
diff options
| author | Daniel Baumann <daniel.baumann@progress-linux.org> | 2024-08-26 08:15:24 +0000 |
|---|---|---|
| committer | Daniel Baumann <daniel.baumann@progress-linux.org> | 2024-08-26 08:15:35 +0000 |
| commit | f09848204fa5283d21ea43e262ee41aa578e1808 (patch) | |
| tree | c62385d7adf209fa6a798635954d887f718fb3fb /src | |
| parent | Releasing debian version 1.46.3-2. (diff) | |
| download | netdata-f09848204fa5283d21ea43e262ee41aa578e1808.tar.xz netdata-f09848204fa5283d21ea43e262ee41aa578e1808.zip | |
Merging upstream version 1.47.0.
Signed-off-by: Daniel Baumann <daniel.baumann@progress-linux.org>
Diffstat (limited to 'src')
| -rw-r--r-- | src/aclk/aclk.c | 63 | ||||
| -rw-r--r-- | src/aclk/aclk_capas.c | 4 | ||||
| -rw-r--r-- | src/aclk/aclk_rx_msgs.c | 12 | ||||
| -rw-r--r-- | src/aclk/helpers/mqtt_wss_pal.h | 6 | ||||
| -rw-r--r-- | src/aclk/https_client.c | 2 | ||||
| -rw-r--r-- | src/aclk/mqtt_websockets/mqtt_ng.c | 56 | ||||
| -rw-r--r-- | src/aclk/mqtt_websockets/mqtt_wss_client.c | 148 | ||||
| -rw-r--r-- | src/aclk/mqtt_websockets/mqtt_wss_log.c | 12 | ||||
| -rw-r--r-- | src/aclk/mqtt_websockets/ws_client.c | 84 | ||||
| -rw-r--r-- | src/aclk/schema-wrappers/alarm_stream.cc | 3 | ||||
| -rw-r--r-- | src/aclk/schema-wrappers/alarm_stream.h | 12 | ||||
| -rw-r--r-- | src/claim/claim.c | 21 | ||||
| -rw-r--r-- | src/collectors/COLLECTORS.md | 800 | ||||
| -rw-r--r-- | src/collectors/README.md | 2 | ||||
| -rw-r--r-- | src/collectors/REFERENCE.md | 2 | ||||
| -rw-r--r-- | src/collectors/all.h | 1 | ||||
| -rw-r--r-- | src/collectors/apps.plugin/apps_groups.conf | 7 | ||||
| -rw-r--r-- | src/collectors/apps.plugin/apps_output.c | 57 | ||||
| -rw-r--r-- | src/collectors/apps.plugin/apps_plugin.c | 39 | ||||
| -rw-r--r-- | src/collectors/apps.plugin/apps_plugin.h | 10 | ||||
| -rw-r--r-- | src/collectors/apps.plugin/apps_proc_pid_limits.c | 2 | ||||
| -rw-r--r-- | src/collectors/apps.plugin/apps_proc_pids.c | 40 | ||||
| -rw-r--r-- | src/collectors/cgroups.plugin/cgroup-discovery.c | 20 | ||||
| -rw-r--r-- | src/collectors/cgroups.plugin/cgroup-network.c | 30 | ||||
| -rw-r--r-- | src/collectors/cgroups.plugin/sys_fs_cgroup.c | 72 | ||||
| -rw-r--r-- | src/collectors/charts.d.plugin/ap/ap.chart.sh | 179 | ||||
| -rw-r--r-- | src/collectors/charts.d.plugin/ap/ap.conf | 23 | ||||
| -rw-r--r-- | src/collectors/charts.d.plugin/ap/integrations/access_points.md | 174 | ||||
| -rw-r--r-- | src/collectors/charts.d.plugin/apcupsd/integrations/apc_ups.md | 34 | ||||
| -rw-r--r-- | src/collectors/charts.d.plugin/charts.d.conf | 1 | ||||
| -rwxr-xr-x | src/collectors/charts.d.plugin/charts.d.plugin.in | 1 | ||||
| -rw-r--r-- | src/collectors/charts.d.plugin/libreswan/integrations/libreswan.md | 34 | ||||
| -rw-r--r-- | src/collectors/charts.d.plugin/opensips/integrations/opensips.md | 34 | ||||
| -rw-r--r-- | src/collectors/charts.d.plugin/sensors/integrations/linux_sensors_sysfs.md | 36 | ||||
| -rw-r--r-- | src/collectors/charts.d.plugin/sensors/metadata.yaml | 2 | ||||
| -rw-r--r-- | src/collectors/common-contexts/common-contexts.h | 2 | ||||
| -rw-r--r-- | src/collectors/common-contexts/system.interrupts.h | 39 | ||||
| -rw-r--r-- | src/collectors/common-contexts/system.ipc.h | 34 | ||||
| -rw-r--r-- | src/collectors/cups.plugin/cups_plugin.c | 2 | ||||
| -rw-r--r-- | src/collectors/diskspace.plugin/plugin_diskspace.c | 4 | ||||
| -rw-r--r-- | src/collectors/ebpf.plugin/ebpf.c | 100 | ||||
| -rw-r--r-- | src/collectors/ebpf.plugin/ebpf.d/cachestat.conf | 2 | ||||
| -rw-r--r-- | src/collectors/ebpf.plugin/ebpf.d/dcstat.conf | 2 | ||||
| -rw-r--r-- | src/collectors/ebpf.plugin/ebpf.d/fd.conf | 1 | ||||
| -rw-r--r-- | src/collectors/ebpf.plugin/ebpf.d/oomkill.conf | 12 | ||||
| -rw-r--r-- | src/collectors/ebpf.plugin/ebpf.d/process.conf | 2 | ||||
| -rw-r--r-- | src/collectors/ebpf.plugin/ebpf.d/shm.conf | 2 | ||||
| -rw-r--r-- | src/collectors/ebpf.plugin/ebpf.d/swap.conf | 2 | ||||
| -rw-r--r-- | src/collectors/ebpf.plugin/ebpf.d/vfs.conf | 1 | ||||
| -rw-r--r-- | src/collectors/ebpf.plugin/ebpf.h | 30 | ||||
| -rw-r--r-- | src/collectors/ebpf.plugin/ebpf_apps.c | 515 | ||||
| -rw-r--r-- | src/collectors/ebpf.plugin/ebpf_apps.h | 304 | ||||
| -rw-r--r-- | src/collectors/ebpf.plugin/ebpf_cachestat.c | 120 | ||||
| -rw-r--r-- | src/collectors/ebpf.plugin/ebpf_cachestat.h | 31 | ||||
| -rw-r--r-- | src/collectors/ebpf.plugin/ebpf_cgroup.c | 22 | ||||
| -rw-r--r-- | src/collectors/ebpf.plugin/ebpf_cgroup.h | 12 | ||||
| -rw-r--r-- | src/collectors/ebpf.plugin/ebpf_dcstat.c | 107 | ||||
| -rw-r--r-- | src/collectors/ebpf.plugin/ebpf_dcstat.h | 30 | ||||
| -rw-r--r-- | src/collectors/ebpf.plugin/ebpf_fd.c | 117 | ||||
| -rw-r--r-- | src/collectors/ebpf.plugin/ebpf_fd.h | 19 | ||||
| -rw-r--r-- | src/collectors/ebpf.plugin/ebpf_filesystem.c | 76 | ||||
| -rw-r--r-- | src/collectors/ebpf.plugin/ebpf_functions.c | 3 | ||||
| -rw-r--r-- | src/collectors/ebpf.plugin/ebpf_oomkill.c | 14 | ||||
| -rw-r--r-- | src/collectors/ebpf.plugin/ebpf_oomkill.h | 1 | ||||
| -rw-r--r-- | src/collectors/ebpf.plugin/ebpf_process.c | 55 | ||||
| -rw-r--r-- | src/collectors/ebpf.plugin/ebpf_process.h | 11 | ||||
| -rw-r--r-- | src/collectors/ebpf.plugin/ebpf_shm.c | 118 | ||||
| -rw-r--r-- | src/collectors/ebpf.plugin/ebpf_shm.h | 32 | ||||
| -rw-r--r-- | src/collectors/ebpf.plugin/ebpf_socket.c | 588 | ||||
| -rw-r--r-- | src/collectors/ebpf.plugin/ebpf_socket.h | 44 | ||||
| -rw-r--r-- | src/collectors/ebpf.plugin/ebpf_swap.c | 93 | ||||
| -rw-r--r-- | src/collectors/ebpf.plugin/ebpf_swap.h | 19 | ||||
| -rw-r--r-- | src/collectors/ebpf.plugin/ebpf_vfs.c | 278 | ||||
| -rw-r--r-- | src/collectors/ebpf.plugin/ebpf_vfs.h | 61 | ||||
| -rw-r--r-- | src/collectors/ebpf.plugin/integrations/ebpf_process.md | 1 | ||||
| -rw-r--r-- | src/collectors/ebpf.plugin/integrations/ebpf_socket.md | 36 | ||||
| -rw-r--r-- | src/collectors/ebpf.plugin/metadata.yaml | 70 | ||||
| -rw-r--r-- | src/collectors/freebsd.plugin/freebsd_sysctl.c | 53 | ||||
| -rw-r--r-- | src/collectors/freeipmi.plugin/freeipmi_plugin.c | 14 | ||||
| -rw-r--r-- | src/collectors/network-viewer.plugin/network-viewer.c | 367 | ||||
| -rw-r--r-- | src/collectors/nfacct.plugin/plugin_nfacct.c | 2 | ||||
| -rw-r--r-- | src/collectors/perf.plugin/perf_plugin.c | 2 | ||||
| -rw-r--r-- | src/collectors/plugins.d/README.md | 2 | ||||
| -rw-r--r-- | src/collectors/plugins.d/local_listeners.c | 26 | ||||
| -rw-r--r-- | src/collectors/plugins.d/ndsudo.c | 49 | ||||
| -rw-r--r-- | src/collectors/plugins.d/plugins_d.c | 41 | ||||
| -rw-r--r-- | src/collectors/plugins.d/plugins_d.h | 1 | ||||
| -rw-r--r-- | src/collectors/plugins.d/pluginsd_internals.c | 2 | ||||
| -rw-r--r-- | src/collectors/proc.plugin/integrations/zfs_pools.md | 105 | ||||
| -rw-r--r-- | src/collectors/proc.plugin/ipc.c | 31 | ||||
| -rw-r--r-- | src/collectors/proc.plugin/metadata.yaml | 92 | ||||
| -rw-r--r-- | src/collectors/proc.plugin/plugin_proc.c | 1 | ||||
| -rw-r--r-- | src/collectors/proc.plugin/plugin_proc.h | 1 | ||||
| -rw-r--r-- | src/collectors/proc.plugin/proc_meminfo.c | 4 | ||||
| -rw-r--r-- | src/collectors/proc.plugin/proc_spl_kstat_zfs.c | 227 | ||||
| -rw-r--r-- | src/collectors/proc.plugin/proc_stat.c | 27 | ||||
| l--------- | src/collectors/python.d.plugin/alarms/README.md | 1 | ||||
| -rw-r--r-- | src/collectors/python.d.plugin/alarms/alarms.chart.py | 95 | ||||
| -rw-r--r-- | src/collectors/python.d.plugin/alarms/alarms.conf | 60 | ||||
| -rw-r--r-- | src/collectors/python.d.plugin/alarms/integrations/netdata_agent_alarms.md | 201 | ||||
| -rw-r--r-- | src/collectors/python.d.plugin/alarms/metadata.yaml | 177 | ||||
| -rw-r--r-- | src/collectors/python.d.plugin/am2320/integrations/am2320.md | 34 | ||||
| -rw-r--r-- | src/collectors/python.d.plugin/beanstalk/beanstalk.chart.py | 252 | ||||
| -rw-r--r-- | src/collectors/python.d.plugin/beanstalk/beanstalk.conf | 78 | ||||
| -rw-r--r-- | src/collectors/python.d.plugin/beanstalk/integrations/beanstalk.md | 219 | ||||
| -rw-r--r-- | src/collectors/python.d.plugin/boinc/integrations/boinc.md | 34 | ||||
| -rw-r--r-- | src/collectors/python.d.plugin/ceph/integrations/ceph.md | 34 | ||||
| l--------- | src/collectors/python.d.plugin/changefinder/README.md | 1 | ||||
| -rw-r--r-- | src/collectors/python.d.plugin/changefinder/changefinder.chart.py | 185 | ||||
| -rw-r--r-- | src/collectors/python.d.plugin/changefinder/changefinder.conf | 74 | ||||
| -rw-r--r-- | src/collectors/python.d.plugin/changefinder/integrations/python.d_changefinder.md | 217 | ||||
| -rw-r--r-- | src/collectors/python.d.plugin/changefinder/metadata.yaml | 212 | ||||
| -rw-r--r-- | src/collectors/python.d.plugin/dovecot/dovecot.chart.py | 143 | ||||
| -rw-r--r-- | src/collectors/python.d.plugin/dovecot/dovecot.conf | 98 | ||||
| -rw-r--r-- | src/collectors/python.d.plugin/dovecot/integrations/dovecot.md | 197 | ||||
| -rw-r--r-- | src/collectors/python.d.plugin/dovecot/metadata.yaml | 207 | ||||
| l--------- | src/collectors/python.d.plugin/example/README.md | 1 | ||||
| -rw-r--r-- | src/collectors/python.d.plugin/example/example.chart.py | 51 | ||||
| -rw-r--r-- | src/collectors/python.d.plugin/example/example.conf | 87 | ||||
| -rw-r--r-- | src/collectors/python.d.plugin/example/integrations/example_collector.md | 171 | ||||
| -rw-r--r-- | src/collectors/python.d.plugin/example/metadata.yaml | 138 | ||||
| -rw-r--r-- | src/collectors/python.d.plugin/exim/exim.chart.py | 39 | ||||
| -rw-r--r-- | src/collectors/python.d.plugin/exim/exim.conf | 91 | ||||
| -rw-r--r-- | src/collectors/python.d.plugin/exim/integrations/exim.md | 181 | ||||
| -rw-r--r-- | src/collectors/python.d.plugin/exim/metadata.yaml | 132 | ||||
| -rw-r--r-- | src/collectors/python.d.plugin/gearman/gearman.chart.py | 243 | ||||
| -rw-r--r-- | src/collectors/python.d.plugin/gearman/gearman.conf | 75 | ||||
| -rw-r--r-- | src/collectors/python.d.plugin/gearman/integrations/gearman.md | 210 | ||||
| -rw-r--r-- | src/collectors/python.d.plugin/gearman/metadata.yaml | 168 | ||||
| -rw-r--r-- | src/collectors/python.d.plugin/go_expvar/integrations/go_applications_expvar.md | 34 | ||||
| -rw-r--r-- | src/collectors/python.d.plugin/haproxy/metadata.yaml | 2 | ||||
| -rw-r--r-- | src/collectors/python.d.plugin/icecast/icecast.chart.py | 94 | ||||
| -rw-r--r-- | src/collectors/python.d.plugin/icecast/icecast.conf | 81 | ||||
| -rw-r--r-- | src/collectors/python.d.plugin/icecast/integrations/icecast.md | 166 | ||||
| -rw-r--r-- | src/collectors/python.d.plugin/icecast/metadata.yaml | 127 | ||||
| -rw-r--r-- | src/collectors/python.d.plugin/ipfs/integrations/ipfs.md | 203 | ||||
| -rw-r--r-- | src/collectors/python.d.plugin/ipfs/ipfs.chart.py | 149 | ||||
| -rw-r--r-- | src/collectors/python.d.plugin/ipfs/ipfs.conf | 82 | ||||
| -rw-r--r-- | src/collectors/python.d.plugin/ipfs/metadata.yaml | 172 | ||||
| -rw-r--r-- | src/collectors/python.d.plugin/memcached/memcached.chart.py | 197 | ||||
| -rw-r--r-- | src/collectors/python.d.plugin/memcached/memcached.conf | 90 | ||||
| -rw-r--r-- | src/collectors/python.d.plugin/monit/integrations/monit.md | 214 | ||||
| -rw-r--r-- | src/collectors/python.d.plugin/monit/metadata.yaml | 217 | ||||
| -rw-r--r-- | src/collectors/python.d.plugin/monit/monit.chart.py | 360 | ||||
| -rw-r--r-- | src/collectors/python.d.plugin/monit/monit.conf | 86 | ||||
| l--------- | src/collectors/python.d.plugin/nsd/README.md | 1 | ||||
| -rw-r--r-- | src/collectors/python.d.plugin/nsd/integrations/name_server_daemon.md | 199 | ||||
| -rw-r--r-- | src/collectors/python.d.plugin/nsd/metadata.yaml | 201 | ||||
| -rw-r--r-- | src/collectors/python.d.plugin/nsd/nsd.chart.py | 105 | ||||
| -rw-r--r-- | src/collectors/python.d.plugin/nsd/nsd.conf | 91 | ||||
| -rw-r--r-- | src/collectors/python.d.plugin/nvidia_smi/README.md | 81 | ||||
| -rw-r--r-- | src/collectors/python.d.plugin/nvidia_smi/metadata.yaml | 166 | ||||
| -rw-r--r-- | src/collectors/python.d.plugin/nvidia_smi/nvidia_smi.chart.py | 651 | ||||
| -rw-r--r-- | src/collectors/python.d.plugin/nvidia_smi/nvidia_smi.conf | 68 | ||||
| -rw-r--r-- | src/collectors/python.d.plugin/openldap/integrations/openldap.md | 34 | ||||
| -rw-r--r-- | src/collectors/python.d.plugin/oracledb/integrations/oracle_db.md | 34 | ||||
| -rw-r--r-- | src/collectors/python.d.plugin/pandas/integrations/pandas.md | 34 | ||||
| -rw-r--r-- | src/collectors/python.d.plugin/postfix/integrations/postfix.md | 151 | ||||
| -rw-r--r-- | src/collectors/python.d.plugin/postfix/metadata.yaml | 124 | ||||
| -rw-r--r-- | src/collectors/python.d.plugin/postfix/postfix.chart.py | 52 | ||||
| -rw-r--r-- | src/collectors/python.d.plugin/postfix/postfix.conf | 72 | ||||
| -rw-r--r-- | src/collectors/python.d.plugin/puppet/integrations/puppet.md | 215 | ||||
| -rw-r--r-- | src/collectors/python.d.plugin/puppet/metadata.yaml | 185 | ||||
| -rw-r--r-- | src/collectors/python.d.plugin/puppet/puppet.chart.py | 121 | ||||
| -rw-r--r-- | src/collectors/python.d.plugin/puppet/puppet.conf | 94 | ||||
| -rw-r--r-- | src/collectors/python.d.plugin/python.d.conf | 40 | ||||
| -rw-r--r-- | src/collectors/python.d.plugin/python_modules/third_party/lm_sensors.py | 327 | ||||
| -rw-r--r-- | src/collectors/python.d.plugin/rethinkdbs/integrations/rethinkdb.md | 190 | ||||
| -rw-r--r-- | src/collectors/python.d.plugin/rethinkdbs/metadata.yaml | 188 | ||||
| -rw-r--r-- | src/collectors/python.d.plugin/rethinkdbs/rethinkdbs.chart.py | 247 | ||||
| -rw-r--r-- | src/collectors/python.d.plugin/rethinkdbs/rethinkdbs.conf | 76 | ||||
| l--------- | src/collectors/python.d.plugin/retroshare/README.md | 1 | ||||
| -rw-r--r-- | src/collectors/python.d.plugin/retroshare/integrations/retroshare.md | 191 | ||||
| -rw-r--r-- | src/collectors/python.d.plugin/retroshare/metadata.yaml | 144 | ||||
| -rw-r--r-- | src/collectors/python.d.plugin/retroshare/retroshare.chart.py | 78 | ||||
| -rw-r--r-- | src/collectors/python.d.plugin/retroshare/retroshare.conf | 72 | ||||
| l--------- | src/collectors/python.d.plugin/riakkv/README.md | 1 | ||||
| -rw-r--r-- | src/collectors/python.d.plugin/riakkv/integrations/riakkv.md | 220 | ||||
| -rw-r--r-- | src/collectors/python.d.plugin/riakkv/riakkv.chart.py | 334 | ||||
| -rw-r--r-- | src/collectors/python.d.plugin/riakkv/riakkv.conf | 68 | ||||
| -rw-r--r-- | src/collectors/python.d.plugin/samba/integrations/samba.md | 34 | ||||
| -rw-r--r-- | src/collectors/python.d.plugin/spigotmc/integrations/spigotmc.md | 34 | ||||
| -rw-r--r-- | src/collectors/python.d.plugin/squid/integrations/squid.md | 199 | ||||
| -rw-r--r-- | src/collectors/python.d.plugin/squid/squid.chart.py | 123 | ||||
| -rw-r--r-- | src/collectors/python.d.plugin/squid/squid.conf | 167 | ||||
| -rw-r--r-- | src/collectors/python.d.plugin/tomcat/integrations/tomcat.md | 203 | ||||
| -rw-r--r-- | src/collectors/python.d.plugin/tomcat/metadata.yaml | 200 | ||||
| -rw-r--r-- | src/collectors/python.d.plugin/tomcat/tomcat.chart.py | 199 | ||||
| -rw-r--r-- | src/collectors/python.d.plugin/tomcat/tomcat.conf | 89 | ||||
| -rw-r--r-- | src/collectors/python.d.plugin/tor/integrations/tor.md | 197 | ||||
| -rw-r--r-- | src/collectors/python.d.plugin/tor/metadata.yaml | 143 | ||||
| -rw-r--r-- | src/collectors/python.d.plugin/tor/tor.chart.py | 109 | ||||
| -rw-r--r-- | src/collectors/python.d.plugin/tor/tor.conf | 81 | ||||
| -rw-r--r-- | src/collectors/python.d.plugin/traefik/metadata.yaml | 2 | ||||
| -rw-r--r-- | src/collectors/python.d.plugin/uwsgi/integrations/uwsgi.md | 219 | ||||
| -rw-r--r-- | src/collectors/python.d.plugin/uwsgi/metadata.yaml | 201 | ||||
| -rw-r--r-- | src/collectors/python.d.plugin/uwsgi/uwsgi.chart.py | 177 | ||||
| -rw-r--r-- | src/collectors/python.d.plugin/uwsgi/uwsgi.conf | 92 | ||||
| -rw-r--r-- | src/collectors/python.d.plugin/varnish/integrations/varnish.md | 34 | ||||
| -rw-r--r-- | src/collectors/python.d.plugin/w1sensor/integrations/1-wire_sensors.md | 34 | ||||
| -rw-r--r-- | src/collectors/python.d.plugin/zscores/integrations/python.d_zscores.md | 34 | ||||
| -rw-r--r-- | src/collectors/systemd-journal.plugin/systemd-journal.c | 2 | ||||
| -rw-r--r-- | src/collectors/tc.plugin/plugin_tc.c | 27 | ||||
| -rw-r--r-- | src/collectors/windows.plugin/perflib-network.c | 4 | ||||
| -rw-r--r-- | src/collectors/windows.plugin/perflib-objects.c | 47 | ||||
| -rw-r--r-- | src/collectors/windows.plugin/perflib-processor.c | 14 | ||||
| -rw-r--r-- | src/collectors/windows.plugin/windows_plugin.c | 1 | ||||
| -rw-r--r-- | src/collectors/windows.plugin/windows_plugin.h | 5 | ||||
| -rw-r--r-- | src/collectors/xenstat.plugin/xenstat_plugin.c | 2 | ||||
| -rw-r--r-- | src/daemon/analytics.c | 30 | ||||
| -rw-r--r-- | src/daemon/analytics.h | 1 | ||||
| -rw-r--r-- | src/daemon/buildinfo.c | 33 | ||||
| -rw-r--r-- | src/daemon/commands.c | 97 | ||||
| -rw-r--r-- | src/daemon/common.c | 2 | ||||
| -rw-r--r-- | src/daemon/common.h | 3 | ||||
| -rw-r--r-- | src/daemon/config/README.md | 19 | ||||
| -rw-r--r-- | src/daemon/daemon.c | 6 | ||||
| -rw-r--r-- | src/daemon/global_statistics.c | 488 | ||||
| -rw-r--r-- | src/daemon/main.c | 129 | ||||
| -rw-r--r-- | src/daemon/main.h | 1 | ||||
| -rw-r--r-- | src/daemon/signals.c | 83 | ||||
| -rw-r--r-- | src/daemon/signals.h | 1 | ||||
| -rw-r--r-- | src/daemon/static_threads.c | 23 | ||||
| -rw-r--r-- | src/daemon/unit_test.c | 17 | ||||
| -rw-r--r-- | src/daemon/watcher.c | 3 | ||||
| -rw-r--r-- | src/daemon/watcher.h | 1 | ||||
| -rw-r--r-- | src/daemon/win_system-info.c | 318 | ||||
| -rw-r--r-- | src/daemon/win_system-info.h | 20 | ||||
| -rw-r--r-- | src/daemon/winsvc.cc | 252 | ||||
| -rw-r--r-- | src/database/engine/rrdengine.c | 2 | ||||
| -rw-r--r-- | src/database/rrd.h | 3 | ||||
| -rw-r--r-- | src/database/rrdhost.c | 16 | ||||
| -rw-r--r-- | src/database/rrdlabels.c | 38 | ||||
| -rw-r--r-- | src/database/sqlite/sqlite_aclk.c | 228 | ||||
| -rw-r--r-- | src/database/sqlite/sqlite_aclk.h | 44 | ||||
| -rw-r--r-- | src/database/sqlite/sqlite_aclk_alert.c | 1269 | ||||
| -rw-r--r-- | src/database/sqlite/sqlite_aclk_alert.h | 24 | ||||
| -rw-r--r-- | src/database/sqlite/sqlite_aclk_node.c | 8 | ||||
| -rw-r--r-- | src/database/sqlite/sqlite_context.c | 2 | ||||
| -rw-r--r-- | src/database/sqlite/sqlite_db_migration.c | 2 | ||||
| -rw-r--r-- | src/database/sqlite/sqlite_functions.c | 12 | ||||
| -rw-r--r-- | src/database/sqlite/sqlite_health.c | 263 | ||||
| -rw-r--r-- | src/database/sqlite/sqlite_health.h | 7 | ||||
| -rw-r--r-- | src/database/sqlite/sqlite_metadata.c | 47 | ||||
| -rw-r--r-- | src/exporting/send_data.c | 2 | ||||
| -rw-r--r-- | src/go/cmd/godplugin/main.go (renamed from src/go/collectors/go.d.plugin/cmd/godplugin/main.go) | 49 | ||||
| -rw-r--r-- | src/go/collectors/go.d.plugin/README.md | 227 | ||||
| -rw-r--r-- | src/go/collectors/go.d.plugin/agent/functions/manager.go | 136 | ||||
| -rw-r--r-- | src/go/collectors/go.d.plugin/config/go.d/snmp.conf | 48 | ||||
| -rw-r--r-- | src/go/collectors/go.d.plugin/modules/chrony/charts.go | 148 | ||||
| -rw-r--r-- | src/go/collectors/go.d.plugin/modules/chrony/client.go | 61 | ||||
| -rw-r--r-- | src/go/collectors/go.d.plugin/modules/chrony/collect.go | 97 | ||||
| -rw-r--r-- | src/go/collectors/go.d.plugin/modules/dnsmasq/collect.go | 126 | ||||
| -rw-r--r-- | src/go/collectors/go.d.plugin/modules/init.go | 98 | ||||
| -rw-r--r-- | src/go/collectors/go.d.plugin/modules/nvidia_smi/collect.go | 72 | ||||
| -rw-r--r-- | src/go/collectors/go.d.plugin/modules/nvidia_smi/collect_csv.go | 198 | ||||
| -rw-r--r-- | src/go/collectors/go.d.plugin/modules/nvidia_smi/exec.go | 78 | ||||
| -rw-r--r-- | src/go/collectors/go.d.plugin/modules/nvidia_smi/nvidia_smi.go | 117 | ||||
| -rw-r--r-- | src/go/collectors/go.d.plugin/modules/nvidia_smi/testdata/help-query-gpu.txt | 414 | ||||
| -rw-r--r-- | src/go/collectors/go.d.plugin/modules/nvidia_smi/testdata/tesla-p100.csv | 2 | ||||
| -rw-r--r-- | src/go/collectors/go.d.plugin/modules/snmp/charts.go | 116 | ||||
| -rw-r--r-- | src/go/collectors/go.d.plugin/modules/snmp/collect.go | 55 | ||||
| -rw-r--r-- | src/go/collectors/go.d.plugin/modules/snmp/init.go | 189 | ||||
| -rw-r--r-- | src/go/collectors/go.d.plugin/modules/snmp/snmp.go | 201 | ||||
| -rw-r--r-- | src/go/collectors/go.d.plugin/modules/snmp/snmp_test.go | 520 | ||||
| -rw-r--r-- | src/go/collectors/go.d.plugin/modules/vsphere/vsphere_test.go | 488 | ||||
| -rw-r--r-- | src/go/go.mod (renamed from src/go/collectors/go.d.plugin/go.mod) | 71 | ||||
| -rw-r--r-- | src/go/go.sum (renamed from src/go/collectors/go.d.plugin/go.sum) | 184 | ||||
| -rw-r--r-- | src/go/logger/default.go (renamed from src/go/collectors/go.d.plugin/logger/default.go) | 0 | ||||
| -rw-r--r-- | src/go/logger/handler.go (renamed from src/go/collectors/go.d.plugin/logger/handler.go) | 0 | ||||
| -rw-r--r-- | src/go/logger/journal_linux.go | 33 | ||||
| -rw-r--r-- | src/go/logger/journal_stub.go | 9 | ||||
| -rw-r--r-- | src/go/logger/level.go (renamed from src/go/collectors/go.d.plugin/logger/level.go) | 0 | ||||
| -rw-r--r-- | src/go/logger/logger.go (renamed from src/go/collectors/go.d.plugin/logger/logger.go) | 26 | ||||
| -rw-r--r-- | src/go/logger/logger_test.go (renamed from src/go/collectors/go.d.plugin/logger/logger_test.go) | 0 | ||||
| -rw-r--r-- | src/go/pkg/buildinfo/version.go (renamed from src/go/collectors/go.d.plugin/pkg/buildinfo/version.go) | 0 | ||||
| -rw-r--r-- | src/go/pkg/executable/executable.go (renamed from src/go/collectors/go.d.plugin/agent/executable/executable.go) | 2 | ||||
| -rw-r--r-- | src/go/plugin/go.d/README.md | 244 | ||||
| -rw-r--r-- | src/go/plugin/go.d/agent/README.md (renamed from src/go/collectors/go.d.plugin/agent/README.md) | 4 | ||||
| -rw-r--r-- | src/go/plugin/go.d/agent/agent.go (renamed from src/go/collectors/go.d.plugin/agent/agent.go) | 24 | ||||
| -rw-r--r-- | src/go/plugin/go.d/agent/agent_test.go (renamed from src/go/collectors/go.d.plugin/agent/agent_test.go) | 4 | ||||
| -rw-r--r-- | src/go/plugin/go.d/agent/confgroup/cache.go (renamed from src/go/collectors/go.d.plugin/agent/confgroup/cache.go) | 0 | ||||
| -rw-r--r-- | src/go/plugin/go.d/agent/confgroup/cache_test.go (renamed from src/go/collectors/go.d.plugin/agent/confgroup/cache_test.go) | 0 | ||||
| -rw-r--r-- | src/go/plugin/go.d/agent/confgroup/config.go (renamed from src/go/collectors/go.d.plugin/agent/confgroup/config.go) | 4 | ||||
| -rw-r--r-- | src/go/plugin/go.d/agent/confgroup/config_test.go (renamed from src/go/collectors/go.d.plugin/agent/confgroup/config_test.go) | 2 | ||||
| -rw-r--r-- | src/go/plugin/go.d/agent/confgroup/group.go (renamed from src/go/collectors/go.d.plugin/agent/confgroup/group.go) | 0 | ||||
| -rw-r--r-- | src/go/plugin/go.d/agent/confgroup/registry.go (renamed from src/go/collectors/go.d.plugin/agent/confgroup/registry.go) | 0 | ||||
| -rw-r--r-- | src/go/plugin/go.d/agent/confgroup/registry_test.go (renamed from src/go/collectors/go.d.plugin/agent/confgroup/registry_test.go) | 0 | ||||
| -rw-r--r-- | src/go/plugin/go.d/agent/config.go (renamed from src/go/collectors/go.d.plugin/agent/config.go) | 0 | ||||
| -rw-r--r-- | src/go/plugin/go.d/agent/discovery/cache.go (renamed from src/go/collectors/go.d.plugin/agent/discovery/cache.go) | 2 | ||||
| -rw-r--r-- | src/go/plugin/go.d/agent/discovery/config.go (renamed from src/go/collectors/go.d.plugin/agent/discovery/config.go) | 8 | ||||
| -rw-r--r-- | src/go/plugin/go.d/agent/discovery/dummy/config.go (renamed from src/go/collectors/go.d.plugin/agent/discovery/dummy/config.go) | 2 | ||||
| -rw-r--r-- | src/go/plugin/go.d/agent/discovery/dummy/discovery.go (renamed from src/go/collectors/go.d.plugin/agent/discovery/dummy/discovery.go) | 4 | ||||
| -rw-r--r-- | src/go/plugin/go.d/agent/discovery/dummy/discovery_test.go (renamed from src/go/collectors/go.d.plugin/agent/discovery/dummy/discovery_test.go) | 4 | ||||
| -rw-r--r-- | src/go/plugin/go.d/agent/discovery/file/config.go (renamed from src/go/collectors/go.d.plugin/agent/discovery/file/config.go) | 2 | ||||
| -rw-r--r-- | src/go/plugin/go.d/agent/discovery/file/discovery.go (renamed from src/go/collectors/go.d.plugin/agent/discovery/file/discovery.go) | 4 | ||||
| -rw-r--r-- | src/go/plugin/go.d/agent/discovery/file/discovery_test.go (renamed from src/go/collectors/go.d.plugin/agent/discovery/file/discovery_test.go) | 0 | ||||
| -rw-r--r-- | src/go/plugin/go.d/agent/discovery/file/parse.go (renamed from src/go/collectors/go.d.plugin/agent/discovery/file/parse.go) | 2 | ||||
| -rw-r--r-- | src/go/plugin/go.d/agent/discovery/file/parse_test.go (renamed from src/go/collectors/go.d.plugin/agent/discovery/file/parse_test.go) | 4 | ||||
| -rw-r--r-- | src/go/plugin/go.d/agent/discovery/file/read.go (renamed from src/go/collectors/go.d.plugin/agent/discovery/file/read.go) | 4 | ||||
| -rw-r--r-- | src/go/plugin/go.d/agent/discovery/file/read_test.go (renamed from src/go/collectors/go.d.plugin/agent/discovery/file/read_test.go) | 4 | ||||
| -rw-r--r-- | src/go/plugin/go.d/agent/discovery/file/sim_test.go (renamed from src/go/collectors/go.d.plugin/agent/discovery/file/sim_test.go) | 2 | ||||
| -rw-r--r-- | src/go/plugin/go.d/agent/discovery/file/watch.go (renamed from src/go/collectors/go.d.plugin/agent/discovery/file/watch.go) | 4 | ||||
| -rw-r--r-- | src/go/plugin/go.d/agent/discovery/file/watch_test.go (renamed from src/go/collectors/go.d.plugin/agent/discovery/file/watch_test.go) | 4 | ||||
| -rw-r--r-- | src/go/plugin/go.d/agent/discovery/manager.go (renamed from src/go/collectors/go.d.plugin/agent/discovery/manager.go) | 10 | ||||
| -rw-r--r-- | src/go/plugin/go.d/agent/discovery/manager_test.go (renamed from src/go/collectors/go.d.plugin/agent/discovery/manager_test.go) | 4 | ||||
| -rw-r--r-- | src/go/plugin/go.d/agent/discovery/sd/conffile.go (renamed from src/go/collectors/go.d.plugin/agent/discovery/sd/conffile.go) | 4 | ||||
| -rw-r--r-- | src/go/plugin/go.d/agent/discovery/sd/discoverer/dockerd/docker.go (renamed from src/go/collectors/go.d.plugin/agent/discovery/sd/discoverer/dockerd/docker.go) | 8 | ||||
| -rw-r--r-- | src/go/plugin/go.d/agent/discovery/sd/discoverer/dockerd/dockerd_test.go (renamed from src/go/collectors/go.d.plugin/agent/discovery/sd/discoverer/dockerd/dockerd_test.go) | 2 | ||||
| -rw-r--r-- | src/go/plugin/go.d/agent/discovery/sd/discoverer/dockerd/sim_test.go (renamed from src/go/collectors/go.d.plugin/agent/discovery/sd/discoverer/dockerd/sim_test.go) | 2 | ||||
| -rw-r--r-- | src/go/plugin/go.d/agent/discovery/sd/discoverer/dockerd/target.go (renamed from src/go/collectors/go.d.plugin/agent/discovery/sd/discoverer/dockerd/target.go) | 2 | ||||
| -rw-r--r-- | src/go/plugin/go.d/agent/discovery/sd/discoverer/kubernetes/config.go (renamed from src/go/collectors/go.d.plugin/agent/discovery/sd/discoverer/kubernetes/config.go) | 0 | ||||
| -rw-r--r-- | src/go/plugin/go.d/agent/discovery/sd/discoverer/kubernetes/kubernetes.go (renamed from src/go/collectors/go.d.plugin/agent/discovery/sd/discoverer/kubernetes/kubernetes.go) | 6 | ||||
| -rw-r--r-- | src/go/plugin/go.d/agent/discovery/sd/discoverer/kubernetes/kubernetes_test.go (renamed from src/go/collectors/go.d.plugin/agent/discovery/sd/discoverer/kubernetes/kubernetes_test.go) | 4 | ||||
| -rw-r--r-- | src/go/plugin/go.d/agent/discovery/sd/discoverer/kubernetes/pod.go (renamed from src/go/collectors/go.d.plugin/agent/discovery/sd/discoverer/kubernetes/pod.go) | 4 | ||||
| -rw-r--r-- | src/go/plugin/go.d/agent/discovery/sd/discoverer/kubernetes/pod_test.go (renamed from src/go/collectors/go.d.plugin/agent/discovery/sd/discoverer/kubernetes/pod_test.go) | 2 | ||||
| -rw-r--r-- | src/go/plugin/go.d/agent/discovery/sd/discoverer/kubernetes/service.go (renamed from src/go/collectors/go.d.plugin/agent/discovery/sd/discoverer/kubernetes/service.go) | 4 | ||||
| -rw-r--r-- | src/go/plugin/go.d/agent/discovery/sd/discoverer/kubernetes/service_test.go (renamed from src/go/collectors/go.d.plugin/agent/discovery/sd/discoverer/kubernetes/service_test.go) | 2 | ||||
| -rw-r--r-- | src/go/plugin/go.d/agent/discovery/sd/discoverer/kubernetes/sim_test.go (renamed from src/go/collectors/go.d.plugin/agent/discovery/sd/discoverer/kubernetes/sim_test.go) | 2 | ||||
| -rw-r--r-- | src/go/plugin/go.d/agent/discovery/sd/discoverer/netlisteners/netlisteners.go (renamed from src/go/collectors/go.d.plugin/agent/discovery/sd/discoverer/netlisteners/netlisteners.go) | 6 | ||||
| -rw-r--r-- | src/go/plugin/go.d/agent/discovery/sd/discoverer/netlisteners/netlisteners_test.go (renamed from src/go/collectors/go.d.plugin/agent/discovery/sd/discoverer/netlisteners/netlisteners_test.go) | 2 | ||||
| -rw-r--r-- | src/go/plugin/go.d/agent/discovery/sd/discoverer/netlisteners/sim_test.go (renamed from src/go/collectors/go.d.plugin/agent/discovery/sd/discoverer/netlisteners/sim_test.go) | 2 | ||||
| -rw-r--r-- | src/go/plugin/go.d/agent/discovery/sd/discoverer/netlisteners/target.go (renamed from src/go/collectors/go.d.plugin/agent/discovery/sd/discoverer/netlisteners/target.go) | 2 | ||||
| -rw-r--r-- | src/go/plugin/go.d/agent/discovery/sd/model/discoverer.go (renamed from src/go/collectors/go.d.plugin/agent/discovery/sd/model/discoverer.go) | 0 | ||||
| -rw-r--r-- | src/go/plugin/go.d/agent/discovery/sd/model/tags.go (renamed from src/go/collectors/go.d.plugin/agent/discovery/sd/model/tags.go) | 0 | ||||
| -rw-r--r-- | src/go/plugin/go.d/agent/discovery/sd/model/tags_test.go (renamed from src/go/collectors/go.d.plugin/agent/discovery/sd/model/tags_test.go) | 0 | ||||
| -rw-r--r-- | src/go/plugin/go.d/agent/discovery/sd/model/target.go (renamed from src/go/collectors/go.d.plugin/agent/discovery/sd/model/target.go) | 0 | ||||
| -rw-r--r-- | src/go/plugin/go.d/agent/discovery/sd/pipeline/accumulator.go (renamed from src/go/collectors/go.d.plugin/agent/discovery/sd/pipeline/accumulator.go) | 4 | ||||
| -rw-r--r-- | src/go/plugin/go.d/agent/discovery/sd/pipeline/classify.go (renamed from src/go/collectors/go.d.plugin/agent/discovery/sd/pipeline/classify.go) | 4 | ||||
| -rw-r--r-- | src/go/plugin/go.d/agent/discovery/sd/pipeline/classify_test.go (renamed from src/go/collectors/go.d.plugin/agent/discovery/sd/pipeline/classify_test.go) | 2 | ||||
| -rw-r--r-- | src/go/plugin/go.d/agent/discovery/sd/pipeline/compose.go (renamed from src/go/collectors/go.d.plugin/agent/discovery/sd/pipeline/compose.go) | 6 | ||||
| -rw-r--r-- | src/go/plugin/go.d/agent/discovery/sd/pipeline/compose_test.go (renamed from src/go/collectors/go.d.plugin/agent/discovery/sd/pipeline/compose_test.go) | 4 | ||||
| -rw-r--r-- | src/go/plugin/go.d/agent/discovery/sd/pipeline/config.go (renamed from src/go/collectors/go.d.plugin/agent/discovery/sd/pipeline/config.go) | 8 | ||||
| -rw-r--r-- | src/go/plugin/go.d/agent/discovery/sd/pipeline/funcmap.go (renamed from src/go/collectors/go.d.plugin/agent/discovery/sd/pipeline/funcmap.go) | 2 | ||||
| -rw-r--r-- | src/go/plugin/go.d/agent/discovery/sd/pipeline/funcmap_test.go (renamed from src/go/collectors/go.d.plugin/agent/discovery/sd/pipeline/funcmap_test.go) | 0 | ||||
| -rw-r--r-- | src/go/plugin/go.d/agent/discovery/sd/pipeline/pipeline.go (renamed from src/go/collectors/go.d.plugin/agent/discovery/sd/pipeline/pipeline.go) | 14 | ||||
| -rw-r--r-- | src/go/plugin/go.d/agent/discovery/sd/pipeline/pipeline_test.go (renamed from src/go/collectors/go.d.plugin/agent/discovery/sd/pipeline/pipeline_test.go) | 4 | ||||
| -rw-r--r-- | src/go/plugin/go.d/agent/discovery/sd/pipeline/promport.go (renamed from src/go/collectors/go.d.plugin/agent/discovery/sd/pipeline/promport.go) | 0 | ||||
| -rw-r--r-- | src/go/plugin/go.d/agent/discovery/sd/pipeline/selector.go (renamed from src/go/collectors/go.d.plugin/agent/discovery/sd/pipeline/selector.go) | 2 | ||||
| -rw-r--r-- | src/go/plugin/go.d/agent/discovery/sd/pipeline/selector_test.go (renamed from src/go/collectors/go.d.plugin/agent/discovery/sd/pipeline/selector_test.go) | 2 | ||||
| -rw-r--r-- | src/go/plugin/go.d/agent/discovery/sd/pipeline/sim_test.go (renamed from src/go/collectors/go.d.plugin/agent/discovery/sd/pipeline/sim_test.go) | 6 | ||||
| -rw-r--r-- | src/go/plugin/go.d/agent/discovery/sd/sd.go (renamed from src/go/collectors/go.d.plugin/agent/discovery/sd/sd.go) | 8 | ||||
| -rw-r--r-- | src/go/plugin/go.d/agent/discovery/sd/sd_test.go (renamed from src/go/collectors/go.d.plugin/agent/discovery/sd/sd_test.go) | 2 | ||||
| -rw-r--r-- | src/go/plugin/go.d/agent/discovery/sd/sim_test.go (renamed from src/go/collectors/go.d.plugin/agent/discovery/sd/sim_test.go) | 6 | ||||
| -rw-r--r-- | src/go/plugin/go.d/agent/discovery/sim_test.go (renamed from src/go/collectors/go.d.plugin/agent/discovery/sim_test.go) | 2 | ||||
| -rw-r--r-- | src/go/plugin/go.d/agent/filelock/filelock.go (renamed from src/go/collectors/go.d.plugin/agent/filelock/filelock.go) | 0 | ||||
| -rw-r--r-- | src/go/plugin/go.d/agent/filelock/filelock_test.go (renamed from src/go/collectors/go.d.plugin/agent/filelock/filelock_test.go) | 0 | ||||
| -rw-r--r-- | src/go/plugin/go.d/agent/filestatus/manager.go (renamed from src/go/collectors/go.d.plugin/agent/filestatus/manager.go) | 4 | ||||
| -rw-r--r-- | src/go/plugin/go.d/agent/filestatus/manager_test.go (renamed from src/go/collectors/go.d.plugin/agent/filestatus/manager_test.go) | 2 | ||||
| -rw-r--r-- | src/go/plugin/go.d/agent/filestatus/store.go (renamed from src/go/collectors/go.d.plugin/agent/filestatus/store.go) | 2 | ||||
| -rw-r--r-- | src/go/plugin/go.d/agent/filestatus/store_test.go (renamed from src/go/collectors/go.d.plugin/agent/filestatus/store_test.go) | 2 | ||||
| -rw-r--r-- | src/go/plugin/go.d/agent/functions/ext.go (renamed from src/go/collectors/go.d.plugin/agent/functions/ext.go) | 0 | ||||
| -rw-r--r-- | src/go/plugin/go.d/agent/functions/function.go (renamed from src/go/collectors/go.d.plugin/agent/functions/function.go) | 30 | ||||
| -rw-r--r-- | src/go/plugin/go.d/agent/functions/input.go | 35 | ||||
| -rw-r--r-- | src/go/plugin/go.d/agent/functions/manager.go | 127 | ||||
| -rw-r--r-- | src/go/plugin/go.d/agent/functions/manager_test.go (renamed from src/go/collectors/go.d.plugin/agent/functions/manager_test.go) | 25 | ||||
| -rw-r--r-- | src/go/plugin/go.d/agent/hostinfo/hostinfo.go (renamed from src/go/collectors/go.d.plugin/agent/hostinfo/hostinfo.go) | 0 | ||||
| -rw-r--r-- | src/go/plugin/go.d/agent/hostinfo/hostinfo_common.go (renamed from src/go/collectors/go.d.plugin/agent/hostinfo/hostinfo_common.go) | 0 | ||||
| -rw-r--r-- | src/go/plugin/go.d/agent/hostinfo/hostinfo_linux.go (renamed from src/go/collectors/go.d.plugin/agent/hostinfo/hostinfo_linux.go) | 0 | ||||
| -rw-r--r-- | src/go/plugin/go.d/agent/jobmgr/cache.go (renamed from src/go/collectors/go.d.plugin/agent/jobmgr/cache.go) | 4 | ||||
| -rw-r--r-- | src/go/plugin/go.d/agent/jobmgr/di.go (renamed from src/go/collectors/go.d.plugin/agent/jobmgr/di.go) | 6 | ||||
| -rw-r--r-- | src/go/plugin/go.d/agent/jobmgr/dyncfg.go (renamed from src/go/collectors/go.d.plugin/agent/jobmgr/dyncfg.go) | 6 | ||||
| -rw-r--r-- | src/go/plugin/go.d/agent/jobmgr/manager.go (renamed from src/go/collectors/go.d.plugin/agent/jobmgr/manager.go) | 14 | ||||
| -rw-r--r-- | src/go/plugin/go.d/agent/jobmgr/manager_test.go (renamed from src/go/collectors/go.d.plugin/agent/jobmgr/manager_test.go) | 4 | ||||
| -rw-r--r-- | src/go/plugin/go.d/agent/jobmgr/noop.go (renamed from src/go/collectors/go.d.plugin/agent/jobmgr/noop.go) | 6 | ||||
| -rw-r--r-- | src/go/plugin/go.d/agent/jobmgr/sim_test.go (renamed from src/go/collectors/go.d.plugin/agent/jobmgr/sim_test.go) | 8 | ||||
| -rw-r--r-- | src/go/plugin/go.d/agent/module/charts.go (renamed from src/go/collectors/go.d.plugin/agent/module/charts.go) | 37 | ||||
| -rw-r--r-- | src/go/plugin/go.d/agent/module/charts_test.go (renamed from src/go/collectors/go.d.plugin/agent/module/charts_test.go) | 3 | ||||
| -rw-r--r-- | src/go/plugin/go.d/agent/module/job.go (renamed from src/go/collectors/go.d.plugin/agent/module/job.go) | 8 | ||||
| -rw-r--r-- | src/go/plugin/go.d/agent/module/job_test.go (renamed from src/go/collectors/go.d.plugin/agent/module/job_test.go) | 0 | ||||
| -rw-r--r-- | src/go/plugin/go.d/agent/module/mock.go (renamed from src/go/collectors/go.d.plugin/agent/module/mock.go) | 0 | ||||
| -rw-r--r-- | src/go/plugin/go.d/agent/module/mock_test.go (renamed from src/go/collectors/go.d.plugin/agent/module/mock_test.go) | 0 | ||||
| -rw-r--r-- | src/go/plugin/go.d/agent/module/module.go (renamed from src/go/collectors/go.d.plugin/agent/module/module.go) | 2 | ||||
| -rw-r--r-- | src/go/plugin/go.d/agent/module/registry.go (renamed from src/go/collectors/go.d.plugin/agent/module/registry.go) | 0 | ||||
| -rw-r--r-- | src/go/plugin/go.d/agent/module/registry_test.go (renamed from src/go/collectors/go.d.plugin/agent/module/registry_test.go) | 0 | ||||
| -rw-r--r-- | src/go/plugin/go.d/agent/netdataapi/api.go (renamed from src/go/collectors/go.d.plugin/agent/netdataapi/api.go) | 0 | ||||
| -rw-r--r-- | src/go/plugin/go.d/agent/netdataapi/api_test.go (renamed from src/go/collectors/go.d.plugin/agent/netdataapi/api_test.go) | 0 | ||||
| -rw-r--r-- | src/go/plugin/go.d/agent/safewriter/writer.go (renamed from src/go/collectors/go.d.plugin/agent/safewriter/writer.go) | 0 | ||||
| -rw-r--r-- | src/go/plugin/go.d/agent/setup.go (renamed from src/go/collectors/go.d.plugin/agent/setup.go) | 16 | ||||
| -rw-r--r-- | src/go/plugin/go.d/agent/setup_test.go (renamed from src/go/collectors/go.d.plugin/agent/setup_test.go) | 2 | ||||
| -rw-r--r-- | src/go/plugin/go.d/agent/testdata/agent-empty.conf (renamed from src/go/collectors/go.d.plugin/agent/testdata/agent-empty.conf) | 0 | ||||
| -rw-r--r-- | src/go/plugin/go.d/agent/testdata/agent-invalid-syntax.conf (renamed from src/go/collectors/go.d.plugin/agent/testdata/agent-invalid-syntax.conf) | 0 | ||||
| -rw-r--r-- | src/go/plugin/go.d/agent/testdata/agent-valid.conf (renamed from src/go/collectors/go.d.plugin/agent/testdata/agent-valid.conf) | 0 | ||||
| -rw-r--r-- | src/go/plugin/go.d/agent/ticker/ticker.go (renamed from src/go/collectors/go.d.plugin/agent/ticker/ticker.go) | 0 | ||||
| -rw-r--r-- | src/go/plugin/go.d/agent/ticker/ticket_test.go (renamed from src/go/collectors/go.d.plugin/agent/ticker/ticket_test.go) | 0 | ||||
| -rw-r--r-- | src/go/plugin/go.d/agent/vnodes/testdata/config.yaml (renamed from src/go/collectors/go.d.plugin/agent/vnodes/testdata/config.yaml) | 0 | ||||
| -rw-r--r-- | src/go/plugin/go.d/agent/vnodes/vnodes.go (renamed from src/go/collectors/go.d.plugin/agent/vnodes/vnodes.go) | 2 | ||||
| -rw-r--r-- | src/go/plugin/go.d/agent/vnodes/vnodes_test.go (renamed from src/go/collectors/go.d.plugin/agent/vnodes/vnodes_test.go) | 0 | ||||
| -rw-r--r-- | src/go/plugin/go.d/cli/cli.go (renamed from src/go/collectors/go.d.plugin/cli/cli.go) | 0 | ||||
| -rw-r--r-- | src/go/plugin/go.d/config/go.d.conf (renamed from src/go/collectors/go.d.plugin/config/go.d.conf) | 18 | ||||
| -rw-r--r-- | src/go/plugin/go.d/config/go.d/activemq.conf (renamed from src/go/collectors/go.d.plugin/config/go.d/activemq.conf) | 2 | ||||
| -rw-r--r-- | src/go/plugin/go.d/config/go.d/adaptec_raid.conf (renamed from src/go/collectors/go.d.plugin/config/go.d/adaptec_raid.conf) | 2 | ||||
| -rw-r--r-- | src/go/plugin/go.d/config/go.d/ap.conf | 6 | ||||
| -rw-r--r-- | src/go/plugin/go.d/config/go.d/apache.conf (renamed from src/go/collectors/go.d.plugin/config/go.d/apache.conf) | 2 | ||||
| -rw-r--r-- | src/go/plugin/go.d/config/go.d/beanstalk.conf | 6 | ||||
| -rw-r--r-- | src/go/plugin/go.d/config/go.d/bind.conf (renamed from src/go/collectors/go.d.plugin/config/go.d/bind.conf) | 2 | ||||
| -rw-r--r-- | src/go/plugin/go.d/config/go.d/cassandra.conf (renamed from src/go/collectors/go.d.plugin/config/go.d/cassandra.conf) | 2 | ||||
| -rw-r--r-- | src/go/plugin/go.d/config/go.d/chrony.conf (renamed from src/go/collectors/go.d.plugin/config/go.d/chrony.conf) | 2 | ||||
| -rw-r--r-- | src/go/plugin/go.d/config/go.d/clickhouse.conf (renamed from src/go/collectors/go.d.plugin/config/go.d/clickhouse.conf) | 2 | ||||
| -rw-r--r-- | src/go/plugin/go.d/config/go.d/cockroachdb.conf (renamed from src/go/collectors/go.d.plugin/config/go.d/cockroachdb.conf) | 2 | ||||
| -rw-r--r-- | src/go/plugin/go.d/config/go.d/consul.conf (renamed from src/go/collectors/go.d.plugin/config/go.d/consul.conf) | 2 | ||||
| -rw-r--r-- | src/go/plugin/go.d/config/go.d/coredns.conf (renamed from src/go/collectors/go.d.plugin/config/go.d/coredns.conf) | 2 | ||||
| -rw-r--r-- | src/go/plugin/go.d/config/go.d/couchbase.conf (renamed from src/go/collectors/go.d.plugin/config/go.d/couchbase.conf) | 2 | ||||
| -rw-r--r-- | src/go/plugin/go.d/config/go.d/couchdb.conf (renamed from src/go/collectors/go.d.plugin/config/go.d/couchdb.conf) | 2 | ||||
| -rw-r--r-- | src/go/plugin/go.d/config/go.d/dmcache.conf (renamed from src/go/collectors/go.d.plugin/config/go.d/dmcache.conf) | 2 | ||||
| -rw-r--r-- | src/go/plugin/go.d/config/go.d/dns_query.conf (renamed from src/go/collectors/go.d.plugin/config/go.d/dns_query.conf) | 2 | ||||
| -rw-r--r-- | src/go/plugin/go.d/config/go.d/dnsdist.conf (renamed from src/go/collectors/go.d.plugin/config/go.d/dnsdist.conf) | 2 | ||||
| -rw-r--r-- | src/go/plugin/go.d/config/go.d/dnsmasq.conf (renamed from src/go/collectors/go.d.plugin/config/go.d/dnsmasq.conf) | 2 | ||||
| -rw-r--r-- | src/go/plugin/go.d/config/go.d/dnsmasq_dhcp.conf (renamed from src/go/collectors/go.d.plugin/config/go.d/dnsmasq_dhcp.conf) | 2 | ||||
| -rw-r--r-- | src/go/plugin/go.d/config/go.d/docker.conf (renamed from src/go/collectors/go.d.plugin/config/go.d/docker.conf) | 2 | ||||
| -rw-r--r-- | src/go/plugin/go.d/config/go.d/docker_engine.conf (renamed from src/go/collectors/go.d.plugin/config/go.d/docker_engine.conf) | 2 | ||||
| -rw-r--r-- | src/go/plugin/go.d/config/go.d/dockerhub.conf (renamed from src/go/collectors/go.d.plugin/config/go.d/dockerhub.conf) | 2 | ||||
| -rw-r--r-- | src/go/plugin/go.d/config/go.d/dovecot.conf | 6 | ||||
| -rw-r--r-- | src/go/plugin/go.d/config/go.d/elasticsearch.conf (renamed from src/go/collectors/go.d.plugin/config/go.d/elasticsearch.conf) | 2 | ||||
| -rw-r--r-- | src/go/plugin/go.d/config/go.d/envoy.conf (renamed from src/go/collectors/go.d.plugin/config/go.d/envoy.conf) | 2 | ||||
| -rw-r--r-- | src/go/plugin/go.d/config/go.d/example.conf (renamed from src/go/collectors/go.d.plugin/config/go.d/example.conf) | 2 | ||||
| -rw-r--r-- | src/go/plugin/go.d/config/go.d/exim.conf | 5 | ||||
| -rw-r--r-- | src/go/plugin/go.d/config/go.d/fail2ban.conf (renamed from src/go/collectors/go.d.plugin/config/go.d/fail2ban.conf) | 2 | ||||
| -rw-r--r-- | src/go/plugin/go.d/config/go.d/filecheck.conf (renamed from src/go/collectors/go.d.plugin/config/go.d/filecheck.conf) | 2 | ||||
| -rw-r--r-- | src/go/plugin/go.d/config/go.d/fluentd.conf (renamed from src/go/collectors/go.d.plugin/config/go.d/fluentd.conf) | 2 | ||||
| -rw-r--r-- | src/go/plugin/go.d/config/go.d/freeradius.conf (renamed from src/go/collectors/go.d.plugin/config/go.d/freeradius.conf) | 2 | ||||
| -rw-r--r-- | src/go/plugin/go.d/config/go.d/gearman.conf | 6 | ||||
| -rw-r--r-- | src/go/plugin/go.d/config/go.d/geth.conf (renamed from src/go/collectors/go.d.plugin/config/go.d/geth.conf) | 2 | ||||
| -rw-r--r-- | src/go/plugin/go.d/config/go.d/haproxy.conf (renamed from src/go/collectors/go.d.plugin/config/go.d/haproxy.conf) | 2 | ||||
| -rw-r--r-- | src/go/plugin/go.d/config/go.d/hddtemp.conf (renamed from src/go/collectors/go.d.plugin/config/go.d/hddtemp.conf) | 2 | ||||
| -rw-r--r-- | src/go/plugin/go.d/config/go.d/hdfs.conf (renamed from src/go/collectors/go.d.plugin/config/go.d/hdfs.conf) | 2 | ||||
| -rw-r--r-- | src/go/plugin/go.d/config/go.d/hpssa.conf (renamed from src/go/collectors/go.d.plugin/config/go.d/hpssa.conf) | 2 | ||||
| -rw-r--r-- | src/go/plugin/go.d/config/go.d/httpcheck.conf (renamed from src/go/collectors/go.d.plugin/config/go.d/httpcheck.conf) | 2 | ||||
| -rw-r--r-- | src/go/plugin/go.d/config/go.d/icecast.conf | 6 | ||||
| -rw-r--r-- | src/go/plugin/go.d/config/go.d/intelgpu.conf (renamed from src/go/collectors/go.d.plugin/config/go.d/intelgpu.conf) | 2 | ||||
| -rw-r--r-- | src/go/plugin/go.d/config/go.d/ipfs.conf | 6 | ||||
| -rw-r--r-- | src/go/plugin/go.d/config/go.d/isc_dhcpd.conf (renamed from src/go/collectors/go.d.plugin/config/go.d/isc_dhcpd.conf) | 2 | ||||
| -rw-r--r-- | src/go/plugin/go.d/config/go.d/k8s_kubelet.conf (renamed from src/go/collectors/go.d.plugin/config/go.d/k8s_kubelet.conf) | 2 | ||||
| -rw-r--r-- | src/go/plugin/go.d/config/go.d/k8s_kubeproxy.conf (renamed from src/go/collectors/go.d.plugin/config/go.d/k8s_kubeproxy.conf) | 2 | ||||
| -rw-r--r-- | src/go/plugin/go.d/config/go.d/k8s_state.conf (renamed from src/go/collectors/go.d.plugin/config/go.d/k8s_state.conf) | 2 | ||||
| -rw-r--r-- | src/go/plugin/go.d/config/go.d/lighttpd.conf (renamed from src/go/collectors/go.d.plugin/config/go.d/lighttpd.conf) | 2 | ||||
| -rw-r--r-- | src/go/plugin/go.d/config/go.d/litespeed.conf (renamed from src/go/collectors/go.d.plugin/config/go.d/litespeed.conf) | 2 | ||||
| -rw-r--r-- | src/go/plugin/go.d/config/go.d/logind.conf (renamed from src/go/collectors/go.d.plugin/config/go.d/logind.conf) | 2 | ||||
| -rw-r--r-- | src/go/plugin/go.d/config/go.d/logstash.conf (renamed from src/go/collectors/go.d.plugin/config/go.d/logstash.conf) | 2 | ||||
| -rw-r--r-- | src/go/plugin/go.d/config/go.d/lvm.conf (renamed from src/go/collectors/go.d.plugin/config/go.d/lvm.conf) | 2 | ||||
| -rw-r--r-- | src/go/plugin/go.d/config/go.d/megacli.conf (renamed from src/go/collectors/go.d.plugin/config/go.d/megacli.conf) | 2 | ||||
| -rw-r--r-- | src/go/plugin/go.d/config/go.d/memcached.conf | 6 | ||||
| -rw-r--r-- | src/go/plugin/go.d/config/go.d/mongodb.conf (renamed from src/go/collectors/go.d.plugin/config/go.d/mongodb.conf) | 2 | ||||
| -rw-r--r-- | src/go/plugin/go.d/config/go.d/monit.conf | 6 | ||||
| -rw-r--r-- | src/go/plugin/go.d/config/go.d/mysql.conf (renamed from src/go/collectors/go.d.plugin/config/go.d/mysql.conf) | 2 | ||||
| -rw-r--r-- | src/go/plugin/go.d/config/go.d/nginx.conf (renamed from src/go/collectors/go.d.plugin/config/go.d/nginx.conf) | 2 | ||||
| -rw-r--r-- | src/go/plugin/go.d/config/go.d/nginxplus.conf (renamed from src/go/collectors/go.d.plugin/config/go.d/nginxplus.conf) | 2 | ||||
| -rw-r--r-- | src/go/plugin/go.d/config/go.d/nginxvts.conf (renamed from src/go/collectors/go.d.plugin/config/go.d/nginxvts.conf) | 2 | ||||
| -rw-r--r-- | src/go/plugin/go.d/config/go.d/nsd.conf | 5 | ||||
| -rw-r--r-- | src/go/plugin/go.d/config/go.d/ntpd.conf (renamed from src/go/collectors/go.d.plugin/config/go.d/ntpd.conf) | 2 | ||||
| -rw-r--r-- | src/go/plugin/go.d/config/go.d/nvidia_smi.conf (renamed from src/go/collectors/go.d.plugin/config/go.d/nvidia_smi.conf) | 2 | ||||
| -rw-r--r-- | src/go/plugin/go.d/config/go.d/nvme.conf (renamed from src/go/collectors/go.d.plugin/config/go.d/nvme.conf) | 2 | ||||
| -rw-r--r-- | src/go/plugin/go.d/config/go.d/openvpn.conf (renamed from src/go/collectors/go.d.plugin/config/go.d/openvpn.conf) | 2 | ||||
| -rw-r--r-- | src/go/plugin/go.d/config/go.d/openvpn_status_log.conf (renamed from src/go/collectors/go.d.plugin/config/go.d/openvpn_status_log.conf) | 2 | ||||
| -rw-r--r-- | src/go/plugin/go.d/config/go.d/pgbouncer.conf (renamed from src/go/collectors/go.d.plugin/config/go.d/pgbouncer.conf) | 2 | ||||
| -rw-r--r-- | src/go/plugin/go.d/config/go.d/phpdaemon.conf (renamed from src/go/collectors/go.d.plugin/config/go.d/phpdaemon.conf) | 2 | ||||
| -rw-r--r-- | src/go/plugin/go.d/config/go.d/phpfpm.conf (renamed from src/go/collectors/go.d.plugin/config/go.d/phpfpm.conf) | 2 | ||||
| -rw-r--r-- | src/go/plugin/go.d/config/go.d/pihole.conf (renamed from src/go/collectors/go.d.plugin/config/go.d/pihole.conf) | 2 | ||||
| -rw-r--r-- | src/go/plugin/go.d/config/go.d/pika.conf (renamed from src/go/collectors/go.d.plugin/config/go.d/pika.conf) | 2 | ||||
| -rw-r--r-- | src/go/plugin/go.d/config/go.d/ping.conf (renamed from src/go/collectors/go.d.plugin/config/go.d/ping.conf) | 2 | ||||
| -rw-r--r-- | src/go/plugin/go.d/config/go.d/portcheck.conf (renamed from src/go/collectors/go.d.plugin/config/go.d/portcheck.conf) | 2 | ||||
| -rw-r--r-- | src/go/plugin/go.d/config/go.d/postfix.conf | 12 | ||||
| -rw-r--r-- | src/go/plugin/go.d/config/go.d/postgres.conf (renamed from src/go/collectors/go.d.plugin/config/go.d/postgres.conf) | 2 | ||||
| -rw-r--r-- | src/go/plugin/go.d/config/go.d/powerdns.conf (renamed from src/go/collectors/go.d.plugin/config/go.d/powerdns.conf) | 2 | ||||
| -rw-r--r-- | src/go/plugin/go.d/config/go.d/powerdns_recursor.conf (renamed from src/go/collectors/go.d.plugin/config/go.d/powerdns_recursor.conf) | 2 | ||||
| -rw-r--r-- | src/go/plugin/go.d/config/go.d/prometheus.conf (renamed from src/go/collectors/go.d.plugin/config/go.d/prometheus.conf) | 2 | ||||
| -rw-r--r-- | src/go/plugin/go.d/config/go.d/proxysql.conf (renamed from src/go/collectors/go.d.plugin/config/go.d/proxysql.conf) | 2 | ||||
| -rw-r--r-- | src/go/plugin/go.d/config/go.d/pulsar.conf (renamed from src/go/collectors/go.d.plugin/config/go.d/pulsar.conf) | 2 | ||||
| -rw-r--r-- | src/go/plugin/go.d/config/go.d/puppet.conf | 7 | ||||
| -rw-r--r-- | src/go/plugin/go.d/config/go.d/rabbitmq.conf (renamed from src/go/collectors/go.d.plugin/config/go.d/rabbitmq.conf) | 2 | ||||
| -rw-r--r-- | src/go/plugin/go.d/config/go.d/redis.conf (renamed from src/go/collectors/go.d.plugin/config/go.d/redis.conf) | 2 | ||||
| -rw-r--r-- | src/go/plugin/go.d/config/go.d/rethinkdb.conf | 6 | ||||
| -rw-r--r-- | src/go/plugin/go.d/config/go.d/riakkv.conf | 6 | ||||
| -rw-r--r-- | src/go/plugin/go.d/config/go.d/rspamd.conf (renamed from src/go/collectors/go.d.plugin/config/go.d/rspamd.conf) | 2 | ||||
| -rw-r--r-- | src/go/plugin/go.d/config/go.d/scaleio.conf (renamed from src/go/collectors/go.d.plugin/config/go.d/scaleio.conf) | 2 | ||||
| -rw-r--r-- | src/go/plugin/go.d/config/go.d/sd/docker.conf (renamed from src/go/collectors/go.d.plugin/config/go.d/sd/docker.conf) | 73 | ||||
| -rw-r--r-- | src/go/plugin/go.d/config/go.d/sd/net_listeners.conf (renamed from src/go/collectors/go.d.plugin/config/go.d/sd/net_listeners.conf) | 102 | ||||
| -rw-r--r-- | src/go/plugin/go.d/config/go.d/sensors.conf (renamed from src/go/collectors/go.d.plugin/config/go.d/sensors.conf) | 2 | ||||
| -rw-r--r-- | src/go/plugin/go.d/config/go.d/smartctl.conf (renamed from src/go/collectors/go.d.plugin/config/go.d/smartctl.conf) | 2 | ||||
| -rw-r--r-- | src/go/plugin/go.d/config/go.d/snmp.conf | 10 | ||||
| -rw-r--r-- | src/go/plugin/go.d/config/go.d/squid.conf | 6 | ||||
| -rw-r--r-- | src/go/plugin/go.d/config/go.d/squidlog.conf (renamed from src/go/collectors/go.d.plugin/config/go.d/squidlog.conf) | 2 | ||||
| -rw-r--r-- | src/go/plugin/go.d/config/go.d/storcli.conf (renamed from src/go/collectors/go.d.plugin/config/go.d/storcli.conf) | 2 | ||||
| -rw-r--r-- | src/go/plugin/go.d/config/go.d/supervisord.conf (renamed from src/go/collectors/go.d.plugin/config/go.d/supervisord.conf) | 2 | ||||
| -rw-r--r-- | src/go/plugin/go.d/config/go.d/systemdunits.conf (renamed from src/go/collectors/go.d.plugin/config/go.d/systemdunits.conf) | 2 | ||||
| -rw-r--r-- | src/go/plugin/go.d/config/go.d/tengine.conf (renamed from src/go/collectors/go.d.plugin/config/go.d/tengine.conf) | 2 | ||||
| -rw-r--r-- | src/go/plugin/go.d/config/go.d/tomcat.conf | 6 | ||||
| -rw-r--r-- | src/go/plugin/go.d/config/go.d/tor.conf | 6 | ||||
| -rw-r--r-- | src/go/plugin/go.d/config/go.d/traefik.conf (renamed from src/go/collectors/go.d.plugin/config/go.d/traefik.conf) | 2 | ||||
| -rw-r--r-- | src/go/plugin/go.d/config/go.d/unbound.conf (renamed from src/go/collectors/go.d.plugin/config/go.d/unbound.conf) | 2 | ||||
| -rw-r--r-- | src/go/plugin/go.d/config/go.d/upsd.conf (renamed from src/go/collectors/go.d.plugin/config/go.d/upsd.conf) | 2 | ||||
| -rw-r--r-- | src/go/plugin/go.d/config/go.d/uwsgi.conf | 6 | ||||
| -rw-r--r-- | src/go/plugin/go.d/config/go.d/vcsa.conf (renamed from src/go/collectors/go.d.plugin/config/go.d/vcsa.conf) | 2 | ||||
| -rw-r--r-- | src/go/plugin/go.d/config/go.d/vernemq.conf (renamed from src/go/collectors/go.d.plugin/config/go.d/vernemq.conf) | 2 | ||||
| -rw-r--r-- | src/go/plugin/go.d/config/go.d/vsphere.conf (renamed from src/go/collectors/go.d.plugin/config/go.d/vsphere.conf) | 2 | ||||
| -rw-r--r-- | src/go/plugin/go.d/config/go.d/web_log.conf (renamed from src/go/collectors/go.d.plugin/config/go.d/web_log.conf) | 2 | ||||
| -rw-r--r-- | src/go/plugin/go.d/config/go.d/whoisquery.conf (renamed from src/go/collectors/go.d.plugin/config/go.d/whoisquery.conf) | 2 | ||||
| -rw-r--r-- | src/go/plugin/go.d/config/go.d/windows.conf (renamed from src/go/collectors/go.d.plugin/config/go.d/windows.conf) | 2 | ||||
| -rw-r--r-- | src/go/plugin/go.d/config/go.d/wireguard.conf (renamed from src/go/collectors/go.d.plugin/config/go.d/wireguard.conf) | 2 | ||||
| -rw-r--r-- | src/go/plugin/go.d/config/go.d/x509check.conf (renamed from src/go/collectors/go.d.plugin/config/go.d/x509check.conf) | 2 | ||||
| -rw-r--r-- | src/go/plugin/go.d/config/go.d/zfspool.conf (renamed from src/go/collectors/go.d.plugin/config/go.d/zfspool.conf) | 2 | ||||
| -rw-r--r-- | src/go/plugin/go.d/config/go.d/zookeeper.conf (renamed from src/go/collectors/go.d.plugin/config/go.d/zookeeper.conf) | 2 | ||||
| -rw-r--r-- | src/go/plugin/go.d/docs/how-to-write-a-module.md (renamed from src/go/collectors/go.d.plugin/docs/how-to-write-a-module.md) | 33 | ||||
| -rw-r--r-- | src/go/plugin/go.d/examples/simple/main.go (renamed from src/go/collectors/go.d.plugin/examples/simple/main.go) | 10 | ||||
| -rwxr-xr-x | src/go/plugin/go.d/hack/go-build.sh (renamed from src/go/collectors/go.d.plugin/hack/go-build.sh) | 4 | ||||
| -rwxr-xr-x | src/go/plugin/go.d/hack/go-fmt.sh (renamed from src/go/collectors/go.d.plugin/hack/go-fmt.sh) | 0 | ||||
| l--------- | src/go/plugin/go.d/modules/activemq/README.md (renamed from src/go/collectors/go.d.plugin/modules/activemq/README.md) | 0 | ||||
| -rw-r--r-- | src/go/plugin/go.d/modules/activemq/activemq.go (renamed from src/go/collectors/go.d.plugin/modules/activemq/activemq.go) | 6 | ||||
| -rw-r--r-- | src/go/plugin/go.d/modules/activemq/activemq_test.go (renamed from src/go/collectors/go.d.plugin/modules/activemq/activemq_test.go) | 4 | ||||
| -rw-r--r-- | src/go/plugin/go.d/modules/activemq/apiclient.go (renamed from src/go/collectors/go.d.plugin/modules/activemq/apiclient.go) | 2 | ||||
| -rw-r--r-- | src/go/plugin/go.d/modules/activemq/charts.go (renamed from src/go/collectors/go.d.plugin/modules/activemq/charts.go) | 2 | ||||
| -rw-r--r-- | src/go/plugin/go.d/modules/activemq/collect.go (renamed from src/go/collectors/go.d.plugin/modules/activemq/collect.go) | 0 | ||||
| -rw-r--r-- | src/go/plugin/go.d/modules/activemq/config_schema.json (renamed from src/go/collectors/go.d.plugin/modules/activemq/config_schema.json) | 6 | ||||
| -rw-r--r-- | src/go/plugin/go.d/modules/activemq/init.go (renamed from src/go/collectors/go.d.plugin/modules/activemq/init.go) | 2 | ||||
| -rw-r--r-- | src/go/plugin/go.d/modules/activemq/integrations/activemq.md (renamed from src/go/collectors/go.d.plugin/modules/activemq/integrations/activemq.md) | 39 | ||||
| -rw-r--r-- | src/go/plugin/go.d/modules/activemq/metadata.yaml (renamed from src/go/collectors/go.d.plugin/modules/activemq/metadata.yaml) | 0 | ||||
| -rw-r--r-- | src/go/plugin/go.d/modules/activemq/testdata/config.json (renamed from src/go/collectors/go.d.plugin/modules/activemq/testdata/config.json) | 0 | ||||
| -rw-r--r-- | src/go/plugin/go.d/modules/activemq/testdata/config.yaml (renamed from src/go/collectors/go.d.plugin/modules/activemq/testdata/config.yaml) | 0 | ||||
| l--------- | src/go/plugin/go.d/modules/adaptecraid/README.md (renamed from src/go/collectors/go.d.plugin/modules/adaptecraid/README.md) | 0 | ||||
| -rw-r--r-- | src/go/plugin/go.d/modules/adaptecraid/adaptec.go (renamed from src/go/collectors/go.d.plugin/modules/adaptecraid/adaptec.go) | 4 | ||||
| -rw-r--r-- | src/go/plugin/go.d/modules/adaptecraid/adaptec_test.go (renamed from src/go/collectors/go.d.plugin/modules/adaptecraid/adaptec_test.go) | 2 | ||||
| -rw-r--r-- | src/go/plugin/go.d/modules/adaptecraid/charts.go (renamed from src/go/collectors/go.d.plugin/modules/adaptecraid/charts.go) | 2 | ||||
| -rw-r--r-- | src/go/plugin/go.d/modules/adaptecraid/collect.go (renamed from src/go/collectors/go.d.plugin/modules/adaptecraid/collect.go) | 0 | ||||
| -rw-r--r-- | src/go/plugin/go.d/modules/adaptecraid/collect_ld.go (renamed from src/go/collectors/go.d.plugin/modules/adaptecraid/collect_ld.go) | 0 | ||||
| -rw-r--r-- | src/go/plugin/go.d/modules/adaptecraid/collect_pd.go (renamed from src/go/collectors/go.d.plugin/modules/adaptecraid/collect_pd.go) | 0 | ||||
| -rw-r--r-- | src/go/plugin/go.d/modules/adaptecraid/config_schema.json (renamed from src/go/collectors/go.d.plugin/modules/adaptecraid/config_schema.json) | 0 | ||||
| -rw-r--r-- | src/go/plugin/go.d/modules/adaptecraid/exec.go (renamed from src/go/collectors/go.d.plugin/modules/adaptecraid/exec.go) | 2 | ||||
| -rw-r--r-- | src/go/plugin/go.d/modules/adaptecraid/init.go (renamed from src/go/collectors/go.d.plugin/modules/adaptecraid/init.go) | 2 | ||||
| -rw-r--r-- | src/go/plugin/go.d/modules/adaptecraid/integrations/adaptec_raid.md (renamed from src/go/collectors/go.d.plugin/modules/adaptecraid/integrations/adaptec_raid.md) | 39 | ||||
| -rw-r--r-- | src/go/plugin/go.d/modules/adaptecraid/metadata.yaml (renamed from src/go/collectors/go.d.plugin/modules/adaptecraid/metadata.yaml) | 0 | ||||
| -rw-r--r-- | src/go/plugin/go.d/modules/adaptecraid/testdata/config.json (renamed from src/go/collectors/go.d.plugin/modules/adaptecraid/testdata/config.json) | 0 | ||||
| -rw-r--r-- | src/go/plugin/go.d/modules/adaptecraid/testdata/config.yaml (renamed from src/go/collectors/go.d.plugin/modules/adaptecraid/testdata/config.yaml) | 0 | ||||
| -rw-r--r-- | src/go/plugin/go.d/modules/adaptecraid/testdata/getconfig-ld-current.txt (renamed from src/go/collectors/go.d.plugin/modules/adaptecraid/testdata/getconfig-ld-current.txt) | 0 | ||||
| -rw-r--r-- | src/go/plugin/go.d/modules/adaptecraid/testdata/getconfig-ld-old.txt (renamed from src/go/collectors/go.d.plugin/modules/adaptecraid/testdata/getconfig-ld-old.txt) | 0 | ||||
| -rw-r--r-- | src/go/plugin/go.d/modules/adaptecraid/testdata/getconfig-pd-current.txt (renamed from src/go/collectors/go.d.plugin/modules/adaptecraid/testdata/getconfig-pd-current.txt) | 0 | ||||
| -rw-r--r-- | src/go/plugin/go.d/modules/adaptecraid/testdata/getconfig-pd-old.txt (renamed from src/go/collectors/go.d.plugin/modules/adaptecraid/testdata/getconfig-pd-old.txt) | 0 | ||||
| l--------- | src/go/plugin/go.d/modules/ap/README.md (renamed from src/collectors/charts.d.plugin/ap/README.md) | 0 | ||||
| -rw-r--r-- | src/go/plugin/go.d/modules/ap/ap.go | 113 | ||||
| -rw-r--r-- | src/go/plugin/go.d/modules/ap/ap_test.go | 292 | ||||
| -rw-r--r-- | src/go/plugin/go.d/modules/ap/charts.go | 147 | ||||
| -rw-r--r-- | src/go/plugin/go.d/modules/ap/collect.go | 221 | ||||
| -rw-r--r-- | src/go/plugin/go.d/modules/ap/config_schema.json (renamed from src/go/collectors/go.d.plugin/modules/nvidia_smi/config_schema.json) | 16 | ||||
| -rw-r--r-- | src/go/plugin/go.d/modules/ap/exec.go | 56 | ||||
| -rw-r--r-- | src/go/plugin/go.d/modules/ap/init.go | 37 | ||||
| -rw-r--r-- | src/go/plugin/go.d/modules/ap/integrations/access_points.md | 202 | ||||
| -rw-r--r-- | src/go/plugin/go.d/modules/ap/metadata.yaml (renamed from src/collectors/charts.d.plugin/ap/metadata.yaml) | 83 | ||||
| -rw-r--r-- | src/go/plugin/go.d/modules/ap/testdata/config.json (renamed from src/go/collectors/go.d.plugin/modules/sensors/testdata/config.json) | 0 | ||||
| -rw-r--r-- | src/go/plugin/go.d/modules/ap/testdata/config.yaml (renamed from src/go/collectors/go.d.plugin/modules/sensors/testdata/config.yaml) | 0 | ||||
| -rw-r--r-- | src/go/plugin/go.d/modules/ap/testdata/iw_dev_ap.txt | 25 | ||||
| -rw-r--r-- | src/go/plugin/go.d/modules/ap/testdata/iw_dev_managed.txt | 11 | ||||
| -rw-r--r-- | src/go/plugin/go.d/modules/ap/testdata/station_dump.txt | 58 | ||||
| l--------- | src/go/plugin/go.d/modules/apache/README.md (renamed from src/go/collectors/go.d.plugin/modules/apache/README.md) | 0 | ||||
| -rw-r--r-- | src/go/plugin/go.d/modules/apache/apache.go (renamed from src/go/collectors/go.d.plugin/modules/apache/apache.go) | 4 | ||||
| -rw-r--r-- | src/go/plugin/go.d/modules/apache/apache_test.go (renamed from src/go/collectors/go.d.plugin/modules/apache/apache_test.go) | 4 | ||||
| -rw-r--r-- | src/go/plugin/go.d/modules/apache/charts.go (renamed from src/go/collectors/go.d.plugin/modules/apache/charts.go) | 2 | ||||
| -rw-r--r-- | src/go/plugin/go.d/modules/apache/collect.go (renamed from src/go/collectors/go.d.plugin/modules/apache/collect.go) | 4 | ||||
| -rw-r--r-- | src/go/plugin/go.d/modules/apache/config_schema.json (renamed from src/go/collectors/go.d.plugin/modules/apache/config_schema.json) | 6 | ||||
| -rw-r--r-- | src/go/plugin/go.d/modules/apache/init.go (renamed from src/go/collectors/go.d.plugin/modules/apache/init.go) | 2 | ||||
| -rw-r--r-- | src/go/plugin/go.d/modules/apache/integrations/apache.md (renamed from src/go/collectors/go.d.plugin/modules/apache/integrations/apache.md) | 39 | ||||
| -rw-r--r-- | src/go/plugin/go.d/modules/apache/integrations/httpd.md (renamed from src/go/collectors/go.d.plugin/modules/apache/integrations/httpd.md) | 39 | ||||
| -rw-r--r-- | src/go/plugin/go.d/modules/apache/metadata.yaml (renamed from src/go/collectors/go.d.plugin/modules/apache/metadata.yaml) | 0 | ||||
| -rw-r--r-- | src/go/plugin/go.d/modules/apache/metrics.go (renamed from src/go/collectors/go.d.plugin/modules/apache/metrics.go) | 0 | ||||
| -rw-r--r-- | src/go/plugin/go.d/modules/apache/testdata/config.json (renamed from src/go/collectors/go.d.plugin/modules/apache/testdata/config.json) | 0 | ||||
| -rw-r--r-- | src/go/plugin/go.d/modules/apache/testdata/config.yaml (renamed from src/go/collectors/go.d.plugin/modules/apache/testdata/config.yaml) | 0 | ||||
| -rw-r--r-- | src/go/plugin/go.d/modules/apache/testdata/extended-status-mpm-event.txt (renamed from src/go/collectors/go.d.plugin/modules/apache/testdata/extended-status-mpm-event.txt) | 0 | ||||
| -rw-r--r-- | src/go/plugin/go.d/modules/apache/testdata/extended-status-mpm-prefork.txt (renamed from src/go/collectors/go.d.plugin/modules/apache/testdata/extended-status-mpm-prefork.txt) | 0 | ||||
| -rw-r--r-- | src/go/plugin/go.d/modules/apache/testdata/lighttpd-status.txt (renamed from src/go/collectors/go.d.plugin/modules/apache/testdata/lighttpd-status.txt) | 0 | ||||
| -rw-r--r-- | src/go/plugin/go.d/modules/apache/testdata/simple-status-mpm-event.txt (renamed from src/go/collectors/go.d.plugin/modules/apache/testdata/simple-status-mpm-event.txt) | 0 | ||||
| l--------- | src/go/plugin/go.d/modules/beanstalk/README.md (renamed from src/collectors/python.d.plugin/beanstalk/README.md) | 0 | ||||
| -rw-r--r-- | src/go/plugin/go.d/modules/beanstalk/beanstalk.go | 123 | ||||
| -rw-r--r-- | src/go/plugin/go.d/modules/beanstalk/beanstalk_test.go | 384 | ||||
| -rw-r--r-- | src/go/plugin/go.d/modules/beanstalk/charts.go | 333 | ||||
| -rw-r--r-- | src/go/plugin/go.d/modules/beanstalk/client.go | 249 | ||||
| -rw-r--r-- | src/go/plugin/go.d/modules/beanstalk/collect.go | 118 | ||||
| -rw-r--r-- | src/go/plugin/go.d/modules/beanstalk/config_schema.json | 54 | ||||
| -rw-r--r-- | src/go/plugin/go.d/modules/beanstalk/init.go | 29 | ||||
| -rw-r--r-- | src/go/plugin/go.d/modules/beanstalk/integrations/beanstalk.md | 253 | ||||
| -rw-r--r-- | src/go/plugin/go.d/modules/beanstalk/metadata.yaml (renamed from src/collectors/python.d.plugin/beanstalk/metadata.yaml) | 228 | ||||
| -rw-r--r-- | src/go/plugin/go.d/modules/beanstalk/testdata/config.json | 6 | ||||
| -rw-r--r-- | src/go/plugin/go.d/modules/beanstalk/testdata/config.yaml | 4 | ||||
| -rw-r--r-- | src/go/plugin/go.d/modules/beanstalk/testdata/list-tubes.txt | 3 | ||||
| -rw-r--r-- | src/go/plugin/go.d/modules/beanstalk/testdata/stats-tube-default.txt | 16 | ||||
| -rw-r--r-- | src/go/plugin/go.d/modules/beanstalk/testdata/stats.txt | 50 | ||||
| -rw-r--r-- | src/go/plugin/go.d/modules/bind/README.md (renamed from src/go/collectors/go.d.plugin/modules/bind/README.md) | 2 | ||||
| -rw-r--r-- | src/go/plugin/go.d/modules/bind/bind.go (renamed from src/go/collectors/go.d.plugin/modules/bind/bind.go) | 6 | ||||
| -rw-r--r-- | src/go/plugin/go.d/modules/bind/bind_test.go (renamed from src/go/collectors/go.d.plugin/modules/bind/bind_test.go) | 2 | ||||
| -rw-r--r-- | src/go/plugin/go.d/modules/bind/charts.go (renamed from src/go/collectors/go.d.plugin/modules/bind/charts.go) | 2 | ||||
| -rw-r--r-- | src/go/plugin/go.d/modules/bind/collect.go (renamed from src/go/collectors/go.d.plugin/modules/bind/collect.go) | 2 | ||||
| -rw-r--r-- | src/go/plugin/go.d/modules/bind/config_schema.json (renamed from src/go/collectors/go.d.plugin/modules/bind/config_schema.json) | 6 | ||||
| -rw-r--r-- | src/go/plugin/go.d/modules/bind/init.go (renamed from src/go/collectors/go.d.plugin/modules/bind/init.go) | 2 | ||||
| -rw-r--r-- | src/go/plugin/go.d/modules/bind/json_client.go (renamed from src/go/collectors/go.d.plugin/modules/bind/json_client.go) | 2 | ||||
| -rw-r--r-- | src/go/plugin/go.d/modules/bind/testdata/config.json (renamed from src/go/collectors/go.d.plugin/modules/bind/testdata/config.json) | 0 | ||||
| -rw-r--r-- | src/go/plugin/go.d/modules/bind/testdata/config.yaml (renamed from src/go/collectors/go.d.plugin/modules/bind/testdata/config.yaml) | 0 | ||||
| -rw-r--r-- | src/go/plugin/go.d/modules/bind/testdata/query-server.json (renamed from src/go/collectors/go.d.plugin/modules/bind/testdata/query-server.json) | 0 | ||||
| -rw-r--r-- | src/go/plugin/go.d/modules/bind/testdata/query-server.xml (renamed from src/go/collectors/go.d.plugin/modules/bind/testdata/query-server.xml) | 0 | ||||
| -rw-r--r-- | src/go/plugin/go.d/modules/bind/xml3_client.go (renamed from src/go/collectors/go.d.plugin/modules/bind/xml3_client.go) | 2 | ||||
| l--------- | src/go/plugin/go.d/modules/cassandra/README.md (renamed from src/go/collectors/go.d.plugin/modules/cassandra/README.md) | 0 | ||||
| -rw-r--r-- | src/go/plugin/go.d/modules/cassandra/cassandra.go (renamed from src/go/collectors/go.d.plugin/modules/cassandra/cassandra.go) | 6 | ||||
| -rw-r--r-- | src/go/plugin/go.d/modules/cassandra/cassandra_test.go (renamed from src/go/collectors/go.d.plugin/modules/cassandra/cassandra_test.go) | 4 | ||||
| -rw-r--r-- | src/go/plugin/go.d/modules/cassandra/charts.go (renamed from src/go/collectors/go.d.plugin/modules/cassandra/charts.go) | 2 | ||||
| -rw-r--r-- | src/go/plugin/go.d/modules/cassandra/collect.go (renamed from src/go/collectors/go.d.plugin/modules/cassandra/collect.go) | 2 | ||||
| -rw-r--r-- | src/go/plugin/go.d/modules/cassandra/config_schema.json (renamed from src/go/collectors/go.d.plugin/modules/cassandra/config_schema.json) | 6 | ||||
| -rw-r--r-- | src/go/plugin/go.d/modules/cassandra/init.go (renamed from src/go/collectors/go.d.plugin/modules/cassandra/init.go) | 4 | ||||
| -rw-r--r-- | src/go/plugin/go.d/modules/cassandra/integrations/cassandra.md (renamed from src/go/collectors/go.d.plugin/modules/cassandra/integrations/cassandra.md) | 39 | ||||
| -rw-r--r-- | src/go/plugin/go.d/modules/cassandra/jmx_exporter.yaml (renamed from src/go/collectors/go.d.plugin/modules/cassandra/jmx_exporter.yaml) | 0 | ||||
| -rw-r--r-- | src/go/plugin/go.d/modules/cassandra/metadata.yaml (renamed from src/go/collectors/go.d.plugin/modules/cassandra/metadata.yaml) | 0 | ||||
| -rw-r--r-- | src/go/plugin/go.d/modules/cassandra/metrics.go (renamed from src/go/collectors/go.d.plugin/modules/cassandra/metrics.go) | 0 | ||||
| -rw-r--r-- | src/go/plugin/go.d/modules/cassandra/testdata/config.json (renamed from src/go/collectors/go.d.plugin/modules/cassandra/testdata/config.json) | 0 | ||||
| -rw-r--r-- | src/go/plugin/go.d/modules/cassandra/testdata/config.yaml (renamed from src/go/collectors/go.d.plugin/modules/cassandra/testdata/config.yaml) | 0 | ||||
| -rw-r--r-- | src/go/plugin/go.d/modules/cassandra/testdata/metrics.txt (renamed from src/go/collectors/go.d.plugin/modules/cassandra/testdata/metrics.txt) | 0 | ||||
| l--------- | src/go/plugin/go.d/modules/chrony/README.md (renamed from src/go/collectors/go.d.plugin/modules/chrony/README.md) | 0 | ||||
| -rw-r--r-- | src/go/plugin/go.d/modules/chrony/charts.go | 320 | ||||
| -rw-r--r-- | src/go/plugin/go.d/modules/chrony/chrony.go (renamed from src/go/collectors/go.d.plugin/modules/chrony/chrony.go) | 15 | ||||
| -rw-r--r-- | src/go/plugin/go.d/modules/chrony/chrony_test.go (renamed from src/go/collectors/go.d.plugin/modules/chrony/chrony_test.go) | 33 | ||||
| -rw-r--r-- | src/go/plugin/go.d/modules/chrony/client.go | 171 | ||||
| -rw-r--r-- | src/go/plugin/go.d/modules/chrony/collect.go | 156 | ||||
| -rw-r--r-- | src/go/plugin/go.d/modules/chrony/config_schema.json (renamed from src/go/collectors/go.d.plugin/modules/chrony/config_schema.json) | 0 | ||||
| -rw-r--r-- | src/go/plugin/go.d/modules/chrony/init.go (renamed from src/go/collectors/go.d.plugin/modules/chrony/init.go) | 0 | ||||
| -rw-r--r-- | src/go/plugin/go.d/modules/chrony/integrations/chrony.md (renamed from src/go/collectors/go.d.plugin/modules/chrony/integrations/chrony.md) | 39 | ||||
| -rw-r--r-- | src/go/plugin/go.d/modules/chrony/metadata.yaml (renamed from src/go/collectors/go.d.plugin/modules/chrony/metadata.yaml) | 0 | ||||
| -rw-r--r-- | src/go/plugin/go.d/modules/chrony/testdata/config.json (renamed from src/go/collectors/go.d.plugin/modules/chrony/testdata/config.json) | 0 | ||||
| -rw-r--r-- | src/go/plugin/go.d/modules/chrony/testdata/config.yaml (renamed from src/go/collectors/go.d.plugin/modules/chrony/testdata/config.yaml) | 0 | ||||
| l--------- | src/go/plugin/go.d/modules/clickhouse/README.md (renamed from src/go/collectors/go.d.plugin/modules/clickhouse/README.md) | 0 | ||||
| -rw-r--r-- | src/go/plugin/go.d/modules/clickhouse/charts.go (renamed from src/go/collectors/go.d.plugin/modules/clickhouse/charts.go) | 2 | ||||
| -rw-r--r-- | src/go/plugin/go.d/modules/clickhouse/clickhouse.go (renamed from src/go/collectors/go.d.plugin/modules/clickhouse/clickhouse.go) | 4 | ||||
| -rw-r--r-- | src/go/plugin/go.d/modules/clickhouse/clickhouse_test.go (renamed from src/go/collectors/go.d.plugin/modules/clickhouse/clickhouse_test.go) | 4 | ||||
| -rw-r--r-- | src/go/plugin/go.d/modules/clickhouse/collect.go (renamed from src/go/collectors/go.d.plugin/modules/clickhouse/collect.go) | 0 | ||||
| -rw-r--r-- | src/go/plugin/go.d/modules/clickhouse/collect_system_async_metrics.go (renamed from src/go/collectors/go.d.plugin/modules/clickhouse/collect_system_async_metrics.go) | 2 | ||||
| -rw-r--r-- | src/go/plugin/go.d/modules/clickhouse/collect_system_disks.go (renamed from src/go/collectors/go.d.plugin/modules/clickhouse/collect_system_disks.go) | 2 | ||||
| -rw-r--r-- | src/go/plugin/go.d/modules/clickhouse/collect_system_events.go (renamed from src/go/collectors/go.d.plugin/modules/clickhouse/collect_system_events.go) | 2 | ||||
| -rw-r--r-- | src/go/plugin/go.d/modules/clickhouse/collect_system_metrics.go (renamed from src/go/collectors/go.d.plugin/modules/clickhouse/collect_system_metrics.go) | 2 | ||||
| -rw-r--r-- | src/go/plugin/go.d/modules/clickhouse/collect_system_parts.go (renamed from src/go/collectors/go.d.plugin/modules/clickhouse/collect_system_parts.go) | 2 | ||||
| -rw-r--r-- | src/go/plugin/go.d/modules/clickhouse/collect_system_processes.go (renamed from src/go/collectors/go.d.plugin/modules/clickhouse/collect_system_processes.go) | 2 | ||||
| -rw-r--r-- | src/go/plugin/go.d/modules/clickhouse/config_schema.json (renamed from src/go/collectors/go.d.plugin/modules/clickhouse/config_schema.json) | 6 | ||||
| -rw-r--r-- | src/go/plugin/go.d/modules/clickhouse/init.go (renamed from src/go/collectors/go.d.plugin/modules/clickhouse/init.go) | 2 | ||||
| -rw-r--r-- | src/go/plugin/go.d/modules/clickhouse/integrations/clickhouse.md (renamed from src/go/collectors/go.d.plugin/modules/clickhouse/integrations/clickhouse.md) | 39 | ||||
| -rw-r--r-- | src/go/plugin/go.d/modules/clickhouse/metadata.yaml (renamed from src/go/collectors/go.d.plugin/modules/clickhouse/metadata.yaml) | 0 | ||||
| -rw-r--r-- | src/go/plugin/go.d/modules/clickhouse/testdata/config.json (renamed from src/go/collectors/go.d.plugin/modules/clickhouse/testdata/config.json) | 0 | ||||
| -rw-r--r-- | src/go/plugin/go.d/modules/clickhouse/testdata/config.yaml (renamed from src/go/collectors/go.d.plugin/modules/clickhouse/testdata/config.yaml) | 0 | ||||
| -rw-r--r-- | src/go/plugin/go.d/modules/clickhouse/testdata/resp_longest_query_time.csv (renamed from src/go/collectors/go.d.plugin/modules/clickhouse/testdata/resp_longest_query_time.csv) | 0 | ||||
| -rw-r--r-- | src/go/plugin/go.d/modules/clickhouse/testdata/resp_system_async_metrics.csv (renamed from src/go/collectors/go.d.plugin/modules/clickhouse/testdata/resp_system_async_metrics.csv) | 0 | ||||
| -rw-r--r-- | src/go/plugin/go.d/modules/clickhouse/testdata/resp_system_disks.csv (renamed from src/go/collectors/go.d.plugin/modules/clickhouse/testdata/resp_system_disks.csv) | 0 | ||||
| -rw-r--r-- | src/go/plugin/go.d/modules/clickhouse/testdata/resp_system_events.csv (renamed from src/go/collectors/go.d.plugin/modules/clickhouse/testdata/resp_system_events.csv) | 0 | ||||
| -rw-r--r-- | src/go/plugin/go.d/modules/clickhouse/testdata/resp_system_metrics.csv (renamed from src/go/collectors/go.d.plugin/modules/clickhouse/testdata/resp_system_metrics.csv) | 0 | ||||
| -rw-r--r-- | src/go/plugin/go.d/modules/clickhouse/testdata/resp_system_parts.csv (renamed from src/go/collectors/go.d.plugin/modules/clickhouse/testdata/resp_system_parts.csv) | 0 | ||||
| l--------- | src/go/plugin/go.d/modules/cockroachdb/README.md (renamed from src/go/collectors/go.d.plugin/modules/cockroachdb/README.md) | 0 | ||||
| -rw-r--r-- | src/go/plugin/go.d/modules/cockroachdb/charts.go (renamed from src/go/collectors/go.d.plugin/modules/cockroachdb/charts.go) | 2 | ||||
| -rw-r--r-- | src/go/plugin/go.d/modules/cockroachdb/cockroachdb.go (renamed from src/go/collectors/go.d.plugin/modules/cockroachdb/cockroachdb.go) | 6 | ||||
| -rw-r--r-- | src/go/plugin/go.d/modules/cockroachdb/cockroachdb_test.go (renamed from src/go/collectors/go.d.plugin/modules/cockroachdb/cockroachdb_test.go) | 2 | ||||
| -rw-r--r-- | src/go/plugin/go.d/modules/cockroachdb/collect.go (renamed from src/go/collectors/go.d.plugin/modules/cockroachdb/collect.go) | 4 | ||||
| -rw-r--r-- | src/go/plugin/go.d/modules/cockroachdb/config_schema.json (renamed from src/go/collectors/go.d.plugin/modules/cockroachdb/config_schema.json) | 6 | ||||
| -rw-r--r-- | src/go/plugin/go.d/modules/cockroachdb/init.go (renamed from src/go/collectors/go.d.plugin/modules/cockroachdb/init.go) | 4 | ||||
| -rw-r--r-- | src/go/plugin/go.d/modules/cockroachdb/integrations/cockroachdb.md (renamed from src/go/collectors/go.d.plugin/modules/cockroachdb/integrations/cockroachdb.md) | 39 | ||||
| -rw-r--r-- | src/go/plugin/go.d/modules/cockroachdb/metadata.yaml (renamed from src/go/collectors/go.d.plugin/modules/cockroachdb/metadata.yaml) | 0 | ||||
| -rw-r--r-- | src/go/plugin/go.d/modules/cockroachdb/metrics.go (renamed from src/go/collectors/go.d.plugin/modules/cockroachdb/metrics.go) | 0 | ||||
| -rw-r--r-- | src/go/plugin/go.d/modules/cockroachdb/testdata/config.json (renamed from src/go/collectors/go.d.plugin/modules/cockroachdb/testdata/config.json) | 0 | ||||
| -rw-r--r-- | src/go/plugin/go.d/modules/cockroachdb/testdata/config.yaml (renamed from src/go/collectors/go.d.plugin/modules/cockroachdb/testdata/config.yaml) | 0 | ||||
| -rw-r--r-- | src/go/plugin/go.d/modules/cockroachdb/testdata/metrics.txt (renamed from src/go/collectors/go.d.plugin/modules/cockroachdb/testdata/metrics.txt) | 0 | ||||
| -rw-r--r-- | src/go/plugin/go.d/modules/cockroachdb/testdata/non_cockroachdb.txt (renamed from src/go/collectors/go.d.plugin/modules/cockroachdb/testdata/non_cockroachdb.txt) | 0 | ||||
| l--------- | src/go/plugin/go.d/modules/consul/README.md (renamed from src/go/collectors/go.d.plugin/modules/consul/README.md) | 0 | ||||
| -rw-r--r-- | src/go/plugin/go.d/modules/consul/charts.go (renamed from src/go/collectors/go.d.plugin/modules/consul/charts.go) | 2 | ||||
| -rw-r--r-- | src/go/plugin/go.d/modules/consul/collect.go (renamed from src/go/collectors/go.d.plugin/modules/consul/collect.go) | 5 | ||||
| -rw-r--r-- | src/go/plugin/go.d/modules/consul/collect_autopilot.go (renamed from src/go/collectors/go.d.plugin/modules/consul/collect_autopilot.go) | 0 | ||||
| -rw-r--r-- | src/go/plugin/go.d/modules/consul/collect_checks.go (renamed from src/go/collectors/go.d.plugin/modules/consul/collect_checks.go) | 0 | ||||
| -rw-r--r-- | src/go/plugin/go.d/modules/consul/collect_config.go (renamed from src/go/collectors/go.d.plugin/modules/consul/collect_config.go) | 0 | ||||
| -rw-r--r-- | src/go/plugin/go.d/modules/consul/collect_metrics.go (renamed from src/go/collectors/go.d.plugin/modules/consul/collect_metrics.go) | 2 | ||||
| -rw-r--r-- | src/go/plugin/go.d/modules/consul/collect_net_rtt.go (renamed from src/go/collectors/go.d.plugin/modules/consul/collect_net_rtt.go) | 2 | ||||
| -rw-r--r-- | src/go/plugin/go.d/modules/consul/config_schema.json (renamed from src/go/collectors/go.d.plugin/modules/consul/config_schema.json) | 9 | ||||
| -rw-r--r-- | src/go/plugin/go.d/modules/consul/consul.go (renamed from src/go/collectors/go.d.plugin/modules/consul/consul.go) | 6 | ||||
| -rw-r--r-- | src/go/plugin/go.d/modules/consul/consul_test.go (renamed from src/go/collectors/go.d.plugin/modules/consul/consul_test.go) | 4 | ||||
| -rw-r--r-- | src/go/plugin/go.d/modules/consul/init.go (renamed from src/go/collectors/go.d.plugin/modules/consul/init.go) | 4 | ||||
| -rw-r--r-- | src/go/plugin/go.d/modules/consul/integrations/consul.md (renamed from src/go/collectors/go.d.plugin/modules/consul/integrations/consul.md) | 39 | ||||
| -rw-r--r-- | src/go/plugin/go.d/modules/consul/metadata.yaml (renamed from src/go/collectors/go.d.plugin/modules/consul/metadata.yaml) | 0 | ||||
| -rw-r--r-- | src/go/plugin/go.d/modules/consul/testdata/config.json (renamed from src/go/collectors/go.d.plugin/modules/consul/testdata/config.json) | 0 | ||||
| -rw-r--r-- | src/go/plugin/go.d/modules/consul/testdata/config.yaml (renamed from src/go/collectors/go.d.plugin/modules/consul/testdata/config.yaml) | 0 | ||||
| -rw-r--r-- | src/go/plugin/go.d/modules/consul/testdata/v1.13.2/client_v1-agent-metrics.txt (renamed from src/go/collectors/go.d.plugin/modules/consul/testdata/v1.13.2/client_v1-agent-metrics.txt) | 0 | ||||
| -rw-r--r-- | src/go/plugin/go.d/modules/consul/testdata/v1.13.2/client_v1-agent-self.json (renamed from src/go/collectors/go.d.plugin/modules/consul/testdata/v1.13.2/client_v1-agent-self.json) | 0 | ||||
| -rw-r--r-- | src/go/plugin/go.d/modules/consul/testdata/v1.13.2/server_v1-agent-metrics.txt (renamed from src/go/collectors/go.d.plugin/modules/consul/testdata/v1.13.2/server_v1-agent-metrics.txt) | 0 | ||||
| -rw-r--r-- | src/go/plugin/go.d/modules/consul/testdata/v1.13.2/server_v1-agent-metrics_with_hostname.txt (renamed from src/go/collectors/go.d.plugin/modules/consul/testdata/v1.13.2/server_v1-agent-metrics_with_hostname.txt) | 0 | ||||
| -rw-r--r-- | src/go/plugin/go.d/modules/consul/testdata/v1.13.2/server_v1-agent-self.json (renamed from src/go/collectors/go.d.plugin/modules/consul/testdata/v1.13.2/server_v1-agent-self.json) | 0 | ||||
| -rw-r--r-- | src/go/plugin/go.d/modules/consul/testdata/v1.13.2/server_v1-agent-self_cloud-managed.json (renamed from src/go/collectors/go.d.plugin/modules/consul/testdata/v1.13.2/server_v1-agent-self_cloud-managed.json) | 0 | ||||
| -rw-r--r-- | src/go/plugin/go.d/modules/consul/testdata/v1.13.2/server_v1-agent-self_disabled_prom.json (renamed from src/go/collectors/go.d.plugin/modules/consul/testdata/v1.13.2/server_v1-agent-self_disabled_prom.json) | 0 | ||||
| -rw-r--r-- | src/go/plugin/go.d/modules/consul/testdata/v1.13.2/server_v1-agent-self_with_hostname.json (renamed from src/go/collectors/go.d.plugin/modules/consul/testdata/v1.13.2/server_v1-agent-self_with_hostname.json) | 0 | ||||
| -rw-r--r-- | src/go/plugin/go.d/modules/consul/testdata/v1.13.2/server_v1-coordinate-nodes.json (renamed from src/go/collectors/go.d.plugin/modules/consul/testdata/v1.13.2/server_v1-coordinate-nodes.json) | 0 | ||||
| -rw-r--r-- | src/go/plugin/go.d/modules/consul/testdata/v1.13.2/server_v1-operator-autopilot-health.json (renamed from src/go/collectors/go.d.plugin/modules/consul/testdata/v1.13.2/server_v1-operator-autopilot-health.json) | 0 | ||||
| -rw-r--r-- | src/go/plugin/go.d/modules/consul/testdata/v1.13.2/v1-agent-checks.json (renamed from src/go/collectors/go.d.plugin/modules/consul/testdata/v1.13.2/v1-agent-checks.json) | 0 | ||||
| -rw-r--r-- | src/go/plugin/go.d/modules/consul/testdata/v1.14.3-cloud/server_v1-agent-metrics.txt (renamed from src/go/collectors/go.d.plugin/modules/consul/testdata/v1.14.3-cloud/server_v1-agent-metrics.txt) | 0 | ||||
| -rw-r--r-- | src/go/plugin/go.d/modules/consul/testdata/v1.14.3-cloud/server_v1-agent-self.json (renamed from src/go/collectors/go.d.plugin/modules/consul/testdata/v1.14.3-cloud/server_v1-agent-self.json) | 0 | ||||
| -rw-r--r-- | src/go/plugin/go.d/modules/consul/testdata/v1.14.3-cloud/server_v1-coordinate-nodes.json (renamed from src/go/collectors/go.d.plugin/modules/consul/testdata/v1.14.3-cloud/server_v1-coordinate-nodes.json) | 0 | ||||
| -rw-r--r-- | src/go/plugin/go.d/modules/consul/testdata/v1.14.3-cloud/v1-agent-checks.json (renamed from src/go/collectors/go.d.plugin/modules/consul/testdata/v1.14.3-cloud/v1-agent-checks.json) | 0 | ||||
| l--------- | src/go/plugin/go.d/modules/coredns/README.md (renamed from src/go/collectors/go.d.plugin/modules/coredns/README.md) | 0 | ||||
| -rw-r--r-- | src/go/plugin/go.d/modules/coredns/charts.go (renamed from src/go/collectors/go.d.plugin/modules/coredns/charts.go) | 2 | ||||
| -rw-r--r-- | src/go/plugin/go.d/modules/coredns/collect.go (renamed from src/go/collectors/go.d.plugin/modules/coredns/collect.go) | 4 | ||||
| -rw-r--r-- | src/go/plugin/go.d/modules/coredns/config_schema.json (renamed from src/go/collectors/go.d.plugin/modules/coredns/config_schema.json) | 14 | ||||
| -rw-r--r-- | src/go/plugin/go.d/modules/coredns/coredns.go (renamed from src/go/collectors/go.d.plugin/modules/coredns/coredns.go) | 8 | ||||
| -rw-r--r-- | src/go/plugin/go.d/modules/coredns/coredns_test.go (renamed from src/go/collectors/go.d.plugin/modules/coredns/coredns_test.go) | 2 | ||||
| -rw-r--r-- | src/go/plugin/go.d/modules/coredns/init.go (renamed from src/go/collectors/go.d.plugin/modules/coredns/init.go) | 6 | ||||
| -rw-r--r-- | src/go/plugin/go.d/modules/coredns/integrations/coredns.md (renamed from src/go/collectors/go.d.plugin/modules/coredns/integrations/coredns.md) | 43 | ||||
| -rw-r--r-- | src/go/plugin/go.d/modules/coredns/metadata.yaml (renamed from src/go/collectors/go.d.plugin/modules/coredns/metadata.yaml) | 4 | ||||
| -rw-r--r-- | src/go/plugin/go.d/modules/coredns/metrics.go (renamed from src/go/collectors/go.d.plugin/modules/coredns/metrics.go) | 2 | ||||
| -rw-r--r-- | src/go/plugin/go.d/modules/coredns/testdata/config.json (renamed from src/go/collectors/go.d.plugin/modules/coredns/testdata/config.json) | 0 | ||||
| -rw-r--r-- | src/go/plugin/go.d/modules/coredns/testdata/config.yaml (renamed from src/go/collectors/go.d.plugin/modules/coredns/testdata/config.yaml) | 0 | ||||
| -rw-r--r-- | src/go/plugin/go.d/modules/coredns/testdata/no_version/no_load.txt (renamed from src/go/collectors/go.d.plugin/modules/coredns/testdata/no_version/no_load.txt) | 0 | ||||
| -rw-r--r-- | src/go/plugin/go.d/modules/coredns/testdata/version169/no_load.txt (renamed from src/go/collectors/go.d.plugin/modules/coredns/testdata/version169/no_load.txt) | 0 | ||||
| -rw-r--r-- | src/go/plugin/go.d/modules/coredns/testdata/version169/some_load.txt (renamed from src/go/collectors/go.d.plugin/modules/coredns/testdata/version169/some_load.txt) | 0 | ||||
| -rw-r--r-- | src/go/plugin/go.d/modules/coredns/testdata/version170/no_load.txt (renamed from src/go/collectors/go.d.plugin/modules/coredns/testdata/version170/no_load.txt) | 0 | ||||
| -rw-r--r-- | src/go/plugin/go.d/modules/coredns/testdata/version170/some_load.txt (renamed from src/go/collectors/go.d.plugin/modules/coredns/testdata/version170/some_load.txt) | 0 | ||||
| l--------- | src/go/plugin/go.d/modules/couchbase/README.md (renamed from src/go/collectors/go.d.plugin/modules/couchbase/README.md) | 0 | ||||
| -rw-r--r-- | src/go/plugin/go.d/modules/couchbase/charts.go (renamed from src/go/collectors/go.d.plugin/modules/couchbase/charts.go) | 2 | ||||
| -rw-r--r-- | src/go/plugin/go.d/modules/couchbase/collect.go (renamed from src/go/collectors/go.d.plugin/modules/couchbase/collect.go) | 12 | ||||
| -rw-r--r-- | src/go/plugin/go.d/modules/couchbase/config_schema.json (renamed from src/go/collectors/go.d.plugin/modules/couchbase/config_schema.json) | 6 | ||||
| -rw-r--r-- | src/go/plugin/go.d/modules/couchbase/couchbase.go (renamed from src/go/collectors/go.d.plugin/modules/couchbase/couchbase.go) | 4 | ||||
| -rw-r--r-- | src/go/plugin/go.d/modules/couchbase/couchbase_test.go (renamed from src/go/collectors/go.d.plugin/modules/couchbase/couchbase_test.go) | 4 | ||||
| -rw-r--r-- | src/go/plugin/go.d/modules/couchbase/init.go (renamed from src/go/collectors/go.d.plugin/modules/couchbase/init.go) | 4 | ||||
| -rw-r--r-- | src/go/plugin/go.d/modules/couchbase/integrations/couchbase.md (renamed from src/go/collectors/go.d.plugin/modules/couchbase/integrations/couchbase.md) | 39 | ||||
| -rw-r--r-- | src/go/plugin/go.d/modules/couchbase/metadata.yaml (renamed from src/go/collectors/go.d.plugin/modules/couchbase/metadata.yaml) | 0 | ||||
| -rw-r--r-- | src/go/plugin/go.d/modules/couchbase/metrics.go (renamed from src/go/collectors/go.d.plugin/modules/couchbase/metrics.go) | 0 | ||||
| -rw-r--r-- | src/go/plugin/go.d/modules/couchbase/testdata/6.6.0/buckets_basic_stats.json (renamed from src/go/collectors/go.d.plugin/modules/couchbase/testdata/6.6.0/buckets_basic_stats.json) | 0 | ||||
| -rw-r--r-- | src/go/plugin/go.d/modules/couchbase/testdata/config.json (renamed from src/go/collectors/go.d.plugin/modules/couchbase/testdata/config.json) | 0 | ||||
| -rw-r--r-- | src/go/plugin/go.d/modules/couchbase/testdata/config.yaml (renamed from src/go/collectors/go.d.plugin/modules/couchbase/testdata/config.yaml) | 0 | ||||
| l--------- | src/go/plugin/go.d/modules/couchdb/README.md (renamed from src/go/collectors/go.d.plugin/modules/couchdb/README.md) | 0 | ||||
| -rw-r--r-- | src/go/plugin/go.d/modules/couchdb/charts.go (renamed from src/go/collectors/go.d.plugin/modules/couchdb/charts.go) | 2 | ||||
| -rw-r--r-- | src/go/plugin/go.d/modules/couchdb/collect.go (renamed from src/go/collectors/go.d.plugin/modules/couchdb/collect.go) | 24 | ||||
| -rw-r--r-- | src/go/plugin/go.d/modules/couchdb/config_schema.json (renamed from src/go/collectors/go.d.plugin/modules/couchdb/config_schema.json) | 6 | ||||
| -rw-r--r-- | src/go/plugin/go.d/modules/couchdb/couchdb.go (renamed from src/go/collectors/go.d.plugin/modules/couchdb/couchdb.go) | 4 | ||||
| -rw-r--r-- | src/go/plugin/go.d/modules/couchdb/couchdb_test.go (renamed from src/go/collectors/go.d.plugin/modules/couchdb/couchdb_test.go) | 6 | ||||
| -rw-r--r-- | src/go/plugin/go.d/modules/couchdb/init.go (renamed from src/go/collectors/go.d.plugin/modules/couchdb/init.go) | 4 | ||||
| -rw-r--r-- | src/go/plugin/go.d/modules/couchdb/integrations/couchdb.md (renamed from src/go/collectors/go.d.plugin/modules/couchdb/integrations/couchdb.md) | 39 | ||||
| -rw-r--r-- | src/go/plugin/go.d/modules/couchdb/metadata.yaml (renamed from src/go/collectors/go.d.plugin/modules/couchdb/metadata.yaml) | 0 | ||||
| -rw-r--r-- | src/go/plugin/go.d/modules/couchdb/metrics.go (renamed from src/go/collectors/go.d.plugin/modules/couchdb/metrics.go) | 0 | ||||
| -rw-r--r-- | src/go/plugin/go.d/modules/couchdb/testdata/config.json (renamed from src/go/collectors/go.d.plugin/modules/couchdb/testdata/config.json) | 0 | ||||
| -rw-r--r-- | src/go/plugin/go.d/modules/couchdb/testdata/config.yaml (renamed from src/go/collectors/go.d.plugin/modules/couchdb/testdata/config.yaml) | 0 | ||||
| -rw-r--r-- | src/go/plugin/go.d/modules/couchdb/testdata/v3.1.1/active_tasks.json (renamed from src/go/collectors/go.d.plugin/modules/couchdb/testdata/v3.1.1/active_tasks.json) | 0 | ||||
| -rw-r--r-- | src/go/plugin/go.d/modules/couchdb/testdata/v3.1.1/dbs_info.json (renamed from src/go/collectors/go.d.plugin/modules/couchdb/testdata/v3.1.1/dbs_info.json) | 0 | ||||
| -rw-r--r-- | src/go/plugin/go.d/modules/couchdb/testdata/v3.1.1/node_stats.json (renamed from src/go/collectors/go.d.plugin/modules/couchdb/testdata/v3.1.1/node_stats.json) | 0 | ||||
| -rw-r--r-- | src/go/plugin/go.d/modules/couchdb/testdata/v3.1.1/node_system.json (renamed from src/go/collectors/go.d.plugin/modules/couchdb/testdata/v3.1.1/node_system.json) | 0 | ||||
| -rw-r--r-- | src/go/plugin/go.d/modules/couchdb/testdata/v3.1.1/root.json (renamed from src/go/collectors/go.d.plugin/modules/couchdb/testdata/v3.1.1/root.json) | 0 | ||||
| l--------- | src/go/plugin/go.d/modules/dmcache/README.md (renamed from src/go/collectors/go.d.plugin/modules/dmcache/README.md) | 0 | ||||
| -rw-r--r-- | src/go/plugin/go.d/modules/dmcache/charts.go (renamed from src/go/collectors/go.d.plugin/modules/dmcache/charts.go) | 2 | ||||
| -rw-r--r-- | src/go/plugin/go.d/modules/dmcache/collect.go (renamed from src/go/collectors/go.d.plugin/modules/dmcache/collect.go) | 0 | ||||
| -rw-r--r-- | src/go/plugin/go.d/modules/dmcache/config_schema.json (renamed from src/go/collectors/go.d.plugin/modules/dmcache/config_schema.json) | 0 | ||||
| -rw-r--r-- | src/go/plugin/go.d/modules/dmcache/dmcache.go (renamed from src/go/collectors/go.d.plugin/modules/dmcache/dmcache.go) | 4 | ||||
| -rw-r--r-- | src/go/plugin/go.d/modules/dmcache/dmcache_test.go (renamed from src/go/collectors/go.d.plugin/modules/dmcache/dmcache_test.go) | 2 | ||||
| -rw-r--r-- | src/go/plugin/go.d/modules/dmcache/exec.go (renamed from src/go/collectors/go.d.plugin/modules/dmcache/exec.go) | 2 | ||||
| -rw-r--r-- | src/go/plugin/go.d/modules/dmcache/init.go (renamed from src/go/collectors/go.d.plugin/modules/dmcache/init.go) | 2 | ||||
| -rw-r--r-- | src/go/plugin/go.d/modules/dmcache/integrations/dmcache_devices.md (renamed from src/go/collectors/go.d.plugin/modules/dmcache/integrations/dmcache_devices.md) | 39 | ||||
| -rw-r--r-- | src/go/plugin/go.d/modules/dmcache/metadata.yaml (renamed from src/go/collectors/go.d.plugin/modules/dmcache/metadata.yaml) | 0 | ||||
| -rw-r--r-- | src/go/plugin/go.d/modules/dmcache/testdata/config.json (renamed from src/go/collectors/go.d.plugin/modules/dmcache/testdata/config.json) | 0 | ||||
| -rw-r--r-- | src/go/plugin/go.d/modules/dmcache/testdata/config.yaml (renamed from src/go/collectors/go.d.plugin/modules/dmcache/testdata/config.yaml) | 0 | ||||
| l--------- | src/go/plugin/go.d/modules/dnsdist/README.md (renamed from src/go/collectors/go.d.plugin/modules/dnsdist/README.md) | 0 | ||||
| -rw-r--r-- | src/go/plugin/go.d/modules/dnsdist/charts.go (renamed from src/go/collectors/go.d.plugin/modules/dnsdist/charts.go) | 2 | ||||
| -rw-r--r-- | src/go/plugin/go.d/modules/dnsdist/collect.go (renamed from src/go/collectors/go.d.plugin/modules/dnsdist/collect.go) | 10 | ||||
| -rw-r--r-- | src/go/plugin/go.d/modules/dnsdist/config_schema.json (renamed from src/go/collectors/go.d.plugin/modules/dnsdist/config_schema.json) | 6 | ||||
| -rw-r--r-- | src/go/plugin/go.d/modules/dnsdist/dnsdist.go (renamed from src/go/collectors/go.d.plugin/modules/dnsdist/dnsdist.go) | 4 | ||||
| -rw-r--r-- | src/go/plugin/go.d/modules/dnsdist/dnsdist_test.go (renamed from src/go/collectors/go.d.plugin/modules/dnsdist/dnsdist_test.go) | 6 | ||||
| -rw-r--r-- | src/go/plugin/go.d/modules/dnsdist/init.go (renamed from src/go/collectors/go.d.plugin/modules/dnsdist/init.go) | 4 | ||||
| -rw-r--r-- | src/go/plugin/go.d/modules/dnsdist/integrations/dnsdist.md (renamed from src/go/collectors/go.d.plugin/modules/dnsdist/integrations/dnsdist.md) | 39 | ||||
| -rw-r--r-- | src/go/plugin/go.d/modules/dnsdist/metadata.yaml (renamed from src/go/collectors/go.d.plugin/modules/dnsdist/metadata.yaml) | 0 | ||||
| -rw-r--r-- | src/go/plugin/go.d/modules/dnsdist/metrics.go (renamed from src/go/collectors/go.d.plugin/modules/dnsdist/metrics.go) | 0 | ||||
| -rw-r--r-- | src/go/plugin/go.d/modules/dnsdist/testdata/config.json (renamed from src/go/collectors/go.d.plugin/modules/dnsdist/testdata/config.json) | 0 | ||||
| -rw-r--r-- | src/go/plugin/go.d/modules/dnsdist/testdata/config.yaml (renamed from src/go/collectors/go.d.plugin/modules/dnsdist/testdata/config.yaml) | 0 | ||||
| -rw-r--r-- | src/go/plugin/go.d/modules/dnsdist/testdata/v1.5.1/jsonstat.json (renamed from src/go/collectors/go.d.plugin/modules/dnsdist/testdata/v1.5.1/jsonstat.json) | 0 | ||||
| l--------- | src/go/plugin/go.d/modules/dnsmasq/README.md (renamed from src/go/collectors/go.d.plugin/modules/dnsmasq/README.md) | 0 | ||||
| -rw-r--r-- | src/go/plugin/go.d/modules/dnsmasq/charts.go (renamed from src/go/collectors/go.d.plugin/modules/dnsmasq/charts.go) | 2 | ||||
| -rw-r--r-- | src/go/plugin/go.d/modules/dnsmasq/collect.go | 139 | ||||
| -rw-r--r-- | src/go/plugin/go.d/modules/dnsmasq/config_schema.json (renamed from src/go/collectors/go.d.plugin/modules/dnsmasq/config_schema.json) | 0 | ||||
| -rw-r--r-- | src/go/plugin/go.d/modules/dnsmasq/dnsmasq.go (renamed from src/go/collectors/go.d.plugin/modules/dnsmasq/dnsmasq.go) | 4 | ||||
| -rw-r--r-- | src/go/plugin/go.d/modules/dnsmasq/dnsmasq_test.go (renamed from src/go/collectors/go.d.plugin/modules/dnsmasq/dnsmasq_test.go) | 2 | ||||
| -rw-r--r-- | src/go/plugin/go.d/modules/dnsmasq/init.go (renamed from src/go/collectors/go.d.plugin/modules/dnsmasq/init.go) | 2 | ||||
| -rw-r--r-- | src/go/plugin/go.d/modules/dnsmasq/integrations/dnsmasq.md (renamed from src/go/collectors/go.d.plugin/modules/dnsmasq/integrations/dnsmasq.md) | 39 | ||||
| -rw-r--r-- | src/go/plugin/go.d/modules/dnsmasq/metadata.yaml (renamed from src/go/collectors/go.d.plugin/modules/dnsmasq/metadata.yaml) | 0 | ||||
| -rw-r--r-- | src/go/plugin/go.d/modules/dnsmasq/testdata/config.json (renamed from src/go/collectors/go.d.plugin/modules/dnsmasq/testdata/config.json) | 0 | ||||
| -rw-r--r-- | src/go/plugin/go.d/modules/dnsmasq/testdata/config.yaml (renamed from src/go/collectors/go.d.plugin/modules/dnsmasq/testdata/config.yaml) | 0 | ||||
| l--------- | src/go/plugin/go.d/modules/dnsmasq_dhcp/README.md (renamed from src/go/collectors/go.d.plugin/modules/dnsmasq_dhcp/README.md) | 0 | ||||
| -rw-r--r-- | src/go/plugin/go.d/modules/dnsmasq_dhcp/charts.go (renamed from src/go/collectors/go.d.plugin/modules/dnsmasq_dhcp/charts.go) | 2 | ||||
| -rw-r--r-- | src/go/plugin/go.d/modules/dnsmasq_dhcp/collect.go (renamed from src/go/collectors/go.d.plugin/modules/dnsmasq_dhcp/collect.go) | 2 | ||||
| -rw-r--r-- | src/go/plugin/go.d/modules/dnsmasq_dhcp/config_schema.json (renamed from src/go/collectors/go.d.plugin/modules/dnsmasq_dhcp/config_schema.json) | 0 | ||||
| -rw-r--r-- | src/go/plugin/go.d/modules/dnsmasq_dhcp/dhcp.go (renamed from src/go/collectors/go.d.plugin/modules/dnsmasq_dhcp/dhcp.go) | 4 | ||||
| -rw-r--r-- | src/go/plugin/go.d/modules/dnsmasq_dhcp/dhcp_test.go (renamed from src/go/collectors/go.d.plugin/modules/dnsmasq_dhcp/dhcp_test.go) | 62 | ||||
| -rw-r--r-- | src/go/plugin/go.d/modules/dnsmasq_dhcp/init.go (renamed from src/go/collectors/go.d.plugin/modules/dnsmasq_dhcp/init.go) | 0 | ||||
| -rw-r--r-- | src/go/plugin/go.d/modules/dnsmasq_dhcp/integrations/dnsmasq_dhcp.md (renamed from src/go/collectors/go.d.plugin/modules/dnsmasq_dhcp/integrations/dnsmasq_dhcp.md) | 39 | ||||
| -rw-r--r-- | src/go/plugin/go.d/modules/dnsmasq_dhcp/metadata.yaml (renamed from src/go/collectors/go.d.plugin/modules/dnsmasq_dhcp/metadata.yaml) | 0 | ||||
| -rw-r--r-- | src/go/plugin/go.d/modules/dnsmasq_dhcp/parse_configuration.go (renamed from src/go/collectors/go.d.plugin/modules/dnsmasq_dhcp/parse_configuration.go) | 31 | ||||
| -rw-r--r-- | src/go/plugin/go.d/modules/dnsmasq_dhcp/testdata/config.json (renamed from src/go/collectors/go.d.plugin/modules/dnsmasq_dhcp/testdata/config.json) | 0 | ||||
| -rw-r--r-- | src/go/plugin/go.d/modules/dnsmasq_dhcp/testdata/config.yaml (renamed from src/go/collectors/go.d.plugin/modules/dnsmasq_dhcp/testdata/config.yaml) | 0 | ||||
| -rw-r--r-- | src/go/plugin/go.d/modules/dnsmasq_dhcp/testdata/dnsmasq.conf (renamed from src/go/collectors/go.d.plugin/modules/dnsmasq_dhcp/testdata/dnsmasq.conf) | 0 | ||||
| -rw-r--r-- | src/go/plugin/go.d/modules/dnsmasq_dhcp/testdata/dnsmasq.d/.dnsmasq.conf (renamed from src/go/collectors/go.d.plugin/modules/dnsmasq_dhcp/testdata/dnsmasq.d/.dnsmasq.conf) | 0 | ||||
| -rw-r--r-- | src/go/plugin/go.d/modules/dnsmasq_dhcp/testdata/dnsmasq.d/dnsmasqv4.any (renamed from src/go/collectors/go.d.plugin/modules/dnsmasq_dhcp/testdata/dnsmasq.d/dnsmasqv4.any) | 0 | ||||
| -rw-r--r-- | src/go/plugin/go.d/modules/dnsmasq_dhcp/testdata/dnsmasq.d/dnsmasqv6.any (renamed from src/go/collectors/go.d.plugin/modules/dnsmasq_dhcp/testdata/dnsmasq.d/dnsmasqv6.any) | 0 | ||||
| -rw-r--r-- | src/go/plugin/go.d/modules/dnsmasq_dhcp/testdata/dnsmasq.d2/dnsmasqv4.any (renamed from src/go/collectors/go.d.plugin/modules/dnsmasq_dhcp/testdata/dnsmasq.d2/dnsmasqv4.any) | 0 | ||||
| -rw-r--r-- | src/go/plugin/go.d/modules/dnsmasq_dhcp/testdata/dnsmasq.d2/dnsmasqv6.any (renamed from src/go/collectors/go.d.plugin/modules/dnsmasq_dhcp/testdata/dnsmasq.d2/dnsmasqv6.any) | 0 | ||||
| -rw-r--r-- | src/go/plugin/go.d/modules/dnsmasq_dhcp/testdata/dnsmasq.d2/~dnsmasq.conf (renamed from src/go/collectors/go.d.plugin/modules/dnsmasq_dhcp/testdata/dnsmasq.d2/~dnsmasq.conf) | 0 | ||||
| -rw-r--r-- | src/go/plugin/go.d/modules/dnsmasq_dhcp/testdata/dnsmasq.d3/dnsmasq.bak (renamed from src/go/collectors/go.d.plugin/modules/dnsmasq_dhcp/testdata/dnsmasq.d3/dnsmasq.bak) | 0 | ||||
| -rw-r--r-- | src/go/plugin/go.d/modules/dnsmasq_dhcp/testdata/dnsmasq.d3/dnsmasqv4.any (renamed from src/go/collectors/go.d.plugin/modules/dnsmasq_dhcp/testdata/dnsmasq.d3/dnsmasqv4.any) | 0 | ||||
| -rw-r--r-- | src/go/plugin/go.d/modules/dnsmasq_dhcp/testdata/dnsmasq.d3/dnsmasqv6.any (renamed from src/go/collectors/go.d.plugin/modules/dnsmasq_dhcp/testdata/dnsmasq.d3/dnsmasqv6.any) | 0 | ||||
| -rw-r--r-- | src/go/plugin/go.d/modules/dnsmasq_dhcp/testdata/dnsmasq.d4/dnsmasq.other (renamed from src/go/collectors/go.d.plugin/modules/dnsmasq_dhcp/testdata/dnsmasq.d4/dnsmasq.other) | 0 | ||||
| -rw-r--r-- | src/go/plugin/go.d/modules/dnsmasq_dhcp/testdata/dnsmasq.d4/dnsmasqv4.conf (renamed from src/go/collectors/go.d.plugin/modules/dnsmasq_dhcp/testdata/dnsmasq.d4/dnsmasqv4.conf) | 0 | ||||
| -rw-r--r-- | src/go/plugin/go.d/modules/dnsmasq_dhcp/testdata/dnsmasq.d4/dnsmasqv6.conf (renamed from src/go/collectors/go.d.plugin/modules/dnsmasq_dhcp/testdata/dnsmasq.d4/dnsmasqv6.conf) | 0 | ||||
| -rw-r--r-- | src/go/plugin/go.d/modules/dnsmasq_dhcp/testdata/dnsmasq.leases (renamed from src/go/collectors/go.d.plugin/modules/dnsmasq_dhcp/testdata/dnsmasq.leases) | 0 | ||||
| -rw-r--r-- | src/go/plugin/go.d/modules/dnsmasq_dhcp/testdata/dnsmasq2.conf (renamed from src/go/collectors/go.d.plugin/modules/dnsmasq_dhcp/testdata/dnsmasq2.conf) | 0 | ||||
| -rw-r--r-- | src/go/plugin/go.d/modules/dnsmasq_dhcp/testdata/dnsmasq3.conf (renamed from src/go/collectors/go.d.plugin/modules/dnsmasq_dhcp/testdata/dnsmasq3.conf) | 0 | ||||
| l--------- | src/go/plugin/go.d/modules/dnsquery/README.md (renamed from src/go/collectors/go.d.plugin/modules/dnsquery/README.md) | 0 | ||||
| -rw-r--r-- | src/go/plugin/go.d/modules/dnsquery/charts.go (renamed from src/go/collectors/go.d.plugin/modules/dnsquery/charts.go) | 2 | ||||
| -rw-r--r-- | src/go/plugin/go.d/modules/dnsquery/collect.go (renamed from src/go/collectors/go.d.plugin/modules/dnsquery/collect.go) | 0 | ||||
| -rw-r--r-- | src/go/plugin/go.d/modules/dnsquery/config_schema.json (renamed from src/go/collectors/go.d.plugin/modules/dnsquery/config_schema.json) | 0 | ||||
| -rw-r--r-- | src/go/plugin/go.d/modules/dnsquery/dnsquery.go (renamed from src/go/collectors/go.d.plugin/modules/dnsquery/dnsquery.go) | 4 | ||||
| -rw-r--r-- | src/go/plugin/go.d/modules/dnsquery/dnsquery_test.go (renamed from src/go/collectors/go.d.plugin/modules/dnsquery/dnsquery_test.go) | 4 | ||||
| -rw-r--r-- | src/go/plugin/go.d/modules/dnsquery/init.go (renamed from src/go/collectors/go.d.plugin/modules/dnsquery/init.go) | 2 | ||||
| -rw-r--r-- | src/go/plugin/go.d/modules/dnsquery/integrations/dns_query.md (renamed from src/go/collectors/go.d.plugin/modules/dnsquery/integrations/dns_query.md) | 39 | ||||
| -rw-r--r-- | src/go/plugin/go.d/modules/dnsquery/metadata.yaml (renamed from src/go/collectors/go.d.plugin/modules/dnsquery/metadata.yaml) | 0 | ||||
| -rw-r--r-- | src/go/plugin/go.d/modules/dnsquery/testdata/config.json (renamed from src/go/collectors/go.d.plugin/modules/dnsquery/testdata/config.json) | 0 | ||||
| -rw-r--r-- | src/go/plugin/go.d/modules/dnsquery/testdata/config.yaml (renamed from src/go/collectors/go.d.plugin/modules/dnsquery/testdata/config.yaml) | 0 | ||||
| l--------- | src/go/plugin/go.d/modules/docker/README.md (renamed from src/go/collectors/go.d.plugin/modules/docker/README.md) | 0 | ||||
| -rw-r--r-- | src/go/plugin/go.d/modules/docker/charts.go (renamed from src/go/collectors/go.d.plugin/modules/docker/charts.go) | 2 | ||||
| -rw-r--r-- | src/go/plugin/go.d/modules/docker/collect.go (renamed from src/go/collectors/go.d.plugin/modules/docker/collect.go) | 0 | ||||
| -rw-r--r-- | src/go/plugin/go.d/modules/docker/config_schema.json (renamed from src/go/collectors/go.d.plugin/modules/docker/config_schema.json) | 0 | ||||
| -rw-r--r-- | src/go/plugin/go.d/modules/docker/docker.go (renamed from src/go/collectors/go.d.plugin/modules/docker/docker.go) | 6 | ||||
| -rw-r--r-- | src/go/plugin/go.d/modules/docker/docker_test.go (renamed from src/go/collectors/go.d.plugin/modules/docker/docker_test.go) | 2 | ||||
| -rw-r--r-- | src/go/plugin/go.d/modules/docker/integrations/docker.md (renamed from src/go/collectors/go.d.plugin/modules/docker/integrations/docker.md) | 39 | ||||
| -rw-r--r-- | src/go/plugin/go.d/modules/docker/metadata.yaml (renamed from src/go/collectors/go.d.plugin/modules/docker/metadata.yaml) | 0 | ||||
| -rw-r--r-- | src/go/plugin/go.d/modules/docker/testdata/config.json (renamed from src/go/collectors/go.d.plugin/modules/docker/testdata/config.json) | 0 | ||||
| -rw-r--r-- | src/go/plugin/go.d/modules/docker/testdata/config.yaml (renamed from src/go/collectors/go.d.plugin/modules/docker/testdata/config.yaml) | 0 | ||||
| l--------- | src/go/plugin/go.d/modules/docker_engine/README.md (renamed from src/go/collectors/go.d.plugin/modules/docker_engine/README.md) | 0 | ||||
| -rw-r--r-- | src/go/plugin/go.d/modules/docker_engine/charts.go (renamed from src/go/collectors/go.d.plugin/modules/docker_engine/charts.go) | 2 | ||||
| -rw-r--r-- | src/go/plugin/go.d/modules/docker_engine/collect.go (renamed from src/go/collectors/go.d.plugin/modules/docker_engine/collect.go) | 4 | ||||
| -rw-r--r-- | src/go/plugin/go.d/modules/docker_engine/config_schema.json (renamed from src/go/collectors/go.d.plugin/modules/docker_engine/config_schema.json) | 6 | ||||
| -rw-r--r-- | src/go/plugin/go.d/modules/docker_engine/docker_engine.go (renamed from src/go/collectors/go.d.plugin/modules/docker_engine/docker_engine.go) | 6 | ||||
| -rw-r--r-- | src/go/plugin/go.d/modules/docker_engine/docker_engine_test.go (renamed from src/go/collectors/go.d.plugin/modules/docker_engine/docker_engine_test.go) | 6 | ||||
| -rw-r--r-- | src/go/plugin/go.d/modules/docker_engine/init.go (renamed from src/go/collectors/go.d.plugin/modules/docker_engine/init.go) | 4 | ||||
| -rw-r--r-- | src/go/plugin/go.d/modules/docker_engine/integrations/docker_engine.md (renamed from src/go/collectors/go.d.plugin/modules/docker_engine/integrations/docker_engine.md) | 39 | ||||
| -rw-r--r-- | src/go/plugin/go.d/modules/docker_engine/metadata.yaml (renamed from src/go/collectors/go.d.plugin/modules/docker_engine/metadata.yaml) | 0 | ||||
| -rw-r--r-- | src/go/plugin/go.d/modules/docker_engine/metrics.go (renamed from src/go/collectors/go.d.plugin/modules/docker_engine/metrics.go) | 0 | ||||
| -rw-r--r-- | src/go/plugin/go.d/modules/docker_engine/testdata/config.json (renamed from src/go/collectors/go.d.plugin/modules/docker_engine/testdata/config.json) | 0 | ||||
| -rw-r--r-- | src/go/plugin/go.d/modules/docker_engine/testdata/config.yaml (renamed from src/go/collectors/go.d.plugin/modules/docker_engine/testdata/config.yaml) | 0 | ||||
| -rw-r--r-- | src/go/plugin/go.d/modules/docker_engine/testdata/non-docker-engine.txt (renamed from src/go/collectors/go.d.plugin/modules/docker_engine/testdata/non-docker-engine.txt) | 0 | ||||
| -rw-r--r-- | src/go/plugin/go.d/modules/docker_engine/testdata/v17.05.0-ce.txt (renamed from src/go/collectors/go.d.plugin/modules/docker_engine/testdata/v17.05.0-ce.txt) | 0 | ||||
| -rw-r--r-- | src/go/plugin/go.d/modules/docker_engine/testdata/v18.09.3-ce-swarm.txt (renamed from src/go/collectors/go.d.plugin/modules/docker_engine/testdata/v18.09.3-ce-swarm.txt) | 0 | ||||
| -rw-r--r-- | src/go/plugin/go.d/modules/docker_engine/testdata/v18.09.3-ce.txt (renamed from src/go/collectors/go.d.plugin/modules/docker_engine/testdata/v18.09.3-ce.txt) | 0 | ||||
| l--------- | src/go/plugin/go.d/modules/dockerhub/README.md (renamed from src/go/collectors/go.d.plugin/modules/dockerhub/README.md) | 0 | ||||
| -rw-r--r-- | src/go/plugin/go.d/modules/dockerhub/apiclient.go (renamed from src/go/collectors/go.d.plugin/modules/dockerhub/apiclient.go) | 2 | ||||
| -rw-r--r-- | src/go/plugin/go.d/modules/dockerhub/charts.go (renamed from src/go/collectors/go.d.plugin/modules/dockerhub/charts.go) | 2 | ||||
| -rw-r--r-- | src/go/plugin/go.d/modules/dockerhub/collect.go (renamed from src/go/collectors/go.d.plugin/modules/dockerhub/collect.go) | 0 | ||||
| -rw-r--r-- | src/go/plugin/go.d/modules/dockerhub/config_schema.json (renamed from src/go/collectors/go.d.plugin/modules/dockerhub/config_schema.json) | 6 | ||||
| -rw-r--r-- | src/go/plugin/go.d/modules/dockerhub/dockerhub.go (renamed from src/go/collectors/go.d.plugin/modules/dockerhub/dockerhub.go) | 4 | ||||
| -rw-r--r-- | src/go/plugin/go.d/modules/dockerhub/dockerhub_test.go (renamed from src/go/collectors/go.d.plugin/modules/dockerhub/dockerhub_test.go) | 2 | ||||
| -rw-r--r-- | src/go/plugin/go.d/modules/dockerhub/init.go (renamed from src/go/collectors/go.d.plugin/modules/dockerhub/init.go) | 2 | ||||
| -rw-r--r-- | src/go/plugin/go.d/modules/dockerhub/integrations/docker_hub_repository.md (renamed from src/go/collectors/go.d.plugin/modules/dockerhub/integrations/docker_hub_repository.md) | 39 | ||||
| -rw-r--r-- | src/go/plugin/go.d/modules/dockerhub/metadata.yaml (renamed from src/go/collectors/go.d.plugin/modules/dockerhub/metadata.yaml) | 0 | ||||
| -rw-r--r-- | src/go/plugin/go.d/modules/dockerhub/testdata/config.json (renamed from src/go/collectors/go.d.plugin/modules/dockerhub/testdata/config.json) | 0 | ||||
| -rw-r--r-- | src/go/plugin/go.d/modules/dockerhub/testdata/config.yaml (renamed from src/go/collectors/go.d.plugin/modules/dockerhub/testdata/config.yaml) | 0 | ||||
| -rw-r--r-- | src/go/plugin/go.d/modules/dockerhub/testdata/repo1.txt (renamed from src/go/collectors/go.d.plugin/modules/dockerhub/testdata/repo1.txt) | 0 | ||||
| -rw-r--r-- | src/go/plugin/go.d/modules/dockerhub/testdata/repo2.txt (renamed from src/go/collectors/go.d.plugin/modules/dockerhub/testdata/repo2.txt) | 0 | ||||
| -rw-r--r-- | src/go/plugin/go.d/modules/dockerhub/testdata/repo3.txt (renamed from src/go/collectors/go.d.plugin/modules/dockerhub/testdata/repo3.txt) | 0 | ||||
| l--------- | src/go/plugin/go.d/modules/dovecot/README.md (renamed from src/collectors/python.d.plugin/dovecot/README.md) | 0 | ||||
| -rw-r--r-- | src/go/plugin/go.d/modules/dovecot/charts.go | 185 | ||||
| -rw-r--r-- | src/go/plugin/go.d/modules/dovecot/client.go | 54 | ||||
| -rw-r--r-- | src/go/plugin/go.d/modules/dovecot/collect.go | 89 | ||||
| -rw-r--r-- | src/go/plugin/go.d/modules/dovecot/config_schema.json | 47 | ||||
| -rw-r--r-- | src/go/plugin/go.d/modules/dovecot/dovecot.go | 101 | ||||
| -rw-r--r-- | src/go/plugin/go.d/modules/dovecot/dovecot_test.go | 281 | ||||
| -rw-r--r-- | src/go/plugin/go.d/modules/dovecot/integrations/dovecot.md | 244 | ||||
| -rw-r--r-- | src/go/plugin/go.d/modules/dovecot/metadata.yaml | 194 | ||||
| -rw-r--r-- | src/go/plugin/go.d/modules/dovecot/testdata/config.json (renamed from src/go/collectors/go.d.plugin/modules/hddtemp/testdata/config.json) | 0 | ||||
| -rw-r--r-- | src/go/plugin/go.d/modules/dovecot/testdata/config.yaml (renamed from src/go/collectors/go.d.plugin/modules/hddtemp/testdata/config.yaml) | 0 | ||||
| -rw-r--r-- | src/go/plugin/go.d/modules/dovecot/testdata/export_global.txt | 2 | ||||
| l--------- | src/go/plugin/go.d/modules/elasticsearch/README.md (renamed from src/go/collectors/go.d.plugin/modules/elasticsearch/README.md) | 0 | ||||
| -rw-r--r-- | src/go/plugin/go.d/modules/elasticsearch/charts.go (renamed from src/go/collectors/go.d.plugin/modules/elasticsearch/charts.go) | 2 | ||||
| -rw-r--r-- | src/go/plugin/go.d/modules/elasticsearch/collect.go (renamed from src/go/collectors/go.d.plugin/modules/elasticsearch/collect.go) | 21 | ||||
| -rw-r--r-- | src/go/plugin/go.d/modules/elasticsearch/config_schema.json (renamed from src/go/collectors/go.d.plugin/modules/elasticsearch/config_schema.json) | 6 | ||||
| -rw-r--r-- | src/go/plugin/go.d/modules/elasticsearch/elasticsearch.go (renamed from src/go/collectors/go.d.plugin/modules/elasticsearch/elasticsearch.go) | 4 | ||||
| -rw-r--r-- | src/go/plugin/go.d/modules/elasticsearch/elasticsearch_test.go (renamed from src/go/collectors/go.d.plugin/modules/elasticsearch/elasticsearch_test.go) | 6 | ||||
| -rw-r--r-- | src/go/plugin/go.d/modules/elasticsearch/init.go (renamed from src/go/collectors/go.d.plugin/modules/elasticsearch/init.go) | 2 | ||||
| -rw-r--r-- | src/go/plugin/go.d/modules/elasticsearch/integrations/elasticsearch.md (renamed from src/go/collectors/go.d.plugin/modules/elasticsearch/integrations/elasticsearch.md) | 39 | ||||
| -rw-r--r-- | src/go/plugin/go.d/modules/elasticsearch/integrations/opensearch.md (renamed from src/go/collectors/go.d.plugin/modules/elasticsearch/integrations/opensearch.md) | 39 | ||||
| -rw-r--r-- | src/go/plugin/go.d/modules/elasticsearch/metadata.yaml (renamed from src/go/collectors/go.d.plugin/modules/elasticsearch/metadata.yaml) | 0 | ||||
| -rw-r--r-- | src/go/plugin/go.d/modules/elasticsearch/metrics.go (renamed from src/go/collectors/go.d.plugin/modules/elasticsearch/metrics.go) | 0 | ||||
| -rw-r--r-- | src/go/plugin/go.d/modules/elasticsearch/testdata/config.json (renamed from src/go/collectors/go.d.plugin/modules/elasticsearch/testdata/config.json) | 0 | ||||
| -rw-r--r-- | src/go/plugin/go.d/modules/elasticsearch/testdata/config.yaml (renamed from src/go/collectors/go.d.plugin/modules/elasticsearch/testdata/config.yaml) | 0 | ||||
| -rw-r--r-- | src/go/plugin/go.d/modules/elasticsearch/testdata/v8.4.2/cat_indices_stats.json (renamed from src/go/collectors/go.d.plugin/modules/elasticsearch/testdata/v8.4.2/cat_indices_stats.json) | 0 | ||||
| -rw-r--r-- | src/go/plugin/go.d/modules/elasticsearch/testdata/v8.4.2/cluster_health.json (renamed from src/go/collectors/go.d.plugin/modules/elasticsearch/testdata/v8.4.2/cluster_health.json) | 0 | ||||
| -rw-r--r-- | src/go/plugin/go.d/modules/elasticsearch/testdata/v8.4.2/cluster_stats.json (renamed from src/go/collectors/go.d.plugin/modules/elasticsearch/testdata/v8.4.2/cluster_stats.json) | 0 | ||||
| -rw-r--r-- | src/go/plugin/go.d/modules/elasticsearch/testdata/v8.4.2/info.json (renamed from src/go/collectors/go.d.plugin/modules/elasticsearch/testdata/v8.4.2/info.json) | 0 | ||||
| -rw-r--r-- | src/go/plugin/go.d/modules/elasticsearch/testdata/v8.4.2/nodes_local_stats.json (renamed from src/go/collectors/go.d.plugin/modules/elasticsearch/testdata/v8.4.2/nodes_local_stats.json) | 0 | ||||
| -rw-r--r-- | src/go/plugin/go.d/modules/elasticsearch/testdata/v8.4.2/nodes_stats.json (renamed from src/go/collectors/go.d.plugin/modules/elasticsearch/testdata/v8.4.2/nodes_stats.json) | 0 | ||||
| l--------- | src/go/plugin/go.d/modules/envoy/README.md (renamed from src/go/collectors/go.d.plugin/modules/envoy/README.md) | 0 | ||||
| -rw-r--r-- | src/go/plugin/go.d/modules/envoy/charts.go (renamed from src/go/collectors/go.d.plugin/modules/envoy/charts.go) | 2 | ||||
| -rw-r--r-- | src/go/plugin/go.d/modules/envoy/collect.go (renamed from src/go/collectors/go.d.plugin/modules/envoy/collect.go) | 2 | ||||
| -rw-r--r-- | src/go/plugin/go.d/modules/envoy/config_schema.json (renamed from src/go/collectors/go.d.plugin/modules/envoy/config_schema.json) | 6 | ||||
| -rw-r--r-- | src/go/plugin/go.d/modules/envoy/envoy.go (renamed from src/go/collectors/go.d.plugin/modules/envoy/envoy.go) | 6 | ||||
| -rw-r--r-- | src/go/plugin/go.d/modules/envoy/envoy_test.go (renamed from src/go/collectors/go.d.plugin/modules/envoy/envoy_test.go) | 4 | ||||
| -rw-r--r-- | src/go/plugin/go.d/modules/envoy/init.go (renamed from src/go/collectors/go.d.plugin/modules/envoy/init.go) | 4 | ||||
| -rw-r--r-- | src/go/plugin/go.d/modules/envoy/integrations/envoy.md (renamed from src/go/collectors/go.d.plugin/modules/envoy/integrations/envoy.md) | 39 | ||||
| -rw-r--r-- | src/go/plugin/go.d/modules/envoy/metadata.yaml (renamed from src/go/collectors/go.d.plugin/modules/envoy/metadata.yaml) | 0 | ||||
| -rw-r--r-- | src/go/plugin/go.d/modules/envoy/testdata/config.json (renamed from src/go/collectors/go.d.plugin/modules/envoy/testdata/config.json) | 0 | ||||
| -rw-r--r-- | src/go/plugin/go.d/modules/envoy/testdata/config.yaml (renamed from src/go/collectors/go.d.plugin/modules/envoy/testdata/config.yaml) | 0 | ||||
| -rw-r--r-- | src/go/plugin/go.d/modules/envoy/testdata/consul-dataplane.txt (renamed from src/go/collectors/go.d.plugin/modules/envoy/testdata/consul-dataplane.txt) | 0 | ||||
| -rw-r--r-- | src/go/plugin/go.d/modules/envoy/testdata/envoy.txt (renamed from src/go/collectors/go.d.plugin/modules/envoy/testdata/envoy.txt) | 0 | ||||
| -rw-r--r-- | src/go/plugin/go.d/modules/example/README.md (renamed from src/go/collectors/go.d.plugin/modules/example/README.md) | 4 | ||||
| -rw-r--r-- | src/go/plugin/go.d/modules/example/charts.go (renamed from src/go/collectors/go.d.plugin/modules/example/charts.go) | 2 | ||||
| -rw-r--r-- | src/go/plugin/go.d/modules/example/collect.go (renamed from src/go/collectors/go.d.plugin/modules/example/collect.go) | 2 | ||||
| -rw-r--r-- | src/go/plugin/go.d/modules/example/config_schema.json (renamed from src/go/collectors/go.d.plugin/modules/example/config_schema.json) | 0 | ||||
| -rw-r--r-- | src/go/plugin/go.d/modules/example/example.go (renamed from src/go/collectors/go.d.plugin/modules/example/example.go) | 2 | ||||
| -rw-r--r-- | src/go/plugin/go.d/modules/example/example_test.go (renamed from src/go/collectors/go.d.plugin/modules/example/example_test.go) | 2 | ||||
| -rw-r--r-- | src/go/plugin/go.d/modules/example/init.go (renamed from src/go/collectors/go.d.plugin/modules/example/init.go) | 2 | ||||
| -rw-r--r-- | src/go/plugin/go.d/modules/example/testdata/config.json (renamed from src/go/collectors/go.d.plugin/modules/example/testdata/config.json) | 0 | ||||
| -rw-r--r-- | src/go/plugin/go.d/modules/example/testdata/config.yaml (renamed from src/go/collectors/go.d.plugin/modules/example/testdata/config.yaml) | 0 | ||||
| l--------- | src/go/plugin/go.d/modules/exim/README.md (renamed from src/collectors/python.d.plugin/exim/README.md) | 0 | ||||
| -rw-r--r-- | src/go/plugin/go.d/modules/exim/charts.go | 27 | ||||
| -rw-r--r-- | src/go/plugin/go.d/modules/exim/collect.go | 43 | ||||
| -rw-r--r-- | src/go/plugin/go.d/modules/exim/config_schema.json | 35 | ||||
| -rw-r--r-- | src/go/plugin/go.d/modules/exim/exec.go | 47 | ||||
| -rw-r--r-- | src/go/plugin/go.d/modules/exim/exim.go | 97 | ||||
| -rw-r--r-- | src/go/plugin/go.d/modules/exim/exim_test.go | 217 | ||||
| -rw-r--r-- | src/go/plugin/go.d/modules/exim/init.go | 23 | ||||
| -rw-r--r-- | src/go/plugin/go.d/modules/exim/integrations/exim.md | 191 | ||||
| -rw-r--r-- | src/go/plugin/go.d/modules/exim/metadata.yaml | 100 | ||||
| -rw-r--r-- | src/go/plugin/go.d/modules/exim/testdata/config.json (renamed from src/go/collectors/go.d.plugin/modules/fail2ban/testdata/config.json) | 0 | ||||
| -rw-r--r-- | src/go/plugin/go.d/modules/exim/testdata/config.yaml (renamed from src/go/collectors/go.d.plugin/modules/fail2ban/testdata/config.yaml) | 0 | ||||
| l--------- | src/go/plugin/go.d/modules/fail2ban/README.md (renamed from src/go/collectors/go.d.plugin/modules/fail2ban/README.md) | 0 | ||||
| -rw-r--r-- | src/go/plugin/go.d/modules/fail2ban/charts.go (renamed from src/go/collectors/go.d.plugin/modules/fail2ban/charts.go) | 2 | ||||
| -rw-r--r-- | src/go/plugin/go.d/modules/fail2ban/collect.go (renamed from src/go/collectors/go.d.plugin/modules/fail2ban/collect.go) | 0 | ||||
| -rw-r--r-- | src/go/plugin/go.d/modules/fail2ban/config_schema.json (renamed from src/go/collectors/go.d.plugin/modules/fail2ban/config_schema.json) | 0 | ||||
| -rw-r--r-- | src/go/plugin/go.d/modules/fail2ban/exec.go (renamed from src/go/collectors/go.d.plugin/modules/fail2ban/exec.go) | 34 | ||||
| -rw-r--r-- | src/go/plugin/go.d/modules/fail2ban/fail2ban.go (renamed from src/go/collectors/go.d.plugin/modules/fail2ban/fail2ban.go) | 4 | ||||
| -rw-r--r-- | src/go/plugin/go.d/modules/fail2ban/fail2ban_test.go (renamed from src/go/collectors/go.d.plugin/modules/fail2ban/fail2ban_test.go) | 2 | ||||
| -rw-r--r-- | src/go/plugin/go.d/modules/fail2ban/init.go (renamed from src/go/collectors/go.d.plugin/modules/fail2ban/init.go) | 2 | ||||
| -rw-r--r-- | src/go/plugin/go.d/modules/fail2ban/integrations/fail2ban.md (renamed from src/go/collectors/go.d.plugin/modules/fail2ban/integrations/fail2ban.md) | 51 | ||||
| -rw-r--r-- | src/go/plugin/go.d/modules/fail2ban/metadata.yaml (renamed from src/go/collectors/go.d.plugin/modules/fail2ban/metadata.yaml) | 11 | ||||
| -rw-r--r-- | src/go/plugin/go.d/modules/fail2ban/testdata/config.json (renamed from src/go/collectors/go.d.plugin/modules/hpssa/testdata/config.json) | 0 | ||||
| -rw-r--r-- | src/go/plugin/go.d/modules/fail2ban/testdata/config.yaml (renamed from src/go/collectors/go.d.plugin/modules/hpssa/testdata/config.yaml) | 0 | ||||
| -rw-r--r-- | src/go/plugin/go.d/modules/fail2ban/testdata/fail2ban-jail-status.txt (renamed from src/go/collectors/go.d.plugin/modules/fail2ban/testdata/fail2ban-jail-status.txt) | 0 | ||||
| -rw-r--r-- | src/go/plugin/go.d/modules/fail2ban/testdata/fail2ban-status.txt (renamed from src/go/collectors/go.d.plugin/modules/fail2ban/testdata/fail2ban-status.txt) | 0 | ||||
| l--------- | src/go/plugin/go.d/modules/filecheck/README.md (renamed from src/go/collectors/go.d.plugin/modules/filecheck/README.md) | 0 | ||||
| -rw-r--r-- | src/go/plugin/go.d/modules/filecheck/cache.go (renamed from src/go/collectors/go.d.plugin/modules/filecheck/cache.go) | 0 | ||||
| -rw-r--r-- | src/go/plugin/go.d/modules/filecheck/charts.go (renamed from src/go/collectors/go.d.plugin/modules/filecheck/charts.go) | 2 | ||||
| -rw-r--r-- | src/go/plugin/go.d/modules/filecheck/collect.go (renamed from src/go/collectors/go.d.plugin/modules/filecheck/collect.go) | 0 | ||||
| -rw-r--r-- | src/go/plugin/go.d/modules/filecheck/collect_dirs.go (renamed from src/go/collectors/go.d.plugin/modules/filecheck/collect_dirs.go) | 0 | ||||
| -rw-r--r-- | src/go/plugin/go.d/modules/filecheck/collect_files.go (renamed from src/go/collectors/go.d.plugin/modules/filecheck/collect_files.go) | 0 | ||||
| -rw-r--r-- | src/go/plugin/go.d/modules/filecheck/config_schema.json (renamed from src/go/collectors/go.d.plugin/modules/filecheck/config_schema.json) | 0 | ||||
| -rw-r--r-- | src/go/plugin/go.d/modules/filecheck/discover.go (renamed from src/go/collectors/go.d.plugin/modules/filecheck/discover.go) | 0 | ||||
| -rw-r--r-- | src/go/plugin/go.d/modules/filecheck/filecheck.go (renamed from src/go/collectors/go.d.plugin/modules/filecheck/filecheck.go) | 6 | ||||
| -rw-r--r-- | src/go/plugin/go.d/modules/filecheck/filecheck_test.go (renamed from src/go/collectors/go.d.plugin/modules/filecheck/filecheck_test.go) | 2 | ||||
| -rw-r--r-- | src/go/plugin/go.d/modules/filecheck/init.go (renamed from src/go/collectors/go.d.plugin/modules/filecheck/init.go) | 2 | ||||
| -rw-r--r-- | src/go/plugin/go.d/modules/filecheck/integrations/files_and_directories.md (renamed from src/go/collectors/go.d.plugin/modules/filecheck/integrations/files_and_directories.md) | 39 | ||||
| -rw-r--r-- | src/go/plugin/go.d/modules/filecheck/metadata.yaml (renamed from src/go/collectors/go.d.plugin/modules/filecheck/metadata.yaml) | 0 | ||||
| -rw-r--r-- | src/go/plugin/go.d/modules/filecheck/testdata/config.json (renamed from src/go/collectors/go.d.plugin/modules/filecheck/testdata/config.json) | 0 | ||||
| -rw-r--r-- | src/go/plugin/go.d/modules/filecheck/testdata/config.yaml (renamed from src/go/collectors/go.d.plugin/modules/filecheck/testdata/config.yaml) | 0 | ||||
| -rw-r--r-- | src/go/plugin/go.d/modules/filecheck/testdata/dir/empty_file.log (renamed from src/go/collectors/go.d.plugin/modules/filecheck/testdata/dir/empty_file.log) | 0 | ||||
| -rw-r--r-- | src/go/plugin/go.d/modules/filecheck/testdata/dir/file.log (renamed from src/go/collectors/go.d.plugin/modules/filecheck/testdata/dir/file.log) | 0 | ||||
| -rw-r--r-- | src/go/plugin/go.d/modules/filecheck/testdata/dir/subdir/empty_file.log (renamed from src/go/collectors/go.d.plugin/modules/filecheck/testdata/dir/subdir/empty_file.log) | 0 | ||||
| -rw-r--r-- | src/go/plugin/go.d/modules/filecheck/testdata/empty_file.log (renamed from src/go/collectors/go.d.plugin/modules/filecheck/testdata/empty_file.log) | 0 | ||||
| -rw-r--r-- | src/go/plugin/go.d/modules/filecheck/testdata/file.log (renamed from src/go/collectors/go.d.plugin/modules/filecheck/testdata/file.log) | 0 | ||||
| l--------- | src/go/plugin/go.d/modules/fluentd/README.md (renamed from src/go/collectors/go.d.plugin/modules/fluentd/README.md) | 0 | ||||
| -rw-r--r-- | src/go/plugin/go.d/modules/fluentd/apiclient.go (renamed from src/go/collectors/go.d.plugin/modules/fluentd/apiclient.go) | 2 | ||||
| -rw-r--r-- | src/go/plugin/go.d/modules/fluentd/charts.go (renamed from src/go/collectors/go.d.plugin/modules/fluentd/charts.go) | 2 | ||||
| -rw-r--r-- | src/go/plugin/go.d/modules/fluentd/collect.go (renamed from src/go/collectors/go.d.plugin/modules/fluentd/collect.go) | 0 | ||||
| -rw-r--r-- | src/go/plugin/go.d/modules/fluentd/config_schema.json (renamed from src/go/collectors/go.d.plugin/modules/fluentd/config_schema.json) | 6 | ||||
| -rw-r--r-- | src/go/plugin/go.d/modules/fluentd/fluentd.go (renamed from src/go/collectors/go.d.plugin/modules/fluentd/fluentd.go) | 6 | ||||
| -rw-r--r-- | src/go/plugin/go.d/modules/fluentd/fluentd_test.go (renamed from src/go/collectors/go.d.plugin/modules/fluentd/fluentd_test.go) | 2 | ||||
| -rw-r--r-- | src/go/plugin/go.d/modules/fluentd/init.go (renamed from src/go/collectors/go.d.plugin/modules/fluentd/init.go) | 4 | ||||
| -rw-r--r-- | src/go/plugin/go.d/modules/fluentd/integrations/fluentd.md (renamed from src/go/collectors/go.d.plugin/modules/fluentd/integrations/fluentd.md) | 39 | ||||
| -rw-r--r-- | src/go/plugin/go.d/modules/fluentd/metadata.yaml (renamed from src/go/collectors/go.d.plugin/modules/fluentd/metadata.yaml) | 0 | ||||
| -rw-r--r-- | src/go/plugin/go.d/modules/fluentd/testdata/config.json (renamed from src/go/collectors/go.d.plugin/modules/fluentd/testdata/config.json) | 0 | ||||
| -rw-r--r-- | src/go/plugin/go.d/modules/fluentd/testdata/config.yaml (renamed from src/go/collectors/go.d.plugin/modules/fluentd/testdata/config.yaml) | 0 | ||||
| -rw-r--r-- | src/go/plugin/go.d/modules/fluentd/testdata/plugins.json (renamed from src/go/collectors/go.d.plugin/modules/fluentd/testdata/plugins.json) | 0 | ||||
| l--------- | src/go/plugin/go.d/modules/freeradius/README.md (renamed from src/go/collectors/go.d.plugin/modules/freeradius/README.md) | 0 | ||||
| -rw-r--r-- | src/go/plugin/go.d/modules/freeradius/api/client.go (renamed from src/go/collectors/go.d.plugin/modules/freeradius/api/client.go) | 0 | ||||
| -rw-r--r-- | src/go/plugin/go.d/modules/freeradius/api/client_test.go (renamed from src/go/collectors/go.d.plugin/modules/freeradius/api/client_test.go) | 0 | ||||
| -rw-r--r-- | src/go/plugin/go.d/modules/freeradius/api/dictionary.go (renamed from src/go/collectors/go.d.plugin/modules/freeradius/api/dictionary.go) | 0 | ||||
| -rw-r--r-- | src/go/plugin/go.d/modules/freeradius/charts.go (renamed from src/go/collectors/go.d.plugin/modules/freeradius/charts.go) | 2 | ||||
| -rw-r--r-- | src/go/plugin/go.d/modules/freeradius/collect.go (renamed from src/go/collectors/go.d.plugin/modules/freeradius/collect.go) | 2 | ||||
| -rw-r--r-- | src/go/plugin/go.d/modules/freeradius/config_schema.json (renamed from src/go/collectors/go.d.plugin/modules/freeradius/config_schema.json) | 0 | ||||
| -rw-r--r-- | src/go/plugin/go.d/modules/freeradius/freeradius.go (renamed from src/go/collectors/go.d.plugin/modules/freeradius/freeradius.go) | 6 | ||||
| -rw-r--r-- | src/go/plugin/go.d/modules/freeradius/freeradius_test.go (renamed from src/go/collectors/go.d.plugin/modules/freeradius/freeradius_test.go) | 4 | ||||
| -rw-r--r-- | src/go/plugin/go.d/modules/freeradius/init.go (renamed from src/go/collectors/go.d.plugin/modules/freeradius/init.go) | 0 | ||||
| -rw-r--r-- | src/go/plugin/go.d/modules/freeradius/integrations/freeradius.md (renamed from src/go/collectors/go.d.plugin/modules/freeradius/integrations/freeradius.md) | 39 | ||||
| -rw-r--r-- | src/go/plugin/go.d/modules/freeradius/metadata.yaml (renamed from src/go/collectors/go.d.plugin/modules/freeradius/metadata.yaml) | 0 | ||||
| -rw-r--r-- | src/go/plugin/go.d/modules/freeradius/testdata/config.json (renamed from src/go/collectors/go.d.plugin/modules/freeradius/testdata/config.json) | 0 | ||||
| -rw-r--r-- | src/go/plugin/go.d/modules/freeradius/testdata/config.yaml (renamed from src/go/collectors/go.d.plugin/modules/freeradius/testdata/config.yaml) | 0 | ||||
| l--------- | src/go/plugin/go.d/modules/gearman/README.md (renamed from src/collectors/python.d.plugin/gearman/README.md) | 0 | ||||
| -rw-r--r-- | src/go/plugin/go.d/modules/gearman/charts.go | 158 | ||||
| -rw-r--r-- | src/go/plugin/go.d/modules/gearman/client.go | 80 | ||||
| -rw-r--r-- | src/go/plugin/go.d/modules/gearman/collect.go | 221 | ||||
| -rw-r--r-- | src/go/plugin/go.d/modules/gearman/config_schema.json | 44 | ||||
| -rw-r--r-- | src/go/plugin/go.d/modules/gearman/gearman.go | 106 | ||||
| -rw-r--r-- | src/go/plugin/go.d/modules/gearman/gearman_test.go | 326 | ||||
| -rw-r--r-- | src/go/plugin/go.d/modules/gearman/integrations/gearman.md | 235 | ||||
| -rw-r--r-- | src/go/plugin/go.d/modules/gearman/metadata.yaml | 152 | ||||
| -rw-r--r-- | src/go/plugin/go.d/modules/gearman/testdata/config.json | 5 | ||||
| -rw-r--r-- | src/go/plugin/go.d/modules/gearman/testdata/config.yaml | 3 | ||||
| -rw-r--r-- | src/go/plugin/go.d/modules/gearman/testdata/priority-status.txt | 5 | ||||
| -rw-r--r-- | src/go/plugin/go.d/modules/gearman/testdata/status.txt | 5 | ||||
| l--------- | src/go/plugin/go.d/modules/geth/README.md (renamed from src/go/collectors/go.d.plugin/modules/geth/README.md) | 0 | ||||
| -rw-r--r-- | src/go/plugin/go.d/modules/geth/charts.go (renamed from src/go/collectors/go.d.plugin/modules/geth/charts.go) | 2 | ||||
| -rw-r--r-- | src/go/plugin/go.d/modules/geth/collect.go (renamed from src/go/collectors/go.d.plugin/modules/geth/collect.go) | 4 | ||||
| -rw-r--r-- | src/go/plugin/go.d/modules/geth/config_schema.json (renamed from src/go/collectors/go.d.plugin/modules/geth/config_schema.json) | 6 | ||||
| -rw-r--r-- | src/go/plugin/go.d/modules/geth/geth.go (renamed from src/go/collectors/go.d.plugin/modules/geth/geth.go) | 6 | ||||
| -rw-r--r-- | src/go/plugin/go.d/modules/geth/geth_test.go (renamed from src/go/collectors/go.d.plugin/modules/geth/geth_test.go) | 2 | ||||
| -rw-r--r-- | src/go/plugin/go.d/modules/geth/init.go (renamed from src/go/collectors/go.d.plugin/modules/geth/init.go) | 4 | ||||
| -rw-r--r-- | src/go/plugin/go.d/modules/geth/integrations/go-ethereum.md (renamed from src/go/collectors/go.d.plugin/modules/geth/integrations/go-ethereum.md) | 39 | ||||
| -rw-r--r-- | src/go/plugin/go.d/modules/geth/metadata.yaml (renamed from src/go/collectors/go.d.plugin/modules/geth/metadata.yaml) | 0 | ||||
| -rw-r--r-- | src/go/plugin/go.d/modules/geth/metrics.go (renamed from src/go/collectors/go.d.plugin/modules/geth/metrics.go) | 0 | ||||
| -rw-r--r-- | src/go/plugin/go.d/modules/geth/testdata/config.json (renamed from src/go/collectors/go.d.plugin/modules/geth/testdata/config.json) | 0 | ||||
| -rw-r--r-- | src/go/plugin/go.d/modules/geth/testdata/config.yaml (renamed from src/go/collectors/go.d.plugin/modules/geth/testdata/config.yaml) | 0 | ||||
| -rw-r--r-- | src/go/plugin/go.d/modules/geth/testdata/metrics_geth.txt (renamed from src/go/collectors/go.d.plugin/modules/geth/testdata/metrics_geth.txt) | 0 | ||||
| l--------- | src/go/plugin/go.d/modules/haproxy/README.md (renamed from src/go/collectors/go.d.plugin/modules/haproxy/README.md) | 0 | ||||
| -rw-r--r-- | src/go/plugin/go.d/modules/haproxy/charts.go (renamed from src/go/collectors/go.d.plugin/modules/haproxy/charts.go) | 2 | ||||
| -rw-r--r-- | src/go/plugin/go.d/modules/haproxy/collect.go (renamed from src/go/collectors/go.d.plugin/modules/haproxy/collect.go) | 4 | ||||
| -rw-r--r-- | src/go/plugin/go.d/modules/haproxy/config_schema.json (renamed from src/go/collectors/go.d.plugin/modules/haproxy/config_schema.json) | 6 | ||||
| -rw-r--r-- | src/go/plugin/go.d/modules/haproxy/haproxy.go (renamed from src/go/collectors/go.d.plugin/modules/haproxy/haproxy.go) | 6 | ||||
| -rw-r--r-- | src/go/plugin/go.d/modules/haproxy/haproxy_test.go (renamed from src/go/collectors/go.d.plugin/modules/haproxy/haproxy_test.go) | 6 | ||||
| -rw-r--r-- | src/go/plugin/go.d/modules/haproxy/init.go (renamed from src/go/collectors/go.d.plugin/modules/haproxy/init.go) | 6 | ||||
| -rw-r--r-- | src/go/plugin/go.d/modules/haproxy/integrations/haproxy.md (renamed from src/go/collectors/go.d.plugin/modules/haproxy/integrations/haproxy.md) | 39 | ||||
| -rw-r--r-- | src/go/plugin/go.d/modules/haproxy/metadata.yaml (renamed from src/go/collectors/go.d.plugin/modules/haproxy/metadata.yaml) | 0 | ||||
| -rw-r--r-- | src/go/plugin/go.d/modules/haproxy/testdata/config.json (renamed from src/go/collectors/go.d.plugin/modules/haproxy/testdata/config.json) | 0 | ||||
| -rw-r--r-- | src/go/plugin/go.d/modules/haproxy/testdata/config.yaml (renamed from src/go/collectors/go.d.plugin/modules/haproxy/testdata/config.yaml) | 0 | ||||
| -rw-r--r-- | src/go/plugin/go.d/modules/haproxy/testdata/v2.3.10/metrics.txt (renamed from src/go/collectors/go.d.plugin/modules/haproxy/testdata/v2.3.10/metrics.txt) | 0 | ||||
| l--------- | src/go/plugin/go.d/modules/hddtemp/README.md (renamed from src/go/collectors/go.d.plugin/modules/hddtemp/README.md) | 0 | ||||
| -rw-r--r-- | src/go/plugin/go.d/modules/hddtemp/charts.go (renamed from src/go/collectors/go.d.plugin/modules/hddtemp/charts.go) | 2 | ||||
| -rw-r--r-- | src/go/plugin/go.d/modules/hddtemp/client.go (renamed from src/go/collectors/go.d.plugin/modules/hddtemp/client.go) | 2 | ||||
| -rw-r--r-- | src/go/plugin/go.d/modules/hddtemp/collect.go (renamed from src/go/collectors/go.d.plugin/modules/hddtemp/collect.go) | 0 | ||||
| -rw-r--r-- | src/go/plugin/go.d/modules/hddtemp/config_schema.json (renamed from src/go/collectors/go.d.plugin/modules/hddtemp/config_schema.json) | 0 | ||||
| -rw-r--r-- | src/go/plugin/go.d/modules/hddtemp/hddtemp.go (renamed from src/go/collectors/go.d.plugin/modules/hddtemp/hddtemp.go) | 4 | ||||
| -rw-r--r-- | src/go/plugin/go.d/modules/hddtemp/hddtemp_test.go (renamed from src/go/collectors/go.d.plugin/modules/hddtemp/hddtemp_test.go) | 2 | ||||
| -rw-r--r-- | src/go/plugin/go.d/modules/hddtemp/integrations/hdd_temperature.md (renamed from src/go/collectors/go.d.plugin/modules/hddtemp/integrations/hdd_temperature.md) | 39 | ||||
| -rw-r--r-- | src/go/plugin/go.d/modules/hddtemp/metadata.yaml (renamed from src/go/collectors/go.d.plugin/modules/hddtemp/metadata.yaml) | 0 | ||||
| -rw-r--r-- | src/go/plugin/go.d/modules/hddtemp/testdata/config.json | 5 | ||||
| -rw-r--r-- | src/go/plugin/go.d/modules/hddtemp/testdata/config.yaml | 3 | ||||
| -rw-r--r-- | src/go/plugin/go.d/modules/hddtemp/testdata/hddtemp-all-ok.txt (renamed from src/go/collectors/go.d.plugin/modules/hddtemp/testdata/hddtemp-all-ok.txt) | 0 | ||||
| -rw-r--r-- | src/go/plugin/go.d/modules/hddtemp/testdata/hddtemp-all-sleep.txt (renamed from src/go/collectors/go.d.plugin/modules/hddtemp/testdata/hddtemp-all-sleep.txt) | 0 | ||||
| l--------- | src/go/plugin/go.d/modules/hdfs/README.md (renamed from src/go/collectors/go.d.plugin/modules/hdfs/README.md) | 0 | ||||
| -rw-r--r-- | src/go/plugin/go.d/modules/hdfs/charts.go (renamed from src/go/collectors/go.d.plugin/modules/hdfs/charts.go) | 2 | ||||
| -rw-r--r-- | src/go/plugin/go.d/modules/hdfs/client.go (renamed from src/go/collectors/go.d.plugin/modules/hdfs/client.go) | 2 | ||||
| -rw-r--r-- | src/go/plugin/go.d/modules/hdfs/collect.go (renamed from src/go/collectors/go.d.plugin/modules/hdfs/collect.go) | 2 | ||||
| -rw-r--r-- | src/go/plugin/go.d/modules/hdfs/config_schema.json (renamed from src/go/collectors/go.d.plugin/modules/hdfs/config_schema.json) | 6 | ||||
| -rw-r--r-- | src/go/plugin/go.d/modules/hdfs/hdfs.go (renamed from src/go/collectors/go.d.plugin/modules/hdfs/hdfs.go) | 4 | ||||
| -rw-r--r-- | src/go/plugin/go.d/modules/hdfs/hdfs_test.go (renamed from src/go/collectors/go.d.plugin/modules/hdfs/hdfs_test.go) | 2 | ||||
| -rw-r--r-- | src/go/plugin/go.d/modules/hdfs/init.go (renamed from src/go/collectors/go.d.plugin/modules/hdfs/init.go) | 2 | ||||
| -rw-r--r-- | src/go/plugin/go.d/modules/hdfs/integrations/hadoop_distributed_file_system_hdfs.md (renamed from src/go/collectors/go.d.plugin/modules/hdfs/integrations/hadoop_distributed_file_system_hdfs.md) | 39 | ||||
| -rw-r--r-- | src/go/plugin/go.d/modules/hdfs/metadata.yaml (renamed from src/go/collectors/go.d.plugin/modules/hdfs/metadata.yaml) | 0 | ||||
| -rw-r--r-- | src/go/plugin/go.d/modules/hdfs/metrics.go (renamed from src/go/collectors/go.d.plugin/modules/hdfs/metrics.go) | 0 | ||||
| -rw-r--r-- | src/go/plugin/go.d/modules/hdfs/raw_data.go (renamed from src/go/collectors/go.d.plugin/modules/hdfs/raw_data.go) | 0 | ||||
| -rw-r--r-- | src/go/plugin/go.d/modules/hdfs/testdata/config.json (renamed from src/go/collectors/go.d.plugin/modules/hdfs/testdata/config.json) | 0 | ||||
| -rw-r--r-- | src/go/plugin/go.d/modules/hdfs/testdata/config.yaml (renamed from src/go/collectors/go.d.plugin/modules/hdfs/testdata/config.yaml) | 0 | ||||
| -rw-r--r-- | src/go/plugin/go.d/modules/hdfs/testdata/datanode.json (renamed from src/go/collectors/go.d.plugin/modules/hdfs/testdata/datanode.json) | 0 | ||||
| -rw-r--r-- | src/go/plugin/go.d/modules/hdfs/testdata/namenode.json (renamed from src/go/collectors/go.d.plugin/modules/hdfs/testdata/namenode.json) | 0 | ||||
| -rw-r--r-- | src/go/plugin/go.d/modules/hdfs/testdata/unknownnode.json (renamed from src/go/collectors/go.d.plugin/modules/hdfs/testdata/unknownnode.json) | 0 | ||||
| l--------- | src/go/plugin/go.d/modules/hpssa/README.md (renamed from src/go/collectors/go.d.plugin/modules/hpssa/README.md) | 0 | ||||
| -rw-r--r-- | src/go/plugin/go.d/modules/hpssa/charts.go (renamed from src/go/collectors/go.d.plugin/modules/hpssa/charts.go) | 2 | ||||
| -rw-r--r-- | src/go/plugin/go.d/modules/hpssa/collect.go (renamed from src/go/collectors/go.d.plugin/modules/hpssa/collect.go) | 0 | ||||
| -rw-r--r-- | src/go/plugin/go.d/modules/hpssa/config_schema.json (renamed from src/go/collectors/go.d.plugin/modules/hpssa/config_schema.json) | 0 | ||||
| -rw-r--r-- | src/go/plugin/go.d/modules/hpssa/exec.go (renamed from src/go/collectors/go.d.plugin/modules/hpssa/exec.go) | 2 | ||||
| -rw-r--r-- | src/go/plugin/go.d/modules/hpssa/hpssa.go (renamed from src/go/collectors/go.d.plugin/modules/hpssa/hpssa.go) | 4 | ||||
| -rw-r--r-- | src/go/plugin/go.d/modules/hpssa/hpssa_test.go (renamed from src/go/collectors/go.d.plugin/modules/hpssa/hpssa_test.go) | 2 | ||||
| -rw-r--r-- | src/go/plugin/go.d/modules/hpssa/init.go (renamed from src/go/collectors/go.d.plugin/modules/hpssa/init.go) | 2 | ||||
| -rw-r--r-- | src/go/plugin/go.d/modules/hpssa/integrations/hpe_smart_arrays.md (renamed from src/go/collectors/go.d.plugin/modules/hpssa/integrations/hpe_smart_arrays.md) | 39 | ||||
| -rw-r--r-- | src/go/plugin/go.d/modules/hpssa/metadata.yaml (renamed from src/go/collectors/go.d.plugin/modules/hpssa/metadata.yaml) | 0 | ||||
| -rw-r--r-- | src/go/plugin/go.d/modules/hpssa/parse.go (renamed from src/go/collectors/go.d.plugin/modules/hpssa/parse.go) | 0 | ||||
| -rw-r--r-- | src/go/plugin/go.d/modules/hpssa/testdata/config.json (renamed from src/go/collectors/go.d.plugin/modules/logind/testdata/config.json) | 0 | ||||
| -rw-r--r-- | src/go/plugin/go.d/modules/hpssa/testdata/config.yaml (renamed from src/go/collectors/go.d.plugin/modules/logind/testdata/config.yaml) | 0 | ||||
| -rw-r--r-- | src/go/plugin/go.d/modules/hpssa/testdata/ssacli-P212_P410i.txt (renamed from src/go/collectors/go.d.plugin/modules/hpssa/testdata/ssacli-P212_P410i.txt) | 0 | ||||
| -rw-r--r-- | src/go/plugin/go.d/modules/hpssa/testdata/ssacli-P400ar.txt (renamed from src/go/collectors/go.d.plugin/modules/hpssa/testdata/ssacli-P400ar.txt) | 0 | ||||
| -rw-r--r-- | src/go/plugin/go.d/modules/hpssa/testdata/ssacli-P400i-unassigned.txt (renamed from src/go/collectors/go.d.plugin/modules/hpssa/testdata/ssacli-P400i-unassigned.txt) | 0 | ||||
| l--------- | src/go/plugin/go.d/modules/httpcheck/README.md (renamed from src/go/collectors/go.d.plugin/modules/httpcheck/README.md) | 0 | ||||
| -rw-r--r-- | src/go/plugin/go.d/modules/httpcheck/charts.go (renamed from src/go/collectors/go.d.plugin/modules/httpcheck/charts.go) | 2 | ||||
| -rw-r--r-- | src/go/plugin/go.d/modules/httpcheck/collect.go (renamed from src/go/collectors/go.d.plugin/modules/httpcheck/collect.go) | 4 | ||||
| -rw-r--r-- | src/go/plugin/go.d/modules/httpcheck/config_schema.json (renamed from src/go/collectors/go.d.plugin/modules/httpcheck/config_schema.json) | 14 | ||||
| -rw-r--r-- | src/go/plugin/go.d/modules/httpcheck/cookiejar.go (renamed from src/go/collectors/go.d.plugin/modules/httpcheck/cookiejar.go) | 0 | ||||
| -rw-r--r-- | src/go/plugin/go.d/modules/httpcheck/httpcheck.go (renamed from src/go/collectors/go.d.plugin/modules/httpcheck/httpcheck.go) | 4 | ||||
| -rw-r--r-- | src/go/plugin/go.d/modules/httpcheck/httpcheck_test.go (renamed from src/go/collectors/go.d.plugin/modules/httpcheck/httpcheck_test.go) | 4 | ||||
| -rw-r--r-- | src/go/plugin/go.d/modules/httpcheck/init.go (renamed from src/go/collectors/go.d.plugin/modules/httpcheck/init.go) | 6 | ||||
| -rw-r--r-- | src/go/plugin/go.d/modules/httpcheck/integrations/http_endpoints.md (renamed from src/go/collectors/go.d.plugin/modules/httpcheck/integrations/http_endpoints.md) | 57 | ||||
| -rw-r--r-- | src/go/plugin/go.d/modules/httpcheck/metadata.yaml (renamed from src/go/collectors/go.d.plugin/modules/httpcheck/metadata.yaml) | 18 | ||||
| -rw-r--r-- | src/go/plugin/go.d/modules/httpcheck/metrics.go (renamed from src/go/collectors/go.d.plugin/modules/httpcheck/metrics.go) | 0 | ||||
| -rw-r--r-- | src/go/plugin/go.d/modules/httpcheck/testdata/config.json (renamed from src/go/collectors/go.d.plugin/modules/httpcheck/testdata/config.json) | 0 | ||||
| -rw-r--r-- | src/go/plugin/go.d/modules/httpcheck/testdata/config.yaml (renamed from src/go/collectors/go.d.plugin/modules/httpcheck/testdata/config.yaml) | 0 | ||||
| -rw-r--r-- | src/go/plugin/go.d/modules/httpcheck/testdata/cookie.txt (renamed from src/go/collectors/go.d.plugin/modules/httpcheck/testdata/cookie.txt) | 0 | ||||
| l--------- | src/go/plugin/go.d/modules/icecast/README.md (renamed from src/collectors/python.d.plugin/icecast/README.md) | 0 | ||||
| -rw-r--r-- | src/go/plugin/go.d/modules/icecast/charts.go | 65 | ||||
| -rw-r--r-- | src/go/plugin/go.d/modules/icecast/collect.go | 107 | ||||
| -rw-r--r-- | src/go/plugin/go.d/modules/icecast/config_schema.json | 177 | ||||
| -rw-r--r-- | src/go/plugin/go.d/modules/icecast/icecast.go | 118 | ||||
| -rw-r--r-- | src/go/plugin/go.d/modules/icecast/icecast_test.go | 285 | ||||
| -rw-r--r-- | src/go/plugin/go.d/modules/icecast/integrations/icecast.md | 226 | ||||
| -rw-r--r-- | src/go/plugin/go.d/modules/icecast/metadata.yaml | 169 | ||||
| -rw-r--r-- | src/go/plugin/go.d/modules/icecast/server_stats.go | 45 | ||||
| -rw-r--r-- | src/go/plugin/go.d/modules/icecast/testdata/config.json (renamed from src/go/collectors/go.d.plugin/modules/k8s_kubeproxy/testdata/config.json) | 0 | ||||
| -rw-r--r-- | src/go/plugin/go.d/modules/icecast/testdata/config.yaml (renamed from src/go/collectors/go.d.plugin/modules/k8s_kubeproxy/testdata/config.yaml) | 0 | ||||
| -rw-r--r-- | src/go/plugin/go.d/modules/icecast/testdata/stats_multi_source.json | 46 | ||||
| -rw-r--r-- | src/go/plugin/go.d/modules/icecast/testdata/stats_no_sources.json | 11 | ||||
| -rw-r--r-- | src/go/plugin/go.d/modules/icecast/testdata/stats_single_source.json | 27 | ||||
| -rw-r--r-- | src/go/plugin/go.d/modules/init.go | 116 | ||||
| l--------- | src/go/plugin/go.d/modules/intelgpu/README.md (renamed from src/go/collectors/go.d.plugin/modules/intelgpu/README.md) | 0 | ||||
| -rw-r--r-- | src/go/plugin/go.d/modules/intelgpu/charts.go (renamed from src/go/collectors/go.d.plugin/modules/intelgpu/charts.go) | 2 | ||||
| -rw-r--r-- | src/go/plugin/go.d/modules/intelgpu/collect.go (renamed from src/go/collectors/go.d.plugin/modules/intelgpu/collect.go) | 0 | ||||
| -rw-r--r-- | src/go/plugin/go.d/modules/intelgpu/config_schema.json (renamed from src/go/collectors/go.d.plugin/modules/intelgpu/config_schema.json) | 0 | ||||
| -rw-r--r-- | src/go/plugin/go.d/modules/intelgpu/exec.go (renamed from src/go/collectors/go.d.plugin/modules/intelgpu/exec.go) | 2 | ||||
| -rw-r--r-- | src/go/plugin/go.d/modules/intelgpu/init.go (renamed from src/go/collectors/go.d.plugin/modules/intelgpu/init.go) | 2 | ||||
| -rw-r--r-- | src/go/plugin/go.d/modules/intelgpu/integrations/intel_gpu.md (renamed from src/go/collectors/go.d.plugin/modules/intelgpu/integrations/intel_gpu.md) | 39 | ||||
| -rw-r--r-- | src/go/plugin/go.d/modules/intelgpu/intelgpu.go (renamed from src/go/collectors/go.d.plugin/modules/intelgpu/intelgpu.go) | 2 | ||||
| -rw-r--r-- | src/go/plugin/go.d/modules/intelgpu/intelgpu_test.go (renamed from src/go/collectors/go.d.plugin/modules/intelgpu/intelgpu_test.go) | 2 | ||||
| -rw-r--r-- | src/go/plugin/go.d/modules/intelgpu/metadata.yaml (renamed from src/go/collectors/go.d.plugin/modules/intelgpu/metadata.yaml) | 0 | ||||
| -rw-r--r-- | src/go/plugin/go.d/modules/intelgpu/testdata/config.json (renamed from src/go/collectors/go.d.plugin/modules/intelgpu/testdata/config.json) | 0 | ||||
| -rw-r--r-- | src/go/plugin/go.d/modules/intelgpu/testdata/config.yaml (renamed from src/go/collectors/go.d.plugin/modules/intelgpu/testdata/config.yaml) | 0 | ||||
| -rw-r--r-- | src/go/plugin/go.d/modules/intelgpu/testdata/igt.json (renamed from src/go/collectors/go.d.plugin/modules/intelgpu/testdata/igt.json) | 0 | ||||
| l--------- | src/go/plugin/go.d/modules/ipfs/README.md (renamed from src/collectors/python.d.plugin/ipfs/README.md) | 0 | ||||
| -rw-r--r-- | src/go/plugin/go.d/modules/ipfs/charts.go | 105 | ||||
| -rw-r--r-- | src/go/plugin/go.d/modules/ipfs/collect.go | 209 | ||||
| -rw-r--r-- | src/go/plugin/go.d/modules/ipfs/config_schema.json | 195 | ||||
| -rw-r--r-- | src/go/plugin/go.d/modules/ipfs/integrations/ipfs.md | 246 | ||||
| -rw-r--r-- | src/go/plugin/go.d/modules/ipfs/ipfs.go | 128 | ||||
| -rw-r--r-- | src/go/plugin/go.d/modules/ipfs/ipfs_test.go | 278 | ||||
| -rw-r--r-- | src/go/plugin/go.d/modules/ipfs/metadata.yaml | 224 | ||||
| -rw-r--r-- | src/go/plugin/go.d/modules/ipfs/testdata/api_v0_pin_ls.json | 8 | ||||
| -rw-r--r-- | src/go/plugin/go.d/modules/ipfs/testdata/api_v0_stats_bw.json | 6 | ||||
| -rw-r--r-- | src/go/plugin/go.d/modules/ipfs/testdata/api_v0_stats_repo.json | 7 | ||||
| -rw-r--r-- | src/go/plugin/go.d/modules/ipfs/testdata/api_v0_swarm_peers.json | 70 | ||||
| -rw-r--r-- | src/go/plugin/go.d/modules/ipfs/testdata/config.json | 22 | ||||
| -rw-r--r-- | src/go/plugin/go.d/modules/ipfs/testdata/config.yaml | 19 | ||||
| l--------- | src/go/plugin/go.d/modules/isc_dhcpd/README.md (renamed from src/go/collectors/go.d.plugin/modules/isc_dhcpd/README.md) | 0 | ||||
| -rw-r--r-- | src/go/plugin/go.d/modules/isc_dhcpd/charts.go (renamed from src/go/collectors/go.d.plugin/modules/isc_dhcpd/charts.go) | 2 | ||||
| -rw-r--r-- | src/go/plugin/go.d/modules/isc_dhcpd/collect.go (renamed from src/go/collectors/go.d.plugin/modules/isc_dhcpd/collect.go) | 0 | ||||
| -rw-r--r-- | src/go/plugin/go.d/modules/isc_dhcpd/config_schema.json (renamed from src/go/collectors/go.d.plugin/modules/isc_dhcpd/config_schema.json) | 2 | ||||
| -rw-r--r-- | src/go/plugin/go.d/modules/isc_dhcpd/init.go (renamed from src/go/collectors/go.d.plugin/modules/isc_dhcpd/init.go) | 4 | ||||
| -rw-r--r-- | src/go/plugin/go.d/modules/isc_dhcpd/integrations/isc_dhcp.md (renamed from src/go/collectors/go.d.plugin/modules/isc_dhcpd/integrations/isc_dhcp.md) | 41 | ||||
| -rw-r--r-- | src/go/plugin/go.d/modules/isc_dhcpd/isc_dhcpd.go (renamed from src/go/collectors/go.d.plugin/modules/isc_dhcpd/isc_dhcpd.go) | 2 | ||||
| -rw-r--r-- | src/go/plugin/go.d/modules/isc_dhcpd/isc_dhcpd_test.go (renamed from src/go/collectors/go.d.plugin/modules/isc_dhcpd/isc_dhcpd_test.go) | 2 | ||||
| -rw-r--r-- | src/go/plugin/go.d/modules/isc_dhcpd/metadata.yaml (renamed from src/go/collectors/go.d.plugin/modules/isc_dhcpd/metadata.yaml) | 2 | ||||
| -rw-r--r-- | src/go/plugin/go.d/modules/isc_dhcpd/parse.go (renamed from src/go/collectors/go.d.plugin/modules/isc_dhcpd/parse.go) | 0 | ||||
| -rw-r--r-- | src/go/plugin/go.d/modules/isc_dhcpd/testdata/config.json (renamed from src/go/collectors/go.d.plugin/modules/isc_dhcpd/testdata/config.json) | 0 | ||||
| -rw-r--r-- | src/go/plugin/go.d/modules/isc_dhcpd/testdata/config.yaml (renamed from src/go/collectors/go.d.plugin/modules/isc_dhcpd/testdata/config.yaml) | 0 | ||||
| -rw-r--r-- | src/go/plugin/go.d/modules/isc_dhcpd/testdata/dhcpd.leases_empty (renamed from src/go/collectors/go.d.plugin/modules/isc_dhcpd/testdata/dhcpd.leases_empty) | 0 | ||||
| -rw-r--r-- | src/go/plugin/go.d/modules/isc_dhcpd/testdata/dhcpd.leases_ipv4 (renamed from src/go/collectors/go.d.plugin/modules/isc_dhcpd/testdata/dhcpd.leases_ipv4) | 0 | ||||
| -rw-r--r-- | src/go/plugin/go.d/modules/isc_dhcpd/testdata/dhcpd.leases_ipv4_backup (renamed from src/go/collectors/go.d.plugin/modules/isc_dhcpd/testdata/dhcpd.leases_ipv4_backup) | 0 | ||||
| -rw-r--r-- | src/go/plugin/go.d/modules/isc_dhcpd/testdata/dhcpd.leases_ipv4_inactive (renamed from src/go/collectors/go.d.plugin/modules/isc_dhcpd/testdata/dhcpd.leases_ipv4_inactive) | 0 | ||||
| -rw-r--r-- | src/go/plugin/go.d/modules/isc_dhcpd/testdata/dhcpd.leases_ipv6 (renamed from src/go/collectors/go.d.plugin/modules/isc_dhcpd/testdata/dhcpd.leases_ipv6) | 0 | ||||
| l--------- | src/go/plugin/go.d/modules/k8s_kubelet/README.md (renamed from src/go/collectors/go.d.plugin/modules/k8s_kubelet/README.md) | 0 | ||||
| -rw-r--r-- | src/go/plugin/go.d/modules/k8s_kubelet/charts.go (renamed from src/go/collectors/go.d.plugin/modules/k8s_kubelet/charts.go) | 2 | ||||
| -rw-r--r-- | src/go/plugin/go.d/modules/k8s_kubelet/collect.go (renamed from src/go/collectors/go.d.plugin/modules/k8s_kubelet/collect.go) | 8 | ||||
| -rw-r--r-- | src/go/plugin/go.d/modules/k8s_kubelet/config_schema.json (renamed from src/go/collectors/go.d.plugin/modules/k8s_kubelet/config_schema.json) | 6 | ||||
| -rw-r--r-- | src/go/plugin/go.d/modules/k8s_kubelet/init.go (renamed from src/go/collectors/go.d.plugin/modules/k8s_kubelet/init.go) | 4 | ||||
| -rw-r--r-- | src/go/plugin/go.d/modules/k8s_kubelet/integrations/kubelet.md (renamed from src/go/collectors/go.d.plugin/modules/k8s_kubelet/integrations/kubelet.md) | 39 | ||||
| -rw-r--r-- | src/go/plugin/go.d/modules/k8s_kubelet/kubelet.go (renamed from src/go/collectors/go.d.plugin/modules/k8s_kubelet/kubelet.go) | 6 | ||||
| -rw-r--r-- | src/go/plugin/go.d/modules/k8s_kubelet/kubelet_test.go (renamed from src/go/collectors/go.d.plugin/modules/k8s_kubelet/kubelet_test.go) | 2 | ||||
| -rw-r--r-- | src/go/plugin/go.d/modules/k8s_kubelet/metadata.yaml (renamed from src/go/collectors/go.d.plugin/modules/k8s_kubelet/metadata.yaml) | 0 | ||||
| -rw-r--r-- | src/go/plugin/go.d/modules/k8s_kubelet/metrics.go (renamed from src/go/collectors/go.d.plugin/modules/k8s_kubelet/metrics.go) | 2 | ||||
| -rw-r--r-- | src/go/plugin/go.d/modules/k8s_kubelet/testdata/config.json (renamed from src/go/collectors/go.d.plugin/modules/k8s_kubelet/testdata/config.json) | 0 | ||||
| -rw-r--r-- | src/go/plugin/go.d/modules/k8s_kubelet/testdata/config.yaml (renamed from src/go/collectors/go.d.plugin/modules/k8s_kubelet/testdata/config.yaml) | 0 | ||||
| -rw-r--r-- | src/go/plugin/go.d/modules/k8s_kubelet/testdata/metrics.txt (renamed from src/go/collectors/go.d.plugin/modules/k8s_kubelet/testdata/metrics.txt) | 0 | ||||
| -rw-r--r-- | src/go/plugin/go.d/modules/k8s_kubelet/testdata/token.txt (renamed from src/go/collectors/go.d.plugin/modules/k8s_kubelet/testdata/token.txt) | 0 | ||||
| l--------- | src/go/plugin/go.d/modules/k8s_kubeproxy/README.md (renamed from src/go/collectors/go.d.plugin/modules/k8s_kubeproxy/README.md) | 0 | ||||
| -rw-r--r-- | src/go/plugin/go.d/modules/k8s_kubeproxy/charts.go (renamed from src/go/collectors/go.d.plugin/modules/k8s_kubeproxy/charts.go) | 2 | ||||
| -rw-r--r-- | src/go/plugin/go.d/modules/k8s_kubeproxy/collect.go (renamed from src/go/collectors/go.d.plugin/modules/k8s_kubeproxy/collect.go) | 8 | ||||
| -rw-r--r-- | src/go/plugin/go.d/modules/k8s_kubeproxy/config_schema.json (renamed from src/go/collectors/go.d.plugin/modules/k8s_kubeproxy/config_schema.json) | 6 | ||||
| -rw-r--r-- | src/go/plugin/go.d/modules/k8s_kubeproxy/init.go (renamed from src/go/collectors/go.d.plugin/modules/k8s_kubeproxy/init.go) | 4 | ||||
| -rw-r--r-- | src/go/plugin/go.d/modules/k8s_kubeproxy/integrations/kubeproxy.md (renamed from src/go/collectors/go.d.plugin/modules/k8s_kubeproxy/integrations/kubeproxy.md) | 39 | ||||
| -rw-r--r-- | src/go/plugin/go.d/modules/k8s_kubeproxy/kubeproxy.go (renamed from src/go/collectors/go.d.plugin/modules/k8s_kubeproxy/kubeproxy.go) | 6 | ||||
| -rw-r--r-- | src/go/plugin/go.d/modules/k8s_kubeproxy/kubeproxy_test.go (renamed from src/go/collectors/go.d.plugin/modules/k8s_kubeproxy/kubeproxy_test.go) | 2 | ||||
| -rw-r--r-- | src/go/plugin/go.d/modules/k8s_kubeproxy/metadata.yaml (renamed from src/go/collectors/go.d.plugin/modules/k8s_kubeproxy/metadata.yaml) | 0 | ||||
| -rw-r--r-- | src/go/plugin/go.d/modules/k8s_kubeproxy/metrics.go (renamed from src/go/collectors/go.d.plugin/modules/k8s_kubeproxy/metrics.go) | 2 | ||||
| -rw-r--r-- | src/go/plugin/go.d/modules/k8s_kubeproxy/testdata/config.json (renamed from src/go/collectors/go.d.plugin/modules/lighttpd/testdata/config.json) | 0 | ||||
| -rw-r--r-- | src/go/plugin/go.d/modules/k8s_kubeproxy/testdata/config.yaml (renamed from src/go/collectors/go.d.plugin/modules/lighttpd/testdata/config.yaml) | 0 | ||||
| -rw-r--r-- | src/go/plugin/go.d/modules/k8s_kubeproxy/testdata/metrics.txt (renamed from src/go/collectors/go.d.plugin/modules/k8s_kubeproxy/testdata/metrics.txt) | 0 | ||||
| l--------- | src/go/plugin/go.d/modules/k8s_state/README.md (renamed from src/go/collectors/go.d.plugin/modules/k8s_state/README.md) | 0 | ||||
| -rw-r--r-- | src/go/plugin/go.d/modules/k8s_state/charts.go (renamed from src/go/collectors/go.d.plugin/modules/k8s_state/charts.go) | 2 | ||||
| -rw-r--r-- | src/go/plugin/go.d/modules/k8s_state/client.go (renamed from src/go/collectors/go.d.plugin/modules/k8s_state/client.go) | 0 | ||||
| -rw-r--r-- | src/go/plugin/go.d/modules/k8s_state/cluster_meta.go (renamed from src/go/collectors/go.d.plugin/modules/k8s_state/cluster_meta.go) | 0 | ||||
| -rw-r--r-- | src/go/plugin/go.d/modules/k8s_state/collect.go (renamed from src/go/collectors/go.d.plugin/modules/k8s_state/collect.go) | 9 | ||||
| -rw-r--r-- | src/go/plugin/go.d/modules/k8s_state/config_schema.json (renamed from src/go/collectors/go.d.plugin/modules/k8s_state/config_schema.json) | 0 | ||||
| -rw-r--r-- | src/go/plugin/go.d/modules/k8s_state/discover_kubernetes.go (renamed from src/go/collectors/go.d.plugin/modules/k8s_state/discover_kubernetes.go) | 2 | ||||
| -rw-r--r-- | src/go/plugin/go.d/modules/k8s_state/discover_node.go (renamed from src/go/collectors/go.d.plugin/modules/k8s_state/discover_node.go) | 2 | ||||
| -rw-r--r-- | src/go/plugin/go.d/modules/k8s_state/discover_pod.go (renamed from src/go/collectors/go.d.plugin/modules/k8s_state/discover_pod.go) | 2 | ||||
| -rw-r--r-- | src/go/plugin/go.d/modules/k8s_state/init.go (renamed from src/go/collectors/go.d.plugin/modules/k8s_state/init.go) | 0 | ||||
| -rw-r--r-- | src/go/plugin/go.d/modules/k8s_state/integrations/kubernetes_cluster_state.md (renamed from src/go/collectors/go.d.plugin/modules/k8s_state/integrations/kubernetes_cluster_state.md) | 39 | ||||
| -rw-r--r-- | src/go/plugin/go.d/modules/k8s_state/kube_state.go (renamed from src/go/collectors/go.d.plugin/modules/k8s_state/kube_state.go) | 2 | ||||
| -rw-r--r-- | src/go/plugin/go.d/modules/k8s_state/kube_state_test.go (renamed from src/go/collectors/go.d.plugin/modules/k8s_state/kube_state_test.go) | 2 | ||||
| -rw-r--r-- | src/go/plugin/go.d/modules/k8s_state/metadata.yaml (renamed from src/go/collectors/go.d.plugin/modules/k8s_state/metadata.yaml) | 0 | ||||
| -rw-r--r-- | src/go/plugin/go.d/modules/k8s_state/resource.go (renamed from src/go/collectors/go.d.plugin/modules/k8s_state/resource.go) | 0 | ||||
| -rw-r--r-- | src/go/plugin/go.d/modules/k8s_state/state.go (renamed from src/go/collectors/go.d.plugin/modules/k8s_state/state.go) | 0 | ||||
| -rw-r--r-- | src/go/plugin/go.d/modules/k8s_state/testdata/config.json (renamed from src/go/collectors/go.d.plugin/modules/k8s_state/testdata/config.json) | 0 | ||||
| -rw-r--r-- | src/go/plugin/go.d/modules/k8s_state/testdata/config.yaml (renamed from src/go/collectors/go.d.plugin/modules/k8s_state/testdata/config.yaml) | 0 | ||||
| -rw-r--r-- | src/go/plugin/go.d/modules/k8s_state/update_node_state.go (renamed from src/go/collectors/go.d.plugin/modules/k8s_state/update_node_state.go) | 0 | ||||
| -rw-r--r-- | src/go/plugin/go.d/modules/k8s_state/update_pod_state.go (renamed from src/go/collectors/go.d.plugin/modules/k8s_state/update_pod_state.go) | 7 | ||||
| -rw-r--r-- | src/go/plugin/go.d/modules/k8s_state/update_state.go (renamed from src/go/collectors/go.d.plugin/modules/k8s_state/update_state.go) | 0 | ||||
| l--------- | src/go/plugin/go.d/modules/lighttpd/README.md (renamed from src/go/collectors/go.d.plugin/modules/lighttpd/README.md) | 0 | ||||
| -rw-r--r-- | src/go/plugin/go.d/modules/lighttpd/apiclient.go (renamed from src/go/collectors/go.d.plugin/modules/lighttpd/apiclient.go) | 2 | ||||
| -rw-r--r-- | src/go/plugin/go.d/modules/lighttpd/charts.go (renamed from src/go/collectors/go.d.plugin/modules/lighttpd/charts.go) | 2 | ||||
| -rw-r--r-- | src/go/plugin/go.d/modules/lighttpd/collect.go (renamed from src/go/collectors/go.d.plugin/modules/lighttpd/collect.go) | 2 | ||||
| -rw-r--r-- | src/go/plugin/go.d/modules/lighttpd/config_schema.json (renamed from src/go/collectors/go.d.plugin/modules/lighttpd/config_schema.json) | 6 | ||||
| -rw-r--r-- | src/go/plugin/go.d/modules/lighttpd/init.go (renamed from src/go/collectors/go.d.plugin/modules/lighttpd/init.go) | 2 | ||||
| -rw-r--r-- | src/go/plugin/go.d/modules/lighttpd/integrations/lighttpd.md (renamed from src/go/collectors/go.d.plugin/modules/lighttpd/integrations/lighttpd.md) | 39 | ||||
| -rw-r--r-- | src/go/plugin/go.d/modules/lighttpd/lighttpd.go (renamed from src/go/collectors/go.d.plugin/modules/lighttpd/lighttpd.go) | 4 | ||||
| -rw-r--r-- | src/go/plugin/go.d/modules/lighttpd/lighttpd_test.go (renamed from src/go/collectors/go.d.plugin/modules/lighttpd/lighttpd_test.go) | 2 | ||||
| -rw-r--r-- | src/go/plugin/go.d/modules/lighttpd/metadata.yaml (renamed from src/go/collectors/go.d.plugin/modules/lighttpd/metadata.yaml) | 0 | ||||
| -rw-r--r-- | src/go/plugin/go.d/modules/lighttpd/metrics.go (renamed from src/go/collectors/go.d.plugin/modules/lighttpd/metrics.go) | 0 | ||||
| -rw-r--r-- | src/go/plugin/go.d/modules/lighttpd/testdata/apache-status.txt (renamed from src/go/collectors/go.d.plugin/modules/lighttpd/testdata/apache-status.txt) | 0 | ||||
| -rw-r--r-- | src/go/plugin/go.d/modules/lighttpd/testdata/config.json (renamed from src/go/collectors/go.d.plugin/modules/logstash/testdata/config.json) | 0 | ||||
| -rw-r--r-- | src/go/plugin/go.d/modules/lighttpd/testdata/config.yaml (renamed from src/go/collectors/go.d.plugin/modules/logstash/testdata/config.yaml) | 0 | ||||
| -rw-r--r-- | src/go/plugin/go.d/modules/lighttpd/testdata/status.txt (renamed from src/go/collectors/go.d.plugin/modules/lighttpd/testdata/status.txt) | 0 | ||||
| l--------- | src/go/plugin/go.d/modules/litespeed/README.md (renamed from src/go/collectors/go.d.plugin/modules/litespeed/README.md) | 0 | ||||
| -rw-r--r-- | src/go/plugin/go.d/modules/litespeed/charts.go (renamed from src/go/collectors/go.d.plugin/modules/litespeed/charts.go) | 2 | ||||
| -rw-r--r-- | src/go/plugin/go.d/modules/litespeed/collect.go (renamed from src/go/collectors/go.d.plugin/modules/litespeed/collect.go) | 0 | ||||
| -rw-r--r-- | src/go/plugin/go.d/modules/litespeed/config_schema.json (renamed from src/go/collectors/go.d.plugin/modules/litespeed/config_schema.json) | 0 | ||||
| -rw-r--r-- | src/go/plugin/go.d/modules/litespeed/integrations/litespeed.md (renamed from src/go/collectors/go.d.plugin/modules/litespeed/integrations/litespeed.md) | 39 | ||||
| -rw-r--r-- | src/go/plugin/go.d/modules/litespeed/litespeed.go (renamed from src/go/collectors/go.d.plugin/modules/litespeed/litespeed.go) | 2 | ||||
| -rw-r--r-- | src/go/plugin/go.d/modules/litespeed/litespeed_test.go (renamed from src/go/collectors/go.d.plugin/modules/litespeed/litespeed_test.go) | 2 | ||||
| -rw-r--r-- | src/go/plugin/go.d/modules/litespeed/metadata.yaml (renamed from src/go/collectors/go.d.plugin/modules/litespeed/metadata.yaml) | 0 | ||||
| -rw-r--r-- | src/go/plugin/go.d/modules/litespeed/testdata/.rtreport (renamed from src/go/collectors/go.d.plugin/modules/litespeed/testdata/.rtreport) | 0 | ||||
| -rw-r--r-- | src/go/plugin/go.d/modules/litespeed/testdata/.rtreport.2 (renamed from src/go/collectors/go.d.plugin/modules/litespeed/testdata/.rtreport.2) | 0 | ||||
| -rw-r--r-- | src/go/plugin/go.d/modules/litespeed/testdata/config.json (renamed from src/go/collectors/go.d.plugin/modules/litespeed/testdata/config.json) | 0 | ||||
| -rw-r--r-- | src/go/plugin/go.d/modules/litespeed/testdata/config.yaml (renamed from src/go/collectors/go.d.plugin/modules/litespeed/testdata/config.yaml) | 0 | ||||
| l--------- | src/go/plugin/go.d/modules/logind/README.md (renamed from src/go/collectors/go.d.plugin/modules/logind/README.md) | 0 | ||||
| -rw-r--r-- | src/go/plugin/go.d/modules/logind/charts.go (renamed from src/go/collectors/go.d.plugin/modules/logind/charts.go) | 2 | ||||
| -rw-r--r-- | src/go/plugin/go.d/modules/logind/collect.go (renamed from src/go/collectors/go.d.plugin/modules/logind/collect.go) | 0 | ||||
| -rw-r--r-- | src/go/plugin/go.d/modules/logind/config_schema.json (renamed from src/go/collectors/go.d.plugin/modules/logind/config_schema.json) | 0 | ||||
| -rw-r--r-- | src/go/plugin/go.d/modules/logind/connection.go (renamed from src/go/collectors/go.d.plugin/modules/logind/connection.go) | 0 | ||||
| -rw-r--r-- | src/go/plugin/go.d/modules/logind/doc.go (renamed from src/go/collectors/go.d.plugin/modules/logind/doc.go) | 0 | ||||
| -rw-r--r-- | src/go/plugin/go.d/modules/logind/integrations/systemd-logind_users.md (renamed from src/go/collectors/go.d.plugin/modules/logind/integrations/systemd-logind_users.md) | 39 | ||||
| -rw-r--r-- | src/go/plugin/go.d/modules/logind/logind.go (renamed from src/go/collectors/go.d.plugin/modules/logind/logind.go) | 4 | ||||
| -rw-r--r-- | src/go/plugin/go.d/modules/logind/logind_test.go (renamed from src/go/collectors/go.d.plugin/modules/logind/logind_test.go) | 2 | ||||
| -rw-r--r-- | src/go/plugin/go.d/modules/logind/metadata.yaml (renamed from src/go/collectors/go.d.plugin/modules/logind/metadata.yaml) | 0 | ||||
| -rw-r--r-- | src/go/plugin/go.d/modules/logind/testdata/config.json (renamed from src/go/collectors/go.d.plugin/modules/lvm/testdata/config.json) | 0 | ||||
| -rw-r--r-- | src/go/plugin/go.d/modules/logind/testdata/config.yaml (renamed from src/go/collectors/go.d.plugin/modules/lvm/testdata/config.yaml) | 0 | ||||
| l--------- | src/go/plugin/go.d/modules/logstash/README.md (renamed from src/go/collectors/go.d.plugin/modules/logstash/README.md) | 0 | ||||
| -rw-r--r-- | src/go/plugin/go.d/modules/logstash/charts.go (renamed from src/go/collectors/go.d.plugin/modules/logstash/charts.go) | 2 | ||||
| -rw-r--r-- | src/go/plugin/go.d/modules/logstash/collect.go (renamed from src/go/collectors/go.d.plugin/modules/logstash/collect.go) | 10 | ||||
| -rw-r--r-- | src/go/plugin/go.d/modules/logstash/config_schema.json (renamed from src/go/collectors/go.d.plugin/modules/logstash/config_schema.json) | 6 | ||||
| -rw-r--r-- | src/go/plugin/go.d/modules/logstash/integrations/logstash.md (renamed from src/go/collectors/go.d.plugin/modules/logstash/integrations/logstash.md) | 39 | ||||
| -rw-r--r-- | src/go/plugin/go.d/modules/logstash/logstash.go (renamed from src/go/collectors/go.d.plugin/modules/logstash/logstash.go) | 4 | ||||
| -rw-r--r-- | src/go/plugin/go.d/modules/logstash/logstash_test.go (renamed from src/go/collectors/go.d.plugin/modules/logstash/logstash_test.go) | 4 | ||||
| -rw-r--r-- | src/go/plugin/go.d/modules/logstash/metadata.yaml (renamed from src/go/collectors/go.d.plugin/modules/logstash/metadata.yaml) | 0 | ||||
| -rw-r--r-- | src/go/plugin/go.d/modules/logstash/node_stats.go (renamed from src/go/collectors/go.d.plugin/modules/logstash/node_stats.go) | 0 | ||||
| -rw-r--r-- | src/go/plugin/go.d/modules/logstash/testdata/config.json (renamed from src/go/collectors/go.d.plugin/modules/nginx/testdata/config.json) | 0 | ||||
| -rw-r--r-- | src/go/plugin/go.d/modules/logstash/testdata/config.yaml (renamed from src/go/collectors/go.d.plugin/modules/nginx/testdata/config.yaml) | 0 | ||||
| -rw-r--r-- | src/go/plugin/go.d/modules/logstash/testdata/stats.json (renamed from src/go/collectors/go.d.plugin/modules/logstash/testdata/stats.json) | 0 | ||||
| l--------- | src/go/plugin/go.d/modules/lvm/README.md (renamed from src/go/collectors/go.d.plugin/modules/lvm/README.md) | 0 | ||||
| -rw-r--r-- | src/go/plugin/go.d/modules/lvm/charts.go (renamed from src/go/collectors/go.d.plugin/modules/lvm/charts.go) | 2 | ||||
| -rw-r--r-- | src/go/plugin/go.d/modules/lvm/collect.go (renamed from src/go/collectors/go.d.plugin/modules/lvm/collect.go) | 0 | ||||
| -rw-r--r-- | src/go/plugin/go.d/modules/lvm/config_schema.json (renamed from src/go/collectors/go.d.plugin/modules/lvm/config_schema.json) | 0 | ||||
| -rw-r--r-- | src/go/plugin/go.d/modules/lvm/exec.go (renamed from src/go/collectors/go.d.plugin/modules/lvm/exec.go) | 2 | ||||
| -rw-r--r-- | src/go/plugin/go.d/modules/lvm/init.go (renamed from src/go/collectors/go.d.plugin/modules/lvm/init.go) | 2 | ||||
| -rw-r--r-- | src/go/plugin/go.d/modules/lvm/integrations/lvm_logical_volumes.md (renamed from src/go/collectors/go.d.plugin/modules/lvm/integrations/lvm_logical_volumes.md) | 39 | ||||
| -rw-r--r-- | src/go/plugin/go.d/modules/lvm/lvm.go (renamed from src/go/collectors/go.d.plugin/modules/lvm/lvm.go) | 4 | ||||
| -rw-r--r-- | src/go/plugin/go.d/modules/lvm/lvm_test.go (renamed from src/go/collectors/go.d.plugin/modules/lvm/lvm_test.go) | 2 | ||||
| -rw-r--r-- | src/go/plugin/go.d/modules/lvm/metadata.yaml (renamed from src/go/collectors/go.d.plugin/modules/lvm/metadata.yaml) | 0 | ||||
| -rw-r--r-- | src/go/plugin/go.d/modules/lvm/testdata/config.json (renamed from src/go/collectors/go.d.plugin/modules/megacli/testdata/config.json) | 0 | ||||
| -rw-r--r-- | src/go/plugin/go.d/modules/lvm/testdata/config.yaml (renamed from src/go/collectors/go.d.plugin/modules/megacli/testdata/config.yaml) | 0 | ||||
| -rw-r--r-- | src/go/plugin/go.d/modules/lvm/testdata/lvs-report-no-thin.json (renamed from src/go/collectors/go.d.plugin/modules/lvm/testdata/lvs-report-no-thin.json) | 0 | ||||
| -rw-r--r-- | src/go/plugin/go.d/modules/lvm/testdata/lvs-report.json (renamed from src/go/collectors/go.d.plugin/modules/lvm/testdata/lvs-report.json) | 0 | ||||
| l--------- | src/go/plugin/go.d/modules/megacli/README.md (renamed from src/go/collectors/go.d.plugin/modules/megacli/README.md) | 0 | ||||
| -rw-r--r-- | src/go/plugin/go.d/modules/megacli/charts.go (renamed from src/go/collectors/go.d.plugin/modules/megacli/charts.go) | 20 | ||||
| -rw-r--r-- | src/go/plugin/go.d/modules/megacli/collect.go (renamed from src/go/collectors/go.d.plugin/modules/megacli/collect.go) | 0 | ||||
| -rw-r--r-- | src/go/plugin/go.d/modules/megacli/collect_bbu.go (renamed from src/go/collectors/go.d.plugin/modules/megacli/collect_bbu.go) | 58 | ||||
| -rw-r--r-- | src/go/plugin/go.d/modules/megacli/collect_phys_drives.go (renamed from src/go/collectors/go.d.plugin/modules/megacli/collect_phys_drives.go) | 9 | ||||
| -rw-r--r-- | src/go/plugin/go.d/modules/megacli/config_schema.json (renamed from src/go/collectors/go.d.plugin/modules/megacli/config_schema.json) | 0 | ||||
| -rw-r--r-- | src/go/plugin/go.d/modules/megacli/exec.go (renamed from src/go/collectors/go.d.plugin/modules/megacli/exec.go) | 2 | ||||
| -rw-r--r-- | src/go/plugin/go.d/modules/megacli/init.go (renamed from src/go/collectors/go.d.plugin/modules/megacli/init.go) | 2 | ||||
| -rw-r--r-- | src/go/plugin/go.d/modules/megacli/integrations/megacli_megaraid.md (renamed from src/go/collectors/go.d.plugin/modules/megacli/integrations/megacli_megaraid.md) | 42 | ||||
| -rw-r--r-- | src/go/plugin/go.d/modules/megacli/megacli.go (renamed from src/go/collectors/go.d.plugin/modules/megacli/megacli.go) | 4 | ||||
| -rw-r--r-- | src/go/plugin/go.d/modules/megacli/megacli_test.go (renamed from src/go/collectors/go.d.plugin/modules/megacli/megacli_test.go) | 7 | ||||
| -rw-r--r-- | src/go/plugin/go.d/modules/megacli/metadata.yaml (renamed from src/go/collectors/go.d.plugin/modules/megacli/metadata.yaml) | 8 | ||||
| -rw-r--r-- | src/go/plugin/go.d/modules/megacli/testdata/config.json (renamed from src/go/collectors/go.d.plugin/modules/nvme/testdata/config.json) | 0 | ||||
| -rw-r--r-- | src/go/plugin/go.d/modules/megacli/testdata/config.yaml (renamed from src/go/collectors/go.d.plugin/modules/nvme/testdata/config.yaml) | 0 | ||||
| -rw-r--r-- | src/go/plugin/go.d/modules/megacli/testdata/mega-bbu-info-old.txt (renamed from src/go/collectors/go.d.plugin/modules/megacli/testdata/mega-bbu-info-old.txt) | 0 | ||||
| -rw-r--r-- | src/go/plugin/go.d/modules/megacli/testdata/mega-bbu-info-recent.txt (renamed from src/go/collectors/go.d.plugin/modules/megacli/testdata/mega-bbu-info-recent.txt) | 0 | ||||
| -rw-r--r-- | src/go/plugin/go.d/modules/megacli/testdata/mega-phys-drives-info.txt (renamed from src/go/collectors/go.d.plugin/modules/megacli/testdata/mega-phys-drives-info.txt) | 0 | ||||
| l--------- | src/go/plugin/go.d/modules/memcached/README.md (renamed from src/collectors/python.d.plugin/memcached/README.md) | 0 | ||||
| -rw-r--r-- | src/go/plugin/go.d/modules/memcached/charts.go | 229 | ||||
| -rw-r--r-- | src/go/plugin/go.d/modules/memcached/client.go | 45 | ||||
| -rw-r--r-- | src/go/plugin/go.d/modules/memcached/collect.go | 121 | ||||
| -rw-r--r-- | src/go/plugin/go.d/modules/memcached/config_schema.json | 44 | ||||
| -rw-r--r-- | src/go/plugin/go.d/modules/memcached/integrations/memcached.md (renamed from src/collectors/python.d.plugin/memcached/integrations/memcached.md) | 114 | ||||
| -rw-r--r-- | src/go/plugin/go.d/modules/memcached/memcached.go | 108 | ||||
| -rw-r--r-- | src/go/plugin/go.d/modules/memcached/memcached_test.go | 296 | ||||
| -rw-r--r-- | src/go/plugin/go.d/modules/memcached/metadata.yaml (renamed from src/collectors/python.d.plugin/memcached/metadata.yaml) | 96 | ||||
| -rw-r--r-- | src/go/plugin/go.d/modules/memcached/testdata/config.json | 5 | ||||
| -rw-r--r-- | src/go/plugin/go.d/modules/memcached/testdata/config.yaml | 3 | ||||
| -rw-r--r-- | src/go/plugin/go.d/modules/memcached/testdata/stats.txt | 93 | ||||
| l--------- | src/go/plugin/go.d/modules/mongodb/README.md (renamed from src/go/collectors/go.d.plugin/modules/mongodb/README.md) | 0 | ||||
| -rw-r--r-- | src/go/plugin/go.d/modules/mongodb/charts.go (renamed from src/go/collectors/go.d.plugin/modules/mongodb/charts.go) | 2 | ||||
| -rw-r--r-- | src/go/plugin/go.d/modules/mongodb/client.go (renamed from src/go/collectors/go.d.plugin/modules/mongodb/client.go) | 0 | ||||
| -rw-r--r-- | src/go/plugin/go.d/modules/mongodb/collect.go (renamed from src/go/collectors/go.d.plugin/modules/mongodb/collect.go) | 0 | ||||
| -rw-r--r-- | src/go/plugin/go.d/modules/mongodb/collect_dbstats.go (renamed from src/go/collectors/go.d.plugin/modules/mongodb/collect_dbstats.go) | 2 | ||||
| -rw-r--r-- | src/go/plugin/go.d/modules/mongodb/collect_replsetgetstatus.go (renamed from src/go/collectors/go.d.plugin/modules/mongodb/collect_replsetgetstatus.go) | 2 | ||||
| -rw-r--r-- | src/go/plugin/go.d/modules/mongodb/collect_serverstatus.go (renamed from src/go/collectors/go.d.plugin/modules/mongodb/collect_serverstatus.go) | 4 | ||||
| -rw-r--r-- | src/go/plugin/go.d/modules/mongodb/collect_sharding.go (renamed from src/go/collectors/go.d.plugin/modules/mongodb/collect_sharding.go) | 2 | ||||
| -rw-r--r-- | src/go/plugin/go.d/modules/mongodb/config_schema.json (renamed from src/go/collectors/go.d.plugin/modules/mongodb/config_schema.json) | 4 | ||||
| -rw-r--r-- | src/go/plugin/go.d/modules/mongodb/documents.go (renamed from src/go/collectors/go.d.plugin/modules/mongodb/documents.go) | 0 | ||||
| -rw-r--r-- | src/go/plugin/go.d/modules/mongodb/init.go (renamed from src/go/collectors/go.d.plugin/modules/mongodb/init.go) | 0 | ||||
| -rw-r--r-- | src/go/plugin/go.d/modules/mongodb/integrations/mongodb.md (renamed from src/go/collectors/go.d.plugin/modules/mongodb/integrations/mongodb.md) | 39 | ||||
| -rw-r--r-- | src/go/plugin/go.d/modules/mongodb/metadata.yaml (renamed from src/go/collectors/go.d.plugin/modules/mongodb/metadata.yaml) | 2 | ||||
| -rw-r--r-- | src/go/plugin/go.d/modules/mongodb/mongodb.go (renamed from src/go/collectors/go.d.plugin/modules/mongodb/mongodb.go) | 6 | ||||
| -rw-r--r-- | src/go/plugin/go.d/modules/mongodb/mongodb_test.go (renamed from src/go/collectors/go.d.plugin/modules/mongodb/mongodb_test.go) | 4 | ||||
| -rw-r--r-- | src/go/plugin/go.d/modules/mongodb/testdata/config.json (renamed from src/go/collectors/go.d.plugin/modules/mongodb/testdata/config.json) | 0 | ||||
| -rw-r--r-- | src/go/plugin/go.d/modules/mongodb/testdata/config.yaml (renamed from src/go/collectors/go.d.plugin/modules/mongodb/testdata/config.yaml) | 0 | ||||
| -rw-r--r-- | src/go/plugin/go.d/modules/mongodb/testdata/v6.0.3/dbStats.json (renamed from src/go/collectors/go.d.plugin/modules/mongodb/testdata/v6.0.3/dbStats.json) | 0 | ||||
| -rw-r--r-- | src/go/plugin/go.d/modules/mongodb/testdata/v6.0.3/mongod-serverStatus.json (renamed from src/go/collectors/go.d.plugin/modules/mongodb/testdata/v6.0.3/mongod-serverStatus.json) | 0 | ||||
| -rw-r--r-- | src/go/plugin/go.d/modules/mongodb/testdata/v6.0.3/mongos-serverStatus.json (renamed from src/go/collectors/go.d.plugin/modules/mongodb/testdata/v6.0.3/mongos-serverStatus.json) | 0 | ||||
| -rw-r--r-- | src/go/plugin/go.d/modules/mongodb/testdata/v6.0.3/replSetGetStatus.json (renamed from src/go/collectors/go.d.plugin/modules/mongodb/testdata/v6.0.3/replSetGetStatus.json) | 0 | ||||
| l--------- | src/go/plugin/go.d/modules/monit/README.md (renamed from src/collectors/python.d.plugin/monit/README.md) | 0 | ||||
| -rw-r--r-- | src/go/plugin/go.d/modules/monit/charts.go | 91 | ||||
| -rw-r--r-- | src/go/plugin/go.d/modules/monit/collect.go | 117 | ||||
| -rw-r--r-- | src/go/plugin/go.d/modules/monit/config_schema.json | 185 | ||||
| -rw-r--r-- | src/go/plugin/go.d/modules/monit/integrations/monit.md | 255 | ||||
| -rw-r--r-- | src/go/plugin/go.d/modules/monit/metadata.yaml | 193 | ||||
| -rw-r--r-- | src/go/plugin/go.d/modules/monit/monit.go | 117 | ||||
| -rw-r--r-- | src/go/plugin/go.d/modules/monit/monit_test.go | 371 | ||||
| -rw-r--r-- | src/go/plugin/go.d/modules/monit/status.go | 153 | ||||
| -rw-r--r-- | src/go/plugin/go.d/modules/monit/testdata/config.json (renamed from src/go/collectors/go.d.plugin/modules/nginxplus/testdata/config.json) | 0 | ||||
| -rw-r--r-- | src/go/plugin/go.d/modules/monit/testdata/config.yaml (renamed from src/go/collectors/go.d.plugin/modules/nginxplus/testdata/config.yaml) | 0 | ||||
| -rw-r--r-- | src/go/plugin/go.d/modules/monit/testdata/v5.33.0/status.xml | 688 | ||||
| l--------- | src/go/plugin/go.d/modules/mysql/README.md (renamed from src/go/collectors/go.d.plugin/modules/mysql/README.md) | 0 | ||||
| -rw-r--r-- | src/go/plugin/go.d/modules/mysql/charts.go (renamed from src/go/collectors/go.d.plugin/modules/mysql/charts.go) | 2 | ||||
| -rw-r--r-- | src/go/plugin/go.d/modules/mysql/collect.go (renamed from src/go/collectors/go.d.plugin/modules/mysql/collect.go) | 0 | ||||
| -rw-r--r-- | src/go/plugin/go.d/modules/mysql/collect_global_status.go (renamed from src/go/collectors/go.d.plugin/modules/mysql/collect_global_status.go) | 0 | ||||
| -rw-r--r-- | src/go/plugin/go.d/modules/mysql/collect_global_vars.go (renamed from src/go/collectors/go.d.plugin/modules/mysql/collect_global_vars.go) | 0 | ||||
| -rw-r--r-- | src/go/plugin/go.d/modules/mysql/collect_process_list.go (renamed from src/go/collectors/go.d.plugin/modules/mysql/collect_process_list.go) | 0 | ||||
| -rw-r--r-- | src/go/plugin/go.d/modules/mysql/collect_slave_status.go (renamed from src/go/collectors/go.d.plugin/modules/mysql/collect_slave_status.go) | 0 | ||||
| -rw-r--r-- | src/go/plugin/go.d/modules/mysql/collect_user_statistics.go (renamed from src/go/collectors/go.d.plugin/modules/mysql/collect_user_statistics.go) | 0 | ||||
| -rw-r--r-- | src/go/plugin/go.d/modules/mysql/collect_version.go (renamed from src/go/collectors/go.d.plugin/modules/mysql/collect_version.go) | 0 | ||||
| -rw-r--r-- | src/go/plugin/go.d/modules/mysql/config_schema.json (renamed from src/go/collectors/go.d.plugin/modules/mysql/config_schema.json) | 0 | ||||
| -rw-r--r-- | src/go/plugin/go.d/modules/mysql/disable_logging.go (renamed from src/go/collectors/go.d.plugin/modules/mysql/disable_logging.go) | 0 | ||||
| -rw-r--r-- | src/go/plugin/go.d/modules/mysql/integrations/mariadb.md (renamed from src/go/collectors/go.d.plugin/modules/mysql/integrations/mariadb.md) | 45 | ||||
| -rw-r--r-- | src/go/plugin/go.d/modules/mysql/integrations/mysql.md (renamed from src/go/collectors/go.d.plugin/modules/mysql/integrations/mysql.md) | 45 | ||||
| -rw-r--r-- | src/go/plugin/go.d/modules/mysql/integrations/percona_mysql.md (renamed from src/go/collectors/go.d.plugin/modules/mysql/integrations/percona_mysql.md) | 45 | ||||
| -rw-r--r-- | src/go/plugin/go.d/modules/mysql/metadata.yaml (renamed from src/go/collectors/go.d.plugin/modules/mysql/metadata.yaml) | 8 | ||||
| -rw-r--r-- | src/go/plugin/go.d/modules/mysql/mycnf.go (renamed from src/go/collectors/go.d.plugin/modules/mysql/mycnf.go) | 0 | ||||
| -rw-r--r-- | src/go/plugin/go.d/modules/mysql/mycnf_test.go (renamed from src/go/collectors/go.d.plugin/modules/mysql/mycnf_test.go) | 0 | ||||
| -rw-r--r-- | src/go/plugin/go.d/modules/mysql/mysql.go (renamed from src/go/collectors/go.d.plugin/modules/mysql/mysql.go) | 4 | ||||
| -rw-r--r-- | src/go/plugin/go.d/modules/mysql/mysql_test.go (renamed from src/go/collectors/go.d.plugin/modules/mysql/mysql_test.go) | 2 | ||||
| -rw-r--r-- | src/go/plugin/go.d/modules/mysql/testdata/config.json (renamed from src/go/collectors/go.d.plugin/modules/mysql/testdata/config.json) | 0 | ||||
| -rw-r--r-- | src/go/plugin/go.d/modules/mysql/testdata/config.yaml (renamed from src/go/collectors/go.d.plugin/modules/mysql/testdata/config.yaml) | 0 | ||||
| -rw-r--r-- | src/go/plugin/go.d/modules/mysql/testdata/mariadb/v10.8.4-galera-cluster/global_status.txt (renamed from src/go/collectors/go.d.plugin/modules/mysql/testdata/mariadb/v10.8.4-galera-cluster/global_status.txt) | 0 | ||||
| -rw-r--r-- | src/go/plugin/go.d/modules/mysql/testdata/mariadb/v10.8.4-galera-cluster/global_variables.txt (renamed from src/go/collectors/go.d.plugin/modules/mysql/testdata/mariadb/v10.8.4-galera-cluster/global_variables.txt) | 0 | ||||
| -rw-r--r-- | src/go/plugin/go.d/modules/mysql/testdata/mariadb/v10.8.4-galera-cluster/process_list.txt (renamed from src/go/collectors/go.d.plugin/modules/mysql/testdata/mariadb/v10.8.4-galera-cluster/process_list.txt) | 0 | ||||
| -rw-r--r-- | src/go/plugin/go.d/modules/mysql/testdata/mariadb/v10.8.4-galera-cluster/user_statistics.txt (renamed from src/go/collectors/go.d.plugin/modules/mysql/testdata/mariadb/v10.8.4-galera-cluster/user_statistics.txt) | 0 | ||||
| -rw-r--r-- | src/go/plugin/go.d/modules/mysql/testdata/mariadb/v10.8.4-galera-cluster/version.txt (renamed from src/go/collectors/go.d.plugin/modules/mysql/testdata/mariadb/v10.8.4-galera-cluster/version.txt) | 0 | ||||
| -rw-r--r-- | src/go/plugin/go.d/modules/mysql/testdata/mariadb/v10.8.4/all_slaves_status_multi_source.txt (renamed from src/go/collectors/go.d.plugin/modules/mysql/testdata/mariadb/v10.8.4/all_slaves_status_multi_source.txt) | 0 | ||||
| -rw-r--r-- | src/go/plugin/go.d/modules/mysql/testdata/mariadb/v10.8.4/all_slaves_status_single_source.txt (renamed from src/go/collectors/go.d.plugin/modules/mysql/testdata/mariadb/v10.8.4/all_slaves_status_single_source.txt) | 0 | ||||
| -rw-r--r-- | src/go/plugin/go.d/modules/mysql/testdata/mariadb/v10.8.4/global_status.txt (renamed from src/go/collectors/go.d.plugin/modules/mysql/testdata/mariadb/v10.8.4/global_status.txt) | 0 | ||||
| -rw-r--r-- | src/go/plugin/go.d/modules/mysql/testdata/mariadb/v10.8.4/global_variables.txt (renamed from src/go/collectors/go.d.plugin/modules/mysql/testdata/mariadb/v10.8.4/global_variables.txt) | 0 | ||||
| -rw-r--r-- | src/go/plugin/go.d/modules/mysql/testdata/mariadb/v10.8.4/process_list.txt (renamed from src/go/collectors/go.d.plugin/modules/mysql/testdata/mariadb/v10.8.4/process_list.txt) | 0 | ||||
| -rw-r--r-- | src/go/plugin/go.d/modules/mysql/testdata/mariadb/v10.8.4/user_statistics.txt (renamed from src/go/collectors/go.d.plugin/modules/mysql/testdata/mariadb/v10.8.4/user_statistics.txt) | 0 | ||||
| -rw-r--r-- | src/go/plugin/go.d/modules/mysql/testdata/mariadb/v10.8.4/version.txt (renamed from src/go/collectors/go.d.plugin/modules/mysql/testdata/mariadb/v10.8.4/version.txt) | 0 | ||||
| -rw-r--r-- | src/go/plugin/go.d/modules/mysql/testdata/mariadb/v5.5.64/global_status.txt (renamed from src/go/collectors/go.d.plugin/modules/mysql/testdata/mariadb/v5.5.64/global_status.txt) | 0 | ||||
| -rw-r--r-- | src/go/plugin/go.d/modules/mysql/testdata/mariadb/v5.5.64/global_variables.txt (renamed from src/go/collectors/go.d.plugin/modules/mysql/testdata/mariadb/v5.5.64/global_variables.txt) | 0 | ||||
| -rw-r--r-- | src/go/plugin/go.d/modules/mysql/testdata/mariadb/v5.5.64/process_list.txt (renamed from src/go/collectors/go.d.plugin/modules/mysql/testdata/mariadb/v5.5.64/process_list.txt) | 0 | ||||
| -rw-r--r-- | src/go/plugin/go.d/modules/mysql/testdata/mariadb/v5.5.64/version.txt (renamed from src/go/collectors/go.d.plugin/modules/mysql/testdata/mariadb/v5.5.64/version.txt) | 0 | ||||
| -rw-r--r-- | src/go/plugin/go.d/modules/mysql/testdata/mysql/v8.0.30/global_status.txt (renamed from src/go/collectors/go.d.plugin/modules/mysql/testdata/mysql/v8.0.30/global_status.txt) | 0 | ||||
| -rw-r--r-- | src/go/plugin/go.d/modules/mysql/testdata/mysql/v8.0.30/global_variables.txt (renamed from src/go/collectors/go.d.plugin/modules/mysql/testdata/mysql/v8.0.30/global_variables.txt) | 0 | ||||
| -rw-r--r-- | src/go/plugin/go.d/modules/mysql/testdata/mysql/v8.0.30/process_list.txt (renamed from src/go/collectors/go.d.plugin/modules/mysql/testdata/mysql/v8.0.30/process_list.txt) | 0 | ||||
| -rw-r--r-- | src/go/plugin/go.d/modules/mysql/testdata/mysql/v8.0.30/replica_status_multi_source.txt (renamed from src/go/collectors/go.d.plugin/modules/mysql/testdata/mysql/v8.0.30/replica_status_multi_source.txt) | 0 | ||||
| -rw-r--r-- | src/go/plugin/go.d/modules/mysql/testdata/mysql/v8.0.30/version.txt (renamed from src/go/collectors/go.d.plugin/modules/mysql/testdata/mysql/v8.0.30/version.txt) | 0 | ||||
| -rw-r--r-- | src/go/plugin/go.d/modules/mysql/testdata/percona/v8.0.29/global_status.txt (renamed from src/go/collectors/go.d.plugin/modules/mysql/testdata/percona/v8.0.29/global_status.txt) | 0 | ||||
| -rw-r--r-- | src/go/plugin/go.d/modules/mysql/testdata/percona/v8.0.29/global_variables.txt (renamed from src/go/collectors/go.d.plugin/modules/mysql/testdata/percona/v8.0.29/global_variables.txt) | 0 | ||||
| -rw-r--r-- | src/go/plugin/go.d/modules/mysql/testdata/percona/v8.0.29/process_list.txt (renamed from src/go/collectors/go.d.plugin/modules/mysql/testdata/percona/v8.0.29/process_list.txt) | 0 | ||||
| -rw-r--r-- | src/go/plugin/go.d/modules/mysql/testdata/percona/v8.0.29/user_statistics.txt (renamed from src/go/collectors/go.d.plugin/modules/mysql/testdata/percona/v8.0.29/user_statistics.txt) | 0 | ||||
| -rw-r--r-- | src/go/plugin/go.d/modules/mysql/testdata/percona/v8.0.29/version.txt (renamed from src/go/collectors/go.d.plugin/modules/mysql/testdata/percona/v8.0.29/version.txt) | 0 | ||||
| -rw-r--r-- | src/go/plugin/go.d/modules/mysql/testdata/session_variables.txt (renamed from src/go/collectors/go.d.plugin/modules/mysql/testdata/session_variables.txt) | 0 | ||||
| l--------- | src/go/plugin/go.d/modules/nginx/README.md (renamed from src/go/collectors/go.d.plugin/modules/nginx/README.md) | 0 | ||||
| -rw-r--r-- | src/go/plugin/go.d/modules/nginx/apiclient.go (renamed from src/go/collectors/go.d.plugin/modules/nginx/apiclient.go) | 2 | ||||
| -rw-r--r-- | src/go/plugin/go.d/modules/nginx/charts.go (renamed from src/go/collectors/go.d.plugin/modules/nginx/charts.go) | 2 | ||||
| -rw-r--r-- | src/go/plugin/go.d/modules/nginx/collect.go (renamed from src/go/collectors/go.d.plugin/modules/nginx/collect.go) | 2 | ||||
| -rw-r--r-- | src/go/plugin/go.d/modules/nginx/config_schema.json (renamed from src/go/collectors/go.d.plugin/modules/nginx/config_schema.json) | 6 | ||||
| -rw-r--r-- | src/go/plugin/go.d/modules/nginx/integrations/nginx.md (renamed from src/go/collectors/go.d.plugin/modules/nginx/integrations/nginx.md) | 39 | ||||
| -rw-r--r-- | src/go/plugin/go.d/modules/nginx/metadata.yaml (renamed from src/go/collectors/go.d.plugin/modules/nginx/metadata.yaml) | 0 | ||||
| -rw-r--r-- | src/go/plugin/go.d/modules/nginx/metrics.go (renamed from src/go/collectors/go.d.plugin/modules/nginx/metrics.go) | 0 | ||||
| -rw-r--r-- | src/go/plugin/go.d/modules/nginx/nginx.go (renamed from src/go/collectors/go.d.plugin/modules/nginx/nginx.go) | 4 | ||||
| -rw-r--r-- | src/go/plugin/go.d/modules/nginx/nginx_test.go (renamed from src/go/collectors/go.d.plugin/modules/nginx/nginx_test.go) | 2 | ||||
| -rw-r--r-- | src/go/plugin/go.d/modules/nginx/testdata/config.json (renamed from src/go/collectors/go.d.plugin/modules/nginxvts/testdata/config.json) | 0 | ||||
| -rw-r--r-- | src/go/plugin/go.d/modules/nginx/testdata/config.yaml (renamed from src/go/collectors/go.d.plugin/modules/nginxvts/testdata/config.yaml) | 0 | ||||
| -rw-r--r-- | src/go/plugin/go.d/modules/nginx/testdata/status.txt (renamed from src/go/collectors/go.d.plugin/modules/nginx/testdata/status.txt) | 0 | ||||
| -rw-r--r-- | src/go/plugin/go.d/modules/nginx/testdata/tengine-status.txt (renamed from src/go/collectors/go.d.plugin/modules/nginx/testdata/tengine-status.txt) | 0 | ||||
| l--------- | src/go/plugin/go.d/modules/nginxplus/README.md (renamed from src/go/collectors/go.d.plugin/modules/nginxplus/README.md) | 0 | ||||
| -rw-r--r-- | src/go/plugin/go.d/modules/nginxplus/cache.go (renamed from src/go/collectors/go.d.plugin/modules/nginxplus/cache.go) | 0 | ||||
| -rw-r--r-- | src/go/plugin/go.d/modules/nginxplus/charts.go (renamed from src/go/collectors/go.d.plugin/modules/nginxplus/charts.go) | 2 | ||||
| -rw-r--r-- | src/go/plugin/go.d/modules/nginxplus/collect.go (renamed from src/go/collectors/go.d.plugin/modules/nginxplus/collect.go) | 0 | ||||
| -rw-r--r-- | src/go/plugin/go.d/modules/nginxplus/config_schema.json (renamed from src/go/collectors/go.d.plugin/modules/nginxplus/config_schema.json) | 6 | ||||
| -rw-r--r-- | src/go/plugin/go.d/modules/nginxplus/integrations/nginx_plus.md (renamed from src/go/collectors/go.d.plugin/modules/nginxplus/integrations/nginx_plus.md) | 39 | ||||
| -rw-r--r-- | src/go/plugin/go.d/modules/nginxplus/metadata.yaml (renamed from src/go/collectors/go.d.plugin/modules/nginxplus/metadata.yaml) | 0 | ||||
| -rw-r--r-- | src/go/plugin/go.d/modules/nginxplus/nginx_http_api.go (renamed from src/go/collectors/go.d.plugin/modules/nginxplus/nginx_http_api.go) | 0 | ||||
| -rw-r--r-- | src/go/plugin/go.d/modules/nginxplus/nginx_http_api_query.go (renamed from src/go/collectors/go.d.plugin/modules/nginxplus/nginx_http_api_query.go) | 47 | ||||
| -rw-r--r-- | src/go/plugin/go.d/modules/nginxplus/nginxplus.go (renamed from src/go/collectors/go.d.plugin/modules/nginxplus/nginxplus.go) | 4 | ||||
| -rw-r--r-- | src/go/plugin/go.d/modules/nginxplus/nginxplus_test.go (renamed from src/go/collectors/go.d.plugin/modules/nginxplus/nginxplus_test.go) | 4 | ||||
| -rw-r--r-- | src/go/plugin/go.d/modules/nginxplus/testdata/404.json (renamed from src/go/collectors/go.d.plugin/modules/nginxplus/testdata/404.json) | 0 | ||||
| -rw-r--r-- | src/go/plugin/go.d/modules/nginxplus/testdata/api-8/api_versions.json (renamed from src/go/collectors/go.d.plugin/modules/nginxplus/testdata/api-8/api_versions.json) | 0 | ||||
| -rw-r--r-- | src/go/plugin/go.d/modules/nginxplus/testdata/api-8/connections.json (renamed from src/go/collectors/go.d.plugin/modules/nginxplus/testdata/api-8/connections.json) | 0 | ||||
| -rw-r--r-- | src/go/plugin/go.d/modules/nginxplus/testdata/api-8/endpoints_http.json (renamed from src/go/collectors/go.d.plugin/modules/nginxplus/testdata/api-8/endpoints_http.json) | 0 | ||||
| -rw-r--r-- | src/go/plugin/go.d/modules/nginxplus/testdata/api-8/endpoints_root.json (renamed from src/go/collectors/go.d.plugin/modules/nginxplus/testdata/api-8/endpoints_root.json) | 0 | ||||
| -rw-r--r-- | src/go/plugin/go.d/modules/nginxplus/testdata/api-8/endpoints_stream.json (renamed from src/go/collectors/go.d.plugin/modules/nginxplus/testdata/api-8/endpoints_stream.json) | 0 | ||||
| -rw-r--r-- | src/go/plugin/go.d/modules/nginxplus/testdata/api-8/http_caches.json (renamed from src/go/collectors/go.d.plugin/modules/nginxplus/testdata/api-8/http_caches.json) | 0 | ||||
| -rw-r--r-- | src/go/plugin/go.d/modules/nginxplus/testdata/api-8/http_location_zones.json (renamed from src/go/collectors/go.d.plugin/modules/nginxplus/testdata/api-8/http_location_zones.json) | 0 | ||||
| -rw-r--r-- | src/go/plugin/go.d/modules/nginxplus/testdata/api-8/http_requests.json (renamed from src/go/collectors/go.d.plugin/modules/nginxplus/testdata/api-8/http_requests.json) | 0 | ||||
| -rw-r--r-- | src/go/plugin/go.d/modules/nginxplus/testdata/api-8/http_server_zones.json (renamed from src/go/collectors/go.d.plugin/modules/nginxplus/testdata/api-8/http_server_zones.json) | 0 | ||||
| -rw-r--r-- | src/go/plugin/go.d/modules/nginxplus/testdata/api-8/http_upstreams.json (renamed from src/go/collectors/go.d.plugin/modules/nginxplus/testdata/api-8/http_upstreams.json) | 0 | ||||
| -rw-r--r-- | src/go/plugin/go.d/modules/nginxplus/testdata/api-8/nginx.json (renamed from src/go/collectors/go.d.plugin/modules/nginxplus/testdata/api-8/nginx.json) | 0 | ||||
| -rw-r--r-- | src/go/plugin/go.d/modules/nginxplus/testdata/api-8/resolvers.json (renamed from src/go/collectors/go.d.plugin/modules/nginxplus/testdata/api-8/resolvers.json) | 0 | ||||
| -rw-r--r-- | src/go/plugin/go.d/modules/nginxplus/testdata/api-8/ssl.json (renamed from src/go/collectors/go.d.plugin/modules/nginxplus/testdata/api-8/ssl.json) | 0 | ||||
| -rw-r--r-- | src/go/plugin/go.d/modules/nginxplus/testdata/api-8/stream_server_zones.json (renamed from src/go/collectors/go.d.plugin/modules/nginxplus/testdata/api-8/stream_server_zones.json) | 0 | ||||
| -rw-r--r-- | src/go/plugin/go.d/modules/nginxplus/testdata/api-8/stream_upstreams.json (renamed from src/go/collectors/go.d.plugin/modules/nginxplus/testdata/api-8/stream_upstreams.json) | 0 | ||||
| -rw-r--r-- | src/go/plugin/go.d/modules/nginxplus/testdata/config.json (renamed from src/go/collectors/go.d.plugin/modules/phpdaemon/testdata/config.json) | 0 | ||||
| -rw-r--r-- | src/go/plugin/go.d/modules/nginxplus/testdata/config.yaml (renamed from src/go/collectors/go.d.plugin/modules/phpdaemon/testdata/config.yaml) | 0 | ||||
| l--------- | src/go/plugin/go.d/modules/nginxvts/README.md (renamed from src/go/collectors/go.d.plugin/modules/nginxvts/README.md) | 0 | ||||
| -rw-r--r-- | src/go/plugin/go.d/modules/nginxvts/charts.go (renamed from src/go/collectors/go.d.plugin/modules/nginxvts/charts.go) | 2 | ||||
| -rw-r--r-- | src/go/plugin/go.d/modules/nginxvts/collect.go (renamed from src/go/collectors/go.d.plugin/modules/nginxvts/collect.go) | 4 | ||||
| -rw-r--r-- | src/go/plugin/go.d/modules/nginxvts/config_schema.json (renamed from src/go/collectors/go.d.plugin/modules/nginxvts/config_schema.json) | 6 | ||||
| -rw-r--r-- | src/go/plugin/go.d/modules/nginxvts/init.go (renamed from src/go/collectors/go.d.plugin/modules/nginxvts/init.go) | 4 | ||||
| -rw-r--r-- | src/go/plugin/go.d/modules/nginxvts/integrations/nginx_vts.md (renamed from src/go/collectors/go.d.plugin/modules/nginxvts/integrations/nginx_vts.md) | 39 | ||||
| -rw-r--r-- | src/go/plugin/go.d/modules/nginxvts/metadata.yaml (renamed from src/go/collectors/go.d.plugin/modules/nginxvts/metadata.yaml) | 0 | ||||
| -rw-r--r-- | src/go/plugin/go.d/modules/nginxvts/metrics.go (renamed from src/go/collectors/go.d.plugin/modules/nginxvts/metrics.go) | 0 | ||||
| -rw-r--r-- | src/go/plugin/go.d/modules/nginxvts/nginxvts.go (renamed from src/go/collectors/go.d.plugin/modules/nginxvts/nginxvts.go) | 4 | ||||
| -rw-r--r-- | src/go/plugin/go.d/modules/nginxvts/nginxvts_test.go (renamed from src/go/collectors/go.d.plugin/modules/nginxvts/nginxvts_test.go) | 6 | ||||
| -rw-r--r-- | src/go/plugin/go.d/modules/nginxvts/testdata/config.json (renamed from src/go/collectors/go.d.plugin/modules/powerdns/testdata/config.json) | 0 | ||||
| -rw-r--r-- | src/go/plugin/go.d/modules/nginxvts/testdata/config.yaml (renamed from src/go/collectors/go.d.plugin/modules/powerdns/testdata/config.yaml) | 0 | ||||
| -rw-r--r-- | src/go/plugin/go.d/modules/nginxvts/testdata/vts-v0.1.18.json (renamed from src/go/collectors/go.d.plugin/modules/nginxvts/testdata/vts-v0.1.18.json) | 0 | ||||
| l--------- | src/go/plugin/go.d/modules/nsd/README.md | 1 | ||||
| -rw-r--r-- | src/go/plugin/go.d/modules/nsd/charts.go | 249 | ||||
| -rw-r--r-- | src/go/plugin/go.d/modules/nsd/collect.go | 81 | ||||
| -rw-r--r-- | src/go/plugin/go.d/modules/nsd/config_schema.json | 35 | ||||
| -rw-r--r-- | src/go/plugin/go.d/modules/nsd/exec.go | 47 | ||||
| -rw-r--r-- | src/go/plugin/go.d/modules/nsd/init.go | 23 | ||||
| -rw-r--r-- | src/go/plugin/go.d/modules/nsd/integrations/nsd.md | 203 | ||||
| -rw-r--r-- | src/go/plugin/go.d/modules/nsd/metadata.yaml | 272 | ||||
| -rw-r--r-- | src/go/plugin/go.d/modules/nsd/nsd.go | 97 | ||||
| -rw-r--r-- | src/go/plugin/go.d/modules/nsd/nsd_test.go | 337 | ||||
| -rw-r--r-- | src/go/plugin/go.d/modules/nsd/stats_counters.go | 123 | ||||
| -rw-r--r-- | src/go/plugin/go.d/modules/nsd/testdata/config.json (renamed from src/go/collectors/go.d.plugin/modules/storcli/testdata/config.json) | 0 | ||||
| -rw-r--r-- | src/go/plugin/go.d/modules/nsd/testdata/config.yaml (renamed from src/go/collectors/go.d.plugin/modules/storcli/testdata/config.yaml) | 0 | ||||
| -rw-r--r-- | src/go/plugin/go.d/modules/nsd/testdata/stats.txt | 95 | ||||
| l--------- | src/go/plugin/go.d/modules/ntpd/README.md (renamed from src/go/collectors/go.d.plugin/modules/ntpd/README.md) | 0 | ||||
| -rw-r--r-- | src/go/plugin/go.d/modules/ntpd/charts.go (renamed from src/go/collectors/go.d.plugin/modules/ntpd/charts.go) | 2 | ||||
| -rw-r--r-- | src/go/plugin/go.d/modules/ntpd/client.go (renamed from src/go/collectors/go.d.plugin/modules/ntpd/client.go) | 0 | ||||
| -rw-r--r-- | src/go/plugin/go.d/modules/ntpd/collect.go (renamed from src/go/collectors/go.d.plugin/modules/ntpd/collect.go) | 0 | ||||
| -rw-r--r-- | src/go/plugin/go.d/modules/ntpd/config_schema.json (renamed from src/go/collectors/go.d.plugin/modules/ntpd/config_schema.json) | 0 | ||||
| -rw-r--r-- | src/go/plugin/go.d/modules/ntpd/integrations/ntpd.md (renamed from src/go/collectors/go.d.plugin/modules/ntpd/integrations/ntpd.md) | 39 | ||||
| -rw-r--r-- | src/go/plugin/go.d/modules/ntpd/metadata.yaml (renamed from src/go/collectors/go.d.plugin/modules/ntpd/metadata.yaml) | 0 | ||||
| -rw-r--r-- | src/go/plugin/go.d/modules/ntpd/ntpd.go (renamed from src/go/collectors/go.d.plugin/modules/ntpd/ntpd.go) | 6 | ||||
| -rw-r--r-- | src/go/plugin/go.d/modules/ntpd/ntpd_test.go (renamed from src/go/collectors/go.d.plugin/modules/ntpd/ntpd_test.go) | 2 | ||||
| -rw-r--r-- | src/go/plugin/go.d/modules/ntpd/testdata/config.json (renamed from src/go/collectors/go.d.plugin/modules/ntpd/testdata/config.json) | 0 | ||||
| -rw-r--r-- | src/go/plugin/go.d/modules/ntpd/testdata/config.yaml (renamed from src/go/collectors/go.d.plugin/modules/ntpd/testdata/config.yaml) | 0 | ||||
| l--------- | src/go/plugin/go.d/modules/nvidia_smi/README.md (renamed from src/go/collectors/go.d.plugin/modules/nvidia_smi/README.md) | 0 | ||||
| -rw-r--r-- | src/go/plugin/go.d/modules/nvidia_smi/charts.go (renamed from src/go/collectors/go.d.plugin/modules/nvidia_smi/charts.go) | 49 | ||||
| -rw-r--r-- | src/go/plugin/go.d/modules/nvidia_smi/collect.go (renamed from src/go/collectors/go.d.plugin/modules/nvidia_smi/collect_xml.go) | 177 | ||||
| -rw-r--r-- | src/go/plugin/go.d/modules/nvidia_smi/config_schema.json | 56 | ||||
| -rw-r--r-- | src/go/plugin/go.d/modules/nvidia_smi/exec.go | 213 | ||||
| -rw-r--r-- | src/go/plugin/go.d/modules/nvidia_smi/gpu_info.go | 121 | ||||
| -rw-r--r-- | src/go/plugin/go.d/modules/nvidia_smi/init.go (renamed from src/go/collectors/go.d.plugin/modules/nvidia_smi/init.go) | 4 | ||||
| -rw-r--r-- | src/go/plugin/go.d/modules/nvidia_smi/integrations/nvidia_gpu.md (renamed from src/go/collectors/go.d.plugin/modules/nvidia_smi/integrations/nvidia_gpu.md) | 107 | ||||
| -rw-r--r-- | src/go/plugin/go.d/modules/nvidia_smi/metadata.yaml (renamed from src/go/collectors/go.d.plugin/modules/nvidia_smi/metadata.yaml) | 72 | ||||
| -rw-r--r-- | src/go/plugin/go.d/modules/nvidia_smi/nvidia_smi.go | 114 | ||||
| -rw-r--r-- | src/go/plugin/go.d/modules/nvidia_smi/nvidia_smi_test.go (renamed from src/go/collectors/go.d.plugin/modules/nvidia_smi/nvidia_smi_test.go) | 236 | ||||
| -rw-r--r-- | src/go/plugin/go.d/modules/nvidia_smi/testdata/a100-sxm4-mig.xml (renamed from src/go/collectors/go.d.plugin/modules/nvidia_smi/testdata/a100-sxm4-mig.xml) | 0 | ||||
| -rw-r--r-- | src/go/plugin/go.d/modules/nvidia_smi/testdata/config.json (renamed from src/go/collectors/go.d.plugin/modules/nvidia_smi/testdata/config.json) | 2 | ||||
| -rw-r--r-- | src/go/plugin/go.d/modules/nvidia_smi/testdata/config.yaml (renamed from src/go/collectors/go.d.plugin/modules/nvidia_smi/testdata/config.yaml) | 2 | ||||
| -rw-r--r-- | src/go/plugin/go.d/modules/nvidia_smi/testdata/rtx-2080-win.xml (renamed from src/go/collectors/go.d.plugin/modules/nvidia_smi/testdata/rtx-2080-win.xml) | 0 | ||||
| -rw-r--r-- | src/go/plugin/go.d/modules/nvidia_smi/testdata/rtx-3060.xml (renamed from src/go/collectors/go.d.plugin/modules/nvidia_smi/testdata/rtx-3060.xml) | 0 | ||||
| -rw-r--r-- | src/go/plugin/go.d/modules/nvidia_smi/testdata/rtx-4090-driver-535.xml (renamed from src/go/collectors/go.d.plugin/modules/nvidia_smi/testdata/rtx-4090-driver-535.xml) | 0 | ||||
| -rw-r--r-- | src/go/plugin/go.d/modules/nvidia_smi/testdata/tesla-p100.xml (renamed from src/go/collectors/go.d.plugin/modules/nvidia_smi/testdata/tesla-p100.xml) | 0 | ||||
| l--------- | src/go/plugin/go.d/modules/nvme/README.md (renamed from src/go/collectors/go.d.plugin/modules/nvme/README.md) | 0 | ||||
| -rw-r--r-- | src/go/plugin/go.d/modules/nvme/charts.go (renamed from src/go/collectors/go.d.plugin/modules/nvme/charts.go) | 2 | ||||
| -rw-r--r-- | src/go/plugin/go.d/modules/nvme/collect.go (renamed from src/go/collectors/go.d.plugin/modules/nvme/collect.go) | 0 | ||||
| -rw-r--r-- | src/go/plugin/go.d/modules/nvme/config_schema.json (renamed from src/go/collectors/go.d.plugin/modules/nvme/config_schema.json) | 0 | ||||
| -rw-r--r-- | src/go/plugin/go.d/modules/nvme/exec.go (renamed from src/go/collectors/go.d.plugin/modules/nvme/exec.go) | 0 | ||||
| -rw-r--r-- | src/go/plugin/go.d/modules/nvme/init.go (renamed from src/go/collectors/go.d.plugin/modules/nvme/init.go) | 2 | ||||
| -rw-r--r-- | src/go/plugin/go.d/modules/nvme/integrations/nvme_devices.md (renamed from src/go/collectors/go.d.plugin/modules/nvme/integrations/nvme_devices.md) | 39 | ||||
| -rw-r--r-- | src/go/plugin/go.d/modules/nvme/metadata.yaml (renamed from src/go/collectors/go.d.plugin/modules/nvme/metadata.yaml) | 0 | ||||
| -rw-r--r-- | src/go/plugin/go.d/modules/nvme/nvme.go (renamed from src/go/collectors/go.d.plugin/modules/nvme/nvme.go) | 4 | ||||
| -rw-r--r-- | src/go/plugin/go.d/modules/nvme/nvme_test.go (renamed from src/go/collectors/go.d.plugin/modules/nvme/nvme_test.go) | 2 | ||||
| -rw-r--r-- | src/go/plugin/go.d/modules/nvme/testdata/config.json | 4 | ||||
| -rw-r--r-- | src/go/plugin/go.d/modules/nvme/testdata/config.yaml | 2 | ||||
| -rw-r--r-- | src/go/plugin/go.d/modules/nvme/testdata/nvme-list-empty.json (renamed from src/go/collectors/go.d.plugin/modules/nvme/testdata/nvme-list-empty.json) | 0 | ||||
| -rw-r--r-- | src/go/plugin/go.d/modules/nvme/testdata/nvme-list.json (renamed from src/go/collectors/go.d.plugin/modules/nvme/testdata/nvme-list.json) | 0 | ||||
| -rw-r--r-- | src/go/plugin/go.d/modules/nvme/testdata/nvme-smart-log-float.json (renamed from src/go/collectors/go.d.plugin/modules/nvme/testdata/nvme-smart-log-float.json) | 0 | ||||
| -rw-r--r-- | src/go/plugin/go.d/modules/nvme/testdata/nvme-smart-log-string.json (renamed from src/go/collectors/go.d.plugin/modules/nvme/testdata/nvme-smart-log-string.json) | 0 | ||||
| -rw-r--r-- | src/go/plugin/go.d/modules/nvme/testdata/nvme-smart-log.json (renamed from src/go/collectors/go.d.plugin/modules/nvme/testdata/nvme-smart-log.json) | 0 | ||||
| l--------- | src/go/plugin/go.d/modules/openvpn/README.md (renamed from src/go/collectors/go.d.plugin/modules/openvpn/README.md) | 0 | ||||
| -rw-r--r-- | src/go/plugin/go.d/modules/openvpn/charts.go (renamed from src/go/collectors/go.d.plugin/modules/openvpn/charts.go) | 2 | ||||
| -rw-r--r-- | src/go/plugin/go.d/modules/openvpn/client/client.go (renamed from src/go/collectors/go.d.plugin/modules/openvpn/client/client.go) | 2 | ||||
| -rw-r--r-- | src/go/plugin/go.d/modules/openvpn/client/client_test.go (renamed from src/go/collectors/go.d.plugin/modules/openvpn/client/client_test.go) | 2 | ||||
| -rw-r--r-- | src/go/plugin/go.d/modules/openvpn/client/commands.go (renamed from src/go/collectors/go.d.plugin/modules/openvpn/client/commands.go) | 0 | ||||
| -rw-r--r-- | src/go/plugin/go.d/modules/openvpn/client/testdata/load-stats.txt (renamed from src/go/collectors/go.d.plugin/modules/openvpn/client/testdata/load-stats.txt) | 0 | ||||
| -rw-r--r-- | src/go/plugin/go.d/modules/openvpn/client/testdata/status3.txt (renamed from src/go/collectors/go.d.plugin/modules/openvpn/client/testdata/status3.txt) | 0 | ||||
| -rw-r--r-- | src/go/plugin/go.d/modules/openvpn/client/testdata/version.txt (renamed from src/go/collectors/go.d.plugin/modules/openvpn/client/testdata/version.txt) | 0 | ||||
| -rw-r--r-- | src/go/plugin/go.d/modules/openvpn/client/types.go (renamed from src/go/collectors/go.d.plugin/modules/openvpn/client/types.go) | 0 | ||||
| -rw-r--r-- | src/go/plugin/go.d/modules/openvpn/collect.go (renamed from src/go/collectors/go.d.plugin/modules/openvpn/collect.go) | 0 | ||||
| -rw-r--r-- | src/go/plugin/go.d/modules/openvpn/config_schema.json (renamed from src/go/collectors/go.d.plugin/modules/openvpn/config_schema.json) | 6 | ||||
| -rw-r--r-- | src/go/plugin/go.d/modules/openvpn/init.go (renamed from src/go/collectors/go.d.plugin/modules/openvpn/init.go) | 6 | ||||
| -rw-r--r-- | src/go/plugin/go.d/modules/openvpn/integrations/openvpn.md (renamed from src/go/collectors/go.d.plugin/modules/openvpn/integrations/openvpn.md) | 41 | ||||
| -rw-r--r-- | src/go/plugin/go.d/modules/openvpn/metadata.yaml (renamed from src/go/collectors/go.d.plugin/modules/openvpn/metadata.yaml) | 4 | ||||
| -rw-r--r-- | src/go/plugin/go.d/modules/openvpn/openvpn.go (renamed from src/go/collectors/go.d.plugin/modules/openvpn/openvpn.go) | 10 | ||||
| -rw-r--r-- | src/go/plugin/go.d/modules/openvpn/openvpn_test.go (renamed from src/go/collectors/go.d.plugin/modules/openvpn/openvpn_test.go) | 8 | ||||
| -rw-r--r-- | src/go/plugin/go.d/modules/openvpn/testdata/config.json (renamed from src/go/collectors/go.d.plugin/modules/openvpn/testdata/config.json) | 0 | ||||
| -rw-r--r-- | src/go/plugin/go.d/modules/openvpn/testdata/config.yaml (renamed from src/go/collectors/go.d.plugin/modules/openvpn/testdata/config.yaml) | 0 | ||||
| l--------- | src/go/plugin/go.d/modules/openvpn_status_log/README.md (renamed from src/go/collectors/go.d.plugin/modules/openvpn_status_log/README.md) | 0 | ||||
| -rw-r--r-- | src/go/plugin/go.d/modules/openvpn_status_log/charts.go (renamed from src/go/collectors/go.d.plugin/modules/openvpn_status_log/charts.go) | 2 | ||||
| -rw-r--r-- | src/go/plugin/go.d/modules/openvpn_status_log/collect.go (renamed from src/go/collectors/go.d.plugin/modules/openvpn_status_log/collect.go) | 0 | ||||
| -rw-r--r-- | src/go/plugin/go.d/modules/openvpn_status_log/config_schema.json (renamed from src/go/collectors/go.d.plugin/modules/openvpn_status_log/config_schema.json) | 4 | ||||
| -rw-r--r-- | src/go/plugin/go.d/modules/openvpn_status_log/init.go (renamed from src/go/collectors/go.d.plugin/modules/openvpn_status_log/init.go) | 2 | ||||
| -rw-r--r-- | src/go/plugin/go.d/modules/openvpn_status_log/integrations/openvpn_status_log.md (renamed from src/go/collectors/go.d.plugin/modules/openvpn_status_log/integrations/openvpn_status_log.md) | 39 | ||||
| -rw-r--r-- | src/go/plugin/go.d/modules/openvpn_status_log/metadata.yaml (renamed from src/go/collectors/go.d.plugin/modules/openvpn_status_log/metadata.yaml) | 2 | ||||
| -rw-r--r-- | src/go/plugin/go.d/modules/openvpn_status_log/openvpn.go (renamed from src/go/collectors/go.d.plugin/modules/openvpn_status_log/openvpn.go) | 4 | ||||
| -rw-r--r-- | src/go/plugin/go.d/modules/openvpn_status_log/openvpn_test.go (renamed from src/go/collectors/go.d.plugin/modules/openvpn_status_log/openvpn_test.go) | 4 | ||||
| -rw-r--r-- | src/go/plugin/go.d/modules/openvpn_status_log/parser.go (renamed from src/go/collectors/go.d.plugin/modules/openvpn_status_log/parser.go) | 0 | ||||
| -rw-r--r-- | src/go/plugin/go.d/modules/openvpn_status_log/testdata/config.json (renamed from src/go/collectors/go.d.plugin/modules/openvpn_status_log/testdata/config.json) | 0 | ||||
| -rw-r--r-- | src/go/plugin/go.d/modules/openvpn_status_log/testdata/config.yaml (renamed from src/go/collectors/go.d.plugin/modules/openvpn_status_log/testdata/config.yaml) | 0 | ||||
| -rw-r--r-- | src/go/plugin/go.d/modules/openvpn_status_log/testdata/empty.txt (renamed from src/go/collectors/go.d.plugin/modules/openvpn_status_log/testdata/empty.txt) | 0 | ||||
| -rw-r--r-- | src/go/plugin/go.d/modules/openvpn_status_log/testdata/v2.5.1/static-key.txt (renamed from src/go/collectors/go.d.plugin/modules/openvpn_status_log/testdata/v2.5.1/static-key.txt) | 0 | ||||
| -rw-r--r-- | src/go/plugin/go.d/modules/openvpn_status_log/testdata/v2.5.1/version1-no-clients.txt (renamed from src/go/collectors/go.d.plugin/modules/openvpn_status_log/testdata/v2.5.1/version1-no-clients.txt) | 0 | ||||
| -rw-r--r-- | src/go/plugin/go.d/modules/openvpn_status_log/testdata/v2.5.1/version1.txt (renamed from src/go/collectors/go.d.plugin/modules/openvpn_status_log/testdata/v2.5.1/version1.txt) | 0 | ||||
| -rw-r--r-- | src/go/plugin/go.d/modules/openvpn_status_log/testdata/v2.5.1/version2-no-clients.txt (renamed from src/go/collectors/go.d.plugin/modules/openvpn_status_log/testdata/v2.5.1/version2-no-clients.txt) | 0 | ||||
| -rw-r--r-- | src/go/plugin/go.d/modules/openvpn_status_log/testdata/v2.5.1/version2.txt (renamed from src/go/collectors/go.d.plugin/modules/openvpn_status_log/testdata/v2.5.1/version2.txt) | 0 | ||||
| -rw-r--r-- | src/go/plugin/go.d/modules/openvpn_status_log/testdata/v2.5.1/version3-no-clients.txt (renamed from src/go/collectors/go.d.plugin/modules/openvpn_status_log/testdata/v2.5.1/version3-no-clients.txt) | 0 | ||||
| -rw-r--r-- | src/go/plugin/go.d/modules/openvpn_status_log/testdata/v2.5.1/version3.txt (renamed from src/go/collectors/go.d.plugin/modules/openvpn_status_log/testdata/v2.5.1/version3.txt) | 0 | ||||
| l--------- | src/go/plugin/go.d/modules/pgbouncer/README.md (renamed from src/go/collectors/go.d.plugin/modules/pgbouncer/README.md) | 0 | ||||
| -rw-r--r-- | src/go/plugin/go.d/modules/pgbouncer/charts.go (renamed from src/go/collectors/go.d.plugin/modules/pgbouncer/charts.go) | 2 | ||||
| -rw-r--r-- | src/go/plugin/go.d/modules/pgbouncer/collect.go (renamed from src/go/collectors/go.d.plugin/modules/pgbouncer/collect.go) | 0 | ||||
| -rw-r--r-- | src/go/plugin/go.d/modules/pgbouncer/config_schema.json (renamed from src/go/collectors/go.d.plugin/modules/pgbouncer/config_schema.json) | 0 | ||||
| -rw-r--r-- | src/go/plugin/go.d/modules/pgbouncer/init.go (renamed from src/go/collectors/go.d.plugin/modules/pgbouncer/init.go) | 0 | ||||
| -rw-r--r-- | src/go/plugin/go.d/modules/pgbouncer/integrations/pgbouncer.md (renamed from src/go/collectors/go.d.plugin/modules/pgbouncer/integrations/pgbouncer.md) | 39 | ||||
| -rw-r--r-- | src/go/plugin/go.d/modules/pgbouncer/metadata.yaml (renamed from src/go/collectors/go.d.plugin/modules/pgbouncer/metadata.yaml) | 0 | ||||
| -rw-r--r-- | src/go/plugin/go.d/modules/pgbouncer/metrics.go (renamed from src/go/collectors/go.d.plugin/modules/pgbouncer/metrics.go) | 0 | ||||
| -rw-r--r-- | src/go/plugin/go.d/modules/pgbouncer/pgbouncer.go (renamed from src/go/collectors/go.d.plugin/modules/pgbouncer/pgbouncer.go) | 4 | ||||
| -rw-r--r-- | src/go/plugin/go.d/modules/pgbouncer/pgbouncer_test.go (renamed from src/go/collectors/go.d.plugin/modules/pgbouncer/pgbouncer_test.go) | 2 | ||||
| -rw-r--r-- | src/go/plugin/go.d/modules/pgbouncer/testdata/config.json (renamed from src/go/collectors/go.d.plugin/modules/pgbouncer/testdata/config.json) | 0 | ||||
| -rw-r--r-- | src/go/plugin/go.d/modules/pgbouncer/testdata/config.yaml (renamed from src/go/collectors/go.d.plugin/modules/pgbouncer/testdata/config.yaml) | 0 | ||||
| -rw-r--r-- | src/go/plugin/go.d/modules/pgbouncer/testdata/v1.17.0/config.txt (renamed from src/go/collectors/go.d.plugin/modules/pgbouncer/testdata/v1.17.0/config.txt) | 0 | ||||
| -rw-r--r-- | src/go/plugin/go.d/modules/pgbouncer/testdata/v1.17.0/databases.txt (renamed from src/go/collectors/go.d.plugin/modules/pgbouncer/testdata/v1.17.0/databases.txt) | 0 | ||||
| -rw-r--r-- | src/go/plugin/go.d/modules/pgbouncer/testdata/v1.17.0/pools.txt (renamed from src/go/collectors/go.d.plugin/modules/pgbouncer/testdata/v1.17.0/pools.txt) | 0 | ||||
| -rw-r--r-- | src/go/plugin/go.d/modules/pgbouncer/testdata/v1.17.0/stats.txt (renamed from src/go/collectors/go.d.plugin/modules/pgbouncer/testdata/v1.17.0/stats.txt) | 0 | ||||
| -rw-r--r-- | src/go/plugin/go.d/modules/pgbouncer/testdata/v1.17.0/version.txt (renamed from src/go/collectors/go.d.plugin/modules/pgbouncer/testdata/v1.17.0/version.txt) | 0 | ||||
| -rw-r--r-- | src/go/plugin/go.d/modules/pgbouncer/testdata/v1.7.0/version.txt (renamed from src/go/collectors/go.d.plugin/modules/pgbouncer/testdata/v1.7.0/version.txt) | 0 | ||||
| l--------- | src/go/plugin/go.d/modules/phpdaemon/README.md (renamed from src/go/collectors/go.d.plugin/modules/phpdaemon/README.md) | 0 | ||||
| -rw-r--r-- | src/go/plugin/go.d/modules/phpdaemon/charts.go (renamed from src/go/collectors/go.d.plugin/modules/phpdaemon/charts.go) | 2 | ||||
| -rw-r--r-- | src/go/plugin/go.d/modules/phpdaemon/client.go (renamed from src/go/collectors/go.d.plugin/modules/phpdaemon/client.go) | 2 | ||||
| -rw-r--r-- | src/go/plugin/go.d/modules/phpdaemon/collect.go (renamed from src/go/collectors/go.d.plugin/modules/phpdaemon/collect.go) | 2 | ||||
| -rw-r--r-- | src/go/plugin/go.d/modules/phpdaemon/config_schema.json (renamed from src/go/collectors/go.d.plugin/modules/phpdaemon/config_schema.json) | 6 | ||||
| -rw-r--r-- | src/go/plugin/go.d/modules/phpdaemon/init.go (renamed from src/go/collectors/go.d.plugin/modules/phpdaemon/init.go) | 2 | ||||
| -rw-r--r-- | src/go/plugin/go.d/modules/phpdaemon/integrations/phpdaemon.md (renamed from src/go/collectors/go.d.plugin/modules/phpdaemon/integrations/phpdaemon.md) | 39 | ||||
| -rw-r--r-- | src/go/plugin/go.d/modules/phpdaemon/metadata.yaml (renamed from src/go/collectors/go.d.plugin/modules/phpdaemon/metadata.yaml) | 0 | ||||
| -rw-r--r-- | src/go/plugin/go.d/modules/phpdaemon/metrics.go (renamed from src/go/collectors/go.d.plugin/modules/phpdaemon/metrics.go) | 0 | ||||
| -rw-r--r-- | src/go/plugin/go.d/modules/phpdaemon/phpdaemon.go (renamed from src/go/collectors/go.d.plugin/modules/phpdaemon/phpdaemon.go) | 4 | ||||
| -rw-r--r-- | src/go/plugin/go.d/modules/phpdaemon/phpdaemon_test.go (renamed from src/go/collectors/go.d.plugin/modules/phpdaemon/phpdaemon_test.go) | 2 | ||||
| -rw-r--r-- | src/go/plugin/go.d/modules/phpdaemon/testdata/config.json (renamed from src/go/collectors/go.d.plugin/modules/powerdns_recursor/testdata/config.json) | 0 | ||||
| -rw-r--r-- | src/go/plugin/go.d/modules/phpdaemon/testdata/config.yaml (renamed from src/go/collectors/go.d.plugin/modules/powerdns_recursor/testdata/config.yaml) | 0 | ||||
| -rw-r--r-- | src/go/plugin/go.d/modules/phpdaemon/testdata/fullstatus.json (renamed from src/go/collectors/go.d.plugin/modules/phpdaemon/testdata/fullstatus.json) | 0 | ||||
| l--------- | src/go/plugin/go.d/modules/phpfpm/README.md (renamed from src/go/collectors/go.d.plugin/modules/phpfpm/README.md) | 0 | ||||
| -rw-r--r-- | src/go/plugin/go.d/modules/phpfpm/charts.go (renamed from src/go/collectors/go.d.plugin/modules/phpfpm/charts.go) | 2 | ||||
| -rw-r--r-- | src/go/plugin/go.d/modules/phpfpm/client.go (renamed from src/go/collectors/go.d.plugin/modules/phpfpm/client.go) | 4 | ||||
| -rw-r--r-- | src/go/plugin/go.d/modules/phpfpm/collect.go (renamed from src/go/collectors/go.d.plugin/modules/phpfpm/collect.go) | 2 | ||||
| -rw-r--r-- | src/go/plugin/go.d/modules/phpfpm/config_schema.json (renamed from src/go/collectors/go.d.plugin/modules/phpfpm/config_schema.json) | 6 | ||||
| -rw-r--r-- | src/go/plugin/go.d/modules/phpfpm/decode.go (renamed from src/go/collectors/go.d.plugin/modules/phpfpm/decode.go) | 0 | ||||
| -rw-r--r-- | src/go/plugin/go.d/modules/phpfpm/init.go (renamed from src/go/collectors/go.d.plugin/modules/phpfpm/init.go) | 2 | ||||
| -rw-r--r-- | src/go/plugin/go.d/modules/phpfpm/integrations/php-fpm.md (renamed from src/go/collectors/go.d.plugin/modules/phpfpm/integrations/php-fpm.md) | 39 | ||||
| -rw-r--r-- | src/go/plugin/go.d/modules/phpfpm/metadata.yaml (renamed from src/go/collectors/go.d.plugin/modules/phpfpm/metadata.yaml) | 0 | ||||
| -rw-r--r-- | src/go/plugin/go.d/modules/phpfpm/phpfpm.go (renamed from src/go/collectors/go.d.plugin/modules/phpfpm/phpfpm.go) | 4 | ||||
| -rw-r--r-- | src/go/plugin/go.d/modules/phpfpm/phpfpm_test.go (renamed from src/go/collectors/go.d.plugin/modules/phpfpm/phpfpm_test.go) | 2 | ||||
| -rw-r--r-- | src/go/plugin/go.d/modules/phpfpm/testdata/config.json (renamed from src/go/collectors/go.d.plugin/modules/phpfpm/testdata/config.json) | 0 | ||||
| -rw-r--r-- | src/go/plugin/go.d/modules/phpfpm/testdata/config.yaml (renamed from src/go/collectors/go.d.plugin/modules/phpfpm/testdata/config.yaml) | 0 | ||||
| -rw-r--r-- | src/go/plugin/go.d/modules/phpfpm/testdata/status-full-no-idle.json (renamed from src/go/collectors/go.d.plugin/modules/phpfpm/testdata/status-full-no-idle.json) | 0 | ||||
| -rw-r--r-- | src/go/plugin/go.d/modules/phpfpm/testdata/status-full.json (renamed from src/go/collectors/go.d.plugin/modules/phpfpm/testdata/status-full.json) | 0 | ||||
| -rw-r--r-- | src/go/plugin/go.d/modules/phpfpm/testdata/status-full.txt (renamed from src/go/collectors/go.d.plugin/modules/phpfpm/testdata/status-full.txt) | 0 | ||||
| -rw-r--r-- | src/go/plugin/go.d/modules/phpfpm/testdata/status.json (renamed from src/go/collectors/go.d.plugin/modules/phpfpm/testdata/status.json) | 0 | ||||
| -rw-r--r-- | src/go/plugin/go.d/modules/phpfpm/testdata/status.txt (renamed from src/go/collectors/go.d.plugin/modules/phpfpm/testdata/status.txt) | 0 | ||||
| l--------- | src/go/plugin/go.d/modules/pihole/README.md (renamed from src/go/collectors/go.d.plugin/modules/pihole/README.md) | 0 | ||||
| -rw-r--r-- | src/go/plugin/go.d/modules/pihole/charts.go (renamed from src/go/collectors/go.d.plugin/modules/pihole/charts.go) | 2 | ||||
| -rw-r--r-- | src/go/plugin/go.d/modules/pihole/collect.go (renamed from src/go/collectors/go.d.plugin/modules/pihole/collect.go) | 14 | ||||
| -rw-r--r-- | src/go/plugin/go.d/modules/pihole/config_schema.json (renamed from src/go/collectors/go.d.plugin/modules/pihole/config_schema.json) | 6 | ||||
| -rw-r--r-- | src/go/plugin/go.d/modules/pihole/init.go (renamed from src/go/collectors/go.d.plugin/modules/pihole/init.go) | 2 | ||||
| -rw-r--r-- | src/go/plugin/go.d/modules/pihole/integrations/pi-hole.md (renamed from src/go/collectors/go.d.plugin/modules/pihole/integrations/pi-hole.md) | 39 | ||||
| -rw-r--r-- | src/go/plugin/go.d/modules/pihole/metadata.yaml (renamed from src/go/collectors/go.d.plugin/modules/pihole/metadata.yaml) | 0 | ||||
| -rw-r--r-- | src/go/plugin/go.d/modules/pihole/metrics.go (renamed from src/go/collectors/go.d.plugin/modules/pihole/metrics.go) | 0 | ||||
| -rw-r--r-- | src/go/plugin/go.d/modules/pihole/pihole.go (renamed from src/go/collectors/go.d.plugin/modules/pihole/pihole.go) | 4 | ||||
| -rw-r--r-- | src/go/plugin/go.d/modules/pihole/pihole_test.go (renamed from src/go/collectors/go.d.plugin/modules/pihole/pihole_test.go) | 4 | ||||
| -rw-r--r-- | src/go/plugin/go.d/modules/pihole/testdata/config.json (renamed from src/go/collectors/go.d.plugin/modules/pihole/testdata/config.json) | 0 | ||||
| -rw-r--r-- | src/go/plugin/go.d/modules/pihole/testdata/config.yaml (renamed from src/go/collectors/go.d.plugin/modules/pihole/testdata/config.yaml) | 0 | ||||
| -rw-r--r-- | src/go/plugin/go.d/modules/pihole/testdata/getForwardDestinations.json (renamed from src/go/collectors/go.d.plugin/modules/pihole/testdata/getForwardDestinations.json) | 0 | ||||
| -rw-r--r-- | src/go/plugin/go.d/modules/pihole/testdata/getQueryTypes.json (renamed from src/go/collectors/go.d.plugin/modules/pihole/testdata/getQueryTypes.json) | 0 | ||||
| -rw-r--r-- | src/go/plugin/go.d/modules/pihole/testdata/setupVars.conf (renamed from src/go/collectors/go.d.plugin/modules/pihole/testdata/setupVars.conf) | 0 | ||||
| -rw-r--r-- | src/go/plugin/go.d/modules/pihole/testdata/summaryRaw.json (renamed from src/go/collectors/go.d.plugin/modules/pihole/testdata/summaryRaw.json) | 0 | ||||
| l--------- | src/go/plugin/go.d/modules/pika/README.md (renamed from src/go/collectors/go.d.plugin/modules/pika/README.md) | 0 | ||||
| -rw-r--r-- | src/go/plugin/go.d/modules/pika/charts.go (renamed from src/go/collectors/go.d.plugin/modules/pika/charts.go) | 2 | ||||
| -rw-r--r-- | src/go/plugin/go.d/modules/pika/collect.go (renamed from src/go/collectors/go.d.plugin/modules/pika/collect.go) | 0 | ||||
| -rw-r--r-- | src/go/plugin/go.d/modules/pika/collect_info.go (renamed from src/go/collectors/go.d.plugin/modules/pika/collect_info.go) | 2 | ||||
| -rw-r--r-- | src/go/plugin/go.d/modules/pika/config_schema.json (renamed from src/go/collectors/go.d.plugin/modules/pika/config_schema.json) | 0 | ||||
| -rw-r--r-- | src/go/plugin/go.d/modules/pika/init.go (renamed from src/go/collectors/go.d.plugin/modules/pika/init.go) | 4 | ||||
| -rw-r--r-- | src/go/plugin/go.d/modules/pika/integrations/pika.md (renamed from src/go/collectors/go.d.plugin/modules/pika/integrations/pika.md) | 39 | ||||
| -rw-r--r-- | src/go/plugin/go.d/modules/pika/metadata.yaml (renamed from src/go/collectors/go.d.plugin/modules/pika/metadata.yaml) | 0 | ||||
| -rw-r--r-- | src/go/plugin/go.d/modules/pika/pika.go (renamed from src/go/collectors/go.d.plugin/modules/pika/pika.go) | 6 | ||||
| -rw-r--r-- | src/go/plugin/go.d/modules/pika/pika_test.go (renamed from src/go/collectors/go.d.plugin/modules/pika/pika_test.go) | 4 | ||||
| -rw-r--r-- | src/go/plugin/go.d/modules/pika/testdata/config.json (renamed from src/go/collectors/go.d.plugin/modules/pika/testdata/config.json) | 0 | ||||
| -rw-r--r-- | src/go/plugin/go.d/modules/pika/testdata/config.yaml (renamed from src/go/collectors/go.d.plugin/modules/pika/testdata/config.yaml) | 0 | ||||
| -rw-r--r-- | src/go/plugin/go.d/modules/pika/testdata/redis/info_all.txt (renamed from src/go/collectors/go.d.plugin/modules/pika/testdata/redis/info_all.txt) | 0 | ||||
| -rw-r--r-- | src/go/plugin/go.d/modules/pika/testdata/v3.4.0/info_all.txt (renamed from src/go/collectors/go.d.plugin/modules/pika/testdata/v3.4.0/info_all.txt) | 0 | ||||
| l--------- | src/go/plugin/go.d/modules/ping/README.md (renamed from src/go/collectors/go.d.plugin/modules/ping/README.md) | 0 | ||||
| -rw-r--r-- | src/go/plugin/go.d/modules/ping/charts.go (renamed from src/go/collectors/go.d.plugin/modules/ping/charts.go) | 2 | ||||
| -rw-r--r-- | src/go/plugin/go.d/modules/ping/collect.go (renamed from src/go/collectors/go.d.plugin/modules/ping/collect.go) | 0 | ||||
| -rw-r--r-- | src/go/plugin/go.d/modules/ping/config_schema.json (renamed from src/go/collectors/go.d.plugin/modules/ping/config_schema.json) | 2 | ||||
| -rw-r--r-- | src/go/plugin/go.d/modules/ping/init.go (renamed from src/go/collectors/go.d.plugin/modules/ping/init.go) | 0 | ||||
| -rw-r--r-- | src/go/plugin/go.d/modules/ping/integrations/ping.md (renamed from src/go/collectors/go.d.plugin/modules/ping/integrations/ping.md) | 41 | ||||
| -rw-r--r-- | src/go/plugin/go.d/modules/ping/metadata.yaml (renamed from src/go/collectors/go.d.plugin/modules/ping/metadata.yaml) | 2 | ||||
| -rw-r--r-- | src/go/plugin/go.d/modules/ping/ping.go (renamed from src/go/collectors/go.d.plugin/modules/ping/ping.go) | 6 | ||||
| -rw-r--r-- | src/go/plugin/go.d/modules/ping/ping_test.go (renamed from src/go/collectors/go.d.plugin/modules/ping/ping_test.go) | 4 | ||||
| -rw-r--r-- | src/go/plugin/go.d/modules/ping/prober.go (renamed from src/go/collectors/go.d.plugin/modules/ping/prober.go) | 2 | ||||
| -rw-r--r-- | src/go/plugin/go.d/modules/ping/testdata/config.json (renamed from src/go/collectors/go.d.plugin/modules/ping/testdata/config.json) | 0 | ||||
| -rw-r--r-- | src/go/plugin/go.d/modules/ping/testdata/config.yaml (renamed from src/go/collectors/go.d.plugin/modules/ping/testdata/config.yaml) | 0 | ||||
| l--------- | src/go/plugin/go.d/modules/portcheck/README.md (renamed from src/go/collectors/go.d.plugin/modules/portcheck/README.md) | 0 | ||||
| -rw-r--r-- | src/go/plugin/go.d/modules/portcheck/charts.go (renamed from src/go/collectors/go.d.plugin/modules/portcheck/charts.go) | 2 | ||||
| -rw-r--r-- | src/go/plugin/go.d/modules/portcheck/collect.go (renamed from src/go/collectors/go.d.plugin/modules/portcheck/collect.go) | 0 | ||||
| -rw-r--r-- | src/go/plugin/go.d/modules/portcheck/config_schema.json (renamed from src/go/collectors/go.d.plugin/modules/portcheck/config_schema.json) | 0 | ||||
| -rw-r--r-- | src/go/plugin/go.d/modules/portcheck/init.go (renamed from src/go/collectors/go.d.plugin/modules/portcheck/init.go) | 2 | ||||
| -rw-r--r-- | src/go/plugin/go.d/modules/portcheck/integrations/tcp_endpoints.md (renamed from src/go/collectors/go.d.plugin/modules/portcheck/integrations/tcp_endpoints.md) | 39 | ||||
| -rw-r--r-- | src/go/plugin/go.d/modules/portcheck/metadata.yaml (renamed from src/go/collectors/go.d.plugin/modules/portcheck/metadata.yaml) | 0 | ||||
| -rw-r--r-- | src/go/plugin/go.d/modules/portcheck/portcheck.go (renamed from src/go/collectors/go.d.plugin/modules/portcheck/portcheck.go) | 4 | ||||
| -rw-r--r-- | src/go/plugin/go.d/modules/portcheck/portcheck_test.go (renamed from src/go/collectors/go.d.plugin/modules/portcheck/portcheck_test.go) | 2 | ||||
| -rw-r--r-- | src/go/plugin/go.d/modules/portcheck/testdata/config.json (renamed from src/go/collectors/go.d.plugin/modules/portcheck/testdata/config.json) | 0 | ||||
| -rw-r--r-- | src/go/plugin/go.d/modules/portcheck/testdata/config.yaml (renamed from src/go/collectors/go.d.plugin/modules/portcheck/testdata/config.yaml) | 0 | ||||
| l--------- | src/go/plugin/go.d/modules/postfix/README.md (renamed from src/collectors/python.d.plugin/postfix/README.md) | 0 | ||||
| -rw-r--r-- | src/go/plugin/go.d/modules/postfix/charts.go | 44 | ||||
| -rw-r--r-- | src/go/plugin/go.d/modules/postfix/collect.go | 71 | ||||
| -rw-r--r-- | src/go/plugin/go.d/modules/postfix/config_schema.json | 47 | ||||
| -rw-r--r-- | src/go/plugin/go.d/modules/postfix/exec.go | 41 | ||||
| -rw-r--r-- | src/go/plugin/go.d/modules/postfix/init.go | 38 | ||||
| -rw-r--r-- | src/go/plugin/go.d/modules/postfix/integrations/postfix.md | 195 | ||||
| -rw-r--r-- | src/go/plugin/go.d/modules/postfix/metadata.yaml | 106 | ||||
| -rw-r--r-- | src/go/plugin/go.d/modules/postfix/postfix.go | 109 | ||||
| -rw-r--r-- | src/go/plugin/go.d/modules/postfix/postfix_test.go (renamed from src/go/collectors/go.d.plugin/modules/zfspool/zfspool_test.go) | 149 | ||||
| -rw-r--r-- | src/go/plugin/go.d/modules/postfix/testdata/config.json | 5 | ||||
| -rw-r--r-- | src/go/plugin/go.d/modules/postfix/testdata/config.yaml | 3 | ||||
| -rw-r--r-- | src/go/plugin/go.d/modules/postfix/testdata/postqueue.txt | 34 | ||||
| l--------- | src/go/plugin/go.d/modules/postgres/README.md (renamed from src/go/collectors/go.d.plugin/modules/postgres/README.md) | 0 | ||||
| -rw-r--r-- | src/go/plugin/go.d/modules/postgres/charts.go (renamed from src/go/collectors/go.d.plugin/modules/postgres/charts.go) | 2 | ||||
| -rw-r--r-- | src/go/plugin/go.d/modules/postgres/collect.go (renamed from src/go/collectors/go.d.plugin/modules/postgres/collect.go) | 11 | ||||
| -rw-r--r-- | src/go/plugin/go.d/modules/postgres/collect_metrics.go (renamed from src/go/collectors/go.d.plugin/modules/postgres/collect_metrics.go) | 0 | ||||
| -rw-r--r-- | src/go/plugin/go.d/modules/postgres/config_schema.json (renamed from src/go/collectors/go.d.plugin/modules/postgres/config_schema.json) | 0 | ||||
| -rw-r--r-- | src/go/plugin/go.d/modules/postgres/do_query.go (renamed from src/go/collectors/go.d.plugin/modules/postgres/do_query.go) | 0 | ||||
| -rw-r--r-- | src/go/plugin/go.d/modules/postgres/do_query_bloat.go (renamed from src/go/collectors/go.d.plugin/modules/postgres/do_query_bloat.go) | 2 | ||||
| -rw-r--r-- | src/go/plugin/go.d/modules/postgres/do_query_columns.go (renamed from src/go/collectors/go.d.plugin/modules/postgres/do_query_columns.go) | 0 | ||||
| -rw-r--r-- | src/go/plugin/go.d/modules/postgres/do_query_databases.go (renamed from src/go/collectors/go.d.plugin/modules/postgres/do_query_databases.go) | 0 | ||||
| -rw-r--r-- | src/go/plugin/go.d/modules/postgres/do_query_global.go (renamed from src/go/collectors/go.d.plugin/modules/postgres/do_query_global.go) | 0 | ||||
| -rw-r--r-- | src/go/plugin/go.d/modules/postgres/do_query_indexes.go (renamed from src/go/collectors/go.d.plugin/modules/postgres/do_query_indexes.go) | 2 | ||||
| -rw-r--r-- | src/go/plugin/go.d/modules/postgres/do_query_misc.go (renamed from src/go/collectors/go.d.plugin/modules/postgres/do_query_misc.go) | 2 | ||||
| -rw-r--r-- | src/go/plugin/go.d/modules/postgres/do_query_replication.go (renamed from src/go/collectors/go.d.plugin/modules/postgres/do_query_replication.go) | 2 | ||||
| -rw-r--r-- | src/go/plugin/go.d/modules/postgres/do_query_tables.go (renamed from src/go/collectors/go.d.plugin/modules/postgres/do_query_tables.go) | 0 | ||||
| -rw-r--r-- | src/go/plugin/go.d/modules/postgres/init.go (renamed from src/go/collectors/go.d.plugin/modules/postgres/init.go) | 2 | ||||
| -rw-r--r-- | src/go/plugin/go.d/modules/postgres/integrations/postgresql.md (renamed from src/go/collectors/go.d.plugin/modules/postgres/integrations/postgresql.md) | 41 | ||||
| -rw-r--r-- | src/go/plugin/go.d/modules/postgres/metadata.yaml (renamed from src/go/collectors/go.d.plugin/modules/postgres/metadata.yaml) | 2 | ||||
| -rw-r--r-- | src/go/plugin/go.d/modules/postgres/metrics.go (renamed from src/go/collectors/go.d.plugin/modules/postgres/metrics.go) | 2 | ||||
| -rw-r--r-- | src/go/plugin/go.d/modules/postgres/postgres.go (renamed from src/go/collectors/go.d.plugin/modules/postgres/postgres.go) | 12 | ||||
| -rw-r--r-- | src/go/plugin/go.d/modules/postgres/postgres_test.go (renamed from src/go/collectors/go.d.plugin/modules/postgres/postgres_test.go) | 4 | ||||
| -rw-r--r-- | src/go/plugin/go.d/modules/postgres/queries.go (renamed from src/go/collectors/go.d.plugin/modules/postgres/queries.go) | 0 | ||||
| -rw-r--r-- | src/go/plugin/go.d/modules/postgres/testdata/config.json (renamed from src/go/collectors/go.d.plugin/modules/postgres/testdata/config.json) | 0 | ||||
| -rw-r--r-- | src/go/plugin/go.d/modules/postgres/testdata/config.yaml (renamed from src/go/collectors/go.d.plugin/modules/postgres/testdata/config.yaml) | 0 | ||||
| -rw-r--r-- | src/go/plugin/go.d/modules/postgres/testdata/v14.4/autovacuum_workers.txt (renamed from src/go/collectors/go.d.plugin/modules/postgres/testdata/v14.4/autovacuum_workers.txt) | 0 | ||||
| -rw-r--r-- | src/go/plugin/go.d/modules/postgres/testdata/v14.4/bloat_tables.txt (renamed from src/go/collectors/go.d.plugin/modules/postgres/testdata/v14.4/bloat_tables.txt) | 0 | ||||
| -rw-r--r-- | src/go/plugin/go.d/modules/postgres/testdata/v14.4/catalog_relations.txt (renamed from src/go/collectors/go.d.plugin/modules/postgres/testdata/v14.4/catalog_relations.txt) | 0 | ||||
| -rw-r--r-- | src/go/plugin/go.d/modules/postgres/testdata/v14.4/checkpoints.txt (renamed from src/go/collectors/go.d.plugin/modules/postgres/testdata/v14.4/checkpoints.txt) | 0 | ||||
| -rw-r--r-- | src/go/plugin/go.d/modules/postgres/testdata/v14.4/database_conflicts.txt (renamed from src/go/collectors/go.d.plugin/modules/postgres/testdata/v14.4/database_conflicts.txt) | 0 | ||||
| -rw-r--r-- | src/go/plugin/go.d/modules/postgres/testdata/v14.4/database_locks.txt (renamed from src/go/collectors/go.d.plugin/modules/postgres/testdata/v14.4/database_locks.txt) | 0 | ||||
| -rw-r--r-- | src/go/plugin/go.d/modules/postgres/testdata/v14.4/database_size.txt (renamed from src/go/collectors/go.d.plugin/modules/postgres/testdata/v14.4/database_size.txt) | 0 | ||||
| -rw-r--r-- | src/go/plugin/go.d/modules/postgres/testdata/v14.4/database_stats.txt (renamed from src/go/collectors/go.d.plugin/modules/postgres/testdata/v14.4/database_stats.txt) | 0 | ||||
| -rw-r--r-- | src/go/plugin/go.d/modules/postgres/testdata/v14.4/is_super_user-false.txt (renamed from src/go/collectors/go.d.plugin/modules/postgres/testdata/v14.4/is_super_user-false.txt) | 0 | ||||
| -rw-r--r-- | src/go/plugin/go.d/modules/postgres/testdata/v14.4/is_super_user-true.txt (renamed from src/go/collectors/go.d.plugin/modules/postgres/testdata/v14.4/is_super_user-true.txt) | 0 | ||||
| -rw-r--r-- | src/go/plugin/go.d/modules/postgres/testdata/v14.4/pg_is_in_recovery-true.txt (renamed from src/go/collectors/go.d.plugin/modules/postgres/testdata/v14.4/pg_is_in_recovery-true.txt) | 0 | ||||
| -rw-r--r-- | src/go/plugin/go.d/modules/postgres/testdata/v14.4/queryable_database_list.txt (renamed from src/go/collectors/go.d.plugin/modules/postgres/testdata/v14.4/queryable_database_list.txt) | 0 | ||||
| -rw-r--r-- | src/go/plugin/go.d/modules/postgres/testdata/v14.4/replication_slot_files.txt (renamed from src/go/collectors/go.d.plugin/modules/postgres/testdata/v14.4/replication_slot_files.txt) | 0 | ||||
| -rw-r--r-- | src/go/plugin/go.d/modules/postgres/testdata/v14.4/replication_standby_app_wal_delta.txt (renamed from src/go/collectors/go.d.plugin/modules/postgres/testdata/v14.4/replication_standby_app_wal_delta.txt) | 0 | ||||
| -rw-r--r-- | src/go/plugin/go.d/modules/postgres/testdata/v14.4/replication_standby_app_wal_lag.txt (renamed from src/go/collectors/go.d.plugin/modules/postgres/testdata/v14.4/replication_standby_app_wal_lag.txt) | 0 | ||||
| -rw-r--r-- | src/go/plugin/go.d/modules/postgres/testdata/v14.4/server_connections_state.txt (renamed from src/go/collectors/go.d.plugin/modules/postgres/testdata/v14.4/server_connections_state.txt) | 0 | ||||
| -rw-r--r-- | src/go/plugin/go.d/modules/postgres/testdata/v14.4/server_current_connections.txt (renamed from src/go/collectors/go.d.plugin/modules/postgres/testdata/v14.4/server_current_connections.txt) | 0 | ||||
| -rw-r--r-- | src/go/plugin/go.d/modules/postgres/testdata/v14.4/server_version_num.txt (renamed from src/go/collectors/go.d.plugin/modules/postgres/testdata/v14.4/server_version_num.txt) | 0 | ||||
| -rw-r--r-- | src/go/plugin/go.d/modules/postgres/testdata/v14.4/settings_max_connections.txt (renamed from src/go/collectors/go.d.plugin/modules/postgres/testdata/v14.4/settings_max_connections.txt) | 0 | ||||
| -rw-r--r-- | src/go/plugin/go.d/modules/postgres/testdata/v14.4/settings_max_locks_held.txt (renamed from src/go/collectors/go.d.plugin/modules/postgres/testdata/v14.4/settings_max_locks_held.txt) | 0 | ||||
| -rw-r--r-- | src/go/plugin/go.d/modules/postgres/testdata/v14.4/stat_user_indexes_db_postgres.txt (renamed from src/go/collectors/go.d.plugin/modules/postgres/testdata/v14.4/stat_user_indexes_db_postgres.txt) | 0 | ||||
| -rw-r--r-- | src/go/plugin/go.d/modules/postgres/testdata/v14.4/stat_user_tables_db_postgres.txt (renamed from src/go/collectors/go.d.plugin/modules/postgres/testdata/v14.4/stat_user_tables_db_postgres.txt) | 0 | ||||
| -rw-r--r-- | src/go/plugin/go.d/modules/postgres/testdata/v14.4/statio_user_tables_db_postgres.txt (renamed from src/go/collectors/go.d.plugin/modules/postgres/testdata/v14.4/statio_user_tables_db_postgres.txt) | 0 | ||||
| -rw-r--r-- | src/go/plugin/go.d/modules/postgres/testdata/v14.4/table_columns_stats.txt (renamed from src/go/collectors/go.d.plugin/modules/postgres/testdata/v14.4/table_columns_stats.txt) | 0 | ||||
| -rw-r--r-- | src/go/plugin/go.d/modules/postgres/testdata/v14.4/txid_wraparound.txt (renamed from src/go/collectors/go.d.plugin/modules/postgres/testdata/v14.4/txid_wraparound.txt) | 0 | ||||
| -rw-r--r-- | src/go/plugin/go.d/modules/postgres/testdata/v14.4/uptime.txt (renamed from src/go/collectors/go.d.plugin/modules/postgres/testdata/v14.4/uptime.txt) | 0 | ||||
| -rw-r--r-- | src/go/plugin/go.d/modules/postgres/testdata/v14.4/wal_archive_files.txt (renamed from src/go/collectors/go.d.plugin/modules/postgres/testdata/v14.4/wal_archive_files.txt) | 0 | ||||
| -rw-r--r-- | src/go/plugin/go.d/modules/postgres/testdata/v14.4/wal_files.txt (renamed from src/go/collectors/go.d.plugin/modules/postgres/testdata/v14.4/wal_files.txt) | 0 | ||||
| -rw-r--r-- | src/go/plugin/go.d/modules/postgres/testdata/v14.4/wal_writes.txt (renamed from src/go/collectors/go.d.plugin/modules/postgres/testdata/v14.4/wal_writes.txt) | 0 | ||||
| -rw-r--r-- | src/go/plugin/go.d/modules/postgres/testdata/v14.4/xact_query_running_time.txt (renamed from src/go/collectors/go.d.plugin/modules/postgres/testdata/v14.4/xact_query_running_time.txt) | 0 | ||||
| l--------- | src/go/plugin/go.d/modules/powerdns/README.md (renamed from src/go/collectors/go.d.plugin/modules/powerdns/README.md) | 0 | ||||
| -rw-r--r-- | src/go/plugin/go.d/modules/powerdns/authoritativens.go (renamed from src/go/collectors/go.d.plugin/modules/powerdns/authoritativens.go) | 4 | ||||
| -rw-r--r-- | src/go/plugin/go.d/modules/powerdns/authoritativens_test.go (renamed from src/go/collectors/go.d.plugin/modules/powerdns/authoritativens_test.go) | 6 | ||||
| -rw-r--r-- | src/go/plugin/go.d/modules/powerdns/charts.go (renamed from src/go/collectors/go.d.plugin/modules/powerdns/charts.go) | 2 | ||||
| -rw-r--r-- | src/go/plugin/go.d/modules/powerdns/collect.go (renamed from src/go/collectors/go.d.plugin/modules/powerdns/collect.go) | 5 | ||||
| -rw-r--r-- | src/go/plugin/go.d/modules/powerdns/config_schema.json (renamed from src/go/collectors/go.d.plugin/modules/powerdns/config_schema.json) | 6 | ||||
| -rw-r--r-- | src/go/plugin/go.d/modules/powerdns/init.go (renamed from src/go/collectors/go.d.plugin/modules/powerdns/init.go) | 4 | ||||
| -rw-r--r-- | src/go/plugin/go.d/modules/powerdns/integrations/powerdns_authoritative_server.md (renamed from src/go/collectors/go.d.plugin/modules/powerdns/integrations/powerdns_authoritative_server.md) | 39 | ||||
| -rw-r--r-- | src/go/plugin/go.d/modules/powerdns/metadata.yaml (renamed from src/go/collectors/go.d.plugin/modules/powerdns/metadata.yaml) | 0 | ||||
| -rw-r--r-- | src/go/plugin/go.d/modules/powerdns/metrics.go (renamed from src/go/collectors/go.d.plugin/modules/powerdns/metrics.go) | 0 | ||||
| -rw-r--r-- | src/go/plugin/go.d/modules/powerdns/testdata/config.json (renamed from src/go/collectors/go.d.plugin/modules/rspamd/testdata/config.json) | 0 | ||||
| -rw-r--r-- | src/go/plugin/go.d/modules/powerdns/testdata/config.yaml (renamed from src/go/collectors/go.d.plugin/modules/rspamd/testdata/config.yaml) | 0 | ||||
| -rw-r--r-- | src/go/plugin/go.d/modules/powerdns/testdata/recursor/statistics.json (renamed from src/go/collectors/go.d.plugin/modules/powerdns/testdata/recursor/statistics.json) | 0 | ||||
| -rw-r--r-- | src/go/plugin/go.d/modules/powerdns/testdata/v4.3.0/statistics.json (renamed from src/go/collectors/go.d.plugin/modules/powerdns/testdata/v4.3.0/statistics.json) | 0 | ||||
| l--------- | src/go/plugin/go.d/modules/powerdns_recursor/README.md (renamed from src/go/collectors/go.d.plugin/modules/powerdns_recursor/README.md) | 0 | ||||
| -rw-r--r-- | src/go/plugin/go.d/modules/powerdns_recursor/charts.go (renamed from src/go/collectors/go.d.plugin/modules/powerdns_recursor/charts.go) | 2 | ||||
| -rw-r--r-- | src/go/plugin/go.d/modules/powerdns_recursor/collect.go (renamed from src/go/collectors/go.d.plugin/modules/powerdns_recursor/collect.go) | 5 | ||||
| -rw-r--r-- | src/go/plugin/go.d/modules/powerdns_recursor/config_schema.json (renamed from src/go/collectors/go.d.plugin/modules/powerdns_recursor/config_schema.json) | 6 | ||||
| -rw-r--r-- | src/go/plugin/go.d/modules/powerdns_recursor/init.go (renamed from src/go/collectors/go.d.plugin/modules/powerdns_recursor/init.go) | 4 | ||||
| -rw-r--r-- | src/go/plugin/go.d/modules/powerdns_recursor/integrations/powerdns_recursor.md (renamed from src/go/collectors/go.d.plugin/modules/powerdns_recursor/integrations/powerdns_recursor.md) | 39 | ||||
| -rw-r--r-- | src/go/plugin/go.d/modules/powerdns_recursor/metadata.yaml (renamed from src/go/collectors/go.d.plugin/modules/powerdns_recursor/metadata.yaml) | 0 | ||||
| -rw-r--r-- | src/go/plugin/go.d/modules/powerdns_recursor/metrics.go (renamed from src/go/collectors/go.d.plugin/modules/powerdns_recursor/metrics.go) | 0 | ||||
| -rw-r--r-- | src/go/plugin/go.d/modules/powerdns_recursor/recursor.go (renamed from src/go/collectors/go.d.plugin/modules/powerdns_recursor/recursor.go) | 4 | ||||
| -rw-r--r-- | src/go/plugin/go.d/modules/powerdns_recursor/recursor_test.go (renamed from src/go/collectors/go.d.plugin/modules/powerdns_recursor/recursor_test.go) | 6 | ||||
| -rw-r--r-- | src/go/plugin/go.d/modules/powerdns_recursor/testdata/authoritative/statistics.json (renamed from src/go/collectors/go.d.plugin/modules/powerdns_recursor/testdata/authoritative/statistics.json) | 0 | ||||
| -rw-r--r-- | src/go/plugin/go.d/modules/powerdns_recursor/testdata/config.json (renamed from src/go/collectors/go.d.plugin/modules/scaleio/testdata/config.json) | 0 | ||||
| -rw-r--r-- | src/go/plugin/go.d/modules/powerdns_recursor/testdata/config.yaml (renamed from src/go/collectors/go.d.plugin/modules/scaleio/testdata/config.yaml) | 0 | ||||
| -rw-r--r-- | src/go/plugin/go.d/modules/powerdns_recursor/testdata/v4.3.1/statistics.json (renamed from src/go/collectors/go.d.plugin/modules/powerdns_recursor/testdata/v4.3.1/statistics.json) | 0 | ||||
| l--------- | src/go/plugin/go.d/modules/prometheus/README.md (renamed from src/go/collectors/go.d.plugin/modules/prometheus/README.md) | 0 | ||||
| -rw-r--r-- | src/go/plugin/go.d/modules/prometheus/cache.go (renamed from src/go/collectors/go.d.plugin/modules/prometheus/cache.go) | 2 | ||||
| -rw-r--r-- | src/go/plugin/go.d/modules/prometheus/charts.go (renamed from src/go/collectors/go.d.plugin/modules/prometheus/charts.go) | 4 | ||||
| -rw-r--r-- | src/go/plugin/go.d/modules/prometheus/collect.go (renamed from src/go/collectors/go.d.plugin/modules/prometheus/collect.go) | 2 | ||||
| -rw-r--r-- | src/go/plugin/go.d/modules/prometheus/config_schema.json (renamed from src/go/collectors/go.d.plugin/modules/prometheus/config_schema.json) | 10 | ||||
| -rw-r--r-- | src/go/plugin/go.d/modules/prometheus/init.go (renamed from src/go/collectors/go.d.plugin/modules/prometheus/init.go) | 6 | ||||
| -rw-r--r-- | src/go/plugin/go.d/modules/prometheus/integrations/4d_server.md (renamed from src/go/collectors/go.d.plugin/modules/prometheus/integrations/4d_server.md) | 42 | ||||
| -rw-r--r-- | src/go/plugin/go.d/modules/prometheus/integrations/8430ft_modem.md (renamed from src/go/collectors/go.d.plugin/modules/prometheus/integrations/8430ft_modem.md) | 42 | ||||
| -rw-r--r-- | src/go/plugin/go.d/modules/prometheus/integrations/a10_acos_network_devices.md (renamed from src/go/collectors/go.d.plugin/modules/prometheus/integrations/a10_acos_network_devices.md) | 42 | ||||
| -rw-r--r-- | src/go/plugin/go.d/modules/prometheus/integrations/airthings_waveplus_air_sensor.md (renamed from src/go/collectors/go.d.plugin/modules/prometheus/integrations/airthings_waveplus_air_sensor.md) | 42 | ||||
| -rw-r--r-- | src/go/plugin/go.d/modules/prometheus/integrations/akamai_edge_dns_traffic.md (renamed from src/go/collectors/go.d.plugin/modules/prometheus/integrations/akamai_edge_dns_traffic.md) | 42 | ||||
| -rw-r--r-- | src/go/plugin/go.d/modules/prometheus/integrations/akamai_global_traffic_management.md (renamed from src/go/collectors/go.d.plugin/modules/prometheus/integrations/akamai_global_traffic_management.md) | 42 | ||||
| -rw-r--r-- | src/go/plugin/go.d/modules/prometheus/integrations/akami_cloudmonitor.md (renamed from src/go/collectors/go.d.plugin/modules/prometheus/integrations/akami_cloudmonitor.md) | 42 | ||||
| -rw-r--r-- | src/go/plugin/go.d/modules/prometheus/integrations/alamos_fe2_server.md (renamed from src/go/collectors/go.d.plugin/modules/prometheus/integrations/alamos_fe2_server.md) | 42 | ||||
| -rw-r--r-- | src/go/plugin/go.d/modules/prometheus/integrations/alibaba_cloud.md (renamed from src/go/collectors/go.d.plugin/modules/prometheus/integrations/alibaba_cloud.md) | 42 | ||||
| -rw-r--r-- | src/go/plugin/go.d/modules/prometheus/integrations/altaro_backup.md (renamed from src/go/collectors/go.d.plugin/modules/prometheus/integrations/altaro_backup.md) | 42 | ||||
| -rw-r--r-- | src/go/plugin/go.d/modules/prometheus/integrations/amd_cpu_&_gpu.md (renamed from src/go/collectors/go.d.plugin/modules/prometheus/integrations/amd_cpu_&_gpu.md) | 42 | ||||
| -rw-r--r-- | src/go/plugin/go.d/modules/prometheus/integrations/andrews_&_arnold_line_status.md (renamed from src/go/collectors/go.d.plugin/modules/prometheus/integrations/andrews_&_arnold_line_status.md) | 42 | ||||
| -rw-r--r-- | src/go/plugin/go.d/modules/prometheus/integrations/apache_airflow.md (renamed from src/go/collectors/go.d.plugin/modules/prometheus/integrations/apache_airflow.md) | 42 | ||||
| -rw-r--r-- | src/go/plugin/go.d/modules/prometheus/integrations/apache_flink.md (renamed from src/go/collectors/go.d.plugin/modules/prometheus/integrations/apache_flink.md) | 42 | ||||
| -rw-r--r-- | src/go/plugin/go.d/modules/prometheus/integrations/apicast.md (renamed from src/go/collectors/go.d.plugin/modules/prometheus/integrations/apicast.md) | 42 | ||||
| -rw-r--r-- | src/go/plugin/go.d/modules/prometheus/integrations/apple_time_machine.md (renamed from src/go/collectors/go.d.plugin/modules/prometheus/integrations/apple_time_machine.md) | 42 | ||||
| -rw-r--r-- | src/go/plugin/go.d/modules/prometheus/integrations/arm_hwcpipe.md (renamed from src/go/collectors/go.d.plugin/modules/prometheus/integrations/arm_hwcpipe.md) | 42 | ||||
| -rw-r--r-- | src/go/plugin/go.d/modules/prometheus/integrations/aruba_devices.md (renamed from src/go/collectors/go.d.plugin/modules/prometheus/integrations/aruba_devices.md) | 42 | ||||
| -rw-r--r-- | src/go/plugin/go.d/modules/prometheus/integrations/arvancloud_cdn.md (renamed from src/go/collectors/go.d.plugin/modules/prometheus/integrations/arvancloud_cdn.md) | 42 | ||||
| -rw-r--r-- | src/go/plugin/go.d/modules/prometheus/integrations/audisto.md (renamed from src/go/collectors/go.d.plugin/modules/prometheus/integrations/audisto.md) | 42 | ||||
| -rw-r--r-- | src/go/plugin/go.d/modules/prometheus/integrations/authlog.md (renamed from src/go/collectors/go.d.plugin/modules/prometheus/integrations/authlog.md) | 42 | ||||
| -rw-r--r-- | src/go/plugin/go.d/modules/prometheus/integrations/aws_ec2_compute_instances.md (renamed from src/go/collectors/go.d.plugin/modules/prometheus/integrations/aws_ec2_compute_instances.md) | 42 | ||||
| -rw-r--r-- | src/go/plugin/go.d/modules/prometheus/integrations/aws_ec2_spot_instance.md (renamed from src/go/collectors/go.d.plugin/modules/prometheus/integrations/aws_ec2_spot_instance.md) | 42 | ||||
| -rw-r--r-- | src/go/plugin/go.d/modules/prometheus/integrations/aws_ecs.md (renamed from src/go/collectors/go.d.plugin/modules/prometheus/integrations/aws_ecs.md) | 42 | ||||
| -rw-r--r-- | src/go/plugin/go.d/modules/prometheus/integrations/aws_health_events.md (renamed from src/go/collectors/go.d.plugin/modules/prometheus/integrations/aws_health_events.md) | 42 | ||||
| -rw-r--r-- | src/go/plugin/go.d/modules/prometheus/integrations/aws_instance_health.md (renamed from src/go/collectors/go.d.plugin/modules/prometheus/integrations/aws_instance_health.md) | 42 | ||||
| -rw-r--r-- | src/go/plugin/go.d/modules/prometheus/integrations/aws_quota.md (renamed from src/go/collectors/go.d.plugin/modules/prometheus/integrations/aws_quota.md) | 42 | ||||
| -rw-r--r-- | src/go/plugin/go.d/modules/prometheus/integrations/aws_rds.md (renamed from src/go/collectors/go.d.plugin/modules/prometheus/integrations/aws_rds.md) | 42 | ||||
| -rw-r--r-- | src/go/plugin/go.d/modules/prometheus/integrations/aws_s3_buckets.md (renamed from src/go/collectors/go.d.plugin/modules/prometheus/integrations/aws_s3_buckets.md) | 42 | ||||
| -rw-r--r-- | src/go/plugin/go.d/modules/prometheus/integrations/aws_sqs.md (renamed from src/go/collectors/go.d.plugin/modules/prometheus/integrations/aws_sqs.md) | 42 | ||||
| -rw-r--r-- | src/go/plugin/go.d/modules/prometheus/integrations/azure_ad_app_passwords.md (renamed from src/go/collectors/go.d.plugin/modules/prometheus/integrations/azure_ad_app_passwords.md) | 42 | ||||
| -rw-r--r-- | src/go/plugin/go.d/modules/prometheus/integrations/azure_application.md (renamed from src/go/collectors/go.d.plugin/modules/prometheus/integrations/azure_application.md) | 42 | ||||
| -rw-r--r-- | src/go/plugin/go.d/modules/prometheus/integrations/azure_elastic_pool_sql.md (renamed from src/go/collectors/go.d.plugin/modules/prometheus/integrations/azure_elastic_pool_sql.md) | 42 | ||||
| -rw-r--r-- | src/go/plugin/go.d/modules/prometheus/integrations/azure_resources.md (renamed from src/go/collectors/go.d.plugin/modules/prometheus/integrations/azure_resources.md) | 42 | ||||
| -rw-r--r-- | src/go/plugin/go.d/modules/prometheus/integrations/azure_service_bus.md (renamed from src/go/collectors/go.d.plugin/modules/prometheus/integrations/azure_service_bus.md) | 42 | ||||
| -rw-r--r-- | src/go/plugin/go.d/modules/prometheus/integrations/azure_sql.md (renamed from src/go/collectors/go.d.plugin/modules/prometheus/integrations/azure_sql.md) | 42 | ||||
| -rw-r--r-- | src/go/plugin/go.d/modules/prometheus/integrations/bigquery.md (renamed from src/go/collectors/go.d.plugin/modules/prometheus/integrations/bigquery.md) | 42 | ||||
| -rw-r--r-- | src/go/plugin/go.d/modules/prometheus/integrations/bird_routing_daemon.md (renamed from src/go/collectors/go.d.plugin/modules/prometheus/integrations/bird_routing_daemon.md) | 42 | ||||
| -rw-r--r-- | src/go/plugin/go.d/modules/prometheus/integrations/blackbox.md (renamed from src/go/collectors/go.d.plugin/modules/prometheus/integrations/blackbox.md) | 42 | ||||
| -rw-r--r-- | src/go/plugin/go.d/modules/prometheus/integrations/bobcat_miner_300.md (renamed from src/go/collectors/go.d.plugin/modules/prometheus/integrations/bobcat_miner_300.md) | 42 | ||||
| -rw-r--r-- | src/go/plugin/go.d/modules/prometheus/integrations/borg_backup.md (renamed from src/go/collectors/go.d.plugin/modules/prometheus/integrations/borg_backup.md) | 42 | ||||
| -rw-r--r-- | src/go/plugin/go.d/modules/prometheus/integrations/bosh.md (renamed from src/go/collectors/go.d.plugin/modules/prometheus/integrations/bosh.md) | 42 | ||||
| -rw-r--r-- | src/go/plugin/go.d/modules/prometheus/integrations/bpftrace_variables.md (renamed from src/go/collectors/go.d.plugin/modules/prometheus/integrations/bpftrace_variables.md) | 42 | ||||
| -rw-r--r-- | src/go/plugin/go.d/modules/prometheus/integrations/bungeecord.md (renamed from src/go/collectors/go.d.plugin/modules/prometheus/integrations/bungeecord.md) | 42 | ||||
| -rw-r--r-- | src/go/plugin/go.d/modules/prometheus/integrations/cadvisor.md (renamed from src/go/collectors/go.d.plugin/modules/prometheus/integrations/cadvisor.md) | 42 | ||||
| -rw-r--r-- | src/go/plugin/go.d/modules/prometheus/integrations/celery.md (renamed from src/go/collectors/go.d.plugin/modules/prometheus/integrations/celery.md) | 42 | ||||
| -rw-r--r-- | src/go/plugin/go.d/modules/prometheus/integrations/certificate_transparency.md (renamed from src/go/collectors/go.d.plugin/modules/prometheus/integrations/certificate_transparency.md) | 42 | ||||
| -rw-r--r-- | src/go/plugin/go.d/modules/prometheus/integrations/checkpoint_device.md (renamed from src/go/collectors/go.d.plugin/modules/prometheus/integrations/checkpoint_device.md) | 42 | ||||
| -rw-r--r-- | src/go/plugin/go.d/modules/prometheus/integrations/chia.md (renamed from src/go/collectors/go.d.plugin/modules/prometheus/integrations/chia.md) | 42 | ||||
| -rw-r--r-- | src/go/plugin/go.d/modules/prometheus/integrations/christ_elektronik_clm5ip_power_panel.md (renamed from src/go/collectors/go.d.plugin/modules/prometheus/integrations/christ_elektronik_clm5ip_power_panel.md) | 42 | ||||
| -rw-r--r-- | src/go/plugin/go.d/modules/prometheus/integrations/cilium_agent.md (renamed from src/go/collectors/go.d.plugin/modules/prometheus/integrations/cilium_agent.md) | 42 | ||||
| -rw-r--r-- | src/go/plugin/go.d/modules/prometheus/integrations/cilium_operator.md (renamed from src/go/collectors/go.d.plugin/modules/prometheus/integrations/cilium_operator.md) | 42 | ||||
| -rw-r--r-- | src/go/plugin/go.d/modules/prometheus/integrations/cilium_proxy.md (renamed from src/go/collectors/go.d.plugin/modules/prometheus/integrations/cilium_proxy.md) | 42 | ||||
| -rw-r--r-- | src/go/plugin/go.d/modules/prometheus/integrations/cisco_aci.md (renamed from src/go/collectors/go.d.plugin/modules/prometheus/integrations/cisco_aci.md) | 42 | ||||
| -rw-r--r-- | src/go/plugin/go.d/modules/prometheus/integrations/citrix_netscaler.md (renamed from src/go/collectors/go.d.plugin/modules/prometheus/integrations/citrix_netscaler.md) | 42 | ||||
| -rw-r--r-- | src/go/plugin/go.d/modules/prometheus/integrations/clamav_daemon.md (renamed from src/go/collectors/go.d.plugin/modules/prometheus/integrations/clamav_daemon.md) | 42 | ||||
| -rw-r--r-- | src/go/plugin/go.d/modules/prometheus/integrations/clamscan_results.md (renamed from src/go/collectors/go.d.plugin/modules/prometheus/integrations/clamscan_results.md) | 42 | ||||
| -rw-r--r-- | src/go/plugin/go.d/modules/prometheus/integrations/clash.md (renamed from src/go/collectors/go.d.plugin/modules/prometheus/integrations/clash.md) | 42 | ||||
| -rw-r--r-- | src/go/plugin/go.d/modules/prometheus/integrations/cloud_foundry.md (renamed from src/go/collectors/go.d.plugin/modules/prometheus/integrations/cloud_foundry.md) | 42 | ||||
| -rw-r--r-- | src/go/plugin/go.d/modules/prometheus/integrations/cloud_foundry_firehose.md (renamed from src/go/collectors/go.d.plugin/modules/prometheus/integrations/cloud_foundry_firehose.md) | 42 | ||||
| -rw-r--r-- | src/go/plugin/go.d/modules/prometheus/integrations/cloudflare_pcap.md (renamed from src/go/collectors/go.d.plugin/modules/prometheus/integrations/cloudflare_pcap.md) | 42 | ||||
| -rw-r--r-- | src/go/plugin/go.d/modules/prometheus/integrations/cloudwatch.md (renamed from src/go/collectors/go.d.plugin/modules/prometheus/integrations/cloudwatch.md) | 42 | ||||
| -rw-r--r-- | src/go/plugin/go.d/modules/prometheus/integrations/clustercontrol_cmon.md (renamed from src/go/collectors/go.d.plugin/modules/prometheus/integrations/clustercontrol_cmon.md) | 42 | ||||
| -rw-r--r-- | src/go/plugin/go.d/modules/prometheus/integrations/collectd.md (renamed from src/go/collectors/go.d.plugin/modules/prometheus/integrations/collectd.md) | 42 | ||||
| -rw-r--r-- | src/go/plugin/go.d/modules/prometheus/integrations/concourse.md (renamed from src/go/collectors/go.d.plugin/modules/prometheus/integrations/concourse.md) | 42 | ||||
| -rw-r--r-- | src/go/plugin/go.d/modules/prometheus/integrations/craftbeerpi.md (renamed from src/go/collectors/go.d.plugin/modules/prometheus/integrations/craftbeerpi.md) | 42 | ||||
| -rw-r--r-- | src/go/plugin/go.d/modules/prometheus/integrations/crowdsec.md (renamed from src/go/collectors/go.d.plugin/modules/prometheus/integrations/crowdsec.md) | 42 | ||||
| -rw-r--r-- | src/go/plugin/go.d/modules/prometheus/integrations/crypto_exchanges.md (renamed from src/go/collectors/go.d.plugin/modules/prometheus/integrations/crypto_exchanges.md) | 42 | ||||
| -rw-r--r-- | src/go/plugin/go.d/modules/prometheus/integrations/cryptowatch.md (renamed from src/go/collectors/go.d.plugin/modules/prometheus/integrations/cryptowatch.md) | 42 | ||||
| -rw-r--r-- | src/go/plugin/go.d/modules/prometheus/integrations/custom_exporter.md (renamed from src/go/collectors/go.d.plugin/modules/prometheus/integrations/custom_exporter.md) | 42 | ||||
| -rw-r--r-- | src/go/plugin/go.d/modules/prometheus/integrations/cvmfs_clients.md (renamed from src/go/collectors/go.d.plugin/modules/prometheus/integrations/cvmfs_clients.md) | 42 | ||||
| -rw-r--r-- | src/go/plugin/go.d/modules/prometheus/integrations/ddwrt_routers.md (renamed from src/go/collectors/go.d.plugin/modules/prometheus/integrations/ddwrt_routers.md) | 42 | ||||
| -rw-r--r-- | src/go/plugin/go.d/modules/prometheus/integrations/dell_emc_ecs_cluster.md (renamed from src/go/collectors/go.d.plugin/modules/prometheus/integrations/dell_emc_ecs_cluster.md) | 42 | ||||
| -rw-r--r-- | src/go/plugin/go.d/modules/prometheus/integrations/dell_emc_isilon_cluster.md (renamed from src/go/collectors/go.d.plugin/modules/prometheus/integrations/dell_emc_isilon_cluster.md) | 42 | ||||
| -rw-r--r-- | src/go/plugin/go.d/modules/prometheus/integrations/dell_emc_xtremio_cluster.md (renamed from src/go/collectors/go.d.plugin/modules/prometheus/integrations/dell_emc_xtremio_cluster.md) | 42 | ||||
| -rw-r--r-- | src/go/plugin/go.d/modules/prometheus/integrations/dell_powermax.md (renamed from src/go/collectors/go.d.plugin/modules/prometheus/integrations/dell_powermax.md) | 42 | ||||
| -rw-r--r-- | src/go/plugin/go.d/modules/prometheus/integrations/dependency-track.md (renamed from src/go/collectors/go.d.plugin/modules/prometheus/integrations/dependency-track.md) | 42 | ||||
| -rw-r--r-- | src/go/plugin/go.d/modules/prometheus/integrations/digitalocean.md (renamed from src/go/collectors/go.d.plugin/modules/prometheus/integrations/digitalocean.md) | 42 | ||||
| -rw-r--r-- | src/go/plugin/go.d/modules/prometheus/integrations/discourse.md (renamed from src/go/collectors/go.d.plugin/modules/prometheus/integrations/discourse.md) | 42 | ||||
| -rw-r--r-- | src/go/plugin/go.d/modules/prometheus/integrations/dmarc.md (renamed from src/go/collectors/go.d.plugin/modules/prometheus/integrations/dmarc.md) | 42 | ||||
| -rw-r--r-- | src/go/plugin/go.d/modules/prometheus/integrations/dnsbl.md (renamed from src/go/collectors/go.d.plugin/modules/prometheus/integrations/dnsbl.md) | 42 | ||||
| -rw-r--r-- | src/go/plugin/go.d/modules/prometheus/integrations/dutch_electricity_smart_meter.md (renamed from src/go/collectors/go.d.plugin/modules/prometheus/integrations/dutch_electricity_smart_meter.md) | 42 | ||||
| -rw-r--r-- | src/go/plugin/go.d/modules/prometheus/integrations/dynatrace.md (renamed from src/go/collectors/go.d.plugin/modules/prometheus/integrations/dynatrace.md) | 42 | ||||
| -rw-r--r-- | src/go/plugin/go.d/modules/prometheus/integrations/eaton_ups.md (renamed from src/go/collectors/go.d.plugin/modules/prometheus/integrations/eaton_ups.md) | 42 | ||||
| -rw-r--r-- | src/go/plugin/go.d/modules/prometheus/integrations/elgato_key_light_devices..md (renamed from src/go/collectors/go.d.plugin/modules/prometheus/integrations/elgato_key_light_devices..md) | 42 | ||||
| -rw-r--r-- | src/go/plugin/go.d/modules/prometheus/integrations/energomera_smart_power_meters.md (renamed from src/go/collectors/go.d.plugin/modules/prometheus/integrations/energomera_smart_power_meters.md) | 42 | ||||
| -rw-r--r-- | src/go/plugin/go.d/modules/prometheus/integrations/eos.md (renamed from src/go/collectors/go.d.plugin/modules/prometheus/integrations/eos.md) | 42 | ||||
| -rw-r--r-- | src/go/plugin/go.d/modules/prometheus/integrations/etcd.md (renamed from src/go/collectors/go.d.plugin/modules/prometheus/integrations/etcd.md) | 42 | ||||
| -rw-r--r-- | src/go/plugin/go.d/modules/prometheus/integrations/excel_spreadsheet.md (renamed from src/go/collectors/go.d.plugin/modules/prometheus/integrations/excel_spreadsheet.md) | 42 | ||||
| -rw-r--r-- | src/go/plugin/go.d/modules/prometheus/integrations/fastd.md (renamed from src/go/collectors/go.d.plugin/modules/prometheus/integrations/fastd.md) | 42 | ||||
| -rw-r--r-- | src/go/plugin/go.d/modules/prometheus/integrations/fortigate_firewall.md (renamed from src/go/collectors/go.d.plugin/modules/prometheus/integrations/fortigate_firewall.md) | 42 | ||||
| -rw-r--r-- | src/go/plugin/go.d/modules/prometheus/integrations/freebsd_nfs.md (renamed from src/go/collectors/go.d.plugin/modules/prometheus/integrations/freebsd_nfs.md) | 42 | ||||
| -rw-r--r-- | src/go/plugin/go.d/modules/prometheus/integrations/freebsd_rctl-racct.md (renamed from src/go/collectors/go.d.plugin/modules/prometheus/integrations/freebsd_rctl-racct.md) | 42 | ||||
| -rw-r--r-- | src/go/plugin/go.d/modules/prometheus/integrations/freifunk_network.md (renamed from src/go/collectors/go.d.plugin/modules/prometheus/integrations/freifunk_network.md) | 42 | ||||
| -rw-r--r-- | src/go/plugin/go.d/modules/prometheus/integrations/fritzbox_network_devices.md (renamed from src/go/collectors/go.d.plugin/modules/prometheus/integrations/fritzbox_network_devices.md) | 42 | ||||
| -rw-r--r-- | src/go/plugin/go.d/modules/prometheus/integrations/frrouting.md (renamed from src/go/collectors/go.d.plugin/modules/prometheus/integrations/frrouting.md) | 42 | ||||
| -rw-r--r-- | src/go/plugin/go.d/modules/prometheus/integrations/gcp_gce.md (renamed from src/go/collectors/go.d.plugin/modules/prometheus/integrations/gcp_gce.md) | 42 | ||||
| -rw-r--r-- | src/go/plugin/go.d/modules/prometheus/integrations/gcp_quota.md (renamed from src/go/collectors/go.d.plugin/modules/prometheus/integrations/gcp_quota.md) | 42 | ||||
| -rw-r--r-- | src/go/plugin/go.d/modules/prometheus/integrations/generic_command_line_output.md (renamed from src/go/collectors/go.d.plugin/modules/prometheus/integrations/generic_command_line_output.md) | 42 | ||||
| -rw-r--r-- | src/go/plugin/go.d/modules/prometheus/integrations/generic_storage_enclosure_tool.md (renamed from src/go/collectors/go.d.plugin/modules/prometheus/integrations/generic_storage_enclosure_tool.md) | 42 | ||||
| -rw-r--r-- | src/go/plugin/go.d/modules/prometheus/integrations/github_api_rate_limit.md (renamed from src/go/collectors/go.d.plugin/modules/prometheus/integrations/github_api_rate_limit.md) | 42 | ||||
| -rw-r--r-- | src/go/plugin/go.d/modules/prometheus/integrations/github_repository.md (renamed from src/go/collectors/go.d.plugin/modules/prometheus/integrations/github_repository.md) | 42 | ||||
| -rw-r--r-- | src/go/plugin/go.d/modules/prometheus/integrations/gitlab_runner.md (renamed from src/go/collectors/go.d.plugin/modules/prometheus/integrations/gitlab_runner.md) | 42 | ||||
| -rw-r--r-- | src/go/plugin/go.d/modules/prometheus/integrations/gobetween.md (renamed from src/go/collectors/go.d.plugin/modules/prometheus/integrations/gobetween.md) | 42 | ||||
| -rw-r--r-- | src/go/plugin/go.d/modules/prometheus/integrations/google_cloud_platform.md (renamed from src/go/collectors/go.d.plugin/modules/prometheus/integrations/google_cloud_platform.md) | 42 | ||||
| -rw-r--r-- | src/go/plugin/go.d/modules/prometheus/integrations/google_pagespeed.md (renamed from src/go/collectors/go.d.plugin/modules/prometheus/integrations/google_pagespeed.md) | 42 | ||||
| -rw-r--r-- | src/go/plugin/go.d/modules/prometheus/integrations/google_stackdriver.md (renamed from src/go/collectors/go.d.plugin/modules/prometheus/integrations/google_stackdriver.md) | 42 | ||||
| -rw-r--r-- | src/go/plugin/go.d/modules/prometheus/integrations/gpsd.md (renamed from src/go/collectors/go.d.plugin/modules/prometheus/integrations/gpsd.md) | 42 | ||||
| -rw-r--r-- | src/go/plugin/go.d/modules/prometheus/integrations/grafana.md (renamed from src/go/collectors/go.d.plugin/modules/prometheus/integrations/grafana.md) | 42 | ||||
| -rw-r--r-- | src/go/plugin/go.d/modules/prometheus/integrations/graylog_server.md (renamed from src/go/collectors/go.d.plugin/modules/prometheus/integrations/graylog_server.md) | 42 | ||||
| -rw-r--r-- | src/go/plugin/go.d/modules/prometheus/integrations/gtp.md (renamed from src/go/collectors/go.d.plugin/modules/prometheus/integrations/gtp.md) | 42 | ||||
| -rw-r--r-- | src/go/plugin/go.d/modules/prometheus/integrations/halon.md (renamed from src/go/collectors/go.d.plugin/modules/prometheus/integrations/halon.md) | 42 | ||||
| -rw-r--r-- | src/go/plugin/go.d/modules/prometheus/integrations/hana.md (renamed from src/go/collectors/go.d.plugin/modules/prometheus/integrations/hana.md) | 42 | ||||
| -rw-r--r-- | src/go/plugin/go.d/modules/prometheus/integrations/hashicorp_vault_secrets.md (renamed from src/go/collectors/go.d.plugin/modules/prometheus/integrations/hashicorp_vault_secrets.md) | 42 | ||||
| -rw-r--r-- | src/go/plugin/go.d/modules/prometheus/integrations/hasura_graphql_server.md (renamed from src/go/collectors/go.d.plugin/modules/prometheus/integrations/hasura_graphql_server.md) | 42 | ||||
| -rw-r--r-- | src/go/plugin/go.d/modules/prometheus/integrations/hdsentinel.md (renamed from src/go/collectors/go.d.plugin/modules/prometheus/integrations/hdsentinel.md) | 42 | ||||
| -rw-r--r-- | src/go/plugin/go.d/modules/prometheus/integrations/helium_hotspot.md (renamed from src/go/collectors/go.d.plugin/modules/prometheus/integrations/helium_hotspot.md) | 42 | ||||
| -rw-r--r-- | src/go/plugin/go.d/modules/prometheus/integrations/helium_miner_validator.md (renamed from src/go/collectors/go.d.plugin/modules/prometheus/integrations/helium_miner_validator.md) | 42 | ||||
| -rw-r--r-- | src/go/plugin/go.d/modules/prometheus/integrations/hhvm.md (renamed from src/go/collectors/go.d.plugin/modules/prometheus/integrations/hhvm.md) | 42 | ||||
| -rw-r--r-- | src/go/plugin/go.d/modules/prometheus/integrations/hitron_cgn_series_cpe.md (renamed from src/go/collectors/go.d.plugin/modules/prometheus/integrations/hitron_cgn_series_cpe.md) | 42 | ||||
| -rw-r--r-- | src/go/plugin/go.d/modules/prometheus/integrations/hitron_coda_cable_modem.md (renamed from src/go/collectors/go.d.plugin/modules/prometheus/integrations/hitron_coda_cable_modem.md) | 42 | ||||
| -rw-r--r-- | src/go/plugin/go.d/modules/prometheus/integrations/homebridge.md (renamed from src/go/collectors/go.d.plugin/modules/prometheus/integrations/homebridge.md) | 42 | ||||
| -rw-r--r-- | src/go/plugin/go.d/modules/prometheus/integrations/homey.md (renamed from src/go/collectors/go.d.plugin/modules/prometheus/integrations/homey.md) | 42 | ||||
| -rw-r--r-- | src/go/plugin/go.d/modules/prometheus/integrations/honeypot.md (renamed from src/go/collectors/go.d.plugin/modules/prometheus/integrations/honeypot.md) | 42 | ||||
| -rw-r--r-- | src/go/plugin/go.d/modules/prometheus/integrations/hp_ilo.md (renamed from src/go/collectors/go.d.plugin/modules/prometheus/integrations/hp_ilo.md) | 42 | ||||
| -rw-r--r-- | src/go/plugin/go.d/modules/prometheus/integrations/huawei_devices.md (renamed from src/go/collectors/go.d.plugin/modules/prometheus/integrations/huawei_devices.md) | 42 | ||||
| -rw-r--r-- | src/go/plugin/go.d/modules/prometheus/integrations/hubble.md (renamed from src/go/collectors/go.d.plugin/modules/prometheus/integrations/hubble.md) | 42 | ||||
| -rw-r--r-- | src/go/plugin/go.d/modules/prometheus/integrations/ibm_aix_systems_njmon.md (renamed from src/go/collectors/go.d.plugin/modules/prometheus/integrations/ibm_aix_systems_njmon.md) | 42 | ||||
| -rw-r--r-- | src/go/plugin/go.d/modules/prometheus/integrations/ibm_cryptoexpress_cex_cards.md (renamed from src/go/collectors/go.d.plugin/modules/prometheus/integrations/ibm_cryptoexpress_cex_cards.md) | 42 | ||||
| -rw-r--r-- | src/go/plugin/go.d/modules/prometheus/integrations/ibm_mq.md (renamed from src/go/collectors/go.d.plugin/modules/prometheus/integrations/ibm_mq.md) | 42 | ||||
| -rw-r--r-- | src/go/plugin/go.d/modules/prometheus/integrations/ibm_spectrum.md (renamed from src/go/collectors/go.d.plugin/modules/prometheus/integrations/ibm_spectrum.md) | 42 | ||||
| -rw-r--r-- | src/go/plugin/go.d/modules/prometheus/integrations/ibm_spectrum_virtualize.md (renamed from src/go/collectors/go.d.plugin/modules/prometheus/integrations/ibm_spectrum_virtualize.md) | 42 | ||||
| -rw-r--r-- | src/go/plugin/go.d/modules/prometheus/integrations/ibm_z_hardware_management_console.md (renamed from src/go/collectors/go.d.plugin/modules/prometheus/integrations/ibm_z_hardware_management_console.md) | 42 | ||||
| -rw-r--r-- | src/go/plugin/go.d/modules/prometheus/integrations/influxdb.md (renamed from src/go/collectors/go.d.plugin/modules/prometheus/integrations/influxdb.md) | 42 | ||||
| -rw-r--r-- | src/go/plugin/go.d/modules/prometheus/integrations/iota_full_node.md (renamed from src/go/collectors/go.d.plugin/modules/prometheus/integrations/iota_full_node.md) | 42 | ||||
| -rw-r--r-- | src/go/plugin/go.d/modules/prometheus/integrations/ipmi_by_soundcloud.md (renamed from src/go/collectors/go.d.plugin/modules/prometheus/integrations/ipmi_by_soundcloud.md) | 42 | ||||
| -rw-r--r-- | src/go/plugin/go.d/modules/prometheus/integrations/iqair_airvisual_air_quality_monitors.md (renamed from src/go/collectors/go.d.plugin/modules/prometheus/integrations/iqair_airvisual_air_quality_monitors.md) | 42 | ||||
| -rw-r--r-- | src/go/plugin/go.d/modules/prometheus/integrations/jarvis_standing_desk.md (renamed from src/go/collectors/go.d.plugin/modules/prometheus/integrations/jarvis_standing_desk.md) | 42 | ||||
| -rw-r--r-- | src/go/plugin/go.d/modules/prometheus/integrations/jenkins.md (renamed from src/go/collectors/go.d.plugin/modules/prometheus/integrations/jenkins.md) | 42 | ||||
| -rw-r--r-- | src/go/plugin/go.d/modules/prometheus/integrations/jetbrains_floating_license_server.md (renamed from src/go/collectors/go.d.plugin/modules/prometheus/integrations/jetbrains_floating_license_server.md) | 42 | ||||
| -rw-r--r-- | src/go/plugin/go.d/modules/prometheus/integrations/jmx.md (renamed from src/go/collectors/go.d.plugin/modules/prometheus/integrations/jmx.md) | 42 | ||||
| -rw-r--r-- | src/go/plugin/go.d/modules/prometheus/integrations/jolokia.md (renamed from src/go/collectors/go.d.plugin/modules/prometheus/integrations/jolokia.md) | 42 | ||||
| -rw-r--r-- | src/go/plugin/go.d/modules/prometheus/integrations/journald.md (renamed from src/go/collectors/go.d.plugin/modules/prometheus/integrations/journald.md) | 42 | ||||
| -rw-r--r-- | src/go/plugin/go.d/modules/prometheus/integrations/kafka.md (renamed from src/go/collectors/go.d.plugin/modules/prometheus/integrations/kafka.md) | 42 | ||||
| -rw-r--r-- | src/go/plugin/go.d/modules/prometheus/integrations/kafka_connect.md (renamed from src/go/collectors/go.d.plugin/modules/prometheus/integrations/kafka_connect.md) | 42 | ||||
| -rw-r--r-- | src/go/plugin/go.d/modules/prometheus/integrations/kafka_consumer_lag.md (renamed from src/go/collectors/go.d.plugin/modules/prometheus/integrations/kafka_consumer_lag.md) | 42 | ||||
| -rw-r--r-- | src/go/plugin/go.d/modules/prometheus/integrations/kafka_zookeeper.md (renamed from src/go/collectors/go.d.plugin/modules/prometheus/integrations/kafka_zookeeper.md) | 42 | ||||
| -rw-r--r-- | src/go/plugin/go.d/modules/prometheus/integrations/kannel.md (renamed from src/go/collectors/go.d.plugin/modules/prometheus/integrations/kannel.md) | 42 | ||||
| -rw-r--r-- | src/go/plugin/go.d/modules/prometheus/integrations/keepalived.md (renamed from src/go/collectors/go.d.plugin/modules/prometheus/integrations/keepalived.md) | 42 | ||||
| -rw-r--r-- | src/go/plugin/go.d/modules/prometheus/integrations/kubernetes_cluster_cloud_cost.md (renamed from src/go/collectors/go.d.plugin/modules/prometheus/integrations/kubernetes_cluster_cloud_cost.md) | 42 | ||||
| -rw-r--r-- | src/go/plugin/go.d/modules/prometheus/integrations/lagerist_disk_latency.md (renamed from src/go/collectors/go.d.plugin/modules/prometheus/integrations/lagerist_disk_latency.md) | 42 | ||||
| -rw-r--r-- | src/go/plugin/go.d/modules/prometheus/integrations/ldap.md (renamed from src/go/collectors/go.d.plugin/modules/prometheus/integrations/ldap.md) | 42 | ||||
| -rw-r--r-- | src/go/plugin/go.d/modules/prometheus/integrations/linode.md (renamed from src/go/collectors/go.d.plugin/modules/prometheus/integrations/linode.md) | 42 | ||||
| -rw-r--r-- | src/go/plugin/go.d/modules/prometheus/integrations/loki.md (renamed from src/go/collectors/go.d.plugin/modules/prometheus/integrations/loki.md) | 42 | ||||
| -rw-r--r-- | src/go/plugin/go.d/modules/prometheus/integrations/lustre_metadata.md (renamed from src/go/collectors/go.d.plugin/modules/prometheus/integrations/lustre_metadata.md) | 42 | ||||
| -rw-r--r-- | src/go/plugin/go.d/modules/prometheus/integrations/lynis_audit_reports.md (renamed from src/go/collectors/go.d.plugin/modules/prometheus/integrations/lynis_audit_reports.md) | 42 | ||||
| -rw-r--r-- | src/go/plugin/go.d/modules/prometheus/integrations/machbase.md (renamed from src/go/collectors/go.d.plugin/modules/prometheus/integrations/machbase.md) | 42 | ||||
| -rw-r--r-- | src/go/plugin/go.d/modules/prometheus/integrations/maildir.md (renamed from src/go/collectors/go.d.plugin/modules/prometheus/integrations/maildir.md) | 42 | ||||
| -rw-r--r-- | src/go/plugin/go.d/modules/prometheus/integrations/meilisearch.md (renamed from src/go/collectors/go.d.plugin/modules/prometheus/integrations/meilisearch.md) | 42 | ||||
| -rw-r--r-- | src/go/plugin/go.d/modules/prometheus/integrations/memcached_community.md (renamed from src/go/collectors/go.d.plugin/modules/prometheus/integrations/memcached_community.md) | 42 | ||||
| -rw-r--r-- | src/go/plugin/go.d/modules/prometheus/integrations/meraki_dashboard.md (renamed from src/go/collectors/go.d.plugin/modules/prometheus/integrations/meraki_dashboard.md) | 42 | ||||
| -rw-r--r-- | src/go/plugin/go.d/modules/prometheus/integrations/mesos.md (renamed from src/go/collectors/go.d.plugin/modules/prometheus/integrations/mesos.md) | 42 | ||||
| -rw-r--r-- | src/go/plugin/go.d/modules/prometheus/integrations/mikrotik_devices.md (renamed from src/go/collectors/go.d.plugin/modules/prometheus/integrations/mikrotik_devices.md) | 42 | ||||
| -rw-r--r-- | src/go/plugin/go.d/modules/prometheus/integrations/mikrotik_routeros_devices.md (renamed from src/go/collectors/go.d.plugin/modules/prometheus/integrations/mikrotik_routeros_devices.md) | 42 | ||||
| -rw-r--r-- | src/go/plugin/go.d/modules/prometheus/integrations/minecraft.md (renamed from src/go/collectors/go.d.plugin/modules/prometheus/integrations/minecraft.md) | 42 | ||||
| -rw-r--r-- | src/go/plugin/go.d/modules/prometheus/integrations/modbus_protocol.md (renamed from src/go/collectors/go.d.plugin/modules/prometheus/integrations/modbus_protocol.md) | 42 | ||||
| -rw-r--r-- | src/go/plugin/go.d/modules/prometheus/integrations/mogilefs.md (renamed from src/go/collectors/go.d.plugin/modules/prometheus/integrations/mogilefs.md) | 42 | ||||
| -rw-r--r-- | src/go/plugin/go.d/modules/prometheus/integrations/monnit_sensors_mqtt.md (renamed from src/go/collectors/go.d.plugin/modules/prometheus/integrations/monnit_sensors_mqtt.md) | 42 | ||||
| -rw-r--r-- | src/go/plugin/go.d/modules/prometheus/integrations/mosquitto.md (renamed from src/go/collectors/go.d.plugin/modules/prometheus/integrations/mosquitto.md) | 42 | ||||
| -rw-r--r-- | src/go/plugin/go.d/modules/prometheus/integrations/mp707_usb_thermometer.md (renamed from src/go/collectors/go.d.plugin/modules/prometheus/integrations/mp707_usb_thermometer.md) | 42 | ||||
| -rw-r--r-- | src/go/plugin/go.d/modules/prometheus/integrations/mqtt_blackbox.md (renamed from src/go/collectors/go.d.plugin/modules/prometheus/integrations/mqtt_blackbox.md) | 42 | ||||
| -rw-r--r-- | src/go/plugin/go.d/modules/prometheus/integrations/mtail.md (renamed from src/go/collectors/go.d.plugin/modules/prometheus/integrations/mtail.md) | 42 | ||||
| -rw-r--r-- | src/go/plugin/go.d/modules/prometheus/integrations/naemon.md (renamed from src/go/collectors/go.d.plugin/modules/prometheus/integrations/naemon.md) | 42 | ||||
| -rw-r--r-- | src/go/plugin/go.d/modules/prometheus/integrations/nagios.md (renamed from src/go/collectors/go.d.plugin/modules/prometheus/integrations/nagios.md) | 42 | ||||
| -rw-r--r-- | src/go/plugin/go.d/modules/prometheus/integrations/nature_remo_e_lite_devices.md (renamed from src/go/collectors/go.d.plugin/modules/prometheus/integrations/nature_remo_e_lite_devices.md) | 42 | ||||
| -rw-r--r-- | src/go/plugin/go.d/modules/prometheus/integrations/netapp_ontap_api.md (renamed from src/go/collectors/go.d.plugin/modules/prometheus/integrations/netapp_ontap_api.md) | 42 | ||||
| -rw-r--r-- | src/go/plugin/go.d/modules/prometheus/integrations/netapp_solidfire.md (renamed from src/go/collectors/go.d.plugin/modules/prometheus/integrations/netapp_solidfire.md) | 42 | ||||
| -rw-r--r-- | src/go/plugin/go.d/modules/prometheus/integrations/netatmo_sensors.md (renamed from src/go/collectors/go.d.plugin/modules/prometheus/integrations/netatmo_sensors.md) | 42 | ||||
| -rw-r--r-- | src/go/plugin/go.d/modules/prometheus/integrations/netflow.md (renamed from src/go/collectors/go.d.plugin/modules/prometheus/integrations/netflow.md) | 42 | ||||
| -rw-r--r-- | src/go/plugin/go.d/modules/prometheus/integrations/netmeter.md (renamed from src/go/collectors/go.d.plugin/modules/prometheus/integrations/netmeter.md) | 42 | ||||
| -rw-r--r-- | src/go/plugin/go.d/modules/prometheus/integrations/new_relic.md (renamed from src/go/collectors/go.d.plugin/modules/prometheus/integrations/new_relic.md) | 42 | ||||
| -rw-r--r-- | src/go/plugin/go.d/modules/prometheus/integrations/nextcloud_servers.md (renamed from src/go/collectors/go.d.plugin/modules/prometheus/integrations/nextcloud_servers.md) | 42 | ||||
| -rw-r--r-- | src/go/plugin/go.d/modules/prometheus/integrations/nextdns.md (renamed from src/go/collectors/go.d.plugin/modules/prometheus/integrations/nextdns.md) | 42 | ||||
| -rw-r--r-- | src/go/plugin/go.d/modules/prometheus/integrations/nftables.md (renamed from src/go/collectors/go.d.plugin/modules/prometheus/integrations/nftables.md) | 42 | ||||
| -rw-r--r-- | src/go/plugin/go.d/modules/prometheus/integrations/nrpe_daemon.md (renamed from src/go/collectors/go.d.plugin/modules/prometheus/integrations/nrpe_daemon.md) | 42 | ||||
| -rw-r--r-- | src/go/plugin/go.d/modules/prometheus/integrations/nsx-t.md (renamed from src/go/collectors/go.d.plugin/modules/prometheus/integrations/nsx-t.md) | 42 | ||||
| -rw-r--r-- | src/go/plugin/go.d/modules/prometheus/integrations/nvml.md (renamed from src/go/collectors/go.d.plugin/modules/prometheus/integrations/nvml.md) | 42 | ||||
| -rw-r--r-- | src/go/plugin/go.d/modules/prometheus/integrations/obs_studio.md (renamed from src/go/collectors/go.d.plugin/modules/prometheus/integrations/obs_studio.md) | 42 | ||||
| -rw-r--r-- | src/go/plugin/go.d/modules/prometheus/integrations/odbc.md (renamed from src/go/collectors/go.d.plugin/modules/prometheus/integrations/odbc.md) | 42 | ||||
| -rw-r--r-- | src/go/plugin/go.d/modules/prometheus/integrations/open_vswitch.md (renamed from src/go/collectors/go.d.plugin/modules/prometheus/integrations/open_vswitch.md) | 42 | ||||
| -rw-r--r-- | src/go/plugin/go.d/modules/prometheus/integrations/openhab.md (renamed from src/go/collectors/go.d.plugin/modules/prometheus/integrations/openhab.md) | 42 | ||||
| -rw-r--r-- | src/go/plugin/go.d/modules/prometheus/integrations/openldap_community.md (renamed from src/go/collectors/go.d.plugin/modules/prometheus/integrations/openldap_community.md) | 42 | ||||
| -rw-r--r-- | src/go/plugin/go.d/modules/prometheus/integrations/openrc.md (renamed from src/go/collectors/go.d.plugin/modules/prometheus/integrations/openrc.md) | 42 | ||||
| -rw-r--r-- | src/go/plugin/go.d/modules/prometheus/integrations/openrct2.md (renamed from src/go/collectors/go.d.plugin/modules/prometheus/integrations/openrct2.md) | 42 | ||||
| -rw-r--r-- | src/go/plugin/go.d/modules/prometheus/integrations/openroadm_devices.md (renamed from src/go/collectors/go.d.plugin/modules/prometheus/integrations/openroadm_devices.md) | 42 | ||||
| -rw-r--r-- | src/go/plugin/go.d/modules/prometheus/integrations/openstack.md (renamed from src/go/collectors/go.d.plugin/modules/prometheus/integrations/openstack.md) | 42 | ||||
| -rw-r--r-- | src/go/plugin/go.d/modules/prometheus/integrations/openvas.md (renamed from src/go/collectors/go.d.plugin/modules/prometheus/integrations/openvas.md) | 42 | ||||
| -rw-r--r-- | src/go/plugin/go.d/modules/prometheus/integrations/openweathermap.md (renamed from src/go/collectors/go.d.plugin/modules/prometheus/integrations/openweathermap.md) | 42 | ||||
| -rw-r--r-- | src/go/plugin/go.d/modules/prometheus/integrations/oracle_db_community.md (renamed from src/go/collectors/go.d.plugin/modules/prometheus/integrations/oracle_db_community.md) | 42 | ||||
| -rw-r--r-- | src/go/plugin/go.d/modules/prometheus/integrations/otrs.md (renamed from src/go/collectors/go.d.plugin/modules/prometheus/integrations/otrs.md) | 42 | ||||
| -rw-r--r-- | src/go/plugin/go.d/modules/prometheus/integrations/patroni.md (renamed from src/go/collectors/go.d.plugin/modules/prometheus/integrations/patroni.md) | 42 | ||||
| -rw-r--r-- | src/go/plugin/go.d/modules/prometheus/integrations/personal_weather_station.md (renamed from src/go/collectors/go.d.plugin/modules/prometheus/integrations/personal_weather_station.md) | 42 | ||||
| -rw-r--r-- | src/go/plugin/go.d/modules/prometheus/integrations/pgbackrest.md (renamed from src/go/collectors/go.d.plugin/modules/prometheus/integrations/pgbackrest.md) | 42 | ||||
| -rw-r--r-- | src/go/plugin/go.d/modules/prometheus/integrations/pgpool-ii.md (renamed from src/go/collectors/go.d.plugin/modules/prometheus/integrations/pgpool-ii.md) | 42 | ||||
| -rw-r--r-- | src/go/plugin/go.d/modules/prometheus/integrations/philips_hue.md (renamed from src/go/collectors/go.d.plugin/modules/prometheus/integrations/philips_hue.md) | 42 | ||||
| -rw-r--r-- | src/go/plugin/go.d/modules/prometheus/integrations/pimoroni_enviro+.md (renamed from src/go/collectors/go.d.plugin/modules/prometheus/integrations/pimoroni_enviro+.md) | 42 | ||||
| -rw-r--r-- | src/go/plugin/go.d/modules/prometheus/integrations/pingdom.md (renamed from src/go/collectors/go.d.plugin/modules/prometheus/integrations/pingdom.md) | 42 | ||||
| -rw-r--r-- | src/go/plugin/go.d/modules/prometheus/integrations/podman.md (renamed from src/go/collectors/go.d.plugin/modules/prometheus/integrations/podman.md) | 42 | ||||
| -rw-r--r-- | src/go/plugin/go.d/modules/prometheus/integrations/powerpal_devices.md (renamed from src/go/collectors/go.d.plugin/modules/prometheus/integrations/powerpal_devices.md) | 42 | ||||
| -rw-r--r-- | src/go/plugin/go.d/modules/prometheus/integrations/proftpd.md (renamed from src/go/collectors/go.d.plugin/modules/prometheus/integrations/proftpd.md) | 42 | ||||
| -rw-r--r-- | src/go/plugin/go.d/modules/prometheus/integrations/prometheus_endpoint.md (renamed from src/go/collectors/go.d.plugin/modules/prometheus/integrations/prometheus_endpoint.md) | 42 | ||||
| -rw-r--r-- | src/go/plugin/go.d/modules/prometheus/integrations/proxmox_ve.md (renamed from src/go/collectors/go.d.plugin/modules/prometheus/integrations/proxmox_ve.md) | 42 | ||||
| -rw-r--r-- | src/go/plugin/go.d/modules/prometheus/integrations/radio_thermostat.md (renamed from src/go/collectors/go.d.plugin/modules/prometheus/integrations/radio_thermostat.md) | 42 | ||||
| -rw-r--r-- | src/go/plugin/go.d/modules/prometheus/integrations/radius.md (renamed from src/go/collectors/go.d.plugin/modules/prometheus/integrations/radius.md) | 42 | ||||
| -rw-r--r-- | src/go/plugin/go.d/modules/prometheus/integrations/rancher.md (renamed from src/go/collectors/go.d.plugin/modules/prometheus/integrations/rancher.md) | 42 | ||||
| -rw-r--r-- | src/go/plugin/go.d/modules/prometheus/integrations/raritan_pdu.md (renamed from src/go/collectors/go.d.plugin/modules/prometheus/integrations/raritan_pdu.md) | 42 | ||||
| -rw-r--r-- | src/go/plugin/go.d/modules/prometheus/integrations/redis_queue.md (renamed from src/go/collectors/go.d.plugin/modules/prometheus/integrations/redis_queue.md) | 42 | ||||
| -rw-r--r-- | src/go/plugin/go.d/modules/prometheus/integrations/ripe_atlas.md (renamed from src/go/collectors/go.d.plugin/modules/prometheus/integrations/ripe_atlas.md) | 42 | ||||
| -rw-r--r-- | src/go/plugin/go.d/modules/prometheus/integrations/sabnzbd.md (renamed from src/go/collectors/go.d.plugin/modules/prometheus/integrations/sabnzbd.md) | 42 | ||||
| -rw-r--r-- | src/go/plugin/go.d/modules/prometheus/integrations/salicru_eqx_inverter.md (renamed from src/go/collectors/go.d.plugin/modules/prometheus/integrations/salicru_eqx_inverter.md) | 42 | ||||
| -rw-r--r-- | src/go/plugin/go.d/modules/prometheus/integrations/sense_energy.md (renamed from src/go/collectors/go.d.plugin/modules/prometheus/integrations/sense_energy.md) | 42 | ||||
| -rw-r--r-- | src/go/plugin/go.d/modules/prometheus/integrations/sentry.md (renamed from src/go/collectors/go.d.plugin/modules/prometheus/integrations/sentry.md) | 42 | ||||
| -rw-r--r-- | src/go/plugin/go.d/modules/prometheus/integrations/servertech.md (renamed from src/go/collectors/go.d.plugin/modules/prometheus/integrations/servertech.md) | 42 | ||||
| -rw-r--r-- | src/go/plugin/go.d/modules/prometheus/integrations/shell_command.md (renamed from src/go/collectors/go.d.plugin/modules/prometheus/integrations/shell_command.md) | 42 | ||||
| -rw-r--r-- | src/go/plugin/go.d/modules/prometheus/integrations/shelly_humidity_sensor.md (renamed from src/go/collectors/go.d.plugin/modules/prometheus/integrations/shelly_humidity_sensor.md) | 42 | ||||
| -rw-r--r-- | src/go/plugin/go.d/modules/prometheus/integrations/sia.md (renamed from src/go/collectors/go.d.plugin/modules/prometheus/integrations/sia.md) | 42 | ||||
| -rw-r--r-- | src/go/plugin/go.d/modules/prometheus/integrations/siemens_s7_plc.md (renamed from src/go/collectors/go.d.plugin/modules/prometheus/integrations/siemens_s7_plc.md) | 42 | ||||
| -rw-r--r-- | src/go/plugin/go.d/modules/prometheus/integrations/site_24x7.md (renamed from src/go/collectors/go.d.plugin/modules/prometheus/integrations/site_24x7.md) | 42 | ||||
| -rw-r--r-- | src/go/plugin/go.d/modules/prometheus/integrations/slurm.md (renamed from src/go/collectors/go.d.plugin/modules/prometheus/integrations/slurm.md) | 42 | ||||
| -rw-r--r-- | src/go/plugin/go.d/modules/prometheus/integrations/sma_inverters.md (renamed from src/go/collectors/go.d.plugin/modules/prometheus/integrations/sma_inverters.md) | 42 | ||||
| -rw-r--r-- | src/go/plugin/go.d/modules/prometheus/integrations/smart_meters_sml.md (renamed from src/go/collectors/go.d.plugin/modules/prometheus/integrations/smart_meters_sml.md) | 42 | ||||
| -rw-r--r-- | src/go/plugin/go.d/modules/prometheus/integrations/smartrg_808ac_cable_modem.md (renamed from src/go/collectors/go.d.plugin/modules/prometheus/integrations/smartrg_808ac_cable_modem.md) | 42 | ||||
| -rw-r--r-- | src/go/plugin/go.d/modules/prometheus/integrations/softether_vpn_server.md (renamed from src/go/collectors/go.d.plugin/modules/prometheus/integrations/softether_vpn_server.md) | 42 | ||||
| -rw-r--r-- | src/go/plugin/go.d/modules/prometheus/integrations/solar_logging_stick.md (renamed from src/go/collectors/go.d.plugin/modules/prometheus/integrations/solar_logging_stick.md) | 42 | ||||
| -rw-r--r-- | src/go/plugin/go.d/modules/prometheus/integrations/solaredge_inverters.md (renamed from src/go/collectors/go.d.plugin/modules/prometheus/integrations/solaredge_inverters.md) | 42 | ||||
| -rw-r--r-- | src/go/plugin/go.d/modules/prometheus/integrations/solis_ginlong_5g_inverters.md (renamed from src/go/collectors/go.d.plugin/modules/prometheus/integrations/solis_ginlong_5g_inverters.md) | 42 | ||||
| -rw-r--r-- | src/go/plugin/go.d/modules/prometheus/integrations/sonic_nos.md (renamed from src/go/collectors/go.d.plugin/modules/prometheus/integrations/sonic_nos.md) | 42 | ||||
| -rw-r--r-- | src/go/plugin/go.d/modules/prometheus/integrations/spacelift.md (renamed from src/go/collectors/go.d.plugin/modules/prometheus/integrations/spacelift.md) | 42 | ||||
| -rw-r--r-- | src/go/plugin/go.d/modules/prometheus/integrations/speedify_cli.md (renamed from src/go/collectors/go.d.plugin/modules/prometheus/integrations/speedify_cli.md) | 42 | ||||
| -rw-r--r-- | src/go/plugin/go.d/modules/prometheus/integrations/sphinx.md (renamed from src/go/collectors/go.d.plugin/modules/prometheus/integrations/sphinx.md) | 42 | ||||
| -rw-r--r-- | src/go/plugin/go.d/modules/prometheus/integrations/sql_database_agnostic.md (renamed from src/go/collectors/go.d.plugin/modules/prometheus/integrations/sql_database_agnostic.md) | 42 | ||||
| -rw-r--r-- | src/go/plugin/go.d/modules/prometheus/integrations/ssh.md (renamed from src/go/collectors/go.d.plugin/modules/prometheus/integrations/ssh.md) | 42 | ||||
| -rw-r--r-- | src/go/plugin/go.d/modules/prometheus/integrations/ssl_certificate.md (renamed from src/go/collectors/go.d.plugin/modules/prometheus/integrations/ssl_certificate.md) | 42 | ||||
| -rw-r--r-- | src/go/plugin/go.d/modules/prometheus/integrations/starlink_spacex.md (renamed from src/go/collectors/go.d.plugin/modules/prometheus/integrations/starlink_spacex.md) | 42 | ||||
| -rw-r--r-- | src/go/plugin/go.d/modules/prometheus/integrations/starwind_vsan_vsphere_edition.md (renamed from src/go/collectors/go.d.plugin/modules/prometheus/integrations/starwind_vsan_vsphere_edition.md) | 42 | ||||
| -rw-r--r-- | src/go/plugin/go.d/modules/prometheus/integrations/statuspage.md (renamed from src/go/collectors/go.d.plugin/modules/prometheus/integrations/statuspage.md) | 42 | ||||
| -rw-r--r-- | src/go/plugin/go.d/modules/prometheus/integrations/steam.md (renamed from src/go/collectors/go.d.plugin/modules/prometheus/integrations/steam.md) | 42 | ||||
| -rw-r--r-- | src/go/plugin/go.d/modules/prometheus/integrations/storidge.md (renamed from src/go/collectors/go.d.plugin/modules/prometheus/integrations/storidge.md) | 42 | ||||
| -rw-r--r-- | src/go/plugin/go.d/modules/prometheus/integrations/stream.md (renamed from src/go/collectors/go.d.plugin/modules/prometheus/integrations/stream.md) | 42 | ||||
| -rw-r--r-- | src/go/plugin/go.d/modules/prometheus/integrations/strongswan.md (renamed from src/go/collectors/go.d.plugin/modules/prometheus/integrations/strongswan.md) | 42 | ||||
| -rw-r--r-- | src/go/plugin/go.d/modules/prometheus/integrations/sunspec_solar_energy.md (renamed from src/go/collectors/go.d.plugin/modules/prometheus/integrations/sunspec_solar_energy.md) | 42 | ||||
| -rw-r--r-- | src/go/plugin/go.d/modules/prometheus/integrations/suricata.md (renamed from src/go/collectors/go.d.plugin/modules/prometheus/integrations/suricata.md) | 42 | ||||
| -rw-r--r-- | src/go/plugin/go.d/modules/prometheus/integrations/synology_activebackup.md (renamed from src/go/collectors/go.d.plugin/modules/prometheus/integrations/synology_activebackup.md) | 42 | ||||
| -rw-r--r-- | src/go/plugin/go.d/modules/prometheus/integrations/sysload.md (renamed from src/go/collectors/go.d.plugin/modules/prometheus/integrations/sysload.md) | 42 | ||||
| -rw-r--r-- | src/go/plugin/go.d/modules/prometheus/integrations/t-rex_nvidia_gpu_miner.md (renamed from src/go/collectors/go.d.plugin/modules/prometheus/integrations/t-rex_nvidia_gpu_miner.md) | 42 | ||||
| -rw-r--r-- | src/go/plugin/go.d/modules/prometheus/integrations/tacacs.md (renamed from src/go/collectors/go.d.plugin/modules/prometheus/integrations/tacacs.md) | 42 | ||||
| -rw-r--r-- | src/go/plugin/go.d/modules/prometheus/integrations/tado_smart_heating_solution.md (renamed from src/go/collectors/go.d.plugin/modules/prometheus/integrations/tado_smart_heating_solution.md) | 42 | ||||
| -rw-r--r-- | src/go/plugin/go.d/modules/prometheus/integrations/tankerkoenig_api.md (renamed from src/go/collectors/go.d.plugin/modules/prometheus/integrations/tankerkoenig_api.md) | 42 | ||||
| -rw-r--r-- | src/go/plugin/go.d/modules/prometheus/integrations/tesla_powerwall.md (renamed from src/go/collectors/go.d.plugin/modules/prometheus/integrations/tesla_powerwall.md) | 42 | ||||
| -rw-r--r-- | src/go/plugin/go.d/modules/prometheus/integrations/tesla_vehicle.md (renamed from src/go/collectors/go.d.plugin/modules/prometheus/integrations/tesla_vehicle.md) | 42 | ||||
| -rw-r--r-- | src/go/plugin/go.d/modules/prometheus/integrations/tesla_wall_connector.md (renamed from src/go/collectors/go.d.plugin/modules/prometheus/integrations/tesla_wall_connector.md) | 42 | ||||
| -rw-r--r-- | src/go/plugin/go.d/modules/prometheus/integrations/tp-link_p110.md (renamed from src/go/collectors/go.d.plugin/modules/prometheus/integrations/tp-link_p110.md) | 42 | ||||
| -rw-r--r-- | src/go/plugin/go.d/modules/prometheus/integrations/traceroute.md (renamed from src/go/collectors/go.d.plugin/modules/prometheus/integrations/traceroute.md) | 42 | ||||
| -rw-r--r-- | src/go/plugin/go.d/modules/prometheus/integrations/twincat_ads_web_service.md (renamed from src/go/collectors/go.d.plugin/modules/prometheus/integrations/twincat_ads_web_service.md) | 42 | ||||
| -rw-r--r-- | src/go/plugin/go.d/modules/prometheus/integrations/twitch.md (renamed from src/go/collectors/go.d.plugin/modules/prometheus/integrations/twitch.md) | 42 | ||||
| -rw-r--r-- | src/go/plugin/go.d/modules/prometheus/integrations/ubiquiti_ufiber_olt.md (renamed from src/go/collectors/go.d.plugin/modules/prometheus/integrations/ubiquiti_ufiber_olt.md) | 42 | ||||
| -rw-r--r-- | src/go/plugin/go.d/modules/prometheus/integrations/uptimerobot.md (renamed from src/go/collectors/go.d.plugin/modules/prometheus/integrations/uptimerobot.md) | 42 | ||||
| -rw-r--r-- | src/go/plugin/go.d/modules/prometheus/integrations/vault_pki.md (renamed from src/go/collectors/go.d.plugin/modules/prometheus/integrations/vault_pki.md) | 42 | ||||
| -rw-r--r-- | src/go/plugin/go.d/modules/prometheus/integrations/vertica.md (renamed from src/go/collectors/go.d.plugin/modules/prometheus/integrations/vertica.md) | 42 | ||||
| -rw-r--r-- | src/go/plugin/go.d/modules/prometheus/integrations/vscode.md (renamed from src/go/collectors/go.d.plugin/modules/prometheus/integrations/vscode.md) | 42 | ||||
| -rw-r--r-- | src/go/plugin/go.d/modules/prometheus/integrations/warp10.md (renamed from src/go/collectors/go.d.plugin/modules/prometheus/integrations/warp10.md) | 42 | ||||
| -rw-r--r-- | src/go/plugin/go.d/modules/prometheus/integrations/xiaomi_mi_flora.md (renamed from src/go/collectors/go.d.plugin/modules/prometheus/integrations/xiaomi_mi_flora.md) | 42 | ||||
| -rw-r--r-- | src/go/plugin/go.d/modules/prometheus/integrations/xmpp_server.md (renamed from src/go/collectors/go.d.plugin/modules/prometheus/integrations/xmpp_server.md) | 42 | ||||
| -rw-r--r-- | src/go/plugin/go.d/modules/prometheus/integrations/yourls_url_shortener.md (renamed from src/go/collectors/go.d.plugin/modules/prometheus/integrations/yourls_url_shortener.md) | 42 | ||||
| -rw-r--r-- | src/go/plugin/go.d/modules/prometheus/integrations/zerto.md (renamed from src/go/collectors/go.d.plugin/modules/prometheus/integrations/zerto.md) | 42 | ||||
| -rw-r--r-- | src/go/plugin/go.d/modules/prometheus/integrations/zulip.md (renamed from src/go/collectors/go.d.plugin/modules/prometheus/integrations/zulip.md) | 42 | ||||
| -rw-r--r-- | src/go/plugin/go.d/modules/prometheus/integrations/zyxel_gs1200-8.md (renamed from src/go/collectors/go.d.plugin/modules/prometheus/integrations/zyxel_gs1200-8.md) | 42 | ||||
| -rw-r--r-- | src/go/plugin/go.d/modules/prometheus/metadata.yaml (renamed from src/go/collectors/go.d.plugin/modules/prometheus/metadata.yaml) | 3 | ||||
| -rw-r--r-- | src/go/plugin/go.d/modules/prometheus/prometheus.go (renamed from src/go/collectors/go.d.plugin/modules/prometheus/prometheus.go) | 10 | ||||
| -rw-r--r-- | src/go/plugin/go.d/modules/prometheus/prometheus_test.go (renamed from src/go/collectors/go.d.plugin/modules/prometheus/prometheus_test.go) | 6 | ||||
| -rw-r--r-- | src/go/plugin/go.d/modules/prometheus/testdata/config.json (renamed from src/go/collectors/go.d.plugin/modules/prometheus/testdata/config.json) | 0 | ||||
| -rw-r--r-- | src/go/plugin/go.d/modules/prometheus/testdata/config.yaml (renamed from src/go/collectors/go.d.plugin/modules/prometheus/testdata/config.yaml) | 0 | ||||
| l--------- | src/go/plugin/go.d/modules/proxysql/README.md (renamed from src/go/collectors/go.d.plugin/modules/proxysql/README.md) | 0 | ||||
| -rw-r--r-- | src/go/plugin/go.d/modules/proxysql/cache.go (renamed from src/go/collectors/go.d.plugin/modules/proxysql/cache.go) | 0 | ||||
| -rw-r--r-- | src/go/plugin/go.d/modules/proxysql/charts.go (renamed from src/go/collectors/go.d.plugin/modules/proxysql/charts.go) | 2 | ||||
| -rw-r--r-- | src/go/plugin/go.d/modules/proxysql/collect.go (renamed from src/go/collectors/go.d.plugin/modules/proxysql/collect.go) | 0 | ||||
| -rw-r--r-- | src/go/plugin/go.d/modules/proxysql/config_schema.json (renamed from src/go/collectors/go.d.plugin/modules/proxysql/config_schema.json) | 0 | ||||
| -rw-r--r-- | src/go/plugin/go.d/modules/proxysql/integrations/proxysql.md (renamed from src/go/collectors/go.d.plugin/modules/proxysql/integrations/proxysql.md) | 39 | ||||
| -rw-r--r-- | src/go/plugin/go.d/modules/proxysql/metadata.yaml (renamed from src/go/collectors/go.d.plugin/modules/proxysql/metadata.yaml) | 0 | ||||
| -rw-r--r-- | src/go/plugin/go.d/modules/proxysql/proxysql.go (renamed from src/go/collectors/go.d.plugin/modules/proxysql/proxysql.go) | 4 | ||||
| -rw-r--r-- | src/go/plugin/go.d/modules/proxysql/proxysql_test.go (renamed from src/go/collectors/go.d.plugin/modules/proxysql/proxysql_test.go) | 2 | ||||
| -rw-r--r-- | src/go/plugin/go.d/modules/proxysql/testdata/config.json (renamed from src/go/collectors/go.d.plugin/modules/proxysql/testdata/config.json) | 0 | ||||
| -rw-r--r-- | src/go/plugin/go.d/modules/proxysql/testdata/config.yaml (renamed from src/go/collectors/go.d.plugin/modules/proxysql/testdata/config.yaml) | 0 | ||||
| -rw-r--r-- | src/go/plugin/go.d/modules/proxysql/testdata/v2.0.10/stats_memory_metrics.txt (renamed from src/go/collectors/go.d.plugin/modules/proxysql/testdata/v2.0.10/stats_memory_metrics.txt) | 0 | ||||
| -rw-r--r-- | src/go/plugin/go.d/modules/proxysql/testdata/v2.0.10/stats_mysql_commands_counters.txt (renamed from src/go/collectors/go.d.plugin/modules/proxysql/testdata/v2.0.10/stats_mysql_commands_counters.txt) | 0 | ||||
| -rw-r--r-- | src/go/plugin/go.d/modules/proxysql/testdata/v2.0.10/stats_mysql_connection_pool .txt (renamed from src/go/collectors/go.d.plugin/modules/proxysql/testdata/v2.0.10/stats_mysql_connection_pool .txt) | 0 | ||||
| -rw-r--r-- | src/go/plugin/go.d/modules/proxysql/testdata/v2.0.10/stats_mysql_global.txt (renamed from src/go/collectors/go.d.plugin/modules/proxysql/testdata/v2.0.10/stats_mysql_global.txt) | 0 | ||||
| -rw-r--r-- | src/go/plugin/go.d/modules/proxysql/testdata/v2.0.10/stats_mysql_users.txt (renamed from src/go/collectors/go.d.plugin/modules/proxysql/testdata/v2.0.10/stats_mysql_users.txt) | 0 | ||||
| -rw-r--r-- | src/go/plugin/go.d/modules/proxysql/testdata/v2.0.10/version.txt (renamed from src/go/collectors/go.d.plugin/modules/proxysql/testdata/v2.0.10/version.txt) | 0 | ||||
| l--------- | src/go/plugin/go.d/modules/pulsar/README.md (renamed from src/go/collectors/go.d.plugin/modules/pulsar/README.md) | 0 | ||||
| -rw-r--r-- | src/go/plugin/go.d/modules/pulsar/cache.go (renamed from src/go/collectors/go.d.plugin/modules/pulsar/cache.go) | 0 | ||||
| -rw-r--r-- | src/go/plugin/go.d/modules/pulsar/charts.go (renamed from src/go/collectors/go.d.plugin/modules/pulsar/charts.go) | 4 | ||||
| -rw-r--r-- | src/go/plugin/go.d/modules/pulsar/collect.go (renamed from src/go/collectors/go.d.plugin/modules/pulsar/collect.go) | 4 | ||||
| -rw-r--r-- | src/go/plugin/go.d/modules/pulsar/config_schema.json (renamed from src/go/collectors/go.d.plugin/modules/pulsar/config_schema.json) | 6 | ||||
| -rw-r--r-- | src/go/plugin/go.d/modules/pulsar/init.go (renamed from src/go/collectors/go.d.plugin/modules/pulsar/init.go) | 6 | ||||
| -rw-r--r-- | src/go/plugin/go.d/modules/pulsar/integrations/apache_pulsar.md (renamed from src/go/collectors/go.d.plugin/modules/pulsar/integrations/apache_pulsar.md) | 39 | ||||
| -rw-r--r-- | src/go/plugin/go.d/modules/pulsar/metadata.yaml (renamed from src/go/collectors/go.d.plugin/modules/pulsar/metadata.yaml) | 0 | ||||
| -rw-r--r-- | src/go/plugin/go.d/modules/pulsar/metrics.go (renamed from src/go/collectors/go.d.plugin/modules/pulsar/metrics.go) | 0 | ||||
| -rw-r--r-- | src/go/plugin/go.d/modules/pulsar/pulsar.go (renamed from src/go/collectors/go.d.plugin/modules/pulsar/pulsar.go) | 8 | ||||
| -rw-r--r-- | src/go/plugin/go.d/modules/pulsar/pulsar_test.go (renamed from src/go/collectors/go.d.plugin/modules/pulsar/pulsar_test.go) | 8 | ||||
| -rw-r--r-- | src/go/plugin/go.d/modules/pulsar/testdata/config.json (renamed from src/go/collectors/go.d.plugin/modules/pulsar/testdata/config.json) | 0 | ||||
| -rw-r--r-- | src/go/plugin/go.d/modules/pulsar/testdata/config.yaml (renamed from src/go/collectors/go.d.plugin/modules/pulsar/testdata/config.yaml) | 0 | ||||
| -rw-r--r-- | src/go/plugin/go.d/modules/pulsar/testdata/non-pulsar.txt (renamed from src/go/collectors/go.d.plugin/modules/pulsar/testdata/non-pulsar.txt) | 0 | ||||
| -rw-r--r-- | src/go/plugin/go.d/modules/pulsar/testdata/standalone-v2.5.0-namespaces.txt (renamed from src/go/collectors/go.d.plugin/modules/pulsar/testdata/standalone-v2.5.0-namespaces.txt) | 0 | ||||
| -rw-r--r-- | src/go/plugin/go.d/modules/pulsar/testdata/standalone-v2.5.0-topics-2.txt (renamed from src/go/collectors/go.d.plugin/modules/pulsar/testdata/standalone-v2.5.0-topics-2.txt) | 0 | ||||
| -rw-r--r-- | src/go/plugin/go.d/modules/pulsar/testdata/standalone-v2.5.0-topics.txt (renamed from src/go/collectors/go.d.plugin/modules/pulsar/testdata/standalone-v2.5.0-topics.txt) | 0 | ||||
| l--------- | src/go/plugin/go.d/modules/puppet/README.md (renamed from src/collectors/python.d.plugin/puppet/README.md) | 0 | ||||
| -rw-r--r-- | src/go/plugin/go.d/modules/puppet/charts.go | 93 | ||||
| -rw-r--r-- | src/go/plugin/go.d/modules/puppet/collect.go | 75 | ||||
| -rw-r--r-- | src/go/plugin/go.d/modules/puppet/config_schema.json | 177 | ||||
| -rw-r--r-- | src/go/plugin/go.d/modules/puppet/integrations/puppet.md | 233 | ||||
| -rw-r--r-- | src/go/plugin/go.d/modules/puppet/metadata.yaml | 184 | ||||
| -rw-r--r-- | src/go/plugin/go.d/modules/puppet/puppet.go | 114 | ||||
| -rw-r--r-- | src/go/plugin/go.d/modules/puppet/puppet_test.go | 252 | ||||
| -rw-r--r-- | src/go/plugin/go.d/modules/puppet/response.go | 32 | ||||
| -rw-r--r-- | src/go/plugin/go.d/modules/puppet/testdata/config.json (renamed from src/go/collectors/go.d.plugin/modules/tengine/testdata/config.json) | 0 | ||||
| -rw-r--r-- | src/go/plugin/go.d/modules/puppet/testdata/config.yaml (renamed from src/go/collectors/go.d.plugin/modules/tengine/testdata/config.yaml) | 0 | ||||
| -rw-r--r-- | src/go/plugin/go.d/modules/puppet/testdata/serviceStatusResponse.json | 497 | ||||
| l--------- | src/go/plugin/go.d/modules/rabbitmq/README.md (renamed from src/go/collectors/go.d.plugin/modules/rabbitmq/README.md) | 0 | ||||
| -rw-r--r-- | src/go/plugin/go.d/modules/rabbitmq/charts.go (renamed from src/go/collectors/go.d.plugin/modules/rabbitmq/charts.go) | 2 | ||||
| -rw-r--r-- | src/go/plugin/go.d/modules/rabbitmq/collect.go (renamed from src/go/collectors/go.d.plugin/modules/rabbitmq/collect.go) | 8 | ||||
| -rw-r--r-- | src/go/plugin/go.d/modules/rabbitmq/config_schema.json (renamed from src/go/collectors/go.d.plugin/modules/rabbitmq/config_schema.json) | 6 | ||||
| -rw-r--r-- | src/go/plugin/go.d/modules/rabbitmq/integrations/rabbitmq.md (renamed from src/go/collectors/go.d.plugin/modules/rabbitmq/integrations/rabbitmq.md) | 39 | ||||
| -rw-r--r-- | src/go/plugin/go.d/modules/rabbitmq/metadata.yaml (renamed from src/go/collectors/go.d.plugin/modules/rabbitmq/metadata.yaml) | 0 | ||||
| -rw-r--r-- | src/go/plugin/go.d/modules/rabbitmq/metrics.go (renamed from src/go/collectors/go.d.plugin/modules/rabbitmq/metrics.go) | 0 | ||||
| -rw-r--r-- | src/go/plugin/go.d/modules/rabbitmq/rabbitmq.go (renamed from src/go/collectors/go.d.plugin/modules/rabbitmq/rabbitmq.go) | 4 | ||||
| -rw-r--r-- | src/go/plugin/go.d/modules/rabbitmq/rabbitmq_test.go (renamed from src/go/collectors/go.d.plugin/modules/rabbitmq/rabbitmq_test.go) | 4 | ||||
| -rw-r--r-- | src/go/plugin/go.d/modules/rabbitmq/testdata/config.json (renamed from src/go/collectors/go.d.plugin/modules/rabbitmq/testdata/config.json) | 0 | ||||
| -rw-r--r-- | src/go/plugin/go.d/modules/rabbitmq/testdata/config.yaml (renamed from src/go/collectors/go.d.plugin/modules/rabbitmq/testdata/config.yaml) | 0 | ||||
| -rw-r--r-- | src/go/plugin/go.d/modules/rabbitmq/testdata/v3.11.5/api-nodes-node.json (renamed from src/go/collectors/go.d.plugin/modules/rabbitmq/testdata/v3.11.5/api-nodes-node.json) | 0 | ||||
| -rw-r--r-- | src/go/plugin/go.d/modules/rabbitmq/testdata/v3.11.5/api-overview.json (renamed from src/go/collectors/go.d.plugin/modules/rabbitmq/testdata/v3.11.5/api-overview.json) | 0 | ||||
| -rw-r--r-- | src/go/plugin/go.d/modules/rabbitmq/testdata/v3.11.5/api-queues.json (renamed from src/go/collectors/go.d.plugin/modules/rabbitmq/testdata/v3.11.5/api-queues.json) | 0 | ||||
| -rw-r--r-- | src/go/plugin/go.d/modules/rabbitmq/testdata/v3.11.5/api-vhosts.json (renamed from src/go/collectors/go.d.plugin/modules/rabbitmq/testdata/v3.11.5/api-vhosts.json) | 0 | ||||
| l--------- | src/go/plugin/go.d/modules/redis/README.md (renamed from src/go/collectors/go.d.plugin/modules/redis/README.md) | 0 | ||||
| -rw-r--r-- | src/go/plugin/go.d/modules/redis/charts.go (renamed from src/go/collectors/go.d.plugin/modules/redis/charts.go) | 2 | ||||
| -rw-r--r-- | src/go/plugin/go.d/modules/redis/collect.go (renamed from src/go/collectors/go.d.plugin/modules/redis/collect.go) | 0 | ||||
| -rw-r--r-- | src/go/plugin/go.d/modules/redis/collect_info.go (renamed from src/go/collectors/go.d.plugin/modules/redis/collect_info.go) | 2 | ||||
| -rw-r--r-- | src/go/plugin/go.d/modules/redis/collect_ping_latency.go (renamed from src/go/collectors/go.d.plugin/modules/redis/collect_ping_latency.go) | 0 | ||||
| -rw-r--r-- | src/go/plugin/go.d/modules/redis/config_schema.json (renamed from src/go/collectors/go.d.plugin/modules/redis/config_schema.json) | 5 | ||||
| -rw-r--r-- | src/go/plugin/go.d/modules/redis/init.go (renamed from src/go/collectors/go.d.plugin/modules/redis/init.go) | 4 | ||||
| -rw-r--r-- | src/go/plugin/go.d/modules/redis/integrations/redis.md (renamed from src/go/collectors/go.d.plugin/modules/redis/integrations/redis.md) | 39 | ||||
| -rw-r--r-- | src/go/plugin/go.d/modules/redis/metadata.yaml (renamed from src/go/collectors/go.d.plugin/modules/redis/metadata.yaml) | 0 | ||||
| -rw-r--r-- | src/go/plugin/go.d/modules/redis/redis.go (renamed from src/go/collectors/go.d.plugin/modules/redis/redis.go) | 8 | ||||
| -rw-r--r-- | src/go/plugin/go.d/modules/redis/redis_test.go (renamed from src/go/collectors/go.d.plugin/modules/redis/redis_test.go) | 4 | ||||
| -rw-r--r-- | src/go/plugin/go.d/modules/redis/testdata/config.json (renamed from src/go/collectors/go.d.plugin/modules/redis/testdata/config.json) | 0 | ||||
| -rw-r--r-- | src/go/plugin/go.d/modules/redis/testdata/config.yaml (renamed from src/go/collectors/go.d.plugin/modules/redis/testdata/config.yaml) | 0 | ||||
| -rw-r--r-- | src/go/plugin/go.d/modules/redis/testdata/pika/info_all.txt (renamed from src/go/collectors/go.d.plugin/modules/redis/testdata/pika/info_all.txt) | 0 | ||||
| -rw-r--r-- | src/go/plugin/go.d/modules/redis/testdata/v6.0.9/info_all.txt (renamed from src/go/collectors/go.d.plugin/modules/redis/testdata/v6.0.9/info_all.txt) | 0 | ||||
| l--------- | src/go/plugin/go.d/modules/rethinkdb/README.md (renamed from src/collectors/python.d.plugin/rethinkdbs/README.md) | 0 | ||||
| -rw-r--r-- | src/go/plugin/go.d/modules/rethinkdb/charts.go | 189 | ||||
| -rw-r--r-- | src/go/plugin/go.d/modules/rethinkdb/client.go | 72 | ||||
| -rw-r--r-- | src/go/plugin/go.d/modules/rethinkdb/collect.go | 123 | ||||
| -rw-r--r-- | src/go/plugin/go.d/modules/rethinkdb/config_schema.json | 82 | ||||
| -rw-r--r-- | src/go/plugin/go.d/modules/rethinkdb/integrations/rethinkdb.md | 257 | ||||
| -rw-r--r-- | src/go/plugin/go.d/modules/rethinkdb/metadata.yaml | 198 | ||||
| -rw-r--r-- | src/go/plugin/go.d/modules/rethinkdb/rethinkdb.go | 107 | ||||
| -rw-r--r-- | src/go/plugin/go.d/modules/rethinkdb/rethinkdb_test.go | 267 | ||||
| -rw-r--r-- | src/go/plugin/go.d/modules/rethinkdb/testdata/config.json | 7 | ||||
| -rw-r--r-- | src/go/plugin/go.d/modules/rethinkdb/testdata/config.yaml | 5 | ||||
| -rw-r--r-- | src/go/plugin/go.d/modules/rethinkdb/testdata/v2.4.4/stats.txt | 4 | ||||
| l--------- | src/go/plugin/go.d/modules/riakkv/README.md | 1 | ||||
| -rw-r--r-- | src/go/plugin/go.d/modules/riakkv/charts.go | 461 | ||||
| -rw-r--r-- | src/go/plugin/go.d/modules/riakkv/collect.go | 74 | ||||
| -rw-r--r-- | src/go/plugin/go.d/modules/riakkv/config_schema.json | 186 | ||||
| -rw-r--r-- | src/go/plugin/go.d/modules/riakkv/integrations/riak_kv.md | 283 | ||||
| -rw-r--r-- | src/go/plugin/go.d/modules/riakkv/metadata.yaml (renamed from src/collectors/python.d.plugin/riakkv/metadata.yaml) | 204 | ||||
| -rw-r--r-- | src/go/plugin/go.d/modules/riakkv/riakkv.go | 122 | ||||
| -rw-r--r-- | src/go/plugin/go.d/modules/riakkv/riakkv_test.go | 265 | ||||
| -rw-r--r-- | src/go/plugin/go.d/modules/riakkv/stats.go | 112 | ||||
| -rw-r--r-- | src/go/plugin/go.d/modules/riakkv/testdata/config.json (renamed from src/go/collectors/go.d.plugin/modules/traefik/testdata/config.json) | 0 | ||||
| -rw-r--r-- | src/go/plugin/go.d/modules/riakkv/testdata/config.yaml (renamed from src/go/collectors/go.d.plugin/modules/traefik/testdata/config.yaml) | 0 | ||||
| -rw-r--r-- | src/go/plugin/go.d/modules/riakkv/testdata/stats.json | 478 | ||||
| l--------- | src/go/plugin/go.d/modules/rspamd/README.md (renamed from src/go/collectors/go.d.plugin/modules/rspamd/README.md) | 0 | ||||
| -rw-r--r-- | src/go/plugin/go.d/modules/rspamd/charts.go (renamed from src/go/collectors/go.d.plugin/modules/rspamd/charts.go) | 2 | ||||
| -rw-r--r-- | src/go/plugin/go.d/modules/rspamd/collect.go (renamed from src/go/collectors/go.d.plugin/modules/rspamd/collect.go) | 8 | ||||
| -rw-r--r-- | src/go/plugin/go.d/modules/rspamd/config_schema.json (renamed from src/go/collectors/go.d.plugin/modules/rspamd/config_schema.json) | 6 | ||||
| -rw-r--r-- | src/go/plugin/go.d/modules/rspamd/integrations/rspamd.md (renamed from src/go/collectors/go.d.plugin/modules/rspamd/integrations/rspamd.md) | 39 | ||||
| -rw-r--r-- | src/go/plugin/go.d/modules/rspamd/metadata.yaml (renamed from src/go/collectors/go.d.plugin/modules/rspamd/metadata.yaml) | 0 | ||||
| -rw-r--r-- | src/go/plugin/go.d/modules/rspamd/rspamd.go (renamed from src/go/collectors/go.d.plugin/modules/rspamd/rspamd.go) | 4 | ||||
| -rw-r--r-- | src/go/plugin/go.d/modules/rspamd/rspamd_test.go (renamed from src/go/collectors/go.d.plugin/modules/rspamd/rspamd_test.go) | 4 | ||||
| -rw-r--r-- | src/go/plugin/go.d/modules/rspamd/testdata/config.json (renamed from src/go/collectors/go.d.plugin/modules/vcsa/testdata/config.json) | 0 | ||||
| -rw-r--r-- | src/go/plugin/go.d/modules/rspamd/testdata/config.yaml (renamed from src/go/collectors/go.d.plugin/modules/vcsa/testdata/config.yaml) | 0 | ||||
| -rw-r--r-- | src/go/plugin/go.d/modules/rspamd/testdata/v3.4-stat.json (renamed from src/go/collectors/go.d.plugin/modules/rspamd/testdata/v3.4-stat.json) | 0 | ||||
| l--------- | src/go/plugin/go.d/modules/scaleio/README.md (renamed from src/go/collectors/go.d.plugin/modules/scaleio/README.md) | 0 | ||||
| -rw-r--r-- | src/go/plugin/go.d/modules/scaleio/charts.go (renamed from src/go/collectors/go.d.plugin/modules/scaleio/charts.go) | 4 | ||||
| -rw-r--r-- | src/go/plugin/go.d/modules/scaleio/client/client.go (renamed from src/go/collectors/go.d.plugin/modules/scaleio/client/client.go) | 2 | ||||
| -rw-r--r-- | src/go/plugin/go.d/modules/scaleio/client/client_test.go (renamed from src/go/collectors/go.d.plugin/modules/scaleio/client/client_test.go) | 2 | ||||
| -rw-r--r-- | src/go/plugin/go.d/modules/scaleio/client/server.go (renamed from src/go/collectors/go.d.plugin/modules/scaleio/client/server.go) | 0 | ||||
| -rw-r--r-- | src/go/plugin/go.d/modules/scaleio/client/types.go (renamed from src/go/collectors/go.d.plugin/modules/scaleio/client/types.go) | 0 | ||||
| -rw-r--r-- | src/go/plugin/go.d/modules/scaleio/collect.go (renamed from src/go/collectors/go.d.plugin/modules/scaleio/collect.go) | 4 | ||||
| -rw-r--r-- | src/go/plugin/go.d/modules/scaleio/collect_sdc.go (renamed from src/go/collectors/go.d.plugin/modules/scaleio/collect_sdc.go) | 2 | ||||
| -rw-r--r-- | src/go/plugin/go.d/modules/scaleio/collect_storage_pool.go (renamed from src/go/collectors/go.d.plugin/modules/scaleio/collect_storage_pool.go) | 2 | ||||
| -rw-r--r-- | src/go/plugin/go.d/modules/scaleio/collect_system.go (renamed from src/go/collectors/go.d.plugin/modules/scaleio/collect_system.go) | 2 | ||||
| -rw-r--r-- | src/go/plugin/go.d/modules/scaleio/config_schema.json (renamed from src/go/collectors/go.d.plugin/modules/scaleio/config_schema.json) | 6 | ||||
| -rw-r--r-- | src/go/plugin/go.d/modules/scaleio/integrations/dell_emc_scaleio.md (renamed from src/go/collectors/go.d.plugin/modules/scaleio/integrations/dell_emc_scaleio.md) | 39 | ||||
| -rw-r--r-- | src/go/plugin/go.d/modules/scaleio/metadata.yaml (renamed from src/go/collectors/go.d.plugin/modules/scaleio/metadata.yaml) | 0 | ||||
| -rw-r--r-- | src/go/plugin/go.d/modules/scaleio/metrics.go (renamed from src/go/collectors/go.d.plugin/modules/scaleio/metrics.go) | 0 | ||||
| -rw-r--r-- | src/go/plugin/go.d/modules/scaleio/queries.go (renamed from src/go/collectors/go.d.plugin/modules/scaleio/queries.go) | 2 | ||||
| -rw-r--r-- | src/go/plugin/go.d/modules/scaleio/scaleio.go (renamed from src/go/collectors/go.d.plugin/modules/scaleio/scaleio.go) | 6 | ||||
| -rw-r--r-- | src/go/plugin/go.d/modules/scaleio/scaleio_test.go (renamed from src/go/collectors/go.d.plugin/modules/scaleio/scaleio_test.go) | 4 | ||||
| -rw-r--r-- | src/go/plugin/go.d/modules/scaleio/testdata/config.json (renamed from src/go/collectors/go.d.plugin/modules/vernemq/testdata/config.json) | 0 | ||||
| -rw-r--r-- | src/go/plugin/go.d/modules/scaleio/testdata/config.yaml (renamed from src/go/collectors/go.d.plugin/modules/vernemq/testdata/config.yaml) | 0 | ||||
| -rw-r--r-- | src/go/plugin/go.d/modules/scaleio/testdata/instances.json (renamed from src/go/collectors/go.d.plugin/modules/scaleio/testdata/instances.json) | 0 | ||||
| -rw-r--r-- | src/go/plugin/go.d/modules/scaleio/testdata/selected_statistics.json (renamed from src/go/collectors/go.d.plugin/modules/scaleio/testdata/selected_statistics.json) | 0 | ||||
| l--------- | src/go/plugin/go.d/modules/sensors/README.md (renamed from src/go/collectors/go.d.plugin/modules/sensors/README.md) | 0 | ||||
| -rw-r--r-- | src/go/plugin/go.d/modules/sensors/charts.go (renamed from src/go/collectors/go.d.plugin/modules/sensors/charts.go) | 2 | ||||
| -rw-r--r-- | src/go/plugin/go.d/modules/sensors/collect.go (renamed from src/go/collectors/go.d.plugin/modules/sensors/collect.go) | 0 | ||||
| -rw-r--r-- | src/go/plugin/go.d/modules/sensors/config_schema.json (renamed from src/go/collectors/go.d.plugin/modules/sensors/config_schema.json) | 0 | ||||
| -rw-r--r-- | src/go/plugin/go.d/modules/sensors/exec.go (renamed from src/go/collectors/go.d.plugin/modules/sensors/exec.go) | 2 | ||||
| -rw-r--r-- | src/go/plugin/go.d/modules/sensors/init.go (renamed from src/go/collectors/go.d.plugin/modules/sensors/init.go) | 0 | ||||
| -rw-r--r-- | src/go/plugin/go.d/modules/sensors/integrations/linux_sensors_lm-sensors.md (renamed from src/go/collectors/go.d.plugin/modules/sensors/integrations/linux_sensors_lm-sensors.md) | 39 | ||||
| -rw-r--r-- | src/go/plugin/go.d/modules/sensors/metadata.yaml (renamed from src/go/collectors/go.d.plugin/modules/sensors/metadata.yaml) | 0 | ||||
| -rw-r--r-- | src/go/plugin/go.d/modules/sensors/sensors.go (renamed from src/go/collectors/go.d.plugin/modules/sensors/sensors.go) | 4 | ||||
| -rw-r--r-- | src/go/plugin/go.d/modules/sensors/sensors_test.go (renamed from src/go/collectors/go.d.plugin/modules/sensors/sensors_test.go) | 2 | ||||
| -rw-r--r-- | src/go/plugin/go.d/modules/sensors/testdata/config.json (renamed from src/go/collectors/go.d.plugin/modules/zfspool/testdata/config.json) | 0 | ||||
| -rw-r--r-- | src/go/plugin/go.d/modules/sensors/testdata/config.yaml (renamed from src/go/collectors/go.d.plugin/modules/zfspool/testdata/config.yaml) | 0 | ||||
| -rw-r--r-- | src/go/plugin/go.d/modules/sensors/testdata/sensors-temp-in-curr-power-fan.txt (renamed from src/go/collectors/go.d.plugin/modules/sensors/testdata/sensors-temp-in-curr-power-fan.txt) | 0 | ||||
| -rw-r--r-- | src/go/plugin/go.d/modules/sensors/testdata/sensors-temp.txt (renamed from src/go/collectors/go.d.plugin/modules/sensors/testdata/sensors-temp.txt) | 0 | ||||
| l--------- | src/go/plugin/go.d/modules/smartctl/README.md (renamed from src/go/collectors/go.d.plugin/modules/smartctl/README.md) | 0 | ||||
| -rw-r--r-- | src/go/plugin/go.d/modules/smartctl/charts.go (renamed from src/go/collectors/go.d.plugin/modules/smartctl/charts.go) | 82 | ||||
| -rw-r--r-- | src/go/plugin/go.d/modules/smartctl/collect.go (renamed from src/go/collectors/go.d.plugin/modules/smartctl/collect.go) | 31 | ||||
| -rw-r--r-- | src/go/plugin/go.d/modules/smartctl/config_schema.json (renamed from src/go/collectors/go.d.plugin/modules/smartctl/config_schema.json) | 47 | ||||
| -rw-r--r-- | src/go/plugin/go.d/modules/smartctl/exec.go (renamed from src/go/collectors/go.d.plugin/modules/smartctl/exec.go) | 7 | ||||
| -rw-r--r-- | src/go/plugin/go.d/modules/smartctl/init.go (renamed from src/go/collectors/go.d.plugin/modules/smartctl/init.go) | 11 | ||||
| -rw-r--r-- | src/go/plugin/go.d/modules/smartctl/integrations/s.m.a.r.t..md (renamed from src/go/collectors/go.d.plugin/modules/smartctl/integrations/s.m.a.r.t..md) | 109 | ||||
| -rw-r--r-- | src/go/plugin/go.d/modules/smartctl/metadata.yaml (renamed from src/go/collectors/go.d.plugin/modules/smartctl/metadata.yaml) | 81 | ||||
| -rw-r--r-- | src/go/plugin/go.d/modules/smartctl/scan.go (renamed from src/go/collectors/go.d.plugin/modules/smartctl/scan.go) | 66 | ||||
| -rw-r--r-- | src/go/plugin/go.d/modules/smartctl/smart_device.go (renamed from src/go/collectors/go.d.plugin/modules/smartctl/smart_device.go) | 4 | ||||
| -rw-r--r-- | src/go/plugin/go.d/modules/smartctl/smartctl.go (renamed from src/go/collectors/go.d.plugin/modules/smartctl/smartctl.go) | 32 | ||||
| -rw-r--r-- | src/go/plugin/go.d/modules/smartctl/smartctl_test.go (renamed from src/go/collectors/go.d.plugin/modules/smartctl/smartctl_test.go) | 84 | ||||
| -rw-r--r-- | src/go/plugin/go.d/modules/smartctl/testdata/config.json (renamed from src/go/collectors/go.d.plugin/modules/smartctl/testdata/config.json) | 8 | ||||
| -rw-r--r-- | src/go/plugin/go.d/modules/smartctl/testdata/config.yaml (renamed from src/go/collectors/go.d.plugin/modules/smartctl/testdata/config.yaml) | 5 | ||||
| -rw-r--r-- | src/go/plugin/go.d/modules/smartctl/testdata/type-nvme/device-nvme0.json (renamed from src/go/collectors/go.d.plugin/modules/smartctl/testdata/type-nvme/device-nvme0.json) | 0 | ||||
| -rw-r--r-- | src/go/plugin/go.d/modules/smartctl/testdata/type-nvme/device-nvme1.json | 113 | ||||
| -rw-r--r-- | src/go/plugin/go.d/modules/smartctl/testdata/type-nvme/scan.json (renamed from src/go/collectors/go.d.plugin/modules/smartctl/testdata/type-nvme/scan.json) | 0 | ||||
| -rw-r--r-- | src/go/plugin/go.d/modules/smartctl/testdata/type-sat/device-hdd-sda.json (renamed from src/go/collectors/go.d.plugin/modules/smartctl/testdata/type-sat/device-hdd-sda.json) | 0 | ||||
| -rw-r--r-- | src/go/plugin/go.d/modules/smartctl/testdata/type-sat/device-ssd-sdc.json (renamed from src/go/collectors/go.d.plugin/modules/smartctl/testdata/type-sat/device-ssd-sdc.json) | 0 | ||||
| -rw-r--r-- | src/go/plugin/go.d/modules/smartctl/testdata/type-sat/scan.json (renamed from src/go/collectors/go.d.plugin/modules/smartctl/testdata/type-sat/scan.json) | 0 | ||||
| -rw-r--r-- | src/go/plugin/go.d/modules/smartctl/testdata/type-scsi/device-sda.json | 128 | ||||
| -rw-r--r-- | src/go/plugin/go.d/modules/smartctl/testdata/type-scsi/scan.json | 29 | ||||
| l--------- | src/go/plugin/go.d/modules/snmp/README.md (renamed from src/go/collectors/go.d.plugin/modules/snmp/README.md) | 0 | ||||
| -rw-r--r-- | src/go/plugin/go.d/modules/snmp/charts.go | 309 | ||||
| -rw-r--r-- | src/go/plugin/go.d/modules/snmp/collect.go | 395 | ||||
| -rw-r--r-- | src/go/plugin/go.d/modules/snmp/config.go | 52 | ||||
| -rw-r--r-- | src/go/plugin/go.d/modules/snmp/config_schema.json (renamed from src/go/collectors/go.d.plugin/modules/snmp/config_schema.json) | 67 | ||||
| -rw-r--r-- | src/go/plugin/go.d/modules/snmp/init.go | 175 | ||||
| -rw-r--r-- | src/go/plugin/go.d/modules/snmp/integrations/snmp_devices.md (renamed from src/go/collectors/go.d.plugin/modules/snmp/integrations/snmp_devices.md) | 226 | ||||
| -rw-r--r-- | src/go/plugin/go.d/modules/snmp/metadata.yaml (renamed from src/go/collectors/go.d.plugin/modules/snmp/metadata.yaml) | 216 | ||||
| -rw-r--r-- | src/go/plugin/go.d/modules/snmp/netif.go | 412 | ||||
| -rw-r--r-- | src/go/plugin/go.d/modules/snmp/snmp.go | 155 | ||||
| -rw-r--r-- | src/go/plugin/go.d/modules/snmp/snmp_test.go | 754 | ||||
| -rw-r--r-- | src/go/plugin/go.d/modules/snmp/testdata/config.json (renamed from src/go/collectors/go.d.plugin/modules/snmp/testdata/config.json) | 7 | ||||
| -rw-r--r-- | src/go/plugin/go.d/modules/snmp/testdata/config.yaml (renamed from src/go/collectors/go.d.plugin/modules/snmp/testdata/config.yaml) | 4 | ||||
| l--------- | src/go/plugin/go.d/modules/squid/README.md (renamed from src/collectors/python.d.plugin/squid/README.md) | 0 | ||||
| -rw-r--r-- | src/go/plugin/go.d/modules/squid/charts.go | 81 | ||||
| -rw-r--r-- | src/go/plugin/go.d/modules/squid/collect.go | 105 | ||||
| -rw-r--r-- | src/go/plugin/go.d/modules/squid/config_schema.json | 177 | ||||
| -rw-r--r-- | src/go/plugin/go.d/modules/squid/integrations/squid.md | 227 | ||||
| -rw-r--r-- | src/go/plugin/go.d/modules/squid/metadata.yaml (renamed from src/collectors/python.d.plugin/squid/metadata.yaml) | 143 | ||||
| -rw-r--r-- | src/go/plugin/go.d/modules/squid/squid.go | 114 | ||||
| -rw-r--r-- | src/go/plugin/go.d/modules/squid/squid_test.go | 223 | ||||
| -rw-r--r-- | src/go/plugin/go.d/modules/squid/testdata/config.json | 20 | ||||
| -rw-r--r-- | src/go/plugin/go.d/modules/squid/testdata/config.yaml | 17 | ||||
| -rw-r--r-- | src/go/plugin/go.d/modules/squid/testdata/counters.txt | 59 | ||||
| l--------- | src/go/plugin/go.d/modules/squidlog/README.md (renamed from src/go/collectors/go.d.plugin/modules/squidlog/README.md) | 0 | ||||
| -rw-r--r-- | src/go/plugin/go.d/modules/squidlog/charts.go (renamed from src/go/collectors/go.d.plugin/modules/squidlog/charts.go) | 2 | ||||
| -rw-r--r-- | src/go/plugin/go.d/modules/squidlog/collect.go (renamed from src/go/collectors/go.d.plugin/modules/squidlog/collect.go) | 6 | ||||
| -rw-r--r-- | src/go/plugin/go.d/modules/squidlog/config_schema.json (renamed from src/go/collectors/go.d.plugin/modules/squidlog/config_schema.json) | 0 | ||||
| -rw-r--r-- | src/go/plugin/go.d/modules/squidlog/init.go (renamed from src/go/collectors/go.d.plugin/modules/squidlog/init.go) | 51 | ||||
| -rw-r--r-- | src/go/plugin/go.d/modules/squidlog/integrations/squid_log_files.md (renamed from src/go/collectors/go.d.plugin/modules/squidlog/integrations/squid_log_files.md) | 39 | ||||
| -rw-r--r-- | src/go/plugin/go.d/modules/squidlog/logline.go (renamed from src/go/collectors/go.d.plugin/modules/squidlog/logline.go) | 10 | ||||
| -rw-r--r-- | src/go/plugin/go.d/modules/squidlog/logline_test.go (renamed from src/go/collectors/go.d.plugin/modules/squidlog/logline_test.go) | 6 | ||||
| -rw-r--r-- | src/go/plugin/go.d/modules/squidlog/metadata.yaml (renamed from src/go/collectors/go.d.plugin/modules/squidlog/metadata.yaml) | 0 | ||||
| -rw-r--r-- | src/go/plugin/go.d/modules/squidlog/metrics.go (renamed from src/go/collectors/go.d.plugin/modules/squidlog/metrics.go) | 2 | ||||
| -rw-r--r-- | src/go/plugin/go.d/modules/squidlog/squidlog.go (renamed from src/go/collectors/go.d.plugin/modules/squidlog/squidlog.go) | 4 | ||||
| -rw-r--r-- | src/go/plugin/go.d/modules/squidlog/squidlog_test.go (renamed from src/go/collectors/go.d.plugin/modules/squidlog/squidlog_test.go) | 6 | ||||
| -rw-r--r-- | src/go/plugin/go.d/modules/squidlog/testdata/access.log (renamed from src/go/collectors/go.d.plugin/modules/squidlog/testdata/access.log) | 0 | ||||
| -rw-r--r-- | src/go/plugin/go.d/modules/squidlog/testdata/config.json (renamed from src/go/collectors/go.d.plugin/modules/squidlog/testdata/config.json) | 0 | ||||
| -rw-r--r-- | src/go/plugin/go.d/modules/squidlog/testdata/config.yaml (renamed from src/go/collectors/go.d.plugin/modules/squidlog/testdata/config.yaml) | 0 | ||||
| -rw-r--r-- | src/go/plugin/go.d/modules/squidlog/testdata/unknown.log (renamed from src/go/collectors/go.d.plugin/modules/squidlog/testdata/unknown.log) | 0 | ||||
| l--------- | src/go/plugin/go.d/modules/storcli/README.md (renamed from src/go/collectors/go.d.plugin/modules/storcli/README.md) | 0 | ||||
| -rw-r--r-- | src/go/plugin/go.d/modules/storcli/charts.go (renamed from src/go/collectors/go.d.plugin/modules/storcli/charts.go) | 2 | ||||
| -rw-r--r-- | src/go/plugin/go.d/modules/storcli/collect.go (renamed from src/go/collectors/go.d.plugin/modules/storcli/collect.go) | 0 | ||||
| -rw-r--r-- | src/go/plugin/go.d/modules/storcli/collect_controllers.go (renamed from src/go/collectors/go.d.plugin/modules/storcli/collect_controllers.go) | 0 | ||||
| -rw-r--r-- | src/go/plugin/go.d/modules/storcli/collect_drives.go (renamed from src/go/collectors/go.d.plugin/modules/storcli/collect_drives.go) | 0 | ||||
| -rw-r--r-- | src/go/plugin/go.d/modules/storcli/config_schema.json (renamed from src/go/collectors/go.d.plugin/modules/storcli/config_schema.json) | 0 | ||||
| -rw-r--r-- | src/go/plugin/go.d/modules/storcli/exec.go (renamed from src/go/collectors/go.d.plugin/modules/storcli/exec.go) | 2 | ||||
| -rw-r--r-- | src/go/plugin/go.d/modules/storcli/init.go (renamed from src/go/collectors/go.d.plugin/modules/storcli/init.go) | 2 | ||||
| -rw-r--r-- | src/go/plugin/go.d/modules/storcli/integrations/storecli_raid.md (renamed from src/go/collectors/go.d.plugin/modules/storcli/integrations/storecli_raid.md) | 39 | ||||
| -rw-r--r-- | src/go/plugin/go.d/modules/storcli/metadata.yaml (renamed from src/go/collectors/go.d.plugin/modules/storcli/metadata.yaml) | 0 | ||||
| -rw-r--r-- | src/go/plugin/go.d/modules/storcli/storcli.go (renamed from src/go/collectors/go.d.plugin/modules/storcli/storcli.go) | 4 | ||||
| -rw-r--r-- | src/go/plugin/go.d/modules/storcli/storcli_test.go (renamed from src/go/collectors/go.d.plugin/modules/storcli/storcli_test.go) | 2 | ||||
| -rw-r--r-- | src/go/plugin/go.d/modules/storcli/testdata/config.json | 4 | ||||
| -rw-r--r-- | src/go/plugin/go.d/modules/storcli/testdata/config.yaml | 2 | ||||
| -rw-r--r-- | src/go/plugin/go.d/modules/storcli/testdata/megaraid-controllers-info.json (renamed from src/go/collectors/go.d.plugin/modules/storcli/testdata/megaraid-controllers-info.json) | 0 | ||||
| -rw-r--r-- | src/go/plugin/go.d/modules/storcli/testdata/megaraid-drives-info.json (renamed from src/go/collectors/go.d.plugin/modules/storcli/testdata/megaraid-drives-info.json) | 0 | ||||
| -rw-r--r-- | src/go/plugin/go.d/modules/storcli/testdata/mpt3sas-controllers-info.json (renamed from src/go/collectors/go.d.plugin/modules/storcli/testdata/mpt3sas-controllers-info.json) | 0 | ||||
| l--------- | src/go/plugin/go.d/modules/supervisord/README.md (renamed from src/go/collectors/go.d.plugin/modules/supervisord/README.md) | 0 | ||||
| -rw-r--r-- | src/go/plugin/go.d/modules/supervisord/charts.go (renamed from src/go/collectors/go.d.plugin/modules/supervisord/charts.go) | 2 | ||||
| -rw-r--r-- | src/go/plugin/go.d/modules/supervisord/client.go (renamed from src/go/collectors/go.d.plugin/modules/supervisord/client.go) | 0 | ||||
| -rw-r--r-- | src/go/plugin/go.d/modules/supervisord/collect.go (renamed from src/go/collectors/go.d.plugin/modules/supervisord/collect.go) | 2 | ||||
| -rw-r--r-- | src/go/plugin/go.d/modules/supervisord/config_schema.json (renamed from src/go/collectors/go.d.plugin/modules/supervisord/config_schema.json) | 0 | ||||
| -rw-r--r-- | src/go/plugin/go.d/modules/supervisord/init.go (renamed from src/go/collectors/go.d.plugin/modules/supervisord/init.go) | 2 | ||||
| -rw-r--r-- | src/go/plugin/go.d/modules/supervisord/integrations/supervisor.md (renamed from src/go/collectors/go.d.plugin/modules/supervisord/integrations/supervisor.md) | 39 | ||||
| -rw-r--r-- | src/go/plugin/go.d/modules/supervisord/metadata.yaml (renamed from src/go/collectors/go.d.plugin/modules/supervisord/metadata.yaml) | 0 | ||||
| -rw-r--r-- | src/go/plugin/go.d/modules/supervisord/supervisord.go (renamed from src/go/collectors/go.d.plugin/modules/supervisord/supervisord.go) | 4 | ||||
| -rw-r--r-- | src/go/plugin/go.d/modules/supervisord/supervisord_test.go (renamed from src/go/collectors/go.d.plugin/modules/supervisord/supervisord_test.go) | 2 | ||||
| -rw-r--r-- | src/go/plugin/go.d/modules/supervisord/testdata/config.json (renamed from src/go/collectors/go.d.plugin/modules/supervisord/testdata/config.json) | 0 | ||||
| -rw-r--r-- | src/go/plugin/go.d/modules/supervisord/testdata/config.yaml (renamed from src/go/collectors/go.d.plugin/modules/supervisord/testdata/config.yaml) | 0 | ||||
| l--------- | src/go/plugin/go.d/modules/systemdunits/README.md (renamed from src/go/collectors/go.d.plugin/modules/systemdunits/README.md) | 0 | ||||
| -rw-r--r-- | src/go/plugin/go.d/modules/systemdunits/charts.go (renamed from src/go/collectors/go.d.plugin/modules/systemdunits/charts.go) | 2 | ||||
| -rw-r--r-- | src/go/plugin/go.d/modules/systemdunits/client.go (renamed from src/go/collectors/go.d.plugin/modules/systemdunits/client.go) | 0 | ||||
| -rw-r--r-- | src/go/plugin/go.d/modules/systemdunits/collect.go (renamed from src/go/collectors/go.d.plugin/modules/systemdunits/collect.go) | 0 | ||||
| -rw-r--r-- | src/go/plugin/go.d/modules/systemdunits/collect_unit_files.go (renamed from src/go/collectors/go.d.plugin/modules/systemdunits/collect_unit_files.go) | 0 | ||||
| -rw-r--r-- | src/go/plugin/go.d/modules/systemdunits/collect_units.go (renamed from src/go/collectors/go.d.plugin/modules/systemdunits/collect_units.go) | 0 | ||||
| -rw-r--r-- | src/go/plugin/go.d/modules/systemdunits/config_schema.json (renamed from src/go/collectors/go.d.plugin/modules/systemdunits/config_schema.json) | 0 | ||||
| -rw-r--r-- | src/go/plugin/go.d/modules/systemdunits/doc.go (renamed from src/go/collectors/go.d.plugin/modules/systemdunits/doc.go) | 0 | ||||
| -rw-r--r-- | src/go/plugin/go.d/modules/systemdunits/init.go (renamed from src/go/collectors/go.d.plugin/modules/systemdunits/init.go) | 2 | ||||
| -rw-r--r-- | src/go/plugin/go.d/modules/systemdunits/integrations/systemd_units.md (renamed from src/go/collectors/go.d.plugin/modules/systemdunits/integrations/systemd_units.md) | 39 | ||||
| -rw-r--r-- | src/go/plugin/go.d/modules/systemdunits/metadata.yaml (renamed from src/go/collectors/go.d.plugin/modules/systemdunits/metadata.yaml) | 0 | ||||
| -rw-r--r-- | src/go/plugin/go.d/modules/systemdunits/systemdunits.go (renamed from src/go/collectors/go.d.plugin/modules/systemdunits/systemdunits.go) | 6 | ||||
| -rw-r--r-- | src/go/plugin/go.d/modules/systemdunits/systemdunits_test.go (renamed from src/go/collectors/go.d.plugin/modules/systemdunits/systemdunits_test.go) | 2 | ||||
| -rw-r--r-- | src/go/plugin/go.d/modules/systemdunits/testdata/config.json (renamed from src/go/collectors/go.d.plugin/modules/systemdunits/testdata/config.json) | 0 | ||||
| -rw-r--r-- | src/go/plugin/go.d/modules/systemdunits/testdata/config.yaml (renamed from src/go/collectors/go.d.plugin/modules/systemdunits/testdata/config.yaml) | 0 | ||||
| l--------- | src/go/plugin/go.d/modules/tengine/README.md (renamed from src/go/collectors/go.d.plugin/modules/tengine/README.md) | 0 | ||||
| -rw-r--r-- | src/go/plugin/go.d/modules/tengine/apiclient.go (renamed from src/go/collectors/go.d.plugin/modules/tengine/apiclient.go) | 2 | ||||
| -rw-r--r-- | src/go/plugin/go.d/modules/tengine/charts.go (renamed from src/go/collectors/go.d.plugin/modules/tengine/charts.go) | 2 | ||||
| -rw-r--r-- | src/go/plugin/go.d/modules/tengine/collect.go (renamed from src/go/collectors/go.d.plugin/modules/tengine/collect.go) | 2 | ||||
| -rw-r--r-- | src/go/plugin/go.d/modules/tengine/config_schema.json (renamed from src/go/collectors/go.d.plugin/modules/tengine/config_schema.json) | 6 | ||||
| -rw-r--r-- | src/go/plugin/go.d/modules/tengine/integrations/tengine.md (renamed from src/go/collectors/go.d.plugin/modules/tengine/integrations/tengine.md) | 39 | ||||
| -rw-r--r-- | src/go/plugin/go.d/modules/tengine/metadata.yaml (renamed from src/go/collectors/go.d.plugin/modules/tengine/metadata.yaml) | 0 | ||||
| -rw-r--r-- | src/go/plugin/go.d/modules/tengine/metrics.go (renamed from src/go/collectors/go.d.plugin/modules/tengine/metrics.go) | 0 | ||||
| -rw-r--r-- | src/go/plugin/go.d/modules/tengine/tengine.go (renamed from src/go/collectors/go.d.plugin/modules/tengine/tengine.go) | 4 | ||||
| -rw-r--r-- | src/go/plugin/go.d/modules/tengine/tengine_test.go (renamed from src/go/collectors/go.d.plugin/modules/tengine/tengine_test.go) | 2 | ||||
| -rw-r--r-- | src/go/plugin/go.d/modules/tengine/testdata/config.json | 20 | ||||
| -rw-r--r-- | src/go/plugin/go.d/modules/tengine/testdata/config.yaml | 17 | ||||
| -rw-r--r-- | src/go/plugin/go.d/modules/tengine/testdata/status.txt (renamed from src/go/collectors/go.d.plugin/modules/tengine/testdata/status.txt) | 0 | ||||
| l--------- | src/go/plugin/go.d/modules/tomcat/README.md (renamed from src/collectors/python.d.plugin/tomcat/README.md) | 0 | ||||
| -rw-r--r-- | src/go/plugin/go.d/modules/tomcat/charts.go | 196 | ||||
| -rw-r--r-- | src/go/plugin/go.d/modules/tomcat/collect.go | 130 | ||||
| -rw-r--r-- | src/go/plugin/go.d/modules/tomcat/config_schema.json | 183 | ||||
| -rw-r--r-- | src/go/plugin/go.d/modules/tomcat/init.go | 21 | ||||
| -rw-r--r-- | src/go/plugin/go.d/modules/tomcat/integrations/tomcat.md | 275 | ||||
| -rw-r--r-- | src/go/plugin/go.d/modules/tomcat/metadata.yaml | 241 | ||||
| -rw-r--r-- | src/go/plugin/go.d/modules/tomcat/status_response.go | 51 | ||||
| -rw-r--r-- | src/go/plugin/go.d/modules/tomcat/testdata/config.json | 20 | ||||
| -rw-r--r-- | src/go/plugin/go.d/modules/tomcat/testdata/config.yaml | 17 | ||||
| -rw-r--r-- | src/go/plugin/go.d/modules/tomcat/testdata/server_status.xml | 54 | ||||
| -rw-r--r-- | src/go/plugin/go.d/modules/tomcat/tomcat.go | 120 | ||||
| -rw-r--r-- | src/go/plugin/go.d/modules/tomcat/tomcat_test.go | 272 | ||||
| l--------- | src/go/plugin/go.d/modules/tor/README.md (renamed from src/collectors/python.d.plugin/tor/README.md) | 0 | ||||
| -rw-r--r-- | src/go/plugin/go.d/modules/tor/charts.go | 43 | ||||
| -rw-r--r-- | src/go/plugin/go.d/modules/tor/client.go | 117 | ||||
| -rw-r--r-- | src/go/plugin/go.d/modules/tor/collect.go | 65 | ||||
| -rw-r--r-- | src/go/plugin/go.d/modules/tor/config_schema.json | 53 | ||||
| -rw-r--r-- | src/go/plugin/go.d/modules/tor/integrations/tor.md | 225 | ||||
| -rw-r--r-- | src/go/plugin/go.d/modules/tor/metadata.yaml | 135 | ||||
| -rw-r--r-- | src/go/plugin/go.d/modules/tor/testdata/config.json | 6 | ||||
| -rw-r--r-- | src/go/plugin/go.d/modules/tor/testdata/config.yaml | 4 | ||||
| -rw-r--r-- | src/go/plugin/go.d/modules/tor/tor.go | 102 | ||||
| -rw-r--r-- | src/go/plugin/go.d/modules/tor/tor_test.go | 328 | ||||
| l--------- | src/go/plugin/go.d/modules/traefik/README.md (renamed from src/go/collectors/go.d.plugin/modules/traefik/README.md) | 0 | ||||
| -rw-r--r-- | src/go/plugin/go.d/modules/traefik/charts.go (renamed from src/go/collectors/go.d.plugin/modules/traefik/charts.go) | 2 | ||||
| -rw-r--r-- | src/go/plugin/go.d/modules/traefik/collect.go (renamed from src/go/collectors/go.d.plugin/modules/traefik/collect.go) | 4 | ||||
| -rw-r--r-- | src/go/plugin/go.d/modules/traefik/config_schema.json (renamed from src/go/collectors/go.d.plugin/modules/traefik/config_schema.json) | 6 | ||||
| -rw-r--r-- | src/go/plugin/go.d/modules/traefik/init.go (renamed from src/go/collectors/go.d.plugin/modules/traefik/init.go) | 6 | ||||
| -rw-r--r-- | src/go/plugin/go.d/modules/traefik/integrations/traefik.md (renamed from src/go/collectors/go.d.plugin/modules/traefik/integrations/traefik.md) | 39 | ||||
| -rw-r--r-- | src/go/plugin/go.d/modules/traefik/metadata.yaml (renamed from src/go/collectors/go.d.plugin/modules/traefik/metadata.yaml) | 0 | ||||
| -rw-r--r-- | src/go/plugin/go.d/modules/traefik/testdata/config.json | 20 | ||||
| -rw-r--r-- | src/go/plugin/go.d/modules/traefik/testdata/config.yaml | 17 | ||||
| -rw-r--r-- | src/go/plugin/go.d/modules/traefik/testdata/v2.2.1/metrics.txt (renamed from src/go/collectors/go.d.plugin/modules/traefik/testdata/v2.2.1/metrics.txt) | 0 | ||||
| -rw-r--r-- | src/go/plugin/go.d/modules/traefik/traefik.go (renamed from src/go/collectors/go.d.plugin/modules/traefik/traefik.go) | 6 | ||||
| -rw-r--r-- | src/go/plugin/go.d/modules/traefik/traefik_test.go (renamed from src/go/collectors/go.d.plugin/modules/traefik/traefik_test.go) | 6 | ||||
| l--------- | src/go/plugin/go.d/modules/unbound/README.md (renamed from src/go/collectors/go.d.plugin/modules/unbound/README.md) | 0 | ||||
| -rw-r--r-- | src/go/plugin/go.d/modules/unbound/charts.go (renamed from src/go/collectors/go.d.plugin/modules/unbound/charts.go) | 2 | ||||
| -rw-r--r-- | src/go/plugin/go.d/modules/unbound/collect.go (renamed from src/go/collectors/go.d.plugin/modules/unbound/collect.go) | 0 | ||||
| -rw-r--r-- | src/go/plugin/go.d/modules/unbound/config/config.go (renamed from src/go/collectors/go.d.plugin/modules/unbound/config/config.go) | 0 | ||||
| -rw-r--r-- | src/go/plugin/go.d/modules/unbound/config/config_test.go (renamed from src/go/collectors/go.d.plugin/modules/unbound/config/config_test.go) | 0 | ||||
| -rw-r--r-- | src/go/plugin/go.d/modules/unbound/config/parse.go (renamed from src/go/collectors/go.d.plugin/modules/unbound/config/parse.go) | 0 | ||||
| -rw-r--r-- | src/go/plugin/go.d/modules/unbound/config/parse_test.go (renamed from src/go/collectors/go.d.plugin/modules/unbound/config/parse_test.go) | 0 | ||||
| -rw-r--r-- | src/go/plugin/go.d/modules/unbound/config/testdata/infinite_rec.conf (renamed from src/go/collectors/go.d.plugin/modules/unbound/config/testdata/infinite_rec.conf) | 0 | ||||
| -rw-r--r-- | src/go/plugin/go.d/modules/unbound/config/testdata/non_existent_glob_include.conf (renamed from src/go/collectors/go.d.plugin/modules/unbound/config/testdata/non_existent_glob_include.conf) | 0 | ||||
| -rw-r--r-- | src/go/plugin/go.d/modules/unbound/config/testdata/non_existent_include.conf (renamed from src/go/collectors/go.d.plugin/modules/unbound/config/testdata/non_existent_include.conf) | 0 | ||||
| -rw-r--r-- | src/go/plugin/go.d/modules/unbound/config/testdata/valid_glob.conf (renamed from src/go/collectors/go.d.plugin/modules/unbound/config/testdata/valid_glob.conf) | 0 | ||||
| -rw-r--r-- | src/go/plugin/go.d/modules/unbound/config/testdata/valid_glob2.conf (renamed from src/go/collectors/go.d.plugin/modules/unbound/config/testdata/valid_glob2.conf) | 0 | ||||
| -rw-r--r-- | src/go/plugin/go.d/modules/unbound/config/testdata/valid_glob3.conf (renamed from src/go/collectors/go.d.plugin/modules/unbound/config/testdata/valid_glob3.conf) | 0 | ||||
| -rw-r--r-- | src/go/plugin/go.d/modules/unbound/config/testdata/valid_include.conf (renamed from src/go/collectors/go.d.plugin/modules/unbound/config/testdata/valid_include.conf) | 0 | ||||
| -rw-r--r-- | src/go/plugin/go.d/modules/unbound/config/testdata/valid_include2.conf (renamed from src/go/collectors/go.d.plugin/modules/unbound/config/testdata/valid_include2.conf) | 0 | ||||
| -rw-r--r-- | src/go/plugin/go.d/modules/unbound/config/testdata/valid_include3.conf (renamed from src/go/collectors/go.d.plugin/modules/unbound/config/testdata/valid_include3.conf) | 0 | ||||
| -rw-r--r-- | src/go/plugin/go.d/modules/unbound/config/testdata/valid_include_toplevel.conf (renamed from src/go/collectors/go.d.plugin/modules/unbound/config/testdata/valid_include_toplevel.conf) | 0 | ||||
| -rw-r--r-- | src/go/plugin/go.d/modules/unbound/config/testdata/valid_include_toplevel2.conf (renamed from src/go/collectors/go.d.plugin/modules/unbound/config/testdata/valid_include_toplevel2.conf) | 0 | ||||
| -rw-r--r-- | src/go/plugin/go.d/modules/unbound/config/testdata/valid_include_toplevel3.conf (renamed from src/go/collectors/go.d.plugin/modules/unbound/config/testdata/valid_include_toplevel3.conf) | 0 | ||||
| -rw-r--r-- | src/go/plugin/go.d/modules/unbound/config_schema.json (renamed from src/go/collectors/go.d.plugin/modules/unbound/config_schema.json) | 0 | ||||
| -rw-r--r-- | src/go/plugin/go.d/modules/unbound/init.go (renamed from src/go/collectors/go.d.plugin/modules/unbound/init.go) | 6 | ||||
| -rw-r--r-- | src/go/plugin/go.d/modules/unbound/integrations/unbound.md (renamed from src/go/collectors/go.d.plugin/modules/unbound/integrations/unbound.md) | 39 | ||||
| -rw-r--r-- | src/go/plugin/go.d/modules/unbound/metadata.yaml (renamed from src/go/collectors/go.d.plugin/modules/unbound/metadata.yaml) | 0 | ||||
| -rw-r--r-- | src/go/plugin/go.d/modules/unbound/testdata/config.json (renamed from src/go/collectors/go.d.plugin/modules/unbound/testdata/config.json) | 0 | ||||
| -rw-r--r-- | src/go/plugin/go.d/modules/unbound/testdata/config.yaml (renamed from src/go/collectors/go.d.plugin/modules/unbound/testdata/config.yaml) | 0 | ||||
| -rw-r--r-- | src/go/plugin/go.d/modules/unbound/testdata/stats/common.txt (renamed from src/go/collectors/go.d.plugin/modules/unbound/testdata/stats/common.txt) | 0 | ||||
| -rw-r--r-- | src/go/plugin/go.d/modules/unbound/testdata/stats/extended.txt (renamed from src/go/collectors/go.d.plugin/modules/unbound/testdata/stats/extended.txt) | 0 | ||||
| -rw-r--r-- | src/go/plugin/go.d/modules/unbound/testdata/stats/lifecycle/cumulative/extended1.txt (renamed from src/go/collectors/go.d.plugin/modules/unbound/testdata/stats/lifecycle/cumulative/extended1.txt) | 0 | ||||
| -rw-r--r-- | src/go/plugin/go.d/modules/unbound/testdata/stats/lifecycle/cumulative/extended2.txt (renamed from src/go/collectors/go.d.plugin/modules/unbound/testdata/stats/lifecycle/cumulative/extended2.txt) | 0 | ||||
| -rw-r--r-- | src/go/plugin/go.d/modules/unbound/testdata/stats/lifecycle/cumulative/extended3.txt (renamed from src/go/collectors/go.d.plugin/modules/unbound/testdata/stats/lifecycle/cumulative/extended3.txt) | 0 | ||||
| -rw-r--r-- | src/go/plugin/go.d/modules/unbound/testdata/stats/lifecycle/reset/extended1.txt (renamed from src/go/collectors/go.d.plugin/modules/unbound/testdata/stats/lifecycle/reset/extended1.txt) | 0 | ||||
| -rw-r--r-- | src/go/plugin/go.d/modules/unbound/testdata/stats/lifecycle/reset/extended2.txt (renamed from src/go/collectors/go.d.plugin/modules/unbound/testdata/stats/lifecycle/reset/extended2.txt) | 0 | ||||
| -rw-r--r-- | src/go/plugin/go.d/modules/unbound/testdata/stats/lifecycle/reset/extended3.txt (renamed from src/go/collectors/go.d.plugin/modules/unbound/testdata/stats/lifecycle/reset/extended3.txt) | 0 | ||||
| -rw-r--r-- | src/go/plugin/go.d/modules/unbound/testdata/unbound.conf (renamed from src/go/collectors/go.d.plugin/modules/unbound/testdata/unbound.conf) | 0 | ||||
| -rw-r--r-- | src/go/plugin/go.d/modules/unbound/testdata/unbound_disabled.conf (renamed from src/go/collectors/go.d.plugin/modules/unbound/testdata/unbound_disabled.conf) | 0 | ||||
| -rw-r--r-- | src/go/plugin/go.d/modules/unbound/testdata/unbound_empty.conf (renamed from src/go/collectors/go.d.plugin/modules/unbound/testdata/unbound_empty.conf) | 0 | ||||
| -rw-r--r-- | src/go/plugin/go.d/modules/unbound/unbound.go (renamed from src/go/collectors/go.d.plugin/modules/unbound/unbound.go) | 8 | ||||
| -rw-r--r-- | src/go/plugin/go.d/modules/unbound/unbound_test.go (renamed from src/go/collectors/go.d.plugin/modules/unbound/unbound_test.go) | 6 | ||||
| l--------- | src/go/plugin/go.d/modules/upsd/README.md (renamed from src/go/collectors/go.d.plugin/modules/upsd/README.md) | 0 | ||||
| -rw-r--r-- | src/go/plugin/go.d/modules/upsd/charts.go (renamed from src/go/collectors/go.d.plugin/modules/upsd/charts.go) | 2 | ||||
| -rw-r--r-- | src/go/plugin/go.d/modules/upsd/client.go (renamed from src/go/collectors/go.d.plugin/modules/upsd/client.go) | 2 | ||||
| -rw-r--r-- | src/go/plugin/go.d/modules/upsd/collect.go (renamed from src/go/collectors/go.d.plugin/modules/upsd/collect.go) | 0 | ||||
| -rw-r--r-- | src/go/plugin/go.d/modules/upsd/config_schema.json (renamed from src/go/collectors/go.d.plugin/modules/upsd/config_schema.json) | 0 | ||||
| -rw-r--r-- | src/go/plugin/go.d/modules/upsd/integrations/ups_nut.md (renamed from src/go/collectors/go.d.plugin/modules/upsd/integrations/ups_nut.md) | 39 | ||||
| -rw-r--r-- | src/go/plugin/go.d/modules/upsd/metadata.yaml (renamed from src/go/collectors/go.d.plugin/modules/upsd/metadata.yaml) | 0 | ||||
| -rw-r--r-- | src/go/plugin/go.d/modules/upsd/testdata/config.json (renamed from src/go/collectors/go.d.plugin/modules/upsd/testdata/config.json) | 0 | ||||
| -rw-r--r-- | src/go/plugin/go.d/modules/upsd/testdata/config.yaml (renamed from src/go/collectors/go.d.plugin/modules/upsd/testdata/config.yaml) | 0 | ||||
| -rw-r--r-- | src/go/plugin/go.d/modules/upsd/upsd.go (renamed from src/go/collectors/go.d.plugin/modules/upsd/upsd.go) | 4 | ||||
| -rw-r--r-- | src/go/plugin/go.d/modules/upsd/upsd_test.go (renamed from src/go/collectors/go.d.plugin/modules/upsd/upsd_test.go) | 2 | ||||
| -rw-r--r-- | src/go/plugin/go.d/modules/upsd/variables.go (renamed from src/go/collectors/go.d.plugin/modules/upsd/variables.go) | 0 | ||||
| l--------- | src/go/plugin/go.d/modules/uwsgi/README.md (renamed from src/collectors/python.d.plugin/uwsgi/README.md) | 0 | ||||
| -rw-r--r-- | src/go/plugin/go.d/modules/uwsgi/charts.go | 275 | ||||
| -rw-r--r-- | src/go/plugin/go.d/modules/uwsgi/client.go | 64 | ||||
| -rw-r--r-- | src/go/plugin/go.d/modules/uwsgi/collect.go | 128 | ||||
| -rw-r--r-- | src/go/plugin/go.d/modules/uwsgi/config_schema.json | 44 | ||||
| -rw-r--r-- | src/go/plugin/go.d/modules/uwsgi/init.go | 3 | ||||
| -rw-r--r-- | src/go/plugin/go.d/modules/uwsgi/integrations/uwsgi.md | 248 | ||||
| -rw-r--r-- | src/go/plugin/go.d/modules/uwsgi/metadata.yaml | 215 | ||||
| -rw-r--r-- | src/go/plugin/go.d/modules/uwsgi/testdata/config.json | 5 | ||||
| -rw-r--r-- | src/go/plugin/go.d/modules/uwsgi/testdata/config.yaml | 3 | ||||
| -rw-r--r-- | src/go/plugin/go.d/modules/uwsgi/testdata/stats.json | 117 | ||||
| -rw-r--r-- | src/go/plugin/go.d/modules/uwsgi/testdata/stats_no_workers.json | 49 | ||||
| -rw-r--r-- | src/go/plugin/go.d/modules/uwsgi/uwsgi.go | 98 | ||||
| -rw-r--r-- | src/go/plugin/go.d/modules/uwsgi/uwsgi_test.go | 325 | ||||
| l--------- | src/go/plugin/go.d/modules/vcsa/README.md (renamed from src/go/collectors/go.d.plugin/modules/vcsa/README.md) | 0 | ||||
| -rw-r--r-- | src/go/plugin/go.d/modules/vcsa/charts.go (renamed from src/go/collectors/go.d.plugin/modules/vcsa/charts.go) | 2 | ||||
| -rw-r--r-- | src/go/plugin/go.d/modules/vcsa/client/client.go (renamed from src/go/collectors/go.d.plugin/modules/vcsa/client/client.go) | 2 | ||||
| -rw-r--r-- | src/go/plugin/go.d/modules/vcsa/client/client_test.go (renamed from src/go/collectors/go.d.plugin/modules/vcsa/client/client_test.go) | 0 | ||||
| -rw-r--r-- | src/go/plugin/go.d/modules/vcsa/collect.go (renamed from src/go/collectors/go.d.plugin/modules/vcsa/collect.go) | 0 | ||||
| -rw-r--r-- | src/go/plugin/go.d/modules/vcsa/config_schema.json (renamed from src/go/collectors/go.d.plugin/modules/vcsa/config_schema.json) | 6 | ||||
| -rw-r--r-- | src/go/plugin/go.d/modules/vcsa/init.go (renamed from src/go/collectors/go.d.plugin/modules/vcsa/init.go) | 4 | ||||
| -rw-r--r-- | src/go/plugin/go.d/modules/vcsa/integrations/vcenter_server_appliance.md (renamed from src/go/collectors/go.d.plugin/modules/vcsa/integrations/vcenter_server_appliance.md) | 39 | ||||
| -rw-r--r-- | src/go/plugin/go.d/modules/vcsa/metadata.yaml (renamed from src/go/collectors/go.d.plugin/modules/vcsa/metadata.yaml) | 0 | ||||
| -rw-r--r-- | src/go/plugin/go.d/modules/vcsa/testdata/config.json | 20 | ||||
| -rw-r--r-- | src/go/plugin/go.d/modules/vcsa/testdata/config.yaml | 17 | ||||
| -rw-r--r-- | src/go/plugin/go.d/modules/vcsa/vcsa.go (renamed from src/go/collectors/go.d.plugin/modules/vcsa/vcsa.go) | 4 | ||||
| -rw-r--r-- | src/go/plugin/go.d/modules/vcsa/vcsa_test.go (renamed from src/go/collectors/go.d.plugin/modules/vcsa/vcsa_test.go) | 2 | ||||
| l--------- | src/go/plugin/go.d/modules/vernemq/README.md (renamed from src/go/collectors/go.d.plugin/modules/vernemq/README.md) | 0 | ||||
| -rw-r--r-- | src/go/plugin/go.d/modules/vernemq/charts.go (renamed from src/go/collectors/go.d.plugin/modules/vernemq/charts.go) | 2 | ||||
| -rw-r--r-- | src/go/plugin/go.d/modules/vernemq/collect.go (renamed from src/go/collectors/go.d.plugin/modules/vernemq/collect.go) | 4 | ||||
| -rw-r--r-- | src/go/plugin/go.d/modules/vernemq/config_schema.json (renamed from src/go/collectors/go.d.plugin/modules/vernemq/config_schema.json) | 6 | ||||
| -rw-r--r-- | src/go/plugin/go.d/modules/vernemq/init.go (renamed from src/go/collectors/go.d.plugin/modules/vernemq/init.go) | 4 | ||||
| -rw-r--r-- | src/go/plugin/go.d/modules/vernemq/integrations/vernemq.md (renamed from src/go/collectors/go.d.plugin/modules/vernemq/integrations/vernemq.md) | 39 | ||||
| -rw-r--r-- | src/go/plugin/go.d/modules/vernemq/metadata.yaml (renamed from src/go/collectors/go.d.plugin/modules/vernemq/metadata.yaml) | 0 | ||||
| -rw-r--r-- | src/go/plugin/go.d/modules/vernemq/metrics.go (renamed from src/go/collectors/go.d.plugin/modules/vernemq/metrics.go) | 0 | ||||
| -rw-r--r-- | src/go/plugin/go.d/modules/vernemq/testdata/config.json | 20 | ||||
| -rw-r--r-- | src/go/plugin/go.d/modules/vernemq/testdata/config.yaml | 17 | ||||
| -rw-r--r-- | src/go/plugin/go.d/modules/vernemq/testdata/metrics-v1.10.1-mqtt5.txt (renamed from src/go/collectors/go.d.plugin/modules/vernemq/testdata/metrics-v1.10.1-mqtt5.txt) | 0 | ||||
| -rw-r--r-- | src/go/plugin/go.d/modules/vernemq/testdata/non_vernemq.txt (renamed from src/go/collectors/go.d.plugin/modules/vernemq/testdata/non_vernemq.txt) | 0 | ||||
| -rw-r--r-- | src/go/plugin/go.d/modules/vernemq/vernemq.go (renamed from src/go/collectors/go.d.plugin/modules/vernemq/vernemq.go) | 6 | ||||
| -rw-r--r-- | src/go/plugin/go.d/modules/vernemq/vernemq_test.go (renamed from src/go/collectors/go.d.plugin/modules/vernemq/vernemq_test.go) | 2 | ||||
| l--------- | src/go/plugin/go.d/modules/vsphere/README.md (renamed from src/go/collectors/go.d.plugin/modules/vsphere/README.md) | 0 | ||||
| -rw-r--r-- | src/go/plugin/go.d/modules/vsphere/charts.go (renamed from src/go/collectors/go.d.plugin/modules/vsphere/charts.go) | 4 | ||||
| -rw-r--r-- | src/go/plugin/go.d/modules/vsphere/client/client.go (renamed from src/go/collectors/go.d.plugin/modules/vsphere/client/client.go) | 2 | ||||
| -rw-r--r-- | src/go/plugin/go.d/modules/vsphere/client/client_test.go (renamed from src/go/collectors/go.d.plugin/modules/vsphere/client/client_test.go) | 2 | ||||
| -rw-r--r-- | src/go/plugin/go.d/modules/vsphere/client/keepalive.go (renamed from src/go/collectors/go.d.plugin/modules/vsphere/client/keepalive.go) | 0 | ||||
| -rw-r--r-- | src/go/plugin/go.d/modules/vsphere/collect.go (renamed from src/go/collectors/go.d.plugin/modules/vsphere/collect.go) | 2 | ||||
| -rw-r--r-- | src/go/plugin/go.d/modules/vsphere/config_schema.json (renamed from src/go/collectors/go.d.plugin/modules/vsphere/config_schema.json) | 9 | ||||
| -rw-r--r-- | src/go/plugin/go.d/modules/vsphere/discover.go (renamed from src/go/collectors/go.d.plugin/modules/vsphere/discover.go) | 0 | ||||
| -rw-r--r-- | src/go/plugin/go.d/modules/vsphere/discover/build.go (renamed from src/go/collectors/go.d.plugin/modules/vsphere/discover/build.go) | 2 | ||||
| -rw-r--r-- | src/go/plugin/go.d/modules/vsphere/discover/discover.go (renamed from src/go/collectors/go.d.plugin/modules/vsphere/discover/discover.go) | 6 | ||||
| -rw-r--r-- | src/go/plugin/go.d/modules/vsphere/discover/discover_test.go (renamed from src/go/collectors/go.d.plugin/modules/vsphere/discover/discover_test.go) | 6 | ||||
| -rw-r--r-- | src/go/plugin/go.d/modules/vsphere/discover/filter.go (renamed from src/go/collectors/go.d.plugin/modules/vsphere/discover/filter.go) | 2 | ||||
| -rw-r--r-- | src/go/plugin/go.d/modules/vsphere/discover/hierarchy.go (renamed from src/go/collectors/go.d.plugin/modules/vsphere/discover/hierarchy.go) | 2 | ||||
| -rw-r--r-- | src/go/plugin/go.d/modules/vsphere/discover/metric_lists.go (renamed from src/go/collectors/go.d.plugin/modules/vsphere/discover/metric_lists.go) | 2 | ||||
| -rw-r--r-- | src/go/plugin/go.d/modules/vsphere/init.go (renamed from src/go/collectors/go.d.plugin/modules/vsphere/init.go) | 6 | ||||
| -rw-r--r-- | src/go/plugin/go.d/modules/vsphere/integrations/vmware_vcenter_server.md (renamed from src/go/collectors/go.d.plugin/modules/vsphere/integrations/vmware_vcenter_server.md) | 39 | ||||
| -rw-r--r-- | src/go/plugin/go.d/modules/vsphere/match/match.go (renamed from src/go/collectors/go.d.plugin/modules/vsphere/match/match.go) | 4 | ||||
| -rw-r--r-- | src/go/plugin/go.d/modules/vsphere/match/match_test.go (renamed from src/go/collectors/go.d.plugin/modules/vsphere/match/match_test.go) | 4 | ||||
| -rw-r--r-- | src/go/plugin/go.d/modules/vsphere/metadata.yaml (renamed from src/go/collectors/go.d.plugin/modules/vsphere/metadata.yaml) | 0 | ||||
| -rw-r--r-- | src/go/plugin/go.d/modules/vsphere/metrics.txt (renamed from src/go/collectors/go.d.plugin/modules/vsphere/metrics.txt) | 0 | ||||
| -rw-r--r-- | src/go/plugin/go.d/modules/vsphere/resources/resources.go (renamed from src/go/collectors/go.d.plugin/modules/vsphere/resources/resources.go) | 0 | ||||
| -rw-r--r-- | src/go/plugin/go.d/modules/vsphere/scrape/scrape.go (renamed from src/go/collectors/go.d.plugin/modules/vsphere/scrape/scrape.go) | 4 | ||||
| -rw-r--r-- | src/go/plugin/go.d/modules/vsphere/scrape/scrape_test.go (renamed from src/go/collectors/go.d.plugin/modules/vsphere/scrape/scrape_test.go) | 8 | ||||
| -rw-r--r-- | src/go/plugin/go.d/modules/vsphere/scrape/throttled_caller.go (renamed from src/go/collectors/go.d.plugin/modules/vsphere/scrape/throttled_caller.go) | 0 | ||||
| -rw-r--r-- | src/go/plugin/go.d/modules/vsphere/scrape/throttled_caller_test.go (renamed from src/go/collectors/go.d.plugin/modules/vsphere/scrape/throttled_caller_test.go) | 0 | ||||
| -rw-r--r-- | src/go/plugin/go.d/modules/vsphere/task.go (renamed from src/go/collectors/go.d.plugin/modules/vsphere/task.go) | 0 | ||||
| -rw-r--r-- | src/go/plugin/go.d/modules/vsphere/task_test.go (renamed from src/go/collectors/go.d.plugin/modules/vsphere/task_test.go) | 0 | ||||
| -rw-r--r-- | src/go/plugin/go.d/modules/vsphere/testdata/config.json (renamed from src/go/collectors/go.d.plugin/modules/vsphere/testdata/config.json) | 0 | ||||
| -rw-r--r-- | src/go/plugin/go.d/modules/vsphere/testdata/config.yaml (renamed from src/go/collectors/go.d.plugin/modules/vsphere/testdata/config.yaml) | 0 | ||||
| -rw-r--r-- | src/go/plugin/go.d/modules/vsphere/vsphere.go (renamed from src/go/collectors/go.d.plugin/modules/vsphere/vsphere.go) | 8 | ||||
| -rw-r--r-- | src/go/plugin/go.d/modules/vsphere/vsphere_test.go | 489 | ||||
| l--------- | src/go/plugin/go.d/modules/weblog/README.md (renamed from src/go/collectors/go.d.plugin/modules/weblog/README.md) | 0 | ||||
| -rw-r--r-- | src/go/plugin/go.d/modules/weblog/charts.go (renamed from src/go/collectors/go.d.plugin/modules/weblog/charts.go) | 2 | ||||
| -rw-r--r-- | src/go/plugin/go.d/modules/weblog/collect.go (renamed from src/go/collectors/go.d.plugin/modules/weblog/collect.go) | 6 | ||||
| -rw-r--r-- | src/go/plugin/go.d/modules/weblog/config_schema.json (renamed from src/go/collectors/go.d.plugin/modules/weblog/config_schema.json) | 4 | ||||
| -rw-r--r-- | src/go/plugin/go.d/modules/weblog/init.go (renamed from src/go/collectors/go.d.plugin/modules/weblog/init.go) | 4 | ||||
| -rw-r--r-- | src/go/plugin/go.d/modules/weblog/integrations/web_server_log_files.md (renamed from src/go/collectors/go.d.plugin/modules/weblog/integrations/web_server_log_files.md) | 108 | ||||
| -rw-r--r-- | src/go/plugin/go.d/modules/weblog/logline.go (renamed from src/go/collectors/go.d.plugin/modules/weblog/logline.go) | 0 | ||||
| -rw-r--r-- | src/go/plugin/go.d/modules/weblog/logline_test.go (renamed from src/go/collectors/go.d.plugin/modules/weblog/logline_test.go) | 0 | ||||
| -rw-r--r-- | src/go/plugin/go.d/modules/weblog/metadata.yaml (renamed from src/go/collectors/go.d.plugin/modules/weblog/metadata.yaml) | 62 | ||||
| -rw-r--r-- | src/go/plugin/go.d/modules/weblog/metrics.go (renamed from src/go/collectors/go.d.plugin/modules/weblog/metrics.go) | 2 | ||||
| -rw-r--r-- | src/go/plugin/go.d/modules/weblog/parser.go (renamed from src/go/collectors/go.d.plugin/modules/weblog/parser.go) | 2 | ||||
| -rw-r--r-- | src/go/plugin/go.d/modules/weblog/parser_test.go (renamed from src/go/collectors/go.d.plugin/modules/weblog/parser_test.go) | 2 | ||||
| -rw-r--r-- | src/go/plugin/go.d/modules/weblog/testdata/common.log (renamed from src/go/collectors/go.d.plugin/modules/weblog/testdata/common.log) | 0 | ||||
| -rw-r--r-- | src/go/plugin/go.d/modules/weblog/testdata/config.json (renamed from src/go/collectors/go.d.plugin/modules/weblog/testdata/config.json) | 0 | ||||
| -rw-r--r-- | src/go/plugin/go.d/modules/weblog/testdata/config.yaml (renamed from src/go/collectors/go.d.plugin/modules/weblog/testdata/config.yaml) | 0 | ||||
| -rw-r--r-- | src/go/plugin/go.d/modules/weblog/testdata/custom.log (renamed from src/go/collectors/go.d.plugin/modules/weblog/testdata/custom.log) | 0 | ||||
| -rw-r--r-- | src/go/plugin/go.d/modules/weblog/testdata/custom_time_fields.log (renamed from src/go/collectors/go.d.plugin/modules/weblog/testdata/custom_time_fields.log) | 0 | ||||
| -rw-r--r-- | src/go/plugin/go.d/modules/weblog/testdata/full.log (renamed from src/go/collectors/go.d.plugin/modules/weblog/testdata/full.log) | 0 | ||||
| -rw-r--r-- | src/go/plugin/go.d/modules/weblog/testdata/u_ex221107.log (renamed from src/go/collectors/go.d.plugin/modules/weblog/testdata/u_ex221107.log) | 0 | ||||
| -rw-r--r-- | src/go/plugin/go.d/modules/weblog/weblog.go (renamed from src/go/collectors/go.d.plugin/modules/weblog/weblog.go) | 4 | ||||
| -rw-r--r-- | src/go/plugin/go.d/modules/weblog/weblog_test.go (renamed from src/go/collectors/go.d.plugin/modules/weblog/weblog_test.go) | 6 | ||||
| l--------- | src/go/plugin/go.d/modules/whoisquery/README.md (renamed from src/go/collectors/go.d.plugin/modules/whoisquery/README.md) | 0 | ||||
| -rw-r--r-- | src/go/plugin/go.d/modules/whoisquery/charts.go (renamed from src/go/collectors/go.d.plugin/modules/whoisquery/charts.go) | 2 | ||||
| -rw-r--r-- | src/go/plugin/go.d/modules/whoisquery/collect.go (renamed from src/go/collectors/go.d.plugin/modules/whoisquery/collect.go) | 0 | ||||
| -rw-r--r-- | src/go/plugin/go.d/modules/whoisquery/config_schema.json (renamed from src/go/collectors/go.d.plugin/modules/whoisquery/config_schema.json) | 4 | ||||
| -rw-r--r-- | src/go/plugin/go.d/modules/whoisquery/init.go (renamed from src/go/collectors/go.d.plugin/modules/whoisquery/init.go) | 2 | ||||
| -rw-r--r-- | src/go/plugin/go.d/modules/whoisquery/integrations/domain_expiration_date.md (renamed from src/go/collectors/go.d.plugin/modules/whoisquery/integrations/domain_expiration_date.md) | 39 | ||||
| -rw-r--r-- | src/go/plugin/go.d/modules/whoisquery/metadata.yaml (renamed from src/go/collectors/go.d.plugin/modules/whoisquery/metadata.yaml) | 0 | ||||
| -rw-r--r-- | src/go/plugin/go.d/modules/whoisquery/provider.go (renamed from src/go/collectors/go.d.plugin/modules/whoisquery/provider.go) | 0 | ||||
| -rw-r--r-- | src/go/plugin/go.d/modules/whoisquery/testdata/config.json (renamed from src/go/collectors/go.d.plugin/modules/whoisquery/testdata/config.json) | 0 | ||||
| -rw-r--r-- | src/go/plugin/go.d/modules/whoisquery/testdata/config.yaml (renamed from src/go/collectors/go.d.plugin/modules/whoisquery/testdata/config.yaml) | 0 | ||||
| -rw-r--r-- | src/go/plugin/go.d/modules/whoisquery/whoisquery.go (renamed from src/go/collectors/go.d.plugin/modules/whoisquery/whoisquery.go) | 4 | ||||
| -rw-r--r-- | src/go/plugin/go.d/modules/whoisquery/whoisquery_test.go (renamed from src/go/collectors/go.d.plugin/modules/whoisquery/whoisquery_test.go) | 2 | ||||
| l--------- | src/go/plugin/go.d/modules/windows/README.md (renamed from src/go/collectors/go.d.plugin/modules/windows/README.md) | 0 | ||||
| -rw-r--r-- | src/go/plugin/go.d/modules/windows/charts.go (renamed from src/go/collectors/go.d.plugin/modules/windows/charts.go) | 2 | ||||
| -rw-r--r-- | src/go/plugin/go.d/modules/windows/collect.go (renamed from src/go/collectors/go.d.plugin/modules/windows/collect.go) | 2 | ||||
| -rw-r--r-- | src/go/plugin/go.d/modules/windows/collect_ad.go (renamed from src/go/collectors/go.d.plugin/modules/windows/collect_ad.go) | 2 | ||||
| -rw-r--r-- | src/go/plugin/go.d/modules/windows/collect_adcs.go (renamed from src/go/collectors/go.d.plugin/modules/windows/collect_adcs.go) | 2 | ||||
| -rw-r--r-- | src/go/plugin/go.d/modules/windows/collect_adfs.go (renamed from src/go/collectors/go.d.plugin/modules/windows/collect_adfs.go) | 2 | ||||
| -rw-r--r-- | src/go/plugin/go.d/modules/windows/collect_collector.go (renamed from src/go/collectors/go.d.plugin/modules/windows/collect_collector.go) | 2 | ||||
| -rw-r--r-- | src/go/plugin/go.d/modules/windows/collect_cpu.go (renamed from src/go/collectors/go.d.plugin/modules/windows/collect_cpu.go) | 2 | ||||
| -rw-r--r-- | src/go/plugin/go.d/modules/windows/collect_exchange.go (renamed from src/go/collectors/go.d.plugin/modules/windows/collect_exchange.go) | 2 | ||||
| -rw-r--r-- | src/go/plugin/go.d/modules/windows/collect_hyperv.go (renamed from src/go/collectors/go.d.plugin/modules/windows/collect_hyperv.go) | 2 | ||||
| -rw-r--r-- | src/go/plugin/go.d/modules/windows/collect_iis.go (renamed from src/go/collectors/go.d.plugin/modules/windows/collect_iis.go) | 2 | ||||
| -rw-r--r-- | src/go/plugin/go.d/modules/windows/collect_logical_disk.go (renamed from src/go/collectors/go.d.plugin/modules/windows/collect_logical_disk.go) | 2 | ||||
| -rw-r--r-- | src/go/plugin/go.d/modules/windows/collect_logon.go (renamed from src/go/collectors/go.d.plugin/modules/windows/collect_logon.go) | 2 | ||||
| -rw-r--r-- | src/go/plugin/go.d/modules/windows/collect_memory.go (renamed from src/go/collectors/go.d.plugin/modules/windows/collect_memory.go) | 2 | ||||
| -rw-r--r-- | src/go/plugin/go.d/modules/windows/collect_mssql.go (renamed from src/go/collectors/go.d.plugin/modules/windows/collect_mssql.go) | 2 | ||||
| -rw-r--r-- | src/go/plugin/go.d/modules/windows/collect_net.go (renamed from src/go/collectors/go.d.plugin/modules/windows/collect_net.go) | 2 | ||||
| -rw-r--r-- | src/go/plugin/go.d/modules/windows/collect_netframework.go (renamed from src/go/collectors/go.d.plugin/modules/windows/collect_netframework.go) | 2 | ||||
| -rw-r--r-- | src/go/plugin/go.d/modules/windows/collect_os.go (renamed from src/go/collectors/go.d.plugin/modules/windows/collect_os.go) | 2 | ||||
| -rw-r--r-- | src/go/plugin/go.d/modules/windows/collect_process.go (renamed from src/go/collectors/go.d.plugin/modules/windows/collect_process.go) | 2 | ||||
| -rw-r--r-- | src/go/plugin/go.d/modules/windows/collect_service.go (renamed from src/go/collectors/go.d.plugin/modules/windows/collect_service.go) | 2 | ||||
| -rw-r--r-- | src/go/plugin/go.d/modules/windows/collect_system.go (renamed from src/go/collectors/go.d.plugin/modules/windows/collect_system.go) | 2 | ||||
| -rw-r--r-- | src/go/plugin/go.d/modules/windows/collect_tcp.go (renamed from src/go/collectors/go.d.plugin/modules/windows/collect_tcp.go) | 2 | ||||
| -rw-r--r-- | src/go/plugin/go.d/modules/windows/collect_thermalzone.go (renamed from src/go/collectors/go.d.plugin/modules/windows/collect_thermalzone.go) | 2 | ||||
| -rw-r--r-- | src/go/plugin/go.d/modules/windows/config_schema.json (renamed from src/go/collectors/go.d.plugin/modules/windows/config_schema.json) | 6 | ||||
| -rw-r--r-- | src/go/plugin/go.d/modules/windows/init.go (renamed from src/go/collectors/go.d.plugin/modules/windows/init.go) | 4 | ||||
| -rw-r--r-- | src/go/plugin/go.d/modules/windows/integrations/active_directory.md (renamed from src/go/collectors/go.d.plugin/modules/windows/integrations/active_directory.md) | 39 | ||||
| -rw-r--r-- | src/go/plugin/go.d/modules/windows/integrations/hyperv.md (renamed from src/go/collectors/go.d.plugin/modules/windows/integrations/hyperv.md) | 39 | ||||
| -rw-r--r-- | src/go/plugin/go.d/modules/windows/integrations/ms_exchange.md (renamed from src/go/collectors/go.d.plugin/modules/windows/integrations/ms_exchange.md) | 39 | ||||
| -rw-r--r-- | src/go/plugin/go.d/modules/windows/integrations/ms_sql_server.md (renamed from src/go/collectors/go.d.plugin/modules/windows/integrations/ms_sql_server.md) | 39 | ||||
| -rw-r--r-- | src/go/plugin/go.d/modules/windows/integrations/net_framework.md (renamed from src/go/collectors/go.d.plugin/modules/windows/integrations/net_framework.md) | 39 | ||||
| -rw-r--r-- | src/go/plugin/go.d/modules/windows/integrations/windows.md (renamed from src/go/collectors/go.d.plugin/modules/windows/integrations/windows.md) | 39 | ||||
| -rw-r--r-- | src/go/plugin/go.d/modules/windows/metadata.yaml (renamed from src/go/collectors/go.d.plugin/modules/windows/metadata.yaml) | 0 | ||||
| -rw-r--r-- | src/go/plugin/go.d/modules/windows/testdata/config.json (renamed from src/go/collectors/go.d.plugin/modules/windows/testdata/config.json) | 0 | ||||
| -rw-r--r-- | src/go/plugin/go.d/modules/windows/testdata/config.yaml (renamed from src/go/collectors/go.d.plugin/modules/windows/testdata/config.yaml) | 0 | ||||
| -rw-r--r-- | src/go/plugin/go.d/modules/windows/testdata/v0.20.0/metrics.txt (renamed from src/go/collectors/go.d.plugin/modules/windows/testdata/v0.20.0/metrics.txt) | 0 | ||||
| -rw-r--r-- | src/go/plugin/go.d/modules/windows/windows.go (renamed from src/go/collectors/go.d.plugin/modules/windows/windows.go) | 6 | ||||
| -rw-r--r-- | src/go/plugin/go.d/modules/windows/windows_test.go (renamed from src/go/collectors/go.d.plugin/modules/windows/windows_test.go) | 4 | ||||
| l--------- | src/go/plugin/go.d/modules/wireguard/README.md (renamed from src/go/collectors/go.d.plugin/modules/wireguard/README.md) | 0 | ||||
| -rw-r--r-- | src/go/plugin/go.d/modules/wireguard/charts.go (renamed from src/go/collectors/go.d.plugin/modules/wireguard/charts.go) | 2 | ||||
| -rw-r--r-- | src/go/plugin/go.d/modules/wireguard/collect.go (renamed from src/go/collectors/go.d.plugin/modules/wireguard/collect.go) | 0 | ||||
| -rw-r--r-- | src/go/plugin/go.d/modules/wireguard/config_schema.json (renamed from src/go/collectors/go.d.plugin/modules/wireguard/config_schema.json) | 0 | ||||
| -rw-r--r-- | src/go/plugin/go.d/modules/wireguard/integrations/wireguard.md (renamed from src/go/collectors/go.d.plugin/modules/wireguard/integrations/wireguard.md) | 39 | ||||
| -rw-r--r-- | src/go/plugin/go.d/modules/wireguard/metadata.yaml (renamed from src/go/collectors/go.d.plugin/modules/wireguard/metadata.yaml) | 0 | ||||
| -rw-r--r-- | src/go/plugin/go.d/modules/wireguard/testdata/config.json (renamed from src/go/collectors/go.d.plugin/modules/wireguard/testdata/config.json) | 0 | ||||
| -rw-r--r-- | src/go/plugin/go.d/modules/wireguard/testdata/config.yaml (renamed from src/go/collectors/go.d.plugin/modules/wireguard/testdata/config.yaml) | 0 | ||||
| -rw-r--r-- | src/go/plugin/go.d/modules/wireguard/wireguard.go (renamed from src/go/collectors/go.d.plugin/modules/wireguard/wireguard.go) | 2 | ||||
| -rw-r--r-- | src/go/plugin/go.d/modules/wireguard/wireguard_test.go (renamed from src/go/collectors/go.d.plugin/modules/wireguard/wireguard_test.go) | 2 | ||||
| l--------- | src/go/plugin/go.d/modules/x509check/README.md (renamed from src/go/collectors/go.d.plugin/modules/x509check/README.md) | 0 | ||||
| -rw-r--r-- | src/go/plugin/go.d/modules/x509check/charts.go (renamed from src/go/collectors/go.d.plugin/modules/x509check/charts.go) | 3 | ||||
| -rw-r--r-- | src/go/plugin/go.d/modules/x509check/collect.go (renamed from src/go/collectors/go.d.plugin/modules/x509check/collect.go) | 6 | ||||
| -rw-r--r-- | src/go/plugin/go.d/modules/x509check/config_schema.json (renamed from src/go/collectors/go.d.plugin/modules/x509check/config_schema.json) | 0 | ||||
| -rw-r--r-- | src/go/plugin/go.d/modules/x509check/init.go (renamed from src/go/collectors/go.d.plugin/modules/x509check/init.go) | 2 | ||||
| -rw-r--r-- | src/go/plugin/go.d/modules/x509check/integrations/x.509_certificate.md (renamed from src/go/collectors/go.d.plugin/modules/x509check/integrations/x.509_certificate.md) | 45 | ||||
| -rw-r--r-- | src/go/plugin/go.d/modules/x509check/metadata.yaml (renamed from src/go/collectors/go.d.plugin/modules/x509check/metadata.yaml) | 5 | ||||
| -rw-r--r-- | src/go/plugin/go.d/modules/x509check/provider.go (renamed from src/go/collectors/go.d.plugin/modules/x509check/provider.go) | 2 | ||||
| -rw-r--r-- | src/go/plugin/go.d/modules/x509check/testdata/config.json (renamed from src/go/collectors/go.d.plugin/modules/x509check/testdata/config.json) | 0 | ||||
| -rw-r--r-- | src/go/plugin/go.d/modules/x509check/testdata/config.yaml (renamed from src/go/collectors/go.d.plugin/modules/x509check/testdata/config.yaml) | 0 | ||||
| -rw-r--r-- | src/go/plugin/go.d/modules/x509check/x509check.go (renamed from src/go/collectors/go.d.plugin/modules/x509check/x509check.go) | 6 | ||||
| -rw-r--r-- | src/go/plugin/go.d/modules/x509check/x509check_test.go (renamed from src/go/collectors/go.d.plugin/modules/x509check/x509check_test.go) | 4 | ||||
| l--------- | src/go/plugin/go.d/modules/zfspool/README.md (renamed from src/go/collectors/go.d.plugin/modules/zfspool/README.md) | 0 | ||||
| -rw-r--r-- | src/go/plugin/go.d/modules/zfspool/charts.go (renamed from src/go/collectors/go.d.plugin/modules/zfspool/charts.go) | 96 | ||||
| -rw-r--r-- | src/go/plugin/go.d/modules/zfspool/collect.go | 27 | ||||
| -rw-r--r-- | src/go/plugin/go.d/modules/zfspool/collect_zpool_list.go (renamed from src/go/collectors/go.d.plugin/modules/zfspool/collect.go) | 87 | ||||
| -rw-r--r-- | src/go/plugin/go.d/modules/zfspool/collect_zpool_list_vdev.go | 138 | ||||
| -rw-r--r-- | src/go/plugin/go.d/modules/zfspool/config_schema.json (renamed from src/go/collectors/go.d.plugin/modules/zfspool/config_schema.json) | 0 | ||||
| -rw-r--r-- | src/go/plugin/go.d/modules/zfspool/exec.go (renamed from src/go/collectors/go.d.plugin/modules/zfspool/exec.go) | 17 | ||||
| -rw-r--r-- | src/go/plugin/go.d/modules/zfspool/init.go (renamed from src/go/collectors/go.d.plugin/modules/zfspool/init.go) | 0 | ||||
| -rw-r--r-- | src/go/plugin/go.d/modules/zfspool/integrations/zfs_pools.md (renamed from src/go/collectors/go.d.plugin/modules/zfspool/integrations/zfs_pools.md) | 57 | ||||
| -rw-r--r-- | src/go/plugin/go.d/modules/zfspool/metadata.yaml (renamed from src/go/collectors/go.d.plugin/modules/zfspool/metadata.yaml) | 24 | ||||
| -rw-r--r-- | src/go/plugin/go.d/modules/zfspool/testdata/config.json | 5 | ||||
| -rw-r--r-- | src/go/plugin/go.d/modules/zfspool/testdata/config.yaml | 3 | ||||
| -rw-r--r-- | src/go/plugin/go.d/modules/zfspool/testdata/zpool-list-vdev-logs-cache.txt | 12 | ||||
| -rw-r--r-- | src/go/plugin/go.d/modules/zfspool/testdata/zpool-list-vdev.txt | 5 | ||||
| -rw-r--r-- | src/go/plugin/go.d/modules/zfspool/testdata/zpool-list.txt (renamed from src/go/collectors/go.d.plugin/modules/zfspool/testdata/zpool-list.txt) | 0 | ||||
| -rw-r--r-- | src/go/plugin/go.d/modules/zfspool/zfspool.go (renamed from src/go/collectors/go.d.plugin/modules/zfspool/zfspool.go) | 13 | ||||
| -rw-r--r-- | src/go/plugin/go.d/modules/zfspool/zfspool_test.go | 546 | ||||
| l--------- | src/go/plugin/go.d/modules/zookeeper/README.md (renamed from src/go/collectors/go.d.plugin/modules/zookeeper/README.md) | 0 | ||||
| -rw-r--r-- | src/go/plugin/go.d/modules/zookeeper/charts.go (renamed from src/go/collectors/go.d.plugin/modules/zookeeper/charts.go) | 2 | ||||
| -rw-r--r-- | src/go/plugin/go.d/modules/zookeeper/collect.go (renamed from src/go/collectors/go.d.plugin/modules/zookeeper/collect.go) | 0 | ||||
| -rw-r--r-- | src/go/plugin/go.d/modules/zookeeper/config_schema.json (renamed from src/go/collectors/go.d.plugin/modules/zookeeper/config_schema.json) | 0 | ||||
| -rw-r--r-- | src/go/plugin/go.d/modules/zookeeper/fetcher.go (renamed from src/go/collectors/go.d.plugin/modules/zookeeper/fetcher.go) | 2 | ||||
| -rw-r--r-- | src/go/plugin/go.d/modules/zookeeper/fetcher_test.go (renamed from src/go/collectors/go.d.plugin/modules/zookeeper/fetcher_test.go) | 2 | ||||
| -rw-r--r-- | src/go/plugin/go.d/modules/zookeeper/init.go (renamed from src/go/collectors/go.d.plugin/modules/zookeeper/init.go) | 4 | ||||
| -rw-r--r-- | src/go/plugin/go.d/modules/zookeeper/integrations/zookeeper.md (renamed from src/go/collectors/go.d.plugin/modules/zookeeper/integrations/zookeeper.md) | 39 | ||||
| -rw-r--r-- | src/go/plugin/go.d/modules/zookeeper/metadata.yaml (renamed from src/go/collectors/go.d.plugin/modules/zookeeper/metadata.yaml) | 0 | ||||
| -rw-r--r-- | src/go/plugin/go.d/modules/zookeeper/testdata/config.json (renamed from src/go/collectors/go.d.plugin/modules/zookeeper/testdata/config.json) | 0 | ||||
| -rw-r--r-- | src/go/plugin/go.d/modules/zookeeper/testdata/config.yaml (renamed from src/go/collectors/go.d.plugin/modules/zookeeper/testdata/config.yaml) | 0 | ||||
| -rw-r--r-- | src/go/plugin/go.d/modules/zookeeper/testdata/mntr.txt (renamed from src/go/collectors/go.d.plugin/modules/zookeeper/testdata/mntr.txt) | 0 | ||||
| -rw-r--r-- | src/go/plugin/go.d/modules/zookeeper/testdata/mntr_notinwhitelist.txt (renamed from src/go/collectors/go.d.plugin/modules/zookeeper/testdata/mntr_notinwhitelist.txt) | 0 | ||||
| -rw-r--r-- | src/go/plugin/go.d/modules/zookeeper/zookeeper.go (renamed from src/go/collectors/go.d.plugin/modules/zookeeper/zookeeper.go) | 6 | ||||
| -rw-r--r-- | src/go/plugin/go.d/modules/zookeeper/zookeeper_test.go (renamed from src/go/collectors/go.d.plugin/modules/zookeeper/zookeeper_test.go) | 2 | ||||
| -rw-r--r-- | src/go/plugin/go.d/pkg/README.md (renamed from src/go/collectors/go.d.plugin/pkg/README.md) | 18 | ||||
| -rw-r--r-- | src/go/plugin/go.d/pkg/dockerhost/dockerhost.go (renamed from src/go/collectors/go.d.plugin/pkg/dockerhost/dockerhost.go) | 0 | ||||
| -rw-r--r-- | src/go/plugin/go.d/pkg/iprange/README.md (renamed from src/go/collectors/go.d.plugin/pkg/iprange/README.md) | 2 | ||||
| -rw-r--r-- | src/go/plugin/go.d/pkg/iprange/parse.go (renamed from src/go/collectors/go.d.plugin/pkg/iprange/parse.go) | 0 | ||||
| -rw-r--r-- | src/go/plugin/go.d/pkg/iprange/parse_test.go (renamed from src/go/collectors/go.d.plugin/pkg/iprange/parse_test.go) | 0 | ||||
| -rw-r--r-- | src/go/plugin/go.d/pkg/iprange/pool.go (renamed from src/go/collectors/go.d.plugin/pkg/iprange/pool.go) | 0 | ||||
| -rw-r--r-- | src/go/plugin/go.d/pkg/iprange/pool_test.go (renamed from src/go/collectors/go.d.plugin/pkg/iprange/pool_test.go) | 0 | ||||
| -rw-r--r-- | src/go/plugin/go.d/pkg/iprange/range.go (renamed from src/go/collectors/go.d.plugin/pkg/iprange/range.go) | 0 | ||||
| -rw-r--r-- | src/go/plugin/go.d/pkg/iprange/range_test.go (renamed from src/go/collectors/go.d.plugin/pkg/iprange/range_test.go) | 0 | ||||
| -rw-r--r-- | src/go/plugin/go.d/pkg/k8sclient/k8sclient.go (renamed from src/go/collectors/go.d.plugin/pkg/k8sclient/k8sclient.go) | 0 | ||||
| -rw-r--r-- | src/go/plugin/go.d/pkg/logs/csv.go (renamed from src/go/collectors/go.d.plugin/pkg/logs/csv.go) | 0 | ||||
| -rw-r--r-- | src/go/plugin/go.d/pkg/logs/csv_test.go (renamed from src/go/collectors/go.d.plugin/pkg/logs/csv_test.go) | 0 | ||||
| -rw-r--r-- | src/go/plugin/go.d/pkg/logs/json.go (renamed from src/go/collectors/go.d.plugin/pkg/logs/json.go) | 0 | ||||
| -rw-r--r-- | src/go/plugin/go.d/pkg/logs/json_test.go (renamed from src/go/collectors/go.d.plugin/pkg/logs/json_test.go) | 0 | ||||
| -rw-r--r-- | src/go/plugin/go.d/pkg/logs/lastline.go (renamed from src/go/collectors/go.d.plugin/pkg/logs/lastline.go) | 0 | ||||
| -rw-r--r-- | src/go/plugin/go.d/pkg/logs/lastline_test.go (renamed from src/go/collectors/go.d.plugin/pkg/logs/lastline_test.go) | 0 | ||||
| -rw-r--r-- | src/go/plugin/go.d/pkg/logs/ltsv.go (renamed from src/go/collectors/go.d.plugin/pkg/logs/ltsv.go) | 0 | ||||
| -rw-r--r-- | src/go/plugin/go.d/pkg/logs/ltsv_test.go (renamed from src/go/collectors/go.d.plugin/pkg/logs/ltsv_test.go) | 0 | ||||
| -rw-r--r-- | src/go/plugin/go.d/pkg/logs/parser.go (renamed from src/go/collectors/go.d.plugin/pkg/logs/parser.go) | 0 | ||||
| -rw-r--r-- | src/go/plugin/go.d/pkg/logs/parser_test.go (renamed from src/go/collectors/go.d.plugin/pkg/logs/parser_test.go) | 0 | ||||
| -rw-r--r-- | src/go/plugin/go.d/pkg/logs/reader.go (renamed from src/go/collectors/go.d.plugin/pkg/logs/reader.go) | 2 | ||||
| -rw-r--r-- | src/go/plugin/go.d/pkg/logs/reader_test.go (renamed from src/go/collectors/go.d.plugin/pkg/logs/reader_test.go) | 0 | ||||
| -rw-r--r-- | src/go/plugin/go.d/pkg/logs/regexp.go (renamed from src/go/collectors/go.d.plugin/pkg/logs/regexp.go) | 0 | ||||
| -rw-r--r-- | src/go/plugin/go.d/pkg/logs/regexp_test.go (renamed from src/go/collectors/go.d.plugin/pkg/logs/regexp_test.go) | 0 | ||||
| -rw-r--r-- | src/go/plugin/go.d/pkg/matcher/README.md (renamed from src/go/collectors/go.d.plugin/pkg/matcher/README.md) | 2 | ||||
| -rw-r--r-- | src/go/plugin/go.d/pkg/matcher/cache.go (renamed from src/go/collectors/go.d.plugin/pkg/matcher/cache.go) | 0 | ||||
| -rw-r--r-- | src/go/plugin/go.d/pkg/matcher/cache_test.go (renamed from src/go/collectors/go.d.plugin/pkg/matcher/cache_test.go) | 0 | ||||
| -rw-r--r-- | src/go/plugin/go.d/pkg/matcher/doc.go (renamed from src/go/collectors/go.d.plugin/pkg/matcher/doc.go) | 0 | ||||
| -rw-r--r-- | src/go/plugin/go.d/pkg/matcher/doc_test.go (renamed from src/go/collectors/go.d.plugin/pkg/matcher/doc_test.go) | 2 | ||||
| -rw-r--r-- | src/go/plugin/go.d/pkg/matcher/expr.go (renamed from src/go/collectors/go.d.plugin/pkg/matcher/expr.go) | 0 | ||||
| -rw-r--r-- | src/go/plugin/go.d/pkg/matcher/expr_test.go (renamed from src/go/collectors/go.d.plugin/pkg/matcher/expr_test.go) | 0 | ||||
| -rw-r--r-- | src/go/plugin/go.d/pkg/matcher/glob.go (renamed from src/go/collectors/go.d.plugin/pkg/matcher/glob.go) | 0 | ||||
| -rw-r--r-- | src/go/plugin/go.d/pkg/matcher/glob_test.go (renamed from src/go/collectors/go.d.plugin/pkg/matcher/glob_test.go) | 0 | ||||
| -rw-r--r-- | src/go/plugin/go.d/pkg/matcher/logical.go (renamed from src/go/collectors/go.d.plugin/pkg/matcher/logical.go) | 0 | ||||
| -rw-r--r-- | src/go/plugin/go.d/pkg/matcher/logical_test.go (renamed from src/go/collectors/go.d.plugin/pkg/matcher/logical_test.go) | 0 | ||||
| -rw-r--r-- | src/go/plugin/go.d/pkg/matcher/matcher.go (renamed from src/go/collectors/go.d.plugin/pkg/matcher/matcher.go) | 0 | ||||
| -rw-r--r-- | src/go/plugin/go.d/pkg/matcher/matcher_test.go (renamed from src/go/collectors/go.d.plugin/pkg/matcher/matcher_test.go) | 0 | ||||
| -rw-r--r-- | src/go/plugin/go.d/pkg/matcher/regexp.go (renamed from src/go/collectors/go.d.plugin/pkg/matcher/regexp.go) | 0 | ||||
| -rw-r--r-- | src/go/plugin/go.d/pkg/matcher/regexp_test.go (renamed from src/go/collectors/go.d.plugin/pkg/matcher/regexp_test.go) | 0 | ||||
| -rw-r--r-- | src/go/plugin/go.d/pkg/matcher/simple_patterns.go (renamed from src/go/collectors/go.d.plugin/pkg/matcher/simple_patterns.go) | 0 | ||||
| -rw-r--r-- | src/go/plugin/go.d/pkg/matcher/simple_patterns_test.go (renamed from src/go/collectors/go.d.plugin/pkg/matcher/simple_patterns_test.go) | 0 | ||||
| -rw-r--r-- | src/go/plugin/go.d/pkg/matcher/string.go (renamed from src/go/collectors/go.d.plugin/pkg/matcher/string.go) | 0 | ||||
| -rw-r--r-- | src/go/plugin/go.d/pkg/matcher/string_test.go (renamed from src/go/collectors/go.d.plugin/pkg/matcher/string_test.go) | 0 | ||||
| -rw-r--r-- | src/go/plugin/go.d/pkg/metrics/counter.go (renamed from src/go/collectors/go.d.plugin/pkg/metrics/counter.go) | 2 | ||||
| -rw-r--r-- | src/go/plugin/go.d/pkg/metrics/counter_test.go (renamed from src/go/collectors/go.d.plugin/pkg/metrics/counter_test.go) | 0 | ||||
| -rw-r--r-- | src/go/plugin/go.d/pkg/metrics/gauge.go (renamed from src/go/collectors/go.d.plugin/pkg/metrics/gauge.go) | 2 | ||||
| -rw-r--r-- | src/go/plugin/go.d/pkg/metrics/gauge_test.go (renamed from src/go/collectors/go.d.plugin/pkg/metrics/gauge_test.go) | 0 | ||||
| -rw-r--r-- | src/go/plugin/go.d/pkg/metrics/histogram.go (renamed from src/go/collectors/go.d.plugin/pkg/metrics/histogram.go) | 2 | ||||
| -rw-r--r-- | src/go/plugin/go.d/pkg/metrics/histogram_test.go (renamed from src/go/collectors/go.d.plugin/pkg/metrics/histogram_test.go) | 0 | ||||
| -rw-r--r-- | src/go/plugin/go.d/pkg/metrics/metrics.go (renamed from src/go/collectors/go.d.plugin/pkg/metrics/metrics.go) | 2 | ||||
| -rw-r--r-- | src/go/plugin/go.d/pkg/metrics/summary.go (renamed from src/go/collectors/go.d.plugin/pkg/metrics/summary.go) | 2 | ||||
| -rw-r--r-- | src/go/plugin/go.d/pkg/metrics/summary_test.go (renamed from src/go/collectors/go.d.plugin/pkg/metrics/summary_test.go) | 0 | ||||
| -rw-r--r-- | src/go/plugin/go.d/pkg/metrics/unique_counter.go (renamed from src/go/collectors/go.d.plugin/pkg/metrics/unique_counter.go) | 2 | ||||
| -rw-r--r-- | src/go/plugin/go.d/pkg/metrics/unique_counter_test.go (renamed from src/go/collectors/go.d.plugin/pkg/metrics/unique_counter_test.go) | 0 | ||||
| -rw-r--r-- | src/go/plugin/go.d/pkg/multipath/multipath.go (renamed from src/go/collectors/go.d.plugin/pkg/multipath/multipath.go) | 0 | ||||
| -rw-r--r-- | src/go/plugin/go.d/pkg/multipath/multipath_test.go (renamed from src/go/collectors/go.d.plugin/pkg/multipath/multipath_test.go) | 0 | ||||
| -rw-r--r-- | src/go/plugin/go.d/pkg/multipath/testdata/data1/test-empty.conf (renamed from src/go/collectors/go.d.plugin/pkg/multipath/testdata/data1/test-empty.conf) | 0 | ||||
| -rw-r--r-- | src/go/plugin/go.d/pkg/multipath/testdata/data1/test.conf (renamed from src/go/collectors/go.d.plugin/pkg/multipath/testdata/data1/test.conf) | 0 | ||||
| -rw-r--r-- | src/go/plugin/go.d/pkg/multipath/testdata/data2/test-empty.conf (renamed from src/go/collectors/go.d.plugin/pkg/multipath/testdata/data2/test-empty.conf) | 0 | ||||
| -rw-r--r-- | src/go/plugin/go.d/pkg/multipath/testdata/data2/test.conf (renamed from src/go/collectors/go.d.plugin/pkg/multipath/testdata/data2/test.conf) | 0 | ||||
| -rw-r--r-- | src/go/plugin/go.d/pkg/prometheus/client.go (renamed from src/go/collectors/go.d.plugin/pkg/prometheus/client.go) | 4 | ||||
| -rw-r--r-- | src/go/plugin/go.d/pkg/prometheus/client_test.go (renamed from src/go/collectors/go.d.plugin/pkg/prometheus/client_test.go) | 4 | ||||
| -rw-r--r-- | src/go/plugin/go.d/pkg/prometheus/metric_family.go (renamed from src/go/collectors/go.d.plugin/pkg/prometheus/metric_family.go) | 0 | ||||
| -rw-r--r-- | src/go/plugin/go.d/pkg/prometheus/metric_family_test.go (renamed from src/go/collectors/go.d.plugin/pkg/prometheus/metric_family_test.go) | 0 | ||||
| -rw-r--r-- | src/go/plugin/go.d/pkg/prometheus/metric_series.go (renamed from src/go/collectors/go.d.plugin/pkg/prometheus/metric_series.go) | 0 | ||||
| -rw-r--r-- | src/go/plugin/go.d/pkg/prometheus/metric_series_test.go (renamed from src/go/collectors/go.d.plugin/pkg/prometheus/metric_series_test.go) | 0 | ||||
| -rw-r--r-- | src/go/plugin/go.d/pkg/prometheus/parse.go (renamed from src/go/collectors/go.d.plugin/pkg/prometheus/parse.go) | 2 | ||||
| -rw-r--r-- | src/go/plugin/go.d/pkg/prometheus/parse_test.go (renamed from src/go/collectors/go.d.plugin/pkg/prometheus/parse_test.go) | 2 | ||||
| -rw-r--r-- | src/go/plugin/go.d/pkg/prometheus/selector/README.md (renamed from src/go/collectors/go.d.plugin/pkg/prometheus/selector/README.md) | 2 | ||||
| -rw-r--r-- | src/go/plugin/go.d/pkg/prometheus/selector/expr.go (renamed from src/go/collectors/go.d.plugin/pkg/prometheus/selector/expr.go) | 0 | ||||
| -rw-r--r-- | src/go/plugin/go.d/pkg/prometheus/selector/expr_test.go (renamed from src/go/collectors/go.d.plugin/pkg/prometheus/selector/expr_test.go) | 0 | ||||
| -rw-r--r-- | src/go/plugin/go.d/pkg/prometheus/selector/logical.go (renamed from src/go/collectors/go.d.plugin/pkg/prometheus/selector/logical.go) | 0 | ||||
| -rw-r--r-- | src/go/plugin/go.d/pkg/prometheus/selector/logical_test.go (renamed from src/go/collectors/go.d.plugin/pkg/prometheus/selector/logical_test.go) | 0 | ||||
| -rw-r--r-- | src/go/plugin/go.d/pkg/prometheus/selector/parse.go (renamed from src/go/collectors/go.d.plugin/pkg/prometheus/selector/parse.go) | 2 | ||||
| -rw-r--r-- | src/go/plugin/go.d/pkg/prometheus/selector/parse_test.go (renamed from src/go/collectors/go.d.plugin/pkg/prometheus/selector/parse_test.go) | 2 | ||||
| -rw-r--r-- | src/go/plugin/go.d/pkg/prometheus/selector/selector.go (renamed from src/go/collectors/go.d.plugin/pkg/prometheus/selector/selector.go) | 2 | ||||
| -rw-r--r-- | src/go/plugin/go.d/pkg/prometheus/selector/selector_test.go (renamed from src/go/collectors/go.d.plugin/pkg/prometheus/selector/selector_test.go) | 0 | ||||
| -rw-r--r-- | src/go/plugin/go.d/pkg/prometheus/testdata/counter-meta.txt (renamed from src/go/collectors/go.d.plugin/pkg/prometheus/testdata/counter-meta.txt) | 0 | ||||
| -rw-r--r-- | src/go/plugin/go.d/pkg/prometheus/testdata/counter-no-meta.txt (renamed from src/go/collectors/go.d.plugin/pkg/prometheus/testdata/counter-no-meta.txt) | 0 | ||||
| -rw-r--r-- | src/go/plugin/go.d/pkg/prometheus/testdata/gauge-meta.txt (renamed from src/go/collectors/go.d.plugin/pkg/prometheus/testdata/gauge-meta.txt) | 0 | ||||
| -rw-r--r-- | src/go/plugin/go.d/pkg/prometheus/testdata/gauge-no-meta.txt (renamed from src/go/collectors/go.d.plugin/pkg/prometheus/testdata/gauge-no-meta.txt) | 0 | ||||
| -rw-r--r-- | src/go/plugin/go.d/pkg/prometheus/testdata/histogram-meta.txt (renamed from src/go/collectors/go.d.plugin/pkg/prometheus/testdata/histogram-meta.txt) | 0 | ||||
| -rw-r--r-- | src/go/plugin/go.d/pkg/prometheus/testdata/histogram-no-meta.txt (renamed from src/go/collectors/go.d.plugin/pkg/prometheus/testdata/histogram-no-meta.txt) | 0 | ||||
| -rw-r--r-- | src/go/plugin/go.d/pkg/prometheus/testdata/multiline-help.txt (renamed from src/go/collectors/go.d.plugin/pkg/prometheus/testdata/multiline-help.txt) | 0 | ||||
| -rw-r--r-- | src/go/plugin/go.d/pkg/prometheus/testdata/summary-meta.txt (renamed from src/go/collectors/go.d.plugin/pkg/prometheus/testdata/summary-meta.txt) | 0 | ||||
| -rw-r--r-- | src/go/plugin/go.d/pkg/prometheus/testdata/summary-no-meta.txt (renamed from src/go/collectors/go.d.plugin/pkg/prometheus/testdata/summary-no-meta.txt) | 0 | ||||
| -rw-r--r-- | src/go/plugin/go.d/pkg/prometheus/testdata/testdata.nometa.txt (renamed from src/go/collectors/go.d.plugin/pkg/prometheus/testdata/testdata.nometa.txt) | 0 | ||||
| -rw-r--r-- | src/go/plugin/go.d/pkg/prometheus/testdata/testdata.txt (renamed from src/go/collectors/go.d.plugin/pkg/prometheus/testdata/testdata.txt) | 0 | ||||
| -rw-r--r-- | src/go/plugin/go.d/pkg/socket/client.go (renamed from src/go/collectors/go.d.plugin/pkg/socket/client.go) | 0 | ||||
| -rw-r--r-- | src/go/plugin/go.d/pkg/socket/client_test.go (renamed from src/go/collectors/go.d.plugin/pkg/socket/client_test.go) | 0 | ||||
| -rw-r--r-- | src/go/plugin/go.d/pkg/socket/servers_test.go (renamed from src/go/collectors/go.d.plugin/pkg/socket/servers_test.go) | 0 | ||||
| -rw-r--r-- | src/go/plugin/go.d/pkg/socket/types.go (renamed from src/go/collectors/go.d.plugin/pkg/socket/types.go) | 0 | ||||
| -rw-r--r-- | src/go/plugin/go.d/pkg/socket/utils.go (renamed from src/go/collectors/go.d.plugin/pkg/socket/utils.go) | 0 | ||||
| -rw-r--r-- | src/go/plugin/go.d/pkg/stm/stm.go (renamed from src/go/collectors/go.d.plugin/pkg/stm/stm.go) | 0 | ||||
| -rw-r--r-- | src/go/plugin/go.d/pkg/stm/stm_test.go (renamed from src/go/collectors/go.d.plugin/pkg/stm/stm_test.go) | 4 | ||||
| -rw-r--r-- | src/go/plugin/go.d/pkg/tlscfg/config.go (renamed from src/go/collectors/go.d.plugin/pkg/tlscfg/config.go) | 0 | ||||
| -rw-r--r-- | src/go/plugin/go.d/pkg/tlscfg/config_test.go (renamed from src/go/collectors/go.d.plugin/pkg/tlscfg/config_test.go) | 0 | ||||
| -rw-r--r-- | src/go/plugin/go.d/pkg/web/client.go (renamed from src/go/collectors/go.d.plugin/pkg/web/client.go) | 2 | ||||
| -rw-r--r-- | src/go/plugin/go.d/pkg/web/client_test.go (renamed from src/go/collectors/go.d.plugin/pkg/web/client_test.go) | 0 | ||||
| -rw-r--r-- | src/go/plugin/go.d/pkg/web/doc.go (renamed from src/go/collectors/go.d.plugin/pkg/web/doc.go) | 0 | ||||
| -rw-r--r-- | src/go/plugin/go.d/pkg/web/doc_test.go (renamed from src/go/collectors/go.d.plugin/pkg/web/doc_test.go) | 0 | ||||
| -rw-r--r-- | src/go/plugin/go.d/pkg/web/duration.go (renamed from src/go/collectors/go.d.plugin/pkg/web/duration.go) | 0 | ||||
| -rw-r--r-- | src/go/plugin/go.d/pkg/web/duration_test.go (renamed from src/go/collectors/go.d.plugin/pkg/web/duration_test.go) | 0 | ||||
| -rw-r--r-- | src/go/plugin/go.d/pkg/web/request.go (renamed from src/go/collectors/go.d.plugin/pkg/web/request.go) | 17 | ||||
| -rw-r--r-- | src/go/plugin/go.d/pkg/web/request_test.go (renamed from src/go/collectors/go.d.plugin/pkg/web/request_test.go) | 28 | ||||
| -rw-r--r-- | src/go/plugin/go.d/pkg/web/web.go (renamed from src/go/collectors/go.d.plugin/pkg/web/web.go) | 0 | ||||
| -rw-r--r-- | src/health/guides/httpcheck/httpcheck_web_service_bad_content.md | 2 | ||||
| -rw-r--r-- | src/health/guides/httpcheck/httpcheck_web_service_bad_status.md | 2 | ||||
| -rw-r--r-- | src/health/guides/httpcheck/httpcheck_web_service_slow.md | 2 | ||||
| -rw-r--r-- | src/health/guides/httpcheck/httpcheck_web_service_unreachable.md | 2 | ||||
| -rw-r--r-- | src/health/health.d/beanstalkd.conf | 30 | ||||
| -rw-r--r-- | src/health/health.d/docker.conf | 23 | ||||
| -rw-r--r-- | src/health/health.d/gearman.conf | 27 | ||||
| -rw-r--r-- | src/health/health.d/ipfs.conf | 4 | ||||
| -rw-r--r-- | src/health/health.d/x509check.conf | 7 | ||||
| -rw-r--r-- | src/health/health.d/zfs.conf | 19 | ||||
| -rw-r--r-- | src/health/health_event_loop.c | 195 | ||||
| -rw-r--r-- | src/health/health_log.c | 5 | ||||
| -rw-r--r-- | src/health/health_notifications.c | 11 | ||||
| -rw-r--r-- | src/health/health_prototypes.c | 9 | ||||
| -rwxr-xr-x | src/health/notifications/alarm-notify.sh.in | 21 | ||||
| -rwxr-xr-x | src/health/notifications/health_alarm_notify.conf | 1 | ||||
| -rw-r--r-- | src/health/notifications/telegram/README.md | 2 | ||||
| -rw-r--r-- | src/health/notifications/telegram/metadata.yaml | 2 | ||||
| -rw-r--r-- | src/libnetdata/clocks/clocks.c | 34 | ||||
| -rw-r--r-- | src/libnetdata/json/json-c-parser-inline.h | 2 | ||||
| -rw-r--r-- | src/libnetdata/libnetdata.c | 104 | ||||
| -rw-r--r-- | src/libnetdata/libnetdata.h | 26 | ||||
| -rw-r--r-- | src/libnetdata/locks/locks.c | 82 | ||||
| -rw-r--r-- | src/libnetdata/locks/locks.h | 31 | ||||
| -rw-r--r-- | src/libnetdata/log/log.c | 136 | ||||
| -rw-r--r-- | src/libnetdata/log/log.h | 8 | ||||
| -rw-r--r-- | src/libnetdata/maps/local-sockets.h | 664 | ||||
| -rw-r--r-- | src/libnetdata/maps/system-services.h | 92 | ||||
| -rw-r--r-- | src/libnetdata/os/close_range.c | 98 | ||||
| -rw-r--r-- | src/libnetdata/os/close_range.h | 12 | ||||
| -rw-r--r-- | src/libnetdata/os/get_pid_max.c | 45 | ||||
| -rw-r--r-- | src/libnetdata/os/os-windows-wrappers.c | 61 | ||||
| -rw-r--r-- | src/libnetdata/os/os-windows-wrappers.h | 18 | ||||
| -rw-r--r-- | src/libnetdata/os/os.h | 4 | ||||
| -rw-r--r-- | src/libnetdata/os/setproctitle.c | 31 | ||||
| -rw-r--r-- | src/libnetdata/os/setproctitle.h | 8 | ||||
| -rw-r--r-- | src/libnetdata/os/waitid.c | 72 | ||||
| -rw-r--r-- | src/libnetdata/os/waitid.h | 48 | ||||
| -rw-r--r-- | src/libnetdata/popen/README.md | 15 | ||||
| -rw-r--r-- | src/libnetdata/popen/popen.c | 446 | ||||
| -rw-r--r-- | src/libnetdata/popen/popen.h | 35 | ||||
| -rw-r--r-- | src/libnetdata/procfile/procfile.c | 2 | ||||
| -rw-r--r-- | src/libnetdata/socket/socket.c | 10 | ||||
| -rw-r--r-- | src/libnetdata/spawn_server/spawn_popen.c | 142 | ||||
| -rw-r--r-- | src/libnetdata/spawn_server/spawn_popen.h | 24 | ||||
| -rw-r--r-- | src/libnetdata/spawn_server/spawn_server.c | 1533 | ||||
| -rw-r--r-- | src/libnetdata/spawn_server/spawn_server.h | 57 | ||||
| -rw-r--r-- | src/libnetdata/string/string.c | 5 | ||||
| -rw-r--r-- | src/libnetdata/string/string.h | 2 | ||||
| -rw-r--r-- | src/libnetdata/threads/threads.c | 12 | ||||
| -rw-r--r-- | src/libnetdata/threads/threads.h | 2 | ||||
| -rw-r--r-- | src/logsmanagement/README.md | 673 | ||||
| -rw-r--r-- | src/logsmanagement/circular_buffer.c | 404 | ||||
| -rw-r--r-- | src/logsmanagement/circular_buffer.h | 66 | ||||
| -rw-r--r-- | src/logsmanagement/db_api.c | 1396 | ||||
| -rw-r--r-- | src/logsmanagement/db_api.h | 22 | ||||
| -rw-r--r-- | src/logsmanagement/defaults.h | 140 | ||||
| -rw-r--r-- | src/logsmanagement/file_info.h | 165 | ||||
| -rw-r--r-- | src/logsmanagement/flb_plugin.c | 1536 | ||||
| -rw-r--r-- | src/logsmanagement/flb_plugin.h | 35 | ||||
| -rw-r--r-- | src/logsmanagement/fluent_bit_build/CMakeLists.patch | 19 | ||||
| -rw-r--r-- | src/logsmanagement/fluent_bit_build/chunkio-static-lib-fts.patch | 10 | ||||
| -rw-r--r-- | src/logsmanagement/fluent_bit_build/config.cmake | 178 | ||||
| -rw-r--r-- | src/logsmanagement/fluent_bit_build/exclude-luajit.patch | 10 | ||||
| -rw-r--r-- | src/logsmanagement/fluent_bit_build/flb-log-fmt.patch | 52 | ||||
| -rw-r--r-- | src/logsmanagement/fluent_bit_build/xsi-strerror.patch | 15 | ||||
| -rw-r--r-- | src/logsmanagement/functions.c | 722 | ||||
| -rw-r--r-- | src/logsmanagement/functions.h | 22 | ||||
| -rw-r--r-- | src/logsmanagement/helper.h | 238 | ||||
| -rw-r--r-- | src/logsmanagement/logsmanag_config.c | 1410 | ||||
| -rw-r--r-- | src/logsmanagement/logsmanag_config.h | 31 | ||||
| -rw-r--r-- | src/logsmanagement/logsmanagement.c | 252 | ||||
| -rw-r--r-- | src/logsmanagement/parser.c | 1499 | ||||
| -rw-r--r-- | src/logsmanagement/parser.h | 436 | ||||
| -rw-r--r-- | src/logsmanagement/query.c | 238 | ||||
| -rw-r--r-- | src/logsmanagement/query.h | 157 | ||||
| -rw-r--r-- | src/logsmanagement/rrd_api/rrd_api.h | 312 | ||||
| -rw-r--r-- | src/logsmanagement/rrd_api/rrd_api_docker_ev.c | 137 | ||||
| -rw-r--r-- | src/logsmanagement/rrd_api/rrd_api_docker_ev.h | 39 | ||||
| -rw-r--r-- | src/logsmanagement/rrd_api/rrd_api_generic.c | 28 | ||||
| -rw-r--r-- | src/logsmanagement/rrd_api/rrd_api_generic.h | 34 | ||||
| -rw-r--r-- | src/logsmanagement/rrd_api/rrd_api_kernel.c | 168 | ||||
| -rw-r--r-- | src/logsmanagement/rrd_api/rrd_api_kernel.h | 46 | ||||
| -rw-r--r-- | src/logsmanagement/rrd_api/rrd_api_mqtt.c | 79 | ||||
| -rw-r--r-- | src/logsmanagement/rrd_api/rrd_api_mqtt.h | 37 | ||||
| -rw-r--r-- | src/logsmanagement/rrd_api/rrd_api_stats.c | 298 | ||||
| -rw-r--r-- | src/logsmanagement/rrd_api/rrd_api_stats.h | 19 | ||||
| -rw-r--r-- | src/logsmanagement/rrd_api/rrd_api_systemd.c | 206 | ||||
| -rw-r--r-- | src/logsmanagement/rrd_api/rrd_api_systemd.h | 45 | ||||
| -rw-r--r-- | src/logsmanagement/rrd_api/rrd_api_web_log.c | 716 | ||||
| -rw-r--r-- | src/logsmanagement/rrd_api/rrd_api_web_log.h | 88 | ||||
| -rw-r--r-- | src/logsmanagement/stock_conf/logsmanagement.d.conf.in | 33 | ||||
| -rw-r--r-- | src/logsmanagement/stock_conf/logsmanagement.d/default.conf | 455 | ||||
| -rw-r--r-- | src/logsmanagement/stock_conf/logsmanagement.d/example_forward.conf | 96 | ||||
| -rw-r--r-- | src/logsmanagement/stock_conf/logsmanagement.d/example_mqtt.conf | 31 | ||||
| -rw-r--r-- | src/logsmanagement/stock_conf/logsmanagement.d/example_serial.conf | 38 | ||||
| -rw-r--r-- | src/logsmanagement/stock_conf/logsmanagement.d/example_syslog.conf | 145 | ||||
| -rw-r--r-- | src/logsmanagement/unit_test/unit_test.c | 787 | ||||
| -rw-r--r-- | src/logsmanagement/unit_test/unit_test.h | 12 | ||||
| -rw-r--r-- | src/registry/registry_db.c | 2 | ||||
| -rw-r--r-- | src/spawn/README.md | 0 | ||||
| -rw-r--r-- | src/spawn/spawn.c | 288 | ||||
| -rw-r--r-- | src/spawn/spawn.h | 109 | ||||
| -rw-r--r-- | src/spawn/spawn_client.c | 250 | ||||
| -rw-r--r-- | src/spawn/spawn_server.c | 386 | ||||
| -rw-r--r-- | src/streaming/receiver.c | 2 | ||||
| -rw-r--r-- | src/streaming/rrdpush.c | 2 | ||||
| -rw-r--r-- | src/streaming/sender.c | 2 | ||||
| -rw-r--r-- | src/streaming/stream.conf | 6 | ||||
| -rw-r--r-- | src/web/api/queries/query.c | 2 | ||||
| -rw-r--r-- | src/web/api/web_api_v1.c | 5 | ||||
| -rw-r--r-- | src/web/server/web_client.c | 2 |
2763 files changed, 56950 insertions, 41335 deletions
diff --git a/src/aclk/aclk.c b/src/aclk/aclk.c index 991745491..627edfc91 100644 --- a/src/aclk/aclk.c +++ b/src/aclk/aclk.c @@ -52,9 +52,9 @@ time_t aclk_block_until = 0; #ifdef ENABLE_ACLK mqtt_wss_client mqttwss_client; -netdata_mutex_t aclk_shared_state_mutex = NETDATA_MUTEX_INITIALIZER; -#define ACLK_SHARED_STATE_LOCK netdata_mutex_lock(&aclk_shared_state_mutex) -#define ACLK_SHARED_STATE_UNLOCK netdata_mutex_unlock(&aclk_shared_state_mutex) +//netdata_mutex_t aclk_shared_state_mutex = NETDATA_MUTEX_INITIALIZER; +//#define ACLK_SHARED_STATE_LOCK netdata_mutex_lock(&aclk_shared_state_mutex) +//#define ACLK_SHARED_STATE_UNLOCK netdata_mutex_unlock(&aclk_shared_state_mutex) struct aclk_shared_state aclk_shared_state = { .mqtt_shutdown_msg_id = -1, @@ -1058,30 +1058,24 @@ void aclk_send_bin_msg(char *msg, size_t msg_len, enum aclk_topics subtopic, con static void fill_alert_status_for_host(BUFFER *wb, RRDHOST *host) { - struct proto_alert_status status; - memset(&status, 0, sizeof(status)); - if (get_proto_alert_status(host, &status)) { - buffer_strcat(wb, "\nFailed to get alert streaming status for this host"); + struct aclk_sync_cfg_t *wc = host->aclk_config; + if (!wc) return; - } + buffer_sprintf(wb, "\n\t\tUpdates: %d" - "\n\t\tPending Min Seq ID: %"PRIu64 - "\n\t\tPending Max Seq ID: %"PRIu64 - "\n\t\tLast Submitted Seq ID: %"PRIu64, - status.alert_updates, - status.pending_min_sequence_id, - status.pending_max_sequence_id, - status.last_submitted_sequence_id + "\n\t\tCheckpoints: %d" + "\n\t\tAlert count: %d" + "\n\t\tAlert snapshot count: %d", + wc->stream_alerts, + wc->checkpoint_count, + wc->alert_count, + wc->snapshot_count ); } -#endif /* ENABLE_ACLK */ char *aclk_state(void) { -#ifndef ENABLE_ACLK - return strdupz("ACLK Available: No"); -#else BUFFER *wb = buffer_create(1024, &netdata_buffers_statistics.buffers_aclk); struct tm *tmptr, tmbuf; char *ret; @@ -1163,28 +1157,25 @@ char *aclk_state(void) ret = strdupz(buffer_tostring(wb)); buffer_free(wb); return ret; -#endif /* ENABLE_ACLK */ } -#ifdef ENABLE_ACLK static void fill_alert_status_for_host_json(json_object *obj, RRDHOST *host) { - struct proto_alert_status status; - memset(&status, 0, sizeof(status)); - if (get_proto_alert_status(host, &status)) + struct aclk_sync_cfg_t *wc = host->aclk_config; + if (!wc) return; - json_object *tmp = json_object_new_int(status.alert_updates); + json_object *tmp = json_object_new_int(wc->stream_alerts); json_object_object_add(obj, "updates", tmp); - tmp = json_object_new_int(status.pending_min_sequence_id); - json_object_object_add(obj, "pending-min-seq-id", tmp); + tmp = json_object_new_int(wc->checkpoint_count); + json_object_object_add(obj, "checkpoint-count", tmp); - tmp = json_object_new_int(status.pending_max_sequence_id); - json_object_object_add(obj, "pending-max-seq-id", tmp); + tmp = json_object_new_int(wc->alert_count); + json_object_object_add(obj, "alert-count", tmp); - tmp = json_object_new_int(status.last_submitted_sequence_id); - json_object_object_add(obj, "last-submitted-seq-id", tmp); + tmp = json_object_new_int(wc->snapshot_count); + json_object_object_add(obj, "alert-snapshot-count", tmp); } static json_object *timestamp_to_json(const time_t *t) @@ -1197,13 +1188,9 @@ static json_object *timestamp_to_json(const time_t *t) } return NULL; } -#endif /* ENABLE_ACLK */ char *aclk_state_json(void) { -#ifndef ENABLE_ACLK - return strdupz("{\"aclk-available\":false}"); -#else json_object *tmp, *grp, *msg = json_object_new_object(); tmp = json_object_new_boolean(1); @@ -1313,8 +1300,8 @@ char *aclk_state_json(void) char *str = strdupz(json_object_to_json_string_ext(msg, JSON_C_TO_STRING_PLAIN)); json_object_put(msg); return str; -#endif /* ENABLE_ACLK */ } +#endif /* ENABLE_ACLK */ void add_aclk_host_labels(void) { RRDLABELS *labels = localhost->rrdlabels; @@ -1347,7 +1334,7 @@ void add_aclk_host_labels(void) { void aclk_queue_node_info(RRDHOST *host, bool immediate) { - struct aclk_sync_cfg_t *wc = host->aclk_config; - if (likely(wc)) + struct aclk_sync_cfg_t *wc = host->aclk_config; + if (wc) wc->node_info_send_time = (host == localhost || immediate) ? 1 : now_realtime_sec(); } diff --git a/src/aclk/aclk_capas.c b/src/aclk/aclk_capas.c index 00102ad4a..0f7870fdd 100644 --- a/src/aclk/aclk_capas.c +++ b/src/aclk/aclk_capas.c @@ -16,7 +16,7 @@ const struct capability *aclk_get_agent_capas() { .name = "ctx", .version = 1, .enabled = 1 }, { .name = "funcs", .version = 1, .enabled = 1 }, { .name = "http_api_v2", .version = HTTP_API_V2_VERSION, .enabled = 1 }, - { .name = "health", .version = 1, .enabled = 0 }, // index 7, below + { .name = "health", .version = 2, .enabled = 0 }, // index 7, below { .name = "req_cancel", .version = 1, .enabled = 1 }, { .name = "dyncfg", .version = 2, .enabled = 1 }, { .name = NULL, .version = 0, .enabled = 0 } @@ -46,7 +46,7 @@ struct capability *aclk_get_node_instance_capas(RRDHOST *host) { .name = "ctx", .version = 1, .enabled = 1 }, { .name = "funcs", .version = functions ? 1 : 0, .enabled = functions ? 1 : 0 }, { .name = "http_api_v2", .version = HTTP_API_V2_VERSION, .enabled = 1 }, - { .name = "health", .version = 1, .enabled = host->health.health_enabled }, + { .name = "health", .version = 2, .enabled = host->health.health_enabled }, { .name = "req_cancel", .version = 1, .enabled = 1 }, { .name = "dyncfg", .version = 2, .enabled = dyncfg }, { .name = NULL, .version = 0, .enabled = 0 } diff --git a/src/aclk/aclk_rx_msgs.c b/src/aclk/aclk_rx_msgs.c index 60e421928..8db8e3f1e 100644 --- a/src/aclk/aclk_rx_msgs.c +++ b/src/aclk/aclk_rx_msgs.c @@ -106,13 +106,13 @@ static inline int aclk_v2_payload_get_query(const char *payload, char **query_ur else if(strncmp(payload, "DELETE /", 8) == 0) start = payload + 7; else { - errno = 0; + errno_clear(); netdata_log_error("Only accepting requests that start with GET, POST, PUT, DELETE from CLOUD."); return 1; } if(!(end = strstr(payload, HTTP_1_1 HTTP_ENDL))) { - errno = 0; + errno_clear(); netdata_log_error("Doesn't look like HTTP GET request."); return 1; } @@ -127,7 +127,7 @@ static int aclk_handle_cloud_http_request_v2(struct aclk_request *cloud_to_agent { aclk_query_t query; - errno = 0; + errno_clear(); if (cloud_to_agent->version < ACLK_V_COMPRESSION) { netdata_log_error( "This handler cannot reply to request with version older than %d, received %d.", @@ -347,7 +347,7 @@ int start_alarm_streaming(const char *msg, size_t msg_len) netdata_log_error("Error parsing StartAlarmStreaming"); return 1; } - aclk_start_alert_streaming(res.node_id, res.resets); + aclk_start_alert_streaming(res.node_id, res.version); freez(res.node_id); return 0; } @@ -361,7 +361,7 @@ int send_alarm_checkpoint(const char *msg, size_t msg_len) freez(sac.claim_id); return 1; } - aclk_send_alarm_checkpoint(sac.node_id, sac.claim_id); + aclk_alert_version_check(sac.node_id, sac.claim_id, sac.version); freez(sac.node_id); freez(sac.claim_id); return 0; @@ -375,7 +375,7 @@ int send_alarm_configuration(const char *msg, size_t msg_len) freez(config_hash); return 1; } - aclk_send_alarm_configuration(config_hash); + aclk_send_alert_configuration(config_hash); freez(config_hash); return 0; } diff --git a/src/aclk/helpers/mqtt_wss_pal.h b/src/aclk/helpers/mqtt_wss_pal.h index 5c89f8bb7..fe1aacf49 100644 --- a/src/aclk/helpers/mqtt_wss_pal.h +++ b/src/aclk/helpers/mqtt_wss_pal.h @@ -10,10 +10,4 @@ #undef OPENSSL_VERSION_110 #undef OPENSSL_VERSION_111 -#define mw_malloc(...) mallocz(__VA_ARGS__) -#define mw_calloc(...) callocz(__VA_ARGS__) -#define mw_free(...) freez(__VA_ARGS__) -#define mw_strdup(...) strdupz(__VA_ARGS__) -#define mw_realloc(...) reallocz(__VA_ARGS__) - #endif /* MQTT_WSS_PAL_H */ diff --git a/src/aclk/https_client.c b/src/aclk/https_client.c index 2bc768f24..8c44f13e3 100644 --- a/src/aclk/https_client.c +++ b/src/aclk/https_client.c @@ -696,7 +696,7 @@ int https_request(https_req_t *request, https_req_response_t *response) { goto exit_CTX; } - if (!SSL_set_tlsext_host_name(ctx->ssl, connect_host)) { + if (!SSL_set_tlsext_host_name(ctx->ssl, request->host)) { netdata_log_error("Error setting TLS SNI host"); goto exit_CTX; } diff --git a/src/aclk/mqtt_websockets/mqtt_ng.c b/src/aclk/mqtt_websockets/mqtt_ng.c index f570fde71..8ad6bd5c9 100644 --- a/src/aclk/mqtt_websockets/mqtt_ng.c +++ b/src/aclk/mqtt_websockets/mqtt_ng.c @@ -423,7 +423,7 @@ static void buffer_frag_free_data(struct buffer_fragment *frag) if ( frag->flags & BUFFER_FRAG_DATA_EXTERNAL && frag->data != NULL) { switch (ptr2memory_mode(frag->free_fnc)) { case MEMCPY: - mw_free(frag->data); + freez(frag->data); break; case EXTERNAL_FREE_AFTER_USE: frag->free_fnc(frag->data); @@ -563,7 +563,7 @@ static int transaction_buffer_grow(struct transaction_buffer *buf, mqtt_wss_log_ if (buf->hdr_buffer.size > max) buf->hdr_buffer.size = max; - void *ret = mw_realloc(buf->hdr_buffer.data, buf->hdr_buffer.size); + void *ret = reallocz(buf->hdr_buffer.data, buf->hdr_buffer.size); if (ret == NULL) { mws_warn(log_ctx, "Buffer growth failed (realloc)"); return 1; @@ -581,7 +581,7 @@ inline static int transaction_buffer_init(struct transaction_buffer *to_init, si pthread_mutex_init(&to_init->mutex, NULL); to_init->hdr_buffer.size = size; - to_init->hdr_buffer.data = mw_malloc(size); + to_init->hdr_buffer.data = mallocz(size); if (to_init->hdr_buffer.data == NULL) return 1; @@ -594,7 +594,7 @@ static void transaction_buffer_destroy(struct transaction_buffer *to_init) { buffer_purge(&to_init->hdr_buffer); pthread_mutex_destroy(&to_init->mutex); - mw_free(to_init->hdr_buffer.data); + freez(to_init->hdr_buffer.data); } // Creates transaction @@ -628,7 +628,7 @@ void transaction_buffer_transaction_rollback(struct transaction_buffer *buf, str #define RX_ALIASES_INITIALIZE() c_rhash_new(UINT16_MAX >> 8) struct mqtt_ng_client *mqtt_ng_init(struct mqtt_ng_init *settings) { - struct mqtt_ng_client *client = mw_calloc(1, sizeof(struct mqtt_ng_client)); + struct mqtt_ng_client *client = callocz(1, sizeof(struct mqtt_ng_client)); if (client == NULL) return NULL; @@ -672,7 +672,7 @@ err_free_rx_alias: err_free_trx_buf: transaction_buffer_destroy(&client->main_buffer); err_free_client: - mw_free(client); + freez(client); return NULL; } @@ -688,7 +688,7 @@ static void mqtt_ng_destroy_rx_alias_hash(c_rhash hash) void *to_free; while(!c_rhash_iter_uint64_keys(hash, &i, &stored_key)) { c_rhash_get_ptr_by_uint64(hash, stored_key, &to_free); - mw_free(to_free); + freez(to_free); } c_rhash_destroy(hash); } @@ -700,7 +700,7 @@ static void mqtt_ng_destroy_tx_alias_hash(c_rhash hash) void *to_free; while(!c_rhash_iter_str_keys(hash, &i, &stored_key)) { c_rhash_get_ptr_by_str(hash, stored_key, &to_free); - mw_free(to_free); + freez(to_free); } c_rhash_destroy(hash); } @@ -714,7 +714,7 @@ void mqtt_ng_destroy(struct mqtt_ng_client *client) pthread_rwlock_destroy(&client->tx_topic_aliases.rwlock); mqtt_ng_destroy_rx_alias_hash(client->rx_aliases); - mw_free(client); + freez(client); } int frag_set_external_data(mqtt_wss_log_ctx_t log, struct buffer_fragment *frag, void *data, size_t data_len, free_fnc_t data_free_fnc) @@ -730,7 +730,7 @@ int frag_set_external_data(mqtt_wss_log_ctx_t log, struct buffer_fragment *frag, switch (ptr2memory_mode(data_free_fnc)) { case MEMCPY: - frag->data = mw_malloc(data_len); + frag->data = mallocz(data_len); if (frag->data == NULL) { mws_error(log, UNIT_LOG_PREFIX "OOM while malloc @_optimized_add"); return 1; @@ -1408,12 +1408,12 @@ static void mqtt_properties_parser_ctx_reset(struct mqtt_properties_parser_ctx * struct mqtt_property *f = ctx->head; ctx->head = ctx->head->next; if (f->type == MQTT_TYPE_STR || f->type == MQTT_TYPE_STR_PAIR) - mw_free(f->data.strings[0]); + freez(f->data.strings[0]); if (f->type == MQTT_TYPE_STR_PAIR) - mw_free(f->data.strings[1]); + freez(f->data.strings[1]); if (f->type == MQTT_TYPE_BIN) - mw_free(f->data.bindata); - mw_free(f); + freez(f->data.bindata); + freez(f); } ctx->tail = NULL; ctx->properties_length = 0; @@ -1498,7 +1498,7 @@ static int parse_properties_array(struct mqtt_properties_parser_ctx *ctx, rbuf_t return rc; case PROPERTY_CREATE: BUF_READ_CHECK_AT_LEAST(data, 1); - struct mqtt_property *prop = mw_calloc(1, sizeof(struct mqtt_property)); + struct mqtt_property *prop = callocz(1, sizeof(struct mqtt_property)); if (ctx->head == NULL) { ctx->head = prop; ctx->tail = prop; @@ -1558,7 +1558,7 @@ static int parse_properties_array(struct mqtt_properties_parser_ctx *ctx, rbuf_t break; case PROPERTY_TYPE_STR: BUF_READ_CHECK_AT_LEAST(data, ctx->tail->bindata_len); - ctx->tail->data.strings[ctx->str_idx] = mw_malloc(ctx->tail->bindata_len + 1); + ctx->tail->data.strings[ctx->str_idx] = mallocz(ctx->tail->bindata_len + 1); rbuf_pop(data, ctx->tail->data.strings[ctx->str_idx], ctx->tail->bindata_len); ctx->tail->data.strings[ctx->str_idx][ctx->tail->bindata_len] = 0; ctx->str_idx++; @@ -1571,7 +1571,7 @@ static int parse_properties_array(struct mqtt_properties_parser_ctx *ctx, rbuf_t break; case PROPERTY_TYPE_BIN: BUF_READ_CHECK_AT_LEAST(data, ctx->tail->bindata_len); - ctx->tail->data.bindata = mw_malloc(ctx->tail->bindata_len); + ctx->tail->data.bindata = mallocz(ctx->tail->bindata_len); rbuf_pop(data, ctx->tail->data.bindata, ctx->tail->bindata_len); ctx->bytes_consumed += ctx->tail->bindata_len; ctx->state = PROPERTY_NEXT; @@ -1721,7 +1721,7 @@ static int parse_suback_varhdr(struct mqtt_ng_client *client) return rc; parser->mqtt_parsed_len += parser->properties_parser.bytes_consumed; suback->reason_code_count = parser->mqtt_fixed_hdr_remaining_length - parser->mqtt_parsed_len; - suback->reason_codes = mw_calloc(suback->reason_code_count, sizeof(*suback->reason_codes)); + suback->reason_codes = callocz(suback->reason_code_count, sizeof(*suback->reason_codes)); suback->reason_codes_pending = suback->reason_code_count; parser->varhdr_state = MQTT_PARSE_REASONCODES; /* FALLTHROUGH */ @@ -1760,7 +1760,7 @@ static int parse_publish_varhdr(struct mqtt_ng_client *client) parser->varhdr_state = MQTT_PARSE_VARHDR_POST_TOPICNAME; break; } - publish->topic = mw_calloc(1, publish->topic_len + 1 /* add 0x00 */); + publish->topic = callocz(1, publish->topic_len + 1 /* add 0x00 */); if (publish->topic == NULL) return MQTT_NG_CLIENT_OOM; parser->varhdr_state = MQTT_PARSE_VARHDR_TOPICNAME; @@ -1796,7 +1796,7 @@ static int parse_publish_varhdr(struct mqtt_ng_client *client) /* FALLTHROUGH */ case MQTT_PARSE_PAYLOAD: if (parser->mqtt_fixed_hdr_remaining_length < parser->mqtt_parsed_len) { - mw_free(publish->topic); + freez(publish->topic); publish->topic = NULL; ERROR("Error parsing PUBLISH message"); return MQTT_NG_CLIENT_PROTOCOL_ERROR; @@ -1808,9 +1808,9 @@ static int parse_publish_varhdr(struct mqtt_ng_client *client) } BUF_READ_CHECK_AT_LEAST(parser->received_data, publish->data_len); - publish->data = mw_malloc(publish->data_len); + publish->data = mallocz(publish->data_len); if (publish->data == NULL) { - mw_free(publish->topic); + freez(publish->topic); publish->topic = NULL; return MQTT_NG_CLIENT_OOM; } @@ -1867,7 +1867,7 @@ static int parse_data(struct mqtt_ng_client *client) case MQTT_CPT_SUBACK: rc = parse_suback_varhdr(client); if (rc != MQTT_NG_CLIENT_NEED_MORE_BYTES && rc != MQTT_NG_CLIENT_OK_CALL_AGAIN) { - mw_free(parser->mqtt_packet.suback.reason_codes); + freez(parser->mqtt_packet.suback.reason_codes); } if (rc == MQTT_NG_CLIENT_PARSE_DONE) { parser->state = MQTT_PARSE_MQTT_PACKET_DONE; @@ -2096,8 +2096,8 @@ int handle_incoming_traffic(struct mqtt_ng_client *client) #endif pub = &client->parser.mqtt_packet.publish; if (pub->qos > 1) { - mw_free(pub->topic); - mw_free(pub->data); + freez(pub->topic); + freez(pub->data); return MQTT_NG_CLIENT_NOT_IMPL_YET; } if ( pub->qos == 1 && (rc = mqtt_ng_puback(client, pub->packet_id, 0)) ) { @@ -2127,8 +2127,8 @@ int handle_incoming_traffic(struct mqtt_ng_client *client) // in case we have property topic alias and we have topic we take over the string // and add pointer to it into topic alias list if (prop == NULL) - mw_free(pub->topic); - mw_free(pub->data); + freez(pub->topic); + freez(pub->data); return MQTT_NG_CLIENT_WANT_WRITE; case MQTT_CPT_DISCONNECT: INFO ("Got MQTT DISCONNECT control packet from server. Reason code: %d", (int)client->parser.mqtt_packet.disconnect.reason_code); @@ -2225,7 +2225,7 @@ int mqtt_ng_set_topic_alias(struct mqtt_ng_client *client, const char *topic) return idx; } - alias = mw_malloc(sizeof(struct topic_alias_data)); + alias = mallocz(sizeof(struct topic_alias_data)); idx = ++client->tx_topic_aliases.idx_assigned; alias->idx = idx; __atomic_store_n(&alias->usage_count, 0, __ATOMIC_SEQ_CST); diff --git a/src/aclk/mqtt_websockets/mqtt_wss_client.c b/src/aclk/mqtt_websockets/mqtt_wss_client.c index f5b4025d7..2d231ef44 100644 --- a/src/aclk/mqtt_websockets/mqtt_wss_client.c +++ b/src/aclk/mqtt_websockets/mqtt_wss_client.c @@ -1,5 +1,4 @@ // SPDX-License-Identifier: GPL-3.0-only -// Copyright (C) 2020 Timotej Šiškovič #ifndef _GNU_SOURCE #define _GNU_SOURCE @@ -19,9 +18,6 @@ #include <sys/socket.h> #include <netinet/in.h> -#include <arpa/inet.h> -#include <netinet/tcp.h> //TCP_NODELAY -#include <netdb.h> #include <openssl/err.h> #include <openssl/ssl.h> @@ -107,8 +103,6 @@ struct mqtt_wss_client_struct { int mqtt_keepalive; - pthread_mutex_t pub_lock; - // signifies that we didn't write all MQTT wanted // us to write during last cycle (e.g. due to buffer // size) and thus we should arm POLLOUT @@ -121,7 +115,7 @@ struct mqtt_wss_client_struct { void (*msg_callback)(const char *, const void *, size_t, int); void (*puback_callback)(uint16_t packet_id); - pthread_mutex_t stat_lock; + SPINLOCK stat_lock; struct mqtt_wss_stats stats; #ifdef MQTT_WSS_DEBUG @@ -173,14 +167,13 @@ mqtt_wss_client mqtt_wss_new(const char *log_prefix, SSL_library_init(); SSL_load_error_strings(); - mqtt_wss_client client = mw_calloc(1, sizeof(struct mqtt_wss_client_struct)); + mqtt_wss_client client = callocz(1, sizeof(struct mqtt_wss_client_struct)); if (!client) { mws_error(log, "OOM alocating mqtt_wss_client"); goto fail; } - pthread_mutex_init(&client->pub_lock, NULL); - pthread_mutex_init(&client->stat_lock, NULL); + spinlock_init(&client->stat_lock); client->msg_callback = msg_callback; client->puback_callback = puback_callback; @@ -229,7 +222,7 @@ fail_3: fail_2: ws_client_destroy(client->ws_client); fail_1: - mw_free(client); + freez(client); fail: mqtt_wss_log_ctx_destroy(log); return NULL; @@ -253,12 +246,15 @@ void mqtt_wss_destroy(mqtt_wss_client client) // as it "borrows" this pointer and might use it if (client->target_host == client->host) client->target_host = NULL; + if (client->target_host) - mw_free(client->target_host); + freez(client->target_host); + if (client->host) - mw_free(client->host); - mw_free(client->proxy_passwd); - mw_free(client->proxy_uname); + freez(client->host); + + freez(client->proxy_passwd); + freez(client->proxy_uname); if (client->ssl) SSL_free(client->ssl); @@ -269,11 +265,8 @@ void mqtt_wss_destroy(mqtt_wss_client client) if (client->sockfd > 0) close(client->sockfd); - pthread_mutex_destroy(&client->pub_lock); - pthread_mutex_destroy(&client->stat_lock); - mqtt_wss_log_ctx_destroy(client->log); - mw_free(client); + freez(client); } static int cert_verify_callback(int preverify_ok, X509_STORE_CTX *ctx) @@ -298,7 +291,7 @@ static int cert_verify_callback(int preverify_ok, X509_STORE_CTX *ctx) mws_error(client->log, "verify error:num=%d:%s:depth=%d:%s", err, X509_verify_cert_error_string(err), depth, err_str); - mw_free(err_str); + freez(err_str); } if (!preverify_ok && err == X509_V_ERR_DEPTH_ZERO_SELF_SIGNED_CERT && @@ -362,14 +355,14 @@ static int http_parse_reply(mqtt_wss_client client, rbuf_t buf) } if (http_code != 200) { - ptr = mw_malloc(idx + 1); + ptr = mallocz(idx + 1); if (!ptr) return 6; rbuf_pop(buf, ptr, idx); ptr[idx] = 0; mws_error(client->log, "http_proxy returned error code %d \"%s\"", http_code, ptr); - mw_free(ptr); + freez(ptr); return 7; }/* else rbuf_bump_tail(buf, idx);*/ @@ -450,7 +443,7 @@ static int http_proxy_connect(mqtt_wss_client client) if (client->proxy_uname) { size_t creds_plain_len = strlen(client->proxy_uname) + strlen(client->proxy_passwd) + 2; - char *creds_plain = mw_malloc(creds_plain_len); + char *creds_plain = mallocz(creds_plain_len); if (!creds_plain) { mws_error(client->log, "OOM creds_plain"); rc = 6; @@ -460,9 +453,9 @@ static int http_proxy_connect(mqtt_wss_client client) // OpenSSL encoder puts newline every 64 output bytes // we remove those but during encoding we need that space in the buffer creds_base64_len += (1+(creds_base64_len/64)) * strlen("\n"); - char *creds_base64 = mw_malloc(creds_base64_len + 1); + char *creds_base64 = mallocz(creds_base64_len + 1); if (!creds_base64) { - mw_free(creds_plain); + freez(creds_plain); mws_error(client->log, "OOM creds_base64"); rc = 6; goto cleanup; @@ -475,12 +468,12 @@ static int http_proxy_connect(mqtt_wss_client client) int b64_len; base64_encode_helper((unsigned char*)creds_base64, &b64_len, (unsigned char*)creds_plain, strlen(creds_plain)); - mw_free(creds_plain); + freez(creds_plain); r_buf_ptr = rbuf_get_linear_insert_range(r_buf, &r_buf_linear_insert_capacity); snprintf(r_buf_ptr, r_buf_linear_insert_capacity,"Proxy-Authorization: Basic %s" HTTP_ENDLINE, creds_base64); write(client->sockfd, r_buf_ptr, strlen(r_buf_ptr)); - mw_free(creds_base64); + freez(creds_base64); } write(client->sockfd, HTTP_ENDLINE, strlen(HTTP_ENDLINE)); @@ -523,15 +516,14 @@ cleanup: return rc; } -int mqtt_wss_connect(mqtt_wss_client client, char *host, int port, struct mqtt_connect_params *mqtt_params, int ssl_flags, struct mqtt_wss_proxy *proxy) +int mqtt_wss_connect( + mqtt_wss_client client, + char *host, + int port, + struct mqtt_connect_params *mqtt_params, + int ssl_flags, + struct mqtt_wss_proxy *proxy) { - struct sockaddr_in addr; - memset(&addr, 0, sizeof(addr)); - addr.sin_family = AF_INET; - - struct hostent *he; - struct in_addr **addr_list; - if (!mqtt_params) { mws_error(client->log, "mqtt_params can't be null!"); return -1; @@ -545,23 +537,35 @@ int mqtt_wss_connect(mqtt_wss_client client, char *host, int port, struct mqtt_c if (client->target_host == client->host) client->target_host = NULL; + if (client->target_host) - mw_free(client->target_host); + freez(client->target_host); + if (client->host) - mw_free(client->host); + freez(client->host); + + if (client->proxy_uname) { + freez(client->proxy_uname); + client->proxy_uname = NULL; + } + + if (client->proxy_passwd) { + freez(client->proxy_passwd); + client->proxy_passwd = NULL; + } if (proxy && proxy->type != MQTT_WSS_DIRECT) { - client->host = mw_strdup(proxy->host); + client->host = strdupz(proxy->host); client->port = proxy->port; - client->target_host = mw_strdup(host); + client->target_host = strdupz(host); client->target_port = port; client->proxy_type = proxy->type; if (proxy->username) - client->proxy_uname = mw_strdup(proxy->username); + client->proxy_uname = strdupz(proxy->username); if (proxy->password) - client->proxy_passwd = mw_strdup(proxy->password); + client->proxy_passwd = strdupz(proxy->password); } else { - client->host = mw_strdup(host); + client->host = strdupz(host); client->port = port; client->target_host = client->host; client->target_port = port; @@ -569,30 +573,19 @@ int mqtt_wss_connect(mqtt_wss_client client, char *host, int port, struct mqtt_c client->ssl_flags = ssl_flags; - //TODO gethostbyname -> getaddinfo - // hstrerror -> gai_strerror - if ((he = gethostbyname(client->host)) == NULL) { - mws_error(client->log, "gethostbyname() error \"%s\"", hstrerror(h_errno)); - return -1; - } - - addr_list = (struct in_addr **)he->h_addr_list; - if(!addr_list[0]) { - mws_error(client->log, "No IP addr resolved"); - return -1; - } - mws_debug(client->log, "Resolved IP: %s", inet_ntoa(*addr_list[0])); - addr.sin_addr = *addr_list[0]; - addr.sin_port = htons(client->port); - if (client->sockfd > 0) close(client->sockfd); - client->sockfd = socket(AF_INET, SOCK_STREAM | DEFAULT_SOCKET_FLAGS, 0); - if (client->sockfd < 0) { - mws_error(client->log, "Couldn't create socket()"); - return -1; + + char port_str[16]; + snprintf(port_str, sizeof(port_str) -1, "%d", client->port); + int fd = connect_to_this_ip46(IPPROTO_TCP, SOCK_STREAM, client->host, 0, port_str, NULL); + if (fd < 0) { + mws_error(client->log, "Could not connect to remote endpoint \"%s\", port %d.\n", client->host, port); + return -3; } + client->sockfd = fd; + #ifndef SOCK_CLOEXEC int flags = fcntl(client->sockfd, F_GETFD); if (flags != -1) @@ -600,19 +593,10 @@ int mqtt_wss_connect(mqtt_wss_client client, char *host, int port, struct mqtt_c #endif int flag = 1; - int result = setsockopt(client->sockfd, - IPPROTO_TCP, - TCP_NODELAY, - &flag, - sizeof(int)); + int result = setsockopt(client->sockfd, IPPROTO_TCP, TCP_NODELAY, &flag, sizeof(int)); if (result < 0) mws_error(client->log, "Could not dissable NAGLE"); - if (connect(client->sockfd, (struct sockaddr *)&addr, sizeof(addr)) < 0) { - mws_error(client->log, "Could not connect to remote endpoint \"%s\", port %d.\n", client->host, client->port); - return -3; - } - client->poll_fds[POLLFD_SOCKET].fd = client->sockfd; if (fcntl(client->sockfd, F_SETFL, fcntl(client->sockfd, F_GETFL, 0) | O_NONBLOCK) == -1) { @@ -640,6 +624,7 @@ int mqtt_wss_connect(mqtt_wss_client client, char *host, int port, struct mqtt_c // free SSL structs from possible previous connections if (client->ssl) SSL_free(client->ssl); + if (client->ssl_ctx) SSL_CTX_free(client->ssl_ctx); @@ -675,6 +660,7 @@ int mqtt_wss_connect(mqtt_wss_client client, char *host, int port, struct mqtt_c mws_error(client->log, "SSL could not connect"); return -5; } + if (result == -1) { int ec = SSL_get_error(client->ssl, result); if (ec != SSL_ERROR_WANT_READ && ec != SSL_ERROR_WANT_WRITE) { @@ -693,14 +679,16 @@ int mqtt_wss_connect(mqtt_wss_client client, char *host, int port, struct mqtt_c auth.username_free = NULL; auth.password = (char*)mqtt_params->password; auth.password_free = NULL; + struct mqtt_lwt_properties lwt; lwt.will_topic = (char*)mqtt_params->will_topic; lwt.will_topic_free = NULL; lwt.will_message = (void*)mqtt_params->will_msg; lwt.will_message_free = NULL; // TODO expose no copy version to API lwt.will_message_size = mqtt_params->will_msg_len; - lwt.will_qos = (mqtt_params->will_flags & MQTT_WSS_PUB_QOSMASK); - lwt.will_retain = mqtt_params->will_flags & MQTT_WSS_PUB_RETAIN; + lwt.will_qos = (int) (mqtt_params->will_flags & MQTT_WSS_PUB_QOSMASK); + lwt.will_retain = (int) mqtt_params->will_flags & MQTT_WSS_PUB_RETAIN; + int ret = mqtt_ng_connect(client->mqtt, &auth, mqtt_params->will_msg ? &lwt : NULL, 1, client->mqtt_keepalive); if (ret) { mws_error(client->log, "Error generating MQTT connect"); @@ -955,9 +943,9 @@ int mqtt_wss_service(mqtt_wss_client client, int timeout_ms) #ifdef DEBUG_ULTRA_VERBOSE mws_debug(client->log, "SSL_Read: Read %d.", ret); #endif - pthread_mutex_lock(&client->stat_lock); + spinlock_lock(&client->stat_lock); client->stats.bytes_rx += ret; - pthread_mutex_unlock(&client->stat_lock); + spinlock_unlock(&client->stat_lock); rbuf_bump_head(client->ws_client->buf_read, ret); } else { int errnobkp = errno; @@ -1023,9 +1011,9 @@ int mqtt_wss_service(mqtt_wss_client client, int timeout_ms) #ifdef DEBUG_ULTRA_VERBOSE mws_debug(client->log, "SSL_Write: Written %d of avail %d.", ret, size); #endif - pthread_mutex_lock(&client->stat_lock); + spinlock_lock(&client->stat_lock); client->stats.bytes_tx += ret; - pthread_mutex_unlock(&client->stat_lock); + spinlock_unlock(&client->stat_lock); rbuf_bump_tail(client->ws_client->buf_write, ret); } else { int errnobkp = errno; @@ -1115,10 +1103,10 @@ int mqtt_wss_subscribe(mqtt_wss_client client, char *topic, int max_qos_level) struct mqtt_wss_stats mqtt_wss_get_stats(mqtt_wss_client client) { struct mqtt_wss_stats current; - pthread_mutex_lock(&client->stat_lock); + spinlock_lock(&client->stat_lock); current = client->stats; memset(&client->stats, 0, sizeof(client->stats)); - pthread_mutex_unlock(&client->stat_lock); + spinlock_unlock(&client->stat_lock); mqtt_ng_get_stats(client->mqtt, ¤t.mqtt); return current; } diff --git a/src/aclk/mqtt_websockets/mqtt_wss_log.c b/src/aclk/mqtt_websockets/mqtt_wss_log.c index 5e606c12b..e5da76fcf 100644 --- a/src/aclk/mqtt_websockets/mqtt_wss_log.c +++ b/src/aclk/mqtt_websockets/mqtt_wss_log.c @@ -25,13 +25,13 @@ struct mqtt_wss_log_ctx { #endif mqtt_wss_log_ctx_t mqtt_wss_log_ctx_create(const char *ctx_prefix, mqtt_wss_log_callback_t log_callback) { - mqtt_wss_log_ctx_t ctx = mw_calloc(1, sizeof(struct mqtt_wss_log_ctx)); + mqtt_wss_log_ctx_t ctx = callocz(1, sizeof(struct mqtt_wss_log_ctx)); if(!ctx) return NULL; if(log_callback) { ctx->extern_log_fnc = log_callback; - ctx->buffer = mw_calloc(1, LOG_BUFFER_SIZE); + ctx->buffer = callocz(1, LOG_BUFFER_SIZE); if(!ctx->buffer) goto cleanup; @@ -60,15 +60,15 @@ mqtt_wss_log_ctx_t mqtt_wss_log_ctx_create(const char *ctx_prefix, mqtt_wss_log_ return ctx; cleanup: - mw_free(ctx); + freez(ctx); return NULL; } void mqtt_wss_log_ctx_destroy(mqtt_wss_log_ctx_t ctx) { - mw_free(ctx->ctx_prefix); - mw_free(ctx->buffer); - mw_free(ctx); + freez(ctx->ctx_prefix); + freez(ctx->buffer); + freez(ctx); } static inline char severity_to_c(int severity) diff --git a/src/aclk/mqtt_websockets/ws_client.c b/src/aclk/mqtt_websockets/ws_client.c index 240e889ca..a6b9b23f3 100644 --- a/src/aclk/mqtt_websockets/ws_client.c +++ b/src/aclk/mqtt_websockets/ws_client.c @@ -53,7 +53,7 @@ ws_client *ws_client_new(size_t buf_size, char **host, mqtt_wss_log_ctx_t log) if(!host) return NULL; - client = mw_calloc(1, sizeof(ws_client)); + client = callocz(1, sizeof(ws_client)); if (!client) return NULL; @@ -87,7 +87,7 @@ cleanup_2: cleanup_1: rbuf_free(client->buf_read); cleanup: - mw_free(client); + freez(client); return NULL; } @@ -99,7 +99,7 @@ void ws_client_free_headers(ws_client *client) while (ptr) { tmp = ptr; ptr = ptr->next; - mw_free(tmp); + freez(tmp); } client->hs.headers = NULL; @@ -110,25 +110,28 @@ void ws_client_free_headers(ws_client *client) void ws_client_destroy(ws_client *client) { ws_client_free_headers(client); - mw_free(client->hs.nonce_reply); - mw_free(client->hs.http_reply_msg); + freez(client->hs.nonce_reply); + freez(client->hs.http_reply_msg); close(client->entropy_fd); rbuf_free(client->buf_read); rbuf_free(client->buf_write); rbuf_free(client->buf_to_mqtt); - mw_free(client); + freez(client); } void ws_client_reset(ws_client *client) { ws_client_free_headers(client); - mw_free(client->hs.nonce_reply); + freez(client->hs.nonce_reply); client->hs.nonce_reply = NULL; - mw_free(client->hs.http_reply_msg); + + freez(client->hs.http_reply_msg); client->hs.http_reply_msg = NULL; + rbuf_flush(client->buf_read); rbuf_flush(client->buf_write); rbuf_flush(client->buf_to_mqtt); + client->state = WS_RAW; client->hs.hdr_state = WS_HDR_HTTP; client->rx.parse_state = WS_FIRST_2BYTES; @@ -158,31 +161,11 @@ int ws_client_want_write(ws_client *client) return rbuf_bytes_available(client->buf_write); } -#define RAND_SRC "/dev/urandom" -static int ws_client_get_nonce(ws_client *client, char *dest, unsigned int size) -{ - // we do not need crypto secure random here - // it's just used for protocol negotiation - int rd; - int f = open(RAND_SRC, O_RDONLY | O_CLOEXEC); - if (f < 0) { - ERROR("Error opening \"%s\". Err: \"%s\"", RAND_SRC, strerror(errno)); - return -2; - } - - if ((rd = read(f, dest, size)) > 0) { - close(f); - return rd; - } - close(f); - return -1; -} - #define WEBSOCKET_NONCE_SIZE 16 #define TEMP_BUF_SIZE 4096 int ws_client_start_handshake(ws_client *client) { - char nonce[WEBSOCKET_NONCE_SIZE]; + nd_uuid_t nonce; char nonce_b64[256]; char second[TEMP_BUF_SIZE]; unsigned int md_len; @@ -190,16 +173,15 @@ int ws_client_start_handshake(ws_client *client) EVP_MD_CTX *md_ctx; const EVP_MD *md; - if(!*client->host) { + if(!client->host || !*client->host) { ERROR("Hostname has not been set. We should not be able to come here!"); return 1; } - ws_client_get_nonce(client, nonce, WEBSOCKET_NONCE_SIZE); + uuid_generate_random(nonce); EVP_EncodeBlock((unsigned char *)nonce_b64, (const unsigned char *)nonce, WEBSOCKET_NONCE_SIZE); - snprintf(second, TEMP_BUF_SIZE, websocket_upgrage_hdr, - *client->host, - nonce_b64); + snprintf(second, TEMP_BUF_SIZE, websocket_upgrage_hdr, *client->host, nonce_b64); + if(rbuf_bytes_free(client->buf_write) < strlen(second)) { ERROR("Write buffer capacity too low."); return 1; @@ -236,10 +218,10 @@ int ws_client_start_handshake(ws_client *client) EVP_DigestUpdate(md_ctx, second, strlen(second)); EVP_DigestFinal_ex(md_ctx, digest, &md_len); - EVP_EncodeBlock((unsigned char *)nonce_b64, digest, md_len); + EVP_EncodeBlock((unsigned char *)nonce_b64, digest, (int) md_len); - mw_free(client->hs.nonce_reply); - client->hs.nonce_reply = mw_strdup(nonce_b64); + freez(client->hs.nonce_reply); + client->hs.nonce_reply = strdupz(nonce_b64); OPENSSL_free(digest); @@ -263,7 +245,7 @@ int ws_client_start_handshake(ws_client *client) if (rbuf_bytes_available(client->buf_read) < x) \ return WS_CLIENT_NEED_MORE_BYTES; -#define MAX_HTTP_LINE_LENGTH 1024*4 +#define MAX_HTTP_LINE_LENGTH (1024 * 4) #define HTTP_SC_LENGTH 4 // "XXX " http status code as C string #define WS_CLIENT_HTTP_HDR "HTTP/1.1 " #define WS_CONN_ACCEPT "sec-websocket-accept" @@ -278,11 +260,11 @@ int ws_client_start_handshake(ws_client *client) #error "Buffer too small" #endif -#define HTTP_HDR_LINE_CHECK_LIMIT(x) if ((x) >= MAX_HTTP_LINE_LENGTH) \ -{ \ - ERROR("HTTP line received is too long. Maximum is %d", MAX_HTTP_LINE_LENGTH); \ - return WS_CLIENT_PROTOCOL_ERROR; \ -} +#define HTTP_HDR_LINE_CHECK_LIMIT(x) \ + if ((x) >= MAX_HTTP_LINE_LENGTH) { \ + ERROR("HTTP line received is too long. Maximum is %d", MAX_HTTP_LINE_LENGTH); \ + return WS_CLIENT_PROTOCOL_ERROR; \ + } int ws_client_parse_handshake_resp(ws_client *client) { @@ -290,6 +272,7 @@ int ws_client_parse_handshake_resp(ws_client *client) int idx_crlf, idx_sep; char *ptr; size_t bytes; + switch (client->hs.hdr_state) { case WS_HDR_HTTP: BUF_READ_CHECK_AT_LEAST(strlen(WS_CLIENT_HTTP_HDR)) @@ -297,6 +280,7 @@ int ws_client_parse_handshake_resp(ws_client *client) rbuf_bump_tail(client->buf_read, strlen(WS_CLIENT_HTTP_HDR)); client->hs.hdr_state = WS_HDR_RC; break; + case WS_HDR_RC: BUF_READ_CHECK_AT_LEAST(HTTP_SC_LENGTH); // "XXX " http return code rbuf_pop(client->buf_read, buf, HTTP_SC_LENGTH); @@ -312,6 +296,7 @@ int ws_client_parse_handshake_resp(ws_client *client) } client->hs.hdr_state = WS_HDR_ENDLINE; break; + case WS_HDR_ENDLINE: ptr = rbuf_find_bytes(client->buf_read, WS_HTTP_NEWLINE, strlen(WS_HTTP_NEWLINE), &idx_crlf); if (!ptr) { @@ -321,12 +306,13 @@ int ws_client_parse_handshake_resp(ws_client *client) } HTTP_HDR_LINE_CHECK_LIMIT(idx_crlf); - client->hs.http_reply_msg = mw_malloc(idx_crlf+1); + client->hs.http_reply_msg = mallocz(idx_crlf+1); rbuf_pop(client->buf_read, client->hs.http_reply_msg, idx_crlf); client->hs.http_reply_msg[idx_crlf] = 0; rbuf_bump_tail(client->buf_read, strlen(WS_HTTP_NEWLINE)); client->hs.hdr_state = WS_HDR_PARSE_HEADERS; break; + case WS_HDR_PARSE_HEADERS: ptr = rbuf_find_bytes(client->buf_read, WS_HTTP_NEWLINE, strlen(WS_HTTP_NEWLINE), &idx_crlf); if (!ptr) { @@ -357,7 +343,7 @@ int ws_client_parse_handshake_resp(ws_client *client) return WS_CLIENT_PROTOCOL_ERROR; } - struct http_header *hdr = mw_calloc(1, sizeof(struct http_header) + idx_crlf); //idx_crlf includes ": " that will be used as 2 \0 bytes + struct http_header *hdr = callocz(1, sizeof(struct http_header) + idx_crlf); //idx_crlf includes ": " that will be used as 2 \0 bytes hdr->key = ((char*)hdr) + sizeof(struct http_header); hdr->value = hdr->key + idx_sep + 1; @@ -384,6 +370,7 @@ int ws_client_parse_handshake_resp(ws_client *client) } break; + case WS_HDR_PARSE_DONE: if (!client->hs.nonce_matched) { ERROR("Missing " WS_CONN_ACCEPT " header"); @@ -398,6 +385,7 @@ int ws_client_parse_handshake_resp(ws_client *client) client->hs.hdr_state = WS_HDR_ALL_DONE; INFO("Websocket Connection Accepted By Server"); return WS_CLIENT_PARSING_DONE; + case WS_HDR_ALL_DONE: FATAL("This is error we should never come here!"); return WS_CLIENT_PROTOCOL_ERROR; @@ -642,7 +630,7 @@ int ws_client_process_rx_ws(ws_client *client) break; case WS_PAYLOAD_CONNECTION_CLOSE_MSG: if (!client->rx.specific_data.op_close.reason) - client->rx.specific_data.op_close.reason = mw_malloc(client->rx.payload_length + 1); + client->rx.specific_data.op_close.reason = mallocz(client->rx.payload_length + 1); while (client->rx.payload_processed < client->rx.payload_length) { if (!rbuf_bytes_available(client->buf_read)) @@ -655,7 +643,7 @@ int ws_client_process_rx_ws(ws_client *client) INFO("WebSocket server closed the connection with EC=%d and reason \"%s\"", client->rx.specific_data.op_close.ec, client->rx.specific_data.op_close.reason); - mw_free(client->rx.specific_data.op_close.reason); + freez(client->rx.specific_data.op_close.reason); client->rx.specific_data.op_close.reason = NULL; client->rx.parse_state = WS_PACKET_DONE; break; @@ -672,7 +660,7 @@ int ws_client_process_rx_ws(ws_client *client) return WS_CLIENT_INTERNAL_ERROR; } BUF_READ_CHECK_AT_LEAST(client->rx.payload_length); - client->rx.specific_data.ping_msg = mw_malloc(client->rx.payload_length); + client->rx.specific_data.ping_msg = mallocz(client->rx.payload_length); rbuf_pop(client->buf_read, client->rx.specific_data.ping_msg, client->rx.payload_length); // TODO schedule this instead of sending right away // then attempt to send as soon as buffer space clears up diff --git a/src/aclk/schema-wrappers/alarm_stream.cc b/src/aclk/schema-wrappers/alarm_stream.cc index 29d80e39e..c0b41bb06 100644 --- a/src/aclk/schema-wrappers/alarm_stream.cc +++ b/src/aclk/schema-wrappers/alarm_stream.cc @@ -22,6 +22,7 @@ struct start_alarm_streaming parse_start_alarm_streaming(const char *data, size_ ret.node_id = strdupz(msg.node_id().c_str()); ret.resets = msg.resets(); + ret.version = msg.version(); return ret; } @@ -37,6 +38,7 @@ struct send_alarm_checkpoint parse_send_alarm_checkpoint(const char *data, size_ ret.node_id = strdupz(msg.node_id().c_str()); ret.claim_id = strdupz(msg.claim_id().c_str()); + ret.version = msg.version(); return ret; } @@ -118,6 +120,7 @@ static void fill_alarm_log_entry(struct alarm_log_entry *data, AlarmLogEntry *pr proto->set_transition_id(data->transition_id); proto->set_chart_name(data->chart_name); proto->set_summary(data->summary); + proto->set_alert_version(data->version); } char *generate_alarm_log_entry(size_t *len, struct alarm_log_entry *data) diff --git a/src/aclk/schema-wrappers/alarm_stream.h b/src/aclk/schema-wrappers/alarm_stream.h index 3c81ff445..6e1936b07 100644 --- a/src/aclk/schema-wrappers/alarm_stream.h +++ b/src/aclk/schema-wrappers/alarm_stream.h @@ -13,6 +13,7 @@ extern "C" { struct start_alarm_streaming { char *node_id; + uint64_t version; bool resets; }; @@ -36,8 +37,6 @@ struct alarm_log_entry { char *name; char *family; - uint64_t batch_id; - uint64_t sequence_id; uint64_t when; char *config_hash; @@ -76,13 +75,22 @@ struct alarm_log_entry { char *chart_name; uint64_t event_id; + uint64_t version; char *transition_id; char *summary; + + // local book keeping + int64_t health_log_id; + int64_t alarm_id; + int64_t unique_id; + int64_t sequence_id; }; struct send_alarm_checkpoint { char *node_id; char *claim_id; + uint64_t version; + uint64_t when_end; }; struct alarm_checkpoint { diff --git a/src/claim/claim.c b/src/claim/claim.c index 5f4ec9a43..5383aac37 100644 --- a/src/claim/claim.c +++ b/src/claim/claim.c @@ -53,11 +53,8 @@ CLAIM_AGENT_RESPONSE claim_agent(const char *claiming_arguments, bool force, con } #ifndef DISABLE_CLOUD - int exit_code; - pid_t command_pid; char command_exec_buffer[CLAIMING_COMMAND_LENGTH + 1]; char command_line_buffer[CLAIMING_COMMAND_LENGTH + 1]; - FILE *fp_child_output, *fp_child_input; // This is guaranteed to be set early in main via post_conf_load() char *cloud_base_url = appconfig_get(&cloud_config, CONFIG_SECTION_GLOBAL, "cloud base url", NULL); @@ -92,17 +89,17 @@ CLAIM_AGENT_RESPONSE claim_agent(const char *claiming_arguments, bool force, con claiming_arguments); netdata_log_info("Executing agent claiming command: %s", command_exec_buffer); - fp_child_output = netdata_popen(command_line_buffer, &command_pid, &fp_child_input); - if(!fp_child_output) { + POPEN_INSTANCE *instance = spawn_popen_run(command_line_buffer); + if(!instance) { netdata_log_error("Cannot popen(\"%s\").", command_exec_buffer); return CLAIM_AGENT_CANNOT_EXECUTE_CLAIM_SCRIPT; } netdata_log_info("Waiting for claiming command '%s' to finish.", command_exec_buffer); char read_buffer[100 + 1]; - while (fgets(read_buffer, 100, fp_child_output) != NULL) ; + while (fgets(read_buffer, 100, instance->child_stdout_fp) != NULL) ; - exit_code = netdata_pclose(fp_child_input, fp_child_output, command_pid); + int exit_code = spawn_popen_wait(instance); netdata_log_info("Agent claiming command '%s' returned with code %d", command_exec_buffer, exit_code); if (0 == exit_code) { @@ -113,7 +110,7 @@ CLAIM_AGENT_RESPONSE claim_agent(const char *claiming_arguments, bool force, con netdata_log_error("Agent claiming command '%s' failed to complete its run", command_exec_buffer); return CLAIM_AGENT_CLAIM_SCRIPT_FAILED; } - errno = 0; + errno_clear(); unsigned maximum_known_exit_code = sizeof(claiming_errors) / sizeof(claiming_errors[0]) - 1; if ((unsigned)exit_code > maximum_known_exit_code) { @@ -121,10 +118,8 @@ CLAIM_AGENT_RESPONSE claim_agent(const char *claiming_arguments, bool force, con return CLAIM_AGENT_CLAIM_SCRIPT_RETURNED_INVALID_CODE; } - netdata_log_error("Agent failed to be claimed using the command '%s' with the following error message:", - command_exec_buffer); - - netdata_log_error("\"%s\"", claiming_errors[exit_code]); + netdata_log_error("Agent failed to be claimed using the command '%s' with the following error message: %s", + command_exec_buffer, claiming_errors[exit_code]); if(msg) *msg = claiming_errors[exit_code]; @@ -214,7 +209,7 @@ void load_cloud_conf(int silent) netdata_cloud_enabled = CONFIG_BOOLEAN_NO; char *filename; - errno = 0; + errno_clear(); int ret = 0; diff --git a/src/collectors/COLLECTORS.md b/src/collectors/COLLECTORS.md index ebd7b2a9a..608649a38 100644 --- a/src/collectors/COLLECTORS.md +++ b/src/collectors/COLLECTORS.md @@ -13,7 +13,7 @@ Learn more about [how collectors work](/src/collectors/README.md), and then lear If you don't see the app/service you'd like to monitor in this list: -- If your application has a Prometheus endpoint, Netdata can monitor it! Look at our [generic Prometheus collector](/src/go/collectors/go.d.plugin/modules/prometheus/README.md). +- If your application has a Prometheus endpoint, Netdata can monitor it! Look at our [generic Prometheus collector](/src/go/plugin/go.d/modules/prometheus/README.md). - If your application is instrumented to expose [StatsD](https://blog.netdata.cloud/introduction-to-statsd/) metrics, see our [generic StatsD collector](/src/collectors/statsd.plugin/README.md). @@ -23,297 +23,297 @@ If you don't see the app/service you'd like to monitor in this list: - If you don't see the collector there, you can make a [feature request](https://github.com/netdata/netdata/issues/new/choose) on GitHub. -- If you have basic software development skills, you can add your own plugin in [Go](/src/go/collectors/go.d.plugin/README.md#how-to-develop-a-collector) or [Python](/docs/developer-and-contributor-corner/python-collector.md) +- If you have basic software development skills, you can add your own plugin in [Go](/src/go/plugin/go.d/README.md#how-to-develop-a-collector) or [Python](/docs/developer-and-contributor-corner/python-collector.md) ## Available Data Collection Integrations <!-- AUTOGENERATED PART BY integrations/gen_doc_collector_page.py SCRIPT, DO NOT EDIT MANUALLY --> ### APM -- [Alamos FE2 server](https://github.com/netdata/netdata/blob/master/src/go/collectors/go.d.plugin/modules/prometheus/integrations/alamos_fe2_server.md) +- [Alamos FE2 server](https://github.com/netdata/netdata/blob/master/src/go/plugin/go.d/modules/prometheus/integrations/alamos_fe2_server.md) -- [Apache Airflow](https://github.com/netdata/netdata/blob/master/src/go/collectors/go.d.plugin/modules/prometheus/integrations/apache_airflow.md) +- [Apache Airflow](https://github.com/netdata/netdata/blob/master/src/go/plugin/go.d/modules/prometheus/integrations/apache_airflow.md) -- [Apache Flink](https://github.com/netdata/netdata/blob/master/src/go/collectors/go.d.plugin/modules/prometheus/integrations/apache_flink.md) +- [Apache Flink](https://github.com/netdata/netdata/blob/master/src/go/plugin/go.d/modules/prometheus/integrations/apache_flink.md) -- [Audisto](https://github.com/netdata/netdata/blob/master/src/go/collectors/go.d.plugin/modules/prometheus/integrations/audisto.md) +- [Audisto](https://github.com/netdata/netdata/blob/master/src/go/plugin/go.d/modules/prometheus/integrations/audisto.md) -- [Dependency-Track](https://github.com/netdata/netdata/blob/master/src/go/collectors/go.d.plugin/modules/prometheus/integrations/dependency-track.md) +- [Dependency-Track](https://github.com/netdata/netdata/blob/master/src/go/plugin/go.d/modules/prometheus/integrations/dependency-track.md) - [Go applications (EXPVAR)](https://github.com/netdata/netdata/blob/master/src/collectors/python.d.plugin/go_expvar/integrations/go_applications_expvar.md) -- [Google Pagespeed](https://github.com/netdata/netdata/blob/master/src/go/collectors/go.d.plugin/modules/prometheus/integrations/google_pagespeed.md) +- [Google Pagespeed](https://github.com/netdata/netdata/blob/master/src/go/plugin/go.d/modules/prometheus/integrations/google_pagespeed.md) -- [IBM AIX systems Njmon](https://github.com/netdata/netdata/blob/master/src/go/collectors/go.d.plugin/modules/prometheus/integrations/ibm_aix_systems_njmon.md) +- [IBM AIX systems Njmon](https://github.com/netdata/netdata/blob/master/src/go/plugin/go.d/modules/prometheus/integrations/ibm_aix_systems_njmon.md) -- [JMX](https://github.com/netdata/netdata/blob/master/src/go/collectors/go.d.plugin/modules/prometheus/integrations/jmx.md) +- [JMX](https://github.com/netdata/netdata/blob/master/src/go/plugin/go.d/modules/prometheus/integrations/jmx.md) -- [NRPE daemon](https://github.com/netdata/netdata/blob/master/src/go/collectors/go.d.plugin/modules/prometheus/integrations/nrpe_daemon.md) +- [NRPE daemon](https://github.com/netdata/netdata/blob/master/src/go/plugin/go.d/modules/prometheus/integrations/nrpe_daemon.md) -- [Sentry](https://github.com/netdata/netdata/blob/master/src/go/collectors/go.d.plugin/modules/prometheus/integrations/sentry.md) +- [Sentry](https://github.com/netdata/netdata/blob/master/src/go/plugin/go.d/modules/prometheus/integrations/sentry.md) -- [Sysload](https://github.com/netdata/netdata/blob/master/src/go/collectors/go.d.plugin/modules/prometheus/integrations/sysload.md) +- [Sysload](https://github.com/netdata/netdata/blob/master/src/go/plugin/go.d/modules/prometheus/integrations/sysload.md) -- [VSCode](https://github.com/netdata/netdata/blob/master/src/go/collectors/go.d.plugin/modules/prometheus/integrations/vscode.md) +- [VSCode](https://github.com/netdata/netdata/blob/master/src/go/plugin/go.d/modules/prometheus/integrations/vscode.md) -- [YOURLS URL Shortener](https://github.com/netdata/netdata/blob/master/src/go/collectors/go.d.plugin/modules/prometheus/integrations/yourls_url_shortener.md) +- [YOURLS URL Shortener](https://github.com/netdata/netdata/blob/master/src/go/plugin/go.d/modules/prometheus/integrations/yourls_url_shortener.md) -- [bpftrace variables](https://github.com/netdata/netdata/blob/master/src/go/collectors/go.d.plugin/modules/prometheus/integrations/bpftrace_variables.md) +- [bpftrace variables](https://github.com/netdata/netdata/blob/master/src/go/plugin/go.d/modules/prometheus/integrations/bpftrace_variables.md) -- [gpsd](https://github.com/netdata/netdata/blob/master/src/go/collectors/go.d.plugin/modules/prometheus/integrations/gpsd.md) +- [gpsd](https://github.com/netdata/netdata/blob/master/src/go/plugin/go.d/modules/prometheus/integrations/gpsd.md) -- [jolokia](https://github.com/netdata/netdata/blob/master/src/go/collectors/go.d.plugin/modules/prometheus/integrations/jolokia.md) +- [jolokia](https://github.com/netdata/netdata/blob/master/src/go/plugin/go.d/modules/prometheus/integrations/jolokia.md) -- [phpDaemon](https://github.com/netdata/netdata/blob/master/src/go/collectors/go.d.plugin/modules/phpdaemon/integrations/phpdaemon.md) +- [phpDaemon](https://github.com/netdata/netdata/blob/master/src/go/plugin/go.d/modules/phpdaemon/integrations/phpdaemon.md) ### Authentication and Authorization -- [Fail2ban](https://github.com/netdata/netdata/blob/master/src/go/collectors/go.d.plugin/modules/fail2ban/integrations/fail2ban.md) +- [Fail2ban](https://github.com/netdata/netdata/blob/master/src/go/plugin/go.d/modules/fail2ban/integrations/fail2ban.md) -- [FreeRADIUS](https://github.com/netdata/netdata/blob/master/src/go/collectors/go.d.plugin/modules/freeradius/integrations/freeradius.md) +- [FreeRADIUS](https://github.com/netdata/netdata/blob/master/src/go/plugin/go.d/modules/freeradius/integrations/freeradius.md) -- [HashiCorp Vault secrets](https://github.com/netdata/netdata/blob/master/src/go/collectors/go.d.plugin/modules/prometheus/integrations/hashicorp_vault_secrets.md) +- [HashiCorp Vault secrets](https://github.com/netdata/netdata/blob/master/src/go/plugin/go.d/modules/prometheus/integrations/hashicorp_vault_secrets.md) -- [LDAP](https://github.com/netdata/netdata/blob/master/src/go/collectors/go.d.plugin/modules/prometheus/integrations/ldap.md) +- [LDAP](https://github.com/netdata/netdata/blob/master/src/go/plugin/go.d/modules/prometheus/integrations/ldap.md) -- [OpenLDAP (community)](https://github.com/netdata/netdata/blob/master/src/go/collectors/go.d.plugin/modules/prometheus/integrations/openldap_community.md) +- [OpenLDAP (community)](https://github.com/netdata/netdata/blob/master/src/go/plugin/go.d/modules/prometheus/integrations/openldap_community.md) - [OpenLDAP](https://github.com/netdata/netdata/blob/master/src/collectors/python.d.plugin/openldap/integrations/openldap.md) -- [RADIUS](https://github.com/netdata/netdata/blob/master/src/go/collectors/go.d.plugin/modules/prometheus/integrations/radius.md) +- [RADIUS](https://github.com/netdata/netdata/blob/master/src/go/plugin/go.d/modules/prometheus/integrations/radius.md) -- [SSH](https://github.com/netdata/netdata/blob/master/src/go/collectors/go.d.plugin/modules/prometheus/integrations/ssh.md) +- [SSH](https://github.com/netdata/netdata/blob/master/src/go/plugin/go.d/modules/prometheus/integrations/ssh.md) -- [TACACS](https://github.com/netdata/netdata/blob/master/src/go/collectors/go.d.plugin/modules/prometheus/integrations/tacacs.md) +- [TACACS](https://github.com/netdata/netdata/blob/master/src/go/plugin/go.d/modules/prometheus/integrations/tacacs.md) ### Blockchain Servers -- [Chia](https://github.com/netdata/netdata/blob/master/src/go/collectors/go.d.plugin/modules/prometheus/integrations/chia.md) +- [Chia](https://github.com/netdata/netdata/blob/master/src/go/plugin/go.d/modules/prometheus/integrations/chia.md) -- [Crypto exchanges](https://github.com/netdata/netdata/blob/master/src/go/collectors/go.d.plugin/modules/prometheus/integrations/crypto_exchanges.md) +- [Crypto exchanges](https://github.com/netdata/netdata/blob/master/src/go/plugin/go.d/modules/prometheus/integrations/crypto_exchanges.md) -- [Cryptowatch](https://github.com/netdata/netdata/blob/master/src/go/collectors/go.d.plugin/modules/prometheus/integrations/cryptowatch.md) +- [Cryptowatch](https://github.com/netdata/netdata/blob/master/src/go/plugin/go.d/modules/prometheus/integrations/cryptowatch.md) -- [Go-ethereum](https://github.com/netdata/netdata/blob/master/src/go/collectors/go.d.plugin/modules/geth/integrations/go-ethereum.md) +- [Go-ethereum](https://github.com/netdata/netdata/blob/master/src/go/plugin/go.d/modules/geth/integrations/go-ethereum.md) -- [Helium miner (validator)](https://github.com/netdata/netdata/blob/master/src/go/collectors/go.d.plugin/modules/prometheus/integrations/helium_miner_validator.md) +- [Helium miner (validator)](https://github.com/netdata/netdata/blob/master/src/go/plugin/go.d/modules/prometheus/integrations/helium_miner_validator.md) -- [IOTA full node](https://github.com/netdata/netdata/blob/master/src/go/collectors/go.d.plugin/modules/prometheus/integrations/iota_full_node.md) +- [IOTA full node](https://github.com/netdata/netdata/blob/master/src/go/plugin/go.d/modules/prometheus/integrations/iota_full_node.md) -- [Sia](https://github.com/netdata/netdata/blob/master/src/go/collectors/go.d.plugin/modules/prometheus/integrations/sia.md) +- [Sia](https://github.com/netdata/netdata/blob/master/src/go/plugin/go.d/modules/prometheus/integrations/sia.md) ### CICD Platforms -- [Concourse](https://github.com/netdata/netdata/blob/master/src/go/collectors/go.d.plugin/modules/prometheus/integrations/concourse.md) +- [Concourse](https://github.com/netdata/netdata/blob/master/src/go/plugin/go.d/modules/prometheus/integrations/concourse.md) -- [GitLab Runner](https://github.com/netdata/netdata/blob/master/src/go/collectors/go.d.plugin/modules/prometheus/integrations/gitlab_runner.md) +- [GitLab Runner](https://github.com/netdata/netdata/blob/master/src/go/plugin/go.d/modules/prometheus/integrations/gitlab_runner.md) -- [Jenkins](https://github.com/netdata/netdata/blob/master/src/go/collectors/go.d.plugin/modules/prometheus/integrations/jenkins.md) +- [Jenkins](https://github.com/netdata/netdata/blob/master/src/go/plugin/go.d/modules/prometheus/integrations/jenkins.md) -- [Puppet](https://github.com/netdata/netdata/blob/master/src/collectors/python.d.plugin/puppet/integrations/puppet.md) +- [Puppet](https://github.com/netdata/netdata/blob/master/src/go/plugin/go.d/modules/puppet/integrations/puppet.md) ### Cloud Provider Managed -- [AWS EC2 Compute instances](https://github.com/netdata/netdata/blob/master/src/go/collectors/go.d.plugin/modules/prometheus/integrations/aws_ec2_compute_instances.md) +- [AWS EC2 Compute instances](https://github.com/netdata/netdata/blob/master/src/go/plugin/go.d/modules/prometheus/integrations/aws_ec2_compute_instances.md) -- [AWS EC2 Spot Instance](https://github.com/netdata/netdata/blob/master/src/go/collectors/go.d.plugin/modules/prometheus/integrations/aws_ec2_spot_instance.md) +- [AWS EC2 Spot Instance](https://github.com/netdata/netdata/blob/master/src/go/plugin/go.d/modules/prometheus/integrations/aws_ec2_spot_instance.md) -- [AWS ECS](https://github.com/netdata/netdata/blob/master/src/go/collectors/go.d.plugin/modules/prometheus/integrations/aws_ecs.md) +- [AWS ECS](https://github.com/netdata/netdata/blob/master/src/go/plugin/go.d/modules/prometheus/integrations/aws_ecs.md) -- [AWS Health events](https://github.com/netdata/netdata/blob/master/src/go/collectors/go.d.plugin/modules/prometheus/integrations/aws_health_events.md) +- [AWS Health events](https://github.com/netdata/netdata/blob/master/src/go/plugin/go.d/modules/prometheus/integrations/aws_health_events.md) -- [AWS Quota](https://github.com/netdata/netdata/blob/master/src/go/collectors/go.d.plugin/modules/prometheus/integrations/aws_quota.md) +- [AWS Quota](https://github.com/netdata/netdata/blob/master/src/go/plugin/go.d/modules/prometheus/integrations/aws_quota.md) -- [AWS S3 buckets](https://github.com/netdata/netdata/blob/master/src/go/collectors/go.d.plugin/modules/prometheus/integrations/aws_s3_buckets.md) +- [AWS S3 buckets](https://github.com/netdata/netdata/blob/master/src/go/plugin/go.d/modules/prometheus/integrations/aws_s3_buckets.md) -- [AWS SQS](https://github.com/netdata/netdata/blob/master/src/go/collectors/go.d.plugin/modules/prometheus/integrations/aws_sqs.md) +- [AWS SQS](https://github.com/netdata/netdata/blob/master/src/go/plugin/go.d/modules/prometheus/integrations/aws_sqs.md) -- [AWS instance health](https://github.com/netdata/netdata/blob/master/src/go/collectors/go.d.plugin/modules/prometheus/integrations/aws_instance_health.md) +- [AWS instance health](https://github.com/netdata/netdata/blob/master/src/go/plugin/go.d/modules/prometheus/integrations/aws_instance_health.md) -- [Akamai Global Traffic Management](https://github.com/netdata/netdata/blob/master/src/go/collectors/go.d.plugin/modules/prometheus/integrations/akamai_global_traffic_management.md) +- [Akamai Global Traffic Management](https://github.com/netdata/netdata/blob/master/src/go/plugin/go.d/modules/prometheus/integrations/akamai_global_traffic_management.md) -- [Akami Cloudmonitor](https://github.com/netdata/netdata/blob/master/src/go/collectors/go.d.plugin/modules/prometheus/integrations/akami_cloudmonitor.md) +- [Akami Cloudmonitor](https://github.com/netdata/netdata/blob/master/src/go/plugin/go.d/modules/prometheus/integrations/akami_cloudmonitor.md) -- [Alibaba Cloud](https://github.com/netdata/netdata/blob/master/src/go/collectors/go.d.plugin/modules/prometheus/integrations/alibaba_cloud.md) +- [Alibaba Cloud](https://github.com/netdata/netdata/blob/master/src/go/plugin/go.d/modules/prometheus/integrations/alibaba_cloud.md) -- [ArvanCloud CDN](https://github.com/netdata/netdata/blob/master/src/go/collectors/go.d.plugin/modules/prometheus/integrations/arvancloud_cdn.md) +- [ArvanCloud CDN](https://github.com/netdata/netdata/blob/master/src/go/plugin/go.d/modules/prometheus/integrations/arvancloud_cdn.md) -- [Azure AD App passwords](https://github.com/netdata/netdata/blob/master/src/go/collectors/go.d.plugin/modules/prometheus/integrations/azure_ad_app_passwords.md) +- [Azure AD App passwords](https://github.com/netdata/netdata/blob/master/src/go/plugin/go.d/modules/prometheus/integrations/azure_ad_app_passwords.md) -- [Azure Elastic Pool SQL](https://github.com/netdata/netdata/blob/master/src/go/collectors/go.d.plugin/modules/prometheus/integrations/azure_elastic_pool_sql.md) +- [Azure Elastic Pool SQL](https://github.com/netdata/netdata/blob/master/src/go/plugin/go.d/modules/prometheus/integrations/azure_elastic_pool_sql.md) -- [Azure Resources](https://github.com/netdata/netdata/blob/master/src/go/collectors/go.d.plugin/modules/prometheus/integrations/azure_resources.md) +- [Azure Resources](https://github.com/netdata/netdata/blob/master/src/go/plugin/go.d/modules/prometheus/integrations/azure_resources.md) -- [Azure SQL](https://github.com/netdata/netdata/blob/master/src/go/collectors/go.d.plugin/modules/prometheus/integrations/azure_sql.md) +- [Azure SQL](https://github.com/netdata/netdata/blob/master/src/go/plugin/go.d/modules/prometheus/integrations/azure_sql.md) -- [Azure Service Bus](https://github.com/netdata/netdata/blob/master/src/go/collectors/go.d.plugin/modules/prometheus/integrations/azure_service_bus.md) +- [Azure Service Bus](https://github.com/netdata/netdata/blob/master/src/go/plugin/go.d/modules/prometheus/integrations/azure_service_bus.md) -- [Azure application](https://github.com/netdata/netdata/blob/master/src/go/collectors/go.d.plugin/modules/prometheus/integrations/azure_application.md) +- [Azure application](https://github.com/netdata/netdata/blob/master/src/go/plugin/go.d/modules/prometheus/integrations/azure_application.md) -- [BigQuery](https://github.com/netdata/netdata/blob/master/src/go/collectors/go.d.plugin/modules/prometheus/integrations/bigquery.md) +- [BigQuery](https://github.com/netdata/netdata/blob/master/src/go/plugin/go.d/modules/prometheus/integrations/bigquery.md) -- [CloudWatch](https://github.com/netdata/netdata/blob/master/src/go/collectors/go.d.plugin/modules/prometheus/integrations/cloudwatch.md) +- [CloudWatch](https://github.com/netdata/netdata/blob/master/src/go/plugin/go.d/modules/prometheus/integrations/cloudwatch.md) -- [Dell EMC ECS cluster](https://github.com/netdata/netdata/blob/master/src/go/collectors/go.d.plugin/modules/prometheus/integrations/dell_emc_ecs_cluster.md) +- [Dell EMC ECS cluster](https://github.com/netdata/netdata/blob/master/src/go/plugin/go.d/modules/prometheus/integrations/dell_emc_ecs_cluster.md) -- [DigitalOcean](https://github.com/netdata/netdata/blob/master/src/go/collectors/go.d.plugin/modules/prometheus/integrations/digitalocean.md) +- [DigitalOcean](https://github.com/netdata/netdata/blob/master/src/go/plugin/go.d/modules/prometheus/integrations/digitalocean.md) -- [GCP GCE](https://github.com/netdata/netdata/blob/master/src/go/collectors/go.d.plugin/modules/prometheus/integrations/gcp_gce.md) +- [GCP GCE](https://github.com/netdata/netdata/blob/master/src/go/plugin/go.d/modules/prometheus/integrations/gcp_gce.md) -- [GCP Quota](https://github.com/netdata/netdata/blob/master/src/go/collectors/go.d.plugin/modules/prometheus/integrations/gcp_quota.md) +- [GCP Quota](https://github.com/netdata/netdata/blob/master/src/go/plugin/go.d/modules/prometheus/integrations/gcp_quota.md) -- [Google Cloud Platform](https://github.com/netdata/netdata/blob/master/src/go/collectors/go.d.plugin/modules/prometheus/integrations/google_cloud_platform.md) +- [Google Cloud Platform](https://github.com/netdata/netdata/blob/master/src/go/plugin/go.d/modules/prometheus/integrations/google_cloud_platform.md) -- [Google Stackdriver](https://github.com/netdata/netdata/blob/master/src/go/collectors/go.d.plugin/modules/prometheus/integrations/google_stackdriver.md) +- [Google Stackdriver](https://github.com/netdata/netdata/blob/master/src/go/plugin/go.d/modules/prometheus/integrations/google_stackdriver.md) -- [Linode](https://github.com/netdata/netdata/blob/master/src/go/collectors/go.d.plugin/modules/prometheus/integrations/linode.md) +- [Linode](https://github.com/netdata/netdata/blob/master/src/go/plugin/go.d/modules/prometheus/integrations/linode.md) -- [Lustre metadata](https://github.com/netdata/netdata/blob/master/src/go/collectors/go.d.plugin/modules/prometheus/integrations/lustre_metadata.md) +- [Lustre metadata](https://github.com/netdata/netdata/blob/master/src/go/plugin/go.d/modules/prometheus/integrations/lustre_metadata.md) -- [Nextcloud servers](https://github.com/netdata/netdata/blob/master/src/go/collectors/go.d.plugin/modules/prometheus/integrations/nextcloud_servers.md) +- [Nextcloud servers](https://github.com/netdata/netdata/blob/master/src/go/plugin/go.d/modules/prometheus/integrations/nextcloud_servers.md) -- [OpenStack](https://github.com/netdata/netdata/blob/master/src/go/collectors/go.d.plugin/modules/prometheus/integrations/openstack.md) +- [OpenStack](https://github.com/netdata/netdata/blob/master/src/go/plugin/go.d/modules/prometheus/integrations/openstack.md) -- [Zerto](https://github.com/netdata/netdata/blob/master/src/go/collectors/go.d.plugin/modules/prometheus/integrations/zerto.md) +- [Zerto](https://github.com/netdata/netdata/blob/master/src/go/plugin/go.d/modules/prometheus/integrations/zerto.md) ### Containers and VMs - [Containers](https://github.com/netdata/netdata/blob/master/src/collectors/cgroups.plugin/integrations/containers.md) -- [Docker Engine](https://github.com/netdata/netdata/blob/master/src/go/collectors/go.d.plugin/modules/docker_engine/integrations/docker_engine.md) +- [Docker Engine](https://github.com/netdata/netdata/blob/master/src/go/plugin/go.d/modules/docker_engine/integrations/docker_engine.md) -- [Docker Hub repository](https://github.com/netdata/netdata/blob/master/src/go/collectors/go.d.plugin/modules/dockerhub/integrations/docker_hub_repository.md) +- [Docker Hub repository](https://github.com/netdata/netdata/blob/master/src/go/plugin/go.d/modules/dockerhub/integrations/docker_hub_repository.md) -- [Docker](https://github.com/netdata/netdata/blob/master/src/go/collectors/go.d.plugin/modules/docker/integrations/docker.md) +- [Docker](https://github.com/netdata/netdata/blob/master/src/go/plugin/go.d/modules/docker/integrations/docker.md) - [LXC Containers](https://github.com/netdata/netdata/blob/master/src/collectors/cgroups.plugin/integrations/lxc_containers.md) - [Libvirt Containers](https://github.com/netdata/netdata/blob/master/src/collectors/cgroups.plugin/integrations/libvirt_containers.md) -- [NSX-T](https://github.com/netdata/netdata/blob/master/src/go/collectors/go.d.plugin/modules/prometheus/integrations/nsx-t.md) +- [NSX-T](https://github.com/netdata/netdata/blob/master/src/go/plugin/go.d/modules/prometheus/integrations/nsx-t.md) -- [Podman](https://github.com/netdata/netdata/blob/master/src/go/collectors/go.d.plugin/modules/prometheus/integrations/podman.md) +- [Podman](https://github.com/netdata/netdata/blob/master/src/go/plugin/go.d/modules/prometheus/integrations/podman.md) - [Proxmox Containers](https://github.com/netdata/netdata/blob/master/src/collectors/cgroups.plugin/integrations/proxmox_containers.md) -- [Proxmox VE](https://github.com/netdata/netdata/blob/master/src/go/collectors/go.d.plugin/modules/prometheus/integrations/proxmox_ve.md) +- [Proxmox VE](https://github.com/netdata/netdata/blob/master/src/go/plugin/go.d/modules/prometheus/integrations/proxmox_ve.md) -- [VMware vCenter Server](https://github.com/netdata/netdata/blob/master/src/go/collectors/go.d.plugin/modules/vsphere/integrations/vmware_vcenter_server.md) +- [VMware vCenter Server](https://github.com/netdata/netdata/blob/master/src/go/plugin/go.d/modules/vsphere/integrations/vmware_vcenter_server.md) - [Virtual Machines](https://github.com/netdata/netdata/blob/master/src/collectors/cgroups.plugin/integrations/virtual_machines.md) - [Xen XCP-ng](https://github.com/netdata/netdata/blob/master/src/collectors/xenstat.plugin/integrations/xen_xcp-ng.md) -- [cAdvisor](https://github.com/netdata/netdata/blob/master/src/go/collectors/go.d.plugin/modules/prometheus/integrations/cadvisor.md) +- [cAdvisor](https://github.com/netdata/netdata/blob/master/src/go/plugin/go.d/modules/prometheus/integrations/cadvisor.md) - [oVirt Containers](https://github.com/netdata/netdata/blob/master/src/collectors/cgroups.plugin/integrations/ovirt_containers.md) -- [vCenter Server Appliance](https://github.com/netdata/netdata/blob/master/src/go/collectors/go.d.plugin/modules/vcsa/integrations/vcenter_server_appliance.md) +- [vCenter Server Appliance](https://github.com/netdata/netdata/blob/master/src/go/plugin/go.d/modules/vcsa/integrations/vcenter_server_appliance.md) ### Databases -- [4D Server](https://github.com/netdata/netdata/blob/master/src/go/collectors/go.d.plugin/modules/prometheus/integrations/4d_server.md) +- [4D Server](https://github.com/netdata/netdata/blob/master/src/go/plugin/go.d/modules/prometheus/integrations/4d_server.md) -- [AWS RDS](https://github.com/netdata/netdata/blob/master/src/go/collectors/go.d.plugin/modules/prometheus/integrations/aws_rds.md) +- [AWS RDS](https://github.com/netdata/netdata/blob/master/src/go/plugin/go.d/modules/prometheus/integrations/aws_rds.md) -- [Cassandra](https://github.com/netdata/netdata/blob/master/src/go/collectors/go.d.plugin/modules/cassandra/integrations/cassandra.md) +- [Cassandra](https://github.com/netdata/netdata/blob/master/src/go/plugin/go.d/modules/cassandra/integrations/cassandra.md) -- [ClickHouse](https://github.com/netdata/netdata/blob/master/src/go/collectors/go.d.plugin/modules/clickhouse/integrations/clickhouse.md) +- [ClickHouse](https://github.com/netdata/netdata/blob/master/src/go/plugin/go.d/modules/clickhouse/integrations/clickhouse.md) -- [ClusterControl CMON](https://github.com/netdata/netdata/blob/master/src/go/collectors/go.d.plugin/modules/prometheus/integrations/clustercontrol_cmon.md) +- [ClusterControl CMON](https://github.com/netdata/netdata/blob/master/src/go/plugin/go.d/modules/prometheus/integrations/clustercontrol_cmon.md) -- [CockroachDB](https://github.com/netdata/netdata/blob/master/src/go/collectors/go.d.plugin/modules/cockroachdb/integrations/cockroachdb.md) +- [CockroachDB](https://github.com/netdata/netdata/blob/master/src/go/plugin/go.d/modules/cockroachdb/integrations/cockroachdb.md) -- [CouchDB](https://github.com/netdata/netdata/blob/master/src/go/collectors/go.d.plugin/modules/couchdb/integrations/couchdb.md) +- [CouchDB](https://github.com/netdata/netdata/blob/master/src/go/plugin/go.d/modules/couchdb/integrations/couchdb.md) -- [Couchbase](https://github.com/netdata/netdata/blob/master/src/go/collectors/go.d.plugin/modules/couchbase/integrations/couchbase.md) +- [Couchbase](https://github.com/netdata/netdata/blob/master/src/go/plugin/go.d/modules/couchbase/integrations/couchbase.md) -- [HANA](https://github.com/netdata/netdata/blob/master/src/go/collectors/go.d.plugin/modules/prometheus/integrations/hana.md) +- [HANA](https://github.com/netdata/netdata/blob/master/src/go/plugin/go.d/modules/prometheus/integrations/hana.md) -- [Hasura GraphQL Server](https://github.com/netdata/netdata/blob/master/src/go/collectors/go.d.plugin/modules/prometheus/integrations/hasura_graphql_server.md) +- [Hasura GraphQL Server](https://github.com/netdata/netdata/blob/master/src/go/plugin/go.d/modules/prometheus/integrations/hasura_graphql_server.md) -- [InfluxDB](https://github.com/netdata/netdata/blob/master/src/go/collectors/go.d.plugin/modules/prometheus/integrations/influxdb.md) +- [InfluxDB](https://github.com/netdata/netdata/blob/master/src/go/plugin/go.d/modules/prometheus/integrations/influxdb.md) -- [Machbase](https://github.com/netdata/netdata/blob/master/src/go/collectors/go.d.plugin/modules/prometheus/integrations/machbase.md) +- [Machbase](https://github.com/netdata/netdata/blob/master/src/go/plugin/go.d/modules/prometheus/integrations/machbase.md) -- [MariaDB](https://github.com/netdata/netdata/blob/master/src/go/collectors/go.d.plugin/modules/mysql/integrations/mariadb.md) +- [MariaDB](https://github.com/netdata/netdata/blob/master/src/go/plugin/go.d/modules/mysql/integrations/mariadb.md) -- [Memcached (community)](https://github.com/netdata/netdata/blob/master/src/go/collectors/go.d.plugin/modules/prometheus/integrations/memcached_community.md) +- [Memcached (community)](https://github.com/netdata/netdata/blob/master/src/go/plugin/go.d/modules/prometheus/integrations/memcached_community.md) -- [Memcached](https://github.com/netdata/netdata/blob/master/src/collectors/python.d.plugin/memcached/integrations/memcached.md) +- [Memcached](https://github.com/netdata/netdata/blob/master/src/go/plugin/go.d/modules/memcached/integrations/memcached.md) -- [MongoDB](https://github.com/netdata/netdata/blob/master/src/go/collectors/go.d.plugin/modules/mongodb/integrations/mongodb.md) +- [MongoDB](https://github.com/netdata/netdata/blob/master/src/go/plugin/go.d/modules/mongodb/integrations/mongodb.md) -- [MySQL](https://github.com/netdata/netdata/blob/master/src/go/collectors/go.d.plugin/modules/mysql/integrations/mysql.md) +- [MySQL](https://github.com/netdata/netdata/blob/master/src/go/plugin/go.d/modules/mysql/integrations/mysql.md) -- [ODBC](https://github.com/netdata/netdata/blob/master/src/go/collectors/go.d.plugin/modules/prometheus/integrations/odbc.md) +- [ODBC](https://github.com/netdata/netdata/blob/master/src/go/plugin/go.d/modules/prometheus/integrations/odbc.md) -- [Oracle DB (community)](https://github.com/netdata/netdata/blob/master/src/go/collectors/go.d.plugin/modules/prometheus/integrations/oracle_db_community.md) +- [Oracle DB (community)](https://github.com/netdata/netdata/blob/master/src/go/plugin/go.d/modules/prometheus/integrations/oracle_db_community.md) - [Oracle DB](https://github.com/netdata/netdata/blob/master/src/collectors/python.d.plugin/oracledb/integrations/oracle_db.md) -- [Patroni](https://github.com/netdata/netdata/blob/master/src/go/collectors/go.d.plugin/modules/prometheus/integrations/patroni.md) +- [Patroni](https://github.com/netdata/netdata/blob/master/src/go/plugin/go.d/modules/prometheus/integrations/patroni.md) -- [Percona MySQL](https://github.com/netdata/netdata/blob/master/src/go/collectors/go.d.plugin/modules/mysql/integrations/percona_mysql.md) +- [Percona MySQL](https://github.com/netdata/netdata/blob/master/src/go/plugin/go.d/modules/mysql/integrations/percona_mysql.md) -- [PgBouncer](https://github.com/netdata/netdata/blob/master/src/go/collectors/go.d.plugin/modules/pgbouncer/integrations/pgbouncer.md) +- [PgBouncer](https://github.com/netdata/netdata/blob/master/src/go/plugin/go.d/modules/pgbouncer/integrations/pgbouncer.md) -- [Pgpool-II](https://github.com/netdata/netdata/blob/master/src/go/collectors/go.d.plugin/modules/prometheus/integrations/pgpool-ii.md) +- [Pgpool-II](https://github.com/netdata/netdata/blob/master/src/go/plugin/go.d/modules/prometheus/integrations/pgpool-ii.md) -- [Pika](https://github.com/netdata/netdata/blob/master/src/go/collectors/go.d.plugin/modules/pika/integrations/pika.md) +- [Pika](https://github.com/netdata/netdata/blob/master/src/go/plugin/go.d/modules/pika/integrations/pika.md) -- [PostgreSQL](https://github.com/netdata/netdata/blob/master/src/go/collectors/go.d.plugin/modules/postgres/integrations/postgresql.md) +- [PostgreSQL](https://github.com/netdata/netdata/blob/master/src/go/plugin/go.d/modules/postgres/integrations/postgresql.md) -- [ProxySQL](https://github.com/netdata/netdata/blob/master/src/go/collectors/go.d.plugin/modules/proxysql/integrations/proxysql.md) +- [ProxySQL](https://github.com/netdata/netdata/blob/master/src/go/plugin/go.d/modules/proxysql/integrations/proxysql.md) -- [Redis](https://github.com/netdata/netdata/blob/master/src/go/collectors/go.d.plugin/modules/redis/integrations/redis.md) +- [Redis](https://github.com/netdata/netdata/blob/master/src/go/plugin/go.d/modules/redis/integrations/redis.md) -- [RethinkDB](https://github.com/netdata/netdata/blob/master/src/collectors/python.d.plugin/rethinkdbs/integrations/rethinkdb.md) +- [RethinkDB](https://github.com/netdata/netdata/blob/master/src/go/plugin/go.d/modules/rethinkdb/integrations/rethinkdb.md) -- [RiakKV](https://github.com/netdata/netdata/blob/master/src/collectors/python.d.plugin/riakkv/integrations/riakkv.md) +- [Riak KV](https://github.com/netdata/netdata/blob/master/src/go/plugin/go.d/modules/riakkv/integrations/riak_kv.md) -- [SQL Database agnostic](https://github.com/netdata/netdata/blob/master/src/go/collectors/go.d.plugin/modules/prometheus/integrations/sql_database_agnostic.md) +- [SQL Database agnostic](https://github.com/netdata/netdata/blob/master/src/go/plugin/go.d/modules/prometheus/integrations/sql_database_agnostic.md) -- [Vertica](https://github.com/netdata/netdata/blob/master/src/go/collectors/go.d.plugin/modules/prometheus/integrations/vertica.md) +- [Vertica](https://github.com/netdata/netdata/blob/master/src/go/plugin/go.d/modules/prometheus/integrations/vertica.md) -- [Warp10](https://github.com/netdata/netdata/blob/master/src/go/collectors/go.d.plugin/modules/prometheus/integrations/warp10.md) +- [Warp10](https://github.com/netdata/netdata/blob/master/src/go/plugin/go.d/modules/prometheus/integrations/warp10.md) -- [pgBackRest](https://github.com/netdata/netdata/blob/master/src/go/collectors/go.d.plugin/modules/prometheus/integrations/pgbackrest.md) +- [pgBackRest](https://github.com/netdata/netdata/blob/master/src/go/plugin/go.d/modules/prometheus/integrations/pgbackrest.md) ### Distributed Computing Systems - [BOINC](https://github.com/netdata/netdata/blob/master/src/collectors/python.d.plugin/boinc/integrations/boinc.md) -- [Gearman](https://github.com/netdata/netdata/blob/master/src/collectors/python.d.plugin/gearman/integrations/gearman.md) +- [Gearman](https://github.com/netdata/netdata/blob/master/src/go/plugin/go.d/modules/gearman/integrations/gearman.md) ### DNS and DHCP Servers -- [Akamai Edge DNS Traffic](https://github.com/netdata/netdata/blob/master/src/go/collectors/go.d.plugin/modules/prometheus/integrations/akamai_edge_dns_traffic.md) +- [Akamai Edge DNS Traffic](https://github.com/netdata/netdata/blob/master/src/go/plugin/go.d/modules/prometheus/integrations/akamai_edge_dns_traffic.md) -- [CoreDNS](https://github.com/netdata/netdata/blob/master/src/go/collectors/go.d.plugin/modules/coredns/integrations/coredns.md) +- [CoreDNS](https://github.com/netdata/netdata/blob/master/src/go/plugin/go.d/modules/coredns/integrations/coredns.md) -- [DNS query](https://github.com/netdata/netdata/blob/master/src/go/collectors/go.d.plugin/modules/dnsquery/integrations/dns_query.md) +- [DNS query](https://github.com/netdata/netdata/blob/master/src/go/plugin/go.d/modules/dnsquery/integrations/dns_query.md) -- [DNSBL](https://github.com/netdata/netdata/blob/master/src/go/collectors/go.d.plugin/modules/prometheus/integrations/dnsbl.md) +- [DNSBL](https://github.com/netdata/netdata/blob/master/src/go/plugin/go.d/modules/prometheus/integrations/dnsbl.md) -- [DNSdist](https://github.com/netdata/netdata/blob/master/src/go/collectors/go.d.plugin/modules/dnsdist/integrations/dnsdist.md) +- [DNSdist](https://github.com/netdata/netdata/blob/master/src/go/plugin/go.d/modules/dnsdist/integrations/dnsdist.md) -- [Dnsmasq DHCP](https://github.com/netdata/netdata/blob/master/src/go/collectors/go.d.plugin/modules/dnsmasq_dhcp/integrations/dnsmasq_dhcp.md) +- [Dnsmasq DHCP](https://github.com/netdata/netdata/blob/master/src/go/plugin/go.d/modules/dnsmasq_dhcp/integrations/dnsmasq_dhcp.md) -- [Dnsmasq](https://github.com/netdata/netdata/blob/master/src/go/collectors/go.d.plugin/modules/dnsmasq/integrations/dnsmasq.md) +- [Dnsmasq](https://github.com/netdata/netdata/blob/master/src/go/plugin/go.d/modules/dnsmasq/integrations/dnsmasq.md) -- [ISC DHCP](https://github.com/netdata/netdata/blob/master/src/go/collectors/go.d.plugin/modules/isc_dhcpd/integrations/isc_dhcp.md) +- [ISC DHCP](https://github.com/netdata/netdata/blob/master/src/go/plugin/go.d/modules/isc_dhcpd/integrations/isc_dhcp.md) -- [Name Server Daemon](https://github.com/netdata/netdata/blob/master/src/collectors/python.d.plugin/nsd/integrations/name_server_daemon.md) +- [NSD](https://github.com/netdata/netdata/blob/master/src/go/plugin/go.d/modules/nsd/integrations/nsd.md) -- [NextDNS](https://github.com/netdata/netdata/blob/master/src/go/collectors/go.d.plugin/modules/prometheus/integrations/nextdns.md) +- [NextDNS](https://github.com/netdata/netdata/blob/master/src/go/plugin/go.d/modules/prometheus/integrations/nextdns.md) -- [Pi-hole](https://github.com/netdata/netdata/blob/master/src/go/collectors/go.d.plugin/modules/pihole/integrations/pi-hole.md) +- [Pi-hole](https://github.com/netdata/netdata/blob/master/src/go/plugin/go.d/modules/pihole/integrations/pi-hole.md) -- [PowerDNS Authoritative Server](https://github.com/netdata/netdata/blob/master/src/go/collectors/go.d.plugin/modules/powerdns/integrations/powerdns_authoritative_server.md) +- [PowerDNS Authoritative Server](https://github.com/netdata/netdata/blob/master/src/go/plugin/go.d/modules/powerdns/integrations/powerdns_authoritative_server.md) -- [PowerDNS Recursor](https://github.com/netdata/netdata/blob/master/src/go/collectors/go.d.plugin/modules/powerdns_recursor/integrations/powerdns_recursor.md) +- [PowerDNS Recursor](https://github.com/netdata/netdata/blob/master/src/go/plugin/go.d/modules/powerdns_recursor/integrations/powerdns_recursor.md) -- [Unbound](https://github.com/netdata/netdata/blob/master/src/go/collectors/go.d.plugin/modules/unbound/integrations/unbound.md) +- [Unbound](https://github.com/netdata/netdata/blob/master/src/go/plugin/go.d/modules/unbound/integrations/unbound.md) ### eBPF @@ -353,9 +353,9 @@ If you don't see the app/service you'd like to monitor in this list: ### FreeBSD -- [FreeBSD NFS](https://github.com/netdata/netdata/blob/master/src/go/collectors/go.d.plugin/modules/prometheus/integrations/freebsd_nfs.md) +- [FreeBSD NFS](https://github.com/netdata/netdata/blob/master/src/go/plugin/go.d/modules/prometheus/integrations/freebsd_nfs.md) -- [FreeBSD RCTL-RACCT](https://github.com/netdata/netdata/blob/master/src/go/collectors/go.d.plugin/modules/prometheus/integrations/freebsd_rctl-racct.md) +- [FreeBSD RCTL-RACCT](https://github.com/netdata/netdata/blob/master/src/go/plugin/go.d/modules/prometheus/integrations/freebsd_rctl-racct.md) - [dev.cpu.0.freq](https://github.com/netdata/netdata/blob/master/src/collectors/freebsd.plugin/integrations/dev.cpu.0.freq.md) @@ -419,43 +419,43 @@ If you don't see the app/service you'd like to monitor in this list: ### FTP Servers -- [ProFTPD](https://github.com/netdata/netdata/blob/master/src/go/collectors/go.d.plugin/modules/prometheus/integrations/proftpd.md) +- [ProFTPD](https://github.com/netdata/netdata/blob/master/src/go/plugin/go.d/modules/prometheus/integrations/proftpd.md) ### Gaming -- [BungeeCord](https://github.com/netdata/netdata/blob/master/src/go/collectors/go.d.plugin/modules/prometheus/integrations/bungeecord.md) +- [BungeeCord](https://github.com/netdata/netdata/blob/master/src/go/plugin/go.d/modules/prometheus/integrations/bungeecord.md) -- [Minecraft](https://github.com/netdata/netdata/blob/master/src/go/collectors/go.d.plugin/modules/prometheus/integrations/minecraft.md) +- [Minecraft](https://github.com/netdata/netdata/blob/master/src/go/plugin/go.d/modules/prometheus/integrations/minecraft.md) -- [OpenRCT2](https://github.com/netdata/netdata/blob/master/src/go/collectors/go.d.plugin/modules/prometheus/integrations/openrct2.md) +- [OpenRCT2](https://github.com/netdata/netdata/blob/master/src/go/plugin/go.d/modules/prometheus/integrations/openrct2.md) - [SpigotMC](https://github.com/netdata/netdata/blob/master/src/collectors/python.d.plugin/spigotmc/integrations/spigotmc.md) -- [Steam](https://github.com/netdata/netdata/blob/master/src/go/collectors/go.d.plugin/modules/prometheus/integrations/steam.md) +- [Steam](https://github.com/netdata/netdata/blob/master/src/go/plugin/go.d/modules/prometheus/integrations/steam.md) ### Generic Data Collection -- [Custom Exporter](https://github.com/netdata/netdata/blob/master/src/go/collectors/go.d.plugin/modules/prometheus/integrations/custom_exporter.md) +- [Custom Exporter](https://github.com/netdata/netdata/blob/master/src/go/plugin/go.d/modules/prometheus/integrations/custom_exporter.md) -- [Excel spreadsheet](https://github.com/netdata/netdata/blob/master/src/go/collectors/go.d.plugin/modules/prometheus/integrations/excel_spreadsheet.md) +- [Excel spreadsheet](https://github.com/netdata/netdata/blob/master/src/go/plugin/go.d/modules/prometheus/integrations/excel_spreadsheet.md) -- [Generic Command Line Output](https://github.com/netdata/netdata/blob/master/src/go/collectors/go.d.plugin/modules/prometheus/integrations/generic_command_line_output.md) +- [Generic Command Line Output](https://github.com/netdata/netdata/blob/master/src/go/plugin/go.d/modules/prometheus/integrations/generic_command_line_output.md) -- [JetBrains Floating License Server](https://github.com/netdata/netdata/blob/master/src/go/collectors/go.d.plugin/modules/prometheus/integrations/jetbrains_floating_license_server.md) +- [JetBrains Floating License Server](https://github.com/netdata/netdata/blob/master/src/go/plugin/go.d/modules/prometheus/integrations/jetbrains_floating_license_server.md) -- [OpenWeatherMap](https://github.com/netdata/netdata/blob/master/src/go/collectors/go.d.plugin/modules/prometheus/integrations/openweathermap.md) +- [OpenWeatherMap](https://github.com/netdata/netdata/blob/master/src/go/plugin/go.d/modules/prometheus/integrations/openweathermap.md) - [Pandas](https://github.com/netdata/netdata/blob/master/src/collectors/python.d.plugin/pandas/integrations/pandas.md) -- [Prometheus endpoint](https://github.com/netdata/netdata/blob/master/src/go/collectors/go.d.plugin/modules/prometheus/integrations/prometheus_endpoint.md) +- [Prometheus endpoint](https://github.com/netdata/netdata/blob/master/src/go/plugin/go.d/modules/prometheus/integrations/prometheus_endpoint.md) -- [SNMP devices](https://github.com/netdata/netdata/blob/master/src/go/collectors/go.d.plugin/modules/snmp/integrations/snmp_devices.md) +- [SNMP devices](https://github.com/netdata/netdata/blob/master/src/go/plugin/go.d/modules/snmp/integrations/snmp_devices.md) -- [Shell command](https://github.com/netdata/netdata/blob/master/src/go/collectors/go.d.plugin/modules/prometheus/integrations/shell_command.md) +- [Shell command](https://github.com/netdata/netdata/blob/master/src/go/plugin/go.d/modules/prometheus/integrations/shell_command.md) -- [Tankerkoenig API](https://github.com/netdata/netdata/blob/master/src/go/collectors/go.d.plugin/modules/prometheus/integrations/tankerkoenig_api.md) +- [Tankerkoenig API](https://github.com/netdata/netdata/blob/master/src/go/plugin/go.d/modules/prometheus/integrations/tankerkoenig_api.md) -- [TwinCAT ADS Web Service](https://github.com/netdata/netdata/blob/master/src/go/collectors/go.d.plugin/modules/prometheus/integrations/twincat_ads_web_service.md) +- [TwinCAT ADS Web Service](https://github.com/netdata/netdata/blob/master/src/go/plugin/go.d/modules/prometheus/integrations/twincat_ads_web_service.md) ### Hardware Devices and Sensors @@ -463,143 +463,143 @@ If you don't see the app/service you'd like to monitor in this list: - [AM2320](https://github.com/netdata/netdata/blob/master/src/collectors/python.d.plugin/am2320/integrations/am2320.md) -- [AMD CPU & GPU](https://github.com/netdata/netdata/blob/master/src/go/collectors/go.d.plugin/modules/prometheus/integrations/amd_cpu_&_gpu.md) +- [AMD CPU & GPU](https://github.com/netdata/netdata/blob/master/src/go/plugin/go.d/modules/prometheus/integrations/amd_cpu_&_gpu.md) - [AMD GPU](https://github.com/netdata/netdata/blob/master/src/collectors/proc.plugin/integrations/amd_gpu.md) -- [ARM HWCPipe](https://github.com/netdata/netdata/blob/master/src/go/collectors/go.d.plugin/modules/prometheus/integrations/arm_hwcpipe.md) +- [ARM HWCPipe](https://github.com/netdata/netdata/blob/master/src/go/plugin/go.d/modules/prometheus/integrations/arm_hwcpipe.md) - [CUPS](https://github.com/netdata/netdata/blob/master/src/collectors/cups.plugin/integrations/cups.md) -- [HDD temperature](https://github.com/netdata/netdata/blob/master/src/go/collectors/go.d.plugin/modules/hddtemp/integrations/hdd_temperature.md) +- [HDD temperature](https://github.com/netdata/netdata/blob/master/src/go/plugin/go.d/modules/hddtemp/integrations/hdd_temperature.md) -- [HP iLO](https://github.com/netdata/netdata/blob/master/src/go/collectors/go.d.plugin/modules/prometheus/integrations/hp_ilo.md) +- [HP iLO](https://github.com/netdata/netdata/blob/master/src/go/plugin/go.d/modules/prometheus/integrations/hp_ilo.md) -- [IBM CryptoExpress (CEX) cards](https://github.com/netdata/netdata/blob/master/src/go/collectors/go.d.plugin/modules/prometheus/integrations/ibm_cryptoexpress_cex_cards.md) +- [IBM CryptoExpress (CEX) cards](https://github.com/netdata/netdata/blob/master/src/go/plugin/go.d/modules/prometheus/integrations/ibm_cryptoexpress_cex_cards.md) -- [IBM Z Hardware Management Console](https://github.com/netdata/netdata/blob/master/src/go/collectors/go.d.plugin/modules/prometheus/integrations/ibm_z_hardware_management_console.md) +- [IBM Z Hardware Management Console](https://github.com/netdata/netdata/blob/master/src/go/plugin/go.d/modules/prometheus/integrations/ibm_z_hardware_management_console.md) -- [IPMI (By SoundCloud)](https://github.com/netdata/netdata/blob/master/src/go/collectors/go.d.plugin/modules/prometheus/integrations/ipmi_by_soundcloud.md) +- [IPMI (By SoundCloud)](https://github.com/netdata/netdata/blob/master/src/go/plugin/go.d/modules/prometheus/integrations/ipmi_by_soundcloud.md) -- [Intel GPU](https://github.com/netdata/netdata/blob/master/src/go/collectors/go.d.plugin/modules/intelgpu/integrations/intel_gpu.md) +- [Intel GPU](https://github.com/netdata/netdata/blob/master/src/go/plugin/go.d/modules/intelgpu/integrations/intel_gpu.md) - [Intelligent Platform Management Interface (IPMI)](https://github.com/netdata/netdata/blob/master/src/collectors/freeipmi.plugin/integrations/intelligent_platform_management_interface_ipmi.md) -- [Linux Sensors (lm-sensors)](https://github.com/netdata/netdata/blob/master/src/go/collectors/go.d.plugin/modules/sensors/integrations/linux_sensors_lm-sensors.md) +- [Linux Sensors (lm-sensors)](https://github.com/netdata/netdata/blob/master/src/go/plugin/go.d/modules/sensors/integrations/linux_sensors_lm-sensors.md) - [Linux Sensors (sysfs)](https://github.com/netdata/netdata/blob/master/src/collectors/charts.d.plugin/sensors/integrations/linux_sensors_sysfs.md) -- [NVML](https://github.com/netdata/netdata/blob/master/src/go/collectors/go.d.plugin/modules/prometheus/integrations/nvml.md) +- [NVML](https://github.com/netdata/netdata/blob/master/src/go/plugin/go.d/modules/prometheus/integrations/nvml.md) -- [Nvidia GPU](https://github.com/netdata/netdata/blob/master/src/go/collectors/go.d.plugin/modules/nvidia_smi/integrations/nvidia_gpu.md) +- [Nvidia GPU](https://github.com/netdata/netdata/blob/master/src/go/plugin/go.d/modules/nvidia_smi/integrations/nvidia_gpu.md) -- [Raritan PDU](https://github.com/netdata/netdata/blob/master/src/go/collectors/go.d.plugin/modules/prometheus/integrations/raritan_pdu.md) +- [Raritan PDU](https://github.com/netdata/netdata/blob/master/src/go/plugin/go.d/modules/prometheus/integrations/raritan_pdu.md) -- [S.M.A.R.T.](https://github.com/netdata/netdata/blob/master/src/go/collectors/go.d.plugin/modules/smartctl/integrations/s.m.a.r.t..md) +- [S.M.A.R.T.](https://github.com/netdata/netdata/blob/master/src/go/plugin/go.d/modules/smartctl/integrations/s.m.a.r.t..md) -- [ServerTech](https://github.com/netdata/netdata/blob/master/src/go/collectors/go.d.plugin/modules/prometheus/integrations/servertech.md) +- [ServerTech](https://github.com/netdata/netdata/blob/master/src/go/plugin/go.d/modules/prometheus/integrations/servertech.md) -- [Siemens S7 PLC](https://github.com/netdata/netdata/blob/master/src/go/collectors/go.d.plugin/modules/prometheus/integrations/siemens_s7_plc.md) +- [Siemens S7 PLC](https://github.com/netdata/netdata/blob/master/src/go/plugin/go.d/modules/prometheus/integrations/siemens_s7_plc.md) -- [T-Rex NVIDIA GPU Miner](https://github.com/netdata/netdata/blob/master/src/go/collectors/go.d.plugin/modules/prometheus/integrations/t-rex_nvidia_gpu_miner.md) +- [T-Rex NVIDIA GPU Miner](https://github.com/netdata/netdata/blob/master/src/go/plugin/go.d/modules/prometheus/integrations/t-rex_nvidia_gpu_miner.md) ### IoT Devices -- [Airthings Waveplus air sensor](https://github.com/netdata/netdata/blob/master/src/go/collectors/go.d.plugin/modules/prometheus/integrations/airthings_waveplus_air_sensor.md) +- [Airthings Waveplus air sensor](https://github.com/netdata/netdata/blob/master/src/go/plugin/go.d/modules/prometheus/integrations/airthings_waveplus_air_sensor.md) -- [Bobcat Miner 300](https://github.com/netdata/netdata/blob/master/src/go/collectors/go.d.plugin/modules/prometheus/integrations/bobcat_miner_300.md) +- [Bobcat Miner 300](https://github.com/netdata/netdata/blob/master/src/go/plugin/go.d/modules/prometheus/integrations/bobcat_miner_300.md) -- [Christ Elektronik CLM5IP power panel](https://github.com/netdata/netdata/blob/master/src/go/collectors/go.d.plugin/modules/prometheus/integrations/christ_elektronik_clm5ip_power_panel.md) +- [Christ Elektronik CLM5IP power panel](https://github.com/netdata/netdata/blob/master/src/go/plugin/go.d/modules/prometheus/integrations/christ_elektronik_clm5ip_power_panel.md) -- [CraftBeerPi](https://github.com/netdata/netdata/blob/master/src/go/collectors/go.d.plugin/modules/prometheus/integrations/craftbeerpi.md) +- [CraftBeerPi](https://github.com/netdata/netdata/blob/master/src/go/plugin/go.d/modules/prometheus/integrations/craftbeerpi.md) -- [Dutch Electricity Smart Meter](https://github.com/netdata/netdata/blob/master/src/go/collectors/go.d.plugin/modules/prometheus/integrations/dutch_electricity_smart_meter.md) +- [Dutch Electricity Smart Meter](https://github.com/netdata/netdata/blob/master/src/go/plugin/go.d/modules/prometheus/integrations/dutch_electricity_smart_meter.md) -- [Elgato Key Light devices.](https://github.com/netdata/netdata/blob/master/src/go/collectors/go.d.plugin/modules/prometheus/integrations/elgato_key_light_devices..md) +- [Elgato Key Light devices.](https://github.com/netdata/netdata/blob/master/src/go/plugin/go.d/modules/prometheus/integrations/elgato_key_light_devices..md) -- [Energomera smart power meters](https://github.com/netdata/netdata/blob/master/src/go/collectors/go.d.plugin/modules/prometheus/integrations/energomera_smart_power_meters.md) +- [Energomera smart power meters](https://github.com/netdata/netdata/blob/master/src/go/plugin/go.d/modules/prometheus/integrations/energomera_smart_power_meters.md) -- [Helium hotspot](https://github.com/netdata/netdata/blob/master/src/go/collectors/go.d.plugin/modules/prometheus/integrations/helium_hotspot.md) +- [Helium hotspot](https://github.com/netdata/netdata/blob/master/src/go/plugin/go.d/modules/prometheus/integrations/helium_hotspot.md) -- [Homebridge](https://github.com/netdata/netdata/blob/master/src/go/collectors/go.d.plugin/modules/prometheus/integrations/homebridge.md) +- [Homebridge](https://github.com/netdata/netdata/blob/master/src/go/plugin/go.d/modules/prometheus/integrations/homebridge.md) -- [Homey](https://github.com/netdata/netdata/blob/master/src/go/collectors/go.d.plugin/modules/prometheus/integrations/homey.md) +- [Homey](https://github.com/netdata/netdata/blob/master/src/go/plugin/go.d/modules/prometheus/integrations/homey.md) -- [Jarvis Standing Desk](https://github.com/netdata/netdata/blob/master/src/go/collectors/go.d.plugin/modules/prometheus/integrations/jarvis_standing_desk.md) +- [Jarvis Standing Desk](https://github.com/netdata/netdata/blob/master/src/go/plugin/go.d/modules/prometheus/integrations/jarvis_standing_desk.md) -- [MP707 USB thermometer](https://github.com/netdata/netdata/blob/master/src/go/collectors/go.d.plugin/modules/prometheus/integrations/mp707_usb_thermometer.md) +- [MP707 USB thermometer](https://github.com/netdata/netdata/blob/master/src/go/plugin/go.d/modules/prometheus/integrations/mp707_usb_thermometer.md) -- [Modbus protocol](https://github.com/netdata/netdata/blob/master/src/go/collectors/go.d.plugin/modules/prometheus/integrations/modbus_protocol.md) +- [Modbus protocol](https://github.com/netdata/netdata/blob/master/src/go/plugin/go.d/modules/prometheus/integrations/modbus_protocol.md) -- [Monnit Sensors MQTT](https://github.com/netdata/netdata/blob/master/src/go/collectors/go.d.plugin/modules/prometheus/integrations/monnit_sensors_mqtt.md) +- [Monnit Sensors MQTT](https://github.com/netdata/netdata/blob/master/src/go/plugin/go.d/modules/prometheus/integrations/monnit_sensors_mqtt.md) -- [Nature Remo E lite devices](https://github.com/netdata/netdata/blob/master/src/go/collectors/go.d.plugin/modules/prometheus/integrations/nature_remo_e_lite_devices.md) +- [Nature Remo E lite devices](https://github.com/netdata/netdata/blob/master/src/go/plugin/go.d/modules/prometheus/integrations/nature_remo_e_lite_devices.md) -- [Netatmo sensors](https://github.com/netdata/netdata/blob/master/src/go/collectors/go.d.plugin/modules/prometheus/integrations/netatmo_sensors.md) +- [Netatmo sensors](https://github.com/netdata/netdata/blob/master/src/go/plugin/go.d/modules/prometheus/integrations/netatmo_sensors.md) -- [OpenHAB](https://github.com/netdata/netdata/blob/master/src/go/collectors/go.d.plugin/modules/prometheus/integrations/openhab.md) +- [OpenHAB](https://github.com/netdata/netdata/blob/master/src/go/plugin/go.d/modules/prometheus/integrations/openhab.md) -- [Personal Weather Station](https://github.com/netdata/netdata/blob/master/src/go/collectors/go.d.plugin/modules/prometheus/integrations/personal_weather_station.md) +- [Personal Weather Station](https://github.com/netdata/netdata/blob/master/src/go/plugin/go.d/modules/prometheus/integrations/personal_weather_station.md) -- [Philips Hue](https://github.com/netdata/netdata/blob/master/src/go/collectors/go.d.plugin/modules/prometheus/integrations/philips_hue.md) +- [Philips Hue](https://github.com/netdata/netdata/blob/master/src/go/plugin/go.d/modules/prometheus/integrations/philips_hue.md) -- [Pimoroni Enviro+](https://github.com/netdata/netdata/blob/master/src/go/collectors/go.d.plugin/modules/prometheus/integrations/pimoroni_enviro+.md) +- [Pimoroni Enviro+](https://github.com/netdata/netdata/blob/master/src/go/plugin/go.d/modules/prometheus/integrations/pimoroni_enviro+.md) -- [Powerpal devices](https://github.com/netdata/netdata/blob/master/src/go/collectors/go.d.plugin/modules/prometheus/integrations/powerpal_devices.md) +- [Powerpal devices](https://github.com/netdata/netdata/blob/master/src/go/plugin/go.d/modules/prometheus/integrations/powerpal_devices.md) -- [Radio Thermostat](https://github.com/netdata/netdata/blob/master/src/go/collectors/go.d.plugin/modules/prometheus/integrations/radio_thermostat.md) +- [Radio Thermostat](https://github.com/netdata/netdata/blob/master/src/go/plugin/go.d/modules/prometheus/integrations/radio_thermostat.md) -- [SMA Inverters](https://github.com/netdata/netdata/blob/master/src/go/collectors/go.d.plugin/modules/prometheus/integrations/sma_inverters.md) +- [SMA Inverters](https://github.com/netdata/netdata/blob/master/src/go/plugin/go.d/modules/prometheus/integrations/sma_inverters.md) -- [Salicru EQX inverter](https://github.com/netdata/netdata/blob/master/src/go/collectors/go.d.plugin/modules/prometheus/integrations/salicru_eqx_inverter.md) +- [Salicru EQX inverter](https://github.com/netdata/netdata/blob/master/src/go/plugin/go.d/modules/prometheus/integrations/salicru_eqx_inverter.md) -- [Sense Energy](https://github.com/netdata/netdata/blob/master/src/go/collectors/go.d.plugin/modules/prometheus/integrations/sense_energy.md) +- [Sense Energy](https://github.com/netdata/netdata/blob/master/src/go/plugin/go.d/modules/prometheus/integrations/sense_energy.md) -- [Shelly humidity sensor](https://github.com/netdata/netdata/blob/master/src/go/collectors/go.d.plugin/modules/prometheus/integrations/shelly_humidity_sensor.md) +- [Shelly humidity sensor](https://github.com/netdata/netdata/blob/master/src/go/plugin/go.d/modules/prometheus/integrations/shelly_humidity_sensor.md) -- [Smart meters SML](https://github.com/netdata/netdata/blob/master/src/go/collectors/go.d.plugin/modules/prometheus/integrations/smart_meters_sml.md) +- [Smart meters SML](https://github.com/netdata/netdata/blob/master/src/go/plugin/go.d/modules/prometheus/integrations/smart_meters_sml.md) -- [Solar logging stick](https://github.com/netdata/netdata/blob/master/src/go/collectors/go.d.plugin/modules/prometheus/integrations/solar_logging_stick.md) +- [Solar logging stick](https://github.com/netdata/netdata/blob/master/src/go/plugin/go.d/modules/prometheus/integrations/solar_logging_stick.md) -- [SolarEdge inverters](https://github.com/netdata/netdata/blob/master/src/go/collectors/go.d.plugin/modules/prometheus/integrations/solaredge_inverters.md) +- [SolarEdge inverters](https://github.com/netdata/netdata/blob/master/src/go/plugin/go.d/modules/prometheus/integrations/solaredge_inverters.md) -- [Solis Ginlong 5G inverters](https://github.com/netdata/netdata/blob/master/src/go/collectors/go.d.plugin/modules/prometheus/integrations/solis_ginlong_5g_inverters.md) +- [Solis Ginlong 5G inverters](https://github.com/netdata/netdata/blob/master/src/go/plugin/go.d/modules/prometheus/integrations/solis_ginlong_5g_inverters.md) -- [Sunspec Solar Energy](https://github.com/netdata/netdata/blob/master/src/go/collectors/go.d.plugin/modules/prometheus/integrations/sunspec_solar_energy.md) +- [Sunspec Solar Energy](https://github.com/netdata/netdata/blob/master/src/go/plugin/go.d/modules/prometheus/integrations/sunspec_solar_energy.md) -- [TP-Link P110](https://github.com/netdata/netdata/blob/master/src/go/collectors/go.d.plugin/modules/prometheus/integrations/tp-link_p110.md) +- [TP-Link P110](https://github.com/netdata/netdata/blob/master/src/go/plugin/go.d/modules/prometheus/integrations/tp-link_p110.md) -- [Tado smart heating solution](https://github.com/netdata/netdata/blob/master/src/go/collectors/go.d.plugin/modules/prometheus/integrations/tado_smart_heating_solution.md) +- [Tado smart heating solution](https://github.com/netdata/netdata/blob/master/src/go/plugin/go.d/modules/prometheus/integrations/tado_smart_heating_solution.md) -- [Tesla Powerwall](https://github.com/netdata/netdata/blob/master/src/go/collectors/go.d.plugin/modules/prometheus/integrations/tesla_powerwall.md) +- [Tesla Powerwall](https://github.com/netdata/netdata/blob/master/src/go/plugin/go.d/modules/prometheus/integrations/tesla_powerwall.md) -- [Tesla Wall Connector](https://github.com/netdata/netdata/blob/master/src/go/collectors/go.d.plugin/modules/prometheus/integrations/tesla_wall_connector.md) +- [Tesla Wall Connector](https://github.com/netdata/netdata/blob/master/src/go/plugin/go.d/modules/prometheus/integrations/tesla_wall_connector.md) -- [Tesla vehicle](https://github.com/netdata/netdata/blob/master/src/go/collectors/go.d.plugin/modules/prometheus/integrations/tesla_vehicle.md) +- [Tesla vehicle](https://github.com/netdata/netdata/blob/master/src/go/plugin/go.d/modules/prometheus/integrations/tesla_vehicle.md) -- [Xiaomi Mi Flora](https://github.com/netdata/netdata/blob/master/src/go/collectors/go.d.plugin/modules/prometheus/integrations/xiaomi_mi_flora.md) +- [Xiaomi Mi Flora](https://github.com/netdata/netdata/blob/master/src/go/plugin/go.d/modules/prometheus/integrations/xiaomi_mi_flora.md) -- [iqAir AirVisual air quality monitors](https://github.com/netdata/netdata/blob/master/src/go/collectors/go.d.plugin/modules/prometheus/integrations/iqair_airvisual_air_quality_monitors.md) +- [iqAir AirVisual air quality monitors](https://github.com/netdata/netdata/blob/master/src/go/plugin/go.d/modules/prometheus/integrations/iqair_airvisual_air_quality_monitors.md) ### Kubernetes -- [Cilium Agent](https://github.com/netdata/netdata/blob/master/src/go/collectors/go.d.plugin/modules/prometheus/integrations/cilium_agent.md) +- [Cilium Agent](https://github.com/netdata/netdata/blob/master/src/go/plugin/go.d/modules/prometheus/integrations/cilium_agent.md) -- [Cilium Operator](https://github.com/netdata/netdata/blob/master/src/go/collectors/go.d.plugin/modules/prometheus/integrations/cilium_operator.md) +- [Cilium Operator](https://github.com/netdata/netdata/blob/master/src/go/plugin/go.d/modules/prometheus/integrations/cilium_operator.md) -- [Cilium Proxy](https://github.com/netdata/netdata/blob/master/src/go/collectors/go.d.plugin/modules/prometheus/integrations/cilium_proxy.md) +- [Cilium Proxy](https://github.com/netdata/netdata/blob/master/src/go/plugin/go.d/modules/prometheus/integrations/cilium_proxy.md) -- [Kubelet](https://github.com/netdata/netdata/blob/master/src/go/collectors/go.d.plugin/modules/k8s_kubelet/integrations/kubelet.md) +- [Kubelet](https://github.com/netdata/netdata/blob/master/src/go/plugin/go.d/modules/k8s_kubelet/integrations/kubelet.md) -- [Kubeproxy](https://github.com/netdata/netdata/blob/master/src/go/collectors/go.d.plugin/modules/k8s_kubeproxy/integrations/kubeproxy.md) +- [Kubeproxy](https://github.com/netdata/netdata/blob/master/src/go/plugin/go.d/modules/k8s_kubeproxy/integrations/kubeproxy.md) -- [Kubernetes Cluster Cloud Cost](https://github.com/netdata/netdata/blob/master/src/go/collectors/go.d.plugin/modules/prometheus/integrations/kubernetes_cluster_cloud_cost.md) +- [Kubernetes Cluster Cloud Cost](https://github.com/netdata/netdata/blob/master/src/go/plugin/go.d/modules/prometheus/integrations/kubernetes_cluster_cloud_cost.md) -- [Kubernetes Cluster State](https://github.com/netdata/netdata/blob/master/src/go/collectors/go.d.plugin/modules/k8s_state/integrations/kubernetes_cluster_state.md) +- [Kubernetes Cluster State](https://github.com/netdata/netdata/blob/master/src/go/plugin/go.d/modules/k8s_state/integrations/kubernetes_cluster_state.md) - [Kubernetes Containers](https://github.com/netdata/netdata/blob/master/src/collectors/cgroups.plugin/integrations/kubernetes_containers.md) -- [Rancher](https://github.com/netdata/netdata/blob/master/src/go/collectors/go.d.plugin/modules/prometheus/integrations/rancher.md) +- [Rancher](https://github.com/netdata/netdata/blob/master/src/go/plugin/go.d/modules/prometheus/integrations/rancher.md) ### Linux Systems @@ -607,7 +607,7 @@ If you don't see the app/service you'd like to monitor in this list: - [Disk space](https://github.com/netdata/netdata/blob/master/src/collectors/diskspace.plugin/integrations/disk_space.md) -- [OpenRC](https://github.com/netdata/netdata/blob/master/src/go/collectors/go.d.plugin/modules/prometheus/integrations/openrc.md) +- [OpenRC](https://github.com/netdata/netdata/blob/master/src/go/plugin/go.d/modules/prometheus/integrations/openrc.md) #### CPU @@ -635,8 +635,6 @@ If you don't see the app/service you'd like to monitor in this list: - [ZFS Adaptive Replacement Cache](https://github.com/netdata/netdata/blob/master/src/collectors/proc.plugin/integrations/zfs_adaptive_replacement_cache.md) -- [ZFS Pools](https://github.com/netdata/netdata/blob/master/src/collectors/proc.plugin/integrations/zfs_pools.md) - #### Firewall - [Conntrack](https://github.com/netdata/netdata/blob/master/src/collectors/proc.plugin/integrations/conntrack.md) @@ -645,7 +643,7 @@ If you don't see the app/service you'd like to monitor in this list: - [Synproxy](https://github.com/netdata/netdata/blob/master/src/collectors/proc.plugin/integrations/synproxy.md) -- [nftables](https://github.com/netdata/netdata/blob/master/src/go/collectors/go.d.plugin/modules/prometheus/integrations/nftables.md) +- [nftables](https://github.com/netdata/netdata/blob/master/src/go/plugin/go.d/modules/prometheus/integrations/nftables.md) #### IPC @@ -679,7 +677,7 @@ If you don't see the app/service you'd like to monitor in this list: #### Network -- [Access Points](https://github.com/netdata/netdata/blob/master/src/collectors/charts.d.plugin/ap/integrations/access_points.md) +- [Access Points](https://github.com/netdata/netdata/blob/master/src/go/plugin/go.d/modules/ap/integrations/access_points.md) - [IP Virtual Server](https://github.com/netdata/netdata/blob/master/src/collectors/proc.plugin/integrations/ip_virtual_server.md) @@ -721,185 +719,177 @@ If you don't see the app/service you'd like to monitor in this list: ### Logs Servers -- [AuthLog](https://github.com/netdata/netdata/blob/master/src/go/collectors/go.d.plugin/modules/prometheus/integrations/authlog.md) +- [AuthLog](https://github.com/netdata/netdata/blob/master/src/go/plugin/go.d/modules/prometheus/integrations/authlog.md) -- [Fluentd](https://github.com/netdata/netdata/blob/master/src/go/collectors/go.d.plugin/modules/fluentd/integrations/fluentd.md) +- [Fluentd](https://github.com/netdata/netdata/blob/master/src/go/plugin/go.d/modules/fluentd/integrations/fluentd.md) -- [Graylog Server](https://github.com/netdata/netdata/blob/master/src/go/collectors/go.d.plugin/modules/prometheus/integrations/graylog_server.md) +- [Graylog Server](https://github.com/netdata/netdata/blob/master/src/go/plugin/go.d/modules/prometheus/integrations/graylog_server.md) -- [Logstash](https://github.com/netdata/netdata/blob/master/src/go/collectors/go.d.plugin/modules/logstash/integrations/logstash.md) +- [Logstash](https://github.com/netdata/netdata/blob/master/src/go/plugin/go.d/modules/logstash/integrations/logstash.md) -- [journald](https://github.com/netdata/netdata/blob/master/src/go/collectors/go.d.plugin/modules/prometheus/integrations/journald.md) +- [journald](https://github.com/netdata/netdata/blob/master/src/go/plugin/go.d/modules/prometheus/integrations/journald.md) -- [loki](https://github.com/netdata/netdata/blob/master/src/go/collectors/go.d.plugin/modules/prometheus/integrations/loki.md) +- [loki](https://github.com/netdata/netdata/blob/master/src/go/plugin/go.d/modules/prometheus/integrations/loki.md) -- [mtail](https://github.com/netdata/netdata/blob/master/src/go/collectors/go.d.plugin/modules/prometheus/integrations/mtail.md) +- [mtail](https://github.com/netdata/netdata/blob/master/src/go/plugin/go.d/modules/prometheus/integrations/mtail.md) ### macOS Systems -- [Apple Time Machine](https://github.com/netdata/netdata/blob/master/src/go/collectors/go.d.plugin/modules/prometheus/integrations/apple_time_machine.md) +- [Apple Time Machine](https://github.com/netdata/netdata/blob/master/src/go/plugin/go.d/modules/prometheus/integrations/apple_time_machine.md) - [macOS](https://github.com/netdata/netdata/blob/master/src/collectors/macos.plugin/integrations/macos.md) ### Mail Servers -- [DMARC](https://github.com/netdata/netdata/blob/master/src/go/collectors/go.d.plugin/modules/prometheus/integrations/dmarc.md) +- [DMARC](https://github.com/netdata/netdata/blob/master/src/go/plugin/go.d/modules/prometheus/integrations/dmarc.md) -- [Dovecot](https://github.com/netdata/netdata/blob/master/src/collectors/python.d.plugin/dovecot/integrations/dovecot.md) +- [Dovecot](https://github.com/netdata/netdata/blob/master/src/go/plugin/go.d/modules/dovecot/integrations/dovecot.md) -- [Exim](https://github.com/netdata/netdata/blob/master/src/collectors/python.d.plugin/exim/integrations/exim.md) +- [Exim](https://github.com/netdata/netdata/blob/master/src/go/plugin/go.d/modules/exim/integrations/exim.md) -- [Halon](https://github.com/netdata/netdata/blob/master/src/go/collectors/go.d.plugin/modules/prometheus/integrations/halon.md) +- [Halon](https://github.com/netdata/netdata/blob/master/src/go/plugin/go.d/modules/prometheus/integrations/halon.md) -- [Maildir](https://github.com/netdata/netdata/blob/master/src/go/collectors/go.d.plugin/modules/prometheus/integrations/maildir.md) +- [Maildir](https://github.com/netdata/netdata/blob/master/src/go/plugin/go.d/modules/prometheus/integrations/maildir.md) -- [Postfix](https://github.com/netdata/netdata/blob/master/src/collectors/python.d.plugin/postfix/integrations/postfix.md) +- [Postfix](https://github.com/netdata/netdata/blob/master/src/go/plugin/go.d/modules/postfix/integrations/postfix.md) ### Media Services -- [Discourse](https://github.com/netdata/netdata/blob/master/src/go/collectors/go.d.plugin/modules/prometheus/integrations/discourse.md) - -- [Icecast](https://github.com/netdata/netdata/blob/master/src/collectors/python.d.plugin/icecast/integrations/icecast.md) +- [Discourse](https://github.com/netdata/netdata/blob/master/src/go/plugin/go.d/modules/prometheus/integrations/discourse.md) -- [OBS Studio](https://github.com/netdata/netdata/blob/master/src/go/collectors/go.d.plugin/modules/prometheus/integrations/obs_studio.md) +- [Icecast](https://github.com/netdata/netdata/blob/master/src/go/plugin/go.d/modules/icecast/integrations/icecast.md) -- [RetroShare](https://github.com/netdata/netdata/blob/master/src/collectors/python.d.plugin/retroshare/integrations/retroshare.md) +- [OBS Studio](https://github.com/netdata/netdata/blob/master/src/go/plugin/go.d/modules/prometheus/integrations/obs_studio.md) -- [SABnzbd](https://github.com/netdata/netdata/blob/master/src/go/collectors/go.d.plugin/modules/prometheus/integrations/sabnzbd.md) +- [SABnzbd](https://github.com/netdata/netdata/blob/master/src/go/plugin/go.d/modules/prometheus/integrations/sabnzbd.md) -- [Stream](https://github.com/netdata/netdata/blob/master/src/go/collectors/go.d.plugin/modules/prometheus/integrations/stream.md) +- [Stream](https://github.com/netdata/netdata/blob/master/src/go/plugin/go.d/modules/prometheus/integrations/stream.md) -- [Twitch](https://github.com/netdata/netdata/blob/master/src/go/collectors/go.d.plugin/modules/prometheus/integrations/twitch.md) +- [Twitch](https://github.com/netdata/netdata/blob/master/src/go/plugin/go.d/modules/prometheus/integrations/twitch.md) -- [Zulip](https://github.com/netdata/netdata/blob/master/src/go/collectors/go.d.plugin/modules/prometheus/integrations/zulip.md) +- [Zulip](https://github.com/netdata/netdata/blob/master/src/go/plugin/go.d/modules/prometheus/integrations/zulip.md) ### Message Brokers -- [ActiveMQ](https://github.com/netdata/netdata/blob/master/src/go/collectors/go.d.plugin/modules/activemq/integrations/activemq.md) +- [ActiveMQ](https://github.com/netdata/netdata/blob/master/src/go/plugin/go.d/modules/activemq/integrations/activemq.md) -- [Apache Pulsar](https://github.com/netdata/netdata/blob/master/src/go/collectors/go.d.plugin/modules/pulsar/integrations/apache_pulsar.md) +- [Apache Pulsar](https://github.com/netdata/netdata/blob/master/src/go/plugin/go.d/modules/pulsar/integrations/apache_pulsar.md) -- [Beanstalk](https://github.com/netdata/netdata/blob/master/src/collectors/python.d.plugin/beanstalk/integrations/beanstalk.md) +- [Beanstalk](https://github.com/netdata/netdata/blob/master/src/go/plugin/go.d/modules/beanstalk/integrations/beanstalk.md) -- [IBM MQ](https://github.com/netdata/netdata/blob/master/src/go/collectors/go.d.plugin/modules/prometheus/integrations/ibm_mq.md) +- [IBM MQ](https://github.com/netdata/netdata/blob/master/src/go/plugin/go.d/modules/prometheus/integrations/ibm_mq.md) -- [Kafka Connect](https://github.com/netdata/netdata/blob/master/src/go/collectors/go.d.plugin/modules/prometheus/integrations/kafka_connect.md) +- [Kafka Connect](https://github.com/netdata/netdata/blob/master/src/go/plugin/go.d/modules/prometheus/integrations/kafka_connect.md) -- [Kafka ZooKeeper](https://github.com/netdata/netdata/blob/master/src/go/collectors/go.d.plugin/modules/prometheus/integrations/kafka_zookeeper.md) +- [Kafka ZooKeeper](https://github.com/netdata/netdata/blob/master/src/go/plugin/go.d/modules/prometheus/integrations/kafka_zookeeper.md) -- [Kafka](https://github.com/netdata/netdata/blob/master/src/go/collectors/go.d.plugin/modules/prometheus/integrations/kafka.md) +- [Kafka](https://github.com/netdata/netdata/blob/master/src/go/plugin/go.d/modules/prometheus/integrations/kafka.md) -- [MQTT Blackbox](https://github.com/netdata/netdata/blob/master/src/go/collectors/go.d.plugin/modules/prometheus/integrations/mqtt_blackbox.md) +- [MQTT Blackbox](https://github.com/netdata/netdata/blob/master/src/go/plugin/go.d/modules/prometheus/integrations/mqtt_blackbox.md) -- [RabbitMQ](https://github.com/netdata/netdata/blob/master/src/go/collectors/go.d.plugin/modules/rabbitmq/integrations/rabbitmq.md) +- [RabbitMQ](https://github.com/netdata/netdata/blob/master/src/go/plugin/go.d/modules/rabbitmq/integrations/rabbitmq.md) -- [Redis Queue](https://github.com/netdata/netdata/blob/master/src/go/collectors/go.d.plugin/modules/prometheus/integrations/redis_queue.md) +- [Redis Queue](https://github.com/netdata/netdata/blob/master/src/go/plugin/go.d/modules/prometheus/integrations/redis_queue.md) -- [VerneMQ](https://github.com/netdata/netdata/blob/master/src/go/collectors/go.d.plugin/modules/vernemq/integrations/vernemq.md) +- [VerneMQ](https://github.com/netdata/netdata/blob/master/src/go/plugin/go.d/modules/vernemq/integrations/vernemq.md) -- [XMPP Server](https://github.com/netdata/netdata/blob/master/src/go/collectors/go.d.plugin/modules/prometheus/integrations/xmpp_server.md) +- [XMPP Server](https://github.com/netdata/netdata/blob/master/src/go/plugin/go.d/modules/prometheus/integrations/xmpp_server.md) -- [mosquitto](https://github.com/netdata/netdata/blob/master/src/go/collectors/go.d.plugin/modules/prometheus/integrations/mosquitto.md) +- [mosquitto](https://github.com/netdata/netdata/blob/master/src/go/plugin/go.d/modules/prometheus/integrations/mosquitto.md) ### Networking Stack and Network Interfaces -- [8430FT modem](https://github.com/netdata/netdata/blob/master/src/go/collectors/go.d.plugin/modules/prometheus/integrations/8430ft_modem.md) +- [8430FT modem](https://github.com/netdata/netdata/blob/master/src/go/plugin/go.d/modules/prometheus/integrations/8430ft_modem.md) -- [A10 ACOS network devices](https://github.com/netdata/netdata/blob/master/src/go/collectors/go.d.plugin/modules/prometheus/integrations/a10_acos_network_devices.md) +- [A10 ACOS network devices](https://github.com/netdata/netdata/blob/master/src/go/plugin/go.d/modules/prometheus/integrations/a10_acos_network_devices.md) -- [Andrews & Arnold line status](https://github.com/netdata/netdata/blob/master/src/go/collectors/go.d.plugin/modules/prometheus/integrations/andrews_&_arnold_line_status.md) +- [Andrews & Arnold line status](https://github.com/netdata/netdata/blob/master/src/go/plugin/go.d/modules/prometheus/integrations/andrews_&_arnold_line_status.md) -- [Aruba devices](https://github.com/netdata/netdata/blob/master/src/go/collectors/go.d.plugin/modules/prometheus/integrations/aruba_devices.md) +- [Aruba devices](https://github.com/netdata/netdata/blob/master/src/go/plugin/go.d/modules/prometheus/integrations/aruba_devices.md) -- [Bird Routing Daemon](https://github.com/netdata/netdata/blob/master/src/go/collectors/go.d.plugin/modules/prometheus/integrations/bird_routing_daemon.md) +- [Bird Routing Daemon](https://github.com/netdata/netdata/blob/master/src/go/plugin/go.d/modules/prometheus/integrations/bird_routing_daemon.md) -- [Checkpoint device](https://github.com/netdata/netdata/blob/master/src/go/collectors/go.d.plugin/modules/prometheus/integrations/checkpoint_device.md) +- [Checkpoint device](https://github.com/netdata/netdata/blob/master/src/go/plugin/go.d/modules/prometheus/integrations/checkpoint_device.md) -- [Cisco ACI](https://github.com/netdata/netdata/blob/master/src/go/collectors/go.d.plugin/modules/prometheus/integrations/cisco_aci.md) +- [Cisco ACI](https://github.com/netdata/netdata/blob/master/src/go/plugin/go.d/modules/prometheus/integrations/cisco_aci.md) -- [Citrix NetScaler](https://github.com/netdata/netdata/blob/master/src/go/collectors/go.d.plugin/modules/prometheus/integrations/citrix_netscaler.md) +- [Citrix NetScaler](https://github.com/netdata/netdata/blob/master/src/go/plugin/go.d/modules/prometheus/integrations/citrix_netscaler.md) -- [DDWRT Routers](https://github.com/netdata/netdata/blob/master/src/go/collectors/go.d.plugin/modules/prometheus/integrations/ddwrt_routers.md) +- [DDWRT Routers](https://github.com/netdata/netdata/blob/master/src/go/plugin/go.d/modules/prometheus/integrations/ddwrt_routers.md) -- [FRRouting](https://github.com/netdata/netdata/blob/master/src/go/collectors/go.d.plugin/modules/prometheus/integrations/frrouting.md) +- [FRRouting](https://github.com/netdata/netdata/blob/master/src/go/plugin/go.d/modules/prometheus/integrations/frrouting.md) -- [Fortigate firewall](https://github.com/netdata/netdata/blob/master/src/go/collectors/go.d.plugin/modules/prometheus/integrations/fortigate_firewall.md) +- [Fortigate firewall](https://github.com/netdata/netdata/blob/master/src/go/plugin/go.d/modules/prometheus/integrations/fortigate_firewall.md) -- [Freifunk network](https://github.com/netdata/netdata/blob/master/src/go/collectors/go.d.plugin/modules/prometheus/integrations/freifunk_network.md) +- [Freifunk network](https://github.com/netdata/netdata/blob/master/src/go/plugin/go.d/modules/prometheus/integrations/freifunk_network.md) -- [Fritzbox network devices](https://github.com/netdata/netdata/blob/master/src/go/collectors/go.d.plugin/modules/prometheus/integrations/fritzbox_network_devices.md) +- [Fritzbox network devices](https://github.com/netdata/netdata/blob/master/src/go/plugin/go.d/modules/prometheus/integrations/fritzbox_network_devices.md) -- [Hitron CGN series CPE](https://github.com/netdata/netdata/blob/master/src/go/collectors/go.d.plugin/modules/prometheus/integrations/hitron_cgn_series_cpe.md) +- [Hitron CGN series CPE](https://github.com/netdata/netdata/blob/master/src/go/plugin/go.d/modules/prometheus/integrations/hitron_cgn_series_cpe.md) -- [Hitron CODA Cable Modem](https://github.com/netdata/netdata/blob/master/src/go/collectors/go.d.plugin/modules/prometheus/integrations/hitron_coda_cable_modem.md) +- [Hitron CODA Cable Modem](https://github.com/netdata/netdata/blob/master/src/go/plugin/go.d/modules/prometheus/integrations/hitron_coda_cable_modem.md) -- [Huawei devices](https://github.com/netdata/netdata/blob/master/src/go/collectors/go.d.plugin/modules/prometheus/integrations/huawei_devices.md) +- [Huawei devices](https://github.com/netdata/netdata/blob/master/src/go/plugin/go.d/modules/prometheus/integrations/huawei_devices.md) -- [Keepalived](https://github.com/netdata/netdata/blob/master/src/go/collectors/go.d.plugin/modules/prometheus/integrations/keepalived.md) +- [Keepalived](https://github.com/netdata/netdata/blob/master/src/go/plugin/go.d/modules/prometheus/integrations/keepalived.md) -- [Meraki dashboard](https://github.com/netdata/netdata/blob/master/src/go/collectors/go.d.plugin/modules/prometheus/integrations/meraki_dashboard.md) +- [Meraki dashboard](https://github.com/netdata/netdata/blob/master/src/go/plugin/go.d/modules/prometheus/integrations/meraki_dashboard.md) -- [MikroTik devices](https://github.com/netdata/netdata/blob/master/src/go/collectors/go.d.plugin/modules/prometheus/integrations/mikrotik_devices.md) +- [MikroTik devices](https://github.com/netdata/netdata/blob/master/src/go/plugin/go.d/modules/prometheus/integrations/mikrotik_devices.md) -- [Mikrotik RouterOS devices](https://github.com/netdata/netdata/blob/master/src/go/collectors/go.d.plugin/modules/prometheus/integrations/mikrotik_routeros_devices.md) +- [Mikrotik RouterOS devices](https://github.com/netdata/netdata/blob/master/src/go/plugin/go.d/modules/prometheus/integrations/mikrotik_routeros_devices.md) -- [NetFlow](https://github.com/netdata/netdata/blob/master/src/go/collectors/go.d.plugin/modules/prometheus/integrations/netflow.md) +- [NetFlow](https://github.com/netdata/netdata/blob/master/src/go/plugin/go.d/modules/prometheus/integrations/netflow.md) -- [NetMeter](https://github.com/netdata/netdata/blob/master/src/go/collectors/go.d.plugin/modules/prometheus/integrations/netmeter.md) +- [NetMeter](https://github.com/netdata/netdata/blob/master/src/go/plugin/go.d/modules/prometheus/integrations/netmeter.md) -- [Open vSwitch](https://github.com/netdata/netdata/blob/master/src/go/collectors/go.d.plugin/modules/prometheus/integrations/open_vswitch.md) +- [Open vSwitch](https://github.com/netdata/netdata/blob/master/src/go/plugin/go.d/modules/prometheus/integrations/open_vswitch.md) -- [OpenROADM devices](https://github.com/netdata/netdata/blob/master/src/go/collectors/go.d.plugin/modules/prometheus/integrations/openroadm_devices.md) +- [OpenROADM devices](https://github.com/netdata/netdata/blob/master/src/go/plugin/go.d/modules/prometheus/integrations/openroadm_devices.md) -- [RIPE Atlas](https://github.com/netdata/netdata/blob/master/src/go/collectors/go.d.plugin/modules/prometheus/integrations/ripe_atlas.md) +- [RIPE Atlas](https://github.com/netdata/netdata/blob/master/src/go/plugin/go.d/modules/prometheus/integrations/ripe_atlas.md) -- [SONiC NOS](https://github.com/netdata/netdata/blob/master/src/go/collectors/go.d.plugin/modules/prometheus/integrations/sonic_nos.md) +- [SONiC NOS](https://github.com/netdata/netdata/blob/master/src/go/plugin/go.d/modules/prometheus/integrations/sonic_nos.md) -- [SmartRG 808AC Cable Modem](https://github.com/netdata/netdata/blob/master/src/go/collectors/go.d.plugin/modules/prometheus/integrations/smartrg_808ac_cable_modem.md) +- [SmartRG 808AC Cable Modem](https://github.com/netdata/netdata/blob/master/src/go/plugin/go.d/modules/prometheus/integrations/smartrg_808ac_cable_modem.md) -- [Starlink (SpaceX)](https://github.com/netdata/netdata/blob/master/src/go/collectors/go.d.plugin/modules/prometheus/integrations/starlink_spacex.md) +- [Starlink (SpaceX)](https://github.com/netdata/netdata/blob/master/src/go/plugin/go.d/modules/prometheus/integrations/starlink_spacex.md) -- [Traceroute](https://github.com/netdata/netdata/blob/master/src/go/collectors/go.d.plugin/modules/prometheus/integrations/traceroute.md) +- [Traceroute](https://github.com/netdata/netdata/blob/master/src/go/plugin/go.d/modules/prometheus/integrations/traceroute.md) -- [Ubiquiti UFiber OLT](https://github.com/netdata/netdata/blob/master/src/go/collectors/go.d.plugin/modules/prometheus/integrations/ubiquiti_ufiber_olt.md) +- [Ubiquiti UFiber OLT](https://github.com/netdata/netdata/blob/master/src/go/plugin/go.d/modules/prometheus/integrations/ubiquiti_ufiber_olt.md) -- [Zyxel GS1200-8](https://github.com/netdata/netdata/blob/master/src/go/collectors/go.d.plugin/modules/prometheus/integrations/zyxel_gs1200-8.md) +- [Zyxel GS1200-8](https://github.com/netdata/netdata/blob/master/src/go/plugin/go.d/modules/prometheus/integrations/zyxel_gs1200-8.md) ### Incident Management -- [OTRS](https://github.com/netdata/netdata/blob/master/src/go/collectors/go.d.plugin/modules/prometheus/integrations/otrs.md) +- [OTRS](https://github.com/netdata/netdata/blob/master/src/go/plugin/go.d/modules/prometheus/integrations/otrs.md) -- [StatusPage](https://github.com/netdata/netdata/blob/master/src/go/collectors/go.d.plugin/modules/prometheus/integrations/statuspage.md) +- [StatusPage](https://github.com/netdata/netdata/blob/master/src/go/plugin/go.d/modules/prometheus/integrations/statuspage.md) ### Observability -- [Collectd](https://github.com/netdata/netdata/blob/master/src/go/collectors/go.d.plugin/modules/prometheus/integrations/collectd.md) +- [Collectd](https://github.com/netdata/netdata/blob/master/src/go/plugin/go.d/modules/prometheus/integrations/collectd.md) -- [Dynatrace](https://github.com/netdata/netdata/blob/master/src/go/collectors/go.d.plugin/modules/prometheus/integrations/dynatrace.md) +- [Dynatrace](https://github.com/netdata/netdata/blob/master/src/go/plugin/go.d/modules/prometheus/integrations/dynatrace.md) -- [Grafana](https://github.com/netdata/netdata/blob/master/src/go/collectors/go.d.plugin/modules/prometheus/integrations/grafana.md) +- [Grafana](https://github.com/netdata/netdata/blob/master/src/go/plugin/go.d/modules/prometheus/integrations/grafana.md) -- [Hubble](https://github.com/netdata/netdata/blob/master/src/go/collectors/go.d.plugin/modules/prometheus/integrations/hubble.md) +- [Hubble](https://github.com/netdata/netdata/blob/master/src/go/plugin/go.d/modules/prometheus/integrations/hubble.md) -- [Naemon](https://github.com/netdata/netdata/blob/master/src/go/collectors/go.d.plugin/modules/prometheus/integrations/naemon.md) +- [Naemon](https://github.com/netdata/netdata/blob/master/src/go/plugin/go.d/modules/prometheus/integrations/naemon.md) -- [Nagios](https://github.com/netdata/netdata/blob/master/src/go/collectors/go.d.plugin/modules/prometheus/integrations/nagios.md) +- [Nagios](https://github.com/netdata/netdata/blob/master/src/go/plugin/go.d/modules/prometheus/integrations/nagios.md) -- [New Relic](https://github.com/netdata/netdata/blob/master/src/go/collectors/go.d.plugin/modules/prometheus/integrations/new_relic.md) +- [New Relic](https://github.com/netdata/netdata/blob/master/src/go/plugin/go.d/modules/prometheus/integrations/new_relic.md) ### Other -- [Example collector](https://github.com/netdata/netdata/blob/master/src/collectors/python.d.plugin/example/integrations/example_collector.md) - -- [Files and directories](https://github.com/netdata/netdata/blob/master/src/go/collectors/go.d.plugin/modules/filecheck/integrations/files_and_directories.md) - -- [GitHub API rate limit](https://github.com/netdata/netdata/blob/master/src/go/collectors/go.d.plugin/modules/prometheus/integrations/github_api_rate_limit.md) - -- [GitHub repository](https://github.com/netdata/netdata/blob/master/src/go/collectors/go.d.plugin/modules/prometheus/integrations/github_repository.md) +- [Files and directories](https://github.com/netdata/netdata/blob/master/src/go/plugin/go.d/modules/filecheck/integrations/files_and_directories.md) -- [Netdata Agent alarms](https://github.com/netdata/netdata/blob/master/src/collectors/python.d.plugin/alarms/integrations/netdata_agent_alarms.md) +- [GitHub API rate limit](https://github.com/netdata/netdata/blob/master/src/go/plugin/go.d/modules/prometheus/integrations/github_api_rate_limit.md) -- [python.d changefinder](https://github.com/netdata/netdata/blob/master/src/collectors/python.d.plugin/changefinder/integrations/python.d_changefinder.md) +- [GitHub repository](https://github.com/netdata/netdata/blob/master/src/go/plugin/go.d/modules/prometheus/integrations/github_repository.md) - [python.d zscores](https://github.com/netdata/netdata/blob/master/src/collectors/python.d.plugin/zscores/integrations/python.d_zscores.md) @@ -907,7 +897,7 @@ If you don't see the app/service you'd like to monitor in this list: - [Applications](https://github.com/netdata/netdata/blob/master/src/collectors/apps.plugin/integrations/applications.md) -- [Supervisor](https://github.com/netdata/netdata/blob/master/src/go/collectors/go.d.plugin/modules/supervisord/integrations/supervisor.md) +- [Supervisor](https://github.com/netdata/netdata/blob/master/src/go/plugin/go.d/modules/supervisord/integrations/supervisor.md) - [User Groups](https://github.com/netdata/netdata/blob/master/src/collectors/apps.plugin/integrations/user_groups.md) @@ -915,153 +905,153 @@ If you don't see the app/service you'd like to monitor in this list: ### Provisioning Systems -- [BOSH](https://github.com/netdata/netdata/blob/master/src/go/collectors/go.d.plugin/modules/prometheus/integrations/bosh.md) +- [BOSH](https://github.com/netdata/netdata/blob/master/src/go/plugin/go.d/modules/prometheus/integrations/bosh.md) -- [Cloud Foundry Firehose](https://github.com/netdata/netdata/blob/master/src/go/collectors/go.d.plugin/modules/prometheus/integrations/cloud_foundry_firehose.md) +- [Cloud Foundry Firehose](https://github.com/netdata/netdata/blob/master/src/go/plugin/go.d/modules/prometheus/integrations/cloud_foundry_firehose.md) -- [Cloud Foundry](https://github.com/netdata/netdata/blob/master/src/go/collectors/go.d.plugin/modules/prometheus/integrations/cloud_foundry.md) +- [Cloud Foundry](https://github.com/netdata/netdata/blob/master/src/go/plugin/go.d/modules/prometheus/integrations/cloud_foundry.md) -- [Spacelift](https://github.com/netdata/netdata/blob/master/src/go/collectors/go.d.plugin/modules/prometheus/integrations/spacelift.md) +- [Spacelift](https://github.com/netdata/netdata/blob/master/src/go/plugin/go.d/modules/prometheus/integrations/spacelift.md) ### Search Engines -- [Elasticsearch](https://github.com/netdata/netdata/blob/master/src/go/collectors/go.d.plugin/modules/elasticsearch/integrations/elasticsearch.md) +- [Elasticsearch](https://github.com/netdata/netdata/blob/master/src/go/plugin/go.d/modules/elasticsearch/integrations/elasticsearch.md) -- [Meilisearch](https://github.com/netdata/netdata/blob/master/src/go/collectors/go.d.plugin/modules/prometheus/integrations/meilisearch.md) +- [Meilisearch](https://github.com/netdata/netdata/blob/master/src/go/plugin/go.d/modules/prometheus/integrations/meilisearch.md) -- [OpenSearch](https://github.com/netdata/netdata/blob/master/src/go/collectors/go.d.plugin/modules/elasticsearch/integrations/opensearch.md) +- [OpenSearch](https://github.com/netdata/netdata/blob/master/src/go/plugin/go.d/modules/elasticsearch/integrations/opensearch.md) -- [Sphinx](https://github.com/netdata/netdata/blob/master/src/go/collectors/go.d.plugin/modules/prometheus/integrations/sphinx.md) +- [Sphinx](https://github.com/netdata/netdata/blob/master/src/go/plugin/go.d/modules/prometheus/integrations/sphinx.md) ### Security Systems -- [Certificate Transparency](https://github.com/netdata/netdata/blob/master/src/go/collectors/go.d.plugin/modules/prometheus/integrations/certificate_transparency.md) +- [Certificate Transparency](https://github.com/netdata/netdata/blob/master/src/go/plugin/go.d/modules/prometheus/integrations/certificate_transparency.md) -- [ClamAV daemon](https://github.com/netdata/netdata/blob/master/src/go/collectors/go.d.plugin/modules/prometheus/integrations/clamav_daemon.md) +- [ClamAV daemon](https://github.com/netdata/netdata/blob/master/src/go/plugin/go.d/modules/prometheus/integrations/clamav_daemon.md) -- [Clamscan results](https://github.com/netdata/netdata/blob/master/src/go/collectors/go.d.plugin/modules/prometheus/integrations/clamscan_results.md) +- [Clamscan results](https://github.com/netdata/netdata/blob/master/src/go/plugin/go.d/modules/prometheus/integrations/clamscan_results.md) -- [Crowdsec](https://github.com/netdata/netdata/blob/master/src/go/collectors/go.d.plugin/modules/prometheus/integrations/crowdsec.md) +- [Crowdsec](https://github.com/netdata/netdata/blob/master/src/go/plugin/go.d/modules/prometheus/integrations/crowdsec.md) -- [Honeypot](https://github.com/netdata/netdata/blob/master/src/go/collectors/go.d.plugin/modules/prometheus/integrations/honeypot.md) +- [Honeypot](https://github.com/netdata/netdata/blob/master/src/go/plugin/go.d/modules/prometheus/integrations/honeypot.md) -- [Lynis audit reports](https://github.com/netdata/netdata/blob/master/src/go/collectors/go.d.plugin/modules/prometheus/integrations/lynis_audit_reports.md) +- [Lynis audit reports](https://github.com/netdata/netdata/blob/master/src/go/plugin/go.d/modules/prometheus/integrations/lynis_audit_reports.md) -- [OpenVAS](https://github.com/netdata/netdata/blob/master/src/go/collectors/go.d.plugin/modules/prometheus/integrations/openvas.md) +- [OpenVAS](https://github.com/netdata/netdata/blob/master/src/go/plugin/go.d/modules/prometheus/integrations/openvas.md) -- [Rspamd](https://github.com/netdata/netdata/blob/master/src/go/collectors/go.d.plugin/modules/rspamd/integrations/rspamd.md) +- [Rspamd](https://github.com/netdata/netdata/blob/master/src/go/plugin/go.d/modules/rspamd/integrations/rspamd.md) -- [SSL Certificate](https://github.com/netdata/netdata/blob/master/src/go/collectors/go.d.plugin/modules/prometheus/integrations/ssl_certificate.md) +- [SSL Certificate](https://github.com/netdata/netdata/blob/master/src/go/plugin/go.d/modules/prometheus/integrations/ssl_certificate.md) -- [Suricata](https://github.com/netdata/netdata/blob/master/src/go/collectors/go.d.plugin/modules/prometheus/integrations/suricata.md) +- [Suricata](https://github.com/netdata/netdata/blob/master/src/go/plugin/go.d/modules/prometheus/integrations/suricata.md) -- [Vault PKI](https://github.com/netdata/netdata/blob/master/src/go/collectors/go.d.plugin/modules/prometheus/integrations/vault_pki.md) +- [Vault PKI](https://github.com/netdata/netdata/blob/master/src/go/plugin/go.d/modules/prometheus/integrations/vault_pki.md) ### Service Discovery / Registry -- [Consul](https://github.com/netdata/netdata/blob/master/src/go/collectors/go.d.plugin/modules/consul/integrations/consul.md) +- [Consul](https://github.com/netdata/netdata/blob/master/src/go/plugin/go.d/modules/consul/integrations/consul.md) -- [Kafka Consumer Lag](https://github.com/netdata/netdata/blob/master/src/go/collectors/go.d.plugin/modules/prometheus/integrations/kafka_consumer_lag.md) +- [Kafka Consumer Lag](https://github.com/netdata/netdata/blob/master/src/go/plugin/go.d/modules/prometheus/integrations/kafka_consumer_lag.md) -- [ZooKeeper](https://github.com/netdata/netdata/blob/master/src/go/collectors/go.d.plugin/modules/zookeeper/integrations/zookeeper.md) +- [ZooKeeper](https://github.com/netdata/netdata/blob/master/src/go/plugin/go.d/modules/zookeeper/integrations/zookeeper.md) -- [etcd](https://github.com/netdata/netdata/blob/master/src/go/collectors/go.d.plugin/modules/prometheus/integrations/etcd.md) +- [etcd](https://github.com/netdata/netdata/blob/master/src/go/plugin/go.d/modules/prometheus/integrations/etcd.md) ### Storage, Mount Points and Filesystems -- [Adaptec RAID](https://github.com/netdata/netdata/blob/master/src/go/collectors/go.d.plugin/modules/adaptecraid/integrations/adaptec_raid.md) +- [Adaptec RAID](https://github.com/netdata/netdata/blob/master/src/go/plugin/go.d/modules/adaptecraid/integrations/adaptec_raid.md) -- [Altaro Backup](https://github.com/netdata/netdata/blob/master/src/go/collectors/go.d.plugin/modules/prometheus/integrations/altaro_backup.md) +- [Altaro Backup](https://github.com/netdata/netdata/blob/master/src/go/plugin/go.d/modules/prometheus/integrations/altaro_backup.md) -- [Borg backup](https://github.com/netdata/netdata/blob/master/src/go/collectors/go.d.plugin/modules/prometheus/integrations/borg_backup.md) +- [Borg backup](https://github.com/netdata/netdata/blob/master/src/go/plugin/go.d/modules/prometheus/integrations/borg_backup.md) -- [CVMFS clients](https://github.com/netdata/netdata/blob/master/src/go/collectors/go.d.plugin/modules/prometheus/integrations/cvmfs_clients.md) +- [CVMFS clients](https://github.com/netdata/netdata/blob/master/src/go/plugin/go.d/modules/prometheus/integrations/cvmfs_clients.md) - [Ceph](https://github.com/netdata/netdata/blob/master/src/collectors/python.d.plugin/ceph/integrations/ceph.md) -- [DMCache devices](https://github.com/netdata/netdata/blob/master/src/go/collectors/go.d.plugin/modules/dmcache/integrations/dmcache_devices.md) +- [DMCache devices](https://github.com/netdata/netdata/blob/master/src/go/plugin/go.d/modules/dmcache/integrations/dmcache_devices.md) -- [Dell EMC Isilon cluster](https://github.com/netdata/netdata/blob/master/src/go/collectors/go.d.plugin/modules/prometheus/integrations/dell_emc_isilon_cluster.md) +- [Dell EMC Isilon cluster](https://github.com/netdata/netdata/blob/master/src/go/plugin/go.d/modules/prometheus/integrations/dell_emc_isilon_cluster.md) -- [Dell EMC ScaleIO](https://github.com/netdata/netdata/blob/master/src/go/collectors/go.d.plugin/modules/scaleio/integrations/dell_emc_scaleio.md) +- [Dell EMC ScaleIO](https://github.com/netdata/netdata/blob/master/src/go/plugin/go.d/modules/scaleio/integrations/dell_emc_scaleio.md) -- [Dell EMC XtremIO cluster](https://github.com/netdata/netdata/blob/master/src/go/collectors/go.d.plugin/modules/prometheus/integrations/dell_emc_xtremio_cluster.md) +- [Dell EMC XtremIO cluster](https://github.com/netdata/netdata/blob/master/src/go/plugin/go.d/modules/prometheus/integrations/dell_emc_xtremio_cluster.md) -- [Dell PowerMax](https://github.com/netdata/netdata/blob/master/src/go/collectors/go.d.plugin/modules/prometheus/integrations/dell_powermax.md) +- [Dell PowerMax](https://github.com/netdata/netdata/blob/master/src/go/plugin/go.d/modules/prometheus/integrations/dell_powermax.md) -- [EOS](https://github.com/netdata/netdata/blob/master/src/go/collectors/go.d.plugin/modules/prometheus/integrations/eos.md) +- [EOS](https://github.com/netdata/netdata/blob/master/src/go/plugin/go.d/modules/prometheus/integrations/eos.md) -- [Generic storage enclosure tool](https://github.com/netdata/netdata/blob/master/src/go/collectors/go.d.plugin/modules/prometheus/integrations/generic_storage_enclosure_tool.md) +- [Generic storage enclosure tool](https://github.com/netdata/netdata/blob/master/src/go/plugin/go.d/modules/prometheus/integrations/generic_storage_enclosure_tool.md) -- [HDSentinel](https://github.com/netdata/netdata/blob/master/src/go/collectors/go.d.plugin/modules/prometheus/integrations/hdsentinel.md) +- [HDSentinel](https://github.com/netdata/netdata/blob/master/src/go/plugin/go.d/modules/prometheus/integrations/hdsentinel.md) -- [HPE Smart Arrays](https://github.com/netdata/netdata/blob/master/src/go/collectors/go.d.plugin/modules/hpssa/integrations/hpe_smart_arrays.md) +- [HPE Smart Arrays](https://github.com/netdata/netdata/blob/master/src/go/plugin/go.d/modules/hpssa/integrations/hpe_smart_arrays.md) -- [Hadoop Distributed File System (HDFS)](https://github.com/netdata/netdata/blob/master/src/go/collectors/go.d.plugin/modules/hdfs/integrations/hadoop_distributed_file_system_hdfs.md) +- [Hadoop Distributed File System (HDFS)](https://github.com/netdata/netdata/blob/master/src/go/plugin/go.d/modules/hdfs/integrations/hadoop_distributed_file_system_hdfs.md) -- [IBM Spectrum Virtualize](https://github.com/netdata/netdata/blob/master/src/go/collectors/go.d.plugin/modules/prometheus/integrations/ibm_spectrum_virtualize.md) +- [IBM Spectrum Virtualize](https://github.com/netdata/netdata/blob/master/src/go/plugin/go.d/modules/prometheus/integrations/ibm_spectrum_virtualize.md) -- [IBM Spectrum](https://github.com/netdata/netdata/blob/master/src/go/collectors/go.d.plugin/modules/prometheus/integrations/ibm_spectrum.md) +- [IBM Spectrum](https://github.com/netdata/netdata/blob/master/src/go/plugin/go.d/modules/prometheus/integrations/ibm_spectrum.md) -- [IPFS](https://github.com/netdata/netdata/blob/master/src/collectors/python.d.plugin/ipfs/integrations/ipfs.md) +- [IPFS](https://github.com/netdata/netdata/blob/master/src/go/plugin/go.d/modules/ipfs/integrations/ipfs.md) -- [LVM logical volumes](https://github.com/netdata/netdata/blob/master/src/go/collectors/go.d.plugin/modules/lvm/integrations/lvm_logical_volumes.md) +- [LVM logical volumes](https://github.com/netdata/netdata/blob/master/src/go/plugin/go.d/modules/lvm/integrations/lvm_logical_volumes.md) -- [Lagerist Disk latency](https://github.com/netdata/netdata/blob/master/src/go/collectors/go.d.plugin/modules/prometheus/integrations/lagerist_disk_latency.md) +- [Lagerist Disk latency](https://github.com/netdata/netdata/blob/master/src/go/plugin/go.d/modules/prometheus/integrations/lagerist_disk_latency.md) -- [MegaCLI MegaRAID](https://github.com/netdata/netdata/blob/master/src/go/collectors/go.d.plugin/modules/megacli/integrations/megacli_megaraid.md) +- [MegaCLI MegaRAID](https://github.com/netdata/netdata/blob/master/src/go/plugin/go.d/modules/megacli/integrations/megacli_megaraid.md) -- [MogileFS](https://github.com/netdata/netdata/blob/master/src/go/collectors/go.d.plugin/modules/prometheus/integrations/mogilefs.md) +- [MogileFS](https://github.com/netdata/netdata/blob/master/src/go/plugin/go.d/modules/prometheus/integrations/mogilefs.md) -- [NVMe devices](https://github.com/netdata/netdata/blob/master/src/go/collectors/go.d.plugin/modules/nvme/integrations/nvme_devices.md) +- [NVMe devices](https://github.com/netdata/netdata/blob/master/src/go/plugin/go.d/modules/nvme/integrations/nvme_devices.md) -- [NetApp Solidfire](https://github.com/netdata/netdata/blob/master/src/go/collectors/go.d.plugin/modules/prometheus/integrations/netapp_solidfire.md) +- [NetApp Solidfire](https://github.com/netdata/netdata/blob/master/src/go/plugin/go.d/modules/prometheus/integrations/netapp_solidfire.md) -- [Netapp ONTAP API](https://github.com/netdata/netdata/blob/master/src/go/collectors/go.d.plugin/modules/prometheus/integrations/netapp_ontap_api.md) +- [Netapp ONTAP API](https://github.com/netdata/netdata/blob/master/src/go/plugin/go.d/modules/prometheus/integrations/netapp_ontap_api.md) - [Samba](https://github.com/netdata/netdata/blob/master/src/collectors/python.d.plugin/samba/integrations/samba.md) -- [Starwind VSAN VSphere Edition](https://github.com/netdata/netdata/blob/master/src/go/collectors/go.d.plugin/modules/prometheus/integrations/starwind_vsan_vsphere_edition.md) +- [Starwind VSAN VSphere Edition](https://github.com/netdata/netdata/blob/master/src/go/plugin/go.d/modules/prometheus/integrations/starwind_vsan_vsphere_edition.md) -- [StoreCLI RAID](https://github.com/netdata/netdata/blob/master/src/go/collectors/go.d.plugin/modules/storcli/integrations/storecli_raid.md) +- [StoreCLI RAID](https://github.com/netdata/netdata/blob/master/src/go/plugin/go.d/modules/storcli/integrations/storecli_raid.md) -- [Storidge](https://github.com/netdata/netdata/blob/master/src/go/collectors/go.d.plugin/modules/prometheus/integrations/storidge.md) +- [Storidge](https://github.com/netdata/netdata/blob/master/src/go/plugin/go.d/modules/prometheus/integrations/storidge.md) -- [Synology ActiveBackup](https://github.com/netdata/netdata/blob/master/src/go/collectors/go.d.plugin/modules/prometheus/integrations/synology_activebackup.md) +- [Synology ActiveBackup](https://github.com/netdata/netdata/blob/master/src/go/plugin/go.d/modules/prometheus/integrations/synology_activebackup.md) -- [ZFS Pools](https://github.com/netdata/netdata/blob/master/src/go/collectors/go.d.plugin/modules/zfspool/integrations/zfs_pools.md) +- [ZFS Pools](https://github.com/netdata/netdata/blob/master/src/go/plugin/go.d/modules/zfspool/integrations/zfs_pools.md) ### Synthetic Checks -- [Blackbox](https://github.com/netdata/netdata/blob/master/src/go/collectors/go.d.plugin/modules/prometheus/integrations/blackbox.md) +- [Blackbox](https://github.com/netdata/netdata/blob/master/src/go/plugin/go.d/modules/prometheus/integrations/blackbox.md) -- [Domain expiration date](https://github.com/netdata/netdata/blob/master/src/go/collectors/go.d.plugin/modules/whoisquery/integrations/domain_expiration_date.md) +- [Domain expiration date](https://github.com/netdata/netdata/blob/master/src/go/plugin/go.d/modules/whoisquery/integrations/domain_expiration_date.md) -- [HTTP Endpoints](https://github.com/netdata/netdata/blob/master/src/go/collectors/go.d.plugin/modules/httpcheck/integrations/http_endpoints.md) +- [HTTP Endpoints](https://github.com/netdata/netdata/blob/master/src/go/plugin/go.d/modules/httpcheck/integrations/http_endpoints.md) - [IOPing](https://github.com/netdata/netdata/blob/master/src/collectors/ioping.plugin/integrations/ioping.md) - [Idle OS Jitter](https://github.com/netdata/netdata/blob/master/src/collectors/idlejitter.plugin/integrations/idle_os_jitter.md) -- [Monit](https://github.com/netdata/netdata/blob/master/src/collectors/python.d.plugin/monit/integrations/monit.md) +- [Monit](https://github.com/netdata/netdata/blob/master/src/go/plugin/go.d/modules/monit/integrations/monit.md) -- [Ping](https://github.com/netdata/netdata/blob/master/src/go/collectors/go.d.plugin/modules/ping/integrations/ping.md) +- [Ping](https://github.com/netdata/netdata/blob/master/src/go/plugin/go.d/modules/ping/integrations/ping.md) -- [Pingdom](https://github.com/netdata/netdata/blob/master/src/go/collectors/go.d.plugin/modules/prometheus/integrations/pingdom.md) +- [Pingdom](https://github.com/netdata/netdata/blob/master/src/go/plugin/go.d/modules/prometheus/integrations/pingdom.md) -- [Site 24x7](https://github.com/netdata/netdata/blob/master/src/go/collectors/go.d.plugin/modules/prometheus/integrations/site_24x7.md) +- [Site 24x7](https://github.com/netdata/netdata/blob/master/src/go/plugin/go.d/modules/prometheus/integrations/site_24x7.md) -- [TCP Endpoints](https://github.com/netdata/netdata/blob/master/src/go/collectors/go.d.plugin/modules/portcheck/integrations/tcp_endpoints.md) +- [TCP Endpoints](https://github.com/netdata/netdata/blob/master/src/go/plugin/go.d/modules/portcheck/integrations/tcp_endpoints.md) -- [Uptimerobot](https://github.com/netdata/netdata/blob/master/src/go/collectors/go.d.plugin/modules/prometheus/integrations/uptimerobot.md) +- [Uptimerobot](https://github.com/netdata/netdata/blob/master/src/go/plugin/go.d/modules/prometheus/integrations/uptimerobot.md) -- [X.509 certificate](https://github.com/netdata/netdata/blob/master/src/go/collectors/go.d.plugin/modules/x509check/integrations/x.509_certificate.md) +- [X.509 certificate](https://github.com/netdata/netdata/blob/master/src/go/plugin/go.d/modules/x509check/integrations/x.509_certificate.md) ### System Clock and NTP -- [Chrony](https://github.com/netdata/netdata/blob/master/src/go/collectors/go.d.plugin/modules/chrony/integrations/chrony.md) +- [Chrony](https://github.com/netdata/netdata/blob/master/src/go/plugin/go.d/modules/chrony/integrations/chrony.md) -- [NTPd](https://github.com/netdata/netdata/blob/master/src/go/collectors/go.d.plugin/modules/ntpd/integrations/ntpd.md) +- [NTPd](https://github.com/netdata/netdata/blob/master/src/go/plugin/go.d/modules/ntpd/integrations/ntpd.md) - [Timex](https://github.com/netdata/netdata/blob/master/src/collectors/timex.plugin/integrations/timex.md) @@ -1069,23 +1059,23 @@ If you don't see the app/service you'd like to monitor in this list: - [Systemd Services](https://github.com/netdata/netdata/blob/master/src/collectors/cgroups.plugin/integrations/systemd_services.md) -- [Systemd Units](https://github.com/netdata/netdata/blob/master/src/go/collectors/go.d.plugin/modules/systemdunits/integrations/systemd_units.md) +- [Systemd Units](https://github.com/netdata/netdata/blob/master/src/go/plugin/go.d/modules/systemdunits/integrations/systemd_units.md) -- [systemd-logind users](https://github.com/netdata/netdata/blob/master/src/go/collectors/go.d.plugin/modules/logind/integrations/systemd-logind_users.md) +- [systemd-logind users](https://github.com/netdata/netdata/blob/master/src/go/plugin/go.d/modules/logind/integrations/systemd-logind_users.md) ### Task Queues -- [Celery](https://github.com/netdata/netdata/blob/master/src/go/collectors/go.d.plugin/modules/prometheus/integrations/celery.md) +- [Celery](https://github.com/netdata/netdata/blob/master/src/go/plugin/go.d/modules/prometheus/integrations/celery.md) -- [Mesos](https://github.com/netdata/netdata/blob/master/src/go/collectors/go.d.plugin/modules/prometheus/integrations/mesos.md) +- [Mesos](https://github.com/netdata/netdata/blob/master/src/go/plugin/go.d/modules/prometheus/integrations/mesos.md) -- [Slurm](https://github.com/netdata/netdata/blob/master/src/go/collectors/go.d.plugin/modules/prometheus/integrations/slurm.md) +- [Slurm](https://github.com/netdata/netdata/blob/master/src/go/plugin/go.d/modules/prometheus/integrations/slurm.md) ### Telephony Servers -- [GTP](https://github.com/netdata/netdata/blob/master/src/go/collectors/go.d.plugin/modules/prometheus/integrations/gtp.md) +- [GTP](https://github.com/netdata/netdata/blob/master/src/go/plugin/go.d/modules/prometheus/integrations/gtp.md) -- [Kannel](https://github.com/netdata/netdata/blob/master/src/go/collectors/go.d.plugin/modules/prometheus/integrations/kannel.md) +- [Kannel](https://github.com/netdata/netdata/blob/master/src/go/plugin/go.d/modules/prometheus/integrations/kannel.md) - [OpenSIPS](https://github.com/netdata/netdata/blob/master/src/collectors/charts.d.plugin/opensips/integrations/opensips.md) @@ -1093,88 +1083,88 @@ If you don't see the app/service you'd like to monitor in this list: - [APC UPS](https://github.com/netdata/netdata/blob/master/src/collectors/charts.d.plugin/apcupsd/integrations/apc_ups.md) -- [Eaton UPS](https://github.com/netdata/netdata/blob/master/src/go/collectors/go.d.plugin/modules/prometheus/integrations/eaton_ups.md) +- [Eaton UPS](https://github.com/netdata/netdata/blob/master/src/go/plugin/go.d/modules/prometheus/integrations/eaton_ups.md) -- [UPS (NUT)](https://github.com/netdata/netdata/blob/master/src/go/collectors/go.d.plugin/modules/upsd/integrations/ups_nut.md) +- [UPS (NUT)](https://github.com/netdata/netdata/blob/master/src/go/plugin/go.d/modules/upsd/integrations/ups_nut.md) ### VPNs -- [Fastd](https://github.com/netdata/netdata/blob/master/src/go/collectors/go.d.plugin/modules/prometheus/integrations/fastd.md) +- [Fastd](https://github.com/netdata/netdata/blob/master/src/go/plugin/go.d/modules/prometheus/integrations/fastd.md) - [Libreswan](https://github.com/netdata/netdata/blob/master/src/collectors/charts.d.plugin/libreswan/integrations/libreswan.md) -- [OpenVPN status log](https://github.com/netdata/netdata/blob/master/src/go/collectors/go.d.plugin/modules/openvpn_status_log/integrations/openvpn_status_log.md) +- [OpenVPN status log](https://github.com/netdata/netdata/blob/master/src/go/plugin/go.d/modules/openvpn_status_log/integrations/openvpn_status_log.md) -- [OpenVPN](https://github.com/netdata/netdata/blob/master/src/go/collectors/go.d.plugin/modules/openvpn/integrations/openvpn.md) +- [OpenVPN](https://github.com/netdata/netdata/blob/master/src/go/plugin/go.d/modules/openvpn/integrations/openvpn.md) -- [SoftEther VPN Server](https://github.com/netdata/netdata/blob/master/src/go/collectors/go.d.plugin/modules/prometheus/integrations/softether_vpn_server.md) +- [SoftEther VPN Server](https://github.com/netdata/netdata/blob/master/src/go/plugin/go.d/modules/prometheus/integrations/softether_vpn_server.md) -- [Speedify CLI](https://github.com/netdata/netdata/blob/master/src/go/collectors/go.d.plugin/modules/prometheus/integrations/speedify_cli.md) +- [Speedify CLI](https://github.com/netdata/netdata/blob/master/src/go/plugin/go.d/modules/prometheus/integrations/speedify_cli.md) -- [Tor](https://github.com/netdata/netdata/blob/master/src/collectors/python.d.plugin/tor/integrations/tor.md) +- [Tor](https://github.com/netdata/netdata/blob/master/src/go/plugin/go.d/modules/tor/integrations/tor.md) -- [WireGuard](https://github.com/netdata/netdata/blob/master/src/go/collectors/go.d.plugin/modules/wireguard/integrations/wireguard.md) +- [WireGuard](https://github.com/netdata/netdata/blob/master/src/go/plugin/go.d/modules/wireguard/integrations/wireguard.md) -- [strongSwan](https://github.com/netdata/netdata/blob/master/src/go/collectors/go.d.plugin/modules/prometheus/integrations/strongswan.md) +- [strongSwan](https://github.com/netdata/netdata/blob/master/src/go/plugin/go.d/modules/prometheus/integrations/strongswan.md) ### Web Servers and Web Proxies -- [APIcast](https://github.com/netdata/netdata/blob/master/src/go/collectors/go.d.plugin/modules/prometheus/integrations/apicast.md) +- [APIcast](https://github.com/netdata/netdata/blob/master/src/go/plugin/go.d/modules/prometheus/integrations/apicast.md) -- [Apache](https://github.com/netdata/netdata/blob/master/src/go/collectors/go.d.plugin/modules/apache/integrations/apache.md) +- [Apache](https://github.com/netdata/netdata/blob/master/src/go/plugin/go.d/modules/apache/integrations/apache.md) -- [Clash](https://github.com/netdata/netdata/blob/master/src/go/collectors/go.d.plugin/modules/prometheus/integrations/clash.md) +- [Clash](https://github.com/netdata/netdata/blob/master/src/go/plugin/go.d/modules/prometheus/integrations/clash.md) -- [Cloudflare PCAP](https://github.com/netdata/netdata/blob/master/src/go/collectors/go.d.plugin/modules/prometheus/integrations/cloudflare_pcap.md) +- [Cloudflare PCAP](https://github.com/netdata/netdata/blob/master/src/go/plugin/go.d/modules/prometheus/integrations/cloudflare_pcap.md) -- [Envoy](https://github.com/netdata/netdata/blob/master/src/go/collectors/go.d.plugin/modules/envoy/integrations/envoy.md) +- [Envoy](https://github.com/netdata/netdata/blob/master/src/go/plugin/go.d/modules/envoy/integrations/envoy.md) -- [Gobetween](https://github.com/netdata/netdata/blob/master/src/go/collectors/go.d.plugin/modules/prometheus/integrations/gobetween.md) +- [Gobetween](https://github.com/netdata/netdata/blob/master/src/go/plugin/go.d/modules/prometheus/integrations/gobetween.md) -- [HAProxy](https://github.com/netdata/netdata/blob/master/src/go/collectors/go.d.plugin/modules/haproxy/integrations/haproxy.md) +- [HAProxy](https://github.com/netdata/netdata/blob/master/src/go/plugin/go.d/modules/haproxy/integrations/haproxy.md) -- [HHVM](https://github.com/netdata/netdata/blob/master/src/go/collectors/go.d.plugin/modules/prometheus/integrations/hhvm.md) +- [HHVM](https://github.com/netdata/netdata/blob/master/src/go/plugin/go.d/modules/prometheus/integrations/hhvm.md) -- [HTTPD](https://github.com/netdata/netdata/blob/master/src/go/collectors/go.d.plugin/modules/apache/integrations/httpd.md) +- [HTTPD](https://github.com/netdata/netdata/blob/master/src/go/plugin/go.d/modules/apache/integrations/httpd.md) -- [Lighttpd](https://github.com/netdata/netdata/blob/master/src/go/collectors/go.d.plugin/modules/lighttpd/integrations/lighttpd.md) +- [Lighttpd](https://github.com/netdata/netdata/blob/master/src/go/plugin/go.d/modules/lighttpd/integrations/lighttpd.md) -- [Litespeed](https://github.com/netdata/netdata/blob/master/src/go/collectors/go.d.plugin/modules/litespeed/integrations/litespeed.md) +- [Litespeed](https://github.com/netdata/netdata/blob/master/src/go/plugin/go.d/modules/litespeed/integrations/litespeed.md) -- [NGINX Plus](https://github.com/netdata/netdata/blob/master/src/go/collectors/go.d.plugin/modules/nginxplus/integrations/nginx_plus.md) +- [NGINX Plus](https://github.com/netdata/netdata/blob/master/src/go/plugin/go.d/modules/nginxplus/integrations/nginx_plus.md) -- [NGINX VTS](https://github.com/netdata/netdata/blob/master/src/go/collectors/go.d.plugin/modules/nginxvts/integrations/nginx_vts.md) +- [NGINX VTS](https://github.com/netdata/netdata/blob/master/src/go/plugin/go.d/modules/nginxvts/integrations/nginx_vts.md) -- [NGINX](https://github.com/netdata/netdata/blob/master/src/go/collectors/go.d.plugin/modules/nginx/integrations/nginx.md) +- [NGINX](https://github.com/netdata/netdata/blob/master/src/go/plugin/go.d/modules/nginx/integrations/nginx.md) -- [PHP-FPM](https://github.com/netdata/netdata/blob/master/src/go/collectors/go.d.plugin/modules/phpfpm/integrations/php-fpm.md) +- [PHP-FPM](https://github.com/netdata/netdata/blob/master/src/go/plugin/go.d/modules/phpfpm/integrations/php-fpm.md) -- [Squid log files](https://github.com/netdata/netdata/blob/master/src/go/collectors/go.d.plugin/modules/squidlog/integrations/squid_log_files.md) +- [Squid log files](https://github.com/netdata/netdata/blob/master/src/go/plugin/go.d/modules/squidlog/integrations/squid_log_files.md) -- [Squid](https://github.com/netdata/netdata/blob/master/src/collectors/python.d.plugin/squid/integrations/squid.md) +- [Squid](https://github.com/netdata/netdata/blob/master/src/go/plugin/go.d/modules/squid/integrations/squid.md) -- [Tengine](https://github.com/netdata/netdata/blob/master/src/go/collectors/go.d.plugin/modules/tengine/integrations/tengine.md) +- [Tengine](https://github.com/netdata/netdata/blob/master/src/go/plugin/go.d/modules/tengine/integrations/tengine.md) -- [Tomcat](https://github.com/netdata/netdata/blob/master/src/collectors/python.d.plugin/tomcat/integrations/tomcat.md) +- [Tomcat](https://github.com/netdata/netdata/blob/master/src/go/plugin/go.d/modules/tomcat/integrations/tomcat.md) -- [Traefik](https://github.com/netdata/netdata/blob/master/src/go/collectors/go.d.plugin/modules/traefik/integrations/traefik.md) +- [Traefik](https://github.com/netdata/netdata/blob/master/src/go/plugin/go.d/modules/traefik/integrations/traefik.md) - [Varnish](https://github.com/netdata/netdata/blob/master/src/collectors/python.d.plugin/varnish/integrations/varnish.md) -- [Web server log files](https://github.com/netdata/netdata/blob/master/src/go/collectors/go.d.plugin/modules/weblog/integrations/web_server_log_files.md) +- [Web server log files](https://github.com/netdata/netdata/blob/master/src/go/plugin/go.d/modules/weblog/integrations/web_server_log_files.md) -- [uWSGI](https://github.com/netdata/netdata/blob/master/src/collectors/python.d.plugin/uwsgi/integrations/uwsgi.md) +- [uWSGI](https://github.com/netdata/netdata/blob/master/src/go/plugin/go.d/modules/uwsgi/integrations/uwsgi.md) ### Windows Systems -- [Active Directory](https://github.com/netdata/netdata/blob/master/src/go/collectors/go.d.plugin/modules/windows/integrations/active_directory.md) +- [Active Directory](https://github.com/netdata/netdata/blob/master/src/go/plugin/go.d/modules/windows/integrations/active_directory.md) -- [HyperV](https://github.com/netdata/netdata/blob/master/src/go/collectors/go.d.plugin/modules/windows/integrations/hyperv.md) +- [HyperV](https://github.com/netdata/netdata/blob/master/src/go/plugin/go.d/modules/windows/integrations/hyperv.md) -- [MS Exchange](https://github.com/netdata/netdata/blob/master/src/go/collectors/go.d.plugin/modules/windows/integrations/ms_exchange.md) +- [MS Exchange](https://github.com/netdata/netdata/blob/master/src/go/plugin/go.d/modules/windows/integrations/ms_exchange.md) -- [MS SQL Server](https://github.com/netdata/netdata/blob/master/src/go/collectors/go.d.plugin/modules/windows/integrations/ms_sql_server.md) +- [MS SQL Server](https://github.com/netdata/netdata/blob/master/src/go/plugin/go.d/modules/windows/integrations/ms_sql_server.md) -- [NET Framework](https://github.com/netdata/netdata/blob/master/src/go/collectors/go.d.plugin/modules/windows/integrations/net_framework.md) +- [NET Framework](https://github.com/netdata/netdata/blob/master/src/go/plugin/go.d/modules/windows/integrations/net_framework.md) -- [Windows](https://github.com/netdata/netdata/blob/master/src/go/collectors/go.d.plugin/modules/windows/integrations/windows.md) +- [Windows](https://github.com/netdata/netdata/blob/master/src/go/plugin/go.d/modules/windows/integrations/windows.md) diff --git a/src/collectors/README.md b/src/collectors/README.md index dc043173c..0fd5983b7 100644 --- a/src/collectors/README.md +++ b/src/collectors/README.md @@ -50,7 +50,7 @@ specifics of what a given collector does. - **Orchestrators** are external plugins that run and manage one or more modules. They run as independent processes. The Go orchestrator is in active development. - - [go.d.plugin](/src/go/collectors/go.d.plugin/README.md): An orchestrator for data + - [go.d.plugin](/src/go/plugin/go.d/README.md): An orchestrator for data collection modules written in `go`. - [python.d.plugin](/src/collectors/python.d.plugin/README.md): diff --git a/src/collectors/REFERENCE.md b/src/collectors/REFERENCE.md index 648add3ce..e480a16d8 100644 --- a/src/collectors/REFERENCE.md +++ b/src/collectors/REFERENCE.md @@ -93,7 +93,7 @@ metrics, will automatically enable data collection for the application in questi When Netdata starts up, each collector searches for exposed metrics on the default endpoint established by that service or application's standard installation procedure. For example, -the [Nginx collector](/src/go/collectors/go.d.plugin/modules/nginx/README.md) searches at +the [Nginx collector](/src/go/plugin/go.d/modules/nginx/README.md) searches at `http://127.0.0.1/stub_status` for exposed metrics in the correct format. If an Nginx web server is running and exposes metrics on that endpoint, the collector begins gathering them. diff --git a/src/collectors/all.h b/src/collectors/all.h index 91bd9c230..3b96faa10 100644 --- a/src/collectors/all.h +++ b/src/collectors/all.h @@ -403,7 +403,6 @@ // Logs Management #define NETDATA_CHART_PRIO_LOGS_BASE 95000 // many charts -#define NETDATA_CHART_PRIO_LOGS_STATS_BASE 160000 // logsmanagement stats in "Netdata Monitoring" // PCI diff --git a/src/collectors/apps.plugin/apps_groups.conf b/src/collectors/apps.plugin/apps_groups.conf index 41b69ed69..724616c18 100644 --- a/src/collectors/apps.plugin/apps_groups.conf +++ b/src/collectors/apps.plugin/apps_groups.conf @@ -92,7 +92,6 @@ go.d.plugin: *go.d.plugin* slabinfo.plugin: *slabinfo.plugin* ebpf.plugin: *ebpf.plugin* debugfs.plugin: *debugfs.plugin* -logs-management.plugin: *logs-management.plugin* # agent-service-discovery agent_sd: agent_sd @@ -376,6 +375,12 @@ inetd: inetd xinetd # ----------------------------------------------------------------------------- # other application servers +i2pd: i2pd + +rethinkdb: rethinkdb + +beanstalkd: beanstalkd + rspamd: rspamd consul: consul diff --git a/src/collectors/apps.plugin/apps_output.c b/src/collectors/apps.plugin/apps_output.c index 0bf8e9ae0..84928e641 100644 --- a/src/collectors/apps.plugin/apps_output.c +++ b/src/collectors/apps.plugin/apps_output.c @@ -62,30 +62,6 @@ void send_resource_usage_to_netdata(usec_t dt) { "DIMENSION new_pids 'new pids' incremental 1 1\n" , update_every ); - - fprintf(stdout, - "CHART netdata.apps_fix '' 'Apps Plugin Normalization Ratios' 'percentage' apps.plugin netdata.apps_fix line 140002 %1$d\n" - "DIMENSION utime '' absolute 1 %2$llu\n" - "DIMENSION stime '' absolute 1 %2$llu\n" - "DIMENSION gtime '' absolute 1 %2$llu\n" - "DIMENSION minflt '' absolute 1 %2$llu\n" - "DIMENSION majflt '' absolute 1 %2$llu\n" - , update_every - , RATES_DETAIL - ); - - if(include_exited_childs) - fprintf(stdout, - "CHART netdata.apps_children_fix '' 'Apps Plugin Exited Children Normalization Ratios' 'percentage' apps.plugin netdata.apps_children_fix line 140003 %1$d\n" - "DIMENSION cutime '' absolute 1 %2$llu\n" - "DIMENSION cstime '' absolute 1 %2$llu\n" - "DIMENSION cgtime '' absolute 1 %2$llu\n" - "DIMENSION cminflt '' absolute 1 %2$llu\n" - "DIMENSION cmajflt '' absolute 1 %2$llu\n" - , update_every - , RATES_DETAIL - ); - } fprintf(stdout, @@ -118,39 +94,6 @@ void send_resource_usage_to_netdata(usec_t dt) { , apps_groups_targets_count , targets_assignment_counter ); - - fprintf(stdout, - "BEGIN netdata.apps_fix %"PRIu64"\n" - "SET utime = %u\n" - "SET stime = %u\n" - "SET gtime = %u\n" - "SET minflt = %u\n" - "SET majflt = %u\n" - "END\n" - , dt - , (unsigned int)(utime_fix_ratio * 100 * RATES_DETAIL) - , (unsigned int)(stime_fix_ratio * 100 * RATES_DETAIL) - , (unsigned int)(gtime_fix_ratio * 100 * RATES_DETAIL) - , (unsigned int)(minflt_fix_ratio * 100 * RATES_DETAIL) - , (unsigned int)(majflt_fix_ratio * 100 * RATES_DETAIL) - ); - - if(include_exited_childs) - fprintf(stdout, - "BEGIN netdata.apps_children_fix %"PRIu64"\n" - "SET cutime = %u\n" - "SET cstime = %u\n" - "SET cgtime = %u\n" - "SET cminflt = %u\n" - "SET cmajflt = %u\n" - "END\n" - , dt - , (unsigned int)(cutime_fix_ratio * 100 * RATES_DETAIL) - , (unsigned int)(cstime_fix_ratio * 100 * RATES_DETAIL) - , (unsigned int)(cgtime_fix_ratio * 100 * RATES_DETAIL) - , (unsigned int)(cminflt_fix_ratio * 100 * RATES_DETAIL) - , (unsigned int)(cmajflt_fix_ratio * 100 * RATES_DETAIL) - ); } void send_collected_data_to_netdata(struct target *root, const char *type, usec_t dt) { diff --git a/src/collectors/apps.plugin/apps_plugin.c b/src/collectors/apps.plugin/apps_plugin.c index b660f8171..8fe1ff008 100644 --- a/src/collectors/apps.plugin/apps_plugin.c +++ b/src/collectors/apps.plugin/apps_plugin.c @@ -51,7 +51,6 @@ size_t inodes_changed_counter = 0, links_changed_counter = 0, targets_assignment_counter = 0, - all_pids_count = 0, // the number of processes running apps_groups_targets_count = 0; // # of apps_groups.conf targets int @@ -136,20 +135,6 @@ struct target size_t pagesize; -struct pid_stat - *root_of_pids = NULL, // global list of all processes running - **all_pids = NULL; // to avoid allocations, we pre-allocate - // a pointer for each pid in the entire pid space. - -#if (ALL_PIDS_ARE_READ_INSTANTLY == 0) -// Another pre-allocated list of all possible pids. -// We need it to pids and assign them a unique sortlist id, so that we -// read parents before children. This is needed to prevent a situation where -// a child is found running, but until we read its parent, it has exited and -// its parent has accumulated its resources. -pid_t *all_pids_sortlist = NULL; -#endif - // ---------------------------------------------------------------------------- int managed_log(struct pid_stat *p, PID_LOG log, int status) { @@ -208,7 +193,7 @@ int managed_log(struct pid_stat *p, PID_LOG log, int status) { } } } - errno = 0; + errno_clear(); } else if(unlikely(p->log_thrown & log)) { // netdata_log_error("unsetting log %u on pid %d", log, p->pid); @@ -300,12 +285,14 @@ static void apply_apps_groups_targets_inheritance(void) { } // init goes always to default target - if(all_pids[INIT_PID] && !all_pids[INIT_PID]->matched_by_config) - all_pids[INIT_PID]->target = apps_groups_default_target; + struct pid_stat *pi = find_pid_entry(INIT_PID); + if(pi && !pi->matched_by_config) + pi->target = apps_groups_default_target; // pid 0 goes always to default target - if(all_pids[0] && !all_pids[INIT_PID]->matched_by_config) - all_pids[0]->target = apps_groups_default_target; + pi = find_pid_entry(0); + if(pi && !pi->matched_by_config) + pi->target = apps_groups_default_target; // give a default target on all top level processes if(unlikely(debug_enabled)) loops++; @@ -320,8 +307,9 @@ static void apply_apps_groups_targets_inheritance(void) { p->sortlist = sortlist++; } - if(all_pids[1]) - all_pids[1]->sortlist = sortlist++; + pi = find_pid_entry(1); + if(pi) + pi->sortlist = sortlist++; // give a target to all merged child processes found = 1; @@ -1052,12 +1040,7 @@ int main(int argc, char **argv) { netdata_log_info("started on pid %d", getpid()); users_and_groups_init(); - -#if (ALL_PIDS_ARE_READ_INSTANTLY == 0) - all_pids_sortlist = callocz(sizeof(pid_t), (size_t)pid_max + 1); -#endif - - all_pids = callocz(sizeof(struct pid_stat *), (size_t) pid_max + 1); + pids_init(); // ------------------------------------------------------------------------ // the event loop for functions diff --git a/src/collectors/apps.plugin/apps_plugin.h b/src/collectors/apps.plugin/apps_plugin.h index ce4d815ad..a085872d9 100644 --- a/src/collectors/apps.plugin/apps_plugin.h +++ b/src/collectors/apps.plugin/apps_plugin.h @@ -17,9 +17,7 @@ #include <sys/proc_info.h> #include <sys/sysctl.h> #include <mach/mach_time.h> // For mach_timebase_info_data_t and mach_timebase_info -#endif -#if defined(__APPLE__) extern mach_timebase_info_data_t mach_info; #endif @@ -47,7 +45,6 @@ struct pid_info { struct proc_taskinfo taskinfo; struct proc_bsdinfo bsdinfo; struct rusage_info_v4 rusageinfo; - }; #endif @@ -467,9 +464,7 @@ extern struct target *users_root_target, *groups_root_target; -extern struct pid_stat - *root_of_pids, - **all_pids; +extern struct pid_stat *root_of_pids; extern int update_every; extern unsigned int time_factor; @@ -559,4 +554,7 @@ void send_charts_updates_to_netdata(struct target *root, const char *type, const void send_collected_data_to_netdata(struct target *root, const char *type, usec_t dt); void send_resource_usage_to_netdata(usec_t dt); +void pids_init(void); +struct pid_stat *find_pid_entry(pid_t pid); + #endif //NETDATA_APPS_PLUGIN_H diff --git a/src/collectors/apps.plugin/apps_proc_pid_limits.c b/src/collectors/apps.plugin/apps_proc_pid_limits.c index a1e15f63c..7485086ba 100644 --- a/src/collectors/apps.plugin/apps_proc_pid_limits.c +++ b/src/collectors/apps.plugin/apps_proc_pid_limits.c @@ -33,7 +33,7 @@ static inline bool read_proc_pid_limits_per_os(struct pid_stat *p, void *ptr __m bool ret = false; bool read_limits = false; - errno = 0; + errno_clear(); proc_pid_limits_buffer[0] = '\0'; kernel_uint_t all_fds = pid_openfds_sum(p); diff --git a/src/collectors/apps.plugin/apps_proc_pids.c b/src/collectors/apps.plugin/apps_proc_pids.c index fd7e776fa..b53060d60 100644 --- a/src/collectors/apps.plugin/apps_proc_pids.c +++ b/src/collectors/apps.plugin/apps_proc_pids.c @@ -2,18 +2,44 @@ #include "apps_plugin.h" -static inline struct pid_stat *get_pid_entry(pid_t pid) { - if(likely(all_pids[pid])) - return all_pids[pid]; +static struct pid_stat **all_pids = NULL; +size_t all_pids_count = 0; // the number of processes running + +struct pid_stat *root_of_pids = NULL; // global linked list of all processes running + +#if (ALL_PIDS_ARE_READ_INSTANTLY == 0) +// Another pre-allocated list of all possible pids. +// We need it to assign them a unique sortlist id, so that we +// read parents before children. This is needed to prevent a situation where +// a child is found running, but until we read its parent, it has exited and +// its parent has accumulated its resources. +pid_t *all_pids_sortlist = NULL; +#endif + +void pids_init(void) { +#if (ALL_PIDS_ARE_READ_INSTANTLY == 0) + all_pids_sortlist = callocz(sizeof(pid_t), (size_t)pid_max + 1); +#endif + + all_pids = callocz(sizeof(struct pid_stat *), (size_t) pid_max + 1); +} - struct pid_stat *p = callocz(sizeof(struct pid_stat), 1); +inline struct pid_stat *find_pid_entry(pid_t pid) { + return all_pids[pid]; +} + +static inline struct pid_stat *get_or_allocate_pid_entry(pid_t pid) { + struct pid_stat *p = find_pid_entry(pid); + if(likely(p)) + return p; + + p = callocz(sizeof(struct pid_stat), 1); p->fds = mallocz(sizeof(struct pid_fd) * MAX_SPARE_FDS); p->fds_size = MAX_SPARE_FDS; init_pid_fds(p, 0, p->fds_size); p->pid = pid; DOUBLE_LINKED_LIST_APPEND_ITEM_UNSAFE(root_of_pids, p, prev, next); - all_pids[pid] = p; all_pids_count++; @@ -21,7 +47,7 @@ static inline struct pid_stat *get_pid_entry(pid_t pid) { } static inline void del_pid_entry(pid_t pid) { - struct pid_stat *p = all_pids[pid]; + struct pid_stat *p = find_pid_entry(pid); if(unlikely(!p)) { netdata_log_error("attempted to free pid %d that is not allocated.", pid); @@ -62,7 +88,7 @@ static inline int collect_data_for_pid(pid_t pid, void *ptr) { return 0; } - struct pid_stat *p = get_pid_entry(pid); + struct pid_stat *p = get_or_allocate_pid_entry(pid); if(unlikely(!p || p->read)) return 0; p->read = true; diff --git a/src/collectors/cgroups.plugin/cgroup-discovery.c b/src/collectors/cgroups.plugin/cgroup-discovery.c index 61d5c08ff..d880f8a71 100644 --- a/src/collectors/cgroups.plugin/cgroup-discovery.c +++ b/src/collectors/cgroups.plugin/cgroup-discovery.c @@ -178,11 +178,9 @@ static inline void discovery_rename_cgroup(struct cgroup *cg) { netdata_log_debug(D_CGROUP, "looking for the name of cgroup '%s' with chart id '%s'", cg->id, cg->chart_id); netdata_log_debug(D_CGROUP, "executing command %s \"%s\" for cgroup '%s'", cgroups_rename_script, cg->intermediate_id, cg->chart_id); - pid_t cgroup_pid; - FILE *fp_child_input, *fp_child_output; - (void)netdata_popen_raw_default_flags_and_environment(&cgroup_pid, &fp_child_input, &fp_child_output, cgroups_rename_script, cg->id, cg->intermediate_id); - if (!fp_child_output) { + POPEN_INSTANCE *instance = spawn_popen_run_variadic(cgroups_rename_script, cg->id, cg->intermediate_id, NULL); + if (!instance) { collector_error("CGROUP: cannot popen(%s \"%s\", \"r\").", cgroups_rename_script, cg->intermediate_id); cg->pending_renames = 0; cg->processed = 1; @@ -190,8 +188,8 @@ static inline void discovery_rename_cgroup(struct cgroup *cg) { } char buffer[CGROUP_CHARTID_LINE_MAX + 1]; - char *new_name = fgets(buffer, CGROUP_CHARTID_LINE_MAX, fp_child_output); - int exit_code = netdata_pclose(fp_child_input, fp_child_output, cgroup_pid); + char *new_name = fgets(buffer, CGROUP_CHARTID_LINE_MAX, instance->child_stdout_fp); + int exit_code = spawn_popen_wait(instance); switch (exit_code) { case 0: @@ -1085,7 +1083,6 @@ static void cgroup_cleanup_ebpf_integration() static inline void read_cgroup_network_interfaces(struct cgroup *cg) { netdata_log_debug(D_CGROUP, "looking for the network interfaces of cgroup '%s' with chart id '%s'", cg->id, cg->chart_id); - pid_t cgroup_pid; char cgroup_identifier[CGROUP_NETWORK_INTERFACE_MAX_LINE + 1]; if(!(cg->options & CGROUP_OPTIONS_IS_UNIFIED)) { @@ -1096,16 +1093,15 @@ static inline void read_cgroup_network_interfaces(struct cgroup *cg) { } netdata_log_debug(D_CGROUP, "executing cgroup_identifier %s --cgroup '%s' for cgroup '%s'", cgroups_network_interface_script, cgroup_identifier, cg->id); - FILE *fp_child_input, *fp_child_output; - (void)netdata_popen_raw_default_flags_and_environment(&cgroup_pid, &fp_child_input, &fp_child_output, cgroups_network_interface_script, "--cgroup", cgroup_identifier); - if(!fp_child_output) { + POPEN_INSTANCE *instance = spawn_popen_run_variadic(cgroups_network_interface_script, "--cgroup", cgroup_identifier, NULL); + if(!instance) { collector_error("CGROUP: cannot popen(%s --cgroup \"%s\", \"r\").", cgroups_network_interface_script, cgroup_identifier); return; } char *s; char buffer[CGROUP_NETWORK_INTERFACE_MAX_LINE + 1]; - while((s = fgets(buffer, CGROUP_NETWORK_INTERFACE_MAX_LINE, fp_child_output))) { + while((s = fgets(buffer, CGROUP_NETWORK_INTERFACE_MAX_LINE, instance->child_stdout_fp))) { trim(s); if(*s && *s != '\n') { @@ -1145,7 +1141,7 @@ static inline void read_cgroup_network_interfaces(struct cgroup *cg) { } } - netdata_pclose(fp_child_input, fp_child_output, cgroup_pid); + spawn_popen_wait(instance); } static inline void discovery_process_cgroup(struct cgroup *cg) { diff --git a/src/collectors/cgroups.plugin/cgroup-network.c b/src/collectors/cgroups.plugin/cgroup-network.c index 685282e89..4cb5cbabe 100644 --- a/src/collectors/cgroups.plugin/cgroup-network.c +++ b/src/collectors/cgroups.plugin/cgroup-network.c @@ -421,19 +421,19 @@ void detect_veth_interfaces(pid_t pid) { host = read_proc_net_dev("host", netdata_configured_host_prefix); if(!host) { - errno = 0; + errno_clear(); collector_error("cannot read host interface list."); goto cleanup; } if(!eligible_ifaces(host)) { - errno = 0; + errno_clear(); collector_info("there are no double-linked host interfaces available."); goto cleanup; } if(switch_namespace(netdata_configured_host_prefix, pid)) { - errno = 0; + errno_clear(); collector_error("cannot switch to the namespace of pid %u", (unsigned int) pid); goto cleanup; } @@ -444,13 +444,13 @@ void detect_veth_interfaces(pid_t pid) { cgroup = read_proc_net_dev("cgroup", NULL); if(!cgroup) { - errno = 0; + errno_clear(); collector_error("cannot read cgroup interface list."); goto cleanup; } if(!eligible_ifaces(cgroup)) { - errno = 0; + errno_clear(); collector_error("there are not double-linked cgroup interfaces available."); goto cleanup; } @@ -505,22 +505,20 @@ void call_the_helper(pid_t pid, const char *cgroup) { collector_info("running: %s", command); - pid_t cgroup_pid; - FILE *fp_child_input, *fp_child_output; + POPEN_INSTANCE *pi; - if(cgroup) { - (void)netdata_popen_raw_default_flags(&cgroup_pid, environment, &fp_child_input, &fp_child_output, PLUGINS_DIR "/cgroup-network-helper.sh", "--cgroup", cgroup); - } + if(cgroup) + pi = spawn_popen_run_variadic(PLUGINS_DIR "/cgroup-network-helper.sh", "--cgroup", cgroup, NULL); else { char buffer[100]; snprintfz(buffer, sizeof(buffer) - 1, "%d", pid); - (void)netdata_popen_raw_default_flags(&cgroup_pid, environment, &fp_child_input, &fp_child_output, PLUGINS_DIR "/cgroup-network-helper.sh", "--pid", buffer); + pi = spawn_popen_run_variadic(PLUGINS_DIR "/cgroup-network-helper.sh", "--pid", buffer, NULL); } - if(fp_child_output) { + if(pi) { char buffer[CGROUP_NETWORK_INTERFACE_MAX_LINE + 1]; char *s; - while((s = fgets(buffer, CGROUP_NETWORK_INTERFACE_MAX_LINE, fp_child_output))) { + while((s = fgets(buffer, CGROUP_NETWORK_INTERFACE_MAX_LINE, pi->child_stdout_fp))) { trim(s); if(*s && *s != '\n') { @@ -536,7 +534,7 @@ void call_the_helper(pid_t pid, const char *cgroup) { } } - netdata_pclose(fp_child_input, fp_child_output, cgroup_pid); + spawn_popen_kill(pi); } else collector_error("cannot execute cgroup-network helper script: %s", command); @@ -701,7 +699,7 @@ int main(int argc, char **argv) { pid = atoi(argv[arg+1]); if(pid <= 0) { - errno = 0; + errno_clear(); collector_error("Invalid pid %d given", (int) pid); return 2; } @@ -719,7 +717,7 @@ int main(int argc, char **argv) { if(helper) call_the_helper(pid, cgroup); if(pid <= 0 && !detected_devices) { - errno = 0; + errno_clear(); collector_error("Cannot find a cgroup PID from cgroup '%s'", cgroup); } } diff --git a/src/collectors/cgroups.plugin/sys_fs_cgroup.c b/src/collectors/cgroups.plugin/sys_fs_cgroup.c index 592152401..5fdefa863 100644 --- a/src/collectors/cgroups.plugin/sys_fs_cgroup.c +++ b/src/collectors/cgroups.plugin/sys_fs_cgroup.c @@ -73,30 +73,19 @@ struct discovery_thread discovery_thread; #define MAXSIZE_PROC_CMDLINE 4096 static enum cgroups_systemd_setting cgroups_detect_systemd(const char *exec) { - pid_t command_pid; enum cgroups_systemd_setting retval = SYSTEMD_CGROUP_ERR; char buf[MAXSIZE_PROC_CMDLINE]; char *begin, *end; - FILE *fp_child_input; - FILE *fp_child_output = netdata_popen(exec, &command_pid, &fp_child_input); - - if (!fp_child_output) - return retval; - - int fd = fileno(fp_child_output); - if (fd == -1 ) { - collector_error("Cannot get the output of \"%s\": failed to get file descriptor", exec); - netdata_pclose(fp_child_input, fp_child_output, command_pid); + POPEN_INSTANCE *pi = spawn_popen_run(exec); + if(!pi) return retval; - } struct pollfd pfd; - pfd.fd = fd; + pfd.fd = spawn_server_instance_read_fd(pi->si); pfd.events = POLLIN; int timeout = 3000; // milliseconds - int ret = poll(&pfd, 1, timeout); if (ret == -1) { @@ -104,7 +93,7 @@ static enum cgroups_systemd_setting cgroups_detect_systemd(const char *exec) } else if (ret == 0) { collector_info("Cannot get the output of \"%s\" within timeout (%d ms)", exec, timeout); } else { - while (fgets(buf, MAXSIZE_PROC_CMDLINE, fp_child_output) != NULL) { + while (fgets(buf, MAXSIZE_PROC_CMDLINE, pi->child_stdout_fp) != NULL) { if ((begin = strstr(buf, SYSTEMD_HIERARCHY_STRING))) { end = begin = begin + strlen(SYSTEMD_HIERARCHY_STRING); if (!*begin) @@ -123,7 +112,7 @@ static enum cgroups_systemd_setting cgroups_detect_systemd(const char *exec) } } - if (netdata_pclose(fp_child_input, fp_child_output, command_pid)) + if(spawn_popen_wait(pi) != 0) return SYSTEMD_CGROUP_ERR; return retval; @@ -131,41 +120,56 @@ static enum cgroups_systemd_setting cgroups_detect_systemd(const char *exec) static enum cgroups_type cgroups_try_detect_version() { - pid_t command_pid; + char filename[FILENAME_MAX + 1]; + snprintfz(filename, FILENAME_MAX, "%s%s", netdata_configured_host_prefix, "/sys/fs/cgroup"); + struct statfs fsinfo; + + // https://github.com/systemd/systemd/blob/main/docs/CGROUP_DELEGATION.md#three-different-tree-setups- + // ├── statfs("/sys/fs/cgroup/") + // │ └── .f_type + // │ ├── CGROUP2_SUPER_MAGIC (Unified mode) + // │ └── TMPFS_MAGIC (Legacy or Hybrid mode) + // ├── statfs("/sys/fs/cgroup/unified/") + // │ └── .f_type + // │ ├── CGROUP2_SUPER_MAGIC (Hybrid mode) + // │ └── Otherwise, you're in legacy mode + if (!statfs(filename, &fsinfo)) { +#if defined CGROUP2_SUPER_MAGIC + if (fsinfo.f_type == CGROUP2_SUPER_MAGIC) + return CGROUPS_V2; +#endif +#if defined TMPFS_MAGIC + if (fsinfo.f_type == TMPFS_MAGIC) { + // either hybrid or legacy + return CGROUPS_V1; + } +#endif + } + + collector_info("cgroups version: can't detect using statfs (fs type), falling back to heuristics."); + char buf[MAXSIZE_PROC_CMDLINE]; enum cgroups_systemd_setting systemd_setting; int cgroups2_available = 0; // 1. check if cgroups2 available on system at all - FILE *fp_child_input; - FILE *fp_child_output = netdata_popen("grep cgroup /proc/filesystems", &command_pid, &fp_child_input); - if (!fp_child_output) { - collector_error("popen failed"); + POPEN_INSTANCE *instance = spawn_popen_run("grep cgroup /proc/filesystems"); + if(!instance) { + collector_error("cannot run 'grep cgroup /proc/filesystems'"); return CGROUPS_AUTODETECT_FAIL; } - while (fgets(buf, MAXSIZE_PROC_CMDLINE, fp_child_output) != NULL) { + while (fgets(buf, MAXSIZE_PROC_CMDLINE, instance->child_stdout_fp) != NULL) { if (strstr(buf, "cgroup2")) { cgroups2_available = 1; break; } } - if(netdata_pclose(fp_child_input, fp_child_output, command_pid)) + if(spawn_popen_wait(instance) != 0) return CGROUPS_AUTODETECT_FAIL; if(!cgroups2_available) return CGROUPS_V1; -#if defined CGROUP2_SUPER_MAGIC - // 2. check filesystem type for the default mountpoint - char filename[FILENAME_MAX + 1]; - snprintfz(filename, FILENAME_MAX, "%s%s", netdata_configured_host_prefix, "/sys/fs/cgroup"); - struct statfs fsinfo; - if (!statfs(filename, &fsinfo)) { - if (fsinfo.f_type == CGROUP2_SUPER_MAGIC) - return CGROUPS_V2; - } -#endif - // 3. check systemd compiletime setting if ((systemd_setting = cgroups_detect_systemd("systemd --version")) == SYSTEMD_CGROUP_ERR) systemd_setting = cgroups_detect_systemd(SYSTEMD_CMD_RHEL); diff --git a/src/collectors/charts.d.plugin/ap/ap.chart.sh b/src/collectors/charts.d.plugin/ap/ap.chart.sh deleted file mode 100644 index 80c9dc602..000000000 --- a/src/collectors/charts.d.plugin/ap/ap.chart.sh +++ /dev/null @@ -1,179 +0,0 @@ -# shellcheck shell=bash -# no need for shebang - this file is loaded from charts.d.plugin -# SPDX-License-Identifier: GPL-3.0-or-later - -# netdata -# real-time performance and health monitoring, done right! -# (C) 2016 Costa Tsaousis <costa@tsaousis.gr> -# - -# _update_every is a special variable - it holds the number of seconds -# between the calls of the _update() function -ap_update_every= -ap_priority=6900 - -declare -A ap_devs=() - -# _check is called once, to find out if this chart should be enabled or not -ap_check() { - require_cmd iw || return 1 - local ev - ev=$(run iw dev | awk ' - BEGIN { - i = ""; - ssid = ""; - ap = 0; - } - /^[ \t]+Interface / { - if( ap == 1 ) { - print "ap_devs[" i "]=\"" ssid "\"" - } - - i = $2; - ssid = ""; - ap = 0; - } - /^[ \t]+ssid / { ssid = $2; } - /^[ \t]+type AP$/ { ap = 1; } - END { - if( ap == 1 ) { - print "ap_devs[" i "]=\"" ssid "\"" - } - } - ') - eval "${ev}" - - # this should return: - # - 0 to enable the chart - # - 1 to disable the chart - - [ ${#ap_devs[@]} -gt 0 ] && return 0 - error "no devices found in AP mode, with 'iw dev'" - return 1 -} - -# _create is called once, to create the charts -ap_create() { - local ssid dev - - for dev in "${!ap_devs[@]}"; do - ssid="${ap_devs[${dev}]}" - - # create the chart with 3 dimensions - cat << EOF -CHART ap_clients.${dev} '' "Connected clients to ${ssid} on ${dev}" "clients" ${dev} ap.clients line $((ap_priority + 1)) $ap_update_every '' '' 'ap' -DIMENSION clients '' absolute 1 1 - -CHART ap_bandwidth.${dev} '' "Bandwidth for ${ssid} on ${dev}" "kilobits/s" ${dev} ap.net area $((ap_priority + 2)) $ap_update_every '' '' 'ap' -DIMENSION received '' incremental 8 1024 -DIMENSION sent '' incremental -8 1024 - -CHART ap_packets.${dev} '' "Packets for ${ssid} on ${dev}" "packets/s" ${dev} ap.packets line $((ap_priority + 3)) $ap_update_every '' '' 'ap' -DIMENSION received '' incremental 1 1 -DIMENSION sent '' incremental -1 1 - -CHART ap_issues.${dev} '' "Transmit Issues for ${ssid} on ${dev}" "issues/s" ${dev} ap.issues line $((ap_priority + 4)) $ap_update_every '' '' 'ap' -DIMENSION retries 'tx retries' incremental 1 1 -DIMENSION failures 'tx failures' incremental -1 1 - -CHART ap_signal.${dev} '' "Average Signal for ${ssid} on ${dev}" "dBm" ${dev} ap.signal line $((ap_priority + 5)) $ap_update_every '' '' 'ap' -DIMENSION signal 'average signal' absolute 1 1000 - -CHART ap_bitrate.${dev} '' "Bitrate for ${ssid} on ${dev}" "Mbps" ${dev} ap.bitrate line $((ap_priority + 6)) $ap_update_every '' '' 'ap' -DIMENSION receive '' absolute 1 1000 -DIMENSION transmit '' absolute -1 1000 -DIMENSION expected 'expected throughput' absolute 1 1000 -EOF - done - - return 0 -} - -# _update is called continuously, to collect the values -ap_update() { - # the first argument to this function is the microseconds since last update - # pass this parameter to the BEGIN statement (see below). - - # do all the work to collect / calculate the values - # for each dimension - # remember: KEEP IT SIMPLE AND SHORT - - for dev in "${!ap_devs[@]}"; do - echo - echo "DEVICE ${dev}" - iw "${dev}" station dump - done | awk ' - function zero_data() { - dev = ""; - c = 0; - rb = 0; - tb = 0; - rp = 0; - tp = 0; - tr = 0; - tf = 0; - tt = 0; - rt = 0; - s = 0; - g = 0; - e = 0; - } - function print_device() { - if(dev != "" && length(dev) > 0) { - print "BEGIN ap_clients." dev; - print "SET clients = " c; - print "END"; - print "BEGIN ap_bandwidth." dev; - print "SET received = " rb; - print "SET sent = " tb; - print "END"; - print "BEGIN ap_packets." dev; - print "SET received = " rp; - print "SET sent = " tp; - print "END"; - print "BEGIN ap_issues." dev; - print "SET retries = " tr; - print "SET failures = " tf; - print "END"; - - if( c == 0 ) c = 1; - print "BEGIN ap_signal." dev; - print "SET signal = " int(s / c); - print "END"; - print "BEGIN ap_bitrate." dev; - print "SET receive = " int(rt / c); - print "SET transmit = " int(tt / c); - print "SET expected = " int(e / c); - print "END"; - } - zero_data(); - } - BEGIN { - zero_data(); - } - /^DEVICE / { - print_device(); - dev = $2; - } - /^Station/ { c++; } - /^[ \t]+rx bytes:/ { rb += $3; } - /^[ \t]+tx bytes:/ { tb += $3; } - /^[ \t]+rx packets:/ { rp += $3; } - /^[ \t]+tx packets:/ { tp += $3; } - /^[ \t]+tx retries:/ { tr += $3; } - /^[ \t]+tx failed:/ { tf += $3; } - /^[ \t]+signal:/ { x = $2; s += x * 1000; } - /^[ \t]+rx bitrate:/ { x = $3; rt += x * 1000; } - /^[ \t]+tx bitrate:/ { x = $3; tt += x * 1000; } - /^[ \t]+expected throughput:(.*)Mbps/ { - x=$3; - sub(/Mbps/, "", x); - e += x * 1000; - } - END { - print_device(); - } - ' - - return 0 -} diff --git a/src/collectors/charts.d.plugin/ap/ap.conf b/src/collectors/charts.d.plugin/ap/ap.conf deleted file mode 100644 index 38fc157ce..000000000 --- a/src/collectors/charts.d.plugin/ap/ap.conf +++ /dev/null @@ -1,23 +0,0 @@ -# no need for shebang - this file is loaded from charts.d.plugin - -# netdata -# real-time performance and health monitoring, done right! -# (C) 2018 Costa Tsaousis <costa@tsaousis.gr> -# GPL v3+ - -# nothing fancy to configure. -# this module will run -# iw dev - to find wireless devices in AP mode -# iw ${dev} station dump - to get connected clients -# based on the above, it generates several charts - -# the data collection frequency -# if unset, will inherit the netdata update frequency -#ap_update_every= - -# the charts priority on the dashboard -#ap_priority=6900 - -# the number of retries to do in case of failure -# before disabling the module -#ap_retries=10 diff --git a/src/collectors/charts.d.plugin/ap/integrations/access_points.md b/src/collectors/charts.d.plugin/ap/integrations/access_points.md deleted file mode 100644 index 7eea0f95a..000000000 --- a/src/collectors/charts.d.plugin/ap/integrations/access_points.md +++ /dev/null @@ -1,174 +0,0 @@ -<!--startmeta -custom_edit_url: "https://github.com/netdata/netdata/edit/master/src/collectors/charts.d.plugin/ap/README.md" -meta_yaml: "https://github.com/netdata/netdata/edit/master/src/collectors/charts.d.plugin/ap/metadata.yaml" -sidebar_label: "Access Points" -learn_status: "Published" -learn_rel_path: "Collecting Metrics/Linux Systems/Network" -most_popular: False -message: "DO NOT EDIT THIS FILE DIRECTLY, IT IS GENERATED BY THE COLLECTOR'S metadata.yaml FILE" -endmeta--> - -# Access Points - - -<img src="https://netdata.cloud/img/network-wired.svg" width="150"/> - - -Plugin: charts.d.plugin -Module: ap - -<img src="https://img.shields.io/badge/maintained%20by-Netdata-%2300ab44" /> - -## Overview - -The ap collector visualizes data related to wireless access points. - -It uses the `iw` command line utility to detect access points. For each interface that is of `type AP`, it then runs `iw INTERFACE station dump` and collects statistics. - -This collector is only supported on the following platforms: - -- Linux - -This collector only supports collecting metrics from a single instance of this integration. - - -### Default Behavior - -#### Auto-Detection - -The plugin is able to auto-detect if you are running access points on your linux box. - -#### Limits - -The default configuration for this integration does not impose any limits on data collection. - -#### Performance Impact - -The default configuration for this integration is not expected to impose a significant performance impact on the system. - - -## Metrics - -Metrics grouped by *scope*. - -The scope defines the instance that the metric belongs to. An instance is uniquely identified by a set of labels. - - - -### Per wireless device - -These metrics refer to the entire monitored application. - -This scope has no labels. - -Metrics: - -| Metric | Dimensions | Unit | -|:------|:----------|:----| -| ap.clients | clients | clients | -| ap.net | received, sent | kilobits/s | -| ap.packets | received, sent | packets/s | -| ap.issues | retries, failures | issues/s | -| ap.signal | average signal | dBm | -| ap.bitrate | receive, transmit, expected | Mbps | - - - -## Alerts - -There are no alerts configured by default for this integration. - - -## Setup - -### Prerequisites - -#### Install charts.d plugin - -If [using our official native DEB/RPM packages](/packaging/installer/UPDATE.md#determine-which-installation-method-you-used), make sure `netdata-plugin-chartsd` is installed. - - -#### `iw` utility. - -Make sure the `iw` utility is installed. - - -### Configuration - -#### File - -The configuration file name for this integration is `charts.d/ap.conf`. - - -You can edit the configuration file using the `edit-config` script from the -Netdata [config directory](/docs/netdata-agent/configuration/README.md#the-netdata-config-directory). - -```bash -cd /etc/netdata 2>/dev/null || cd /opt/netdata/etc/netdata -sudo ./edit-config charts.d/ap.conf -``` -#### Options - -The config file is sourced by the charts.d plugin. It's a standard bash file. - -The following collapsed table contains all the options that can be configured for the ap collector. - - -<details open><summary>Config options</summary> - -| Name | Description | Default | Required | -|:----|:-----------|:-------|:--------:| -| ap_update_every | The data collection frequency. If unset, will inherit the netdata update frequency. | 1 | no | -| ap_priority | Controls the order of charts at the netdata dashboard. | 6900 | no | -| ap_retries | The number of retries to do in case of failure before disabling the collector. | 10 | no | - -</details> - -#### Examples - -##### Change the collection frequency - -Specify a custom collection frequence (update_every) for this collector - -```yaml -# the data collection frequency -# if unset, will inherit the netdata update frequency -ap_update_every=10 - -# the charts priority on the dashboard -#ap_priority=6900 - -# the number of retries to do in case of failure -# before disabling the module -#ap_retries=10 - -``` - - -## Troubleshooting - -### Debug Mode - -To troubleshoot issues with the `ap` collector, run the `charts.d.plugin` with the debug option enabled. The output -should give you clues as to why the collector isn't working. - -- Navigate to the `plugins.d` directory, usually at `/usr/libexec/netdata/plugins.d/`. If that's not the case on - your system, open `netdata.conf` and look for the `plugins` setting under `[directories]`. - - ```bash - cd /usr/libexec/netdata/plugins.d/ - ``` - -- Switch to the `netdata` user. - - ```bash - sudo -u netdata -s - ``` - -- Run the `charts.d.plugin` to debug the collector: - - ```bash - ./charts.d.plugin debug 1 ap - ``` - - diff --git a/src/collectors/charts.d.plugin/apcupsd/integrations/apc_ups.md b/src/collectors/charts.d.plugin/apcupsd/integrations/apc_ups.md index 5e34aa7d1..fdf1ccc9e 100644 --- a/src/collectors/charts.d.plugin/apcupsd/integrations/apc_ups.md +++ b/src/collectors/charts.d.plugin/apcupsd/integrations/apc_ups.md @@ -178,6 +178,7 @@ apcupsd_update_every=5 ### Debug Mode + To troubleshoot issues with the `apcupsd` collector, run the `charts.d.plugin` with the debug option enabled. The output should give you clues as to why the collector isn't working. @@ -200,4 +201,37 @@ should give you clues as to why the collector isn't working. ./charts.d.plugin debug 1 apcupsd ``` +### Getting Logs + +If you're encountering problems with the `apcupsd` collector, follow these steps to retrieve logs and identify potential issues: + +- **Run the command** specific to your system (systemd, non-systemd, or Docker container). +- **Examine the output** for any warnings or error messages that might indicate issues. These messages should provide clues about the root cause of the problem. + +#### System with systemd + +Use the following command to view logs generated since the last Netdata service restart: + +```bash +journalctl _SYSTEMD_INVOCATION_ID="$(systemctl show --value --property=InvocationID netdata)" --namespace=netdata --grep apcupsd +``` + +#### System without systemd + +Locate the collector log file, typically at `/var/log/netdata/collector.log`, and use `grep` to filter for collector's name: + +```bash +grep apcupsd /var/log/netdata/collector.log +``` + +**Note**: This method shows logs from all restarts. Focus on the **latest entries** for troubleshooting current issues. + +#### Docker Container + +If your Netdata runs in a Docker container named "netdata" (replace if different), use this command: + +```bash +docker logs netdata 2>&1 | grep apcupsd +``` + diff --git a/src/collectors/charts.d.plugin/charts.d.conf b/src/collectors/charts.d.plugin/charts.d.conf index 4614f259e..b186b19e9 100644 --- a/src/collectors/charts.d.plugin/charts.d.conf +++ b/src/collectors/charts.d.plugin/charts.d.conf @@ -33,7 +33,6 @@ # enable_all_charts="yes" # BY DEFAULT ENABLED MODULES -# ap=yes # apcupsd=yes # libreswan=yes # opensips=yes diff --git a/src/collectors/charts.d.plugin/charts.d.plugin.in b/src/collectors/charts.d.plugin/charts.d.plugin.in index 4e64b7e23..e8018aaff 100755 --- a/src/collectors/charts.d.plugin/charts.d.plugin.in +++ b/src/collectors/charts.d.plugin/charts.d.plugin.in @@ -474,6 +474,7 @@ declare -A charts_enable_keyword=( ) declare -A obsolete_charts=( + ['ap']="go.d/ap" ['apache']="python.d.plugin module" ['cpu_apps']="apps.plugin" ['cpufreq']="proc plugin" diff --git a/src/collectors/charts.d.plugin/libreswan/integrations/libreswan.md b/src/collectors/charts.d.plugin/libreswan/integrations/libreswan.md index 01152ef91..fa8eb7a97 100644 --- a/src/collectors/charts.d.plugin/libreswan/integrations/libreswan.md +++ b/src/collectors/charts.d.plugin/libreswan/integrations/libreswan.md @@ -169,6 +169,7 @@ libreswan_sudo=0 ### Debug Mode + To troubleshoot issues with the `libreswan` collector, run the `charts.d.plugin` with the debug option enabled. The output should give you clues as to why the collector isn't working. @@ -191,4 +192,37 @@ should give you clues as to why the collector isn't working. ./charts.d.plugin debug 1 libreswan ``` +### Getting Logs + +If you're encountering problems with the `libreswan` collector, follow these steps to retrieve logs and identify potential issues: + +- **Run the command** specific to your system (systemd, non-systemd, or Docker container). +- **Examine the output** for any warnings or error messages that might indicate issues. These messages should provide clues about the root cause of the problem. + +#### System with systemd + +Use the following command to view logs generated since the last Netdata service restart: + +```bash +journalctl _SYSTEMD_INVOCATION_ID="$(systemctl show --value --property=InvocationID netdata)" --namespace=netdata --grep libreswan +``` + +#### System without systemd + +Locate the collector log file, typically at `/var/log/netdata/collector.log`, and use `grep` to filter for collector's name: + +```bash +grep libreswan /var/log/netdata/collector.log +``` + +**Note**: This method shows logs from all restarts. Focus on the **latest entries** for troubleshooting current issues. + +#### Docker Container + +If your Netdata runs in a Docker container named "netdata" (replace if different), use this command: + +```bash +docker logs netdata 2>&1 | grep libreswan +``` + diff --git a/src/collectors/charts.d.plugin/opensips/integrations/opensips.md b/src/collectors/charts.d.plugin/opensips/integrations/opensips.md index 9ee332ba1..7fa610eb4 100644 --- a/src/collectors/charts.d.plugin/opensips/integrations/opensips.md +++ b/src/collectors/charts.d.plugin/opensips/integrations/opensips.md @@ -167,6 +167,7 @@ opensips_cmd=/opt/opensips/bin/opensipsctl ### Debug Mode + To troubleshoot issues with the `opensips` collector, run the `charts.d.plugin` with the debug option enabled. The output should give you clues as to why the collector isn't working. @@ -189,4 +190,37 @@ should give you clues as to why the collector isn't working. ./charts.d.plugin debug 1 opensips ``` +### Getting Logs + +If you're encountering problems with the `opensips` collector, follow these steps to retrieve logs and identify potential issues: + +- **Run the command** specific to your system (systemd, non-systemd, or Docker container). +- **Examine the output** for any warnings or error messages that might indicate issues. These messages should provide clues about the root cause of the problem. + +#### System with systemd + +Use the following command to view logs generated since the last Netdata service restart: + +```bash +journalctl _SYSTEMD_INVOCATION_ID="$(systemctl show --value --property=InvocationID netdata)" --namespace=netdata --grep opensips +``` + +#### System without systemd + +Locate the collector log file, typically at `/var/log/netdata/collector.log`, and use `grep` to filter for collector's name: + +```bash +grep opensips /var/log/netdata/collector.log +``` + +**Note**: This method shows logs from all restarts. Focus on the **latest entries** for troubleshooting current issues. + +#### Docker Container + +If your Netdata runs in a Docker container named "netdata" (replace if different), use this command: + +```bash +docker logs netdata 2>&1 | grep opensips +``` + diff --git a/src/collectors/charts.d.plugin/sensors/integrations/linux_sensors_sysfs.md b/src/collectors/charts.d.plugin/sensors/integrations/linux_sensors_sysfs.md index 14fcc2f97..f9221caa1 100644 --- a/src/collectors/charts.d.plugin/sensors/integrations/linux_sensors_sysfs.md +++ b/src/collectors/charts.d.plugin/sensors/integrations/linux_sensors_sysfs.md @@ -22,7 +22,7 @@ Module: sensors ## Overview Use this collector when `lm-sensors` doesn't work on your device (e.g. for RPi temperatures). -For all other cases use the [Go collector](/src/go/collectors/go.d.plugin/modules/sensors/README.md), which supports multiple jobs, is more efficient and performs calculations on top of the kernel provided values." +For all other cases use the [Go collector](/src/go/plugin/go.d/modules/sensors/README.md), which supports multiple jobs, is more efficient and performs calculations on top of the kernel provided values." It will provide charts for all configured system sensors, by reading sensors directly from the kernel. @@ -176,6 +176,7 @@ sensors_sys_depth=5 ### Debug Mode + To troubleshoot issues with the `sensors` collector, run the `charts.d.plugin` with the debug option enabled. The output should give you clues as to why the collector isn't working. @@ -198,4 +199,37 @@ should give you clues as to why the collector isn't working. ./charts.d.plugin debug 1 sensors ``` +### Getting Logs + +If you're encountering problems with the `sensors` collector, follow these steps to retrieve logs and identify potential issues: + +- **Run the command** specific to your system (systemd, non-systemd, or Docker container). +- **Examine the output** for any warnings or error messages that might indicate issues. These messages should provide clues about the root cause of the problem. + +#### System with systemd + +Use the following command to view logs generated since the last Netdata service restart: + +```bash +journalctl _SYSTEMD_INVOCATION_ID="$(systemctl show --value --property=InvocationID netdata)" --namespace=netdata --grep sensors +``` + +#### System without systemd + +Locate the collector log file, typically at `/var/log/netdata/collector.log`, and use `grep` to filter for collector's name: + +```bash +grep sensors /var/log/netdata/collector.log +``` + +**Note**: This method shows logs from all restarts. Focus on the **latest entries** for troubleshooting current issues. + +#### Docker Container + +If your Netdata runs in a Docker container named "netdata" (replace if different), use this command: + +```bash +docker logs netdata 2>&1 | grep sensors +``` + diff --git a/src/collectors/charts.d.plugin/sensors/metadata.yaml b/src/collectors/charts.d.plugin/sensors/metadata.yaml index ffa9f43bb..9aacdd353 100644 --- a/src/collectors/charts.d.plugin/sensors/metadata.yaml +++ b/src/collectors/charts.d.plugin/sensors/metadata.yaml @@ -25,7 +25,7 @@ modules: data_collection: metrics_description: | Use this collector when `lm-sensors` doesn't work on your device (e.g. for RPi temperatures). - For all other cases use the [Go collector](/src/go/collectors/go.d.plugin/modules/sensors/README.md), which supports multiple jobs, is more efficient and performs calculations on top of the kernel provided values." + For all other cases use the [Go collector](/src/go/plugin/go.d/modules/sensors/README.md), which supports multiple jobs, is more efficient and performs calculations on top of the kernel provided values." method_description: | It will provide charts for all configured system sensors, by reading sensors directly from the kernel. The values graphed are the raw hardware values of the sensors. diff --git a/src/collectors/common-contexts/common-contexts.h b/src/collectors/common-contexts/common-contexts.h index 9d2d77147..1938230dc 100644 --- a/src/collectors/common-contexts/common-contexts.h +++ b/src/collectors/common-contexts/common-contexts.h @@ -20,7 +20,9 @@ typedef void (*instance_labels_cb_t)(RRDSET *st, void *data); #include "system.io.h"
#include "system.ram.h"
+#include "system.interrupts.h"
#include "system.processes.h"
+#include "system.ipc.h"
#include "mem.swap.h"
#include "mem.pgfaults.h"
#include "mem.available.h"
diff --git a/src/collectors/common-contexts/system.interrupts.h b/src/collectors/common-contexts/system.interrupts.h new file mode 100644 index 000000000..dffd70572 --- /dev/null +++ b/src/collectors/common-contexts/system.interrupts.h @@ -0,0 +1,39 @@ +// SPDX-License-Identifier: GPL-3.0-or-later
+
+#ifndef NETDATA_SYSTEM_INTERRUPTS_H
+#define NETDATA_SYSTEM_INTERRUPTS_H
+
+#include "common-contexts.h"
+
+#define _
+
+static inline void common_interrupts(uint64_t interrupts, int update_every, char *ext_module) {
+ static RRDSET *st_intr = NULL;
+ static RRDDIM *rd_interrupts = NULL;
+
+ char *module = (!ext_module) ? _COMMON_PLUGIN_MODULE_NAME: ext_module;
+
+ if(unlikely(!st_intr)) {
+ st_intr = rrdset_create_localhost( "system"
+ , "intr"
+ , NULL
+ , "interrupts"
+ , NULL
+ , "CPU Interrupts"
+ , "interrupts/s"
+ , _COMMON_PLUGIN_NAME
+ , module
+ , NETDATA_CHART_PRIO_SYSTEM_INTR
+ , update_every
+ , RRDSET_TYPE_LINE);
+
+ rrdset_flag_set(st_intr, RRDSET_FLAG_DETAIL);
+
+ rd_interrupts = rrddim_add(st_intr, "interrupts", NULL, 1, 1, RRD_ALGORITHM_INCREMENTAL);
+ }
+
+ rrddim_set_by_pointer(st_intr, rd_interrupts, (collected_number)interrupts);
+ rrdset_done(st_intr);
+}
+
+#endif //NETDATA_SYSTEM_INTERRUPTS_H
diff --git a/src/collectors/common-contexts/system.ipc.h b/src/collectors/common-contexts/system.ipc.h new file mode 100644 index 000000000..129ce6dfa --- /dev/null +++ b/src/collectors/common-contexts/system.ipc.h @@ -0,0 +1,34 @@ +// SPDX-License-Identifier: GPL-3.0-or-later
+
+#ifndef NETDATA_SYSTEM_IPC_H
+#define NETDATA_SYSTEM_IPC_H
+
+#include "common-contexts.h"
+
+static inline void common_semaphore_ipc(uint64_t semaphore, NETDATA_DOUBLE red, char *module, int update_every) {
+ static RRDSET *st_semaphores = NULL;
+ static RRDDIM *rd_semaphores = NULL;
+ if(unlikely(!st_semaphores)) {
+ st_semaphores = rrdset_create_localhost("system"
+ , "ipc_semaphores"
+ , NULL
+ , "ipc semaphores"
+ , NULL
+ , "IPC Semaphores"
+ , "semaphores"
+ , _COMMON_PLUGIN_NAME
+ , module
+ , NETDATA_CHART_PRIO_SYSTEM_IPC_SEMAPHORES
+ , update_every
+ , RRDSET_TYPE_AREA
+ );
+ rd_semaphores = rrddim_add(st_semaphores, "semaphores", NULL, 1, 1, RRD_ALGORITHM_ABSOLUTE);
+ }
+
+ rrddim_set_by_pointer(st_semaphores, rd_semaphores, semaphore);
+ rrdset_done(st_semaphores);
+ if (!strcmp(module, "ipc"))
+ st_semaphores->red = red;
+}
+
+#endif //NETDATA_SYSTEM_IPC_H
diff --git a/src/collectors/cups.plugin/cups_plugin.c b/src/collectors/cups.plugin/cups_plugin.c index 4e452f096..20b155e14 100644 --- a/src/collectors/cups.plugin/cups_plugin.c +++ b/src/collectors/cups.plugin/cups_plugin.c @@ -231,7 +231,7 @@ int main(int argc, char **argv) { parse_command_line(argc, argv); - errno = 0; + errno_clear(); dict_dest_job_metrics = dictionary_create(DICT_OPTION_SINGLE_THREADED); diff --git a/src/collectors/diskspace.plugin/plugin_diskspace.c b/src/collectors/diskspace.plugin/plugin_diskspace.c index 10e07586c..f1d8909b2 100644 --- a/src/collectors/diskspace.plugin/plugin_diskspace.c +++ b/src/collectors/diskspace.plugin/plugin_diskspace.c @@ -4,8 +4,8 @@ #define PLUGIN_DISKSPACE_NAME "diskspace.plugin" -#define DEFAULT_EXCLUDED_PATHS "/proc/* /sys/* /var/run/user/* /run/user/* /snap/* /var/lib/docker/*" -#define DEFAULT_EXCLUDED_FILESYSTEMS "*gvfs *gluster* *s3fs *ipfs *davfs2 *httpfs *sshfs *gdfs *moosefs fusectl autofs" +#define DEFAULT_EXCLUDED_PATHS "/dev /dev/shm /proc/* /sys/* /var/run/user/* /run/lock /run/user/* /snap/* /var/lib/docker/* /var/lib/containers/storage/* /run/credentials/* /run/containerd/* /rpool /rpool/*" +#define DEFAULT_EXCLUDED_FILESYSTEMS "*gvfs *gluster* *s3fs *ipfs *davfs2 *httpfs *sshfs *gdfs *moosefs fusectl autofs cgroup cgroup2 hugetlbfs devtmpfs fuse.lxcfs" #define DEFAULT_EXCLUDED_FILESYSTEMS_INODES "msdosfs msdos vfat overlayfs aufs* *unionfs" #define CONFIG_SECTION_DISKSPACE "plugin:proc:diskspace" diff --git a/src/collectors/ebpf.plugin/ebpf.c b/src/collectors/ebpf.plugin/ebpf.c index de2b6e144..5424ea8f0 100644 --- a/src/collectors/ebpf.plugin/ebpf.c +++ b/src/collectors/ebpf.plugin/ebpf.c @@ -30,6 +30,7 @@ int ebpf_nprocs; int isrh = 0; int main_thread_id = 0; int process_pid_fd = -1; +uint64_t collect_pids = 0; static size_t global_iterations_counter = 1; bool publish_internal_metrics = true; @@ -996,7 +997,7 @@ static inline void ebpf_create_apps_for_module(ebpf_module_t *em, struct ebpf_ta */ static void ebpf_create_apps_charts(struct ebpf_target *root) { - if (unlikely(!ebpf_all_pids)) + if (unlikely(!ebpf_pids)) return; struct ebpf_target *w; @@ -1028,21 +1029,15 @@ static void ebpf_create_apps_charts(struct ebpf_target *root) } } - int i; - if (!newly_added) { + if (newly_added) { + int i; for (i = 0; i < EBPF_MODULE_FUNCTION_IDX ; i++) { - ebpf_module_t *current = &ebpf_modules[i]; - if (current->apps_charts & NETDATA_EBPF_APPS_FLAG_CHART_CREATED) + if (!(collect_pids & (1<<i))) continue; + ebpf_module_t *current = &ebpf_modules[i]; ebpf_create_apps_for_module(current, root); } - return; - } - - for (i = 0; i < EBPF_MODULE_FUNCTION_IDX ; i++) { - ebpf_module_t *current = &ebpf_modules[i]; - ebpf_create_apps_for_module(current, root); } } @@ -2680,7 +2675,7 @@ static void ebpf_allocate_common_vectors() { ebpf_judy_pid.pid_table = ebpf_allocate_pid_aral(NETDATA_EBPF_PID_SOCKET_ARAL_TABLE_NAME, sizeof(netdata_ebpf_judy_pid_stats_t)); - ebpf_all_pids = callocz((size_t)pid_max, sizeof(struct ebpf_pid_stat *)); + ebpf_pids = callocz((size_t)pid_max, sizeof(ebpf_pid_data_t)); ebpf_aral_init(); } @@ -3014,7 +3009,7 @@ static int ebpf_load_collector_config(char *path, int *disable_cgroups, int upda /** * Set global variables reading environment variables */ -void set_global_variables() +static void ebpf_set_global_variables() { // Get environment variables ebpf_plugin_dir = getenv("NETDATA_PLUGINS_DIR"); @@ -3042,6 +3037,7 @@ void set_global_variables() isrh = get_redhat_release(); pid_max = os_get_system_pid_max(); running_on_kernel = ebpf_get_kernel_version(); + memset(pids_fd, -1, sizeof(pids_fd)); } /** @@ -3418,6 +3414,11 @@ void ebpf_send_statistic_data() } ebpf_write_end_chart(); + ebpf_write_begin_chart(NETDATA_MONITORING_FAMILY, "monitoring_pid", ""); + write_chart_dimension("user", ebpf_all_pids_count); + write_chart_dimension("kernel", ebpf_hash_table_pids_count); + ebpf_write_end_chart(); + ebpf_write_begin_chart(NETDATA_MONITORING_FAMILY, NETDATA_EBPF_LIFE_TIME, ""); for (i = 0; i < EBPF_MODULE_FUNCTION_IDX ; i++) { ebpf_module_t *wem = &ebpf_modules[i]; @@ -3490,6 +3491,37 @@ static void update_internal_metric_variable() } /** + * Create PIDS Chart + * + * Write to standard output current values for PIDSs charts. + * + * @param order order to display chart + * @param update_every time used to update charts + */ +static void ebpf_create_pids_chart(int order, int update_every) +{ + ebpf_write_chart_cmd(NETDATA_MONITORING_FAMILY, + "monitoring_pid", + "", + "Total number of monitored PIDs", + "pids", + NETDATA_EBPF_FAMILY, + NETDATA_EBPF_CHART_TYPE_LINE, + "netdata.ebpf_pids", + order, + update_every, + "main"); + + ebpf_write_global_dimension("user", + "user", + ebpf_algorithms[NETDATA_EBPF_ABSOLUTE_IDX]); + + ebpf_write_global_dimension("kernel", + "kernel", + ebpf_algorithms[NETDATA_EBPF_ABSOLUTE_IDX]); +} + +/** * Create Thread Chart * * Write to standard output current values for threads charts. @@ -3538,7 +3570,7 @@ static void ebpf_create_thread_chart(char *name, (char *)em->info.thread_name, ebpf_algorithms[NETDATA_EBPF_ABSOLUTE_IDX]); } -} + } /** * Create chart for Load Thread @@ -3741,6 +3773,8 @@ static void ebpf_create_statistic_charts(int update_every) update_every, NULL); + ebpf_create_pids_chart(NETDATA_EBPF_ORDER_PIDS, update_every); + ebpf_create_thread_chart(NETDATA_EBPF_LIFE_TIME, "Time remaining for thread.", "seconds", @@ -3974,18 +4008,18 @@ int main(int argc, char **argv) clocks_init(); nd_log_initialize_for_external_plugins(NETDATA_EBPF_PLUGIN_NAME); - main_thread_id = gettid_cached(); - - set_global_variables(); - ebpf_parse_args(argc, argv); - ebpf_manage_pid(getpid()); - + ebpf_set_global_variables(); if (ebpf_can_plugin_load_code(running_on_kernel, NETDATA_EBPF_PLUGIN_NAME)) return 2; if (ebpf_adjust_memory_limit()) return 3; + main_thread_id = gettid_cached(); + + ebpf_parse_args(argc, argv); + ebpf_manage_pid(getpid()); + signal(SIGINT, ebpf_stop_threads); signal(SIGQUIT, ebpf_stop_threads); signal(SIGTERM, ebpf_stop_threads); @@ -4018,7 +4052,7 @@ int main(int argc, char **argv) ebpf_cgroup_integration, NULL); - int i; + uint32_t i; for (i = 0; ebpf_threads[i].name != NULL; i++) { struct netdata_static_thread *st = &ebpf_threads[i]; @@ -4028,6 +4062,10 @@ int main(int argc, char **argv) if (em->enabled != NETDATA_THREAD_EBPF_NOT_RUNNING) { em->enabled = NETDATA_THREAD_EBPF_RUNNING; em->lifetime = EBPF_NON_FUNCTION_LIFE_TIME; + + if (em->functions.apps_routine && (em->apps_charts || em->cgroup_charts)) { + collect_pids |= 1<<i; + } st->thread = nd_thread_create(st->name, NETDATA_THREAD_OPTION_JOINABLE, st->start_routine, em); } else { em->lifetime = EBPF_DEFAULT_LIFETIME; @@ -4038,7 +4076,7 @@ int main(int argc, char **argv) heartbeat_t hb; heartbeat_init(&hb); int update_apps_every = (int) EBPF_CFG_UPDATE_APPS_EVERY_DEFAULT; - int max_period = update_apps_every * EBPF_CLEANUP_FACTOR; + uint32_t max_period = EBPF_CLEANUP_FACTOR; int update_apps_list = update_apps_every - 1; int process_maps_per_core = ebpf_modules[EBPF_MODULE_PROCESS_IDX].maps_per_core; //Plugin will be killed when it receives a signal @@ -4050,19 +4088,23 @@ int main(int argc, char **argv) ebpf_create_statistic_charts(EBPF_DEFAULT_UPDATE_EVERY); ebpf_send_statistic_data(); - pthread_mutex_unlock(&lock); fflush(stdout); + pthread_mutex_unlock(&lock); } if (++update_apps_list == update_apps_every) { update_apps_list = 0; pthread_mutex_lock(&lock); - pthread_mutex_lock(&collect_data_mutex); - ebpf_cleanup_exited_pids(max_period); - collect_data_for_all_processes(process_pid_fd, process_maps_per_core); - - ebpf_create_apps_charts(apps_groups_root_target); - pthread_mutex_unlock(&collect_data_mutex); + if (collect_pids) { + pthread_mutex_lock(&collect_data_mutex); + ebpf_parse_proc_files(); + if (collect_pids & (1<<EBPF_MODULE_PROCESS_IDX)) { + collect_data_for_all_processes(process_pid_fd, process_maps_per_core, max_period); + } + + ebpf_create_apps_charts(apps_groups_root_target); + pthread_mutex_unlock(&collect_data_mutex); + } pthread_mutex_unlock(&lock); } } diff --git a/src/collectors/ebpf.plugin/ebpf.d/cachestat.conf b/src/collectors/ebpf.plugin/ebpf.d/cachestat.conf index c378e82e8..9c51b2c52 100644 --- a/src/collectors/ebpf.plugin/ebpf.d/cachestat.conf +++ b/src/collectors/ebpf.plugin/ebpf.d/cachestat.conf @@ -37,6 +37,6 @@ # pid table size = 32768 ebpf type format = auto ebpf co-re tracing = trampoline - collect pid = all + collect pid = real parent # maps per core = yes lifetime = 300 diff --git a/src/collectors/ebpf.plugin/ebpf.d/dcstat.conf b/src/collectors/ebpf.plugin/ebpf.d/dcstat.conf index 2d54bce97..614d814e6 100644 --- a/src/collectors/ebpf.plugin/ebpf.d/dcstat.conf +++ b/src/collectors/ebpf.plugin/ebpf.d/dcstat.conf @@ -35,6 +35,6 @@ # pid table size = 32768 ebpf type format = auto ebpf co-re tracing = trampoline - collect pid = all + collect pid = real parent # maps per core = yes lifetime = 300 diff --git a/src/collectors/ebpf.plugin/ebpf.d/fd.conf b/src/collectors/ebpf.plugin/ebpf.d/fd.conf index d48230323..4d0d2ac05 100644 --- a/src/collectors/ebpf.plugin/ebpf.d/fd.conf +++ b/src/collectors/ebpf.plugin/ebpf.d/fd.conf @@ -23,5 +23,6 @@ # pid table size = 32768 ebpf type format = auto ebpf co-re tracing = trampoline + collect pid = real parent # maps per core = yes lifetime = 300 diff --git a/src/collectors/ebpf.plugin/ebpf.d/oomkill.conf b/src/collectors/ebpf.plugin/ebpf.d/oomkill.conf index ea97ebe85..a137b945b 100644 --- a/src/collectors/ebpf.plugin/ebpf.d/oomkill.conf +++ b/src/collectors/ebpf.plugin/ebpf.d/oomkill.conf @@ -3,9 +3,21 @@ # `return : In the `return` mode, the eBPF collector monitors the same kernel functions as `entry`, but also creates # new charts for the return of these functions, such as errors. # +# The eBPF collector also creates charts for each running application through an integration with the `apps.plugin` +# or `cgroups.plugin`. +# If you want to disable the integration with `apps.plugin` or `cgroups.plugin` along with the above charts, change +# the setting `apps` and `cgroups` to 'no'. +# +# The `pid table size` defines the maximum number of PIDs stored inside the hash table. +# +# The `maps per core` defines if hash tables will be per core or not. This option is ignored on kernels older than 4.6. +# # The `lifetime` defines the time length a thread will run when it is enabled by a function. # [global] # ebpf load mode = entry # update every = 1 + ebpf type format = auto + ebpf co-re tracing = trampoline + collect pid = real parent lifetime = 300 diff --git a/src/collectors/ebpf.plugin/ebpf.d/process.conf b/src/collectors/ebpf.plugin/ebpf.d/process.conf index 6f6477003..150c57920 100644 --- a/src/collectors/ebpf.plugin/ebpf.d/process.conf +++ b/src/collectors/ebpf.plugin/ebpf.d/process.conf @@ -26,6 +26,6 @@ # cgroups = no # update every = 10 # pid table size = 32768 - collect pid = all + collect pid = real parent # maps per core = yes lifetime = 300 diff --git a/src/collectors/ebpf.plugin/ebpf.d/shm.conf b/src/collectors/ebpf.plugin/ebpf.d/shm.conf index 0314bdc95..4769c52ee 100644 --- a/src/collectors/ebpf.plugin/ebpf.d/shm.conf +++ b/src/collectors/ebpf.plugin/ebpf.d/shm.conf @@ -31,7 +31,7 @@ # pid table size = 32768 ebpf type format = auto ebpf co-re tracing = trampoline - collect pid = all + collect pid = real parent # maps per core = yes lifetime = 300 diff --git a/src/collectors/ebpf.plugin/ebpf.d/swap.conf b/src/collectors/ebpf.plugin/ebpf.d/swap.conf index 6d76b9880..7d4c5f7d3 100644 --- a/src/collectors/ebpf.plugin/ebpf.d/swap.conf +++ b/src/collectors/ebpf.plugin/ebpf.d/swap.conf @@ -30,6 +30,6 @@ # pid table size = 32768 ebpf type format = auto ebpf co-re tracing = trampoline - collect pid = all + collect pid = real parent # maps per core = yes lifetime = 300 diff --git a/src/collectors/ebpf.plugin/ebpf.d/vfs.conf b/src/collectors/ebpf.plugin/ebpf.d/vfs.conf index f511581b8..941ac1407 100644 --- a/src/collectors/ebpf.plugin/ebpf.d/vfs.conf +++ b/src/collectors/ebpf.plugin/ebpf.d/vfs.conf @@ -31,5 +31,6 @@ # pid table size = 32768 ebpf type format = auto ebpf co-re tracing = trampoline + collect pid = real parent # maps per core = yes lifetime = 300 diff --git a/src/collectors/ebpf.plugin/ebpf.h b/src/collectors/ebpf.plugin/ebpf.h index c54b5900d..6fc42b3e4 100644 --- a/src/collectors/ebpf.plugin/ebpf.h +++ b/src/collectors/ebpf.plugin/ebpf.h @@ -37,6 +37,7 @@ #define NETDATA_EBPF_OLD_CONFIG_FILE "ebpf.conf" #define NETDATA_EBPF_CONFIG_FILE "ebpf.d.conf" +extern size_t ebpf_hash_table_pids_count; #ifdef LIBBPF_MAJOR_VERSION // BTF code #include "cachestat.skel.h" #include "dc.skel.h" @@ -122,34 +123,6 @@ typedef struct netdata_ebpf_judy_pid_stats { } netdata_ebpf_judy_pid_stats_t; extern ebpf_module_t ebpf_modules[]; -enum ebpf_main_index { - EBPF_MODULE_PROCESS_IDX, - EBPF_MODULE_SOCKET_IDX, - EBPF_MODULE_CACHESTAT_IDX, - EBPF_MODULE_SYNC_IDX, - EBPF_MODULE_DCSTAT_IDX, - EBPF_MODULE_SWAP_IDX, - EBPF_MODULE_VFS_IDX, - EBPF_MODULE_FILESYSTEM_IDX, - EBPF_MODULE_DISK_IDX, - EBPF_MODULE_MOUNT_IDX, - EBPF_MODULE_FD_IDX, - EBPF_MODULE_HARDIRQ_IDX, - EBPF_MODULE_SOFTIRQ_IDX, - EBPF_MODULE_OOMKILL_IDX, - EBPF_MODULE_SHM_IDX, - EBPF_MODULE_MDFLUSH_IDX, - EBPF_MODULE_FUNCTION_IDX, - /* THREADS MUST BE INCLUDED BEFORE THIS COMMENT */ - EBPF_OPTION_ALL_CHARTS, - EBPF_OPTION_VERSION, - EBPF_OPTION_HELP, - EBPF_OPTION_GLOBAL_CHART, - EBPF_OPTION_RETURN_MODE, - EBPF_OPTION_LEGACY, - EBPF_OPTION_CORE, - EBPF_OPTION_UNITTEST -}; typedef struct ebpf_tracepoint { bool enabled; @@ -380,6 +353,7 @@ void ebpf_read_local_addresses_unsafe(); extern ebpf_filesystem_partitions_t localfs[]; extern ebpf_sync_syscalls_t local_syscalls[]; extern bool ebpf_plugin_exit; +extern uint64_t collect_pids; static inline bool ebpf_plugin_stop(void) { return ebpf_plugin_exit || nd_thread_signaled_to_cancel(); diff --git a/src/collectors/ebpf.plugin/ebpf_apps.c b/src/collectors/ebpf.plugin/ebpf_apps.c index a17cdb33d..d90c5f128 100644 --- a/src/collectors/ebpf.plugin/ebpf_apps.c +++ b/src/collectors/ebpf.plugin/ebpf_apps.c @@ -21,37 +21,11 @@ void ebpf_aral_init(void) max_elements = NETDATA_EBPF_ALLOC_MIN_ELEMENTS; } - ebpf_aral_apps_pid_stat = ebpf_allocate_pid_aral("ebpf_pid_stat", sizeof(struct ebpf_pid_stat)); - #ifdef NETDATA_DEV_MODE netdata_log_info("Plugin is using ARAL with values %d", NETDATA_EBPF_ALLOC_MAX_PID); #endif } -/** - * eBPF pid stat get - * - * Get a ebpf_pid_stat entry to be used with a specific PID. - * - * @return it returns the address on success. - */ -struct ebpf_pid_stat *ebpf_pid_stat_get(void) -{ - struct ebpf_pid_stat *target = aral_mallocz(ebpf_aral_apps_pid_stat); - memset(target, 0, sizeof(struct ebpf_pid_stat)); - return target; -} - -/** - * eBPF target release - * - * @param stat Release a target after usage. - */ -void ebpf_pid_stat_release(struct ebpf_pid_stat *stat) -{ - aral_freez(ebpf_aral_apps_pid_stat, stat); -} - // ---------------------------------------------------------------------------- // internal flags // handled in code (automatically set) @@ -332,11 +306,11 @@ int ebpf_read_apps_groups_conf(struct ebpf_target **agdt, struct ebpf_target **a #define MAX_CMDLINE 16384 -struct ebpf_pid_stat **ebpf_all_pids = NULL; // to avoid allocations, we pre-allocate the - // the entire pid space. -struct ebpf_pid_stat *ebpf_root_of_pids = NULL; // global list of all processes running +ebpf_pid_data_t *ebpf_pids = NULL; // to avoid allocations, we pre-allocate the entire pid space. +ebpf_pid_data_t *ebpf_pids_link_list = NULL; // global list of all processes running -size_t ebpf_all_pids_count = 0; // the number of processes running +size_t ebpf_all_pids_count = 0; // the number of processes running read from /proc +size_t ebpf_hash_table_pids_count = 0; // the number of tasks in our hash tables struct ebpf_target *apps_groups_default_target = NULL, // the default target @@ -346,6 +320,8 @@ struct ebpf_target size_t apps_groups_targets_count = 0; // # of apps_groups.conf targets +int pids_fd[EBPF_PIDS_END_IDX]; + // ---------------------------------------------------------------------------- // internal counters @@ -389,109 +365,11 @@ static inline void debug_log_dummy(void) #endif /** - * Managed log - * - * Store log information if it is necessary. - * - * @param p the pid stat structure - * @param log the log id - * @param status the return from a function. - * - * @return It returns the status value. - */ -static inline int managed_log(struct ebpf_pid_stat *p, uint32_t log, int status) -{ - if (unlikely(!status)) { - // netdata_log_error("command failed log %u, errno %d", log, errno); - - if (unlikely(debug_enabled || errno != ENOENT)) { - if (unlikely(debug_enabled || !(p->log_thrown & log))) { - p->log_thrown |= log; - switch (log) { - case PID_LOG_IO: - netdata_log_error( - "Cannot process %s/proc/%d/io (command '%s')", netdata_configured_host_prefix, p->pid, - p->comm); - break; - - case PID_LOG_STATUS: - netdata_log_error( - "Cannot process %s/proc/%d/status (command '%s')", netdata_configured_host_prefix, p->pid, - p->comm); - break; - - case PID_LOG_CMDLINE: - netdata_log_error( - "Cannot process %s/proc/%d/cmdline (command '%s')", netdata_configured_host_prefix, p->pid, - p->comm); - break; - - case PID_LOG_FDS: - netdata_log_error( - "Cannot process entries in %s/proc/%d/fd (command '%s')", netdata_configured_host_prefix, - p->pid, p->comm); - break; - - case PID_LOG_STAT: - break; - - default: - netdata_log_error("unhandled error for pid %d, command '%s'", p->pid, p->comm); - break; - } - } - } - errno = 0; - } else if (unlikely(p->log_thrown & log)) { - // netdata_log_error("unsetting log %u on pid %d", log, p->pid); - p->log_thrown &= ~log; - } - - return status; -} - -/** - * Get PID entry - * - * Get or allocate the PID entry for the specified pid. - * - * @param pid the pid to search the data. - * @param tgid the task group id - * - * @return It returns the pid entry structure - */ -ebpf_pid_stat_t *ebpf_get_pid_entry(pid_t pid, pid_t tgid) -{ - ebpf_pid_stat_t *ptr = ebpf_all_pids[pid]; - if (unlikely(ptr)) { - if (!ptr->ppid && tgid) - ptr->ppid = tgid; - return ebpf_all_pids[pid]; - } - - struct ebpf_pid_stat *p = ebpf_pid_stat_get(); - - if (likely(ebpf_root_of_pids)) - ebpf_root_of_pids->prev = p; - - p->next = ebpf_root_of_pids; - ebpf_root_of_pids = p; - - p->pid = pid; - p->ppid = tgid; - - ebpf_all_pids[pid] = p; - ebpf_all_pids_count++; - - return p; -} - -/** * Assign the PID to a target. * * @param p the pid_stat structure to assign for a target. */ -static inline void assign_target_to_pid(struct ebpf_pid_stat *p) +static inline void assign_target_to_pid(ebpf_pid_data_t *p) { targets_assignment_counter++; @@ -499,6 +377,7 @@ static inline void assign_target_to_pid(struct ebpf_pid_stat *p) size_t pclen = strlen(p->comm); struct ebpf_target *w; + bool assigned = false; for (w = apps_groups_root_target; w; w = w->next) { // if(debug_enabled || (p->target && p->target->debug_enabled)) debug_log_int("\t\tcomparing '%s' with '%s'", w->compare, p->comm); @@ -521,9 +400,17 @@ static inline void assign_target_to_pid(struct ebpf_pid_stat *p) if (debug_enabled || (p->target && p->target->debug_enabled)) debug_log_int("%s linked to target %s", p->comm, p->target->name); + w->processes++; + assigned = true; + break; } } + + if (!assigned) { + apps_groups_default_target->processes++; + p->target = apps_groups_default_target; + } } // ---------------------------------------------------------------------------- @@ -532,22 +419,18 @@ static inline void assign_target_to_pid(struct ebpf_pid_stat *p) /** * Read cmd line from /proc/PID/cmdline * - * @param p the ebpf_pid_stat_structure. + * @param p the ebpf_pid_data structure. * * @return It returns 1 on success and 0 otherwise. */ -static inline int read_proc_pid_cmdline(struct ebpf_pid_stat *p) +static inline int read_proc_pid_cmdline(ebpf_pid_data_t *p, char *cmdline) { - static char cmdline[MAX_CMDLINE + 1]; + char filename[FILENAME_MAX + 1]; + snprintfz(filename, FILENAME_MAX, "%s/proc/%d/cmdline", netdata_configured_host_prefix, p->pid); int ret = 0; - if (unlikely(!p->cmdline_filename)) { - char filename[FILENAME_MAX + 1]; - snprintfz(filename, FILENAME_MAX, "%s/proc/%d/cmdline", netdata_configured_host_prefix, p->pid); - p->cmdline_filename = strdupz(filename); - } - int fd = open(p->cmdline_filename, procfile_open_flags, 0666); + int fd = open(filename, procfile_open_flags, 0666); if (unlikely(fd == -1)) goto cleanup; @@ -563,21 +446,12 @@ static inline int read_proc_pid_cmdline(struct ebpf_pid_stat *p) cmdline[i] = ' '; } - debug_log("Read file '%s' contents: %s", p->cmdline_filename, p->cmdline); + debug_log("Read file '%s' contents: %s", filename, p->cmdline); ret = 1; cleanup: - // copy the command to the command line - if (p->cmdline) - freez(p->cmdline); - p->cmdline = strdupz(p->comm); - - rw_spinlock_write_lock(&ebpf_judy_pid.index.rw_spinlock); - netdata_ebpf_judy_pid_stats_t *pid_ptr = ebpf_get_pid_from_judy_unsafe(&ebpf_judy_pid.index.JudyLArray, p->pid); - if (pid_ptr) - pid_ptr->cmdline = p->cmdline; - rw_spinlock_write_unlock(&ebpf_judy_pid.index.rw_spinlock); + p->cmdline[0] = '\0'; return ret; } @@ -587,44 +461,43 @@ cleanup: * Assign target to pid * * @param p the pid stat structure to store the data. - * @param ptr an useless argument. */ -static inline int read_proc_pid_stat(struct ebpf_pid_stat *p, void *ptr) +static inline int read_proc_pid_stat(ebpf_pid_data_t *p) { - UNUSED(ptr); + procfile *ff; - static procfile *ff = NULL; - - if (unlikely(!p->stat_filename)) { - char filename[FILENAME_MAX + 1]; - snprintfz(filename, FILENAME_MAX, "%s/proc/%d/stat", netdata_configured_host_prefix, p->pid); - p->stat_filename = strdupz(filename); - } - - int set_quotes = (!ff) ? 1 : 0; + char filename[FILENAME_MAX + 1]; + int ret = 0; + snprintfz(filename, FILENAME_MAX, "%s/proc/%u/stat", netdata_configured_host_prefix, p->pid); struct stat statbuf; - if (stat(p->stat_filename, &statbuf)) + if (stat(filename, &statbuf)) { + // PID ended before we stat the file + p->has_proc_file = 0; return 0; + } - ff = procfile_reopen(ff, p->stat_filename, NULL, PROCFILE_FLAG_NO_ERROR_ON_FILE_IO); + ff = procfile_open(filename, NULL, PROCFILE_FLAG_NO_ERROR_ON_FILE_IO); if (unlikely(!ff)) - return 0; + goto cleanup_pid_stat; - if (unlikely(set_quotes)) - procfile_set_open_close(ff, "(", ")"); + procfile_set_open_close(ff, "(", ")"); ff = procfile_readall(ff); if (unlikely(!ff)) - return 0; - - p->last_stat_collected_usec = p->stat_collected_usec; - p->stat_collected_usec = now_monotonic_usec(); - calls_counter++; + goto cleanup_pid_stat; char *comm = procfile_lineword(ff, 0, 1); - p->ppid = (int32_t)str2pid_t(procfile_lineword(ff, 0, 3)); + int32_t ppid = (int32_t)str2pid_t(procfile_lineword(ff, 0, 3)); + if (p->ppid == ppid && p->target) + goto without_cmdline_target; + + p->ppid = ppid; + + char cmdline[MAX_CMDLINE + 1]; + p->cmdline = cmdline; + read_proc_pid_cmdline(p, cmdline); if (strcmp(p->comm, comm) != 0) { if (unlikely(debug_enabled)) { if (p->comm[0]) @@ -634,58 +507,50 @@ static inline int read_proc_pid_stat(struct ebpf_pid_stat *p, void *ptr) } strncpyz(p->comm, comm, EBPF_MAX_COMPARE_NAME); - - // /proc/<pid>/cmdline - if (likely(proc_pid_cmdline_is_needed)) - managed_log(p, PID_LOG_CMDLINE, read_proc_pid_cmdline(p)); - - assign_target_to_pid(p); } + if (!p->target) + assign_target_to_pid(p); + + p->cmdline = NULL; if (unlikely(debug_enabled || (p->target && p->target->debug_enabled))) debug_log_int( - "READ PROC/PID/STAT: %s/proc/%d/stat, process: '%s' on target '%s' (dt=%llu)", - netdata_configured_host_prefix, p->pid, p->comm, (p->target) ? p->target->name : "UNSET", - p->stat_collected_usec - p->last_stat_collected_usec); + "READ PROC/PID/STAT: %s/proc/%d/stat, process: '%s' on target '%s'", + netdata_configured_host_prefix, p->pid, p->comm, (p->target) ? p->target->name : "UNSET"); - return 1; +without_cmdline_target: + p->has_proc_file = 1; + p->not_updated = 0; + ret = 1; +cleanup_pid_stat: + procfile_close(ff); + + return ret; } /** * Collect data for PID * * @param pid the current pid that we are working - * @param ptr a NULL value * * @return It returns 1 on success and 0 otherwise */ -static inline int ebpf_collect_data_for_pid(pid_t pid, void *ptr) +static inline int ebpf_collect_data_for_pid(pid_t pid) { if (unlikely(pid < 0 || pid > pid_max)) { netdata_log_error("Invalid pid %d read (expected %d to %d). Ignoring process.", pid, 0, pid_max); return 0; } - ebpf_pid_stat_t *p = ebpf_get_pid_entry(pid, 0); - if (unlikely(!p || p->read)) - return 0; - p->read = 1; - - if (unlikely(!managed_log(p, PID_LOG_STAT, read_proc_pid_stat(p, ptr)))) - // there is no reason to proceed if we cannot get its status - return 0; + ebpf_pid_data_t *p = ebpf_get_pid_data((uint32_t)pid, 0, NULL, EBPF_PIDS_PROC_FILE); + read_proc_pid_stat(p); // check its parent pid - if (unlikely(p->ppid < 0 || p->ppid > pid_max)) { - netdata_log_error("Pid %d (command '%s') states invalid parent pid %d. Using 0.", pid, p->comm, p->ppid); + if (unlikely( p->ppid > pid_max)) { + netdata_log_error("Pid %d (command '%s') states invalid parent pid %u. Using 0.", pid, p->comm, p->ppid); p->ppid = 0; } - // mark it as updated - p->updated = 1; - p->keep = 0; - p->keeploops = 0; - return 1; } @@ -694,14 +559,13 @@ static inline int ebpf_collect_data_for_pid(pid_t pid, void *ptr) */ static inline void link_all_processes_to_their_parents(void) { - struct ebpf_pid_stat *p, *pp; + ebpf_pid_data_t *p, *pp; // link all children to their parents // and update children count on parents - for (p = ebpf_root_of_pids; p; p = p->next) { + for (p = ebpf_pids_link_list; p; p = p->next) { // for each process found - p->sortlist = 0; p->parent = NULL; if (unlikely(!p->ppid)) { @@ -709,16 +573,15 @@ static inline void link_all_processes_to_their_parents(void) continue; } - pp = ebpf_all_pids[p->ppid]; - if (likely(pp)) { + pp = &ebpf_pids[p->ppid]; + if (likely(pp->pid)) { p->parent = pp; pp->children_count++; if (unlikely(debug_enabled || (p->target && p->target->debug_enabled))) debug_log_int( - "child %d (%s, %s) on target '%s' has parent %d (%s, %s).", p->pid, p->comm, - p->updated ? "running" : "exited", (p->target) ? p->target->name : "UNSET", pp->pid, pp->comm, - pp->updated ? "running" : "exited"); + "child %d (%s) on target '%s' has parent %d (%s).", p->pid, p->comm, + (p->target) ? p->target->name : "UNSET", pp->pid, pp->comm); } else { p->parent = NULL; debug_log("pid %d %s states parent %d, but the later does not exist.", p->pid, p->comm, p->ppid); @@ -731,7 +594,7 @@ static inline void link_all_processes_to_their_parents(void) */ static void apply_apps_groups_targets_inheritance(void) { - struct ebpf_pid_stat *p = NULL; + struct ebpf_pid_data *p = NULL; // children that do not have a target // inherit their target from their parent @@ -740,7 +603,7 @@ static void apply_apps_groups_targets_inheritance(void) if (unlikely(debug_enabled)) loops++; found = 0; - for (p = ebpf_root_of_pids; p; p = p->next) { + for (p = ebpf_pids_link_list; p; p = p->next) { // if this process does not have a target // and it has a parent // and its parent has a target @@ -751,7 +614,7 @@ static void apply_apps_groups_targets_inheritance(void) if (debug_enabled || (p->target && p->target->debug_enabled)) debug_log_int( - "TARGET INHERITANCE: %s is inherited by %d (%s) from its parent %d (%s).", p->target->name, + "TARGET INHERITANCE: %s is inherited by %u (%s) from its parent %d (%s).", p->target->name, p->pid, p->comm, p->parent->pid, p->parent->comm); } } @@ -766,7 +629,7 @@ static void apply_apps_groups_targets_inheritance(void) loops++; found = 0; - for (p = ebpf_root_of_pids; p; p = p->next) { + for (p = ebpf_pids_link_list; p; p = p->next) { if (unlikely(!p->sortlist && !p->children_count)) p->sortlist = sortlist++; @@ -802,17 +665,15 @@ static void apply_apps_groups_targets_inheritance(void) } // init goes always to default target - if (ebpf_all_pids[INIT_PID]) - ebpf_all_pids[INIT_PID]->target = apps_groups_default_target; + ebpf_pids[INIT_PID].target = apps_groups_default_target; // pid 0 goes always to default target - if (ebpf_all_pids[0]) - ebpf_all_pids[0]->target = apps_groups_default_target; + ebpf_pids[0].target = apps_groups_default_target; // give a default target on all top level processes if (unlikely(debug_enabled)) loops++; - for (p = ebpf_root_of_pids; p; p = p->next) { + for (p = ebpf_pids_link_list; p; p = p->next) { // if the process is not merged itself // then is is a top level process if (unlikely(!p->merged && !p->target)) @@ -823,8 +684,7 @@ static void apply_apps_groups_targets_inheritance(void) p->sortlist = sortlist++; } - if (ebpf_all_pids[1]) - ebpf_all_pids[1]->sortlist = sortlist++; + ebpf_pids[1].sortlist = sortlist++; // give a target to all merged child processes found = 1; @@ -832,7 +692,7 @@ static void apply_apps_groups_targets_inheritance(void) if (unlikely(debug_enabled)) loops++; found = 0; - for (p = ebpf_root_of_pids; p; p = p->next) { + for (p = ebpf_pids_link_list; p; p = p->next) { if (unlikely(!p->target && p->merged && p->parent && p->parent->target)) { p->target = p->parent->target; found++; @@ -872,29 +732,23 @@ static inline void post_aggregate_targets(struct ebpf_target *root) * * @param pid the PID that will be removed. */ -static inline void ebpf_del_pid_entry(pid_t pid) +void ebpf_del_pid_entry(pid_t pid) { - struct ebpf_pid_stat *p = ebpf_all_pids[pid]; - - if (unlikely(!p)) { - netdata_log_error("attempted to free pid %d that is not allocated.", pid); - return; - } + ebpf_pid_data_t *p = &ebpf_pids[pid]; debug_log("process %d %s exited, deleting it.", pid, p->comm); - if (ebpf_root_of_pids == p) - ebpf_root_of_pids = p->next; + if (ebpf_pids_link_list == p) + ebpf_pids_link_list = p->next; if (p->next) p->next->prev = p->prev; if (p->prev) p->prev->next = p->next; - freez(p->stat_filename); - freez(p->status_filename); - freez(p->io_filename); - freez(p->cmdline_filename); + + if ((p->thread_collecting & EBPF_PIDS_PROC_FILE) || p->has_proc_file) + ebpf_all_pids_count--; rw_spinlock_write_lock(&ebpf_judy_pid.index.rw_spinlock); netdata_ebpf_judy_pid_stats_t *pid_ptr = ebpf_get_pid_from_judy_unsafe(&ebpf_judy_pid.index.JudyLArray, p->pid); @@ -914,58 +768,19 @@ static inline void ebpf_del_pid_entry(pid_t pid) } rw_spinlock_write_unlock(&ebpf_judy_pid.index.rw_spinlock); - freez(p->cmdline); - ebpf_pid_stat_release(p); - - ebpf_all_pids[pid] = NULL; - ebpf_all_pids_count--; -} - -/** - * Get command string associated with a PID. - * This can only safely be used when holding the `collect_data_mutex` lock. - * - * @param pid the pid to search the data. - * @param n the maximum amount of bytes to copy into dest. - * if this is greater than the size of the command, it is clipped. - * @param dest the target memory buffer to write the command into. - * @return -1 if the PID hasn't been scraped yet, 0 otherwise. - */ -int get_pid_comm(pid_t pid, size_t n, char *dest) -{ - struct ebpf_pid_stat *stat; - - stat = ebpf_all_pids[pid]; - if (unlikely(stat == NULL)) { - return -1; - } - - if (unlikely(n > sizeof(stat->comm))) { - n = sizeof(stat->comm); - } - - strncpyz(dest, stat->comm, n); - return 0; + memset(p, 0, sizeof(ebpf_pid_data_t)); } /** * Remove PIDs when they are not running more. */ -void ebpf_cleanup_exited_pids(int max) +static void ebpf_cleanup_exited_pids() { - struct ebpf_pid_stat *p = NULL; - - for (p = ebpf_root_of_pids; p;) { - if (p->not_updated > max) { - if (unlikely(debug_enabled && (p->keep || p->keeploops))) - debug_log(" > CLEANUP cannot keep exited process %d (%s) anymore - removing it.", p->pid, p->comm); - - pid_t r = p->pid; - p = p->next; - - ebpf_del_pid_entry(r); + ebpf_pid_data_t *p = NULL; + for (p = ebpf_pids_link_list; p; p = p->next) { + if (!p->has_proc_file) { + ebpf_reset_specific_pid_data(p); } - p = p->next; } } @@ -974,14 +789,14 @@ void ebpf_cleanup_exited_pids(int max) * * @return It returns 0 on success and -1 otherwise. */ -static inline void read_proc_filesystem() +static int ebpf_read_proc_filesystem() { char dirname[FILENAME_MAX + 1]; snprintfz(dirname, FILENAME_MAX, "%s/proc", netdata_configured_host_prefix); DIR *dir = opendir(dirname); if (!dir) - return; + return -1; struct dirent *de = NULL; @@ -997,9 +812,11 @@ static inline void read_proc_filesystem() if (unlikely(endptr == de->d_name || *endptr != '\0')) continue; - ebpf_collect_data_for_pid(pid, NULL); + ebpf_collect_data_for_pid(pid); } closedir(dir); + + return 0; } /** @@ -1009,17 +826,17 @@ static inline void read_proc_filesystem() * @param p the pid with information to update * @param o never used */ -static inline void aggregate_pid_on_target(struct ebpf_target *w, struct ebpf_pid_stat *p, struct ebpf_target *o) +static inline void aggregate_pid_on_target(struct ebpf_target *w, ebpf_pid_data_t *p, struct ebpf_target *o) { UNUSED(o); - if (unlikely(!p->updated)) { + if (unlikely(!p->has_proc_file)) { // the process is not running return; } if (unlikely(!w)) { - netdata_log_error("pid %d %s was left without a target!", p->pid, p->comm); + netdata_log_error("pid %u %s was left without a target!", p->pid, p->comm); return; } @@ -1042,6 +859,7 @@ void ebpf_process_apps_accumulator(ebpf_process_stat_t *out, int maps_per_core) { int i, end = (maps_per_core) ? ebpf_nprocs : 1; ebpf_process_stat_t *total = &out[0]; + uint64_t ct = total->ct; for (i = 1; i < end; i++) { ebpf_process_stat_t *w = &out[i]; total->exit_call += w->exit_call; @@ -1049,7 +867,11 @@ void ebpf_process_apps_accumulator(ebpf_process_stat_t *out, int maps_per_core) total->create_thread += w->create_thread; total->create_process += w->create_process; total->release_call += w->release_call; + + if (w->ct > ct) + ct = w->ct; } + total->ct = ct; } /** @@ -1061,19 +883,18 @@ void ebpf_process_apps_accumulator(ebpf_process_stat_t *out, int maps_per_core) void ebpf_process_sum_values_for_pids(ebpf_process_stat_t *process, struct ebpf_pid_on_target *root) { memset(process, 0, sizeof(ebpf_process_stat_t)); - while (root) { + for (; root; root = root->next) { int32_t pid = root->pid; - ebpf_pid_stat_t *local_pid = ebpf_get_pid_entry(pid, 0); - if (local_pid) { - ebpf_process_stat_t *in = &local_pid->process; - process->task_err += in->task_err; - process->release_call += in->release_call; - process->exit_call += in->exit_call; - process->create_thread += in->create_thread; - process->create_process += in->create_process; - } + ebpf_pid_data_t *local_pid = ebpf_get_pid_data(pid, 0, NULL, EBPF_PIDS_PROCESS_IDX); + ebpf_publish_process_t *in = local_pid->process; + if (!in) + continue; - root = root->next; + process->task_err += in->task_err; + process->release_call += in->release_call; + process->exit_call += in->exit_call; + process->create_thread += in->create_thread; + process->create_process += in->create_process; } } @@ -1085,51 +906,50 @@ void ebpf_process_sum_values_for_pids(ebpf_process_stat_t *process, struct ebpf_ * * @param tbl_pid_stats_fd The mapped file descriptor for the hash table. * @param maps_per_core do I have hash maps per core? + * @param max_period max period to wait before remove from hash table. */ -void collect_data_for_all_processes(int tbl_pid_stats_fd, int maps_per_core) +void collect_data_for_all_processes(int tbl_pid_stats_fd, int maps_per_core, uint32_t max_period) { - if (unlikely(!ebpf_all_pids)) + if (tbl_pid_stats_fd == -1) return; - struct ebpf_pid_stat *pids = ebpf_root_of_pids; // global list of all processes running - while (pids) { - if (pids->updated_twice) { - pids->read = 0; // mark it as not read, so that collect_data_for_pid() will read it - pids->updated = 0; - pids->merged = 0; - pids->children_count = 0; - pids->parent = NULL; - } else { - if (pids->updated) - pids->updated_twice = 1; - } - - pids = pids->next; - } - - read_proc_filesystem(); - - pids = ebpf_root_of_pids; // global list of all processes running + pids_fd[EBPF_PIDS_PROCESS_IDX] = tbl_pid_stats_fd; + size_t length = sizeof(ebpf_process_stat_t); + if (maps_per_core) + length *= ebpf_nprocs; if (tbl_pid_stats_fd != -1) { - size_t length = sizeof(ebpf_process_stat_t); - if (maps_per_core) - length *= ebpf_nprocs; uint32_t key = 0, next_key = 0; while (bpf_map_get_next_key(tbl_pid_stats_fd, &key, &next_key) == 0) { - ebpf_pid_stat_t *local_pid = ebpf_get_pid_entry(key, 0); - if (!local_pid) - goto end_process_loop; - - ebpf_process_stat_t *w = &local_pid->process; if (bpf_map_lookup_elem(tbl_pid_stats_fd, &key, process_stat_vector)) { goto end_process_loop; } ebpf_process_apps_accumulator(process_stat_vector, maps_per_core); - memcpy(w, process_stat_vector, sizeof(ebpf_process_stat_t)); + ebpf_pid_data_t *local_pid = ebpf_get_pid_data(key, 0, NULL, EBPF_PIDS_PROCESS_IDX); + ebpf_publish_process_t *w = local_pid->process; + if (!w) + local_pid->process = w = ebpf_process_allocate_publish(); + + if (!w->ct || w->ct != process_stat_vector[0].ct) { + w->ct = process_stat_vector[0].ct; + w->create_thread = process_stat_vector[0].create_thread; + w->exit_call = process_stat_vector[0].exit_call; + w->create_thread = process_stat_vector[0].create_thread; + w->create_process = process_stat_vector[0].create_process; + w->release_call = process_stat_vector[0].release_call; + w->task_err = process_stat_vector[0].task_err; + } else { + if (kill(key, 0)) { // No PID found + ebpf_reset_specific_pid_data(local_pid); + } else { // There is PID, but there is not data anymore + ebpf_release_pid_data(local_pid, tbl_pid_stats_fd, key, EBPF_PIDS_PROCESS_IDX); + ebpf_process_release_publish(w); + local_pid->process = NULL; + } + } end_process_loop: memset(process_stat_vector, 0, length); @@ -1137,24 +957,47 @@ end_process_loop: } } + struct ebpf_target *w; + for (w = apps_groups_root_target; w; w = w->next) { + if (unlikely(!(w->processes))) + continue; + + ebpf_process_sum_values_for_pids(&w->process, w->root_pid); + } + +} + +/** + * + */ +void ebpf_parse_proc_files() +{ + ebpf_pid_data_t *pids; + for (pids = ebpf_pids_link_list; pids;) { + if (kill(pids->pid, 0)) { // No PID found + ebpf_pid_data_t *next = pids->next; + ebpf_reset_specific_pid_data(pids); + pids = next; + continue; + } + + pids->not_updated = EBPF_CLEANUP_FACTOR; + pids->merged = 0; + pids->children_count = 0; + pids = pids->next; + } + + if (ebpf_read_proc_filesystem()) + return; + link_all_processes_to_their_parents(); apply_apps_groups_targets_inheritance(); apps_groups_targets_count = zero_all_targets(apps_groups_root_target); - // this has to be done, before the cleanup - // // concentrate everything on the targets - for (pids = ebpf_root_of_pids; pids; pids = pids->next) + for (pids = ebpf_pids_link_list; pids; pids = pids->next) aggregate_pid_on_target(pids->target, pids, NULL); - post_aggregate_targets(apps_groups_root_target); - - struct ebpf_target *w; - for (w = apps_groups_root_target; w; w = w->next) { - if (unlikely(!(w->processes))) - continue; - - ebpf_process_sum_values_for_pids(&w->process, w->root_pid); - } + ebpf_cleanup_exited_pids(); } diff --git a/src/collectors/ebpf.plugin/ebpf_apps.h b/src/collectors/ebpf.plugin/ebpf_apps.h index a2cbaf3b7..98c9995da 100644 --- a/src/collectors/ebpf.plugin/ebpf_apps.h +++ b/src/collectors/ebpf.plugin/ebpf_apps.h @@ -39,10 +39,55 @@ #include "ebpf_swap.h" #include "ebpf_vfs.h" -#define EBPF_MAX_COMPARE_NAME 100 +#define EBPF_MAX_COMPARE_NAME 95 #define EBPF_MAX_NAME 100 -#define EBPF_CLEANUP_FACTOR 10 +#define EBPF_CLEANUP_FACTOR 2 + +enum ebpf_pids_index { + EBPF_PIDS_PROCESS_IDX, + EBPF_PIDS_SOCKET_IDX, + EBPF_PIDS_CACHESTAT_IDX, + EBPF_PIDS_DCSTAT_IDX, + EBPF_PIDS_SWAP_IDX, + EBPF_PIDS_VFS_IDX, + EBPF_PIDS_FD_IDX, + EBPF_PIDS_SHM_IDX, + + EBPF_PIDS_PROC_FILE, + EBPF_PIDS_END_IDX +}; + +extern int pids_fd[EBPF_PIDS_END_IDX]; + +enum ebpf_main_index { + EBPF_MODULE_PROCESS_IDX, + EBPF_MODULE_SOCKET_IDX, + EBPF_MODULE_CACHESTAT_IDX, + EBPF_MODULE_SYNC_IDX, + EBPF_MODULE_DCSTAT_IDX, + EBPF_MODULE_SWAP_IDX, + EBPF_MODULE_VFS_IDX, + EBPF_MODULE_FILESYSTEM_IDX, + EBPF_MODULE_DISK_IDX, + EBPF_MODULE_MOUNT_IDX, + EBPF_MODULE_FD_IDX, + EBPF_MODULE_HARDIRQ_IDX, + EBPF_MODULE_SOFTIRQ_IDX, + EBPF_MODULE_OOMKILL_IDX, + EBPF_MODULE_SHM_IDX, + EBPF_MODULE_MDFLUSH_IDX, + EBPF_MODULE_FUNCTION_IDX, + /* THREADS MUST BE INCLUDED BEFORE THIS COMMENT */ + EBPF_OPTION_ALL_CHARTS, + EBPF_OPTION_VERSION, + EBPF_OPTION_HELP, + EBPF_OPTION_GLOBAL_CHART, + EBPF_OPTION_RETURN_MODE, + EBPF_OPTION_LEGACY, + EBPF_OPTION_CORE, + EBPF_OPTION_UNITTEST +}; // ---------------------------------------------------------------------------- // Structures used to read information from kernel ring @@ -63,10 +108,21 @@ typedef struct ebpf_process_stat { //Counter uint32_t task_err; - - uint8_t removeme; } ebpf_process_stat_t; +typedef struct __attribute__((packed)) ebpf_publish_process { + uint64_t ct; + + //Counter + uint32_t exit_call; + uint32_t release_call; + uint32_t create_process; + uint32_t create_thread; + + //Counter + uint32_t task_err; +} ebpf_publish_process_t; + // ---------------------------------------------------------------------------- // pid_stat // @@ -108,21 +164,246 @@ struct ebpf_target { struct ebpf_target *target; // the one that will be reported to netdata struct ebpf_target *next; }; - extern struct ebpf_target *apps_groups_default_target; extern struct ebpf_target *apps_groups_root_target; extern struct ebpf_target *users_root_target; extern struct ebpf_target *groups_root_target; +extern uint64_t collect_pids; + +// ebpf_pid_data +typedef struct __attribute__((packed)) ebpf_pid_data { + uint32_t pid; + uint32_t ppid; + uint64_t thread_collecting; + + char comm[EBPF_MAX_COMPARE_NAME + 1]; + char *cmdline; + + uint32_t has_proc_file; + uint32_t not_updated; + int children_count; // number of processes directly referencing this + int merged; + int sortlist; // higher numbers = top on the process tree + + struct ebpf_target *target; // the one that will be reported to netdata + struct ebpf_pid_data *parent; + struct ebpf_pid_data *prev; + struct ebpf_pid_data *next; + + netdata_publish_fd_stat_t *fd; + netdata_publish_swap_t *swap; + netdata_publish_shm_t *shm; // this has a leak issue + netdata_publish_dcstat_t *dc; + netdata_publish_vfs_t *vfs; + netdata_publish_cachestat_t *cachestat; + ebpf_publish_process_t *process; + ebpf_socket_publish_apps_t *socket; + +} ebpf_pid_data_t; + +extern ebpf_pid_data_t *ebpf_pids; +extern ebpf_pid_data_t *ebpf_pids_link_list; +extern size_t ebpf_all_pids_count; +extern size_t ebpf_hash_table_pids_count; +void ebpf_del_pid_entry(pid_t pid); + +static inline void *ebpf_cachestat_allocate_publish() +{ + ebpf_hash_table_pids_count++; + return callocz(1, sizeof(netdata_publish_cachestat_t)); +} + +static inline void ebpf_cachestat_release_publish(netdata_publish_cachestat_t *ptr) +{ + ebpf_hash_table_pids_count--; + freez(ptr); +} + +static inline void *ebpf_dcallocate_publish() +{ + ebpf_hash_table_pids_count++; + return callocz(1, sizeof(netdata_publish_dcstat_t)); +} + +static inline void ebpf_dc_release_publish(netdata_publish_dcstat_t *ptr) +{ + ebpf_hash_table_pids_count--; + freez(ptr); +} + +static inline void *ebpf_fd_allocate_publish() +{ + ebpf_hash_table_pids_count++; + return callocz(1, sizeof(netdata_publish_fd_stat_t)); +} + +static inline void ebpf_fd_release_publish(netdata_publish_fd_stat_t *ptr) +{ + ebpf_hash_table_pids_count--; + freez(ptr); +} + +static inline void *ebpf_shm_allocate_publish() +{ + ebpf_hash_table_pids_count++; + return callocz(1, sizeof(netdata_publish_shm_t)); +} + +static inline void ebpf_shm_release_publish(netdata_publish_shm_t *ptr) +{ + ebpf_hash_table_pids_count--; + freez(ptr); +} + +static inline void *ebpf_socket_allocate_publish() +{ + ebpf_hash_table_pids_count++; + return callocz(1, sizeof(ebpf_socket_publish_apps_t)); +} + +static inline void ebpf_socket_release_publish(ebpf_socket_publish_apps_t *ptr) +{ + ebpf_hash_table_pids_count--; + freez(ptr); +} + +static inline void *ebpf_swap_allocate_publish_swap() +{ + ebpf_hash_table_pids_count++; + return callocz(1, sizeof(netdata_publish_swap_t)); +} + +static inline void ebpf_swap_release_publish(netdata_publish_swap_t *ptr) +{ + ebpf_hash_table_pids_count--; + freez(ptr); +} + +static inline void *ebpf_vfs_allocate_publish() +{ + ebpf_hash_table_pids_count++; + return callocz(1, sizeof(netdata_publish_vfs_t)); +} + +static inline void ebpf_vfs_release_publish(netdata_publish_vfs_t *ptr) +{ + ebpf_hash_table_pids_count--; + freez(ptr); +} + +static inline void *ebpf_process_allocate_publish() +{ + ebpf_hash_table_pids_count++; + return callocz(1, sizeof(ebpf_publish_process_t)); +} + +static inline void ebpf_process_release_publish(ebpf_publish_process_t *ptr) +{ + ebpf_hash_table_pids_count--; + freez(ptr); +} + +static inline ebpf_pid_data_t *ebpf_get_pid_data(uint32_t pid, uint32_t tgid, char *name, uint32_t idx) { + ebpf_pid_data_t *ptr = &ebpf_pids[pid]; + ptr->thread_collecting |= 1<<idx; + // The caller is getting data to work. + if (!name && idx != EBPF_PIDS_PROC_FILE) + return ptr; + + if (ptr->pid == pid) { + return ptr; + } + + ptr->pid = pid; + ptr->ppid = tgid; + + if (name) + strncpyz(ptr->comm, name, EBPF_MAX_COMPARE_NAME); + + if (likely(ebpf_pids_link_list)) + ebpf_pids_link_list->prev = ptr; + + ptr->next = ebpf_pids_link_list; + ebpf_pids_link_list = ptr; + if (idx == EBPF_PIDS_PROC_FILE) { + ebpf_all_pids_count++; + } + + return ptr; +} + +static inline void ebpf_release_pid_data(ebpf_pid_data_t *eps, int fd, uint32_t key, uint32_t idx) +{ + if (fd) { + bpf_map_delete_elem(fd, &key); + } + eps->thread_collecting &= ~(1<<idx); + if (!eps->thread_collecting && !eps->has_proc_file) { + ebpf_del_pid_entry((pid_t)key); + } +} + +static inline void ebpf_reset_specific_pid_data(ebpf_pid_data_t *ptr) +{ + int idx; + uint32_t pid = ptr->pid; + for (idx = EBPF_PIDS_PROCESS_IDX; idx < EBPF_PIDS_PROC_FILE; idx++) { + if (!(ptr->thread_collecting & (1<<idx))) { + continue; + } + // Check if we still have the map loaded + int fd = pids_fd[idx]; + if (fd <= STDERR_FILENO) + continue; + + bpf_map_delete_elem(fd, &pid); + ebpf_hash_table_pids_count--; + void *clean; + switch (idx) { + case EBPF_PIDS_PROCESS_IDX: + clean = ptr->process; + break; + case EBPF_PIDS_SOCKET_IDX: + clean = ptr->socket; + break; + case EBPF_PIDS_CACHESTAT_IDX: + clean = ptr->cachestat; + break; + case EBPF_PIDS_DCSTAT_IDX: + clean = ptr->dc; + break; + case EBPF_PIDS_SWAP_IDX: + clean = ptr->swap; + break; + case EBPF_PIDS_VFS_IDX: + clean = ptr->vfs; + break; + case EBPF_PIDS_FD_IDX: + clean = ptr->fd; + break; + case EBPF_PIDS_SHM_IDX: + clean = ptr->shm; + break; + default: + clean = NULL; + } + freez(clean); + } + + ebpf_del_pid_entry(pid); +} + typedef struct ebpf_pid_stat { - int32_t pid; + uint32_t pid; + uint64_t thread_collecting; char comm[EBPF_MAX_COMPARE_NAME + 1]; char *cmdline; uint32_t log_thrown; // char state; - int32_t ppid; + uint32_t ppid; int children_count; // number of processes directly referencing this unsigned char keep : 1; // 1 when we need to keep this process in memory even after it exited @@ -199,8 +480,6 @@ static inline void debug_log_int(const char *fmt, ...) // ---------------------------------------------------------------------------- // Exported variabled and functions // -extern struct ebpf_pid_stat **ebpf_all_pids; - int ebpf_read_apps_groups_conf(struct ebpf_target **apps_groups_default_target, struct ebpf_target **apps_groups_root_target, const char *path, @@ -216,7 +495,7 @@ int ebpf_read_hash_table(void *ep, int fd, uint32_t pid); int get_pid_comm(pid_t pid, size_t n, char *dest); -void collect_data_for_all_processes(int tbl_pid_stats_fd, int maps_per_core); +void collect_data_for_all_processes(int tbl_pid_stats_fd, int maps_per_core, uint32_t max_period); void ebpf_process_apps_accumulator(ebpf_process_stat_t *out, int maps_per_core); // The default value is at least 32 times smaller than maximum number of PIDs allowed on system, @@ -227,8 +506,7 @@ void ebpf_process_apps_accumulator(ebpf_process_stat_t *out, int maps_per_core); #define NETDATA_EBPF_ALLOC_MIN_ELEMENTS 256 // ARAL Sectiion -extern void ebpf_aral_init(void); -extern ebpf_pid_stat_t *ebpf_get_pid_entry(pid_t pid, pid_t tgid); +void ebpf_aral_init(void); extern ebpf_process_stat_t *process_stat_vector; extern ARAL *ebpf_aral_vfs_pid; @@ -240,7 +518,7 @@ extern ARAL *ebpf_aral_shm_pid; void ebpf_shm_aral_init(); netdata_publish_shm_t *ebpf_shm_stat_get(void); void ebpf_shm_release(netdata_publish_shm_t *stat); -void ebpf_cleanup_exited_pids(int max); +void ebpf_parse_proc_files(); // ARAL Section end diff --git a/src/collectors/ebpf.plugin/ebpf_cachestat.c b/src/collectors/ebpf.plugin/ebpf_cachestat.c index 379ff05bb..8c0260d51 100644 --- a/src/collectors/ebpf.plugin/ebpf_cachestat.c +++ b/src/collectors/ebpf.plugin/ebpf_cachestat.c @@ -330,9 +330,9 @@ static void ebpf_obsolete_specific_cachestat_charts(char *type, int update_every */ static void ebpf_obsolete_cachestat_services(ebpf_module_t *em, char *id) { - ebpf_write_chart_obsolete(NETDATA_SERVICE_FAMILY, - id, + ebpf_write_chart_obsolete(id, NETDATA_CACHESTAT_HIT_RATIO_CHART, + "", "Hit ratio", EBPF_COMMON_UNITS_PERCENTAGE, NETDATA_CACHESTAT_SUBMENU, @@ -341,9 +341,9 @@ static void ebpf_obsolete_cachestat_services(ebpf_module_t *em, char *id) 21100, em->update_every); - ebpf_write_chart_obsolete(NETDATA_SERVICE_FAMILY, - id, + ebpf_write_chart_obsolete(id, NETDATA_CACHESTAT_DIRTY_CHART, + "", "Number of dirty pages", EBPF_CACHESTAT_UNITS_PAGE, NETDATA_CACHESTAT_SUBMENU, @@ -352,9 +352,9 @@ static void ebpf_obsolete_cachestat_services(ebpf_module_t *em, char *id) 21101, em->update_every); - ebpf_write_chart_obsolete(NETDATA_SERVICE_FAMILY, - id, + ebpf_write_chart_obsolete(id, NETDATA_CACHESTAT_HIT_CHART, + "", "Number of accessed files", EBPF_CACHESTAT_UNITS_HITS, NETDATA_CACHESTAT_SUBMENU, @@ -363,9 +363,9 @@ static void ebpf_obsolete_cachestat_services(ebpf_module_t *em, char *id) 21102, em->update_every); - ebpf_write_chart_obsolete(NETDATA_SERVICE_FAMILY, - id, + ebpf_write_chart_obsolete(id, NETDATA_CACHESTAT_MISSES_CHART, + "", "Files out of page cache", EBPF_CACHESTAT_UNITS_MISSES, NETDATA_CACHESTAT_SUBMENU, @@ -525,9 +525,14 @@ void ebpf_obsolete_cachestat_apps_charts(struct ebpf_module *em) */ static void ebpf_cachestat_exit(void *pptr) { + pids_fd[EBPF_PIDS_CACHESTAT_IDX] = -1; ebpf_module_t *em = CLEANUP_FUNCTION_GET_PTR(pptr); if(!em) return; + pthread_mutex_lock(&lock); + collect_pids &= ~(1<<EBPF_MODULE_CACHESTAT_IDX); + pthread_mutex_unlock(&lock); + if (ebpf_read_cachestat.thread) nd_thread_signal_cancel(ebpf_read_cachestat.thread); @@ -677,6 +682,9 @@ static void cachestat_apps_accumulator(netdata_cachestat_pid_t *out, int maps_pe total->mark_page_accessed += w->mark_page_accessed; if (w->ct > ct) ct = w->ct; + + if (!total->name[0] && w->name[0]) + strncpyz(total->name, w->name, sizeof(total->name) - 1); } total->ct = ct; } @@ -692,13 +700,14 @@ static void cachestat_apps_accumulator(netdata_cachestat_pid_t *out, int maps_pe static inline void cachestat_save_pid_values(netdata_publish_cachestat_t *out, netdata_cachestat_pid_t *in) { out->ct = in->ct; - if (!out->current.mark_page_accessed) { - memcpy(&out->current, &in[0], sizeof(netdata_cachestat_pid_t)); - return; + if (out->current.mark_page_accessed) { + memcpy(&out->prev, &out->current, sizeof(netdata_cachestat_t)); } - memcpy(&out->prev, &out->current, sizeof(netdata_cachestat_pid_t)); - memcpy(&out->current, &in[0], sizeof(netdata_cachestat_pid_t)); + out->current.account_page_dirtied = in[0].account_page_dirtied; + out->current.add_to_page_cache_lru = in[0].add_to_page_cache_lru; + out->current.mark_buffer_dirty = in[0].mark_buffer_dirty; + out->current.mark_page_accessed = in[0].mark_page_accessed; } /** @@ -707,8 +716,9 @@ static inline void cachestat_save_pid_values(netdata_publish_cachestat_t *out, n * Read the apps table and store data inside the structure. * * @param maps_per_core do I need to read all cores? + * @param max_period limit of iterations without updates before remove data from hash table */ -static void ebpf_read_cachestat_apps_table(int maps_per_core, int max_period) +static void ebpf_read_cachestat_apps_table(int maps_per_core, uint32_t max_period) { netdata_cachestat_pid_t *cv = cachestat_vector; int fd = cachestat_maps[NETDATA_CACHESTAT_PID_STATS].map_fd; @@ -724,17 +734,22 @@ static void ebpf_read_cachestat_apps_table(int maps_per_core, int max_period) cachestat_apps_accumulator(cv, maps_per_core); - ebpf_pid_stat_t *local_pid = ebpf_get_pid_entry(key, cv->tgid); - if (!local_pid) - goto end_cachestat_loop; + ebpf_pid_data_t *local_pid = ebpf_get_pid_data(key, cv->tgid, cv->name, EBPF_PIDS_CACHESTAT_IDX); + netdata_publish_cachestat_t *publish = local_pid->cachestat; + if (!publish) + local_pid->cachestat = publish = ebpf_cachestat_allocate_publish(); - netdata_publish_cachestat_t *publish = &local_pid->cachestat; if (!publish->ct || publish->ct != cv->ct){ cachestat_save_pid_values(publish, cv); local_pid->not_updated = 0; - } else if (++local_pid->not_updated >= max_period) { - bpf_map_delete_elem(fd, &key); - local_pid->not_updated = 0; + } else { + if (kill(key, 0)) { // No PID found + ebpf_reset_specific_pid_data(local_pid); + } else { // There is PID, but there is not data anymore + ebpf_release_pid_data(local_pid, fd, key, EBPF_PIDS_CACHESTAT_IDX); + ebpf_cachestat_release_publish(publish); + local_pid->cachestat = NULL; + } } end_cachestat_loop: @@ -759,13 +774,14 @@ static void ebpf_update_cachestat_cgroup() struct pid_on_target2 *pids; for (pids = ect->pids; pids; pids = pids->next) { int pid = pids->pid; - netdata_cachestat_pid_t *out = &pids->cachestat; - ebpf_pid_stat_t *local_pid = ebpf_get_pid_entry(pid, 0); - if (local_pid) { - netdata_publish_cachestat_t *in = &local_pid->cachestat; + netdata_publish_cachestat_t *out = &pids->cachestat; - memcpy(out, &in->current, sizeof(netdata_cachestat_pid_t)); - } + ebpf_pid_data_t *local_pid = ebpf_get_pid_data(pid, 0, NULL, EBPF_PIDS_CACHESTAT_IDX); + netdata_publish_cachestat_t *in = local_pid->cachestat; + if (!in) + continue; + + memcpy(&out->current, &in->current, sizeof(netdata_cachestat_t)); } } pthread_mutex_unlock(&mutex_cgroup_shm); @@ -784,20 +800,19 @@ void ebpf_cachestat_sum_pids(netdata_publish_cachestat_t *publish, struct ebpf_p memcpy(&publish->prev, &publish->current,sizeof(publish->current)); memset(&publish->current, 0, sizeof(publish->current)); - netdata_cachestat_pid_t *dst = &publish->current; - while (root) { + netdata_cachestat_t *dst = &publish->current; + for (; root; root = root->next) { int32_t pid = root->pid; - ebpf_pid_stat_t *local_pid = ebpf_get_pid_entry(pid, 0); - if (local_pid) { - netdata_publish_cachestat_t *w = &local_pid->cachestat; - netdata_cachestat_pid_t *src = &w->current; - dst->account_page_dirtied += src->account_page_dirtied; - dst->add_to_page_cache_lru += src->add_to_page_cache_lru; - dst->mark_buffer_dirty += src->mark_buffer_dirty; - dst->mark_page_accessed += src->mark_page_accessed; - } + ebpf_pid_data_t *local_pid = ebpf_get_pid_data(pid, 0, NULL, EBPF_PIDS_CACHESTAT_IDX); + netdata_publish_cachestat_t *w = local_pid->cachestat; + if (!w) + continue; - root = root->next; + netdata_cachestat_t *src = &w->current; + dst->account_page_dirtied += src->account_page_dirtied; + dst->add_to_page_cache_lru += src->add_to_page_cache_lru; + dst->mark_buffer_dirty += src->mark_buffer_dirty; + dst->mark_page_accessed += src->mark_page_accessed; } } @@ -834,13 +849,14 @@ void *ebpf_read_cachestat_thread(void *ptr) int maps_per_core = em->maps_per_core; int update_every = em->update_every; - int max_period = update_every * EBPF_CLEANUP_FACTOR; + uint32_t max_period = EBPF_CLEANUP_FACTOR; int counter = update_every - 1; uint32_t lifetime = em->lifetime; uint32_t running_time = 0; usec_t period = update_every * USEC_PER_SEC; + pids_fd[EBPF_PIDS_CACHESTAT_IDX] = cachestat_maps[NETDATA_CACHESTAT_PID_STATS].map_fd; while (!ebpf_plugin_stop() && running_time < lifetime) { (void)heartbeat_next(&hb, period); if (ebpf_plugin_stop() || ++counter != update_every) @@ -1020,8 +1036,8 @@ void ebpf_cache_send_apps_data(struct ebpf_target *root) if (unlikely(!(w->charts_created & (1<<EBPF_MODULE_CACHESTAT_IDX)))) continue; - netdata_cachestat_pid_t *current = &w->cachestat.current; - netdata_cachestat_pid_t *prev = &w->cachestat.prev; + netdata_cachestat_t *current = &w->cachestat.current; + netdata_cachestat_t *prev = &w->cachestat.prev; uint64_t mpa = current->mark_page_accessed - prev->mark_page_accessed; uint64_t mbd = current->mark_buffer_dirty - prev->mark_buffer_dirty; @@ -1067,16 +1083,14 @@ void ebpf_cachestat_sum_cgroup_pids(netdata_publish_cachestat_t *publish, struct memcpy(&publish->prev, &publish->current,sizeof(publish->current)); memset(&publish->current, 0, sizeof(publish->current)); - netdata_cachestat_pid_t *dst = &publish->current; - while (root) { - netdata_cachestat_pid_t *src = &root->cachestat; + netdata_cachestat_t *dst = &publish->current; + for (; root; root = root->next) { + netdata_cachestat_t *src = &root->cachestat.current; dst->account_page_dirtied += src->account_page_dirtied; dst->add_to_page_cache_lru += src->add_to_page_cache_lru; dst->mark_buffer_dirty += src->mark_buffer_dirty; dst->mark_page_accessed += src->mark_page_accessed; - - root = root->next; } } @@ -1091,8 +1105,8 @@ void ebpf_cachestat_calc_chart_values() for (ect = ebpf_cgroup_pids; ect ; ect = ect->next) { ebpf_cachestat_sum_cgroup_pids(&ect->publish_cachestat, ect->pids); - netdata_cachestat_pid_t *current = &ect->publish_cachestat.current; - netdata_cachestat_pid_t *prev = &ect->publish_cachestat.prev; + netdata_cachestat_t *current = &ect->publish_cachestat.current; + netdata_cachestat_t *prev = &ect->publish_cachestat.prev; uint64_t mpa = current->mark_page_accessed - prev->mark_page_accessed; uint64_t mbd = current->mark_buffer_dirty - prev->mark_buffer_dirty; @@ -1205,19 +1219,19 @@ static void ebpf_send_systemd_cachestat_charts() continue; } - ebpf_write_begin_chart(NETDATA_SERVICE_FAMILY, ect->name, NETDATA_CACHESTAT_HIT_RATIO_CHART); + ebpf_write_begin_chart(ect->name, NETDATA_CACHESTAT_HIT_RATIO_CHART, ""); write_chart_dimension("percentage", (long long)ect->publish_cachestat.ratio); ebpf_write_end_chart(); - ebpf_write_begin_chart(NETDATA_SERVICE_FAMILY, ect->name, NETDATA_CACHESTAT_DIRTY_CHART); + ebpf_write_begin_chart(ect->name, NETDATA_CACHESTAT_DIRTY_CHART, ""); write_chart_dimension("pages", (long long)ect->publish_cachestat.dirty); ebpf_write_end_chart(); - ebpf_write_begin_chart(NETDATA_SERVICE_FAMILY, ect->name, NETDATA_CACHESTAT_HIT_CHART); + ebpf_write_begin_chart(ect->name, NETDATA_CACHESTAT_HIT_CHART, ""); write_chart_dimension("hits", (long long)ect->publish_cachestat.hit); ebpf_write_end_chart(); - ebpf_write_begin_chart(NETDATA_SERVICE_FAMILY, ect->name, NETDATA_CACHESTAT_MISSES_CHART); + ebpf_write_begin_chart(ect->name, NETDATA_CACHESTAT_MISSES_CHART, ""); write_chart_dimension("misses", (long long)ect->publish_cachestat.miss); ebpf_write_end_chart(); } diff --git a/src/collectors/ebpf.plugin/ebpf_cachestat.h b/src/collectors/ebpf.plugin/ebpf_cachestat.h index 79d22b43d..6bb91b641 100644 --- a/src/collectors/ebpf.plugin/ebpf_cachestat.h +++ b/src/collectors/ebpf.plugin/ebpf_cachestat.h @@ -33,10 +33,10 @@ #define NETDATA_CGROUP_CACHESTAT_HIT_FILES_CONTEXT "cgroup.cachestat_hits" #define NETDATA_CGROUP_CACHESTAT_MISS_FILES_CONTEXT "cgroup.cachestat_misses" -#define NETDATA_SYSTEMD_CACHESTAT_HIT_RATIO_CONTEXT "systemd.services.cachestat_ratio" -#define NETDATA_SYSTEMD_CACHESTAT_MODIFIED_CACHE_CONTEXT "systemd.services.cachestat_dirties" -#define NETDATA_SYSTEMD_CACHESTAT_HIT_FILE_CONTEXT "systemd.services.cachestat_hits" -#define NETDATA_SYSTEMD_CACHESTAT_MISS_FILES_CONTEXT "systemd.services.cachestat_misses" +#define NETDATA_SYSTEMD_CACHESTAT_HIT_RATIO_CONTEXT "systemd.service.cachestat_ratio" +#define NETDATA_SYSTEMD_CACHESTAT_MODIFIED_CACHE_CONTEXT "systemd.service.cachestat_dirties" +#define NETDATA_SYSTEMD_CACHESTAT_HIT_FILE_CONTEXT "systemd.service.cachestat_hits" +#define NETDATA_SYSTEMD_CACHESTAT_MISS_FILES_CONTEXT "systemd.service.cachestat_misses" // variables enum cachestat_counters { @@ -69,20 +69,27 @@ enum cachestat_tables { NETDATA_CACHESTAT_CTRL }; -typedef struct netdata_publish_cachestat_pid { +typedef struct netdata_cachestat_pid { uint64_t ct; uint32_t tgid; uint32_t uid; uint32_t gid; char name[TASK_COMM_LEN]; - uint64_t add_to_page_cache_lru; - uint64_t mark_page_accessed; - uint64_t account_page_dirtied; - uint64_t mark_buffer_dirty; + uint32_t add_to_page_cache_lru; + uint32_t mark_page_accessed; + uint32_t account_page_dirtied; + uint32_t mark_buffer_dirty; } netdata_cachestat_pid_t; -typedef struct netdata_publish_cachestat { +typedef struct __attribute__((packed)) netdata_cachestat { + uint32_t add_to_page_cache_lru; + uint32_t mark_page_accessed; + uint32_t account_page_dirtied; + uint32_t mark_buffer_dirty; +} netdata_cachestat_t; + +typedef struct __attribute__((packed)) netdata_publish_cachestat { uint64_t ct; long long ratio; @@ -90,8 +97,8 @@ typedef struct netdata_publish_cachestat { long long hit; long long miss; - netdata_cachestat_pid_t current; - netdata_cachestat_pid_t prev; + netdata_cachestat_t current; + netdata_cachestat_t prev; } netdata_publish_cachestat_t; void *ebpf_cachestat_thread(void *ptr); diff --git a/src/collectors/ebpf.plugin/ebpf_cgroup.c b/src/collectors/ebpf.plugin/ebpf_cgroup.c index ae3bf3f8a..9e1fa8231 100644 --- a/src/collectors/ebpf.plugin/ebpf_cgroup.c +++ b/src/collectors/ebpf.plugin/ebpf_cgroup.c @@ -329,9 +329,9 @@ void ebpf_parse_cgroup_shm_data() */ void ebpf_create_charts_on_systemd(ebpf_systemd_args_t *chart) { - ebpf_write_chart_cmd(NETDATA_SERVICE_FAMILY, - chart->id, + ebpf_write_chart_cmd(chart->id, chart->suffix, + "", chart->title, chart->units, chart->family, @@ -340,9 +340,23 @@ void ebpf_create_charts_on_systemd(ebpf_systemd_args_t *chart) chart->order, chart->update_every, chart->module); - ebpf_create_chart_labels("service_name", chart->id, RRDLABEL_SRC_AUTO); + char service_name[512]; + snprintfz(service_name, 511, "%s", (!strstr(chart->id, "systemd_")) ? chart->id : (chart->id + 8)); + ebpf_create_chart_labels("service_name", service_name, RRDLABEL_SRC_AUTO); ebpf_commit_label(); - fprintf(stdout, "DIMENSION %s '' %s 1 1\n", chart->dimension, chart->algorithm); + // Let us keep original string that can be used in another place. Chart creation does not happen frequently. + char *move = strdupz(chart->dimension); + while (move) { + char *next_dim = strchr(move, ','); + if (next_dim) { + *next_dim = '\0'; + next_dim++; + } + + fprintf(stdout, "DIMENSION %s '' %s 1 1\n", move, chart->algorithm); + move = next_dim; + } + freez(move); } // -------------------------------------------------------------------------------------------------------------------- diff --git a/src/collectors/ebpf.plugin/ebpf_cgroup.h b/src/collectors/ebpf.plugin/ebpf_cgroup.h index 87df7bed2..65c8212bb 100644 --- a/src/collectors/ebpf.plugin/ebpf_cgroup.h +++ b/src/collectors/ebpf.plugin/ebpf_cgroup.h @@ -9,20 +9,18 @@ #include "ebpf.h" #include "ebpf_apps.h" -#define NETDATA_SERVICE_FAMILY "systemd" - struct pid_on_target2 { int32_t pid; int updated; netdata_publish_swap_t swap; - netdata_fd_stat_t fd; + netdata_publish_fd_stat_t fd; netdata_publish_vfs_t vfs; - ebpf_process_stat_t ps; + ebpf_publish_process_t ps; netdata_dcstat_pid_t dc; netdata_publish_shm_t shm; netdata_socket_t socket; - netdata_cachestat_pid_t cachestat; + netdata_publish_cachestat_t cachestat; struct pid_on_target2 *next; }; @@ -57,9 +55,9 @@ typedef struct ebpf_cgroup_target { uint32_t updated; netdata_publish_swap_t publish_systemd_swap; - netdata_fd_stat_t publish_systemd_fd; + netdata_publish_fd_stat_t publish_systemd_fd; netdata_publish_vfs_t publish_systemd_vfs; - ebpf_process_stat_t publish_systemd_ps; + ebpf_publish_process_t publish_systemd_ps; netdata_publish_dcstat_t publish_dc; int oomkill; netdata_publish_shm_t publish_shm; diff --git a/src/collectors/ebpf.plugin/ebpf_dcstat.c b/src/collectors/ebpf.plugin/ebpf_dcstat.c index d9455ed9c..e6053cb4a 100644 --- a/src/collectors/ebpf.plugin/ebpf_dcstat.c +++ b/src/collectors/ebpf.plugin/ebpf_dcstat.c @@ -279,9 +279,9 @@ static void ebpf_obsolete_specific_dc_charts(char *type, int update_every); */ static void ebpf_obsolete_dc_services(ebpf_module_t *em, char *id) { - ebpf_write_chart_obsolete(NETDATA_SERVICE_FAMILY, - id, + ebpf_write_chart_obsolete(id, NETDATA_DC_HIT_CHART, + "", "Percentage of files inside directory cache", EBPF_COMMON_UNITS_PERCENTAGE, NETDATA_DIRECTORY_CACHE_SUBMENU, @@ -290,9 +290,9 @@ static void ebpf_obsolete_dc_services(ebpf_module_t *em, char *id) 21200, em->update_every); - ebpf_write_chart_obsolete(NETDATA_SERVICE_FAMILY, - id, + ebpf_write_chart_obsolete(id, NETDATA_DC_REFERENCE_CHART, + "", "Count file access", EBPF_COMMON_UNITS_FILES, NETDATA_DIRECTORY_CACHE_SUBMENU, @@ -301,9 +301,9 @@ static void ebpf_obsolete_dc_services(ebpf_module_t *em, char *id) 21201, em->update_every); - ebpf_write_chart_obsolete(NETDATA_SERVICE_FAMILY, - id, + ebpf_write_chart_obsolete(id, NETDATA_DC_REQUEST_NOT_CACHE_CHART, + "", "Files not present inside directory cache", EBPF_COMMON_UNITS_FILES, NETDATA_DIRECTORY_CACHE_SUBMENU, @@ -312,9 +312,9 @@ static void ebpf_obsolete_dc_services(ebpf_module_t *em, char *id) 21202, em->update_every); - ebpf_write_chart_obsolete(NETDATA_SERVICE_FAMILY, - id, + ebpf_write_chart_obsolete(id, NETDATA_DC_REQUEST_NOT_FOUND_CHART, + "", "Files not found", EBPF_COMMON_UNITS_FILES, NETDATA_DIRECTORY_CACHE_SUBMENU, @@ -453,9 +453,14 @@ static void ebpf_obsolete_dc_global(ebpf_module_t *em) */ static void ebpf_dcstat_exit(void *pptr) { + pids_fd[EBPF_PIDS_DCSTAT_IDX] = -1; ebpf_module_t *em = CLEANUP_FUNCTION_GET_PTR(pptr); if(!em) return; + pthread_mutex_lock(&lock); + collect_pids &= ~(1<<EBPF_MODULE_DCSTAT_IDX); + pthread_mutex_unlock(&lock); + if (ebpf_read_dcstat.thread) nd_thread_signal_cancel(ebpf_read_dcstat.thread); @@ -524,6 +529,9 @@ static void ebpf_dcstat_apps_accumulator(netdata_dcstat_pid_t *out, int maps_per if (w->ct > ct) ct = w->ct; + + if (!total->name[0] && w->name[0]) + strncpyz(total->name, w->name, sizeof(total->name) - 1); } total->ct = ct; } @@ -534,8 +542,9 @@ static void ebpf_dcstat_apps_accumulator(netdata_dcstat_pid_t *out, int maps_per * Read the apps table and store data inside the structure. * * @param maps_per_core do I need to read all cores? + * @param max_period limit of iterations without updates before remove data from hash table */ -static void ebpf_read_dc_apps_table(int maps_per_core, int max_period) +static void ebpf_read_dc_apps_table(int maps_per_core, uint32_t max_period) { netdata_dcstat_pid_t *cv = dcstat_vector; int fd = dcstat_maps[NETDATA_DCSTAT_PID_STATS].map_fd; @@ -551,15 +560,25 @@ static void ebpf_read_dc_apps_table(int maps_per_core, int max_period) ebpf_dcstat_apps_accumulator(cv, maps_per_core); - ebpf_pid_stat_t *pid_stat = ebpf_get_pid_entry(key, cv->tgid); - if (pid_stat) { - netdata_publish_dcstat_t *publish = &pid_stat->dc; - if (!publish->ct || publish->ct != cv->ct) { - memcpy(&publish->curr, &cv[0], sizeof(netdata_dcstat_pid_t)); - pid_stat->not_updated = 0; - } else if (++pid_stat->not_updated >= max_period) { - bpf_map_delete_elem(fd, &key); - pid_stat->not_updated = 0; + ebpf_pid_data_t *pid_stat = ebpf_get_pid_data(key, cv->tgid, cv->name, EBPF_PIDS_DCSTAT_IDX); + netdata_publish_dcstat_t *publish = pid_stat->dc; + if (!publish) + pid_stat->dc = publish = ebpf_dcallocate_publish(); + + if (!publish->ct || publish->ct != cv->ct) { + publish->ct = cv->ct; + publish->curr.not_found = cv[0].not_found; + publish->curr.file_system = cv[0].file_system; + publish->curr.cache_access = cv[0].cache_access; + + pid_stat->not_updated = 0; + } else { + if (kill(key, 0)) { // No PID found + ebpf_reset_specific_pid_data(pid_stat); + } else { // There is PID, but there is not data anymore + ebpf_release_pid_data(pid_stat, fd, key, EBPF_PIDS_DCSTAT_IDX); + ebpf_dc_release_publish(publish); + pid_stat->dc = NULL; } } @@ -580,20 +599,17 @@ end_dc_loop: */ void ebpf_dcstat_sum_pids(netdata_publish_dcstat_t *publish, struct ebpf_pid_on_target *root) { - memset(&publish->curr, 0, sizeof(netdata_dcstat_pid_t)); - netdata_dcstat_pid_t *dst = &publish->curr; - while (root) { + memset(&publish->curr, 0, sizeof(netdata_publish_dcstat_pid_t)); + for (; root; root = root->next) { int32_t pid = root->pid; - ebpf_pid_stat_t *pid_stat = ebpf_get_pid_entry(pid, 0); - if (pid_stat) { - netdata_publish_dcstat_t *w = &pid_stat->dc; - netdata_dcstat_pid_t *src = &w->curr; - dst->cache_access += src->cache_access; - dst->file_system += src->file_system; - dst->not_found += src->not_found; - } + ebpf_pid_data_t *pid_stat = ebpf_get_pid_data(pid, 0, NULL, EBPF_PIDS_DCSTAT_IDX); + netdata_publish_dcstat_t *w = pid_stat->dc; + if (!w) + continue; - root = root->next; + publish->curr.cache_access += w->curr.cache_access; + publish->curr.file_system += w->curr.file_system; + publish->curr.not_found += w->curr.not_found; } } @@ -635,13 +651,17 @@ void *ebpf_read_dcstat_thread(void *ptr) int maps_per_core = em->maps_per_core; int update_every = em->update_every; + int collect_pid = (em->apps_charts || em->cgroup_charts); + if (!collect_pid) + return NULL; int counter = update_every - 1; uint32_t lifetime = em->lifetime; uint32_t running_time = 0; usec_t period = update_every * USEC_PER_SEC; - int max_period = update_every * EBPF_CLEANUP_FACTOR; + uint32_t max_period = EBPF_CLEANUP_FACTOR; + pids_fd[EBPF_PIDS_DCSTAT_IDX] = dcstat_maps[NETDATA_DCSTAT_PID_STATS].map_fd; while (!ebpf_plugin_stop() && running_time < lifetime) { (void)heartbeat_next(&hb, period); if (ebpf_plugin_stop() || ++counter != update_every) @@ -771,12 +791,12 @@ static void ebpf_update_dc_cgroup() for (pids = ect->pids; pids; pids = pids->next) { int pid = pids->pid; netdata_dcstat_pid_t *out = &pids->dc; - ebpf_pid_stat_t *local_pid = ebpf_get_pid_entry(pid, 0); - if (local_pid) { - netdata_publish_dcstat_t *in = &local_pid->dc; + ebpf_pid_data_t *local_pid = ebpf_get_pid_data(pid, 0, NULL, EBPF_PIDS_DCSTAT_IDX); + netdata_publish_dcstat_t *in = local_pid->dc; + if (!in) + continue; - memcpy(out, &in->curr, sizeof(netdata_dcstat_pid_t)); - } + memcpy(out, &in->curr, sizeof(netdata_publish_dcstat_pid_t)); } } pthread_mutex_unlock(&mutex_cgroup_shm); @@ -1001,13 +1021,12 @@ static void ebpf_obsolete_specific_dc_charts(char *type, int update_every) void ebpf_dc_sum_cgroup_pids(netdata_publish_dcstat_t *publish, struct pid_on_target2 *root) { memset(&publish->curr, 0, sizeof(netdata_dcstat_pid_t)); - netdata_dcstat_pid_t *dst = &publish->curr; while (root) { netdata_dcstat_pid_t *src = &root->dc; - dst->cache_access += src->cache_access; - dst->file_system += src->file_system; - dst->not_found += src->not_found; + publish->curr.cache_access += src->cache_access; + publish->curr.file_system += src->file_system; + publish->curr.not_found += src->not_found; root = root->next; } @@ -1139,22 +1158,22 @@ static void ebpf_send_systemd_dc_charts() continue; } - ebpf_write_begin_chart(NETDATA_SERVICE_FAMILY, ect->name, NETDATA_DC_HIT_CHART); + ebpf_write_begin_chart(ect->name, NETDATA_DC_HIT_CHART, ""); write_chart_dimension("percentage", (long long) ect->publish_dc.ratio); ebpf_write_end_chart(); - ebpf_write_begin_chart(NETDATA_SERVICE_FAMILY, ect->name, NETDATA_DC_REFERENCE_CHART); + ebpf_write_begin_chart(ect->name, NETDATA_DC_REFERENCE_CHART, ""); write_chart_dimension("files", (long long) ect->publish_dc.cache_access); ebpf_write_end_chart(); - ebpf_write_begin_chart(NETDATA_SERVICE_FAMILY, ect->name, NETDATA_DC_REQUEST_NOT_CACHE_CHART); + ebpf_write_begin_chart(ect->name, NETDATA_DC_REQUEST_NOT_CACHE_CHART, ""); value = (collected_number) (!ect->publish_dc.cache_access) ? 0 : (long long )ect->publish_dc.curr.file_system - (long long)ect->publish_dc.prev.file_system; ect->publish_dc.prev.file_system = ect->publish_dc.curr.file_system; write_chart_dimension("files", (long long) value); ebpf_write_end_chart(); - ebpf_write_begin_chart(NETDATA_SERVICE_FAMILY, ect->name, NETDATA_DC_REQUEST_NOT_FOUND_CHART); + ebpf_write_begin_chart(ect->name, NETDATA_DC_REQUEST_NOT_FOUND_CHART, ""); value = (collected_number) (!ect->publish_dc.cache_access) ? 0 : (long long)ect->publish_dc.curr.not_found - (long long)ect->publish_dc.prev.not_found; diff --git a/src/collectors/ebpf.plugin/ebpf_dcstat.h b/src/collectors/ebpf.plugin/ebpf_dcstat.h index 82f21f48c..a7e9f82b7 100644 --- a/src/collectors/ebpf.plugin/ebpf_dcstat.h +++ b/src/collectors/ebpf.plugin/ebpf_dcstat.h @@ -3,6 +3,8 @@ #ifndef NETDATA_EBPF_DCSTAT_H #define NETDATA_EBPF_DCSTAT_H 1 +#include "ebpf.h" + // Module name & description #define NETDATA_EBPF_MODULE_NAME_DCSTAT "dcstat" #define NETDATA_EBPF_DC_MODULE_DESC "Monitor file access using directory cache. This thread is integrated with apps and cgroup." @@ -27,10 +29,10 @@ #define NETDATA_CGROUP_DC_NOT_CACHE_CONTEXT "cgroup.dc_not_cache" #define NETDATA_CGROUP_DC_NOT_FOUND_CONTEXT "cgroup.dc_not_found" -#define NETDATA_SYSTEMD_DC_HIT_RATIO_CONTEXT "systemd.services.dc_ratio" -#define NETDATA_SYSTEMD_DC_REFERENCE_CONTEXT "systemd.services.dc_reference" -#define NETDATA_SYSTEMD_DC_NOT_CACHE_CONTEXT "systemd.services.dc_not_cache" -#define NETDATA_SYSTEMD_DC_NOT_FOUND_CONTEXT "systemd.services.dc_not_found" +#define NETDATA_SYSTEMD_DC_HIT_RATIO_CONTEXT "systemd.service.dc_ratio" +#define NETDATA_SYSTEMD_DC_REFERENCE_CONTEXT "systemd.service.dc_reference" +#define NETDATA_SYSTEMD_DC_NOT_CACHE_CONTEXT "systemd.service.dc_not_cache" +#define NETDATA_SYSTEMD_DC_NOT_FOUND_CONTEXT "systemd.service.dc_not_found" // ARAL name #define NETDATA_EBPF_DCSTAT_ARAL_NAME "ebpf_dcstat" @@ -69,26 +71,32 @@ enum directory_cache_targets { NETDATA_DC_TARGET_D_LOOKUP }; -typedef struct netdata_publish_dcstat_pid { +typedef struct __attribute__((packed)) netdata_publish_dcstat_pid { + uint64_t cache_access; + uint32_t file_system; + uint32_t not_found; +} netdata_publish_dcstat_pid_t; + +typedef struct netdata_dcstat_pid { uint64_t ct; uint32_t tgid; uint32_t uid; uint32_t gid; char name[TASK_COMM_LEN]; - uint64_t cache_access; - uint64_t file_system; - uint64_t not_found; + uint32_t cache_access; + uint32_t file_system; + uint32_t not_found; } netdata_dcstat_pid_t; -typedef struct netdata_publish_dcstat { +typedef struct __attribute__((packed)) netdata_publish_dcstat { uint64_t ct; long long ratio; long long cache_access; - netdata_dcstat_pid_t curr; - netdata_dcstat_pid_t prev; + netdata_publish_dcstat_pid_t curr; + netdata_publish_dcstat_pid_t prev; } netdata_publish_dcstat_t; void *ebpf_dcstat_thread(void *ptr); diff --git a/src/collectors/ebpf.plugin/ebpf_fd.c b/src/collectors/ebpf.plugin/ebpf_fd.c index 4025931f7..61a9595cc 100644 --- a/src/collectors/ebpf.plugin/ebpf_fd.c +++ b/src/collectors/ebpf.plugin/ebpf_fd.c @@ -365,9 +365,9 @@ static void ebpf_obsolete_specific_fd_charts(char *type, ebpf_module_t *em); */ static void ebpf_obsolete_fd_services(ebpf_module_t *em, char *id) { - ebpf_write_chart_obsolete(NETDATA_SERVICE_FAMILY, - id, + ebpf_write_chart_obsolete(id, NETDATA_SYSCALL_APPS_FILE_OPEN, + "", "Number of open files", EBPF_COMMON_UNITS_CALLS_PER_SEC, NETDATA_APPS_FILE_GROUP, @@ -377,9 +377,9 @@ static void ebpf_obsolete_fd_services(ebpf_module_t *em, char *id) em->update_every); if (em->mode < MODE_ENTRY) { - ebpf_write_chart_obsolete(NETDATA_SERVICE_FAMILY, - id, + ebpf_write_chart_obsolete(id, NETDATA_SYSCALL_APPS_FILE_OPEN_ERROR, + "", "Fails to open files", EBPF_COMMON_UNITS_CALLS_PER_SEC, NETDATA_APPS_FILE_GROUP, @@ -389,9 +389,9 @@ static void ebpf_obsolete_fd_services(ebpf_module_t *em, char *id) em->update_every); } - ebpf_write_chart_obsolete(NETDATA_SERVICE_FAMILY, - id, + ebpf_write_chart_obsolete(id, NETDATA_SYSCALL_APPS_FILE_CLOSED, + "", "Files closed", EBPF_COMMON_UNITS_CALLS_PER_SEC, NETDATA_APPS_FILE_GROUP, @@ -401,9 +401,9 @@ static void ebpf_obsolete_fd_services(ebpf_module_t *em, char *id) em->update_every); if (em->mode < MODE_ENTRY) { - ebpf_write_chart_obsolete(NETDATA_SERVICE_FAMILY, - id, + ebpf_write_chart_obsolete(id, NETDATA_SYSCALL_APPS_FILE_CLOSE_ERROR, + "", "Fails to close files", EBPF_COMMON_UNITS_CALLS_PER_SEC, NETDATA_APPS_FILE_GROUP, @@ -548,9 +548,14 @@ static void ebpf_obsolete_fd_global(ebpf_module_t *em) */ static void ebpf_fd_exit(void *pptr) { + pids_fd[EBPF_PIDS_FD_IDX] = -1; ebpf_module_t *em = CLEANUP_FUNCTION_GET_PTR(pptr); if(!em) return; + pthread_mutex_lock(&lock); + collect_pids &= ~(1<<EBPF_MODULE_FD_IDX); + pthread_mutex_unlock(&lock); + if (ebpf_read_fd.thread) nd_thread_signal_cancel(ebpf_read_fd.thread); @@ -656,12 +661,19 @@ static void fd_apps_accumulator(netdata_fd_stat_t *out, int maps_per_core) { int i, end = (maps_per_core) ? ebpf_nprocs : 1; netdata_fd_stat_t *total = &out[0]; + uint64_t ct = total->ct; for (i = 1; i < end; i++) { netdata_fd_stat_t *w = &out[i]; total->open_call += w->open_call; total->close_call += w->close_call; total->open_err += w->open_err; total->close_err += w->close_err; + + if (w->ct > ct) + ct = w->ct; + + if (!total->name[0] && w->name[0]) + strncpyz(total->name, w->name, sizeof(total->name) - 1); } } @@ -671,8 +683,9 @@ static void fd_apps_accumulator(netdata_fd_stat_t *out, int maps_per_core) * Read the apps table and store data inside the structure. * * @param maps_per_core do I need to read all cores? + * @param max_period limit of iterations without updates before remove data from hash table */ -static void ebpf_read_fd_apps_table(int maps_per_core, int max_period) +static void ebpf_read_fd_apps_table(int maps_per_core, uint32_t max_period) { netdata_fd_stat_t *fv = fd_vector; int fd = fd_maps[NETDATA_FD_PID_STATS].map_fd; @@ -688,15 +701,26 @@ static void ebpf_read_fd_apps_table(int maps_per_core, int max_period) fd_apps_accumulator(fv, maps_per_core); - ebpf_pid_stat_t *pid_stat = ebpf_get_pid_entry(key, fv->tgid); - if (pid_stat) { - netdata_fd_stat_t *publish_fd = &pid_stat->fd; - if (!publish_fd->ct || publish_fd->ct != fv->ct) { - memcpy(publish_fd, &fv[0], sizeof(netdata_fd_stat_t)); - pid_stat->not_updated = 0; - } else if (++pid_stat->not_updated >= max_period) { - bpf_map_delete_elem(fd, &key); - pid_stat->not_updated = 0; + ebpf_pid_data_t *pid_stat = ebpf_get_pid_data(key, fv->tgid, fv->name, EBPF_PIDS_FD_IDX); + netdata_publish_fd_stat_t *publish_fd = pid_stat->fd; + if (!publish_fd) + pid_stat->fd = publish_fd = ebpf_fd_allocate_publish(); + + if (!publish_fd->ct || publish_fd->ct != fv->ct) { + publish_fd->ct = fv->ct; + publish_fd->open_call = fv->open_call; + publish_fd->close_call = fv->close_call; + publish_fd->open_err = fv->open_err; + publish_fd->close_err = fv->close_err; + + pid_stat->not_updated = 0; + } else { + if (kill(key, 0)) { // No PID found + ebpf_reset_specific_pid_data(pid_stat); + } else { // There is PID, but there is not data anymore + ebpf_release_pid_data(pid_stat, fd, key, EBPF_PIDS_FD_IDX); + ebpf_fd_release_publish(publish_fd); + pid_stat->fd = NULL; } } @@ -719,18 +743,17 @@ static void ebpf_fd_sum_pids(netdata_fd_stat_t *fd, struct ebpf_pid_on_target *r { memset(fd, 0, sizeof(netdata_fd_stat_t)); - while (root) { + for (; root; root = root->next) { int32_t pid = root->pid; - ebpf_pid_stat_t *pid_stat = ebpf_get_pid_entry(pid, 0); - if (pid_stat) { - netdata_fd_stat_t *w = &pid_stat->fd; - fd->open_call += w->open_call; - fd->close_call += w->close_call; - fd->open_err += w->open_err; - fd->close_err += w->close_err; - } + ebpf_pid_data_t *pid_stat = ebpf_get_pid_data(pid, 0, NULL, EBPF_PIDS_FD_IDX); + netdata_publish_fd_stat_t *w = pid_stat->fd; + if (!w) + continue; - root = root->next; + fd->open_call += w->open_call; + fd->close_call += w->close_call; + fd->open_err += w->open_err; + fd->close_err += w->close_err; } } @@ -767,13 +790,17 @@ void *ebpf_read_fd_thread(void *ptr) int maps_per_core = em->maps_per_core; int update_every = em->update_every; + int collect_pid = (em->apps_charts || em->cgroup_charts); + if (!collect_pid) + return NULL; int counter = update_every - 1; uint32_t lifetime = em->lifetime; uint32_t running_time = 0; - usec_t period = update_every * USEC_PER_SEC; - int max_period = update_every * EBPF_CLEANUP_FACTOR; + int period = USEC_PER_SEC; + uint32_t max_period = EBPF_CLEANUP_FACTOR; + pids_fd[EBPF_PIDS_FD_IDX] = fd_maps[NETDATA_FD_PID_STATS].map_fd; while (!ebpf_plugin_stop() && running_time < lifetime) { (void)heartbeat_next(&hb, period); if (ebpf_plugin_stop() || ++counter != update_every) @@ -815,13 +842,12 @@ static void ebpf_update_fd_cgroup() struct pid_on_target2 *pids; for (pids = ect->pids; pids; pids = pids->next) { int pid = pids->pid; - netdata_fd_stat_t *out = &pids->fd; - ebpf_pid_stat_t *local_pid = ebpf_get_pid_entry(pid, 0); - if (local_pid) { - netdata_fd_stat_t *in = &local_pid->fd; - - memcpy(out, in, sizeof(netdata_fd_stat_t)); - } + netdata_publish_fd_stat_t *out = &pids->fd; + ebpf_pid_data_t *local_pid = ebpf_get_pid_data(pid, 0, NULL, EBPF_PIDS_FD_IDX); + netdata_publish_fd_stat_t *in = local_pid->fd; + if (!in) + continue; + memcpy(out, in, sizeof(netdata_publish_fd_stat_t)); } } pthread_mutex_unlock(&mutex_cgroup_shm); @@ -872,13 +898,13 @@ void ebpf_fd_send_apps_data(ebpf_module_t *em, struct ebpf_target *root) * @param fd structure used to store data * @param pids input data */ -static void ebpf_fd_sum_cgroup_pids(netdata_fd_stat_t *fd, struct pid_on_target2 *pids) +static void ebpf_fd_sum_cgroup_pids(netdata_publish_fd_stat_t *fd, struct pid_on_target2 *pids) { netdata_fd_stat_t accumulator; memset(&accumulator, 0, sizeof(accumulator)); while (pids) { - netdata_fd_stat_t *w = &pids->fd; + netdata_publish_fd_stat_t *w = &pids->fd; accumulator.open_err += w->open_err; accumulator.open_call += w->open_call; @@ -995,7 +1021,7 @@ static void ebpf_obsolete_specific_fd_charts(char *type, ebpf_module_t *em) * @param type chart type * @param values structure with values that will be sent to netdata */ -static void ebpf_send_specific_fd_data(char *type, netdata_fd_stat_t *values, ebpf_module_t *em) +static void ebpf_send_specific_fd_data(char *type, netdata_publish_fd_stat_t *values, ebpf_module_t *em) { ebpf_write_begin_chart(type, NETDATA_SYSCALL_APPS_FILE_OPEN, ""); write_chart_dimension(fd_publish_aggregated[NETDATA_FD_SYSCALL_OPEN].name, (long long)values->open_call); @@ -1120,22 +1146,22 @@ static void ebpf_send_systemd_fd_charts(ebpf_module_t *em) continue; } - ebpf_write_begin_chart(NETDATA_SERVICE_FAMILY, ect->name, NETDATA_SYSCALL_APPS_FILE_OPEN); + ebpf_write_begin_chart(ect->name, NETDATA_SYSCALL_APPS_FILE_OPEN, ""); write_chart_dimension("calls", ect->publish_systemd_fd.open_call); ebpf_write_end_chart(); if (em->mode < MODE_ENTRY) { - ebpf_write_begin_chart(NETDATA_SERVICE_FAMILY, ect->name, NETDATA_SYSCALL_APPS_FILE_OPEN_ERROR); + ebpf_write_begin_chart(ect->name, NETDATA_SYSCALL_APPS_FILE_OPEN_ERROR, ""); write_chart_dimension("calls", ect->publish_systemd_fd.open_err); ebpf_write_end_chart(); } - ebpf_write_begin_chart(NETDATA_SERVICE_FAMILY, ect->name, NETDATA_SYSCALL_APPS_FILE_CLOSED); + ebpf_write_begin_chart(ect->name, NETDATA_SYSCALL_APPS_FILE_CLOSED, ""); write_chart_dimension("calls", ect->publish_systemd_fd.close_call); ebpf_write_end_chart(); if (em->mode < MODE_ENTRY) { - ebpf_write_begin_chart(NETDATA_SERVICE_FAMILY, ect->name, NETDATA_SYSCALL_APPS_FILE_CLOSE_ERROR); + ebpf_write_begin_chart(ect->name, NETDATA_SYSCALL_APPS_FILE_CLOSE_ERROR, ""); write_chart_dimension("calls", ect->publish_systemd_fd.close_err); ebpf_write_end_chart(); } @@ -1463,7 +1489,8 @@ void *ebpf_fd_thread(void *ptr) pthread_mutex_unlock(&lock); - ebpf_read_fd.thread = nd_thread_create(ebpf_read_fd.name, NETDATA_THREAD_OPTION_DEFAULT, ebpf_read_fd_thread, em); + ebpf_read_fd.thread = nd_thread_create(ebpf_read_fd.name, NETDATA_THREAD_OPTION_DEFAULT, + ebpf_read_fd_thread, em); fd_collector(em); diff --git a/src/collectors/ebpf.plugin/ebpf_fd.h b/src/collectors/ebpf.plugin/ebpf_fd.h index d4975940e..90ecdb13e 100644 --- a/src/collectors/ebpf.plugin/ebpf_fd.h +++ b/src/collectors/ebpf.plugin/ebpf_fd.h @@ -32,14 +32,25 @@ #define NETDATA_CGROUP_FD_CLOSE_CONTEXT "cgroup.fd_close" #define NETDATA_CGROUP_FD_CLOSE_ERR_CONTEXT "cgroup.fd_close_error" -#define NETDATA_SYSTEMD_FD_OPEN_CONTEXT "systemd.services.fd_open" -#define NETDATA_SYSTEMD_FD_OPEN_ERR_CONTEXT "systemd.services.fd_open_error" -#define NETDATA_SYSTEMD_FD_CLOSE_CONTEXT "systemd.services.fd_close" -#define NETDATA_SYSTEMD_FD_CLOSE_ERR_CONTEXT "systemd.services.fd_close_error" +#define NETDATA_SYSTEMD_FD_OPEN_CONTEXT "systemd.service.fd_open" +#define NETDATA_SYSTEMD_FD_OPEN_ERR_CONTEXT "systemd.service.fd_open_error" +#define NETDATA_SYSTEMD_FD_CLOSE_CONTEXT "systemd.service.fd_close" +#define NETDATA_SYSTEMD_FD_CLOSE_ERR_CONTEXT "systemd.service.fd_close_error" // ARAL name #define NETDATA_EBPF_FD_ARAL_NAME "ebpf_fd" +typedef struct __attribute__((packed)) netdata_publish_fd_stat { + uint64_t ct; + + uint32_t open_call; // Open syscalls (open and openat) + uint32_t close_call; // Close syscall (close) + + // Errors + uint32_t open_err; + uint32_t close_err; +} netdata_publish_fd_stat_t; + typedef struct netdata_fd_stat { uint64_t ct; uint32_t tgid; diff --git a/src/collectors/ebpf.plugin/ebpf_filesystem.c b/src/collectors/ebpf.plugin/ebpf_filesystem.c index c56dea4b1..1187b03e9 100644 --- a/src/collectors/ebpf.plugin/ebpf_filesystem.c +++ b/src/collectors/ebpf.plugin/ebpf_filesystem.c @@ -334,6 +334,46 @@ static inline int ebpf_fs_load_and_attach(ebpf_local_maps_t *map, struct filesys *****************************************************************/ /** + * Obsolete Cleanup Struct + * + * Clean allocatged data durinc obsolete steps + * + * @param efp + */ +static void ebpf_obsolete_cleanup_struct(ebpf_filesystem_partitions_t *efp) { + freez(efp->hread.name); + efp->hread.name = NULL; + freez(efp->hread.title); + efp->hread.title = NULL; + freez(efp->hread.ctx); + efp->hread.ctx = NULL; + + freez(efp->hwrite.name); + efp->hwrite.name = NULL; + freez(efp->hwrite.title); + efp->hwrite.title = NULL; + freez(efp->hwrite.ctx); + efp->hwrite.ctx = NULL; + + freez(efp->hopen.name); + efp->hopen.name = NULL; + freez(efp->hopen.title); + efp->hopen.title = NULL; + freez(efp->hopen.ctx); + efp->hopen.ctx = NULL; + + freez(efp->hadditional.name); + efp->hadditional.name = NULL; + freez(efp->hadditional.title); + efp->hadditional.title = NULL; + freez(efp->hadditional.ctx); + efp->hadditional.ctx = NULL; + + freez(efp->family_name); + efp->family_name = NULL; +} + +/** * Create Filesystem chart * * Create latency charts @@ -348,7 +388,7 @@ static void ebpf_obsolete_fs_charts(int update_every) ebpf_filesystem_partitions_t *efp = &localfs[i]; uint32_t flags = efp->flags; if ((flags & test) == test) { - flags &= ~NETDATA_FILESYSTEM_FLAG_CHART_CREATED; + flags &= ~test; ebpf_write_chart_obsolete(NETDATA_FILESYSTEM_FAMILY, efp->hread.name, "", @@ -370,6 +410,8 @@ static void ebpf_obsolete_fs_charts(int update_every) EBPF_COMMON_UNITS_CALLS_PER_SEC, efp->family_name, NULL, NETDATA_EBPF_CHART_TYPE_STACKED, efp->hadditional.order, update_every); + + ebpf_obsolete_cleanup_struct(efp); } efp->flags = flags; } @@ -395,9 +437,10 @@ static void ebpf_create_fs_charts(int update_every) snprintfz(title, sizeof(title) - 1, "%s latency for each read request.", efp->filesystem); snprintfz(family, sizeof(family) - 1, "%s_latency", efp->family); snprintfz(chart_name, sizeof(chart_name) - 1, "%s_read_latency", efp->filesystem); + snprintfz(ctx, sizeof(ctx) - 1, "filesystem.read_latency"); efp->hread.name = strdupz(chart_name); efp->hread.title = strdupz(title); - efp->hread.ctx = NULL; + efp->hread.ctx = strdupz(ctx); efp->hread.order = order; efp->family_name = strdupz(family); @@ -412,9 +455,10 @@ static void ebpf_create_fs_charts(int update_every) snprintfz(title, sizeof(title) - 1, "%s latency for each write request.", efp->filesystem); snprintfz(chart_name, sizeof(chart_name) - 1, "%s_write_latency", efp->filesystem); + snprintfz(ctx, sizeof(ctx) - 1, "filesystem.write_latency"); efp->hwrite.name = strdupz(chart_name); efp->hwrite.title = strdupz(title); - efp->hwrite.ctx = NULL; + efp->hwrite.ctx = strdupz(ctx); efp->hwrite.order = order; ebpf_create_chart(NETDATA_FILESYSTEM_FAMILY, efp->hwrite.name, efp->hwrite.title, @@ -427,9 +471,10 @@ static void ebpf_create_fs_charts(int update_every) snprintfz(title, sizeof(title) - 1, "%s latency for each open request.", efp->filesystem); snprintfz(chart_name, sizeof(chart_name) - 1, "%s_open_latency", efp->filesystem); + snprintfz(ctx, sizeof(ctx) - 1, "filesystem.open_latency"); efp->hopen.name = strdupz(chart_name); efp->hopen.title = strdupz(title); - efp->hopen.ctx = NULL; + efp->hopen.ctx = strdupz(ctx); efp->hopen.order = order; ebpf_create_chart(NETDATA_FILESYSTEM_FAMILY, efp->hopen.name, efp->hopen.title, @@ -443,7 +488,7 @@ static void ebpf_create_fs_charts(int update_every) char *type = (efp->flags & NETDATA_FILESYSTEM_ATTR_CHARTS) ? "attribute" : "sync"; snprintfz(title, sizeof(title) - 1, "%s latency for each %s request.", efp->filesystem, type); snprintfz(chart_name, sizeof(chart_name) - 1, "%s_%s_latency", efp->filesystem, type); - snprintfz(ctx, sizeof(ctx) - 1, "filesystem.%s_latency", type); + snprintfz(ctx, sizeof(ctx) - 1, "filesystem.%s_latency", efp->filesystem); efp->hadditional.name = strdupz(chart_name); efp->hadditional.title = strdupz(title); efp->hadditional.ctx = strdupz(ctx); @@ -499,11 +544,14 @@ int ebpf_filesystem_initialize_ebpf_data(ebpf_module_t *em) if (!efp->fs_obj) { em->info.thread_name = saved_name; em->kernels = kernels; + pthread_mutex_unlock(&lock); + return -1; + } else if (ebpf_fs_load_and_attach(em->maps, efp->fs_obj, + efp->functions, NULL)) { + em->info.thread_name = saved_name; + em->kernels = kernels; + pthread_mutex_unlock(&lock); return -1; - } else { - if (ebpf_fs_load_and_attach(em->maps, efp->fs_obj, - efp->functions, NULL)) - return -1; } } #endif @@ -572,7 +620,9 @@ static int ebpf_read_local_partitions() ebpf_filesystem_partitions_t *w = &localfs[i]; if (w->enabled && (!strcmp(fs, w->filesystem) || (w->optional_filesystem && !strcmp(fs, w->optional_filesystem)))) { - localfs[i].flags |= NETDATA_FILESYSTEM_LOAD_EBPF_PROGRAM; + if (!(localfs[i].flags & NETDATA_FILESYSTEM_FLAG_CHART_CREATED)) + localfs[i].flags |= NETDATA_FILESYSTEM_LOAD_EBPF_PROGRAM; + localfs[i].flags &= ~NETDATA_FILESYSTEM_REMOVE_CHARTS; count++; break; @@ -756,8 +806,8 @@ static void ebpf_filesystem_exit(void *pptr) pthread_mutex_lock(&lock); ebpf_obsolete_filesystem_global(em); - pthread_mutex_unlock(&lock); fflush(stdout); + pthread_mutex_unlock(&lock); } ebpf_filesystem_cleanup_ebpf_data(); @@ -889,10 +939,10 @@ static void read_filesystem_tables(int maps_per_core) */ void ebpf_filesystem_read_hash(ebpf_module_t *em) { - ebpf_obsolete_fs_charts(em->update_every); - (void) ebpf_update_partitions(em); + ebpf_obsolete_fs_charts(em->update_every); + if (em->optional) return; diff --git a/src/collectors/ebpf.plugin/ebpf_functions.c b/src/collectors/ebpf.plugin/ebpf_functions.c index 4a43bf434..8e9fb01ed 100644 --- a/src/collectors/ebpf.plugin/ebpf_functions.c +++ b/src/collectors/ebpf.plugin/ebpf_functions.c @@ -331,7 +331,7 @@ static void ebpf_function_socket_manipulation(const char *transaction, "Filters can be combined. Each filter can be given only one time. Default all ports\n" }; -for (int i = 1; i < PLUGINSD_MAX_WORDS; i++) { + for (int i = 1; i < PLUGINSD_MAX_WORDS; i++) { const char *keyword = get_word(words, num_words, i); if (!keyword) break; @@ -428,6 +428,7 @@ for (int i = 1; i < PLUGINSD_MAX_WORDS; i++) { ebpf_socket_clean_judy_array_unsafe(); rw_spinlock_write_unlock(&ebpf_judy_pid.index.rw_spinlock); + collect_pids |= 1<<EBPF_MODULE_SOCKET_IDX; pthread_mutex_lock(&ebpf_exit_cleanup); if (ebpf_function_start_thread(em, period)) { ebpf_function_error(transaction, diff --git a/src/collectors/ebpf.plugin/ebpf_oomkill.c b/src/collectors/ebpf.plugin/ebpf_oomkill.c index 8ecd0883c..34361550b 100644 --- a/src/collectors/ebpf.plugin/ebpf_oomkill.c +++ b/src/collectors/ebpf.plugin/ebpf_oomkill.c @@ -55,9 +55,9 @@ static void ebpf_obsolete_specific_oomkill_charts(char *type, int update_every); */ static void ebpf_obsolete_oomkill_services(ebpf_module_t *em, char *id) { - ebpf_write_chart_obsolete(NETDATA_SERVICE_FAMILY, - id, + ebpf_write_chart_obsolete(id, NETDATA_OOMKILL_CHART, + "", "Systemd service OOM kills.", EBPF_OOMKILL_UNIT_KILLS, NETDATA_EBPF_MEMORY_GROUP, @@ -133,6 +133,10 @@ static void oomkill_cleanup(void *pptr) ebpf_module_t *em = CLEANUP_FUNCTION_GET_PTR(pptr); if(!em) return; + pthread_mutex_lock(&lock); + collect_pids &= ~(1<<EBPF_MODULE_OOMKILL_IDX); + pthread_mutex_unlock(&lock); + if (em->enabled == NETDATA_THREAD_EBPF_FUNCTION_RUNNING) { pthread_mutex_lock(&lock); @@ -242,7 +246,7 @@ static void ebpf_create_systemd_oomkill_charts(int update_every) .charttype = NETDATA_EBPF_CHART_TYPE_STACKED, .order = 20191, .algorithm = EBPF_CHART_ALGORITHM_INCREMENTAL, - .context = NETDATA_CGROUP_OOMKILLS_CONTEXT, + .context = NETDATA_SYSTEMD_OOMKILLS_CONTEXT, .module = NETDATA_EBPF_MODULE_NAME_OOMKILL, .update_every = 0, .suffix = NETDATA_OOMKILL_CHART, @@ -276,7 +280,7 @@ static void ebpf_send_systemd_oomkill_charts() if (unlikely(!(ect->flags & NETDATA_EBPF_SERVICES_HAS_OOMKILL_CHART)) ) { continue; } - ebpf_write_begin_chart(NETDATA_SERVICE_FAMILY, ect->name, NETDATA_OOMKILL_CHART); + ebpf_write_begin_chart(ect->name, NETDATA_OOMKILL_CHART, ""); write_chart_dimension(oomkill_publish_aggregated.dimension, (long long) ect->oomkill); ect->oomkill = 0; ebpf_write_end_chart(); @@ -549,7 +553,7 @@ void *ebpf_oomkill_thread(void *ptr) em->maps = oomkill_maps; #define NETDATA_DEFAULT_OOM_DISABLED_MSG "Disabling OOMKILL thread, because" - if (unlikely(!ebpf_all_pids || !em->apps_charts)) { + if (unlikely(!em->apps_charts)) { // When we are not running integration with apps, we won't fill necessary variables for this thread to run, so // we need to disable it. pthread_mutex_lock(&ebpf_exit_cleanup); diff --git a/src/collectors/ebpf.plugin/ebpf_oomkill.h b/src/collectors/ebpf.plugin/ebpf_oomkill.h index 0d02da9d3..0504181c2 100644 --- a/src/collectors/ebpf.plugin/ebpf_oomkill.h +++ b/src/collectors/ebpf.plugin/ebpf_oomkill.h @@ -28,6 +28,7 @@ typedef uint8_t oomkill_ebpf_val_t; // Contexts #define NETDATA_CGROUP_OOMKILLS_CONTEXT "cgroup.oomkills" +#define NETDATA_SYSTEMD_OOMKILLS_CONTEXT "systemd.oomkills" extern struct config oomkill_config; void *ebpf_oomkill_thread(void *ptr); diff --git a/src/collectors/ebpf.plugin/ebpf_process.c b/src/collectors/ebpf.plugin/ebpf_process.c index e5756fa3c..d2810f899 100644 --- a/src/collectors/ebpf.plugin/ebpf_process.c +++ b/src/collectors/ebpf.plugin/ebpf_process.c @@ -229,13 +229,13 @@ static void ebpf_update_process_cgroup() struct pid_on_target2 *pids; for (pids = ect->pids; pids; pids = pids->next) { int pid = pids->pid; - ebpf_process_stat_t *out = &pids->ps; - ebpf_pid_stat_t *local_pid = ebpf_get_pid_entry(pid, 0); - if (local_pid) { - ebpf_process_stat_t *in = &local_pid->process; + ebpf_publish_process_t *out = &pids->ps; + ebpf_pid_data_t *local_pid = ebpf_get_pid_data(pid, 0, NULL, EBPF_PIDS_PROCESS_IDX); + ebpf_publish_process_t *in = local_pid->process; + if (!in) + continue; - memcpy(out, in, sizeof(ebpf_process_stat_t)); - } + memcpy(out, in, sizeof(ebpf_publish_process_t)); } } pthread_mutex_unlock(&mutex_cgroup_shm); @@ -445,9 +445,9 @@ static void ebpf_obsolete_specific_process_charts(char *type, ebpf_module_t *em) */ static void ebpf_obsolete_process_services(ebpf_module_t *em, char *id) { - ebpf_write_chart_obsolete(NETDATA_SERVICE_FAMILY, - id, + ebpf_write_chart_obsolete(id, NETDATA_SYSCALL_APPS_TASK_PROCESS, + "", "Process started", EBPF_COMMON_UNITS_CALLS_PER_SEC, NETDATA_APPS_PROCESS_GROUP, @@ -456,9 +456,9 @@ static void ebpf_obsolete_process_services(ebpf_module_t *em, char *id) 20065, em->update_every); - ebpf_write_chart_obsolete(NETDATA_SERVICE_FAMILY, - id, + ebpf_write_chart_obsolete(id, NETDATA_SYSCALL_APPS_TASK_THREAD, + "", "Threads started", EBPF_COMMON_UNITS_CALLS_PER_SEC, NETDATA_APPS_PROCESS_GROUP, @@ -467,9 +467,9 @@ static void ebpf_obsolete_process_services(ebpf_module_t *em, char *id) 20066, em->update_every); - ebpf_write_chart_obsolete(NETDATA_SERVICE_FAMILY, - id, + ebpf_write_chart_obsolete(id, NETDATA_SYSCALL_APPS_TASK_CLOSE, + "", "Tasks starts exit process.", EBPF_COMMON_UNITS_CALLS_PER_SEC, NETDATA_APPS_PROCESS_GROUP, @@ -478,9 +478,9 @@ static void ebpf_obsolete_process_services(ebpf_module_t *em, char *id) 20067, em->update_every); - ebpf_write_chart_obsolete(NETDATA_SERVICE_FAMILY, - id, + ebpf_write_chart_obsolete(id, NETDATA_SYSCALL_APPS_TASK_EXIT, + "", "Tasks closed", EBPF_COMMON_UNITS_CALLS_PER_SEC, NETDATA_APPS_PROCESS_GROUP, @@ -490,9 +490,9 @@ static void ebpf_obsolete_process_services(ebpf_module_t *em, char *id) em->update_every); if (em->mode < MODE_ENTRY) { - ebpf_write_chart_obsolete(NETDATA_SERVICE_FAMILY, - id, + ebpf_write_chart_obsolete(id, NETDATA_SYSCALL_APPS_TASK_ERROR, + "", "Errors to create process or threads.", EBPF_COMMON_UNITS_CALLS_PER_SEC, NETDATA_APPS_PROCESS_GROUP, @@ -691,9 +691,14 @@ static void ebpf_process_disable_tracepoints() */ static void ebpf_process_exit(void *pptr) { + pids_fd[EBPF_PIDS_PROCESS_IDX] = -1; ebpf_module_t *em = CLEANUP_FUNCTION_GET_PTR(pptr); if(!em) return; + pthread_mutex_lock(&lock); + collect_pids &= ~(1<<EBPF_MODULE_PROCESS_IDX); + pthread_mutex_unlock(&lock); + if (em->enabled == NETDATA_THREAD_EBPF_FUNCTION_RUNNING) { pthread_mutex_lock(&lock); if (em->cgroup_charts) { @@ -746,13 +751,13 @@ static void ebpf_process_exit(void *pptr) * @param ps structure used to store data * @param pids input data */ -static void ebpf_process_sum_cgroup_pids(ebpf_process_stat_t *ps, struct pid_on_target2 *pids) +static void ebpf_process_sum_cgroup_pids(ebpf_publish_process_t *ps, struct pid_on_target2 *pids) { - ebpf_process_stat_t accumulator; + ebpf_publish_process_t accumulator; memset(&accumulator, 0, sizeof(accumulator)); while (pids) { - ebpf_process_stat_t *pps = &pids->ps; + ebpf_publish_process_t *pps = &pids->ps; accumulator.exit_call += pps->exit_call; accumulator.release_call += pps->release_call; @@ -781,7 +786,7 @@ static void ebpf_process_sum_cgroup_pids(ebpf_process_stat_t *ps, struct pid_on_ * @param values structure with values that will be sent to netdata * @param em the structure with thread information */ -static void ebpf_send_specific_process_data(char *type, ebpf_process_stat_t *values, ebpf_module_t *em) +static void ebpf_send_specific_process_data(char *type, ebpf_publish_process_t *values, ebpf_module_t *em) { ebpf_write_begin_chart(type, NETDATA_SYSCALL_APPS_TASK_PROCESS, ""); write_chart_dimension(process_publish_aggregated[NETDATA_KEY_PUBLISH_PROCESS_FORK].name, @@ -1031,24 +1036,24 @@ static void ebpf_send_systemd_process_charts(ebpf_module_t *em) continue; } - ebpf_write_begin_chart(NETDATA_SERVICE_FAMILY, ect->name, NETDATA_SYSCALL_APPS_TASK_PROCESS); + ebpf_write_begin_chart(ect->name, NETDATA_SYSCALL_APPS_TASK_PROCESS, ""); write_chart_dimension("calls", ect->publish_systemd_ps.create_process); ebpf_write_end_chart(); - ebpf_write_begin_chart(NETDATA_SERVICE_FAMILY, ect->name, NETDATA_SYSCALL_APPS_TASK_THREAD); + ebpf_write_begin_chart(ect->name, NETDATA_SYSCALL_APPS_TASK_THREAD, ""); write_chart_dimension("calls", ect->publish_systemd_ps.create_thread); ebpf_write_end_chart(); - ebpf_write_begin_chart(NETDATA_SERVICE_FAMILY, ect->name, NETDATA_SYSCALL_APPS_TASK_EXIT); + ebpf_write_begin_chart(ect->name, NETDATA_SYSCALL_APPS_TASK_EXIT, ""); write_chart_dimension("calls", ect->publish_systemd_ps.exit_call); ebpf_write_end_chart(); - ebpf_write_begin_chart(NETDATA_SERVICE_FAMILY, ect->name, NETDATA_SYSCALL_APPS_TASK_CLOSE); + ebpf_write_begin_chart(ect->name, NETDATA_SYSCALL_APPS_TASK_CLOSE, ""); write_chart_dimension("calls", ect->publish_systemd_ps.release_call); ebpf_write_end_chart(); if (em->mode < MODE_ENTRY) { - ebpf_write_begin_chart(NETDATA_SERVICE_FAMILY, ect->name, NETDATA_SYSCALL_APPS_TASK_ERROR); + ebpf_write_begin_chart(ect->name, NETDATA_SYSCALL_APPS_TASK_ERROR, ""); write_chart_dimension("calls", ect->publish_systemd_ps.task_err); ebpf_write_end_chart(); } diff --git a/src/collectors/ebpf.plugin/ebpf_process.h b/src/collectors/ebpf.plugin/ebpf_process.h index 18ffec1ff..d2990cea6 100644 --- a/src/collectors/ebpf.plugin/ebpf_process.h +++ b/src/collectors/ebpf.plugin/ebpf_process.h @@ -33,16 +33,17 @@ #define NETDATA_CGROUP_PROCESS_EXIT_CONTEXT "cgroup.task_exit" #define NETDATA_CGROUP_PROCESS_ERROR_CONTEXT "cgroup.task_error" -#define NETDATA_SYSTEMD_PROCESS_CREATE_CONTEXT "systemd.services.process_create" -#define NETDATA_SYSTEMD_THREAD_CREATE_CONTEXT "systemd.services.thread_create" -#define NETDATA_SYSTEMD_PROCESS_CLOSE_CONTEXT "systemd.services.task_close" -#define NETDATA_SYSTEMD_PROCESS_EXIT_CONTEXT "systemd.services.task_exit" -#define NETDATA_SYSTEMD_PROCESS_ERROR_CONTEXT "systemd.services.task_error" +#define NETDATA_SYSTEMD_PROCESS_CREATE_CONTEXT "systemd.service.process_create" +#define NETDATA_SYSTEMD_THREAD_CREATE_CONTEXT "systemd.service.thread_create" +#define NETDATA_SYSTEMD_PROCESS_CLOSE_CONTEXT "systemd.service.task_close" +#define NETDATA_SYSTEMD_PROCESS_EXIT_CONTEXT "systemd.service.task_exit" +#define NETDATA_SYSTEMD_PROCESS_ERROR_CONTEXT "systemd.service.task_error" #define NETDATA_EBPF_CGROUP_UPDATE 30 enum netdata_ebpf_stats_order { NETDATA_EBPF_ORDER_STAT_THREADS = 140000, + NETDATA_EBPF_ORDER_PIDS, NETDATA_EBPF_ORDER_STAT_LIFE_TIME, NETDATA_EBPF_ORDER_STAT_LOAD_METHOD, NETDATA_EBPF_ORDER_STAT_KERNEL_MEMORY, diff --git a/src/collectors/ebpf.plugin/ebpf_shm.c b/src/collectors/ebpf.plugin/ebpf_shm.c index 8e1999526..ac44549b2 100644 --- a/src/collectors/ebpf.plugin/ebpf_shm.c +++ b/src/collectors/ebpf.plugin/ebpf_shm.c @@ -7,7 +7,7 @@ static char *shm_dimension_name[NETDATA_SHM_END] = { "get", "at", "dt", "ctl" }; static netdata_syscall_stat_t shm_aggregated_data[NETDATA_SHM_END]; static netdata_publish_syscall_t shm_publish_aggregated[NETDATA_SHM_END]; -netdata_publish_shm_t *shm_vector = NULL; +netdata_ebpf_shm_t *shm_vector = NULL; static netdata_idx_t shm_hash_values[NETDATA_SHM_END]; static netdata_idx_t *shm_values = NULL; @@ -287,9 +287,9 @@ static void ebpf_obsolete_specific_shm_charts(char *type, int update_every); */ static void ebpf_obsolete_shm_services(ebpf_module_t *em, char *id) { - ebpf_write_chart_obsolete(NETDATA_SERVICE_FAMILY, - id, + ebpf_write_chart_obsolete(id, NETDATA_SHMGET_CHART, + "", "Calls to syscall shmget(2).", EBPF_COMMON_UNITS_CALLS_PER_SEC, NETDATA_APPS_IPC_SHM_GROUP, @@ -298,9 +298,9 @@ static void ebpf_obsolete_shm_services(ebpf_module_t *em, char *id) 20191, em->update_every); - ebpf_write_chart_obsolete(NETDATA_SERVICE_FAMILY, - id, + ebpf_write_chart_obsolete(id, NETDATA_SHMAT_CHART, + "", "Calls to syscall shmat(2).", EBPF_COMMON_UNITS_CALLS_PER_SEC, NETDATA_APPS_IPC_SHM_GROUP, @@ -309,9 +309,9 @@ static void ebpf_obsolete_shm_services(ebpf_module_t *em, char *id) 20192, em->update_every); - ebpf_write_chart_obsolete(NETDATA_SERVICE_FAMILY, - id, + ebpf_write_chart_obsolete(id, NETDATA_SHMDT_CHART, + "", "Calls to syscall shmdt(2).", EBPF_COMMON_UNITS_CALLS_PER_SEC, NETDATA_APPS_IPC_SHM_GROUP, @@ -320,9 +320,9 @@ static void ebpf_obsolete_shm_services(ebpf_module_t *em, char *id) 20193, em->update_every); - ebpf_write_chart_obsolete(NETDATA_SERVICE_FAMILY, - id, + ebpf_write_chart_obsolete(id, NETDATA_SHMCTL_CHART, + "", "Calls to syscall shmctl(2).", EBPF_COMMON_UNITS_CALLS_PER_SEC, NETDATA_APPS_IPC_SHM_GROUP, @@ -453,6 +453,10 @@ static void ebpf_shm_exit(void *pptr) ebpf_module_t *em = CLEANUP_FUNCTION_GET_PTR(pptr); if(!em) return; + pthread_mutex_lock(&lock); + collect_pids &= ~(1<<EBPF_MODULE_SHM_IDX); + pthread_mutex_unlock(&lock); + if (ebpf_read_shm.thread) nd_thread_signal_cancel(ebpf_read_shm.thread); @@ -506,16 +510,23 @@ static void ebpf_shm_exit(void *pptr) * @param out the vector with read values. * @param maps_per_core do I need to read all cores? */ -static void shm_apps_accumulator(netdata_publish_shm_t *out, int maps_per_core) +static void shm_apps_accumulator(netdata_ebpf_shm_t *out, int maps_per_core) { int i, end = (maps_per_core) ? ebpf_nprocs : 1; - netdata_publish_shm_t *total = &out[0]; + netdata_ebpf_shm_t *total = &out[0]; + uint64_t ct = total->ct; for (i = 1; i < end; i++) { - netdata_publish_shm_t *w = &out[i]; + netdata_ebpf_shm_t *w = &out[i]; total->get += w->get; total->at += w->at; total->dt += w->dt; total->ctl += w->ctl; + + if (w->ct > ct) + ct = w->ct; + + if (!total->name[0] && w->name[0]) + strncpyz(total->name, w->name, sizeof(total->name) - 1); } } @@ -528,7 +539,7 @@ static void shm_apps_accumulator(netdata_publish_shm_t *out, int maps_per_core) */ static void ebpf_update_shm_cgroup() { - netdata_publish_shm_t *cv = shm_vector; + netdata_ebpf_shm_t *cv = shm_vector; size_t length = sizeof(netdata_publish_shm_t); ebpf_cgroup_target_t *ect; @@ -541,12 +552,12 @@ static void ebpf_update_shm_cgroup() for (pids = ect->pids; pids; pids = pids->next) { int pid = pids->pid; netdata_publish_shm_t *out = &pids->shm; - ebpf_pid_stat_t *local_pid = ebpf_get_pid_entry(pid, 0); - if (local_pid) { - netdata_publish_shm_t *in = &local_pid->shm; + ebpf_pid_data_t *local_pid = ebpf_get_pid_data(pid, 0, NULL, EBPF_PIDS_SHM_IDX); + netdata_publish_shm_t *in = local_pid->shm; + if (!in) + continue; - memcpy(out, in, sizeof(netdata_publish_shm_t)); - } + memcpy(out, in, sizeof(netdata_publish_shm_t)); } } pthread_mutex_unlock(&mutex_cgroup_shm); @@ -558,12 +569,13 @@ static void ebpf_update_shm_cgroup() * Read the apps table and store data inside the structure. * * @param maps_per_core do I need to read all cores? + * @param max_period limit of iterations without updates before remove data from hash table */ -static void ebpf_read_shm_apps_table(int maps_per_core, int max_period) +static void ebpf_read_shm_apps_table(int maps_per_core, uint32_t max_period) { - netdata_publish_shm_t *cv = shm_vector; + netdata_ebpf_shm_t *cv = shm_vector; int fd = shm_maps[NETDATA_PID_SHM_TABLE].map_fd; - size_t length = sizeof(netdata_publish_shm_t); + size_t length = sizeof(netdata_ebpf_shm_t); if (maps_per_core) length *= ebpf_nprocs; @@ -575,18 +587,22 @@ static void ebpf_read_shm_apps_table(int maps_per_core, int max_period) shm_apps_accumulator(cv, maps_per_core); - ebpf_pid_stat_t *local_pid = ebpf_get_pid_entry(key, 0); - if (!local_pid) - goto end_shm_loop; - + ebpf_pid_data_t *local_pid = ebpf_get_pid_data(key, cv->tgid, cv->name, EBPF_PIDS_SHM_IDX); + netdata_publish_shm_t *publish = local_pid->shm; + if (!publish) + local_pid->shm = publish = ebpf_shm_allocate_publish(); - netdata_publish_shm_t *publish = &local_pid->shm; if (!publish->ct || publish->ct != cv->ct) { memcpy(publish, &cv[0], sizeof(netdata_publish_shm_t)); local_pid->not_updated = 0; - } else if (++local_pid->not_updated >= max_period){ - bpf_map_delete_elem(fd, &key); - local_pid->not_updated = 0; + } else { + if (kill(key, 0)) { // No PID found + ebpf_reset_specific_pid_data(local_pid); + } else { // There is PID, but there is not data anymore + ebpf_release_pid_data(local_pid, fd, key, EBPF_PIDS_SHM_IDX); + ebpf_shm_release_publish(publish); + local_pid->shm = NULL; + } } end_shm_loop: @@ -654,23 +670,17 @@ static void ebpf_shm_read_global_table(netdata_idx_t *stats, int maps_per_core) static void ebpf_shm_sum_pids(netdata_publish_shm_t *shm, struct ebpf_pid_on_target *root) { memset(shm, 0, sizeof(netdata_publish_shm_t)); - while (root) { + for (; root; root = root->next) { int32_t pid = root->pid; - ebpf_pid_stat_t *pid_stat = ebpf_get_pid_entry(pid, 0); - if (pid_stat) { - netdata_publish_shm_t *w = &pid_stat->shm; - shm->get += w->get; - shm->at += w->at; - shm->dt += w->dt; - shm->ctl += w->ctl; - - // reset for next collection. - w->get = 0; - w->at = 0; - w->dt = 0; - w->ctl = 0; - } - root = root->next; + ebpf_pid_data_t *pid_stat = ebpf_get_pid_data(pid, 0, NULL, EBPF_PIDS_SHM_IDX); + netdata_publish_shm_t *w = pid_stat->shm; + if (!w) + continue; + + shm->get += w->get; + shm->at += w->at; + shm->dt += w->dt; + shm->ctl += w->ctl; } } @@ -941,19 +951,19 @@ static void ebpf_send_systemd_shm_charts() continue; } - ebpf_write_begin_chart(NETDATA_SERVICE_FAMILY, ect->name, NETDATA_SHMGET_CHART); + ebpf_write_begin_chart(ect->name, NETDATA_SHMGET_CHART, ""); write_chart_dimension("calls", (long long)ect->publish_shm.get); ebpf_write_end_chart(); - ebpf_write_begin_chart(NETDATA_SERVICE_FAMILY, ect->name, NETDATA_SHMAT_CHART); + ebpf_write_begin_chart(ect->name, NETDATA_SHMAT_CHART, ""); write_chart_dimension("calls", (long long)ect->publish_shm.at); ebpf_write_end_chart(); - ebpf_write_begin_chart(NETDATA_SERVICE_FAMILY, ect->name, NETDATA_SHMDT_CHART); + ebpf_write_begin_chart(ect->name, NETDATA_SHMDT_CHART, ""); write_chart_dimension("calls", (long long)ect->publish_shm.dt); ebpf_write_end_chart(); - ebpf_write_begin_chart(NETDATA_SERVICE_FAMILY, ect->name, NETDATA_SHMCTL_CHART); + ebpf_write_begin_chart(ect->name, NETDATA_SHMCTL_CHART, ""); write_chart_dimension("calls", (long long)ect->publish_shm.ctl); ebpf_write_end_chart(); } @@ -1060,13 +1070,17 @@ void *ebpf_read_shm_thread(void *ptr) int maps_per_core = em->maps_per_core; int update_every = em->update_every; + int collect_pid = (em->apps_charts || em->cgroup_charts); + if (!collect_pid) + return NULL; int counter = update_every - 1; uint32_t lifetime = em->lifetime; uint32_t running_time = 0; usec_t period = update_every * USEC_PER_SEC; - int max_period = update_every * EBPF_CLEANUP_FACTOR; + uint32_t max_period = EBPF_CLEANUP_FACTOR; + pids_fd[EBPF_PIDS_SHM_IDX] = shm_maps[NETDATA_PID_SHM_TABLE].map_fd; while (!ebpf_plugin_stop() && running_time < lifetime) { (void)heartbeat_next(&hb, period); if (ebpf_plugin_stop() || ++counter != update_every) @@ -1325,6 +1339,7 @@ static int ebpf_shm_load_bpf(ebpf_module_t *em) */ void *ebpf_shm_thread(void *ptr) { + pids_fd[EBPF_PIDS_SHM_IDX] = -1; ebpf_module_t *em = (ebpf_module_t *)ptr; CLEANUP_FUNCTION_REGISTER(ebpf_shm_exit) cleanup_ptr = em; @@ -1363,7 +1378,8 @@ void *ebpf_shm_thread(void *ptr) ebpf_update_kernel_memory_with_vector(&plugin_statistics, em->maps, EBPF_ACTION_STAT_ADD); pthread_mutex_unlock(&lock); - ebpf_read_shm.thread = nd_thread_create(ebpf_read_shm.name, NETDATA_THREAD_OPTION_DEFAULT, ebpf_read_shm_thread, em); + ebpf_read_shm.thread = nd_thread_create(ebpf_read_shm.name, NETDATA_THREAD_OPTION_DEFAULT, + ebpf_read_shm_thread, em); shm_collector(em); diff --git a/src/collectors/ebpf.plugin/ebpf_shm.h b/src/collectors/ebpf.plugin/ebpf_shm.h index 5a670b1b5..6f89faa9e 100644 --- a/src/collectors/ebpf.plugin/ebpf_shm.h +++ b/src/collectors/ebpf.plugin/ebpf_shm.h @@ -23,21 +23,33 @@ #define NETDATA_CGROUP_SHM_DT_CONTEXT "cgroup.shmdt" #define NETDATA_CGROUP_SHM_CTL_CONTEXT "cgroup.shmctl" -#define NETDATA_SYSTEMD_SHM_GET_CONTEXT "systemd.services.shmget" -#define NETDATA_SYSTEMD_SHM_AT_CONTEXT "systemd.services.shmat" -#define NETDATA_SYSTEMD_SHM_DT_CONTEXT "systemd.services.shmdt" -#define NETDATA_SYSTEMD_SHM_CTL_CONTEXT "systemd.services.shmctl" +#define NETDATA_SYSTEMD_SHM_GET_CONTEXT "systemd.service.shmget" +#define NETDATA_SYSTEMD_SHM_AT_CONTEXT "systemd.service.shmat" +#define NETDATA_SYSTEMD_SHM_DT_CONTEXT "systemd.service.shmdt" +#define NETDATA_SYSTEMD_SHM_CTL_CONTEXT "systemd.service.shmctl" -typedef struct netdata_publish_shm { +typedef struct __attribute__((packed)) netdata_publish_shm { uint64_t ct; - char name[TASK_COMM_LEN]; - uint64_t get; - uint64_t at; - uint64_t dt; - uint64_t ctl; + uint32_t get; + uint32_t at; + uint32_t dt; + uint32_t ctl; } netdata_publish_shm_t; +typedef struct netdata_ebpf_shm { + uint64_t ct; + uint32_t tgid; + uint32_t uid; + uint32_t gid; + char name[TASK_COMM_LEN]; + + uint32_t get; + uint32_t at; + uint32_t dt; + uint32_t ctl; +} netdata_ebpf_shm_t; + enum shm_tables { NETDATA_PID_SHM_TABLE, NETDATA_SHM_CONTROLLER, diff --git a/src/collectors/ebpf.plugin/ebpf_socket.c b/src/collectors/ebpf.plugin/ebpf_socket.c index 9a55f7be4..5b87a3256 100644 --- a/src/collectors/ebpf.plugin/ebpf_socket.c +++ b/src/collectors/ebpf.plugin/ebpf_socket.c @@ -497,6 +497,10 @@ static void ebpf_socket_free(ebpf_module_t *em ) ebpf_update_stats(&plugin_statistics, em); ebpf_update_kernel_memory_with_vector(&plugin_statistics, em->maps, EBPF_ACTION_STAT_REMOVE); pthread_mutex_unlock(&ebpf_exit_cleanup); + + pthread_mutex_lock(&lock); + collect_pids &= ~(1<<EBPF_MODULE_SOCKET_IDX); + pthread_mutex_unlock(&lock); } /** @@ -509,9 +513,9 @@ static void ebpf_socket_free(ebpf_module_t *em ) static void ebpf_obsolete_systemd_socket_charts(int update_every, char *id) { int order = 20080; - ebpf_write_chart_obsolete(NETDATA_SERVICE_FAMILY, - id, - NETDATA_NET_APPS_CONNECTION_TCP_V4, + ebpf_write_chart_obsolete(id, + NETDATA_SOCK_ID_OR_SUFFIX_CONNECTION_TCP_V4, + "", "Calls to tcp_v4_connection", EBPF_COMMON_UNITS_CONNECTIONS, NETDATA_APPS_NET_GROUP, @@ -521,9 +525,9 @@ static void ebpf_obsolete_systemd_socket_charts(int update_every, char *id) update_every); if (tcp_v6_connect_address.type == 'T') { - ebpf_write_chart_obsolete(NETDATA_SERVICE_FAMILY, - id, - NETDATA_NET_APPS_CONNECTION_TCP_V6, + ebpf_write_chart_obsolete(id, + NETDATA_SOCK_ID_OR_SUFFIX_CONNECTION_TCP_V6, + "", "Calls to tcp_v6_connection", EBPF_COMMON_UNITS_CONNECTIONS, NETDATA_APPS_NET_GROUP, @@ -533,31 +537,20 @@ static void ebpf_obsolete_systemd_socket_charts(int update_every, char *id) update_every); } - ebpf_write_chart_obsolete(NETDATA_SERVICE_FAMILY, - id, - NETDATA_NET_APPS_BANDWIDTH_RECV, - "Bits received", - EBPF_COMMON_UNITS_KILOBITS, - NETDATA_APPS_NET_GROUP, - NETDATA_EBPF_CHART_TYPE_STACKED, - NETDATA_SERVICES_SOCKET_BYTES_RECV_CONTEXT, - order++, - update_every); - - ebpf_write_chart_obsolete(NETDATA_SERVICE_FAMILY, - id, - NETDATA_NET_APPS_BANDWIDTH_SENT, - "Bits sent", + ebpf_write_chart_obsolete(id, + NETDATA_SOCK_ID_OR_SUFFIX_BANDWIDTH, + "", + "Bandwidth.", EBPF_COMMON_UNITS_KILOBITS, NETDATA_APPS_NET_GROUP, NETDATA_EBPF_CHART_TYPE_STACKED, - NETDATA_SERVICES_SOCKET_BYTES_SEND_CONTEXT, + NETDATA_SERVICES_SOCKET_TCP_BANDWIDTH_CONTEXT, order++, update_every); - ebpf_write_chart_obsolete(NETDATA_SERVICE_FAMILY, - id, - NETDATA_NET_APPS_BANDWIDTH_TCP_RECV_CALLS, + ebpf_write_chart_obsolete(id, + NETDATA_SOCK_ID_OR_SUFFIX_BANDWIDTH_TCP_RECV_CALLS, + "", "Calls to tcp_cleanup_rbuf.", EBPF_COMMON_UNITS_CALLS_PER_SEC, NETDATA_APPS_NET_GROUP, @@ -566,9 +559,9 @@ static void ebpf_obsolete_systemd_socket_charts(int update_every, char *id) order++, update_every); - ebpf_write_chart_obsolete(NETDATA_SERVICE_FAMILY, - id, - NETDATA_NET_APPS_BANDWIDTH_TCP_SEND_CALLS, + ebpf_write_chart_obsolete(id, + NETDATA_SOCK_ID_OR_SUFFIX_BANDWIDTH_TCP_SEND_CALLS, + "", "Calls to tcp_sendmsg.", EBPF_COMMON_UNITS_CALLS_PER_SEC, NETDATA_APPS_NET_GROUP, @@ -577,9 +570,9 @@ static void ebpf_obsolete_systemd_socket_charts(int update_every, char *id) order++, update_every); - ebpf_write_chart_obsolete(NETDATA_SERVICE_FAMILY, - id, - NETDATA_NET_APPS_BANDWIDTH_TCP_RETRANSMIT, + ebpf_write_chart_obsolete(id, + NETDATA_SOCK_ID_OR_SUFFIX_BANDWIDTH_TCP_RETRANSMIT, + "", "Calls to tcp_retransmit", EBPF_COMMON_UNITS_CALLS_PER_SEC, NETDATA_APPS_NET_GROUP, @@ -588,9 +581,9 @@ static void ebpf_obsolete_systemd_socket_charts(int update_every, char *id) order++, update_every); - ebpf_write_chart_obsolete(NETDATA_SERVICE_FAMILY, - id, - NETDATA_NET_APPS_BANDWIDTH_UDP_SEND_CALLS, + ebpf_write_chart_obsolete(id, + NETDATA_SOCK_ID_OR_SUFFIX_BANDWIDTH_UDP_SEND_CALLS, + "", "Calls to udp_sendmsg", EBPF_COMMON_UNITS_CALLS_PER_SEC, NETDATA_APPS_NET_GROUP, @@ -599,9 +592,9 @@ static void ebpf_obsolete_systemd_socket_charts(int update_every, char *id) order++, update_every); - ebpf_write_chart_obsolete(NETDATA_SERVICE_FAMILY, - id, - NETDATA_NET_APPS_BANDWIDTH_UDP_RECV_CALLS, + ebpf_write_chart_obsolete(id, + NETDATA_SOCK_ID_OR_SUFFIX_BANDWIDTH_UDP_RECV_CALLS, + "", "Calls to udp_recvmsg", EBPF_COMMON_UNITS_CALLS_PER_SEC, NETDATA_APPS_NET_GROUP, @@ -678,23 +671,12 @@ void ebpf_socket_obsolete_apps_charts(struct ebpf_module *em) ebpf_write_chart_obsolete(NETDATA_APP_FAMILY, w->clean_name, - "_ebpf_sock_bytes_sent", - "Bits sent.", + "_ebpf_sock_bandwidth", + "Bandwidth.", EBPF_COMMON_UNITS_KILOBITS, NETDATA_APPS_NET_GROUP, NETDATA_EBPF_CHART_TYPE_STACKED, - "app.ebpf_sock_bytes_sent", - order++, - update_every); - - ebpf_write_chart_obsolete(NETDATA_APP_FAMILY, - w->clean_name, - "_ebpf_sock_bytes_received", - "Bits received.", - EBPF_COMMON_UNITS_KILOBITS, - NETDATA_APPS_NET_GROUP, - NETDATA_EBPF_CHART_TYPE_STACKED, - "app.ebpf_sock_bytes_received", + "app.ebpf_sock_total_bandwidth", order++, update_every); @@ -1056,18 +1038,14 @@ void ebpf_socket_send_apps_data() if (tcp_v6_connect_address.type == 'T') { ebpf_write_begin_chart(NETDATA_APP_FAMILY, w->clean_name, "_call_tcp_v6_connection"); - write_chart_dimension("calls", (collected_number) values->call_tcp_v6_connection); + write_chart_dimension("connections", (collected_number) values->call_tcp_v6_connection); ebpf_write_end_chart(); } - ebpf_write_begin_chart(NETDATA_APP_FAMILY, w->clean_name, "_ebpf_sock_bytes_sent"); - // We multiply by 0.008, because we read bytes, but we display bits - write_chart_dimension("bandwidth", ebpf_socket_bytes2bits(values->bytes_sent)); - ebpf_write_end_chart(); - - ebpf_write_begin_chart(NETDATA_APP_FAMILY, w->clean_name, "_ebpf_sock_bytes_received"); + ebpf_write_begin_chart(NETDATA_APP_FAMILY, w->clean_name, "_ebpf_sock_bandwidth"); // We multiply by 0.008, because we read bytes, but we display bits - write_chart_dimension("bandwidth", ebpf_socket_bytes2bits(values->bytes_received)); + write_chart_dimension("received", ebpf_socket_bytes2bits(values->bytes_received)); + write_chart_dimension("sent", ebpf_socket_bytes2bits(values->bytes_sent)); ebpf_write_end_chart(); ebpf_write_begin_chart(NETDATA_APP_FAMILY, w->clean_name, "_ebpf_call_tcp_sendmsg"); @@ -1273,33 +1251,19 @@ void ebpf_socket_create_apps_charts(struct ebpf_module *em, void *ptr) ebpf_write_chart_cmd(NETDATA_APP_FAMILY, w->clean_name, - "_ebpf_sock_bytes_sent", - "Bits sent.", - EBPF_COMMON_UNITS_KILOBITS, - NETDATA_APPS_NET_GROUP, - NETDATA_EBPF_CHART_TYPE_STACKED, - "app.ebpf_sock_bytes_sent", - order++, - update_every, - NETDATA_EBPF_MODULE_NAME_SOCKET); - ebpf_create_chart_labels("app_group", w->name, RRDLABEL_SRC_AUTO); - ebpf_commit_label(); - fprintf(stdout, "DIMENSION bandwidth '' %s 1 1\n", ebpf_algorithms[NETDATA_EBPF_INCREMENTAL_IDX]); - - ebpf_write_chart_cmd(NETDATA_APP_FAMILY, - w->clean_name, - "_ebpf_sock_bytes_received", - "Bits received.", + "_ebpf_sock_bandwidth", + "Bandwidth.", EBPF_COMMON_UNITS_KILOBITS, NETDATA_APPS_NET_GROUP, NETDATA_EBPF_CHART_TYPE_STACKED, - "app.ebpf_sock_bytes_received", + "app.ebpf_sock_total_bandwidth", order++, update_every, NETDATA_EBPF_MODULE_NAME_SOCKET); ebpf_create_chart_labels("app_group", w->name, RRDLABEL_SRC_AUTO); ebpf_commit_label(); - fprintf(stdout, "DIMENSION bandwidth '' %s 1 1\n", ebpf_algorithms[NETDATA_EBPF_INCREMENTAL_IDX]); + fprintf(stdout, "DIMENSION received '' %s 1 1\n", ebpf_algorithms[NETDATA_EBPF_INCREMENTAL_IDX]); + fprintf(stdout, "DIMENSION sent '' %s 1 1\n", ebpf_algorithms[NETDATA_EBPF_INCREMENTAL_IDX]); ebpf_write_chart_cmd(NETDATA_APP_FAMILY, w->clean_name, @@ -1714,6 +1678,7 @@ static void ebpf_update_array_vectors(ebpf_module_t *em) time_t update_time = time(NULL); while (bpf_map_get_next_key(fd, &key, &next_key) == 0) { test = bpf_map_lookup_elem(fd, &key, values); + bool deleted = true; if (test < 0) { goto end_socket_loop; } @@ -1723,7 +1688,6 @@ static void ebpf_update_array_vectors(ebpf_module_t *em) } ebpf_hash_socket_accumulator(values, end); - ebpf_socket_fill_publish_apps(key.pid, values); // We update UDP to show info with charts, but we do not show them with functions /* @@ -1767,14 +1731,17 @@ static void ebpf_update_array_vectors(ebpf_module_t *em) } uint64_t prev_period = socket_ptr->data.current_timestamp; memcpy(&socket_ptr->data, &values[0], sizeof(netdata_socket_t)); - if (translate) + if (translate) { ebpf_socket_translate(socket_ptr, &key); - else { // Check socket was updated + deleted = false; + } else { // Check socket was updated + deleted = false; if (prev_period) { if (values[0].current_timestamp > prev_period) // Socket updated socket_ptr->last_update = update_time; else if ((update_time - socket_ptr->last_update) > em->update_every) { // Socket was not updated since last read + deleted = true; JudyLDel(&pid_ptr->socket_stats.JudyLArray, values[0].first_timestamp, PJE0); aral_freez(aral_socket_table, socket_ptr); } @@ -1785,7 +1752,19 @@ static void ebpf_update_array_vectors(ebpf_module_t *em) rw_spinlock_write_unlock(&pid_ptr->socket_stats.rw_spinlock); rw_spinlock_write_unlock(&ebpf_judy_pid.index.rw_spinlock); -end_socket_loop: +end_socket_loop: ; // the empty statement is here to allow code to be compiled by old compilers + ebpf_pid_data_t *local_pid = ebpf_get_pid_data(key.pid, 0, values[0].name, EBPF_MODULE_SOCKET_IDX); + ebpf_socket_publish_apps_t *curr = local_pid->socket; + if (!curr) + local_pid->socket = curr = ebpf_socket_allocate_publish(); + + if (!deleted) + ebpf_socket_fill_publish_apps(curr, values); + else { + ebpf_release_pid_data(local_pid, fd, key.pid, EBPF_MODULE_SOCKET_IDX); + ebpf_socket_release_publish(curr); + local_pid->socket = NULL; + } memset(values, 0, length); memcpy(&key, &next_key, sizeof(key)); } @@ -1805,23 +1784,22 @@ void ebpf_socket_resume_apps_data() ebpf_socket_publish_apps_t *values = &w->socket; memset(&w->socket, 0, sizeof(ebpf_socket_publish_apps_t)); - while (move) { + for (; move; move = move->next) { int32_t pid = move->pid; - ebpf_pid_stat_t *local_pid = ebpf_get_pid_entry(pid, 0); - if (local_pid) { - ebpf_socket_publish_apps_t *ws = &local_pid->socket; - values->call_tcp_v4_connection = ws->call_tcp_v4_connection; - values->call_tcp_v6_connection = ws->call_tcp_v6_connection; - values->bytes_sent = ws->bytes_sent; - values->bytes_received = ws->bytes_received; - values->call_tcp_sent = ws->call_tcp_sent; - values->call_tcp_received = ws->call_tcp_received; - values->retransmit = ws->retransmit; - values->call_udp_sent = ws->call_udp_sent; - values->call_udp_received = ws->call_udp_received; - } - - move = move->next; + ebpf_pid_data_t *local_pid = ebpf_get_pid_data(pid, 0, NULL, EBPF_MODULE_SOCKET_IDX); + ebpf_socket_publish_apps_t *ws = local_pid->socket; + if (!ws) + continue; + + values->call_tcp_v4_connection = ws->call_tcp_v4_connection; + values->call_tcp_v6_connection = ws->call_tcp_v6_connection; + values->bytes_sent = ws->bytes_sent; + values->bytes_received = ws->bytes_received; + values->call_tcp_sent = ws->call_tcp_sent; + values->call_tcp_received = ws->call_tcp_received; + values->retransmit = ws->retransmit; + values->call_udp_sent = ws->call_udp_sent; + values->call_udp_received = ws->call_udp_received; } } } @@ -1846,6 +1824,9 @@ void *ebpf_read_socket_thread(void *ptr) int update_every = em->update_every; int counter = update_every - 1; + int collect_pid = (em->apps_charts || em->cgroup_charts); + if (!collect_pid) + return NULL; uint32_t running_time = 0; uint32_t lifetime = em->lifetime; @@ -2009,14 +1990,8 @@ static void ebpf_socket_read_hash_global_tables(netdata_idx_t *stats, int maps_p * @param current_pid the PID that I am updating * @param ns the structure with data read from memory. */ -void ebpf_socket_fill_publish_apps(uint32_t current_pid, netdata_socket_t *ns) +void ebpf_socket_fill_publish_apps(ebpf_socket_publish_apps_t *curr, netdata_socket_t *ns) { - ebpf_pid_stat_t *local_pid = ebpf_get_pid_entry(current_pid, 0); - if (!local_pid) - return; - - ebpf_socket_publish_apps_t *curr = &local_pid->socket; - curr->bytes_sent = ns->tcp.tcp_bytes_sent; curr->bytes_received = ns->tcp.tcp_bytes_received; curr->call_tcp_sent = ns->tcp.call_tcp_sent; @@ -2045,21 +2020,21 @@ static void ebpf_update_socket_cgroup() for (pids = ect->pids; pids; pids = pids->next) { int pid = pids->pid; ebpf_socket_publish_apps_t *publish = &ect->publish_socket; - ebpf_pid_stat_t *local_pid = ebpf_get_pid_entry(pid, 0); - if (local_pid) { - ebpf_socket_publish_apps_t *in = &local_pid->socket; - - publish->bytes_sent = in->bytes_sent; - publish->bytes_received = in->bytes_received; - publish->call_tcp_sent = in->call_tcp_sent; - publish->call_tcp_received = in->call_tcp_received; - publish->retransmit = in->retransmit; - publish->call_udp_sent = in->call_udp_sent; - publish->call_udp_received = in->call_udp_received; - publish->call_close = in->call_close; - publish->call_tcp_v4_connection = in->call_tcp_v4_connection; - publish->call_tcp_v6_connection = in->call_tcp_v6_connection; - } + ebpf_pid_data_t *local_pid = ebpf_get_pid_data(pid, 0, NULL, EBPF_MODULE_SOCKET_IDX); + ebpf_socket_publish_apps_t *in = local_pid->socket; + if (!in) + continue; + + publish->bytes_sent = in->bytes_sent; + publish->bytes_received = in->bytes_received; + publish->call_tcp_sent = in->call_tcp_sent; + publish->call_tcp_received = in->call_tcp_received; + publish->retransmit = in->retransmit; + publish->call_udp_sent = in->call_udp_sent; + publish->call_udp_received = in->call_udp_received; + publish->call_close = in->call_close; + publish->call_tcp_v4_connection = in->call_tcp_v4_connection; + publish->call_tcp_v6_connection = in->call_tcp_v6_connection; } } pthread_mutex_unlock(&mutex_cgroup_shm); @@ -2121,119 +2096,128 @@ static void ebpf_create_specific_socket_charts(char *type, int update_every) { int order_basis = 5300; char *label = (!strncmp(type, "cgroup_", 7)) ? &type[7] : type; - ebpf_create_chart(type, NETDATA_NET_APPS_CONNECTION_TCP_V4, - "Calls to tcp_v4_connection", - EBPF_COMMON_UNITS_CONNECTIONS, NETDATA_CGROUP_NET_GROUP, - NETDATA_CGROUP_TCP_V4_CONN_CONTEXT, - NETDATA_EBPF_CHART_TYPE_LINE, - NETDATA_CHART_PRIO_CGROUPS_CONTAINERS + order_basis++, - ebpf_create_global_dimension, - &socket_publish_aggregated[NETDATA_IDX_TCP_CONNECTION_V4], 1, - update_every, NETDATA_EBPF_MODULE_NAME_SOCKET); + ebpf_write_chart_cmd(type, + NETDATA_SOCK_ID_OR_SUFFIX_CONNECTION_TCP_V4, + "", + "Calls to tcp_v4_connection", + EBPF_COMMON_UNITS_CONNECTIONS, + NETDATA_CGROUP_NET_GROUP, + NETDATA_EBPF_CHART_TYPE_LINE, + NETDATA_CGROUP_TCP_V4_CONN_CONTEXT, + NETDATA_CHART_PRIO_CGROUPS_CONTAINERS + order_basis++, + update_every, + NETDATA_EBPF_MODULE_NAME_SOCKET); ebpf_create_chart_labels("cgroup_name", label, RRDLABEL_SRC_AUTO); ebpf_commit_label(); + fprintf(stdout, "DIMENSION connections '' %s 1 1\n", ebpf_algorithms[NETDATA_EBPF_INCREMENTAL_IDX]); if (tcp_v6_connect_address.type == 'T') { - ebpf_create_chart(type, - NETDATA_NET_APPS_CONNECTION_TCP_V6, - "Calls to tcp_v6_connection", - EBPF_COMMON_UNITS_CONNECTIONS, - NETDATA_CGROUP_NET_GROUP, - NETDATA_CGROUP_TCP_V6_CONN_CONTEXT, - NETDATA_EBPF_CHART_TYPE_LINE, - NETDATA_CHART_PRIO_CGROUPS_CONTAINERS + order_basis++, - ebpf_create_global_dimension, - &socket_publish_aggregated[NETDATA_IDX_TCP_CONNECTION_V6], - 1, - update_every, - NETDATA_EBPF_MODULE_NAME_SOCKET); + ebpf_write_chart_cmd(type, + NETDATA_SOCK_ID_OR_SUFFIX_CONNECTION_TCP_V6, + "", + "Calls to tcp_v6_connection", + EBPF_COMMON_UNITS_CONNECTIONS, + NETDATA_CGROUP_NET_GROUP, + NETDATA_EBPF_CHART_TYPE_LINE, + NETDATA_CGROUP_TCP_V6_CONN_CONTEXT, + NETDATA_CHART_PRIO_CGROUPS_CONTAINERS + order_basis++, + update_every, + NETDATA_EBPF_MODULE_NAME_SOCKET); ebpf_create_chart_labels("cgroup_name", label, RRDLABEL_SRC_AUTO); ebpf_commit_label(); + fprintf(stdout, "DIMENSION connections '' %s 1 1\n", ebpf_algorithms[NETDATA_EBPF_INCREMENTAL_IDX]); } - ebpf_create_chart(type, NETDATA_NET_APPS_BANDWIDTH_RECV, - "Bits received", - EBPF_COMMON_UNITS_KILOBITS, NETDATA_CGROUP_NET_GROUP, - NETDATA_CGROUP_SOCKET_BYTES_RECV_CONTEXT, - NETDATA_EBPF_CHART_TYPE_LINE, - NETDATA_CHART_PRIO_CGROUPS_CONTAINERS + order_basis++, - ebpf_create_global_dimension, - &socket_publish_aggregated[NETDATA_IDX_TCP_CLEANUP_RBUF], 1, - update_every, NETDATA_EBPF_MODULE_NAME_SOCKET); + ebpf_write_chart_cmd(type, + NETDATA_SOCK_ID_OR_SUFFIX_BANDWIDTH, + "", + "Bandwidth.", + EBPF_COMMON_UNITS_KILOBITS, + NETDATA_CGROUP_NET_GROUP, + NETDATA_EBPF_CHART_TYPE_LINE, + NETDATA_CGROUP_SOCKET_TCP_BANDWIDTH_CONTEXT, + NETDATA_CHART_PRIO_CGROUPS_CONTAINERS + order_basis++, + update_every, + NETDATA_EBPF_MODULE_NAME_SOCKET); ebpf_create_chart_labels("cgroup_name", label, RRDLABEL_SRC_AUTO); ebpf_commit_label(); - - ebpf_create_chart(type, NETDATA_NET_APPS_BANDWIDTH_SENT, - "Bits sent", - EBPF_COMMON_UNITS_KILOBITS, NETDATA_CGROUP_NET_GROUP, - NETDATA_CGROUP_SOCKET_BYTES_SEND_CONTEXT, - NETDATA_EBPF_CHART_TYPE_LINE, - NETDATA_CHART_PRIO_CGROUPS_CONTAINERS + order_basis++, - ebpf_create_global_dimension, - socket_publish_aggregated, 1, - update_every, NETDATA_EBPF_MODULE_NAME_SOCKET); + fprintf(stdout, "DIMENSION received '' %s 1 1\n", ebpf_algorithms[NETDATA_EBPF_INCREMENTAL_IDX]); + fprintf(stdout, "DIMENSION sent '' %s 1 1\n", ebpf_algorithms[NETDATA_EBPF_INCREMENTAL_IDX]); + + ebpf_write_chart_cmd(type, + NETDATA_SOCK_ID_OR_SUFFIX_BANDWIDTH_TCP_RECV_CALLS, + "", + "Calls to tcp_cleanup_rbuf.", + EBPF_COMMON_UNITS_CALLS_PER_SEC, + NETDATA_CGROUP_NET_GROUP, + NETDATA_EBPF_CHART_TYPE_LINE, + NETDATA_CGROUP_SOCKET_TCP_RECV_CONTEXT, + NETDATA_CHART_PRIO_CGROUPS_CONTAINERS + order_basis++, + update_every, + NETDATA_EBPF_MODULE_NAME_SOCKET); ebpf_create_chart_labels("cgroup_name", label, RRDLABEL_SRC_AUTO); ebpf_commit_label(); - - ebpf_create_chart(type, NETDATA_NET_APPS_BANDWIDTH_TCP_RECV_CALLS, - "Calls to tcp_cleanup_rbuf.", - EBPF_COMMON_UNITS_CALLS_PER_SEC, NETDATA_CGROUP_NET_GROUP, - NETDATA_CGROUP_SOCKET_TCP_RECV_CONTEXT, - NETDATA_EBPF_CHART_TYPE_LINE, - NETDATA_CHART_PRIO_CGROUPS_CONTAINERS + order_basis++, - ebpf_create_global_dimension, - &socket_publish_aggregated[NETDATA_IDX_TCP_CLEANUP_RBUF], 1, - update_every, NETDATA_EBPF_MODULE_NAME_SOCKET); + fprintf(stdout, "DIMENSION calls '' %s 1 1\n", ebpf_algorithms[NETDATA_EBPF_INCREMENTAL_IDX]); + + ebpf_write_chart_cmd(type, + NETDATA_SOCK_ID_OR_SUFFIX_BANDWIDTH_TCP_SEND_CALLS, + "", + "Calls to tcp_sendmsg.", + EBPF_COMMON_UNITS_CALLS_PER_SEC, + NETDATA_CGROUP_NET_GROUP, + NETDATA_EBPF_CHART_TYPE_LINE, + NETDATA_CGROUP_SOCKET_TCP_SEND_CONTEXT, + NETDATA_CHART_PRIO_CGROUPS_CONTAINERS + order_basis++, + update_every, + NETDATA_EBPF_MODULE_NAME_SOCKET); ebpf_create_chart_labels("cgroup_name", label, RRDLABEL_SRC_AUTO); ebpf_commit_label(); - - ebpf_create_chart(type, NETDATA_NET_APPS_BANDWIDTH_TCP_SEND_CALLS, - "Calls to tcp_sendmsg.", - EBPF_COMMON_UNITS_CALLS_PER_SEC, NETDATA_CGROUP_NET_GROUP, - NETDATA_CGROUP_SOCKET_TCP_SEND_CONTEXT, - NETDATA_EBPF_CHART_TYPE_LINE, - NETDATA_CHART_PRIO_CGROUPS_CONTAINERS + order_basis++, - ebpf_create_global_dimension, - socket_publish_aggregated, 1, - update_every, NETDATA_EBPF_MODULE_NAME_SOCKET); + fprintf(stdout, "DIMENSION calls '' %s 1 1\n", ebpf_algorithms[NETDATA_EBPF_INCREMENTAL_IDX]); + + ebpf_write_chart_cmd(type, + NETDATA_SOCK_ID_OR_SUFFIX_BANDWIDTH_TCP_RETRANSMIT, + "", + "Calls to tcp_retransmit.", + EBPF_COMMON_UNITS_CALLS_PER_SEC, + NETDATA_CGROUP_NET_GROUP, + NETDATA_EBPF_CHART_TYPE_LINE, + NETDATA_CGROUP_SOCKET_TCP_RETRANSMIT_CONTEXT, + NETDATA_CHART_PRIO_CGROUPS_CONTAINERS + order_basis++, + update_every, + NETDATA_EBPF_MODULE_NAME_SOCKET); ebpf_create_chart_labels("cgroup_name", label, RRDLABEL_SRC_AUTO); ebpf_commit_label(); - - ebpf_create_chart(type, NETDATA_NET_APPS_BANDWIDTH_TCP_RETRANSMIT, - "Calls to tcp_retransmit.", - EBPF_COMMON_UNITS_CALLS_PER_SEC, NETDATA_CGROUP_NET_GROUP, - NETDATA_CGROUP_SOCKET_TCP_RETRANSMIT_CONTEXT, - NETDATA_EBPF_CHART_TYPE_LINE, - NETDATA_CHART_PRIO_CGROUPS_CONTAINERS + order_basis++, - ebpf_create_global_dimension, - &socket_publish_aggregated[NETDATA_IDX_TCP_RETRANSMIT], 1, - update_every, NETDATA_EBPF_MODULE_NAME_SOCKET); + fprintf(stdout, "DIMENSION calls '' %s 1 1\n", ebpf_algorithms[NETDATA_EBPF_INCREMENTAL_IDX]); + + ebpf_write_chart_cmd(type, + NETDATA_SOCK_ID_OR_SUFFIX_BANDWIDTH_UDP_SEND_CALLS, + "", + "Calls to udp_sendmsg.", + EBPF_COMMON_UNITS_CALLS_PER_SEC, + NETDATA_CGROUP_NET_GROUP, + NETDATA_EBPF_CHART_TYPE_LINE, + NETDATA_CGROUP_SOCKET_UDP_SEND_CONTEXT, + NETDATA_CHART_PRIO_CGROUPS_CONTAINERS + order_basis++, + update_every, + NETDATA_EBPF_MODULE_NAME_SOCKET); ebpf_create_chart_labels("cgroup_name", label, RRDLABEL_SRC_AUTO); ebpf_commit_label(); - - ebpf_create_chart(type, NETDATA_NET_APPS_BANDWIDTH_UDP_SEND_CALLS, - "Calls to udp_sendmsg", - EBPF_COMMON_UNITS_CALLS_PER_SEC, NETDATA_CGROUP_NET_GROUP, - NETDATA_CGROUP_SOCKET_UDP_SEND_CONTEXT, - NETDATA_EBPF_CHART_TYPE_LINE, - NETDATA_CHART_PRIO_CGROUPS_CONTAINERS + order_basis++, - ebpf_create_global_dimension, - &socket_publish_aggregated[NETDATA_IDX_UDP_SENDMSG], 1, - update_every, NETDATA_EBPF_MODULE_NAME_SOCKET); - ebpf_create_chart_labels("cgroup_name", label, RRDLABEL_SRC_AUTO); - ebpf_commit_label(); - - ebpf_create_chart(type, NETDATA_NET_APPS_BANDWIDTH_UDP_RECV_CALLS, - "Calls to udp_recvmsg", - EBPF_COMMON_UNITS_CALLS_PER_SEC, NETDATA_CGROUP_NET_GROUP, - NETDATA_CGROUP_SOCKET_UDP_RECV_CONTEXT, - NETDATA_EBPF_CHART_TYPE_LINE, - NETDATA_CHART_PRIO_CGROUPS_CONTAINERS + order_basis++, - ebpf_create_global_dimension, - &socket_publish_aggregated[NETDATA_IDX_UDP_RECVBUF], 1, - update_every, NETDATA_EBPF_MODULE_NAME_SOCKET); + fprintf(stdout, "DIMENSION calls '' %s 1 1\n", ebpf_algorithms[NETDATA_EBPF_INCREMENTAL_IDX]); + + ebpf_write_chart_cmd(type, + NETDATA_SOCK_ID_OR_SUFFIX_BANDWIDTH_UDP_RECV_CALLS, + "", + "Calls to udp_recvmsg.", + EBPF_COMMON_UNITS_CALLS_PER_SEC, + NETDATA_CGROUP_NET_GROUP, + NETDATA_EBPF_CHART_TYPE_LINE, + NETDATA_CGROUP_SOCKET_UDP_RECV_CONTEXT, + NETDATA_CHART_PRIO_CGROUPS_CONTAINERS + order_basis++, + update_every, + NETDATA_EBPF_MODULE_NAME_SOCKET); ebpf_create_chart_labels("cgroup_name", label, RRDLABEL_SRC_AUTO); ebpf_commit_label(); + fprintf(stdout, "DIMENSION calls '' %s 1 1\n", ebpf_algorithms[NETDATA_EBPF_INCREMENTAL_IDX]); } /** @@ -2247,57 +2231,65 @@ static void ebpf_create_specific_socket_charts(char *type, int update_every) static void ebpf_obsolete_specific_socket_charts(char *type, int update_every) { int order_basis = 5300; - ebpf_write_chart_obsolete(type, NETDATA_NET_APPS_CONNECTION_TCP_V4, "", "Calls to tcp_v4_connection", - EBPF_COMMON_UNITS_CONNECTIONS, NETDATA_APPS_NET_GROUP, - NETDATA_EBPF_CHART_TYPE_LINE, NETDATA_SERVICES_SOCKET_TCP_V4_CONN_CONTEXT, - NETDATA_CHART_PRIO_CGROUPS_CONTAINERS + order_basis++, update_every); + ebpf_write_chart_obsolete(type, + NETDATA_SOCK_ID_OR_SUFFIX_CONNECTION_TCP_V4, + "", + "Calls to tcp_v4_connection", + EBPF_COMMON_UNITS_CONNECTIONS, + NETDATA_APPS_NET_GROUP, + NETDATA_EBPF_CHART_TYPE_LINE, + NETDATA_CGROUP_TCP_V4_CONN_CONTEXT, + NETDATA_CHART_PRIO_CGROUPS_CONTAINERS + order_basis++, + update_every); if (tcp_v6_connect_address.type == 'T') { ebpf_write_chart_obsolete(type, - NETDATA_NET_APPS_CONNECTION_TCP_V6, + NETDATA_SOCK_ID_OR_SUFFIX_CONNECTION_TCP_V6, "", "Calls to tcp_v6_connection", EBPF_COMMON_UNITS_CONNECTIONS, NETDATA_APPS_NET_GROUP, NETDATA_EBPF_CHART_TYPE_LINE, - NETDATA_SERVICES_SOCKET_TCP_V6_CONN_CONTEXT, + NETDATA_CGROUP_TCP_V6_CONN_CONTEXT, NETDATA_CHART_PRIO_CGROUPS_CONTAINERS + order_basis++, update_every); } - ebpf_write_chart_obsolete(type, NETDATA_NET_APPS_BANDWIDTH_RECV, "", "Bits received", - EBPF_COMMON_UNITS_KILOBITS, NETDATA_APPS_NET_GROUP, - NETDATA_EBPF_CHART_TYPE_LINE, NETDATA_SERVICES_SOCKET_BYTES_RECV_CONTEXT, - NETDATA_CHART_PRIO_CGROUPS_CONTAINERS + order_basis++, update_every); - - ebpf_write_chart_obsolete(type, NETDATA_NET_APPS_BANDWIDTH_SENT, "","Bits sent", + ebpf_write_chart_obsolete(type, NETDATA_SOCK_ID_OR_SUFFIX_BANDWIDTH, + "", + "Bandwidth.", EBPF_COMMON_UNITS_KILOBITS, NETDATA_APPS_NET_GROUP, - NETDATA_EBPF_CHART_TYPE_LINE, NETDATA_SERVICES_SOCKET_BYTES_SEND_CONTEXT, + NETDATA_EBPF_CHART_TYPE_LINE, NETDATA_CGROUP_SOCKET_TCP_BANDWIDTH_CONTEXT, NETDATA_CHART_PRIO_CGROUPS_CONTAINERS + order_basis++, update_every); - ebpf_write_chart_obsolete(type, NETDATA_NET_APPS_BANDWIDTH_TCP_RECV_CALLS, "", "Calls to tcp_cleanup_rbuf.", + ebpf_write_chart_obsolete(type, NETDATA_SOCK_ID_OR_SUFFIX_BANDWIDTH_TCP_RECV_CALLS, "", + "Calls to tcp_cleanup_rbuf.", EBPF_COMMON_UNITS_CALLS_PER_SEC, NETDATA_APPS_NET_GROUP, - NETDATA_EBPF_CHART_TYPE_LINE, NETDATA_SERVICES_SOCKET_TCP_RECV_CONTEXT, + NETDATA_EBPF_CHART_TYPE_LINE, NETDATA_CGROUP_SOCKET_TCP_RECV_CONTEXT, NETDATA_CHART_PRIO_CGROUPS_CONTAINERS + order_basis++, update_every); - ebpf_write_chart_obsolete(type, NETDATA_NET_APPS_BANDWIDTH_TCP_SEND_CALLS, "", "Calls to tcp_sendmsg.", + ebpf_write_chart_obsolete(type, NETDATA_SOCK_ID_OR_SUFFIX_BANDWIDTH_TCP_SEND_CALLS, "", + "Calls to tcp_sendmsg.", EBPF_COMMON_UNITS_CALLS_PER_SEC, NETDATA_APPS_NET_GROUP, - NETDATA_EBPF_CHART_TYPE_LINE, NETDATA_SERVICES_SOCKET_TCP_SEND_CONTEXT, + NETDATA_EBPF_CHART_TYPE_LINE, NETDATA_CGROUP_SOCKET_TCP_SEND_CONTEXT, NETDATA_CHART_PRIO_CGROUPS_CONTAINERS + order_basis++, update_every); - ebpf_write_chart_obsolete(type, NETDATA_NET_APPS_BANDWIDTH_TCP_RETRANSMIT, "", "Calls to tcp_retransmit.", + ebpf_write_chart_obsolete(type, NETDATA_SOCK_ID_OR_SUFFIX_BANDWIDTH_TCP_RETRANSMIT, "", + "Calls to tcp_retransmit.", EBPF_COMMON_UNITS_CALLS_PER_SEC, NETDATA_APPS_NET_GROUP, - NETDATA_EBPF_CHART_TYPE_LINE, NETDATA_SERVICES_SOCKET_TCP_RETRANSMIT_CONTEXT, + NETDATA_EBPF_CHART_TYPE_LINE, NETDATA_CGROUP_SOCKET_TCP_RETRANSMIT_CONTEXT, NETDATA_CHART_PRIO_CGROUPS_CONTAINERS + order_basis++, update_every); - ebpf_write_chart_obsolete(type, NETDATA_NET_APPS_BANDWIDTH_UDP_SEND_CALLS, "", "Calls to udp_sendmsg", + ebpf_write_chart_obsolete(type, NETDATA_SOCK_ID_OR_SUFFIX_BANDWIDTH_UDP_SEND_CALLS, "", + "Calls to udp_sendmsg.", EBPF_COMMON_UNITS_CALLS_PER_SEC, NETDATA_APPS_NET_GROUP, - NETDATA_EBPF_CHART_TYPE_LINE, NETDATA_SERVICES_SOCKET_UDP_SEND_CONTEXT, + NETDATA_EBPF_CHART_TYPE_LINE, NETDATA_CGROUP_SOCKET_UDP_SEND_CONTEXT, NETDATA_CHART_PRIO_CGROUPS_CONTAINERS + order_basis++, update_every); - ebpf_write_chart_obsolete(type, NETDATA_NET_APPS_BANDWIDTH_UDP_RECV_CALLS, "", "Calls to udp_recvmsg", + ebpf_write_chart_obsolete(type, NETDATA_SOCK_ID_OR_SUFFIX_BANDWIDTH_UDP_RECV_CALLS, "", + "Calls to udp_recvmsg.", EBPF_COMMON_UNITS_CALLS_PER_SEC, NETDATA_APPS_NET_GROUP, NETDATA_EBPF_CHART_TYPE_LINE, - NETDATA_SERVICES_SOCKET_UDP_RECV_CONTEXT, + NETDATA_CGROUP_SOCKET_UDP_RECV_CONTEXT, NETDATA_CHART_PRIO_CGROUPS_CONTAINERS + order_basis++, update_every); } @@ -2311,51 +2303,39 @@ static void ebpf_obsolete_specific_socket_charts(char *type, int update_every) */ static void ebpf_send_specific_socket_data(char *type, ebpf_socket_publish_apps_t *values) { - ebpf_write_begin_chart(type, NETDATA_NET_APPS_CONNECTION_TCP_V4, ""); - write_chart_dimension(socket_publish_aggregated[NETDATA_IDX_TCP_CONNECTION_V4].name, - (long long) values->call_tcp_v4_connection); + ebpf_write_begin_chart(type, NETDATA_SOCK_ID_OR_SUFFIX_CONNECTION_TCP_V4, ""); + write_chart_dimension("connections", (long long) values->call_tcp_v4_connection); ebpf_write_end_chart(); if (tcp_v6_connect_address.type == 'T') { - ebpf_write_begin_chart(type, NETDATA_NET_APPS_CONNECTION_TCP_V6, ""); - write_chart_dimension( - socket_publish_aggregated[NETDATA_IDX_TCP_CONNECTION_V6].name, (long long)values->call_tcp_v6_connection); + ebpf_write_begin_chart(type, NETDATA_SOCK_ID_OR_SUFFIX_CONNECTION_TCP_V6, ""); + write_chart_dimension("connections", (long long)values->call_tcp_v6_connection); ebpf_write_end_chart(); } - ebpf_write_begin_chart(type, NETDATA_NET_APPS_BANDWIDTH_SENT, ""); - write_chart_dimension(socket_publish_aggregated[NETDATA_IDX_TCP_SENDMSG].name, - (long long) ebpf_socket_bytes2bits(values->bytes_sent)); + ebpf_write_begin_chart(type, NETDATA_SOCK_ID_OR_SUFFIX_BANDWIDTH, ""); + write_chart_dimension("received", (long long) ebpf_socket_bytes2bits(values->bytes_received)); + write_chart_dimension("sent", (long long) ebpf_socket_bytes2bits(values->bytes_sent)); ebpf_write_end_chart(); - ebpf_write_begin_chart(type, NETDATA_NET_APPS_BANDWIDTH_RECV, ""); - write_chart_dimension(socket_publish_aggregated[NETDATA_IDX_TCP_CLEANUP_RBUF].name, - (long long) ebpf_socket_bytes2bits(values->bytes_received)); + ebpf_write_begin_chart(type, NETDATA_SOCK_ID_OR_SUFFIX_BANDWIDTH_TCP_RECV_CALLS, ""); + write_chart_dimension("calls", (long long) values->call_tcp_received); ebpf_write_end_chart(); - ebpf_write_begin_chart(type, NETDATA_NET_APPS_BANDWIDTH_TCP_SEND_CALLS, ""); - write_chart_dimension(socket_publish_aggregated[NETDATA_IDX_TCP_SENDMSG].name, - (long long) values->call_tcp_sent); + ebpf_write_begin_chart(type, NETDATA_SOCK_ID_OR_SUFFIX_BANDWIDTH_TCP_SEND_CALLS, ""); + write_chart_dimension("calls", (long long) values->call_tcp_sent); ebpf_write_end_chart(); - ebpf_write_begin_chart(type, NETDATA_NET_APPS_BANDWIDTH_TCP_RECV_CALLS, ""); - write_chart_dimension(socket_publish_aggregated[NETDATA_IDX_TCP_CLEANUP_RBUF].name, - (long long) values->call_tcp_received); + ebpf_write_begin_chart(type, NETDATA_SOCK_ID_OR_SUFFIX_BANDWIDTH_TCP_RETRANSMIT, ""); + write_chart_dimension("calls", (long long) values->retransmit); ebpf_write_end_chart(); - ebpf_write_begin_chart(type, NETDATA_NET_APPS_BANDWIDTH_TCP_RETRANSMIT, ""); - write_chart_dimension(socket_publish_aggregated[NETDATA_IDX_TCP_RETRANSMIT].name, - (long long) values->retransmit); + ebpf_write_begin_chart(type, NETDATA_SOCK_ID_OR_SUFFIX_BANDWIDTH_UDP_SEND_CALLS, ""); + write_chart_dimension("calls", (long long) values->call_udp_sent); ebpf_write_end_chart(); - ebpf_write_begin_chart(type, NETDATA_NET_APPS_BANDWIDTH_UDP_SEND_CALLS, ""); - write_chart_dimension(socket_publish_aggregated[NETDATA_IDX_UDP_SENDMSG].name, - (long long) values->call_udp_sent); - ebpf_write_end_chart(); - - ebpf_write_begin_chart(type, NETDATA_NET_APPS_BANDWIDTH_UDP_RECV_CALLS, ""); - write_chart_dimension(socket_publish_aggregated[NETDATA_IDX_UDP_RECVBUF].name, - (long long) values->call_udp_received); + ebpf_write_begin_chart(type, NETDATA_SOCK_ID_OR_SUFFIX_BANDWIDTH_UDP_RECV_CALLS, ""); + write_chart_dimension("calls", (long long) values->call_udp_received); ebpf_write_end_chart(); } @@ -2378,8 +2358,8 @@ static void ebpf_create_systemd_socket_charts(int update_every) .context = NETDATA_SERVICES_SOCKET_TCP_V4_CONN_CONTEXT, .module = NETDATA_EBPF_MODULE_NAME_SOCKET, .update_every = 0, - .suffix = NETDATA_NET_APPS_CONNECTION_TCP_V4, - .dimension = EBPF_COMMON_UNITS_CONNECTIONS + .suffix = NETDATA_SOCK_ID_OR_SUFFIX_CONNECTION_TCP_V4, + .dimension = "connections" }; static ebpf_systemd_args_t data_tcp_v6 = { @@ -2392,36 +2372,22 @@ static void ebpf_create_systemd_socket_charts(int update_every) .context = NETDATA_SERVICES_SOCKET_TCP_V6_CONN_CONTEXT, .module = NETDATA_EBPF_MODULE_NAME_SOCKET, .update_every = 0, - .suffix = NETDATA_NET_APPS_CONNECTION_TCP_V6, - .dimension = "connection" + .suffix = NETDATA_SOCK_ID_OR_SUFFIX_CONNECTION_TCP_V6, + .dimension = "connections" }; - static ebpf_systemd_args_t data_bandwith_recv = { - .title = "Bits received", + static ebpf_systemd_args_t data_bandwidth = { + .title = "Bandwidth.", .units = EBPF_COMMON_UNITS_KILOBITS, .family = NETDATA_APPS_NET_GROUP, .charttype = NETDATA_EBPF_CHART_TYPE_STACKED, .order = 20082, .algorithm = EBPF_CHART_ALGORITHM_INCREMENTAL, - .context = NETDATA_SERVICES_SOCKET_BYTES_RECV_CONTEXT, + .context = NETDATA_SERVICES_SOCKET_TCP_BANDWIDTH_CONTEXT, .module = NETDATA_EBPF_MODULE_NAME_SOCKET, .update_every = 0, - .suffix = NETDATA_NET_APPS_BANDWIDTH_RECV, - .dimension = "connection" - }; - - static ebpf_systemd_args_t data_bandwith_sent = { - .title = "Bits sent", - .units = EBPF_COMMON_UNITS_KILOBITS, - .family = NETDATA_APPS_NET_GROUP, - .charttype = NETDATA_EBPF_CHART_TYPE_STACKED, - .order = 20083, - .algorithm = EBPF_CHART_ALGORITHM_INCREMENTAL, - .context = NETDATA_SERVICES_SOCKET_BYTES_SEND_CONTEXT, - .module = NETDATA_EBPF_MODULE_NAME_SOCKET, - .update_every = 0, - .suffix = NETDATA_NET_APPS_BANDWIDTH_SENT, - .dimension = EBPF_COMMON_UNITS_KILOBITS + .suffix = NETDATA_SOCK_ID_OR_SUFFIX_BANDWIDTH, + .dimension = "received,sent" }; static ebpf_systemd_args_t data_tcp_cleanup = { @@ -2434,7 +2400,7 @@ static void ebpf_create_systemd_socket_charts(int update_every) .context = NETDATA_SERVICES_SOCKET_TCP_RECV_CONTEXT, .module = NETDATA_EBPF_MODULE_NAME_SOCKET, .update_every = 0, - .suffix = NETDATA_NET_APPS_BANDWIDTH_TCP_RECV_CALLS, + .suffix = NETDATA_SOCK_ID_OR_SUFFIX_BANDWIDTH_TCP_RECV_CALLS, .dimension = "calls" }; @@ -2448,7 +2414,7 @@ static void ebpf_create_systemd_socket_charts(int update_every) .context = NETDATA_SERVICES_SOCKET_TCP_SEND_CONTEXT, .module = NETDATA_EBPF_MODULE_NAME_SOCKET, .update_every = 0, - .suffix = NETDATA_NET_APPS_BANDWIDTH_TCP_SEND_CALLS, + .suffix = NETDATA_SOCK_ID_OR_SUFFIX_BANDWIDTH_TCP_SEND_CALLS, .dimension = "calls" }; @@ -2462,7 +2428,7 @@ static void ebpf_create_systemd_socket_charts(int update_every) .context = NETDATA_SERVICES_SOCKET_TCP_RETRANSMIT_CONTEXT, .module = NETDATA_EBPF_MODULE_NAME_SOCKET, .update_every = 0, - .suffix = NETDATA_NET_APPS_BANDWIDTH_TCP_RETRANSMIT, + .suffix = NETDATA_SOCK_ID_OR_SUFFIX_BANDWIDTH_TCP_RETRANSMIT, .dimension = "calls" }; @@ -2476,7 +2442,7 @@ static void ebpf_create_systemd_socket_charts(int update_every) .context = NETDATA_SERVICES_SOCKET_UDP_SEND_CONTEXT, .module = NETDATA_EBPF_MODULE_NAME_SOCKET, .update_every = 0, - .suffix = NETDATA_NET_APPS_BANDWIDTH_UDP_SEND_CALLS, + .suffix = NETDATA_SOCK_ID_OR_SUFFIX_BANDWIDTH_UDP_SEND_CALLS, .dimension = "calls" }; @@ -2490,13 +2456,13 @@ static void ebpf_create_systemd_socket_charts(int update_every) .context = NETDATA_SERVICES_SOCKET_UDP_RECV_CONTEXT, .module = NETDATA_EBPF_MODULE_NAME_SOCKET, .update_every = 0, - .suffix = NETDATA_NET_APPS_BANDWIDTH_UDP_RECV_CALLS, + .suffix = NETDATA_SOCK_ID_OR_SUFFIX_BANDWIDTH_UDP_RECV_CALLS, .dimension = "calls" }; if (!data_tcp_v4.update_every) - data_tcp_v4.update_every = data_tcp_v6.update_every = data_bandwith_recv.update_every = - data_bandwith_sent.update_every = data_tcp_cleanup.update_every = data_tcp_sendmsg.update_every = + data_tcp_v4.update_every = data_tcp_v6.update_every = data_bandwidth.update_every = + data_tcp_cleanup.update_every = data_tcp_sendmsg.update_every = data_tcp_retransmit.update_every = data_udp_send.update_every = data_udp_recv.update_every = update_every; ebpf_cgroup_target_t *w; @@ -2504,8 +2470,8 @@ static void ebpf_create_systemd_socket_charts(int update_every) if (unlikely(!w->systemd || w->flags & NETDATA_EBPF_SERVICES_HAS_SOCKET_CHART)) continue; - data_tcp_v4.id = data_tcp_v6.id = data_bandwith_recv.id = - data_bandwith_sent.id = data_tcp_cleanup.id = data_tcp_sendmsg.id = + data_tcp_v4.id = data_tcp_v6.id = data_bandwidth.id = + data_tcp_cleanup.id = data_tcp_sendmsg.id = data_tcp_retransmit.id = data_udp_send.id = data_udp_recv.id = w->name; ebpf_create_charts_on_systemd(&data_tcp_v4); @@ -2513,8 +2479,7 @@ static void ebpf_create_systemd_socket_charts(int update_every) ebpf_create_charts_on_systemd(&data_tcp_v6); } - ebpf_create_charts_on_systemd(&data_bandwith_recv); - ebpf_create_charts_on_systemd(&data_bandwith_sent); + ebpf_create_charts_on_systemd(&data_bandwidth); ebpf_create_charts_on_systemd(&data_tcp_cleanup); @@ -2543,41 +2508,38 @@ static void ebpf_send_systemd_socket_charts() continue; } - ebpf_write_begin_chart(NETDATA_SERVICE_FAMILY, ect->name, NETDATA_NET_APPS_CONNECTION_TCP_V4); + ebpf_write_begin_chart(ect->name, NETDATA_SOCK_ID_OR_SUFFIX_CONNECTION_TCP_V4, ""); write_chart_dimension("connections", (long long)ect->publish_socket.call_tcp_v4_connection); ebpf_write_end_chart(); if (tcp_v6_connect_address.type == 'T') { - ebpf_write_begin_chart(NETDATA_SERVICE_FAMILY, ect->name, NETDATA_NET_APPS_CONNECTION_TCP_V6); + ebpf_write_begin_chart(ect->name, NETDATA_SOCK_ID_OR_SUFFIX_CONNECTION_TCP_V6, ""); write_chart_dimension("connections", (long long)ect->publish_socket.call_tcp_v6_connection); ebpf_write_end_chart(); } - ebpf_write_begin_chart(NETDATA_SERVICE_FAMILY, ect->name, NETDATA_NET_APPS_BANDWIDTH_SENT); - write_chart_dimension("bits", (long long)ect->publish_socket.bytes_sent); + ebpf_write_begin_chart(ect->name, NETDATA_SOCK_ID_OR_SUFFIX_BANDWIDTH, ""); + write_chart_dimension("received", (long long)ect->publish_socket.bytes_received); + write_chart_dimension("sent", (long long)ect->publish_socket.bytes_sent); ebpf_write_end_chart(); - ebpf_write_begin_chart(NETDATA_SERVICE_FAMILY, ect->name, NETDATA_NET_APPS_BANDWIDTH_RECV); - write_chart_dimension("bits", (long long)ect->publish_socket.bytes_received); - ebpf_write_end_chart(); - - ebpf_write_begin_chart(NETDATA_SERVICE_FAMILY, ect->name, NETDATA_NET_APPS_BANDWIDTH_TCP_SEND_CALLS); + ebpf_write_begin_chart(ect->name, NETDATA_SOCK_ID_OR_SUFFIX_BANDWIDTH_TCP_SEND_CALLS, ""); write_chart_dimension("calls", (long long)ect->publish_socket.call_tcp_sent); ebpf_write_end_chart(); - ebpf_write_begin_chart(NETDATA_SERVICE_FAMILY, ect->name, NETDATA_NET_APPS_BANDWIDTH_TCP_RECV_CALLS); + ebpf_write_begin_chart(ect->name, NETDATA_SOCK_ID_OR_SUFFIX_BANDWIDTH_TCP_RECV_CALLS, ""); write_chart_dimension("calls", (long long)ect->publish_socket.call_tcp_received); ebpf_write_end_chart(); - ebpf_write_begin_chart(NETDATA_SERVICE_FAMILY, ect->name, NETDATA_NET_APPS_BANDWIDTH_TCP_RETRANSMIT); + ebpf_write_begin_chart(ect->name, NETDATA_SOCK_ID_OR_SUFFIX_BANDWIDTH_TCP_RETRANSMIT, ""); write_chart_dimension("calls", (long long)ect->publish_socket.retransmit); ebpf_write_end_chart(); - ebpf_write_begin_chart(NETDATA_SERVICE_FAMILY, ect->name, NETDATA_NET_APPS_BANDWIDTH_UDP_SEND_CALLS); + ebpf_write_begin_chart(ect->name, NETDATA_SOCK_ID_OR_SUFFIX_BANDWIDTH_UDP_SEND_CALLS, ""); write_chart_dimension("calls", (long long)ect->publish_socket.call_udp_sent); ebpf_write_end_chart(); - ebpf_write_begin_chart(NETDATA_SERVICE_FAMILY, ect->name, NETDATA_NET_APPS_BANDWIDTH_UDP_RECV_CALLS); + ebpf_write_begin_chart(ect->name, NETDATA_SOCK_ID_OR_SUFFIX_BANDWIDTH_UDP_RECV_CALLS, ""); write_chart_dimension("calls", (long long)ect->publish_socket.call_udp_received); ebpf_write_end_chart(); } @@ -2888,6 +2850,7 @@ static int ebpf_socket_load_bpf(ebpf_module_t *em) */ void *ebpf_socket_thread(void *ptr) { + pids_fd[EBPF_PIDS_SOCKET_IDX] = -1; ebpf_module_t *em = (ebpf_module_t *)ptr; CLEANUP_FUNCTION_REGISTER(ebpf_socket_exit) cleanup_ptr = em; @@ -2917,7 +2880,6 @@ void *ebpf_socket_thread(void *ptr) ebpf_adjust_thread_load(em, default_btf); #endif if (ebpf_socket_load_bpf(em)) { - pthread_mutex_unlock(&lock); goto endsocket; } diff --git a/src/collectors/ebpf.plugin/ebpf_socket.h b/src/collectors/ebpf.plugin/ebpf_socket.h index b36ed064c..e01126035 100644 --- a/src/collectors/ebpf.plugin/ebpf_socket.h +++ b/src/collectors/ebpf.plugin/ebpf_socket.h @@ -112,16 +112,15 @@ typedef enum ebpf_socket_idx { #define NETDATA_UDP_FUNCTION_BITS "total_udp_bandwidth" #define NETDATA_UDP_FUNCTION_ERROR "udp_error" -// Charts created on Apps submenu -#define NETDATA_NET_APPS_CONNECTION_TCP_V4 "outbound_conn_v4" -#define NETDATA_NET_APPS_CONNECTION_TCP_V6 "outbound_conn_v6" -#define NETDATA_NET_APPS_BANDWIDTH_SENT "total_bandwidth_sent" -#define NETDATA_NET_APPS_BANDWIDTH_RECV "total_bandwidth_recv" -#define NETDATA_NET_APPS_BANDWIDTH_TCP_SEND_CALLS "bandwidth_tcp_send" -#define NETDATA_NET_APPS_BANDWIDTH_TCP_RECV_CALLS "bandwidth_tcp_recv" -#define NETDATA_NET_APPS_BANDWIDTH_TCP_RETRANSMIT "bandwidth_tcp_retransmit" -#define NETDATA_NET_APPS_BANDWIDTH_UDP_SEND_CALLS "bandwidth_udp_send" -#define NETDATA_NET_APPS_BANDWIDTH_UDP_RECV_CALLS "bandwidth_udp_recv" +// Charts created (id or suffix) +#define NETDATA_SOCK_ID_OR_SUFFIX_CONNECTION_TCP_V4 "outbound_conn_v4" +#define NETDATA_SOCK_ID_OR_SUFFIX_CONNECTION_TCP_V6 "outbound_conn_v6" +#define NETDATA_SOCK_ID_OR_SUFFIX_BANDWIDTH "total_bandwidth" +#define NETDATA_SOCK_ID_OR_SUFFIX_BANDWIDTH_TCP_SEND_CALLS "bandwidth_tcp_send" +#define NETDATA_SOCK_ID_OR_SUFFIX_BANDWIDTH_TCP_RECV_CALLS "bandwidth_tcp_recv" +#define NETDATA_SOCK_ID_OR_SUFFIX_BANDWIDTH_TCP_RETRANSMIT "bandwidth_tcp_retransmit" +#define NETDATA_SOCK_ID_OR_SUFFIX_BANDWIDTH_UDP_SEND_CALLS "bandwidth_udp_send" +#define NETDATA_SOCK_ID_OR_SUFFIX_BANDWIDTH_UDP_RECV_CALLS "bandwidth_udp_recv" // Port range #define NETDATA_MINIMUM_PORT_VALUE 1 @@ -137,30 +136,28 @@ typedef enum ebpf_socket_idx { // Contexts #define NETDATA_CGROUP_TCP_V4_CONN_CONTEXT "cgroup.net_conn_ipv4" #define NETDATA_CGROUP_TCP_V6_CONN_CONTEXT "cgroup.net_conn_ipv6" -#define NETDATA_CGROUP_SOCKET_BYTES_RECV_CONTEXT "cgroup.net_bytes_recv" -#define NETDATA_CGROUP_SOCKET_BYTES_SEND_CONTEXT "cgroup.net_bytes_send" +#define NETDATA_CGROUP_SOCKET_TCP_BANDWIDTH_CONTEXT "cgroup.net_total_bandwidth" #define NETDATA_CGROUP_SOCKET_TCP_RECV_CONTEXT "cgroup.net_tcp_recv" #define NETDATA_CGROUP_SOCKET_TCP_SEND_CONTEXT "cgroup.net_tcp_send" #define NETDATA_CGROUP_SOCKET_TCP_RETRANSMIT_CONTEXT "cgroup.net_retransmit" #define NETDATA_CGROUP_SOCKET_UDP_RECV_CONTEXT "cgroup.net_udp_recv" #define NETDATA_CGROUP_SOCKET_UDP_SEND_CONTEXT "cgroup.net_udp_send" -#define NETDATA_SERVICES_SOCKET_TCP_V4_CONN_CONTEXT "systemd.services.net_conn_ipv4" -#define NETDATA_SERVICES_SOCKET_TCP_V6_CONN_CONTEXT "systemd.services.net_conn_ipv6" -#define NETDATA_SERVICES_SOCKET_BYTES_RECV_CONTEXT "systemd.services.net_bytes_recv" -#define NETDATA_SERVICES_SOCKET_BYTES_SEND_CONTEXT "systemd.services.net_bytes_send" -#define NETDATA_SERVICES_SOCKET_TCP_RECV_CONTEXT "systemd.services.net_tcp_recv" -#define NETDATA_SERVICES_SOCKET_TCP_SEND_CONTEXT "systemd.services.net_tcp_send" -#define NETDATA_SERVICES_SOCKET_TCP_RETRANSMIT_CONTEXT "systemd.services.net_retransmit" -#define NETDATA_SERVICES_SOCKET_UDP_RECV_CONTEXT "systemd.services.net_udp_recv" -#define NETDATA_SERVICES_SOCKET_UDP_SEND_CONTEXT "systemd.services.net_udp_send" +#define NETDATA_SERVICES_SOCKET_TCP_V4_CONN_CONTEXT "systemd.service.net_conn_ipv4" +#define NETDATA_SERVICES_SOCKET_TCP_V6_CONN_CONTEXT "systemd.service.net_conn_ipv6" +#define NETDATA_SERVICES_SOCKET_TCP_BANDWIDTH_CONTEXT "systemd.service.net_total_bandwidth" +#define NETDATA_SERVICES_SOCKET_TCP_RECV_CONTEXT "systemd.service.net_tcp_recv" +#define NETDATA_SERVICES_SOCKET_TCP_SEND_CONTEXT "systemd.service.net_tcp_send" +#define NETDATA_SERVICES_SOCKET_TCP_RETRANSMIT_CONTEXT "systemd.service.net_retransmit" +#define NETDATA_SERVICES_SOCKET_UDP_RECV_CONTEXT "systemd.service.net_udp_recv" +#define NETDATA_SERVICES_SOCKET_UDP_SEND_CONTEXT "systemd.service.net_udp_send" // ARAL name #define NETDATA_EBPF_SOCKET_ARAL_NAME "ebpf_socket" #define NETDATA_EBPF_PID_SOCKET_ARAL_TABLE_NAME "ebpf_pid_socket" #define NETDATA_EBPF_SOCKET_ARAL_TABLE_NAME "ebpf_socket_tbl" -typedef struct ebpf_socket_publish_apps { +typedef struct __attribute__((packed)) ebpf_socket_publish_apps { // Data read uint64_t bytes_sent; // Bytes sent uint64_t bytes_received; // Bytes received @@ -345,8 +342,7 @@ void ebpf_parse_service_name_section(struct config *cfg); void ebpf_parse_ips_unsafe(char *ptr); void ebpf_parse_ports(char *ptr); void ebpf_socket_read_open_connections(BUFFER *buf, struct ebpf_module *em); -void ebpf_socket_fill_publish_apps(uint32_t current_pid, netdata_socket_t *ns); - +void ebpf_socket_fill_publish_apps(ebpf_socket_publish_apps_t *curr, netdata_socket_t *ns); extern struct config socket_config; extern netdata_ebpf_targets_t socket_targets[]; diff --git a/src/collectors/ebpf.plugin/ebpf_swap.c b/src/collectors/ebpf.plugin/ebpf_swap.c index 1e2a7cc60..933353178 100644 --- a/src/collectors/ebpf.plugin/ebpf_swap.c +++ b/src/collectors/ebpf.plugin/ebpf_swap.c @@ -10,7 +10,7 @@ static netdata_publish_syscall_t swap_publish_aggregated[NETDATA_SWAP_END]; static netdata_idx_t swap_hash_values[NETDATA_SWAP_END]; static netdata_idx_t *swap_values = NULL; -netdata_publish_swap_t *swap_vector = NULL; +netdata_ebpf_swap_t *swap_vector = NULL; struct config swap_config = { .first_section = NULL, .last_section = NULL, @@ -274,9 +274,9 @@ static void ebpf_obsolete_specific_swap_charts(char *type, int update_every); */ static void ebpf_obsolete_swap_services(ebpf_module_t *em, char *id) { - ebpf_write_chart_obsolete(NETDATA_SERVICE_FAMILY, - id, + ebpf_write_chart_obsolete(id, NETDATA_MEM_SWAP_READ_CHART, + "", "Calls to function swap_readpage.", EBPF_COMMON_UNITS_CALLS_PER_SEC, NETDATA_SYSTEM_SWAP_SUBMENU, @@ -285,9 +285,9 @@ static void ebpf_obsolete_swap_services(ebpf_module_t *em, char *id) 20191, em->update_every); - ebpf_write_chart_obsolete(NETDATA_SERVICE_FAMILY, - id, + ebpf_write_chart_obsolete(id, NETDATA_MEM_SWAP_WRITE_CHART, + "", "Calls to function swap_writepage.", EBPF_COMMON_UNITS_CALLS_PER_SEC, NETDATA_SYSTEM_SWAP_SUBMENU, @@ -391,8 +391,13 @@ static void ebpf_obsolete_swap_global(ebpf_module_t *em) */ static void ebpf_swap_exit(void *ptr) { + pids_fd[EBPF_PIDS_SWAP_IDX] = -1; ebpf_module_t *em = (ebpf_module_t *)ptr; + pthread_mutex_lock(&lock); + collect_pids &= ~(1<<EBPF_MODULE_SWAP_IDX); + pthread_mutex_unlock(&lock); + if (ebpf_read_swap.thread) nd_thread_signal_cancel(ebpf_read_swap.thread); @@ -447,14 +452,21 @@ static void ebpf_swap_exit(void *ptr) * @param out the vector with read values. * @param maps_per_core do I need to read all cores? */ -static void swap_apps_accumulator(netdata_publish_swap_t *out, int maps_per_core) +static void swap_apps_accumulator(netdata_ebpf_swap_t *out, int maps_per_core) { int i, end = (maps_per_core) ? ebpf_nprocs : 1; - netdata_publish_swap_t *total = &out[0]; + netdata_ebpf_swap_t *total = &out[0]; + uint64_t ct = total->ct; for (i = 1; i < end; i++) { - netdata_publish_swap_t *w = &out[i]; + netdata_ebpf_swap_t *w = &out[i]; total->write += w->write; total->read += w->read; + + if (w->ct > ct) + ct = w->ct; + + if (!total->name[0] && w->name[0]) + strncpyz(total->name, w->name, sizeof(total->name) - 1); } } @@ -472,12 +484,11 @@ static void ebpf_update_swap_cgroup() for (pids = ect->pids; pids; pids = pids->next) { int pid = pids->pid; netdata_publish_swap_t *out = &pids->swap; - ebpf_pid_stat_t *local_pid = ebpf_get_pid_entry(pid, 0); - if (local_pid) { - netdata_publish_swap_t *in = &local_pid->swap; - - memcpy(out, in, sizeof(netdata_publish_swap_t)); - } + ebpf_pid_data_t *local_pid = ebpf_get_pid_data(pid, 0, NULL, EBPF_PIDS_SWAP_IDX); + netdata_publish_swap_t *in = local_pid->swap; + if (!in) + continue; + memcpy(out, in, sizeof(netdata_publish_swap_t)); } } pthread_mutex_unlock(&mutex_cgroup_shm); @@ -496,15 +507,15 @@ static void ebpf_swap_sum_pids(netdata_publish_swap_t *swap, struct ebpf_pid_on_ uint64_t local_read = 0; uint64_t local_write = 0; - while (root) { + for (; root; root = root->next) { int32_t pid = root->pid; - ebpf_pid_stat_t *local_pid = ebpf_get_pid_entry(pid, 0); - if (local_pid) { - netdata_publish_swap_t *w = &local_pid->swap; - local_write += w->write; - local_read += w->read; - } - root = root->next; + ebpf_pid_data_t *local_pid = ebpf_get_pid_data(pid, 0, NULL, EBPF_PIDS_SWAP_IDX); + netdata_publish_swap_t *w = local_pid->swap; + if (!w) + continue; + + local_write += w->write; + local_read += w->read; } // These conditions were added, because we are using incremental algorithm @@ -532,12 +543,13 @@ void ebpf_swap_resume_apps_data() { * Read the apps table and store data inside the structure. * * @param maps_per_core do I need to read all cores? + * @param max_period limit of iterations without updates before remove data from hash table */ -static void ebpf_read_swap_apps_table(int maps_per_core, int max_period) +static void ebpf_read_swap_apps_table(int maps_per_core, uint32_t max_period) { - netdata_publish_swap_t *cv = swap_vector; + netdata_ebpf_swap_t *cv = swap_vector; int fd = swap_maps[NETDATA_PID_SWAP_TABLE].map_fd; - size_t length = sizeof(netdata_publish_swap_t); + size_t length = sizeof(netdata_ebpf_swap_t); if (maps_per_core) length *= ebpf_nprocs; @@ -549,17 +561,22 @@ static void ebpf_read_swap_apps_table(int maps_per_core, int max_period) swap_apps_accumulator(cv, maps_per_core); - ebpf_pid_stat_t *local_pid = ebpf_get_pid_entry(key, cv->tgid); - if (!local_pid) - goto end_swap_loop; + ebpf_pid_data_t *local_pid = ebpf_get_pid_data(key, cv->tgid, cv->name, EBPF_PIDS_SWAP_IDX); + netdata_publish_swap_t *publish = local_pid->swap; + if (!publish) + local_pid->swap = publish = ebpf_swap_allocate_publish_swap(); - netdata_publish_swap_t *publish = &local_pid->swap; if (!publish->ct || publish->ct != cv->ct) { memcpy(publish, cv, sizeof(netdata_publish_swap_t)); local_pid->not_updated = 0; - } else if (++local_pid->not_updated >= max_period) { - bpf_map_delete_elem(fd, &key); - local_pid->not_updated = 0; + } else { + if (kill(key, 0)) { // No PID found + ebpf_reset_specific_pid_data(local_pid); + } else { // There is PID, but there is not data anymore + ebpf_release_pid_data(local_pid, fd, key, EBPF_PIDS_SWAP_IDX); + ebpf_swap_release_publish(publish); + local_pid->swap = NULL; + } } // We are cleaning to avoid passing data read from one process to other. @@ -587,13 +604,17 @@ void *ebpf_read_swap_thread(void *ptr) int maps_per_core = em->maps_per_core; int update_every = em->update_every; + int collect_pid = (em->apps_charts || em->cgroup_charts); + if (!collect_pid) + return NULL; int counter = update_every - 1; uint32_t lifetime = em->lifetime; uint32_t running_time = 0; usec_t period = update_every * USEC_PER_SEC; - int max_period = update_every * EBPF_CLEANUP_FACTOR; + uint32_t max_period = EBPF_CLEANUP_FACTOR; + pids_fd[EBPF_PIDS_SWAP_IDX] = swap_maps[NETDATA_PID_SWAP_TABLE].map_fd; while (!ebpf_plugin_stop() && running_time < lifetime) { (void)heartbeat_next(&hb, period); @@ -722,11 +743,11 @@ static void ebpf_send_systemd_swap_charts() continue; } - ebpf_write_begin_chart(NETDATA_SERVICE_FAMILY, ect->name, NETDATA_MEM_SWAP_READ_CHART); + ebpf_write_begin_chart(ect->name, NETDATA_MEM_SWAP_READ_CHART, ""); write_chart_dimension("calls", (long long) ect->publish_systemd_swap.read); ebpf_write_end_chart(); - ebpf_write_begin_chart(NETDATA_SERVICE_FAMILY, ect->name, NETDATA_MEM_SWAP_WRITE_CHART); + ebpf_write_begin_chart(ect->name, NETDATA_MEM_SWAP_WRITE_CHART, ""); write_chart_dimension("calls", (long long) ect->publish_systemd_swap.write); ebpf_write_end_chart(); } @@ -1017,7 +1038,7 @@ void ebpf_swap_create_apps_charts(struct ebpf_module *em, void *ptr) */ static void ebpf_swap_allocate_global_vectors() { - swap_vector = callocz((size_t)ebpf_nprocs, sizeof(netdata_publish_swap_t)); + swap_vector = callocz((size_t)ebpf_nprocs, sizeof(netdata_ebpf_swap_t)); swap_values = callocz((size_t)ebpf_nprocs, sizeof(netdata_idx_t)); diff --git a/src/collectors/ebpf.plugin/ebpf_swap.h b/src/collectors/ebpf.plugin/ebpf_swap.h index 92aecd29b..478b47adf 100644 --- a/src/collectors/ebpf.plugin/ebpf_swap.h +++ b/src/collectors/ebpf.plugin/ebpf_swap.h @@ -21,19 +21,26 @@ // Contexts #define NETDATA_CGROUP_SWAP_READ_CONTEXT "cgroup.swap_read" #define NETDATA_CGROUP_SWAP_WRITE_CONTEXT "cgroup.swap_write" -#define NETDATA_SYSTEMD_SWAP_READ_CONTEXT "systemd.services.swap_read" -#define NETDATA_SYSTEMD_SWAP_WRITE_CONTEXT "systemd.services.swap_write" +#define NETDATA_SYSTEMD_SWAP_READ_CONTEXT "systemd.service.swap_read" +#define NETDATA_SYSTEMD_SWAP_WRITE_CONTEXT "systemd.service.swap_write" -typedef struct netdata_publish_swap { +typedef struct __attribute__((packed)) netdata_publish_swap { + uint64_t ct; + + uint32_t read; + uint32_t write; +} netdata_publish_swap_t; + +typedef struct netdata_ebpf_swap { uint64_t ct; uint32_t tgid; uint32_t uid; uint32_t gid; char name[TASK_COMM_LEN]; - uint64_t read; - uint64_t write; -} netdata_publish_swap_t; + uint32_t read; + uint32_t write; +} netdata_ebpf_swap_t; enum swap_tables { NETDATA_PID_SWAP_TABLE, diff --git a/src/collectors/ebpf.plugin/ebpf_vfs.c b/src/collectors/ebpf.plugin/ebpf_vfs.c index eea27192e..cf1f50e99 100644 --- a/src/collectors/ebpf.plugin/ebpf_vfs.c +++ b/src/collectors/ebpf.plugin/ebpf_vfs.c @@ -11,7 +11,7 @@ static char *vfs_id_names[NETDATA_KEY_PUBLISH_VFS_END] = { "vfs_unlink", "vfs_re static netdata_idx_t *vfs_hash_values = NULL; static netdata_syscall_stat_t vfs_aggregated_data[NETDATA_KEY_PUBLISH_VFS_END]; static netdata_publish_syscall_t vfs_publish_aggregated[NETDATA_KEY_PUBLISH_VFS_END]; -netdata_publish_vfs_t *vfs_vector = NULL; +netdata_ebpf_vfs_t *vfs_vector = NULL; static ebpf_local_maps_t vfs_maps[] = {{.name = "tbl_vfs_pid", .internal_input = ND_EBPF_DEFAULT_PID_SIZE, .user_input = 0, .type = NETDATA_EBPF_MAP_RESIZABLE | NETDATA_EBPF_MAP_PID, @@ -396,9 +396,9 @@ static void ebpf_obsolete_specific_vfs_charts(char *type, ebpf_module_t *em); */ static void ebpf_obsolete_vfs_services(ebpf_module_t *em, char *id) { - ebpf_write_chart_obsolete(NETDATA_SERVICE_FAMILY, - id, + ebpf_write_chart_obsolete(id, NETDATA_SYSCALL_APPS_FILE_DELETED, + "", "Files deleted", EBPF_COMMON_UNITS_CALLS_PER_SEC, NETDATA_VFS_GROUP, @@ -407,9 +407,9 @@ static void ebpf_obsolete_vfs_services(ebpf_module_t *em, char *id) 20065, em->update_every); - ebpf_write_chart_obsolete(NETDATA_SERVICE_FAMILY, - id, + ebpf_write_chart_obsolete(id, NETDATA_SYSCALL_APPS_VFS_WRITE_CALLS, + "", "Write to disk", EBPF_COMMON_UNITS_CALLS_PER_SEC, NETDATA_VFS_GROUP, @@ -419,9 +419,9 @@ static void ebpf_obsolete_vfs_services(ebpf_module_t *em, char *id) em->update_every); if (em->mode < MODE_ENTRY) { - ebpf_write_chart_obsolete(NETDATA_SERVICE_FAMILY, - id, + ebpf_write_chart_obsolete(id, NETDATA_SYSCALL_APPS_VFS_WRITE_CALLS_ERROR, + "", "Fails to write", EBPF_COMMON_UNITS_CALLS_PER_SEC, NETDATA_VFS_GROUP, @@ -431,9 +431,9 @@ static void ebpf_obsolete_vfs_services(ebpf_module_t *em, char *id) em->update_every); } - ebpf_write_chart_obsolete(NETDATA_SERVICE_FAMILY, - id, + ebpf_write_chart_obsolete(id, NETDATA_SYSCALL_APPS_VFS_READ_CALLS, + "", "Read from disk", EBPF_COMMON_UNITS_CALLS_PER_SEC, NETDATA_VFS_GROUP, @@ -443,9 +443,9 @@ static void ebpf_obsolete_vfs_services(ebpf_module_t *em, char *id) em->update_every); if (em->mode < MODE_ENTRY) { - ebpf_write_chart_obsolete(NETDATA_SERVICE_FAMILY, - id, + ebpf_write_chart_obsolete(id, NETDATA_SYSCALL_APPS_VFS_READ_CALLS_ERROR, + "", "Fails to read", EBPF_COMMON_UNITS_CALLS_PER_SEC, NETDATA_VFS_GROUP, @@ -455,9 +455,9 @@ static void ebpf_obsolete_vfs_services(ebpf_module_t *em, char *id) em->update_every); } - ebpf_write_chart_obsolete(NETDATA_SERVICE_FAMILY, - id, + ebpf_write_chart_obsolete(id, NETDATA_SYSCALL_APPS_VFS_WRITE_BYTES, + "", "Bytes written on disk", EBPF_COMMON_UNITS_BYTES, NETDATA_VFS_GROUP, @@ -466,9 +466,9 @@ static void ebpf_obsolete_vfs_services(ebpf_module_t *em, char *id) 20070, em->update_every); - ebpf_write_chart_obsolete(NETDATA_SERVICE_FAMILY, - id, + ebpf_write_chart_obsolete(id, NETDATA_SYSCALL_APPS_VFS_READ_BYTES, + "", "Bytes read from disk", EBPF_COMMON_UNITS_BYTES, NETDATA_VFS_GROUP, @@ -477,9 +477,9 @@ static void ebpf_obsolete_vfs_services(ebpf_module_t *em, char *id) 20071, em->update_every); - ebpf_write_chart_obsolete(NETDATA_SERVICE_FAMILY, - id, + ebpf_write_chart_obsolete(id, NETDATA_SYSCALL_APPS_VFS_FSYNC, + "", "Calls to vfs_fsync.", EBPF_COMMON_UNITS_CALLS_PER_SEC, NETDATA_VFS_GROUP, @@ -489,9 +489,9 @@ static void ebpf_obsolete_vfs_services(ebpf_module_t *em, char *id) em->update_every); if (em->mode < MODE_ENTRY) { - ebpf_write_chart_obsolete(NETDATA_SERVICE_FAMILY, - id, + ebpf_write_chart_obsolete(id, NETDATA_SYSCALL_APPS_VFS_FSYNC_CALLS_ERROR, + "", "Sync error", EBPF_COMMON_UNITS_CALLS_PER_SEC, NETDATA_VFS_GROUP, @@ -501,9 +501,9 @@ static void ebpf_obsolete_vfs_services(ebpf_module_t *em, char *id) em->update_every); } - ebpf_write_chart_obsolete(NETDATA_SERVICE_FAMILY, - id, + ebpf_write_chart_obsolete(id, NETDATA_SYSCALL_APPS_VFS_OPEN, + "", "Calls to vfs_open.", EBPF_COMMON_UNITS_CALLS_PER_SEC, NETDATA_VFS_GROUP, @@ -513,9 +513,9 @@ static void ebpf_obsolete_vfs_services(ebpf_module_t *em, char *id) em->update_every); if (em->mode < MODE_ENTRY) { - ebpf_write_chart_obsolete(NETDATA_SERVICE_FAMILY, - id, + ebpf_write_chart_obsolete(id, NETDATA_SYSCALL_APPS_VFS_OPEN_CALLS_ERROR, + "", "Open error", EBPF_COMMON_UNITS_CALLS_PER_SEC, NETDATA_VFS_GROUP, @@ -525,9 +525,9 @@ static void ebpf_obsolete_vfs_services(ebpf_module_t *em, char *id) em->update_every); } - ebpf_write_chart_obsolete(NETDATA_SERVICE_FAMILY, - id, + ebpf_write_chart_obsolete(id, NETDATA_SYSCALL_APPS_VFS_CREATE, + "", "Calls to vfs_create.", EBPF_COMMON_UNITS_CALLS_PER_SEC, NETDATA_VFS_GROUP, @@ -537,9 +537,9 @@ static void ebpf_obsolete_vfs_services(ebpf_module_t *em, char *id) em->update_every); if (em->mode < MODE_ENTRY) { - ebpf_write_chart_obsolete(NETDATA_SERVICE_FAMILY, - id, + ebpf_write_chart_obsolete(id, NETDATA_SYSCALL_APPS_VFS_CREATE_CALLS_ERROR, + "", "Create error", EBPF_COMMON_UNITS_CALLS_PER_SEC, NETDATA_VFS_GROUP, @@ -881,6 +881,10 @@ static void ebpf_vfs_exit(void *pptr) ebpf_module_t *em = CLEANUP_FUNCTION_GET_PTR(pptr); if(!em) return; + pthread_mutex_lock(&lock); + collect_pids &= ~(1<<EBPF_MODULE_VFS_IDX); + pthread_mutex_unlock(&lock); + if (ebpf_read_vfs.thread) nd_thread_signal_cancel(ebpf_read_vfs.thread); @@ -1029,6 +1033,74 @@ static void ebpf_vfs_read_global_table(netdata_idx_t *stats, int maps_per_core) } /** + * Set VFS + * + * Set vfs structure with values from ebpf structure. + * + * @param vfs the output structure. + * @param w the input data. + */ +static inline void vfs_aggregate_set_vfs(netdata_publish_vfs_t *vfs, netdata_ebpf_vfs_t *w) +{ + vfs->write_call = w->write_call; + vfs->writev_call = w->writev_call; + vfs->read_call = w->read_call; + vfs->readv_call = w->readv_call; + vfs->unlink_call = w->unlink_call; + vfs->fsync_call = w->fsync_call; + vfs->open_call = w->open_call; + vfs->create_call = w->create_call; + + vfs->write_bytes = w->write_bytes; + vfs->writev_bytes = w->writev_bytes; + vfs->read_bytes = w->read_bytes; + vfs->readv_bytes = w->readv_bytes; + + vfs->write_err = w->write_err; + vfs->writev_err = w->writev_err; + vfs->read_err = w->read_err; + vfs->readv_err = w->readv_err; + vfs->unlink_err = w->unlink_err; + vfs->fsync_err = w->fsync_err; + vfs->open_err = w->open_err; + vfs->create_err = w->create_err; +} + +/** + * Aggregate Publish VFS + * + * Aggregate data from w source. + * + * @param vfs the output structure. + * @param w the input data. + */ +static inline void vfs_aggregate_publish_vfs(netdata_publish_vfs_t *vfs, netdata_publish_vfs_t *w) +{ + vfs->write_call += w->write_call; + vfs->writev_call += w->writev_call; + vfs->read_call += w->read_call; + vfs->readv_call += w->readv_call; + vfs->unlink_call += w->unlink_call; + vfs->fsync_call += w->fsync_call; + vfs->open_call += w->open_call; + vfs->create_call += w->create_call; + + vfs->write_bytes += w->write_bytes; + vfs->writev_bytes += w->writev_bytes; + vfs->read_bytes += w->read_bytes; + vfs->readv_bytes += w->readv_bytes; + + vfs->write_err += w->write_err; + vfs->writev_err += w->writev_err; + vfs->read_err += w->read_err; + vfs->readv_err += w->readv_err; + vfs->unlink_err += w->unlink_err; + vfs->fsync_err += w->fsync_err; + vfs->open_err += w->open_err; + vfs->create_err += w->create_err; +} + +/** * Sum PIDs * * Sum values for all targets. @@ -1038,63 +1110,17 @@ static void ebpf_vfs_read_global_table(netdata_idx_t *stats, int maps_per_core) */ static void ebpf_vfs_sum_pids(netdata_publish_vfs_t *vfs, struct ebpf_pid_on_target *root) { - netdata_publish_vfs_t accumulator; - memset(&accumulator, 0, sizeof(accumulator)); + memset(vfs, 0, sizeof(netdata_publish_vfs_t)); - while (root) { + for (; root; root = root->next) { int32_t pid = root->pid; - ebpf_pid_stat_t *local_pid = ebpf_get_pid_entry(pid, 0); - if (local_pid) { - netdata_publish_vfs_t *w = &local_pid->vfs; - accumulator.write_call += w->write_call; - accumulator.writev_call += w->writev_call; - accumulator.read_call += w->read_call; - accumulator.readv_call += w->readv_call; - accumulator.unlink_call += w->unlink_call; - accumulator.fsync_call += w->fsync_call; - accumulator.open_call += w->open_call; - accumulator.create_call += w->create_call; - - accumulator.write_bytes += w->write_bytes; - accumulator.writev_bytes += w->writev_bytes; - accumulator.read_bytes += w->read_bytes; - accumulator.readv_bytes += w->readv_bytes; - - accumulator.write_err += w->write_err; - accumulator.writev_err += w->writev_err; - accumulator.read_err += w->read_err; - accumulator.readv_err += w->readv_err; - accumulator.unlink_err += w->unlink_err; - accumulator.fsync_err += w->fsync_err; - accumulator.open_err += w->open_err; - accumulator.create_err += w->create_err; - } - root = root->next; - } - - // These conditions were added, because we are using incremental algorithm - vfs->write_call = (accumulator.write_call >= vfs->write_call) ? accumulator.write_call : vfs->write_call; - vfs->writev_call = (accumulator.writev_call >= vfs->writev_call) ? accumulator.writev_call : vfs->writev_call; - vfs->read_call = (accumulator.read_call >= vfs->read_call) ? accumulator.read_call : vfs->read_call; - vfs->readv_call = (accumulator.readv_call >= vfs->readv_call) ? accumulator.readv_call : vfs->readv_call; - vfs->unlink_call = (accumulator.unlink_call >= vfs->unlink_call) ? accumulator.unlink_call : vfs->unlink_call; - vfs->fsync_call = (accumulator.fsync_call >= vfs->fsync_call) ? accumulator.fsync_call : vfs->fsync_call; - vfs->open_call = (accumulator.open_call >= vfs->open_call) ? accumulator.open_call : vfs->open_call; - vfs->create_call = (accumulator.create_call >= vfs->create_call) ? accumulator.create_call : vfs->create_call; - - vfs->write_bytes = (accumulator.write_bytes >= vfs->write_bytes) ? accumulator.write_bytes : vfs->write_bytes; - vfs->writev_bytes = (accumulator.writev_bytes >= vfs->writev_bytes) ? accumulator.writev_bytes : vfs->writev_bytes; - vfs->read_bytes = (accumulator.read_bytes >= vfs->read_bytes) ? accumulator.read_bytes : vfs->read_bytes; - vfs->readv_bytes = (accumulator.readv_bytes >= vfs->readv_bytes) ? accumulator.readv_bytes : vfs->readv_bytes; + ebpf_pid_data_t *local_pid = ebpf_get_pid_data(pid, 0, NULL, EBPF_PIDS_VFS_IDX); + netdata_publish_vfs_t *w = local_pid->vfs; + if (!w) + continue; - vfs->write_err = (accumulator.write_err >= vfs->write_err) ? accumulator.write_err : vfs->write_err; - vfs->writev_err = (accumulator.writev_err >= vfs->writev_err) ? accumulator.writev_err : vfs->writev_err; - vfs->read_err = (accumulator.read_err >= vfs->read_err) ? accumulator.read_err : vfs->read_err; - vfs->readv_err = (accumulator.readv_err >= vfs->readv_err) ? accumulator.readv_err : vfs->readv_err; - vfs->unlink_err = (accumulator.unlink_err >= vfs->unlink_err) ? accumulator.unlink_err : vfs->unlink_err; - vfs->fsync_err = (accumulator.fsync_err >= vfs->fsync_err) ? accumulator.fsync_err : vfs->fsync_err; - vfs->open_err = (accumulator.open_err >= vfs->open_err) ? accumulator.open_err : vfs->open_err; - vfs->create_err = (accumulator.create_err >= vfs->create_err) ? accumulator.create_err : vfs->create_err; + vfs_aggregate_publish_vfs(vfs, w); + } } /** @@ -1183,12 +1209,13 @@ void ebpf_vfs_send_apps_data(ebpf_module_t *em, struct ebpf_target *root) * * @param out the vector with read values. */ -static void vfs_apps_accumulator(netdata_publish_vfs_t *out, int maps_per_core) +static void vfs_apps_accumulator(netdata_ebpf_vfs_t *out, int maps_per_core) { int i, end = (maps_per_core) ? ebpf_nprocs : 1; - netdata_publish_vfs_t *total = &out[0]; + netdata_ebpf_vfs_t *total = &out[0]; + uint64_t ct = total->ct; for (i = 1; i < end; i++) { - netdata_publish_vfs_t *w = &out[i]; + netdata_ebpf_vfs_t *w = &out[i]; total->write_call += w->write_call; total->writev_call += w->writev_call; @@ -1206,17 +1233,23 @@ static void vfs_apps_accumulator(netdata_publish_vfs_t *out, int maps_per_core) total->read_err += w->read_err; total->readv_err += w->readv_err; total->unlink_err += w->unlink_err; + + if (w->ct > ct) + ct = w->ct; + + if (!total->name[0] && w->name[0]) + strncpyz(total->name, w->name, sizeof(total->name) - 1); } } /** * Read the hash table and store data to allocated vectors. */ -static void ebpf_vfs_read_apps(int maps_per_core, int max_period) +static void ebpf_vfs_read_apps(int maps_per_core, uint32_t max_period) { - netdata_publish_vfs_t *vv = vfs_vector; + netdata_ebpf_vfs_t *vv = vfs_vector; int fd = vfs_maps[NETDATA_VFS_PID].map_fd; - size_t length = sizeof(netdata_publish_vfs_t); + size_t length = sizeof(netdata_ebpf_vfs_t); if (maps_per_core) length *= ebpf_nprocs; @@ -1228,17 +1261,22 @@ static void ebpf_vfs_read_apps(int maps_per_core, int max_period) vfs_apps_accumulator(vv, maps_per_core); - ebpf_pid_stat_t *local_pid = ebpf_get_pid_entry(key, vv->tgid); - if (!local_pid) - goto end_vfs_loop; + ebpf_pid_data_t *local_pid = ebpf_get_pid_data(key, vv->tgid, vv->name, EBPF_PIDS_VFS_IDX); + netdata_publish_vfs_t *publish = local_pid->vfs; + if (!publish) + local_pid->vfs = publish = ebpf_vfs_allocate_publish(); - netdata_publish_vfs_t *publish = &local_pid->vfs; if (!publish->ct || publish->ct != vv->ct) { - memcpy(publish, vv, sizeof(netdata_publish_vfs_t)); + vfs_aggregate_set_vfs(publish, vv); local_pid->not_updated = 0; } else if (++local_pid->not_updated >= max_period){ - bpf_map_delete_elem(fd, &key); - local_pid->not_updated = 0; + if (kill(key, 0)) { // No PID found + ebpf_reset_specific_pid_data(local_pid); + } else { // There is PID, but there is not data anymore + ebpf_release_pid_data(local_pid, fd, key, EBPF_PIDS_VFS_IDX); + ebpf_vfs_release_publish(publish); + local_pid->vfs = NULL; + } } end_vfs_loop: @@ -1264,12 +1302,14 @@ static void read_update_vfs_cgroup() for (pids = ect->pids; pids; pids = pids->next) { int pid = pids->pid; netdata_publish_vfs_t *out = &pids->vfs; - ebpf_pid_stat_t *local_pid = ebpf_get_pid_entry(pid, 0); - if (local_pid) { - netdata_publish_vfs_t *in = &local_pid->vfs; + memset(out, 0, sizeof(netdata_publish_vfs_t)); - memcpy(out, in, sizeof(netdata_publish_vfs_t)); - } + ebpf_pid_data_t *local_pid = ebpf_get_pid_data(pid, 0, NULL, EBPF_PIDS_VFS_IDX); + netdata_publish_vfs_t *in = local_pid->vfs; + if (!in) + continue; + + vfs_aggregate_publish_vfs(out, in); } } pthread_mutex_unlock(&mutex_cgroup_shm); @@ -1284,7 +1324,7 @@ static void read_update_vfs_cgroup() * @param pids input data */ static void ebpf_vfs_sum_cgroup_pids(netdata_publish_vfs_t *vfs, struct pid_on_target2 *pids) - { +{ netdata_publish_vfs_t accumulator; memset(&accumulator, 0, sizeof(accumulator)); @@ -1888,70 +1928,70 @@ static void ebpf_send_systemd_vfs_charts(ebpf_module_t *em) continue; } - ebpf_write_begin_chart(NETDATA_SERVICE_FAMILY, ect->name, NETDATA_SYSCALL_APPS_FILE_DELETED); + ebpf_write_begin_chart(ect->name, NETDATA_SYSCALL_APPS_FILE_DELETED, ""); write_chart_dimension("calls", ect->publish_systemd_vfs.unlink_call); ebpf_write_end_chart(); - ebpf_write_begin_chart(NETDATA_SERVICE_FAMILY, ect->name, NETDATA_SYSCALL_APPS_VFS_WRITE_CALLS); + ebpf_write_begin_chart(ect->name, NETDATA_SYSCALL_APPS_VFS_WRITE_CALLS, ""); write_chart_dimension("calls", ect->publish_systemd_vfs.write_call + ect->publish_systemd_vfs.writev_call); ebpf_write_end_chart(); if (em->mode < MODE_ENTRY) { - ebpf_write_begin_chart(NETDATA_SERVICE_FAMILY, ect->name, NETDATA_SYSCALL_APPS_VFS_WRITE_CALLS_ERROR); + ebpf_write_begin_chart(ect->name, NETDATA_SYSCALL_APPS_VFS_WRITE_CALLS_ERROR, ""); write_chart_dimension("calls", ect->publish_systemd_vfs.write_err + ect->publish_systemd_vfs.writev_err); ebpf_write_end_chart(); } - ebpf_write_begin_chart(NETDATA_SERVICE_FAMILY, ect->name, NETDATA_SYSCALL_APPS_VFS_READ_CALLS); + ebpf_write_begin_chart(ect->name, NETDATA_SYSCALL_APPS_VFS_READ_CALLS, ""); write_chart_dimension("calls", ect->publish_systemd_vfs.read_call + ect->publish_systemd_vfs.readv_call); ebpf_write_end_chart(); if (em->mode < MODE_ENTRY) { - ebpf_write_begin_chart(NETDATA_SERVICE_FAMILY, ect->name, NETDATA_SYSCALL_APPS_VFS_READ_CALLS_ERROR); + ebpf_write_begin_chart(ect->name, NETDATA_SYSCALL_APPS_VFS_READ_CALLS_ERROR, ""); write_chart_dimension("calls", ect->publish_systemd_vfs.read_err + ect->publish_systemd_vfs.readv_err); ebpf_write_end_chart(); } - ebpf_write_begin_chart(NETDATA_SERVICE_FAMILY, ect->name, NETDATA_SYSCALL_APPS_VFS_WRITE_BYTES); + ebpf_write_begin_chart(ect->name, NETDATA_SYSCALL_APPS_VFS_WRITE_BYTES, ""); write_chart_dimension("bytes", ect->publish_systemd_vfs.write_bytes + ect->publish_systemd_vfs.writev_bytes); ebpf_write_end_chart(); - ebpf_write_begin_chart(NETDATA_SERVICE_FAMILY, ect->name, NETDATA_SYSCALL_APPS_VFS_READ_BYTES); + ebpf_write_begin_chart(ect->name, NETDATA_SYSCALL_APPS_VFS_READ_BYTES, ""); write_chart_dimension("bytes", ect->publish_systemd_vfs.read_bytes + ect->publish_systemd_vfs.readv_bytes); ebpf_write_end_chart(); - ebpf_write_begin_chart(NETDATA_SERVICE_FAMILY, ect->name, NETDATA_SYSCALL_APPS_VFS_FSYNC); + ebpf_write_begin_chart(ect->name, NETDATA_SYSCALL_APPS_VFS_FSYNC, ""); write_chart_dimension("calls", ect->publish_systemd_vfs.fsync_call); ebpf_write_end_chart(); if (em->mode < MODE_ENTRY) { - ebpf_write_begin_chart(NETDATA_SERVICE_FAMILY, ect->name, NETDATA_SYSCALL_APPS_VFS_FSYNC_CALLS_ERROR); + ebpf_write_begin_chart(ect->name, NETDATA_SYSCALL_APPS_VFS_FSYNC_CALLS_ERROR, ""); write_chart_dimension("calls", ect->publish_systemd_vfs.fsync_err); ebpf_write_end_chart(); } - ebpf_write_begin_chart(NETDATA_SERVICE_FAMILY, ect->name, NETDATA_SYSCALL_APPS_VFS_OPEN); + ebpf_write_begin_chart(ect->name, NETDATA_SYSCALL_APPS_VFS_OPEN, ""); write_chart_dimension("calls", ect->publish_systemd_vfs.open_call); ebpf_write_end_chart(); if (em->mode < MODE_ENTRY) { - ebpf_write_begin_chart(NETDATA_SERVICE_FAMILY, ect->name, NETDATA_SYSCALL_APPS_VFS_OPEN_CALLS_ERROR); + ebpf_write_begin_chart(ect->name, NETDATA_SYSCALL_APPS_VFS_OPEN_CALLS_ERROR, ""); write_chart_dimension("calls", ect->publish_systemd_vfs.open_err); ebpf_write_end_chart(); } - ebpf_write_begin_chart(NETDATA_SERVICE_FAMILY, ect->name, NETDATA_SYSCALL_APPS_VFS_CREATE); + ebpf_write_begin_chart(ect->name, NETDATA_SYSCALL_APPS_VFS_CREATE, ""); write_chart_dimension("calls", ect->publish_systemd_vfs.create_call); ebpf_write_end_chart(); if (em->mode < MODE_ENTRY) { - ebpf_write_begin_chart(NETDATA_SERVICE_FAMILY, ect->name, NETDATA_SYSCALL_APPS_VFS_CREATE_CALLS_ERROR); + ebpf_write_begin_chart(ect->name, NETDATA_SYSCALL_APPS_VFS_CREATE_CALLS_ERROR, ""); write_chart_dimension("calls", ect->publish_systemd_vfs.create_err); ebpf_write_end_chart(); } @@ -2031,13 +2071,17 @@ void *ebpf_read_vfs_thread(void *ptr) int maps_per_core = em->maps_per_core; int update_every = em->update_every; + int collect_pid = (em->apps_charts || em->cgroup_charts); + if (!collect_pid) + return NULL; int counter = update_every - 1; uint32_t lifetime = em->lifetime; uint32_t running_time = 0; usec_t period = update_every * USEC_PER_SEC; - int max_period = update_every * EBPF_CLEANUP_FACTOR; + uint32_t max_period = EBPF_CLEANUP_FACTOR; + pids_fd[EBPF_PIDS_VFS_IDX] = vfs_maps[NETDATA_VFS_PID].map_fd; while (!ebpf_plugin_stop() && running_time < lifetime) { (void)heartbeat_next(&hb, period); if (ebpf_plugin_stop() || ++counter != update_every) @@ -2527,7 +2571,7 @@ void ebpf_vfs_create_apps_charts(struct ebpf_module *em, void *ptr) */ static void ebpf_vfs_allocate_global_vectors() { - vfs_vector = callocz(ebpf_nprocs, sizeof(netdata_publish_vfs_t)); + vfs_vector = callocz(ebpf_nprocs, sizeof(netdata_ebpf_vfs_t)); memset(vfs_aggregated_data, 0, sizeof(vfs_aggregated_data)); memset(vfs_publish_aggregated, 0, sizeof(vfs_publish_aggregated)); @@ -2586,6 +2630,7 @@ static int ebpf_vfs_load_bpf(ebpf_module_t *em) */ void *ebpf_vfs_thread(void *ptr) { + pids_fd[EBPF_PIDS_VFS_IDX] = -1; ebpf_module_t *em = (ebpf_module_t *)ptr; CLEANUP_FUNCTION_REGISTER(ebpf_vfs_exit) cleanup_ptr = em; @@ -2618,7 +2663,8 @@ void *ebpf_vfs_thread(void *ptr) pthread_mutex_unlock(&lock); - ebpf_read_vfs.thread = nd_thread_create(ebpf_read_vfs.name, NETDATA_THREAD_OPTION_DEFAULT, ebpf_read_vfs_thread, em); + ebpf_read_vfs.thread = nd_thread_create(ebpf_read_vfs.name, NETDATA_THREAD_OPTION_DEFAULT, + ebpf_read_vfs_thread, em); vfs_collector(em); diff --git a/src/collectors/ebpf.plugin/ebpf_vfs.h b/src/collectors/ebpf.plugin/ebpf_vfs.h index 398e28317..7458cd857 100644 --- a/src/collectors/ebpf.plugin/ebpf_vfs.h +++ b/src/collectors/ebpf.plugin/ebpf_vfs.h @@ -55,19 +55,19 @@ #define NETDATA_CGROUP_VFS_FSYNC_CONTEXT "cgroup.vfs_fsync" #define NETDATA_CGROUP_VFS_FSYNC_ERROR_CONTEXT "cgroup.vfs_fsync_error" -#define NETDATA_SYSTEMD_VFS_UNLINK_CONTEXT "systemd.services.vfs_unlink" -#define NETDATA_SYSTEMD_VFS_WRITE_CONTEXT "systemd.services.vfs_write" -#define NETDATA_SYSTEMD_VFS_WRITE_ERROR_CONTEXT "systemd.services.vfs_write_error" -#define NETDATA_SYSTEMD_VFS_READ_CONTEXT "systemd.services.vfs_read" -#define NETDATA_SYSTEMD_VFS_READ_ERROR_CONTEXT "systemd.services.vfs_read_error" -#define NETDATA_SYSTEMD_VFS_WRITE_BYTES_CONTEXT "systemd.services.vfs_write_bytes" -#define NETDATA_SYSTEMD_VFS_READ_BYTES_CONTEXT "systemd.services.vfs_read_bytes" -#define NETDATA_SYSTEMD_VFS_CREATE_CONTEXT "systemd.services.vfs_create" -#define NETDATA_SYSTEMD_VFS_CREATE_ERROR_CONTEXT "systemd.services.vfs_create_error" -#define NETDATA_SYSTEMD_VFS_OPEN_CONTEXT "systemd.services.vfs_open" -#define NETDATA_SYSTEMD_VFS_OPEN_ERROR_CONTEXT "systemd.services.vfs_open_error" -#define NETDATA_SYSTEMD_VFS_FSYNC_CONTEXT "systemd.services.vfs_fsync" -#define NETDATA_SYSTEMD_VFS_FSYNC_ERROR_CONTEXT "systemd.services.vfs_fsync_error" +#define NETDATA_SYSTEMD_VFS_UNLINK_CONTEXT "systemd.service.vfs_unlink" +#define NETDATA_SYSTEMD_VFS_WRITE_CONTEXT "systemd.service.vfs_write" +#define NETDATA_SYSTEMD_VFS_WRITE_ERROR_CONTEXT "systemd.service.vfs_write_error" +#define NETDATA_SYSTEMD_VFS_READ_CONTEXT "systemd.service.vfs_read" +#define NETDATA_SYSTEMD_VFS_READ_ERROR_CONTEXT "systemd.service.vfs_read_error" +#define NETDATA_SYSTEMD_VFS_WRITE_BYTES_CONTEXT "systemd.service.vfs_write_bytes" +#define NETDATA_SYSTEMD_VFS_READ_BYTES_CONTEXT "systemd.service.vfs_read_bytes" +#define NETDATA_SYSTEMD_VFS_CREATE_CONTEXT "systemd.service.vfs_create" +#define NETDATA_SYSTEMD_VFS_CREATE_ERROR_CONTEXT "systemd.service.vfs_create_error" +#define NETDATA_SYSTEMD_VFS_OPEN_CONTEXT "systemd.service.vfs_open" +#define NETDATA_SYSTEMD_VFS_OPEN_ERROR_CONTEXT "systemd.service.vfs_open_error" +#define NETDATA_SYSTEMD_VFS_FSYNC_CONTEXT "systemd.service.vfs_fsync" +#define NETDATA_SYSTEMD_VFS_FSYNC_ERROR_CONTEXT "systemd.service.vfs_fsync_error" // ARAL name #define NETDATA_EBPF_VFS_ARAL_NAME "ebpf_vfs" @@ -75,7 +75,38 @@ // dimension #define EBPF_COMMON_UNITS_BYTES "bytes/s" -typedef struct netdata_publish_vfs { +typedef struct __attribute__((packed)) netdata_publish_vfs { + uint64_t ct; + + //Counter + uint32_t write_call; + uint32_t writev_call; + uint32_t read_call; + uint32_t readv_call; + uint32_t unlink_call; + uint32_t fsync_call; + uint32_t open_call; + uint32_t create_call; + + //Accumulator + uint64_t write_bytes; + uint64_t writev_bytes; + uint64_t readv_bytes; + uint64_t read_bytes; + + //Counter + uint32_t write_err; + uint32_t writev_err; + uint32_t read_err; + uint32_t readv_err; + uint32_t unlink_err; + uint32_t fsync_err; + uint32_t open_err; + uint32_t create_err; + +} netdata_publish_vfs_t; + +typedef struct netdata_ebpf_vfs { uint64_t ct; uint32_t tgid; uint32_t uid; @@ -107,7 +138,7 @@ typedef struct netdata_publish_vfs { uint32_t fsync_err; uint32_t open_err; uint32_t create_err; -} netdata_publish_vfs_t; +} netdata_ebpf_vfs_t; enum netdata_publish_vfs_list { NETDATA_KEY_PUBLISH_VFS_UNLINK, diff --git a/src/collectors/ebpf.plugin/integrations/ebpf_process.md b/src/collectors/ebpf.plugin/integrations/ebpf_process.md index d6da09031..817d9169b 100644 --- a/src/collectors/ebpf.plugin/integrations/ebpf_process.md +++ b/src/collectors/ebpf.plugin/integrations/ebpf_process.md @@ -68,6 +68,7 @@ Metrics: | netdata.ebpf_aral_stat_size | memory | bytes | | netdata.ebpf_aral_stat_alloc | aral | calls | | netdata.ebpf_threads | total, running | threads | +| netdata.ebpf_pids | user, kernel | pids | | netdata.ebpf_load_methods | legacy, co-re | methods | | netdata.ebpf_kernel_memory | memory_locked | bytes | | netdata.ebpf_hash_tables_count | hash_table | hash tables | diff --git a/src/collectors/ebpf.plugin/integrations/ebpf_socket.md b/src/collectors/ebpf.plugin/integrations/ebpf_socket.md index c5b613315..917dcaba6 100644 --- a/src/collectors/ebpf.plugin/integrations/ebpf_socket.md +++ b/src/collectors/ebpf.plugin/integrations/ebpf_socket.md @@ -92,8 +92,7 @@ Metrics: |:------|:----------|:----| | app.ebpf_call_tcp_v4_connection | connections | connections/s | | app.ebpf_call_tcp_v6_connection | connections | connections/s | -| app.ebpf_sock_bytes_sent | bandwidth | kilobits/s | -| app.ebpf_sock_bytes_received | bandwidth | kilobits/s | +| app.ebpf_sock_total_bandwidth | received, sent | kilobits/s | | app.ebpf_call_tcp_sendmsg | calls | calls/s | | app.ebpf_call_tcp_cleanup_rbuf | calls | calls/s | | app.ebpf_call_tcp_retransmit | calls | calls/s | @@ -110,23 +109,22 @@ Metrics: | Metric | Dimensions | Unit | |:------|:----------|:----| -| cgroup.net_conn_ipv4 | connected_v4 | connections/s | -| cgroup.net_conn_ipv6 | connected_v6 | connections/s | -| cgroup.net_bytes_recv | received | calls/s | -| cgroup.net_bytes_sent | sent | calls/s | -| cgroup.net_tcp_recv | received | calls/s | -| cgroup.net_tcp_send | sent | calls/s | -| cgroup.net_retransmit | retransmitted | calls/s | -| cgroup.net_udp_send | sent | calls/s | -| cgroup.net_udp_recv | received | calls/s | -| services.net_conn_ipv6 | a dimension per systemd service | connections/s | -| services.net_bytes_recv | a dimension per systemd service | kilobits/s | -| services.net_bytes_sent | a dimension per systemd service | kilobits/s | -| services.net_tcp_recv | a dimension per systemd service | calls/s | -| services.net_tcp_send | a dimension per systemd service | calls/s | -| services.net_tcp_retransmit | a dimension per systemd service | calls/s | -| services.net_udp_send | a dimension per systemd service | calls/s | -| services.net_udp_recv | a dimension per systemd service | calls/s | +| cgroup.net_conn_ipv4 | connections | connections/s | +| cgroup.net_conn_ipv6 | connections | connections/s | +| cgroup.net_total_bandwidth | received, sent | kilobits/s | +| cgroup.net_tcp_recv | calls | calls/s | +| cgroup.net_tcp_send | calls | calls/s | +| cgroup.net_retransmit | calls | calls/s | +| cgroup.net_udp_send | calls | calls/s | +| cgroup.net_udp_recv | calls | calls/s | +| services.net_conn_ipv4 | connections | connections/s | +| services.net_conn_ipv6 | connections | connections/s | +| services.net_total_bandwidth | received, sent | kilobits/s | +| services.net_tcp_recv | calls | calls/s | +| services.net_tcp_send | calls | calls/s | +| services.net_tcp_retransmit | calls | calls/s | +| services.net_udp_send | calls | calls/s | +| services.net_udp_recv | calls | calls/s | diff --git a/src/collectors/ebpf.plugin/metadata.yaml b/src/collectors/ebpf.plugin/metadata.yaml index 4921e44f0..861b0ba82 100644 --- a/src/collectors/ebpf.plugin/metadata.yaml +++ b/src/collectors/ebpf.plugin/metadata.yaml @@ -1739,18 +1739,13 @@ modules: chart_type: stacked dimensions: - name: connections - - name: app.ebpf_sock_bytes_sent + - name: app.ebpf_sock_total_bandwidth description: Bytes sent unit: "kilobits/s" chart_type: stacked dimensions: - - name: bandwidth - - name: app.ebpf_sock_bytes_received - description: bytes received - unit: "kilobits/s" - chart_type: stacked - dimensions: - - name: bandwidth + - name: received + - name: sent - name: app.ebpf_call_tcp_sendmsg description: Calls for tcp_sendmsg unit: "calls/s" @@ -1790,103 +1785,99 @@ modules: unit: "connections/s" chart_type: line dimensions: - - name: connected_v4 + - name: connections - name: cgroup.net_conn_ipv6 description: Calls to tcp_v6_connection unit: "connections/s" chart_type: line dimensions: - - name: connected_v6 - - name: cgroup.net_bytes_recv + - name: connections + - name: cgroup.net_total_bandwidth description: Bytes received - unit: "calls/s" + unit: "kilobits/s" chart_type: line dimensions: - name: received - - name: cgroup.net_bytes_sent - description: Bytes sent - unit: "calls/s" - chart_type: line - dimensions: - name: sent - name: cgroup.net_tcp_recv description: Calls to tcp_cleanup_rbuf. unit: "calls/s" chart_type: line dimensions: - - name: received + - name: calls - name: cgroup.net_tcp_send description: Calls to tcp_sendmsg. unit: "calls/s" chart_type: line dimensions: - - name: sent + - name: calls - name: cgroup.net_retransmit description: Calls to tcp_retransmit. unit: "calls/s" chart_type: line dimensions: - - name: retransmitted + - name: calls - name: cgroup.net_udp_send description: Calls to udp_sendmsg unit: "calls/s" chart_type: line dimensions: - - name: sent + - name: calls - name: cgroup.net_udp_recv description: Calls to udp_recvmsg unit: "calls/s" chart_type: line dimensions: - - name: received + - name: calls + - name: services.net_conn_ipv4 + description: Calls to tcp_v4_connection + unit: "connections/s" + chart_type: stacked + dimensions: + - name: connections - name: services.net_conn_ipv6 description: Calls to tcp_v6_connection unit: "connections/s" chart_type: stacked dimensions: - - name: a dimension per systemd service - - name: services.net_bytes_recv + - name: connections + - name: services.net_total_bandwidth description: Bytes received unit: "kilobits/s" chart_type: stacked dimensions: - - name: a dimension per systemd service - - name: services.net_bytes_sent - description: Bytes sent - unit: "kilobits/s" - chart_type: stacked - dimensions: - - name: a dimension per systemd service + - name: received + - name: sent - name: services.net_tcp_recv description: Calls to tcp_cleanup_rbuf. unit: "calls/s" chart_type: stacked dimensions: - - name: a dimension per systemd service + - name: calls - name: services.net_tcp_send description: Calls to tcp_sendmsg. unit: "calls/s" chart_type: stacked dimensions: - - name: a dimension per systemd service + - name: calls - name: services.net_tcp_retransmit description: Calls to tcp_retransmit unit: "calls/s" chart_type: stacked dimensions: - - name: a dimension per systemd service + - name: calls - name: services.net_udp_send description: Calls to udp_sendmsg unit: "calls/s" chart_type: stacked dimensions: - - name: a dimension per systemd service + - name: calls - name: services.net_udp_recv description: Calls to udp_recvmsg unit: "calls/s" chart_type: stacked dimensions: - - name: a dimension per systemd service + - name: calls - meta: plugin_name: ebpf.plugin module_name: dcstat @@ -3263,6 +3254,13 @@ modules: dimensions: - name: total - name: running + - name: netdata.ebpf_pids + description: Total number of monitored PIDs + unit: "pids" + chart_type: line + dimensions: + - name: user + - name: kernel - name: netdata.ebpf_load_methods description: Load info unit: "methods" diff --git a/src/collectors/freebsd.plugin/freebsd_sysctl.c b/src/collectors/freebsd.plugin/freebsd_sysctl.c index 93ec98dc8..0fa710275 100644 --- a/src/collectors/freebsd.plugin/freebsd_sysctl.c +++ b/src/collectors/freebsd.plugin/freebsd_sysctl.c @@ -24,6 +24,10 @@ #include <netinet/udp.h> #include <netinet/udp_var.h> +#define _COMMON_PLUGIN_NAME "freebsd.plugin" +#define _COMMON_PLUGIN_MODULE_NAME "freebsd" +#include "../common-contexts/common-contexts.h" + // -------------------------------------------------------------------------------------------------------------------- // common definitions and variables @@ -574,28 +578,7 @@ int do_hw_intcnt(int update_every, usec_t dt) { static RRDSET *st_intr = NULL; static RRDDIM *rd_intr = NULL; - if (unlikely(!st_intr)) { - st_intr = rrdset_create_localhost( - "system", - "intr", - NULL, - "interrupts", - NULL, - "Total Hardware Interrupts", - "interrupts/s", - "freebsd.plugin", - "hw.intrcnt", - NETDATA_CHART_PRIO_SYSTEM_INTR, - update_every, - RRDSET_TYPE_LINE - ); - rrdset_flag_set(st_intr, RRDSET_FLAG_DETAIL); - - rd_intr = rrddim_add(st_intr, "interrupts", NULL, 1, 1, RRD_ALGORITHM_INCREMENTAL); - } - - rrddim_set_by_pointer(st_intr, rd_intr, totalintr); - rrdset_done(st_intr); + common_interrupts(totalintr, update_every, "hw.intrcnt"); size_t size; static int mib_hw_intrnames[2] = {0, 0}; @@ -1159,30 +1142,10 @@ int do_kern_ipc_sem(int update_every, usec_t dt) { } } - static RRDSET *st_semaphores = NULL, *st_semaphore_arrays = NULL; - static RRDDIM *rd_semaphores = NULL, *rd_semaphore_arrays = NULL; - - if (unlikely(!st_semaphores)) { - st_semaphores = rrdset_create_localhost( - "system", - "ipc_semaphores", - NULL, - "ipc semaphores", - NULL, - "IPC Semaphores", - "semaphores", - "freebsd.plugin", - "kern.ipc.sem", - NETDATA_CHART_PRIO_SYSTEM_IPC_SEMAPHORES, - update_every, - RRDSET_TYPE_AREA - ); - - rd_semaphores = rrddim_add(st_semaphores, "semaphores", NULL, 1, 1, RRD_ALGORITHM_ABSOLUTE); - } + static RRDSET *st_semaphore_arrays = NULL; + static RRDDIM *rd_semaphore_arrays = NULL; - rrddim_set_by_pointer(st_semaphores, rd_semaphores, ipc_sem.semaphores); - rrdset_done(st_semaphores); + common_semaphore_ipc(ipc_sem.semaphores, 0.0, "kern.ipc.sem", update_every); if (unlikely(!st_semaphore_arrays)) { st_semaphore_arrays = rrdset_create_localhost( diff --git a/src/collectors/freeipmi.plugin/freeipmi_plugin.c b/src/collectors/freeipmi.plugin/freeipmi_plugin.c index 4d942f85c..38fb1d19b 100644 --- a/src/collectors/freeipmi.plugin/freeipmi_plugin.c +++ b/src/collectors/freeipmi.plugin/freeipmi_plugin.c @@ -1120,7 +1120,7 @@ static void netdata_update_ipmi_sel_events_count(struct netdata_ipmi_state *stt, } int netdata_ipmi_collect_data(struct ipmi_monitoring_ipmi_config *ipmi_config, IPMI_COLLECTION_TYPE type, struct netdata_ipmi_state *stt) { - errno = 0; + errno_clear(); if(type & IPMI_COLLECT_TYPE_SENSORS) { stt->sensors.collected = 0; @@ -1652,6 +1652,10 @@ int main (int argc, char **argv) { bool debug = false; + // TODO: Workaround for https://github.com/netdata/netdata/issues/17931 + // This variable will be removed once the issue is fixed. + bool restart_every = true; + // ------------------------------------------------------------------------ // parse command line parameters @@ -1672,6 +1676,10 @@ int main (int argc, char **argv) { debug = true; continue; } + else if(strcmp("no-restart", argv[i]) == 0) { + restart_every = false; + continue; + } else if(strcmp("sel", argv[i]) == 0) { netdata_do_sel = true; continue; @@ -1922,7 +1930,7 @@ int main (int argc, char **argv) { collector_error("%s(): ignoring parameter '%s'", __FUNCTION__, argv[i]); } - errno = 0; + errno_clear(); if(freq_s && freq_s < update_every) collector_info("%s(): update frequency %d seconds is too small for IPMI. Using %d.", @@ -2100,7 +2108,7 @@ int main (int argc, char **argv) { "END\n"); // restart check (14400 seconds) - if (now_monotonic_sec() - started_t > IPMI_RESTART_EVERY_SECONDS) { + if (restart_every && (now_monotonic_sec() - started_t > IPMI_RESTART_EVERY_SECONDS)) { collector_info("%s(): reached my lifetime expectancy. Exiting to restart.", __FUNCTION__); fprintf(stdout, "EXIT\n"); plugin_exit(0); diff --git a/src/collectors/network-viewer.plugin/network-viewer.c b/src/collectors/network-viewer.plugin/network-viewer.c index 764151f5c..06dde7382 100644 --- a/src/collectors/network-viewer.plugin/network-viewer.c +++ b/src/collectors/network-viewer.plugin/network-viewer.c @@ -2,18 +2,30 @@ #include "collectors/all.h" #include "libnetdata/libnetdata.h" + #include "libnetdata/required_dummies.h" +static SPAWN_SERVER *spawn_srv = NULL; + #define ENABLE_DETAILED_VIEW #define LOCAL_SOCKETS_EXTENDED_MEMBERS struct { \ size_t count; \ - const char *local_address_space; \ - const char *remote_address_space; \ + struct { \ + pid_t pid; \ + uid_t uid; \ + SOCKET_DIRECTION direction; \ + int state; \ + uint64_t net_ns_inode; \ + struct socket_endpoint server; \ + const char *local_address_space; \ + const char *remote_address_space; \ + } aggregated_key; \ } network_viewer; #include "libnetdata/maps/local-sockets.h" #include "libnetdata/maps/system-users.h" +#include "libnetdata/maps/system-services.h" #define NETWORK_CONNECTIONS_VIEWER_FUNCTION "network-connections" #define NETWORK_CONNECTIONS_VIEWER_HELP "Network connections explorer" @@ -25,6 +37,7 @@ netdata_mutex_t stdout_mutex = NETDATA_MUTEX_INITIALIZER; static bool plugin_should_exit = false; static USERNAMES_CACHE *uc; +static SERVICENAMES_CACHE *sc; ENUM_STR_MAP_DEFINE(SOCKET_DIRECTION) = { { .id = SOCKET_DIRECTION_LISTEN, .name = "listen" }, @@ -57,19 +70,49 @@ ENUM_STR_MAP_DEFINE(TCP_STATE) = { }; ENUM_STR_DEFINE_FUNCTIONS(TCP_STATE, 0, "unknown"); -static void local_socket_to_json_array(BUFFER *wb, LOCAL_SOCKET *n, uint64_t proc_self_net_ns_inode, bool aggregated) { +struct sockets_stats { + BUFFER *wb; + + struct { + uint32_t tcpi_rtt; + uint32_t tcpi_rcv_rtt; + uint32_t tcpi_total_retrans; + } max; +}; + +static void local_socket_to_json_array(struct sockets_stats *st, LOCAL_SOCKET *n, uint64_t proc_self_net_ns_inode, bool aggregated) { + if(n->direction == SOCKET_DIRECTION_NONE) + return; + + BUFFER *wb = st->wb; + char local_address[INET6_ADDRSTRLEN]; char remote_address[INET6_ADDRSTRLEN]; char *protocol; if(n->local.family == AF_INET) { ipv4_address_to_txt(n->local.ip.ipv4, local_address); - ipv4_address_to_txt(n->remote.ip.ipv4, remote_address); + + if(local_sockets_is_zero_address(&n->remote)) + remote_address[0] = '\0'; + else + ipv4_address_to_txt(n->remote.ip.ipv4, remote_address); + protocol = n->local.protocol == IPPROTO_TCP ? "tcp4" : "udp4"; } + else if(is_local_socket_ipv46(n)) { + strncpyz(local_address, "*", sizeof(local_address) - 1); + remote_address[0] = '\0'; + protocol = n->local.protocol == IPPROTO_TCP ? "tcp46" : "udp46"; + } else if(n->local.family == AF_INET6) { ipv6_address_to_txt(&n->local.ip.ipv6, local_address); - ipv6_address_to_txt(&n->remote.ip.ipv6, remote_address); + + if(local_sockets_is_zero_address(&n->remote)) + remote_address[0] = '\0'; + else + ipv6_address_to_txt(&n->remote.ip.ipv6, remote_address); + protocol = n->local.protocol == IPPROTO_TCP ? "tcp6" : "udp6"; } else @@ -113,47 +156,60 @@ static void local_socket_to_json_array(BUFFER *wb, LOCAL_SOCKET *n, uint64_t pro string_freez(u); } - if(!aggregated) { - buffer_json_add_array_item_string(wb, local_address); - buffer_json_add_array_item_uint64(wb, n->local.port); - } - buffer_json_add_array_item_string(wb, n->network_viewer.local_address_space); - - if(!aggregated) { - buffer_json_add_array_item_string(wb, remote_address); - buffer_json_add_array_item_uint64(wb, n->remote.port); - } - buffer_json_add_array_item_string(wb, n->network_viewer.remote_address_space); - - uint16_t server_port = 0; - const char *server_address = NULL; - const char *client_address_space = NULL; - const char *server_address_space = NULL; + struct socket_endpoint *server_endpoint; + const char *server_address; + const char *client_address_space; + const char *server_address_space; switch (n->direction) { case SOCKET_DIRECTION_LISTEN: case SOCKET_DIRECTION_INBOUND: case SOCKET_DIRECTION_LOCAL_INBOUND: - server_port = n->local.port; server_address = local_address; - server_address_space = n->network_viewer.local_address_space; - client_address_space = n->network_viewer.remote_address_space; + server_address_space = n->network_viewer.aggregated_key.local_address_space; + client_address_space = n->network_viewer.aggregated_key.remote_address_space; + server_endpoint = &n->local; break; case SOCKET_DIRECTION_OUTBOUND: case SOCKET_DIRECTION_LOCAL_OUTBOUND: - server_port = n->remote.port; server_address = remote_address; - server_address_space = n->network_viewer.remote_address_space; - client_address_space = n->network_viewer.local_address_space; + server_address_space = n->network_viewer.aggregated_key.remote_address_space; + client_address_space = n->network_viewer.aggregated_key.local_address_space; + server_endpoint = &n->remote; break; case SOCKET_DIRECTION_NONE: + server_address = NULL; + client_address_space = NULL; + server_address_space = NULL; + server_endpoint = NULL; break; } - if(aggregated) + + if(server_endpoint) { + STRING *serv = system_servicenames_cache_lookup(sc, server_endpoint->port, server_endpoint->protocol); + buffer_json_add_array_item_string(wb, string2str(serv)); + } + else + buffer_json_add_array_item_string(wb, "[unknown]"); + + if(!aggregated) { + buffer_json_add_array_item_string(wb, local_address); + buffer_json_add_array_item_uint64(wb, n->local.port); + } + buffer_json_add_array_item_string(wb, n->network_viewer.aggregated_key.local_address_space); + + if(!aggregated) { + buffer_json_add_array_item_string(wb, remote_address); + buffer_json_add_array_item_uint64(wb, n->remote.port); + } + buffer_json_add_array_item_string(wb, n->network_viewer.aggregated_key.remote_address_space); + + if(aggregated) { buffer_json_add_array_item_string(wb, server_address); + } - buffer_json_add_array_item_uint64(wb, server_port); + buffer_json_add_array_item_uint64(wb, n->network_viewer.aggregated_key.server.port); if(aggregated) { buffer_json_add_array_item_string(wb, client_address_space); @@ -162,58 +218,176 @@ static void local_socket_to_json_array(BUFFER *wb, LOCAL_SOCKET *n, uint64_t pro // buffer_json_add_array_item_uint64(wb, n->inode); // buffer_json_add_array_item_uint64(wb, n->net_ns_inode); + + // RTT + buffer_json_add_array_item_double(wb, (double)n->info.tcp.tcpi_rtt / (double)USEC_PER_MS); + if(st->max.tcpi_rtt < n->info.tcp.tcpi_rtt) + st->max.tcpi_rtt = n->info.tcp.tcpi_rtt; + + // Receiver RTT + buffer_json_add_array_item_double(wb, (double)n->info.tcp.tcpi_rcv_rtt / (double)USEC_PER_MS); + if(st->max.tcpi_rcv_rtt < n->info.tcp.tcpi_rcv_rtt) + st->max.tcpi_rcv_rtt = n->info.tcp.tcpi_rcv_rtt; + + // Retransmissions + buffer_json_add_array_item_uint64(wb, n->info.tcp.tcpi_total_retrans); + if(st->max.tcpi_total_retrans < n->info.tcp.tcpi_total_retrans) + st->max.tcpi_total_retrans = n->info.tcp.tcpi_total_retrans; + + // count buffer_json_add_array_item_uint64(wb, n->network_viewer.count); } buffer_json_array_close(wb); } -static void local_sockets_cb_to_json(LS_STATE *ls, LOCAL_SOCKET *n, void *data) { +static void populate_aggregated_key(LOCAL_SOCKET *n) { n->network_viewer.count = 1; - n->network_viewer.local_address_space = local_sockets_address_space(&n->local); - n->network_viewer.remote_address_space = local_sockets_address_space(&n->remote); - local_socket_to_json_array(data, n, ls->proc_self_net_ns_inode, false); -} -static void local_sockets_cb_to_aggregation(LS_STATE *ls __maybe_unused, LOCAL_SOCKET *n, void *data) { - SIMPLE_HASHTABLE_AGGREGATED_SOCKETS *ht = data; - n->network_viewer.count = 1; - n->network_viewer.local_address_space = local_sockets_address_space(&n->local); - n->network_viewer.remote_address_space = local_sockets_address_space(&n->remote); + n->network_viewer.aggregated_key.pid = n->pid; + n->network_viewer.aggregated_key.uid = n->uid; + n->network_viewer.aggregated_key.direction = n->direction; + n->network_viewer.aggregated_key.net_ns_inode = n->net_ns_inode; + n->network_viewer.aggregated_key.state = n->state; switch(n->direction) { case SOCKET_DIRECTION_INBOUND: case SOCKET_DIRECTION_LOCAL_INBOUND: case SOCKET_DIRECTION_LISTEN: - memset(&n->remote.ip, 0, sizeof(n->remote.ip)); - n->remote.port = 0; + n->network_viewer.aggregated_key.server = n->local; break; case SOCKET_DIRECTION_OUTBOUND: case SOCKET_DIRECTION_LOCAL_OUTBOUND: - memset(&n->local.ip, 0, sizeof(n->local.ip)); - n->local.port = 0; + n->network_viewer.aggregated_key.server = n->remote; break; case SOCKET_DIRECTION_NONE: - return; + break; } - n->inode = 0; - n->local_ip_hash = 0; - n->remote_ip_hash = 0; - n->local_port_hash = 0; - n->timer = 0; - n->retransmits = 0; - n->expires = 0; - n->rqueue = 0; - n->wqueue = 0; - memset(&n->local_port_key, 0, sizeof(n->local_port_key)); - - XXH64_hash_t hash = XXH3_64bits(n, sizeof(*n)); + n->network_viewer.aggregated_key.local_address_space = local_sockets_address_space(&n->local); + n->network_viewer.aggregated_key.remote_address_space = local_sockets_address_space(&n->remote); +} + +static void local_sockets_cb_to_json(LS_STATE *ls, LOCAL_SOCKET *n, void *data) { + struct sockets_stats *st = data; + populate_aggregated_key(n); + local_socket_to_json_array(st, n, ls->proc_self_net_ns_inode, false); +} + +#define KEEP_THE_BIGGER(a, b) (a) = ((a) < (b)) ? (b) : (a) +#define KEEP_THE_SMALLER(a, b) (a) = ((a) > (b)) ? (b) : (a) +#define SUM_THEM_ALL(a, b) (a) += (b) +#define OR_THEM_ALL(a, b) (a) |= (b) + +static void local_sockets_cb_to_aggregation(LS_STATE *ls __maybe_unused, LOCAL_SOCKET *n, void *data) { + SIMPLE_HASHTABLE_AGGREGATED_SOCKETS *ht = data; + + populate_aggregated_key(n); + XXH64_hash_t hash = XXH3_64bits(&n->network_viewer.aggregated_key, sizeof(n->network_viewer.aggregated_key)); SIMPLE_HASHTABLE_SLOT_AGGREGATED_SOCKETS *sl = simple_hashtable_get_slot_AGGREGATED_SOCKETS(ht, hash, n, true); LOCAL_SOCKET *t = SIMPLE_HASHTABLE_SLOT_DATA(sl); if(t) { t->network_viewer.count++; + + KEEP_THE_BIGGER(t->timer, n->timer); + KEEP_THE_BIGGER(t->retransmits, n->retransmits); + KEEP_THE_SMALLER(t->expires, n->expires); + KEEP_THE_BIGGER(t->rqueue, n->rqueue); + KEEP_THE_BIGGER(t->wqueue, n->wqueue); + + // The current number of consecutive retransmissions that have occurred for the most recently transmitted segment. + SUM_THEM_ALL(t->info.tcp.tcpi_retransmits, n->info.tcp.tcpi_retransmits); + + // The total number of retransmissions that have occurred for the entire connection since it was established. + SUM_THEM_ALL(t->info.tcp.tcpi_total_retrans, n->info.tcp.tcpi_total_retrans); + + // The total number of segments that have been retransmitted since the connection was established. + SUM_THEM_ALL(t->info.tcp.tcpi_retrans, n->info.tcp.tcpi_retrans); + + // The number of keepalive probes sent + SUM_THEM_ALL(t->info.tcp.tcpi_probes, n->info.tcp.tcpi_probes); + + // The number of times the retransmission timeout has been backed off. + SUM_THEM_ALL(t->info.tcp.tcpi_backoff, n->info.tcp.tcpi_backoff); + + // A bitmask representing the TCP options currently enabled for the connection, such as SACK and Timestamps. + OR_THEM_ALL(t->info.tcp.tcpi_options, n->info.tcp.tcpi_options); + + // The send window scale value used for this connection + KEEP_THE_SMALLER(t->info.tcp.tcpi_snd_wscale, n->info.tcp.tcpi_snd_wscale); + + // The receive window scale value used for this connection + KEEP_THE_SMALLER(t->info.tcp.tcpi_rcv_wscale, n->info.tcp.tcpi_rcv_wscale); + + // Retransmission timeout in milliseconds + KEEP_THE_SMALLER(t->info.tcp.tcpi_rto, n->info.tcp.tcpi_rto); + + // The delayed acknowledgement timeout in milliseconds. + KEEP_THE_SMALLER(t->info.tcp.tcpi_ato, n->info.tcp.tcpi_ato); + + // The maximum segment size for sending. + KEEP_THE_SMALLER(t->info.tcp.tcpi_snd_mss, n->info.tcp.tcpi_snd_mss); + + // The maximum segment size for receiving. + KEEP_THE_SMALLER(t->info.tcp.tcpi_rcv_mss, n->info.tcp.tcpi_rcv_mss); + + // The number of unacknowledged segments + SUM_THEM_ALL(t->info.tcp.tcpi_unacked, n->info.tcp.tcpi_unacked); + + // The number of segments that have been selectively acknowledged + SUM_THEM_ALL(t->info.tcp.tcpi_sacked, n->info.tcp.tcpi_sacked); + + // The number of segments that have been selectively acknowledged + SUM_THEM_ALL(t->info.tcp.tcpi_sacked, n->info.tcp.tcpi_sacked); + + // The number of lost segments. + SUM_THEM_ALL(t->info.tcp.tcpi_lost, n->info.tcp.tcpi_lost); + + // The number of forward acknowledgment segments. + SUM_THEM_ALL(t->info.tcp.tcpi_fackets, n->info.tcp.tcpi_fackets); + + // The time in milliseconds since the last data was sent. + KEEP_THE_SMALLER(t->info.tcp.tcpi_last_data_sent, n->info.tcp.tcpi_last_data_sent); + + // The time in milliseconds since the last acknowledgment was sent (not tracked in Linux, hence often zero). + KEEP_THE_SMALLER(t->info.tcp.tcpi_last_ack_sent, n->info.tcp.tcpi_last_ack_sent); + + // The time in milliseconds since the last data was received. + KEEP_THE_SMALLER(t->info.tcp.tcpi_last_data_recv, n->info.tcp.tcpi_last_data_recv); + + // The time in milliseconds since the last acknowledgment was received. + KEEP_THE_SMALLER(t->info.tcp.tcpi_last_ack_recv, n->info.tcp.tcpi_last_ack_recv); + + // The path MTU for this connection + KEEP_THE_SMALLER(t->info.tcp.tcpi_pmtu, n->info.tcp.tcpi_pmtu); + + // The slow start threshold for receiving + KEEP_THE_SMALLER(t->info.tcp.tcpi_rcv_ssthresh, n->info.tcp.tcpi_rcv_ssthresh); + + // The slow start threshold for sending + KEEP_THE_SMALLER(t->info.tcp.tcpi_snd_ssthresh, n->info.tcp.tcpi_snd_ssthresh); + + // The round trip time in milliseconds + KEEP_THE_BIGGER(t->info.tcp.tcpi_rtt, n->info.tcp.tcpi_rtt); + + // The round trip time variance in milliseconds. + KEEP_THE_BIGGER(t->info.tcp.tcpi_rttvar, n->info.tcp.tcpi_rttvar); + + // The size of the sending congestion window. + KEEP_THE_SMALLER(t->info.tcp.tcpi_snd_cwnd, n->info.tcp.tcpi_snd_cwnd); + + // The maximum segment size that could be advertised. + KEEP_THE_BIGGER(t->info.tcp.tcpi_advmss, n->info.tcp.tcpi_advmss); + + // The reordering metric + KEEP_THE_SMALLER(t->info.tcp.tcpi_reordering, n->info.tcp.tcpi_reordering); + + // The receive round trip time in milliseconds. + KEEP_THE_BIGGER(t->info.tcp.tcpi_rcv_rtt, n->info.tcp.tcpi_rcv_rtt); + + // The available space in the receive buffer. + KEEP_THE_SMALLER(t->info.tcp.tcpi_rcv_space, n->info.tcp.tcpi_rcv_space); } else { t = mallocz(sizeof(*t)); @@ -240,6 +414,10 @@ void network_viewer_function(const char *transaction, char *function __maybe_unu wb->content_type = CT_APPLICATION_JSON; buffer_json_initialize(wb, "\"", "\"", 0, true, BUFFER_JSON_OPTIONS_MINIFY); + struct sockets_stats st = { + .wb = wb, + }; + buffer_json_member_add_uint64(wb, "status", HTTP_RESP_OK); buffer_json_member_add_string(wb, "type", "table"); buffer_json_member_add_time_t(wb, "update_every", 5); @@ -328,9 +506,12 @@ void network_viewer_function(const char *transaction, char *function __maybe_unu .cmdline = true, .comm = true, .namespaces = true, + .tcp_info = true, .max_errors = 10, + .max_concurrent_namespaces = 5, }, + .spawn_server = spawn_srv, .stats = { 0 }, .sockets_hashtable = { 0 }, .local_ips_hashtable = { 0 }, @@ -345,7 +526,7 @@ void network_viewer_function(const char *transaction, char *function __maybe_unu } else { ls.config.cb = local_sockets_cb_to_json; - ls.config.data = wb; + ls.config.data = &st; } local_sockets_process(&ls); @@ -366,7 +547,7 @@ void network_viewer_function(const char *transaction, char *function __maybe_unu qsort(array, added, sizeof(LOCAL_SOCKET *), local_sockets_compar); for(size_t i = 0; i < added ;i++) { - local_socket_to_json_array(wb, array[i], proc_self_net_ns_inode, true); + local_socket_to_json_array(&st, array[i], proc_self_net_ns_inode, true); string_freez(array[i]->cmdline); freez(array[i]); } @@ -451,6 +632,14 @@ void network_viewer_function(const char *transaction, char *function __maybe_unu RRDF_FIELD_OPTS_VISIBLE, NULL); + // Portname + buffer_rrdf_table_add_field(wb, field_id++, "Portname", "Server Port Name", + RRDF_FIELD_TYPE_STRING, RRDF_FIELD_VISUAL_VALUE, RRDF_FIELD_TRANSFORM_NONE, + 0, NULL, NAN, RRDF_FIELD_SORT_ASCENDING, NULL, + RRDF_FIELD_SUMMARY_COUNT, RRDF_FIELD_FILTER_MULTISELECT, + RRDF_FIELD_OPTS_VISIBLE, + NULL); + if(!aggregated) { // Local Address buffer_rrdf_table_add_field(wb, field_id++, "LocalIP", "Local IP Address", @@ -555,14 +744,40 @@ void network_viewer_function(const char *transaction, char *function __maybe_unu // RRDF_FIELD_OPTS_NONE, // NULL); + + // RTT + buffer_rrdf_table_add_field(wb, field_id++, "RTT", aggregated ? "Max Smoothed Round Trip Time" : "Smoothed Round Trip Time", + RRDF_FIELD_TYPE_DURATION, RRDF_FIELD_VISUAL_VALUE, RRDF_FIELD_TRANSFORM_NUMBER, + 2, "ms", st.max.tcpi_rtt / USEC_PER_MS, RRDF_FIELD_SORT_DESCENDING, NULL, + RRDF_FIELD_SUMMARY_MAX, RRDF_FIELD_FILTER_RANGE, + RRDF_FIELD_OPTS_VISIBLE, + NULL); + + // Asymmetry RTT + buffer_rrdf_table_add_field(wb, field_id++, "RecvRTT", aggregated ? "Max Receiver ACKs RTT" : "Receiver ACKs RTT", + RRDF_FIELD_TYPE_DURATION, RRDF_FIELD_VISUAL_VALUE, RRDF_FIELD_TRANSFORM_NUMBER, + 2, "ms", st.max.tcpi_rcv_rtt / USEC_PER_MS, RRDF_FIELD_SORT_DESCENDING, NULL, + RRDF_FIELD_SUMMARY_MAX, RRDF_FIELD_FILTER_RANGE, + RRDF_FIELD_OPTS_VISIBLE, + NULL); + + // Rentrasmissions + buffer_rrdf_table_add_field(wb, field_id++, "Retrans", "Total Retransmissions", + RRDF_FIELD_TYPE_INTEGER, RRDF_FIELD_VISUAL_VALUE, RRDF_FIELD_TRANSFORM_NONE, + 0, "packets", st.max.tcpi_total_retrans, RRDF_FIELD_SORT_DESCENDING, NULL, + RRDF_FIELD_SUMMARY_SUM, RRDF_FIELD_FILTER_RANGE, + RRDF_FIELD_OPTS_VISIBLE, + NULL); + // Count buffer_rrdf_table_add_field(wb, field_id++, "Count", "Number of sockets like this", RRDF_FIELD_TYPE_INTEGER, RRDF_FIELD_VISUAL_VALUE, RRDF_FIELD_TRANSFORM_NONE, - 0, NULL, NAN, RRDF_FIELD_SORT_DESCENDING, NULL, - RRDF_FIELD_SUMMARY_COUNT, RRDF_FIELD_FILTER_NONE, + 0, "sockets", NAN, RRDF_FIELD_SORT_DESCENDING, NULL, + RRDF_FIELD_SUMMARY_SUM, RRDF_FIELD_FILTER_NONE, aggregated ? (RRDF_FIELD_OPTS_VISIBLE | RRDF_FIELD_OPTS_STICKY) : RRDF_FIELD_OPTS_NONE, NULL); } + buffer_json_object_close(wb); // columns buffer_json_member_add_string(wb, "default_sort_column", aggregated ? "Count" : "Direction"); @@ -745,20 +960,31 @@ int main(int argc __maybe_unused, char **argv __maybe_unused) { netdata_configured_host_prefix = getenv("NETDATA_HOST_PREFIX"); if(verify_netdata_host_prefix(true) == -1) exit(1); + spawn_srv = spawn_server_create(SPAWN_SERVER_OPTION_CALLBACK, "setns", local_sockets_spawn_server_callback, argc, (const char **)argv); + if(spawn_srv == NULL) { + fprintf(stderr, "Cannot create spawn server.\n"); + exit(1); + } + uc = system_usernames_cache_init(); + sc = system_servicenames_cache_init(); // ---------------------------------------------------------------------------------------------------------------- if(argc == 2 && strcmp(argv[1], "debug") == 0) { - bool cancelled = false; - usec_t stop_monotonic_ut = now_monotonic_usec() + 600 * USEC_PER_SEC; - char buf[] = "network-connections sockets:aggregated"; - network_viewer_function("123", buf, &stop_monotonic_ut, &cancelled, - NULL, HTTP_ACCESS_ALL, NULL, NULL); - - char buf2[] = "network-connections sockets:detailed"; - network_viewer_function("123", buf2, &stop_monotonic_ut, &cancelled, - NULL, HTTP_ACCESS_ALL, NULL, NULL); +// for(int i = 0; i < 100; i++) { + bool cancelled = false; + usec_t stop_monotonic_ut = now_monotonic_usec() + 600 * USEC_PER_SEC; + char buf[] = "network-connections sockets:aggregated"; + network_viewer_function("123", buf, &stop_monotonic_ut, &cancelled, + NULL, HTTP_ACCESS_ALL, NULL, NULL); + + char buf2[] = "network-connections sockets:detailed"; + network_viewer_function("123", buf2, &stop_monotonic_ut, &cancelled, + NULL, HTTP_ACCESS_ALL, NULL, NULL); +// } + + spawn_server_destroy(spawn_srv); exit(1); } @@ -799,5 +1025,8 @@ int main(int argc __maybe_unused, char **argv __maybe_unused) { } } + spawn_server_destroy(spawn_srv); + spawn_srv = NULL; + return 0; } diff --git a/src/collectors/nfacct.plugin/plugin_nfacct.c b/src/collectors/nfacct.plugin/plugin_nfacct.c index d3d18a363..92c82351a 100644 --- a/src/collectors/nfacct.plugin/plugin_nfacct.c +++ b/src/collectors/nfacct.plugin/plugin_nfacct.c @@ -809,7 +809,7 @@ int main(int argc, char **argv) { nfacct_signals(); - errno = 0; + errno_clear(); if(freq >= netdata_update_every) netdata_update_every = freq; diff --git a/src/collectors/perf.plugin/perf_plugin.c b/src/collectors/perf.plugin/perf_plugin.c index eb24b55e1..8fb4014e4 100644 --- a/src/collectors/perf.plugin/perf_plugin.c +++ b/src/collectors/perf.plugin/perf_plugin.c @@ -1288,7 +1288,7 @@ int main(int argc, char **argv) { parse_command_line(argc, argv); - errno = 0; + errno_clear(); if(freq >= update_every) update_every = freq; diff --git a/src/collectors/plugins.d/README.md b/src/collectors/plugins.d/README.md index a1549af48..6b53dbed6 100644 --- a/src/collectors/plugins.d/README.md +++ b/src/collectors/plugins.d/README.md @@ -20,7 +20,7 @@ from external processes, thus allowing Netdata to use **external plugins**. | [charts.d.plugin](/src/collectors/charts.d.plugin/README.md) | `BASH` | all | a **plugin orchestrator** for data collection modules written in `BASH` v4+. | | [cups.plugin](/src/collectors/cups.plugin/README.md) | `C` | all | monitors **CUPS** | | [ebpf.plugin](/src/collectors/ebpf.plugin/README.md) | `C` | linux | monitors different metrics on environments using kernel internal functions. | -| [go.d.plugin](/src/go/collectors/go.d.plugin/README.md) | `GO` | all | collects metrics from the system, applications, or third-party APIs. | +| [go.d.plugin](/src/go/plugin/go.d/README.md) | `GO` | all | collects metrics from the system, applications, or third-party APIs. | | [ioping.plugin](/src/collectors/ioping.plugin/README.md) | `C` | all | measures disk latency. | | [freeipmi.plugin](/src/collectors/freeipmi.plugin/README.md) | `C` | linux | collects metrics from enterprise hardware sensors, on Linux servers. | | [nfacct.plugin](/src/collectors/nfacct.plugin/README.md) | `C` | linux | collects netfilter firewall, connection tracker and accounting metrics using `libmnl` and `libnetfilter_acct`. | diff --git a/src/collectors/plugins.d/local_listeners.c b/src/collectors/plugins.d/local_listeners.c index 2829b3e37..2a729b34d 100644 --- a/src/collectors/plugins.d/local_listeners.c +++ b/src/collectors/plugins.d/local_listeners.c @@ -15,6 +15,14 @@ static const char *protocol_name(LOCAL_SOCKET *n) { else return "UNKNOWN_IPV4"; } + else if(is_local_socket_ipv46(n)) { + if (n->local.protocol == IPPROTO_TCP) + return "TCP46"; + else if(n->local.protocol == IPPROTO_UDP) + return "UDP46"; + else + return "UNKNOWN_IPV46"; + } else if(n->local.family == AF_INET6) { if (n->local.protocol == IPPROTO_TCP) return "TCP6"; @@ -35,6 +43,10 @@ static void print_local_listeners(LS_STATE *ls __maybe_unused, LOCAL_SOCKET *n, ipv4_address_to_txt(n->local.ip.ipv4, local_address); ipv4_address_to_txt(n->remote.ip.ipv4, remote_address); } + else if(is_local_socket_ipv46(n)) { + strncpyz(local_address, "*", sizeof(local_address) - 1); + remote_address[0] = '\0'; + } else if(n->local.family == AF_INET6) { ipv6_address_to_txt(&n->local.ip.ipv6, local_address); ipv6_address_to_txt(&n->remote.ip.ipv6, remote_address); @@ -93,8 +105,10 @@ int main(int argc, char **argv) { .cmdline = true, .comm = false, .namespaces = true, + .tcp_info = false, .max_errors = 10, + .max_concurrent_namespaces = 10, .cb = print_local_listeners, .data = NULL, @@ -212,6 +226,7 @@ int main(int argc, char **argv) { ls.config.comm = true; ls.config.cmdline = true; ls.config.namespaces = true; + ls.config.tcp_info = true; ls.config.uid = true; ls.config.max_errors = SIZE_MAX; ls.config.cb = print_local_listeners_debug; @@ -276,8 +291,17 @@ int main(int argc, char **argv) { } } + SPAWN_SERVER *spawn_server = spawn_server_create(SPAWN_SERVER_OPTION_CALLBACK, NULL, local_sockets_spawn_server_callback, argc, (const char **)argv); + if(spawn_server == NULL) { + fprintf(stderr, "Cannot create spawn server.\n"); + exit(1); + } + ls.spawn_server = spawn_server; + local_sockets_process(&ls); + spawn_server_destroy(spawn_server); + getrusage(RUSAGE_SELF, &ended); if(debug) { @@ -285,7 +309,7 @@ int main(int argc, char **argv) { unsigned long long system = ended.ru_stime.tv_sec * 1000000ULL + ended.ru_stime.tv_usec - started.ru_stime.tv_sec * 1000000ULL + started.ru_stime.tv_usec; unsigned long long total = user + system; - fprintf(stderr, "CPU Usage %llu user, %llu system, %llu total\n", user, system, total); + fprintf(stderr, "CPU Usage %llu user, %llu system, %llu total, %zu namespaces, %zu nl requests (without namespaces)\n", user, system, total, ls.stats.namespaces_found, ls.stats.mnl_sends); } return 0; diff --git a/src/collectors/plugins.d/ndsudo.c b/src/collectors/plugins.d/ndsudo.c index d53ca9f28..d2cf4fae1 100644 --- a/src/collectors/plugins.d/ndsudo.c +++ b/src/collectors/plugins.d/ndsudo.c @@ -14,6 +14,31 @@ struct command { const char *search[MAX_SEARCH]; } allowed_commands[] = { { + .name = "exim-bpc", + .params = "-bpc", + .search = + { + [0] = "exim", + [1] = NULL, + }, + }, + { + .name = "nsd-control-stats", + .params = "stats_noreset", + .search = { + [0] = "nsd-control", + [1] = NULL, + }, + }, + { + .name = "chronyc-serverstats", + .params = "serverstats", + .search = { + [0] = "chronyc", + [1] = NULL, + }, + }, + { .name = "dmsetup-status-cache", .params = "status --target cache --noflush", .search = { @@ -38,6 +63,14 @@ struct command { }, }, { + .name = "smartctl-json-scan-open", + .params = "--json --scan-open", + .search = { + [0] = "smartctl", + [1] = NULL, + }, + }, + { .name = "smartctl-json-device-info", .params = "--json --all {{deviceName}} --device {{deviceType}} --nocheck {{powerMode}}", .search = { @@ -54,6 +87,14 @@ struct command { }, }, { + .name = "fail2ban-client-status-socket", + .params = "-s {{socket_path}} status", + .search = { + [0] = "fail2ban-client", + [1] = NULL, + }, + }, + { .name = "fail2ban-client-status-jail", .params = "status {{jail}}", .search = { @@ -62,6 +103,14 @@ struct command { }, }, { + .name = "fail2ban-client-status-jail-socket", + .params = "-s {{socket_path}} status {{jail}}", + .search = { + [0] = "fail2ban-client", + [1] = NULL, + }, + }, + { .name = "storcli-controllers-info", .params = "/cALL show all J nolog", .search = { diff --git a/src/collectors/plugins.d/plugins_d.c b/src/collectors/plugins.d/plugins_d.c index f5f55b770..85f1563c3 100644 --- a/src/collectors/plugins.d/plugins_d.c +++ b/src/collectors/plugins.d/plugins_d.c @@ -68,23 +68,15 @@ static void pluginsd_worker_thread_cleanup(void *pptr) { cd->unsafe.running = false; cd->unsafe.thread = 0; - pid_t pid = cd->unsafe.pid; cd->unsafe.pid = 0; - spinlock_unlock(&cd->unsafe.spinlock); - - if (pid) { - siginfo_t info; - netdata_log_info("PLUGINSD: 'host:%s', killing data collection child process with pid %d", - rrdhost_hostname(cd->host), pid); + POPEN_INSTANCE *pi = cd->unsafe.pi; + cd->unsafe.pi = NULL; - if (killpid(pid) != -1) { - netdata_log_info("PLUGINSD: 'host:%s', waiting for data collection child process pid %d to exit...", - rrdhost_hostname(cd->host), pid); + spinlock_unlock(&cd->unsafe.spinlock); - netdata_waitid(P_PID, (id_t)pid, &info, WEXITED); - } - } + if (pi) + spawn_popen_kill(pi); } #define SERIAL_FAILURES_THRESHOLD 10 @@ -160,14 +152,13 @@ static void *pluginsd_worker_thread(void *arg) { size_t count = 0; while(service_running(SERVICE_COLLECTORS)) { - FILE *fp_child_input = NULL; - FILE *fp_child_output = netdata_popen(cd->cmd, &cd->unsafe.pid, &fp_child_input); - - if(unlikely(!fp_child_input || !fp_child_output)) { + cd->unsafe.pi = spawn_popen_run(cd->cmd); + if(!cd->unsafe.pi) { netdata_log_error("PLUGINSD: 'host:%s', cannot popen(\"%s\", \"r\").", rrdhost_hostname(cd->host), cd->cmd); break; } + cd->unsafe.pid = spawn_server_instance_pid(cd->unsafe.pi->si); nd_log(NDLS_DAEMON, NDLP_DEBUG, "PLUGINSD: 'host:%s' connected to '%s' running on pid %d", @@ -190,15 +181,14 @@ static void *pluginsd_worker_thread(void *arg) { }; ND_LOG_STACK_PUSH(lgs); - count = pluginsd_process(cd->host, cd, fp_child_input, fp_child_output, 0); + count = pluginsd_process(cd->host, cd, cd->unsafe.pi->child_stdin_fp, cd->unsafe.pi->child_stdout_fp, 0); nd_log(NDLS_DAEMON, NDLP_DEBUG, "PLUGINSD: 'host:%s', '%s' (pid %d) disconnected after %zu successful data collections (ENDs).", rrdhost_hostname(cd->host), cd->fullfilename, cd->unsafe.pid, count); - killpid(cd->unsafe.pid); - - int worker_ret_code = netdata_pclose(fp_child_input, fp_child_output, cd->unsafe.pid); + int worker_ret_code = spawn_popen_kill(cd->unsafe.pi); + cd->unsafe.pi = NULL; if(likely(worker_ret_code == 0)) pluginsd_worker_thread_handle_success(cd); @@ -248,13 +238,6 @@ void *pluginsd_main(void *ptr) { // disable some plugins by default config_get_boolean(CONFIG_SECTION_PLUGINS, "slabinfo", CONFIG_BOOLEAN_NO); - config_get_boolean(CONFIG_SECTION_PLUGINS, "logs-management", -#if defined(LOGS_MANAGEMENT_DEV_MODE) - CONFIG_BOOLEAN_YES -#else - CONFIG_BOOLEAN_NO -#endif - ); // it crashes (both threads) on Alpine after we made it multi-threaded // works with "--device /dev/ipmi0", but this is not default // see https://github.com/netdata/netdata/pull/15564 for details @@ -273,7 +256,7 @@ void *pluginsd_main(void *ptr) { if (unlikely(!service_running(SERVICE_COLLECTORS))) break; - errno = 0; + errno_clear(); DIR *dir = opendir(directory_name); if (unlikely(!dir)) { if (directory_errors[idx] != errno) { diff --git a/src/collectors/plugins.d/plugins_d.h b/src/collectors/plugins.d/plugins_d.h index ec17c3145..51efa5a72 100644 --- a/src/collectors/plugins.d/plugins_d.h +++ b/src/collectors/plugins.d/plugins_d.h @@ -34,6 +34,7 @@ struct plugind { bool running; // do not touch this structure after setting this to 1 bool enabled; // if this is enabled or not ND_THREAD *thread; + POPEN_INSTANCE *pi; pid_t pid; } unsafe; diff --git a/src/collectors/plugins.d/pluginsd_internals.c b/src/collectors/plugins.d/pluginsd_internals.c index d03daf745..31f0f7539 100644 --- a/src/collectors/plugins.d/pluginsd_internals.c +++ b/src/collectors/plugins.d/pluginsd_internals.c @@ -13,7 +13,7 @@ ssize_t send_to_plugin(const char *txt, void *data) { return h2o_stream_write(parser->h2o_ctx, txt, strlen(txt)); #endif - errno = 0; + errno_clear(); spinlock_lock(&parser->writer.spinlock); ssize_t bytes = -1; diff --git a/src/collectors/proc.plugin/integrations/zfs_pools.md b/src/collectors/proc.plugin/integrations/zfs_pools.md deleted file mode 100644 index f18c82baf..000000000 --- a/src/collectors/proc.plugin/integrations/zfs_pools.md +++ /dev/null @@ -1,105 +0,0 @@ -<!--startmeta -custom_edit_url: "https://github.com/netdata/netdata/edit/master/src/collectors/proc.plugin/integrations/zfs_pools.md" -meta_yaml: "https://github.com/netdata/netdata/edit/master/src/collectors/proc.plugin/metadata.yaml" -sidebar_label: "ZFS Pools" -learn_status: "Published" -learn_rel_path: "Collecting Metrics/Linux Systems/Filesystem/ZFS" -most_popular: False -message: "DO NOT EDIT THIS FILE DIRECTLY, IT IS GENERATED BY THE COLLECTOR'S metadata.yaml FILE" -endmeta--> - -# ZFS Pools - - -<img src="https://netdata.cloud/img/filesystem.svg" width="150"/> - - -Plugin: proc.plugin -Module: /proc/spl/kstat/zfs - -<img src="https://img.shields.io/badge/maintained%20by-Netdata-%2300ab44" /> - -## Overview - -This integration provides metrics about the state of ZFS pools. - - - -This collector is supported on all platforms. - -This collector supports collecting metrics from multiple instances of this integration, including remote instances. - - -### Default Behavior - -#### Auto-Detection - -This integration doesn't support auto-detection. - -#### Limits - -The default configuration for this integration does not impose any limits on data collection. - -#### Performance Impact - -The default configuration for this integration is not expected to impose a significant performance impact on the system. - - -## Metrics - -Metrics grouped by *scope*. - -The scope defines the instance that the metric belongs to. An instance is uniquely identified by a set of labels. - - - -### Per zfs pool - - - -Labels: - -| Label | Description | -|:-----------|:----------------| -| pool | TBD | - -Metrics: - -| Metric | Dimensions | Unit | -|:------|:----------|:----| -| zfspool.state | online, degraded, faulted, offline, removed, unavail, suspended | boolean | - - - -## Alerts - - -The following alerts are available: - -| Alert name | On metric | Description | -|:------------|:----------|:------------| -| [ zfs_pool_state_warn ](https://github.com/netdata/netdata/blob/master/src/health/health.d/zfs.conf) | zfspool.state | ZFS pool ${label:pool} state is degraded | -| [ zfs_pool_state_crit ](https://github.com/netdata/netdata/blob/master/src/health/health.d/zfs.conf) | zfspool.state | ZFS pool ${label:pool} state is faulted or unavail | - - -## Setup - -### Prerequisites - -No action required. - -### Configuration - -#### File - -There is no configuration file. -#### Options - - - -There are no configuration options. - -#### Examples -There are no configuration examples. - - diff --git a/src/collectors/proc.plugin/ipc.c b/src/collectors/proc.plugin/ipc.c index 6d7d920f0..5b47116b9 100644 --- a/src/collectors/proc.plugin/ipc.c +++ b/src/collectors/proc.plugin/ipc.c @@ -6,6 +6,9 @@ #include <sys/msg.h> #include <sys/shm.h> +#define _COMMON_PLUGIN_NAME PLUGIN_PROC_NAME +#define _COMMON_PLUGIN_MODULE_NAME "ipc" +#include "../common-contexts/common-contexts.h" #ifndef SEMVMX #define SEMVMX 32767 /* <= 32767 semaphore maximum value */ @@ -282,8 +285,8 @@ int do_ipc(int update_every, usec_t dt) { static struct ipc_limits limits; static struct ipc_status status; static const RRDVAR_ACQUIRED *arrays_max = NULL, *semaphores_max = NULL; - static RRDSET *st_semaphores = NULL, *st_arrays = NULL; - static RRDDIM *rd_semaphores = NULL, *rd_arrays = NULL; + static RRDSET *st_arrays = NULL; + static RRDDIM *rd_arrays = NULL; static char *msg_filename = NULL; static struct message_queue *message_queue_root = NULL; static long long dimensions_limit; @@ -314,25 +317,7 @@ int do_ipc(int update_every, usec_t dt) { do_sem = CONFIG_BOOLEAN_NO; } else { - // create the charts - if(unlikely(!st_semaphores)) { - st_semaphores = rrdset_create_localhost( - "system" - , "ipc_semaphores" - , NULL - , "ipc semaphores" - , NULL - , "IPC Semaphores" - , "semaphores" - , PLUGIN_PROC_NAME - , "ipc" - , NETDATA_CHART_PRIO_SYSTEM_IPC_SEMAPHORES - , localhost->rrd_update_every - , RRDSET_TYPE_AREA - ); - rd_semaphores = rrddim_add(st_semaphores, "semaphores", NULL, 1, 1, RRD_ALGORITHM_ABSOLUTE); - } - + // create the chart if(unlikely(!st_arrays)) { st_arrays = rrdset_create_localhost( "system" @@ -379,7 +364,6 @@ int do_ipc(int update_every, usec_t dt) { rrdvar_host_variable_set(localhost, arrays_max, limits.semmni); st_arrays->red = limits.semmni; - st_semaphores->red = limits.semmns; read_limits_next = 60 / update_every; } @@ -392,8 +376,7 @@ int do_ipc(int update_every, usec_t dt) { return 0; } - rrddim_set_by_pointer(st_semaphores, rd_semaphores, status.semaem); - rrdset_done(st_semaphores); + common_semaphore_ipc(status.semaem, limits.semmns, "ipc", localhost->rrd_update_every); rrddim_set_by_pointer(st_arrays, rd_arrays, status.semusz); rrdset_done(st_arrays); diff --git a/src/collectors/proc.plugin/metadata.yaml b/src/collectors/proc.plugin/metadata.yaml index fd834dd38..6d9e00d32 100644 --- a/src/collectors/proc.plugin/metadata.yaml +++ b/src/collectors/proc.plugin/metadata.yaml @@ -4497,98 +4497,6 @@ modules: - name: retransmits - meta: plugin_name: proc.plugin - module_name: /proc/spl/kstat/zfs - monitored_instance: - name: ZFS Pools - link: "" - categories: - - data-collection.linux-systems.filesystem-metrics.zfs - icon_filename: "filesystem.svg" - related_resources: - integrations: - list: [] - info_provided_to_referring_integrations: - description: "" - keywords: - - zfs pools - - pools - - zfs - - filesystem - most_popular: false - overview: - data_collection: - metrics_description: "This integration provides metrics about the state of ZFS pools." - method_description: "" - supported_platforms: - include: [] - exclude: [] - multi_instance: true - additional_permissions: - description: "" - default_behavior: - auto_detection: - description: "" - limits: - description: "" - performance_impact: - description: "" - setup: - prerequisites: - list: [] - configuration: - file: - name: "" - description: "" - options: - description: "" - folding: - title: "" - enabled: true - list: [] - examples: - folding: - enabled: true - title: "" - list: [] - troubleshooting: - problems: - list: [] - alerts: - - name: zfs_pool_state_warn - link: https://github.com/netdata/netdata/blob/master/src/health/health.d/zfs.conf - metric: zfspool.state - info: ZFS pool ${label:pool} state is degraded - - name: zfs_pool_state_crit - link: https://github.com/netdata/netdata/blob/master/src/health/health.d/zfs.conf - metric: zfspool.state - info: ZFS pool ${label:pool} state is faulted or unavail - metrics: - folding: - title: Metrics - enabled: false - description: "" - availability: [] - scopes: - - name: zfs pool - description: "" - labels: - - name: pool - description: TBD - metrics: - - name: zfspool.state - description: ZFS pool state - unit: "boolean" - chart_type: line - dimensions: - - name: online - - name: degraded - - name: faulted - - name: offline - - name: removed - - name: unavail - - name: suspended - - meta: - plugin_name: proc.plugin module_name: /proc/spl/kstat/zfs/arcstats monitored_instance: name: ZFS Adaptive Replacement Cache diff --git a/src/collectors/proc.plugin/plugin_proc.c b/src/collectors/proc.plugin/plugin_proc.c index 095cd7389..b4a856467 100644 --- a/src/collectors/proc.plugin/plugin_proc.c +++ b/src/collectors/proc.plugin/plugin_proc.c @@ -62,7 +62,6 @@ static struct proc_module { // ZFS metrics {.name = "/proc/spl/kstat/zfs/arcstats", .dim = "zfs_arcstats", .func = do_proc_spl_kstat_zfs_arcstats}, - {.name = "/proc/spl/kstat/zfs/pool/state",.dim = "zfs_pool_state",.func = do_proc_spl_kstat_zfs_pool_state}, // BTRFS metrics {.name = "/sys/fs/btrfs", .dim = "btrfs", .func = do_sys_fs_btrfs}, diff --git a/src/collectors/proc.plugin/plugin_proc.h b/src/collectors/proc.plugin/plugin_proc.h index a5f7ce6ec..bb1ddf48c 100644 --- a/src/collectors/proc.plugin/plugin_proc.h +++ b/src/collectors/proc.plugin/plugin_proc.h @@ -37,7 +37,6 @@ int do_proc_sys_devices_system_edac_mc(int update_every, usec_t dt); int do_proc_sys_devices_pci_aer(int update_every, usec_t dt); int do_proc_sys_devices_system_node(int update_every, usec_t dt); int do_proc_spl_kstat_zfs_arcstats(int update_every, usec_t dt); -int do_proc_spl_kstat_zfs_pool_state(int update_every, usec_t dt); int do_sys_fs_btrfs(int update_every, usec_t dt); int do_proc_net_sockstat(int update_every, usec_t dt); int do_proc_net_sockstat6(int update_every, usec_t dt); diff --git a/src/collectors/proc.plugin/proc_meminfo.c b/src/collectors/proc.plugin/proc_meminfo.c index c11b4f642..db458b239 100644 --- a/src/collectors/proc.plugin/proc_meminfo.c +++ b/src/collectors/proc.plugin/proc_meminfo.c @@ -29,7 +29,7 @@ int do_proc_meminfo(int update_every, usec_t dt) { static ARL_BASE *arl_base = NULL; static ARL_ENTRY *arl_hwcorrupted = NULL, *arl_memavailable = NULL, *arl_hugepages_total = NULL, - *arl_zswapped = NULL, *arl_high_low = NULL, *arl_cma_total = NULL, + *arl_zswapped = NULL, *arl_high_low = NULL, *arl_directmap4k = NULL, *arl_directmap2m = NULL, *arl_directmap4m = NULL, *arl_directmap1g = NULL; static unsigned long long @@ -189,7 +189,7 @@ int do_proc_meminfo(int update_every, usec_t dt) { arl_expect(arl_base, "FilePmdMapped", &FilePmdMapped); // CONFIG_CMA - arl_cma_total = arl_expect(arl_base, "CmaTotal", &CmaTotal); + arl_expect(arl_base, "CmaTotal", &CmaTotal); arl_expect(arl_base, "CmaFree", &CmaFree); // CONFIG_UNACCEPTED_MEMORY diff --git a/src/collectors/proc.plugin/proc_spl_kstat_zfs.c b/src/collectors/proc.plugin/proc_spl_kstat_zfs.c index 53cc299b8..be96f4449 100644 --- a/src/collectors/proc.plugin/proc_spl_kstat_zfs.c +++ b/src/collectors/proc.plugin/proc_spl_kstat_zfs.c @@ -200,230 +200,3 @@ int do_proc_spl_kstat_zfs_arcstats(int update_every, usec_t dt) { return 0; } - -struct zfs_pool { - RRDSET *st; - - RRDDIM *rd_online; - RRDDIM *rd_degraded; - RRDDIM *rd_faulted; - RRDDIM *rd_offline; - RRDDIM *rd_removed; - RRDDIM *rd_unavail; - RRDDIM *rd_suspended; - - int updated; - int disabled; - - int online; - int degraded; - int faulted; - int offline; - int removed; - int unavail; - int suspended; -}; - -struct deleted_zfs_pool { - char *name; - struct deleted_zfs_pool *next; -} *deleted_zfs_pools = NULL; - -DICTIONARY *zfs_pools = NULL; - -void disable_zfs_pool_state(struct zfs_pool *pool) -{ - if (pool->st) - rrdset_is_obsolete___safe_from_collector_thread(pool->st); - - pool->st = NULL; - - pool->rd_online = NULL; - pool->rd_degraded = NULL; - pool->rd_faulted = NULL; - pool->rd_offline = NULL; - pool->rd_removed = NULL; - pool->rd_unavail = NULL; - pool->rd_suspended = NULL; - - pool->disabled = 1; -} - -int update_zfs_pool_state_chart(const DICTIONARY_ITEM *item, void *pool_p, void *update_every_p) { - const char *name = dictionary_acquired_item_name(item); - struct zfs_pool *pool = (struct zfs_pool *)pool_p; - int update_every = *(int *)update_every_p; - - if (pool->updated) { - pool->updated = 0; - - if (!pool->disabled) { - if (unlikely(!pool->st)) { - char chart_id[MAX_CHART_ID + 1]; - snprintf(chart_id, MAX_CHART_ID, "state_%s", name); - - pool->st = rrdset_create_localhost( - "zfspool", - chart_id, - NULL, - "state", - "zfspool.state", - "ZFS pool state", - "boolean", - PLUGIN_PROC_NAME, - ZFS_PROC_POOLS, - NETDATA_CHART_PRIO_ZFS_POOL_STATE, - update_every, - RRDSET_TYPE_LINE); - - pool->rd_online = rrddim_add(pool->st, "online", NULL, 1, 1, RRD_ALGORITHM_ABSOLUTE); - pool->rd_degraded = rrddim_add(pool->st, "degraded", NULL, 1, 1, RRD_ALGORITHM_ABSOLUTE); - pool->rd_faulted = rrddim_add(pool->st, "faulted", NULL, 1, 1, RRD_ALGORITHM_ABSOLUTE); - pool->rd_offline = rrddim_add(pool->st, "offline", NULL, 1, 1, RRD_ALGORITHM_ABSOLUTE); - pool->rd_removed = rrddim_add(pool->st, "removed", NULL, 1, 1, RRD_ALGORITHM_ABSOLUTE); - pool->rd_unavail = rrddim_add(pool->st, "unavail", NULL, 1, 1, RRD_ALGORITHM_ABSOLUTE); - pool->rd_suspended = rrddim_add(pool->st, "suspended", NULL, 1, 1, RRD_ALGORITHM_ABSOLUTE); - - rrdlabels_add(pool->st->rrdlabels, "pool", name, RRDLABEL_SRC_AUTO); - } - - rrddim_set_by_pointer(pool->st, pool->rd_online, pool->online); - rrddim_set_by_pointer(pool->st, pool->rd_degraded, pool->degraded); - rrddim_set_by_pointer(pool->st, pool->rd_faulted, pool->faulted); - rrddim_set_by_pointer(pool->st, pool->rd_offline, pool->offline); - rrddim_set_by_pointer(pool->st, pool->rd_removed, pool->removed); - rrddim_set_by_pointer(pool->st, pool->rd_unavail, pool->unavail); - rrddim_set_by_pointer(pool->st, pool->rd_suspended, pool->suspended); - rrdset_done(pool->st); - } - } else { - disable_zfs_pool_state(pool); - struct deleted_zfs_pool *new = callocz(1, sizeof(struct deleted_zfs_pool)); - new->name = strdupz(name); - new->next = deleted_zfs_pools; - deleted_zfs_pools = new; - } - - return 0; -} - -int do_proc_spl_kstat_zfs_pool_state(int update_every, usec_t dt) -{ - (void)dt; - - static int do_zfs_pool_state = -1; - static char *dirname = NULL; - - int pool_found = 0, state_file_found = 0; - - if (unlikely(do_zfs_pool_state == -1)) { - char filename[FILENAME_MAX + 1]; - snprintfz(filename, FILENAME_MAX, "%s%s", netdata_configured_host_prefix, "/proc/spl/kstat/zfs"); - dirname = config_get("plugin:proc:" ZFS_PROC_POOLS, "directory to monitor", filename); - - zfs_pools = dictionary_create_advanced(DICT_OPTION_SINGLE_THREADED, &dictionary_stats_category_collectors, 0); - - do_zfs_pool_state = 1; - } - - if (likely(do_zfs_pool_state)) { - DIR *dir = opendir(dirname); - if (unlikely(!dir)) { - if (errno == ENOENT) - collector_info("Cannot read directory '%s'", dirname); - else - collector_error("Cannot read directory '%s'", dirname); - return 1; - } - - struct dirent *de = NULL; - while (likely(de = readdir(dir))) { - if (likely( - de->d_type == DT_DIR && ((de->d_name[0] == '.' && de->d_name[1] == '\0') || - (de->d_name[0] == '.' && de->d_name[1] == '.' && de->d_name[2] == '\0')))) - continue; - - if (unlikely(de->d_type == DT_LNK || de->d_type == DT_DIR)) { - pool_found = 1; - - struct zfs_pool *pool = dictionary_get(zfs_pools, de->d_name); - - if (unlikely(!pool)) { - struct zfs_pool new_zfs_pool = {}; - pool = dictionary_set(zfs_pools, de->d_name, &new_zfs_pool, sizeof(struct zfs_pool)); - } - - pool->updated = 1; - - if (pool->disabled) { - state_file_found = 1; - continue; - } - - pool->online = 0; - pool->degraded = 0; - pool->faulted = 0; - pool->offline = 0; - pool->removed = 0; - pool->unavail = 0; - pool->suspended = 0; - - char filename[FILENAME_MAX + 1]; - snprintfz(filename, FILENAME_MAX, "%s/%s/state", dirname, de->d_name); - - char state[STATE_SIZE + 1]; - int ret = read_txt_file(filename, state, sizeof(state)); - - if (!ret) { - state_file_found = 1; - - // ZFS pool states are described at https://openzfs.github.io/openzfs-docs/man/8/zpoolconcepts.8.html?#Device_Failure_and_Recovery - if (!strcmp(state, "ONLINE\n")) { - pool->online = 1; - } else if (!strcmp(state, "DEGRADED\n")) { - pool->degraded = 1; - } else if (!strcmp(state, "FAULTED\n")) { - pool->faulted = 1; - } else if (!strcmp(state, "OFFLINE\n")) { - pool->offline = 1; - } else if (!strcmp(state, "REMOVED\n")) { - pool->removed = 1; - } else if (!strcmp(state, "UNAVAIL\n")) { - pool->unavail = 1; - } else if (!strcmp(state, "SUSPENDED\n")) { - pool->suspended = 1; - } else { - disable_zfs_pool_state(pool); - - char *c = strchr(state, '\n'); - if (c) - *c = '\0'; - collector_error("ZFS POOLS: Undefined state %s for zpool %s, disabling the chart", state, de->d_name); - } - } - } - } - - closedir(dir); - } - - if (do_zfs_pool_state && pool_found && !state_file_found) { - collector_info("ZFS POOLS: State files not found. Disabling the module."); - do_zfs_pool_state = 0; - } - - if (do_zfs_pool_state) - dictionary_walkthrough_read(zfs_pools, update_zfs_pool_state_chart, &update_every); - - while (deleted_zfs_pools) { - struct deleted_zfs_pool *current_pool = deleted_zfs_pools; - dictionary_del(zfs_pools, current_pool->name); - - deleted_zfs_pools = deleted_zfs_pools->next; - - freez(current_pool->name); - freez(current_pool); - } - - return 0; -} diff --git a/src/collectors/proc.plugin/proc_stat.c b/src/collectors/proc.plugin/proc_stat.c index 838d00b8e..c211ceee5 100644 --- a/src/collectors/proc.plugin/proc_stat.c +++ b/src/collectors/proc.plugin/proc_stat.c @@ -752,33 +752,8 @@ int do_proc_stat(int update_every, usec_t dt) { } else if(unlikely(hash == hash_intr && strcmp(row_key, "intr") == 0)) { if(likely(do_interrupts)) { - static RRDSET *st_intr = NULL; - static RRDDIM *rd_interrupts = NULL; unsigned long long value = str2ull(procfile_lineword(ff, l, 1), NULL); - - if(unlikely(!st_intr)) { - st_intr = rrdset_create_localhost( - "system" - , "intr" - , NULL - , "interrupts" - , NULL - , "CPU Interrupts" - , "interrupts/s" - , PLUGIN_PROC_NAME - , PLUGIN_PROC_MODULE_STAT_NAME - , NETDATA_CHART_PRIO_SYSTEM_INTR - , update_every - , RRDSET_TYPE_LINE - ); - - rrdset_flag_set(st_intr, RRDSET_FLAG_DETAIL); - - rd_interrupts = rrddim_add(st_intr, "interrupts", NULL, 1, 1, RRD_ALGORITHM_INCREMENTAL); - } - - rrddim_set_by_pointer(st_intr, rd_interrupts, value); - rrdset_done(st_intr); + common_interrupts(value, update_every, NULL); } } else if(unlikely(hash == hash_ctxt && strcmp(row_key, "ctxt") == 0)) { diff --git a/src/collectors/python.d.plugin/alarms/README.md b/src/collectors/python.d.plugin/alarms/README.md deleted file mode 120000 index 85759ae6c..000000000 --- a/src/collectors/python.d.plugin/alarms/README.md +++ /dev/null @@ -1 +0,0 @@ -integrations/netdata_agent_alarms.md
\ No newline at end of file diff --git a/src/collectors/python.d.plugin/alarms/alarms.chart.py b/src/collectors/python.d.plugin/alarms/alarms.chart.py deleted file mode 100644 index d19427358..000000000 --- a/src/collectors/python.d.plugin/alarms/alarms.chart.py +++ /dev/null @@ -1,95 +0,0 @@ -# -*- coding: utf-8 -*- -# Description: alarms netdata python.d module -# Author: andrewm4894 -# SPDX-License-Identifier: GPL-3.0-or-later - -from json import loads - -from bases.FrameworkServices.UrlService import UrlService - -update_every = 10 -disabled_by_default = True - - -def charts_template(sm, alarm_status_chart_type='line'): - order = [ - 'alarms', - 'values' - ] - - mappings = ', '.join(['{0}={1}'.format(k, v) for k, v in sm.items()]) - charts = { - 'alarms': { - 'options': [None, 'Alarms ({0})'.format(mappings), 'status', 'status', 'alarms.status', alarm_status_chart_type], - 'lines': [], - 'variables': [ - ['alarms_num'], - ] - }, - 'values': { - 'options': [None, 'Alarm Values', 'value', 'value', 'alarms.value', 'line'], - 'lines': [], - } - } - return order, charts - - -DEFAULT_STATUS_MAP = {'CLEAR': 0, 'WARNING': 1, 'CRITICAL': 2} -DEFAULT_URL = 'http://127.0.0.1:19999/api/v1/alarms?all' -DEFAULT_COLLECT_ALARM_VALUES = False -DEFAULT_ALARM_STATUS_CHART_TYPE = 'line' -DEFAULT_ALARM_CONTAINS_WORDS = '' -DEFAULT_ALARM_EXCLUDES_WORDS = '' - -class Service(UrlService): - def __init__(self, configuration=None, name=None): - UrlService.__init__(self, configuration=configuration, name=name) - self.sm = self.configuration.get('status_map', DEFAULT_STATUS_MAP) - self.alarm_status_chart_type = self.configuration.get('alarm_status_chart_type', DEFAULT_ALARM_STATUS_CHART_TYPE) - self.order, self.definitions = charts_template(self.sm, self.alarm_status_chart_type) - self.url = self.configuration.get('url', DEFAULT_URL) - self.collect_alarm_values = bool(self.configuration.get('collect_alarm_values', DEFAULT_COLLECT_ALARM_VALUES)) - self.collected_dims = {'alarms': set(), 'values': set()} - self.alarm_contains_words = self.configuration.get('alarm_contains_words', DEFAULT_ALARM_CONTAINS_WORDS) - self.alarm_contains_words_list = [alarm_contains_word.lstrip(' ').rstrip(' ') for alarm_contains_word in self.alarm_contains_words.split(',')] - self.alarm_excludes_words = self.configuration.get('alarm_excludes_words', DEFAULT_ALARM_EXCLUDES_WORDS) - self.alarm_excludes_words_list = [alarm_excludes_word.lstrip(' ').rstrip(' ') for alarm_excludes_word in self.alarm_excludes_words.split(',')] - - def _get_data(self): - raw_data = self._get_raw_data() - if raw_data is None: - return None - - raw_data = loads(raw_data) - alarms = raw_data.get('alarms', {}) - if self.alarm_contains_words != '': - alarms = {alarm_name: alarms[alarm_name] for alarm_name in alarms for alarm_contains_word in - self.alarm_contains_words_list if alarm_contains_word in alarm_name} - if self.alarm_excludes_words != '': - alarms = {alarm_name: alarms[alarm_name] for alarm_name in alarms for alarm_excludes_word in - self.alarm_excludes_words_list if alarm_excludes_word not in alarm_name} - - data = {a: self.sm[alarms[a]['status']] for a in alarms if alarms[a]['status'] in self.sm} - self.update_charts('alarms', data) - data['alarms_num'] = len(data) - - if self.collect_alarm_values: - data_values = {'{}_value'.format(a): alarms[a]['value'] * 100 for a in alarms if 'value' in alarms[a] and alarms[a]['value'] is not None} - self.update_charts('values', data_values, divisor=100) - data.update(data_values) - - return data - - def update_charts(self, chart, data, algorithm='absolute', multiplier=1, divisor=1): - if not self.charts: - return - - for dim in data: - if dim not in self.collected_dims[chart]: - self.collected_dims[chart].add(dim) - self.charts[chart].add_dimension([dim, dim, algorithm, multiplier, divisor]) - - for dim in list(self.collected_dims[chart]): - if dim not in data: - self.collected_dims[chart].remove(dim) - self.charts[chart].del_dimension(dim, hide=False) diff --git a/src/collectors/python.d.plugin/alarms/alarms.conf b/src/collectors/python.d.plugin/alarms/alarms.conf deleted file mode 100644 index 06d76c3b3..000000000 --- a/src/collectors/python.d.plugin/alarms/alarms.conf +++ /dev/null @@ -1,60 +0,0 @@ -# netdata python.d.plugin configuration for example -# -# This file is in YaML format. Generally the format is: -# -# name: value -# -# There are 2 sections: -# - global variables -# - one or more JOBS -# -# JOBS allow you to collect values from multiple sources. -# Each source will have its own set of charts. -# -# JOB parameters have to be indented (using spaces only, example below). - -# ---------------------------------------------------------------------- -# Global Variables -# These variables set the defaults for all JOBs, however each JOB -# may define its own, overriding the defaults. - -# update_every sets the default data collection frequency. -# If unset, the python.d.plugin default is used. -# update_every: 10 - -# priority controls the order of charts at the netdata dashboard. -# Lower numbers move the charts towards the top of the page. -# If unset, the default for python.d.plugin is used. -# priority: 60000 - -# penalty indicates whether to apply penalty to update_every in case of failures. -# Penalty will increase every 5 failed updates in a row. Maximum penalty is 10 minutes. -# penalty: yes - -# autodetection_retry sets the job re-check interval in seconds. -# The job is not deleted if check fails. -# Attempts to start the job are made once every autodetection_retry. -# This feature is disabled by default. -# autodetection_retry: 0 - -# ---------------------------------------------------------------------- -# JOBS (data collection sources) - -# what url to pull data from -local: - url: 'http://127.0.0.1:19999/api/v1/alarms?all' - # define how to map alarm status to numbers for the chart - status_map: - CLEAR: 0 - WARNING: 1 - CRITICAL: 2 - # set to true to include a chart with calculated alarm values over time - collect_alarm_values: false - # define the type of chart for plotting status over time e.g. 'line' or 'stacked' - alarm_status_chart_type: 'line' - # a "," separated list of words you want to filter alarm names for. For example 'cpu,load' would filter for only - # alarms with "cpu" or "load" in alarm name. Default includes all. - alarm_contains_words: '' - # a "," separated list of words you want to exclude based on alarm name. For example 'cpu,load' would exclude - # all alarms with "cpu" or "load" in alarm name. Default excludes None. - alarm_excludes_words: '' diff --git a/src/collectors/python.d.plugin/alarms/integrations/netdata_agent_alarms.md b/src/collectors/python.d.plugin/alarms/integrations/netdata_agent_alarms.md deleted file mode 100644 index 57be4f092..000000000 --- a/src/collectors/python.d.plugin/alarms/integrations/netdata_agent_alarms.md +++ /dev/null @@ -1,201 +0,0 @@ -<!--startmeta -custom_edit_url: "https://github.com/netdata/netdata/edit/master/src/collectors/python.d.plugin/alarms/README.md" -meta_yaml: "https://github.com/netdata/netdata/edit/master/src/collectors/python.d.plugin/alarms/metadata.yaml" -sidebar_label: "Netdata Agent alarms" -learn_status: "Published" -learn_rel_path: "Collecting Metrics/Other" -most_popular: False -message: "DO NOT EDIT THIS FILE DIRECTLY, IT IS GENERATED BY THE COLLECTOR'S metadata.yaml FILE" -endmeta--> - -# Netdata Agent alarms - -Plugin: python.d.plugin -Module: alarms - -<img src="https://img.shields.io/badge/maintained%20by-Netdata-%2300ab44" /> - -## Overview - -This collector creates an 'Alarms' menu with one line plot of `alarms.status`. - - -Alarm status is read from the Netdata agent rest api [`/api/v1/alarms?all`](https://learn.netdata.cloud/api#/alerts/alerts1). - - -This collector is supported on all platforms. - -This collector supports collecting metrics from multiple instances of this integration, including remote instances. - - -### Default Behavior - -#### Auto-Detection - -It discovers instances of Netdata running on localhost, and gathers metrics from `http://127.0.0.1:19999/api/v1/alarms?all`. `CLEAR` status is mapped to `0`, `WARNING` to `1` and `CRITICAL` to `2`. Also, by default all alarms produced will be monitored. - - -#### Limits - -The default configuration for this integration does not impose any limits on data collection. - -#### Performance Impact - -The default configuration for this integration is not expected to impose a significant performance impact on the system. - - -## Metrics - -Metrics grouped by *scope*. - -The scope defines the instance that the metric belongs to. An instance is uniquely identified by a set of labels. - - - -### Per Netdata Agent alarms instance - -These metrics refer to the entire monitored application. - - -This scope has no labels. - -Metrics: - -| Metric | Dimensions | Unit | -|:------|:----------|:----| -| alarms.status | a dimension per alarm representing the latest status of the alarm. | status | -| alarms.values | a dimension per alarm representing the latest collected value of the alarm. | value | - - - -## Alerts - -There are no alerts configured by default for this integration. - - -## Setup - -### Prerequisites - -No action required. - -### Configuration - -#### File - -The configuration file name for this integration is `python.d/alarms.conf`. - - -You can edit the configuration file using the `edit-config` script from the -Netdata [config directory](/docs/netdata-agent/configuration/README.md#the-netdata-config-directory). - -```bash -cd /etc/netdata 2>/dev/null || cd /opt/netdata/etc/netdata -sudo ./edit-config python.d/alarms.conf -``` -#### Options - -There are 2 sections: - -* Global variables -* One or more JOBS that can define multiple different instances to monitor. - -The following options can be defined globally: priority, penalty, autodetection_retry, update_every, but can also be defined per JOB to override the global values. - -Additionally, the following collapsed table contains all the options that can be configured inside a JOB definition. - -Every configuration JOB starts with a `job_name` value which will appear in the dashboard, unless a `name` parameter is specified. - - -<details open><summary>Config options</summary> - -| Name | Description | Default | Required | -|:----|:-----------|:-------|:--------:| -| url | Netdata agent alarms endpoint to collect from. Can be local or remote so long as reachable by agent. | http://127.0.0.1:19999/api/v1/alarms?all | yes | -| status_map | Mapping of alarm status to integer number that will be the metric value collected. | {"CLEAR": 0, "WARNING": 1, "CRITICAL": 2} | yes | -| collect_alarm_values | set to true to include a chart with calculated alarm values over time. | no | yes | -| alarm_status_chart_type | define the type of chart for plotting status over time e.g. 'line' or 'stacked'. | line | yes | -| alarm_contains_words | A "," separated list of words you want to filter alarm names for. For example 'cpu,load' would filter for only alarms with "cpu" or "load" in alarm name. Default includes all. | | yes | -| alarm_excludes_words | A "," separated list of words you want to exclude based on alarm name. For example 'cpu,load' would exclude all alarms with "cpu" or "load" in alarm name. Default excludes None. | | yes | -| update_every | Sets the default data collection frequency. | 10 | no | -| priority | Controls the order of charts at the netdata dashboard. | 60000 | no | -| autodetection_retry | Sets the job re-check interval in seconds. | 0 | no | -| penalty | Indicates whether to apply penalty to update_every in case of failures. | yes | no | -| name | Job name. This value will overwrite the `job_name` value. JOBS with the same name are mutually exclusive. Only one of them will be allowed running at any time. This allows autodetection to try several alternatives and pick the one that works. | | no | - -</details> - -#### Examples - -##### Basic - -A basic example configuration. - -```yaml -jobs: - url: 'http://127.0.0.1:19999/api/v1/alarms?all' - -``` -##### Advanced - -An advanced example configuration with multiple jobs collecting different subsets of alarms for plotting on different charts. -"ML" job will collect status and values for all alarms with "ml_" in the name. Default job will collect status for all other alarms. - - -<details open><summary>Config</summary> - -```yaml -ML: - update_every: 5 - url: 'http://127.0.0.1:19999/api/v1/alarms?all' - status_map: - CLEAR: 0 - WARNING: 1 - CRITICAL: 2 - collect_alarm_values: true - alarm_status_chart_type: 'stacked' - alarm_contains_words: 'ml_' - -Default: - update_every: 5 - url: 'http://127.0.0.1:19999/api/v1/alarms?all' - status_map: - CLEAR: 0 - WARNING: 1 - CRITICAL: 2 - collect_alarm_values: false - alarm_status_chart_type: 'stacked' - alarm_excludes_words: 'ml_' - -``` -</details> - - - -## Troubleshooting - -### Debug Mode - -To troubleshoot issues with the `alarms` collector, run the `python.d.plugin` with the debug option enabled. The output -should give you clues as to why the collector isn't working. - -- Navigate to the `plugins.d` directory, usually at `/usr/libexec/netdata/plugins.d/`. If that's not the case on - your system, open `netdata.conf` and look for the `plugins` setting under `[directories]`. - - ```bash - cd /usr/libexec/netdata/plugins.d/ - ``` - -- Switch to the `netdata` user. - - ```bash - sudo -u netdata -s - ``` - -- Run the `python.d.plugin` to debug the collector: - - ```bash - ./python.d.plugin alarms debug trace - ``` - - diff --git a/src/collectors/python.d.plugin/alarms/metadata.yaml b/src/collectors/python.d.plugin/alarms/metadata.yaml deleted file mode 100644 index b6bee7594..000000000 --- a/src/collectors/python.d.plugin/alarms/metadata.yaml +++ /dev/null @@ -1,177 +0,0 @@ -plugin_name: python.d.plugin -modules: - - meta: - plugin_name: python.d.plugin - module_name: alarms - monitored_instance: - name: Netdata Agent alarms - link: /src/collectors/python.d.plugin/alarms/README.md - categories: - - data-collection.other - icon_filename: "" - related_resources: - integrations: - list: [] - info_provided_to_referring_integrations: - description: "" - keywords: - - alarms - - netdata - most_popular: false - overview: - data_collection: - metrics_description: | - This collector creates an 'Alarms' menu with one line plot of `alarms.status`. - method_description: | - Alarm status is read from the Netdata agent rest api [`/api/v1/alarms?all`](https://learn.netdata.cloud/api#/alerts/alerts1). - supported_platforms: - include: [] - exclude: [] - multi_instance: true - additional_permissions: - description: "" - default_behavior: - auto_detection: - description: | - It discovers instances of Netdata running on localhost, and gathers metrics from `http://127.0.0.1:19999/api/v1/alarms?all`. `CLEAR` status is mapped to `0`, `WARNING` to `1` and `CRITICAL` to `2`. Also, by default all alarms produced will be monitored. - limits: - description: "" - performance_impact: - description: "" - setup: - prerequisites: - list: [] - configuration: - file: - name: python.d/alarms.conf - description: "" - options: - description: | - There are 2 sections: - - * Global variables - * One or more JOBS that can define multiple different instances to monitor. - - The following options can be defined globally: priority, penalty, autodetection_retry, update_every, but can also be defined per JOB to override the global values. - - Additionally, the following collapsed table contains all the options that can be configured inside a JOB definition. - - Every configuration JOB starts with a `job_name` value which will appear in the dashboard, unless a `name` parameter is specified. - folding: - title: Config options - enabled: true - list: - - name: url - description: Netdata agent alarms endpoint to collect from. Can be local or remote so long as reachable by agent. - default_value: http://127.0.0.1:19999/api/v1/alarms?all - required: true - - name: status_map - description: Mapping of alarm status to integer number that will be the metric value collected. - default_value: '{"CLEAR": 0, "WARNING": 1, "CRITICAL": 2}' - required: true - - name: collect_alarm_values - description: set to true to include a chart with calculated alarm values over time. - default_value: false - required: true - - name: alarm_status_chart_type - description: define the type of chart for plotting status over time e.g. 'line' or 'stacked'. - default_value: "line" - required: true - - name: alarm_contains_words - description: > - A "," separated list of words you want to filter alarm names for. For example 'cpu,load' would filter for only alarms with "cpu" or "load" in alarm name. Default includes all. - default_value: "" - required: true - - name: alarm_excludes_words - description: > - A "," separated list of words you want to exclude based on alarm name. For example 'cpu,load' would exclude all alarms with "cpu" or "load" in alarm name. Default excludes None. - default_value: "" - required: true - - name: update_every - description: Sets the default data collection frequency. - default_value: 10 - required: false - - name: priority - description: Controls the order of charts at the netdata dashboard. - default_value: 60000 - required: false - - name: autodetection_retry - description: Sets the job re-check interval in seconds. - default_value: 0 - required: false - - name: penalty - description: Indicates whether to apply penalty to update_every in case of failures. - default_value: yes - required: false - - name: name - description: Job name. This value will overwrite the `job_name` value. JOBS with the same name are mutually exclusive. Only one of them will be allowed running at any time. This allows autodetection to try several alternatives and pick the one that works. - default_value: "" - required: false - examples: - folding: - enabled: true - title: Config - list: - - name: Basic - folding: - enabled: false - description: A basic example configuration. - config: | - jobs: - url: 'http://127.0.0.1:19999/api/v1/alarms?all' - - name: Advanced - folding: - enabled: true - description: | - An advanced example configuration with multiple jobs collecting different subsets of alarms for plotting on different charts. - "ML" job will collect status and values for all alarms with "ml_" in the name. Default job will collect status for all other alarms. - config: | - ML: - update_every: 5 - url: 'http://127.0.0.1:19999/api/v1/alarms?all' - status_map: - CLEAR: 0 - WARNING: 1 - CRITICAL: 2 - collect_alarm_values: true - alarm_status_chart_type: 'stacked' - alarm_contains_words: 'ml_' - - Default: - update_every: 5 - url: 'http://127.0.0.1:19999/api/v1/alarms?all' - status_map: - CLEAR: 0 - WARNING: 1 - CRITICAL: 2 - collect_alarm_values: false - alarm_status_chart_type: 'stacked' - alarm_excludes_words: 'ml_' - troubleshooting: - problems: - list: [] - alerts: [] - metrics: - folding: - title: Metrics - enabled: false - description: "" - availability: [] - scopes: - - name: global - description: | - These metrics refer to the entire monitored application. - labels: [] - metrics: - - name: alarms.status - description: Alarms ({status mapping}) - unit: "status" - chart_type: line - dimensions: - - name: a dimension per alarm representing the latest status of the alarm. - - name: alarms.values - description: Alarm Values - unit: "value" - chart_type: line - dimensions: - - name: a dimension per alarm representing the latest collected value of the alarm. diff --git a/src/collectors/python.d.plugin/am2320/integrations/am2320.md b/src/collectors/python.d.plugin/am2320/integrations/am2320.md index f96657624..ea0e505c2 100644 --- a/src/collectors/python.d.plugin/am2320/integrations/am2320.md +++ b/src/collectors/python.d.plugin/am2320/integrations/am2320.md @@ -156,6 +156,7 @@ local_sensor: ### Debug Mode + To troubleshoot issues with the `am2320` collector, run the `python.d.plugin` with the debug option enabled. The output should give you clues as to why the collector isn't working. @@ -178,4 +179,37 @@ should give you clues as to why the collector isn't working. ./python.d.plugin am2320 debug trace ``` +### Getting Logs + +If you're encountering problems with the `am2320` collector, follow these steps to retrieve logs and identify potential issues: + +- **Run the command** specific to your system (systemd, non-systemd, or Docker container). +- **Examine the output** for any warnings or error messages that might indicate issues. These messages should provide clues about the root cause of the problem. + +#### System with systemd + +Use the following command to view logs generated since the last Netdata service restart: + +```bash +journalctl _SYSTEMD_INVOCATION_ID="$(systemctl show --value --property=InvocationID netdata)" --namespace=netdata --grep am2320 +``` + +#### System without systemd + +Locate the collector log file, typically at `/var/log/netdata/collector.log`, and use `grep` to filter for collector's name: + +```bash +grep am2320 /var/log/netdata/collector.log +``` + +**Note**: This method shows logs from all restarts. Focus on the **latest entries** for troubleshooting current issues. + +#### Docker Container + +If your Netdata runs in a Docker container named "netdata" (replace if different), use this command: + +```bash +docker logs netdata 2>&1 | grep am2320 +``` + diff --git a/src/collectors/python.d.plugin/beanstalk/beanstalk.chart.py b/src/collectors/python.d.plugin/beanstalk/beanstalk.chart.py deleted file mode 100644 index 396543e5a..000000000 --- a/src/collectors/python.d.plugin/beanstalk/beanstalk.chart.py +++ /dev/null @@ -1,252 +0,0 @@ -# -*- coding: utf-8 -*- -# Description: beanstalk netdata python.d module -# Author: ilyam8 -# SPDX-License-Identifier: GPL-3.0-or-later - -try: - import beanstalkc - - BEANSTALKC = True -except ImportError: - BEANSTALKC = False - -from bases.FrameworkServices.SimpleService import SimpleService -from bases.loaders import load_yaml - -ORDER = [ - 'cpu_usage', - 'jobs_rate', - 'connections_rate', - 'commands_rate', - 'current_tubes', - 'current_jobs', - 'current_connections', - 'binlog', - 'uptime', -] - -CHARTS = { - 'cpu_usage': { - 'options': [None, 'Cpu Usage', 'cpu time', 'server statistics', 'beanstalk.cpu_usage', 'area'], - 'lines': [ - ['rusage-utime', 'user', 'incremental'], - ['rusage-stime', 'system', 'incremental'] - ] - }, - 'jobs_rate': { - 'options': [None, 'Jobs Rate', 'jobs/s', 'server statistics', 'beanstalk.jobs_rate', 'line'], - 'lines': [ - ['total-jobs', 'total', 'incremental'], - ['job-timeouts', 'timeouts', 'incremental'] - ] - }, - 'connections_rate': { - 'options': [None, 'Connections Rate', 'connections/s', 'server statistics', 'beanstalk.connections_rate', - 'area'], - 'lines': [ - ['total-connections', 'connections', 'incremental'] - ] - }, - 'commands_rate': { - 'options': [None, 'Commands Rate', 'commands/s', 'server statistics', 'beanstalk.commands_rate', 'stacked'], - 'lines': [ - ['cmd-put', 'put', 'incremental'], - ['cmd-peek', 'peek', 'incremental'], - ['cmd-peek-ready', 'peek-ready', 'incremental'], - ['cmd-peek-delayed', 'peek-delayed', 'incremental'], - ['cmd-peek-buried', 'peek-buried', 'incremental'], - ['cmd-reserve', 'reserve', 'incremental'], - ['cmd-use', 'use', 'incremental'], - ['cmd-watch', 'watch', 'incremental'], - ['cmd-ignore', 'ignore', 'incremental'], - ['cmd-delete', 'delete', 'incremental'], - ['cmd-release', 'release', 'incremental'], - ['cmd-bury', 'bury', 'incremental'], - ['cmd-kick', 'kick', 'incremental'], - ['cmd-stats', 'stats', 'incremental'], - ['cmd-stats-job', 'stats-job', 'incremental'], - ['cmd-stats-tube', 'stats-tube', 'incremental'], - ['cmd-list-tubes', 'list-tubes', 'incremental'], - ['cmd-list-tube-used', 'list-tube-used', 'incremental'], - ['cmd-list-tubes-watched', 'list-tubes-watched', 'incremental'], - ['cmd-pause-tube', 'pause-tube', 'incremental'] - ] - }, - 'current_tubes': { - 'options': [None, 'Current Tubes', 'tubes', 'server statistics', 'beanstalk.current_tubes', 'area'], - 'lines': [ - ['current-tubes', 'tubes'] - ] - }, - 'current_jobs': { - 'options': [None, 'Current Jobs', 'jobs', 'server statistics', 'beanstalk.current_jobs', 'stacked'], - 'lines': [ - ['current-jobs-urgent', 'urgent'], - ['current-jobs-ready', 'ready'], - ['current-jobs-reserved', 'reserved'], - ['current-jobs-delayed', 'delayed'], - ['current-jobs-buried', 'buried'] - ] - }, - 'current_connections': { - 'options': [None, 'Current Connections', 'connections', 'server statistics', - 'beanstalk.current_connections', 'line'], - 'lines': [ - ['current-connections', 'written'], - ['current-producers', 'producers'], - ['current-workers', 'workers'], - ['current-waiting', 'waiting'] - ] - }, - 'binlog': { - 'options': [None, 'Binlog', 'records/s', 'server statistics', 'beanstalk.binlog', 'line'], - 'lines': [ - ['binlog-records-written', 'written', 'incremental'], - ['binlog-records-migrated', 'migrated', 'incremental'] - ] - }, - 'uptime': { - 'options': [None, 'Uptime', 'seconds', 'server statistics', 'beanstalk.uptime', 'line'], - 'lines': [ - ['uptime'], - ] - } -} - - -def tube_chart_template(name): - order = [ - '{0}_jobs_rate'.format(name), - '{0}_jobs'.format(name), - '{0}_connections'.format(name), - '{0}_commands'.format(name), - '{0}_pause'.format(name) - ] - family = 'tube {0}'.format(name) - - charts = { - order[0]: { - 'options': [None, 'Job Rate', 'jobs/s', family, 'beanstalk.jobs_rate', 'area'], - 'lines': [ - ['_'.join([name, 'total-jobs']), 'jobs', 'incremental'] - ] - }, - order[1]: { - 'options': [None, 'Jobs', 'jobs', family, 'beanstalk.jobs', 'stacked'], - 'lines': [ - ['_'.join([name, 'current-jobs-urgent']), 'urgent'], - ['_'.join([name, 'current-jobs-ready']), 'ready'], - ['_'.join([name, 'current-jobs-reserved']), 'reserved'], - ['_'.join([name, 'current-jobs-delayed']), 'delayed'], - ['_'.join([name, 'current-jobs-buried']), 'buried'] - ] - }, - order[2]: { - 'options': [None, 'Connections', 'connections', family, 'beanstalk.connections', 'stacked'], - 'lines': [ - ['_'.join([name, 'current-using']), 'using'], - ['_'.join([name, 'current-waiting']), 'waiting'], - ['_'.join([name, 'current-watching']), 'watching'] - ] - }, - order[3]: { - 'options': [None, 'Commands', 'commands/s', family, 'beanstalk.commands', 'stacked'], - 'lines': [ - ['_'.join([name, 'cmd-delete']), 'deletes', 'incremental'], - ['_'.join([name, 'cmd-pause-tube']), 'pauses', 'incremental'] - ] - }, - order[4]: { - 'options': [None, 'Pause', 'seconds', family, 'beanstalk.pause', 'stacked'], - 'lines': [ - ['_'.join([name, 'pause']), 'since'], - ['_'.join([name, 'pause-time-left']), 'left'] - ] - } - } - - return order, charts - - -class Service(SimpleService): - def __init__(self, configuration=None, name=None): - SimpleService.__init__(self, configuration=configuration, name=name) - self.configuration = configuration - self.order = list(ORDER) - self.definitions = dict(CHARTS) - self.conn = None - self.alive = True - - def check(self): - if not BEANSTALKC: - self.error("'beanstalkc' module is needed to use beanstalk.chart.py") - return False - - self.conn = self.connect() - - return True if self.conn else False - - def get_data(self): - """ - :return: dict - """ - if not self.is_alive(): - return None - - active_charts = self.charts.active_charts() - data = dict() - - try: - data.update(self.conn.stats()) - - for tube in self.conn.tubes(): - stats = self.conn.stats_tube(tube) - - if tube + '_jobs_rate' not in active_charts: - self.create_new_tube_charts(tube) - - for stat in stats: - data['_'.join([tube, stat])] = stats[stat] - - except beanstalkc.SocketError: - self.alive = False - return None - - return data or None - - def create_new_tube_charts(self, tube): - order, charts = tube_chart_template(tube) - - for chart_name in order: - params = [chart_name] + charts[chart_name]['options'] - dimensions = charts[chart_name]['lines'] - - new_chart = self.charts.add_chart(params) - for dimension in dimensions: - new_chart.add_dimension(dimension) - - def connect(self): - host = self.configuration.get('host', '127.0.0.1') - port = self.configuration.get('port', 11300) - timeout = self.configuration.get('timeout', 1) - try: - return beanstalkc.Connection(host=host, - port=port, - connect_timeout=timeout, - parse_yaml=load_yaml) - except beanstalkc.SocketError as error: - self.error('Connection to {0}:{1} failed: {2}'.format(host, port, error)) - return None - - def reconnect(self): - try: - self.conn.reconnect() - self.alive = True - return True - except beanstalkc.SocketError: - return False - - def is_alive(self): - if not self.alive: - return self.reconnect() - return True diff --git a/src/collectors/python.d.plugin/beanstalk/beanstalk.conf b/src/collectors/python.d.plugin/beanstalk/beanstalk.conf deleted file mode 100644 index 6d9773a19..000000000 --- a/src/collectors/python.d.plugin/beanstalk/beanstalk.conf +++ /dev/null @@ -1,78 +0,0 @@ -# netdata python.d.plugin configuration for beanstalk -# -# This file is in YaML format. Generally the format is: -# -# name: value -# -# There are 2 sections: -# - global variables -# - one or more JOBS -# -# JOBS allow you to collect values from multiple sources. -# Each source will have its own set of charts. -# -# JOB parameters have to be indented (using spaces only, example below). - -# ---------------------------------------------------------------------- -# Global Variables -# These variables set the defaults for all JOBs, however each JOB -# may define its own, overriding the defaults. - -# update_every sets the default data collection frequency. -# If unset, the python.d.plugin default is used. -# update_every: 1 - -# priority controls the order of charts at the netdata dashboard. -# Lower numbers move the charts towards the top of the page. -# If unset, the default for python.d.plugin is used. -# priority: 60000 - -# penalty indicates whether to apply penalty to update_every in case of failures. -# Penalty will increase every 5 failed updates in a row. Maximum penalty is 10 minutes. -# penalty: yes - -# autodetection_retry sets the job re-check interval in seconds. -# The job is not deleted if check fails. -# Attempts to start the job are made once every autodetection_retry. -# This feature is disabled by default. -# autodetection_retry: 0 - -# chart_cleanup sets the default chart cleanup interval in iterations. -# A chart is marked as obsolete if it has not been updated -# 'chart_cleanup' iterations in a row. -# When a plugin sends the obsolete flag, the charts are not deleted -# from netdata immediately. -# They will be hidden immediately (not offered to dashboard viewer, -# streamed upstream and archived to external databases) and deleted one hour -# later (configurable from netdata.conf). -# chart_cleanup: 10 - -# ---------------------------------------------------------------------- -# JOBS (data collection sources) -# -# The default JOBS share the same *name*. JOBS with the same name -# are mutually exclusive. Only one of them will be allowed running at -# any time. This allows autodetection to try several alternatives and -# pick the one that works. -# -# Any number of jobs is supported. -# -# All python.d.plugin JOBS (for all its modules) support a set of -# predefined parameters. These are: -# -# job_name: -# name: myname # the JOB's name as it will appear at the -# # dashboard (by default is the job_name) -# # JOBs sharing a name are mutually exclusive -# update_every: 1 # the JOB's data collection frequency -# priority: 60000 # the JOB's order on the dashboard -# penalty: yes # the JOB's penalty -# autodetection_retry: 0 # the JOB's re-check interval in seconds -# chart_cleanup: 10 # the JOB's chart cleanup interval in iterations -# -# Additionally to the above, beanstalk also supports the following: -# -# host: 'host' # Server ip address or hostname. Default: 127.0.0.1 -# port: port # Beanstalkd port. Default: -# -# ---------------------------------------------------------------------- diff --git a/src/collectors/python.d.plugin/beanstalk/integrations/beanstalk.md b/src/collectors/python.d.plugin/beanstalk/integrations/beanstalk.md deleted file mode 100644 index 841444354..000000000 --- a/src/collectors/python.d.plugin/beanstalk/integrations/beanstalk.md +++ /dev/null @@ -1,219 +0,0 @@ -<!--startmeta -custom_edit_url: "https://github.com/netdata/netdata/edit/master/src/collectors/python.d.plugin/beanstalk/README.md" -meta_yaml: "https://github.com/netdata/netdata/edit/master/src/collectors/python.d.plugin/beanstalk/metadata.yaml" -sidebar_label: "Beanstalk" -learn_status: "Published" -learn_rel_path: "Collecting Metrics/Message Brokers" -most_popular: False -message: "DO NOT EDIT THIS FILE DIRECTLY, IT IS GENERATED BY THE COLLECTOR'S metadata.yaml FILE" -endmeta--> - -# Beanstalk - - -<img src="https://netdata.cloud/img/beanstalk.svg" width="150"/> - - -Plugin: python.d.plugin -Module: beanstalk - -<img src="https://img.shields.io/badge/maintained%20by-Netdata-%2300ab44" /> - -## Overview - -Monitor Beanstalk metrics to enhance job queueing and processing efficiency. Track job rates, processing times, and queue lengths for better task management. - -The collector uses the `beanstalkc` python module to connect to a `beanstalkd` service and gather metrics. - -This collector is supported on all platforms. - -This collector supports collecting metrics from multiple instances of this integration, including remote instances. - - -### Default Behavior - -#### Auto-Detection - -If no configuration is given, module will attempt to connect to beanstalkd on 127.0.0.1:11300 address. - -#### Limits - -The default configuration for this integration does not impose any limits on data collection. - -#### Performance Impact - -The default configuration for this integration is not expected to impose a significant performance impact on the system. - - -## Metrics - -Metrics grouped by *scope*. - -The scope defines the instance that the metric belongs to. An instance is uniquely identified by a set of labels. - - - -### Per Beanstalk instance - -These metrics refer to the entire monitored application. - -This scope has no labels. - -Metrics: - -| Metric | Dimensions | Unit | -|:------|:----------|:----| -| beanstalk.cpu_usage | user, system | cpu time | -| beanstalk.jobs_rate | total, timeouts | jobs/s | -| beanstalk.connections_rate | connections | connections/s | -| beanstalk.commands_rate | put, peek, peek-ready, peek-delayed, peek-buried, reserve, use, watch, ignore, delete, bury, kick, stats, stats-job, stats-tube, list-tubes, list-tube-used, list-tubes-watched, pause-tube | commands/s | -| beanstalk.current_tubes | tubes | tubes | -| beanstalk.current_jobs | urgent, ready, reserved, delayed, buried | jobs | -| beanstalk.current_connections | written, producers, workers, waiting | connections | -| beanstalk.binlog | written, migrated | records/s | -| beanstalk.uptime | uptime | seconds | - -### Per tube - -Metrics related to Beanstalk tubes. Each tube produces its own set of the following metrics. - -This scope has no labels. - -Metrics: - -| Metric | Dimensions | Unit | -|:------|:----------|:----| -| beanstalk.jobs_rate | jobs | jobs/s | -| beanstalk.jobs | urgent, ready, reserved, delayed, buried | jobs | -| beanstalk.connections | using, waiting, watching | connections | -| beanstalk.commands | deletes, pauses | commands/s | -| beanstalk.pause | since, left | seconds | - - - -## Alerts - - -The following alerts are available: - -| Alert name | On metric | Description | -|:------------|:----------|:------------| -| [ beanstalk_server_buried_jobs ](https://github.com/netdata/netdata/blob/master/src/health/health.d/beanstalkd.conf) | beanstalk.current_jobs | number of buried jobs across all tubes. You need to manually kick them so they can be processed. Presence of buried jobs in a tube does not affect new jobs. | - - -## Setup - -### Prerequisites - -#### beanstalkc python module - -The collector requires the `beanstalkc` python module to be installed. - - -### Configuration - -#### File - -The configuration file name for this integration is `python.d/beanstalk.conf`. - - -You can edit the configuration file using the `edit-config` script from the -Netdata [config directory](/docs/netdata-agent/configuration/README.md#the-netdata-config-directory). - -```bash -cd /etc/netdata 2>/dev/null || cd /opt/netdata/etc/netdata -sudo ./edit-config python.d/beanstalk.conf -``` -#### Options - -There are 2 sections: - -* Global variables -* One or more JOBS that can define multiple different instances to monitor. - -The following options can be defined globally: priority, penalty, autodetection_retry, update_every, but can also be defined per JOB to override the global values. - -Additionally, the following collapsed table contains all the options that can be configured inside a JOB definition. - -Every configuration JOB starts with a `job_name` value which will appear in the dashboard, unless a `name` parameter is specified. - - -<details open><summary>Config options</summary> - -| Name | Description | Default | Required | -|:----|:-----------|:-------|:--------:| -| update_every | Sets the default data collection frequency. | 5 | no | -| priority | Controls the order of charts at the netdata dashboard. | 60000 | no | -| autodetection_retry | Sets the job re-check interval in seconds. | 0 | no | -| penalty | Indicates whether to apply penalty to update_every in case of failures. | yes | no | -| name | Job name. This value will overwrite the `job_name` value. JOBS with the same name are mutually exclusive. Only one of them will be allowed running at any time. This allows autodetection to try several alternatives and pick the one that works. | | no | -| host | IP or URL to a beanstalk service. | 127.0.0.1 | no | -| port | Port to the IP or URL to a beanstalk service. | 11300 | no | - -</details> - -#### Examples - -##### Remote beanstalk server - -A basic remote beanstalk server - -```yaml -remote: - name: 'beanstalk' - host: '1.2.3.4' - port: 11300 - -``` -##### Multi-instance - -> **Note**: When you define multiple jobs, their names must be unique. - -Collecting metrics from local and remote instances. - - -<details open><summary>Config</summary> - -```yaml -localhost: - name: 'local_beanstalk' - host: '127.0.0.1' - port: 11300 - -remote_job: - name: 'remote_beanstalk' - host: '192.0.2.1' - port: 113000 - -``` -</details> - - - -## Troubleshooting - -### Debug Mode - -To troubleshoot issues with the `beanstalk` collector, run the `python.d.plugin` with the debug option enabled. The output -should give you clues as to why the collector isn't working. - -- Navigate to the `plugins.d` directory, usually at `/usr/libexec/netdata/plugins.d/`. If that's not the case on - your system, open `netdata.conf` and look for the `plugins` setting under `[directories]`. - - ```bash - cd /usr/libexec/netdata/plugins.d/ - ``` - -- Switch to the `netdata` user. - - ```bash - sudo -u netdata -s - ``` - -- Run the `python.d.plugin` to debug the collector: - - ```bash - ./python.d.plugin beanstalk debug trace - ``` - - diff --git a/src/collectors/python.d.plugin/boinc/integrations/boinc.md b/src/collectors/python.d.plugin/boinc/integrations/boinc.md index 2e5ff5c4f..d5fcac215 100644 --- a/src/collectors/python.d.plugin/boinc/integrations/boinc.md +++ b/src/collectors/python.d.plugin/boinc/integrations/boinc.md @@ -179,6 +179,7 @@ remote_job: ### Debug Mode + To troubleshoot issues with the `boinc` collector, run the `python.d.plugin` with the debug option enabled. The output should give you clues as to why the collector isn't working. @@ -201,4 +202,37 @@ should give you clues as to why the collector isn't working. ./python.d.plugin boinc debug trace ``` +### Getting Logs + +If you're encountering problems with the `boinc` collector, follow these steps to retrieve logs and identify potential issues: + +- **Run the command** specific to your system (systemd, non-systemd, or Docker container). +- **Examine the output** for any warnings or error messages that might indicate issues. These messages should provide clues about the root cause of the problem. + +#### System with systemd + +Use the following command to view logs generated since the last Netdata service restart: + +```bash +journalctl _SYSTEMD_INVOCATION_ID="$(systemctl show --value --property=InvocationID netdata)" --namespace=netdata --grep boinc +``` + +#### System without systemd + +Locate the collector log file, typically at `/var/log/netdata/collector.log`, and use `grep` to filter for collector's name: + +```bash +grep boinc /var/log/netdata/collector.log +``` + +**Note**: This method shows logs from all restarts. Focus on the **latest entries** for troubleshooting current issues. + +#### Docker Container + +If your Netdata runs in a Docker container named "netdata" (replace if different), use this command: + +```bash +docker logs netdata 2>&1 | grep boinc +``` + diff --git a/src/collectors/python.d.plugin/ceph/integrations/ceph.md b/src/collectors/python.d.plugin/ceph/integrations/ceph.md index 2b49a331d..d2584a4d0 100644 --- a/src/collectors/python.d.plugin/ceph/integrations/ceph.md +++ b/src/collectors/python.d.plugin/ceph/integrations/ceph.md @@ -169,6 +169,7 @@ local: ### Debug Mode + To troubleshoot issues with the `ceph` collector, run the `python.d.plugin` with the debug option enabled. The output should give you clues as to why the collector isn't working. @@ -191,4 +192,37 @@ should give you clues as to why the collector isn't working. ./python.d.plugin ceph debug trace ``` +### Getting Logs + +If you're encountering problems with the `ceph` collector, follow these steps to retrieve logs and identify potential issues: + +- **Run the command** specific to your system (systemd, non-systemd, or Docker container). +- **Examine the output** for any warnings or error messages that might indicate issues. These messages should provide clues about the root cause of the problem. + +#### System with systemd + +Use the following command to view logs generated since the last Netdata service restart: + +```bash +journalctl _SYSTEMD_INVOCATION_ID="$(systemctl show --value --property=InvocationID netdata)" --namespace=netdata --grep ceph +``` + +#### System without systemd + +Locate the collector log file, typically at `/var/log/netdata/collector.log`, and use `grep` to filter for collector's name: + +```bash +grep ceph /var/log/netdata/collector.log +``` + +**Note**: This method shows logs from all restarts. Focus on the **latest entries** for troubleshooting current issues. + +#### Docker Container + +If your Netdata runs in a Docker container named "netdata" (replace if different), use this command: + +```bash +docker logs netdata 2>&1 | grep ceph +``` + diff --git a/src/collectors/python.d.plugin/changefinder/README.md b/src/collectors/python.d.plugin/changefinder/README.md deleted file mode 120000 index 0ca704eb1..000000000 --- a/src/collectors/python.d.plugin/changefinder/README.md +++ /dev/null @@ -1 +0,0 @@ -integrations/python.d_changefinder.md
\ No newline at end of file diff --git a/src/collectors/python.d.plugin/changefinder/changefinder.chart.py b/src/collectors/python.d.plugin/changefinder/changefinder.chart.py deleted file mode 100644 index 2a69cd9f5..000000000 --- a/src/collectors/python.d.plugin/changefinder/changefinder.chart.py +++ /dev/null @@ -1,185 +0,0 @@ -# -*- coding: utf-8 -*- -# Description: changefinder netdata python.d module -# Author: andrewm4894 -# SPDX-License-Identifier: GPL-3.0-or-later - -from json import loads -import re - -from bases.FrameworkServices.UrlService import UrlService - -import numpy as np -import changefinder -from scipy.stats import percentileofscore - -update_every = 5 -disabled_by_default = True - -ORDER = [ - 'scores', - 'flags' -] - -CHARTS = { - 'scores': { - 'options': [None, 'ChangeFinder', 'score', 'Scores', 'changefinder.scores', 'line'], - 'lines': [] - }, - 'flags': { - 'options': [None, 'ChangeFinder', 'flag', 'Flags', 'changefinder.flags', 'stacked'], - 'lines': [] - } -} - -DEFAULT_PROTOCOL = 'http' -DEFAULT_HOST = '127.0.0.1:19999' -DEFAULT_CHARTS_REGEX = 'system.*' -DEFAULT_MODE = 'per_chart' -DEFAULT_CF_R = 0.5 -DEFAULT_CF_ORDER = 1 -DEFAULT_CF_SMOOTH = 15 -DEFAULT_CF_DIFF = False -DEFAULT_CF_THRESHOLD = 99 -DEFAULT_N_SCORE_SAMPLES = 14400 -DEFAULT_SHOW_SCORES = False - - -class Service(UrlService): - def __init__(self, configuration=None, name=None): - UrlService.__init__(self, configuration=configuration, name=name) - self.order = ORDER - self.definitions = CHARTS - self.protocol = self.configuration.get('protocol', DEFAULT_PROTOCOL) - self.host = self.configuration.get('host', DEFAULT_HOST) - self.url = '{}://{}/api/v1/allmetrics?format=json'.format(self.protocol, self.host) - self.charts_regex = re.compile(self.configuration.get('charts_regex', DEFAULT_CHARTS_REGEX)) - self.charts_to_exclude = self.configuration.get('charts_to_exclude', '').split(',') - self.mode = self.configuration.get('mode', DEFAULT_MODE) - self.n_score_samples = int(self.configuration.get('n_score_samples', DEFAULT_N_SCORE_SAMPLES)) - self.show_scores = int(self.configuration.get('show_scores', DEFAULT_SHOW_SCORES)) - self.cf_r = float(self.configuration.get('cf_r', DEFAULT_CF_R)) - self.cf_order = int(self.configuration.get('cf_order', DEFAULT_CF_ORDER)) - self.cf_smooth = int(self.configuration.get('cf_smooth', DEFAULT_CF_SMOOTH)) - self.cf_diff = bool(self.configuration.get('cf_diff', DEFAULT_CF_DIFF)) - self.cf_threshold = float(self.configuration.get('cf_threshold', DEFAULT_CF_THRESHOLD)) - self.collected_dims = {'scores': set(), 'flags': set()} - self.models = {} - self.x_latest = {} - self.scores_latest = {} - self.scores_samples = {} - - def get_score(self, x, model): - """Update the score for the model based on most recent data, flag if it's percentile passes self.cf_threshold. - """ - - # get score - if model not in self.models: - # initialise empty model if needed - self.models[model] = changefinder.ChangeFinder(r=self.cf_r, order=self.cf_order, smooth=self.cf_smooth) - # if the update for this step fails then just fallback to last known score - try: - score = self.models[model].update(x) - self.scores_latest[model] = score - except Exception as _: - score = self.scores_latest.get(model, 0) - score = 0 if np.isnan(score) else score - - # update sample scores used to calculate percentiles - if model in self.scores_samples: - self.scores_samples[model].append(score) - else: - self.scores_samples[model] = [score] - self.scores_samples[model] = self.scores_samples[model][-self.n_score_samples:] - - # convert score to percentile - score = percentileofscore(self.scores_samples[model], score) - - # flag based on score percentile - flag = 1 if score >= self.cf_threshold else 0 - - return score, flag - - def validate_charts(self, chart, data, algorithm='absolute', multiplier=1, divisor=1): - """If dimension not in chart then add it. - """ - if not self.charts: - return - - for dim in data: - if dim not in self.collected_dims[chart]: - self.collected_dims[chart].add(dim) - self.charts[chart].add_dimension([dim, dim, algorithm, multiplier, divisor]) - - for dim in list(self.collected_dims[chart]): - if dim not in data: - self.collected_dims[chart].remove(dim) - self.charts[chart].del_dimension(dim, hide=False) - - def diff(self, x, model): - """Take difference of data. - """ - x_diff = x - self.x_latest.get(model, 0) - self.x_latest[model] = x - x = x_diff - return x - - def _get_data(self): - - # pull data from self.url - raw_data = self._get_raw_data() - if raw_data is None: - return None - - raw_data = loads(raw_data) - - # filter to just the data for the charts specified - charts_in_scope = list(filter(self.charts_regex.match, raw_data.keys())) - charts_in_scope = [c for c in charts_in_scope if c not in self.charts_to_exclude] - - data_score = {} - data_flag = {} - - # process each chart - for chart in charts_in_scope: - - if self.mode == 'per_chart': - - # average dims on chart and run changefinder on that average - x = [raw_data[chart]['dimensions'][dim]['value'] for dim in raw_data[chart]['dimensions']] - x = [x for x in x if x is not None] - - if len(x) > 0: - - x = sum(x) / len(x) - x = self.diff(x, chart) if self.cf_diff else x - - score, flag = self.get_score(x, chart) - if self.show_scores: - data_score['{}_score'.format(chart)] = score * 100 - data_flag[chart] = flag - - else: - - # run changefinder on each individual dim - for dim in raw_data[chart]['dimensions']: - - chart_dim = '{}|{}'.format(chart, dim) - - x = raw_data[chart]['dimensions'][dim]['value'] - x = x if x else 0 - x = self.diff(x, chart_dim) if self.cf_diff else x - - score, flag = self.get_score(x, chart_dim) - if self.show_scores: - data_score['{}_score'.format(chart_dim)] = score * 100 - data_flag[chart_dim] = flag - - self.validate_charts('flags', data_flag) - - if self.show_scores & len(data_score) > 0: - data_score['average_score'] = sum(data_score.values()) / len(data_score) - self.validate_charts('scores', data_score, divisor=100) - - data = {**data_score, **data_flag} - - return data diff --git a/src/collectors/python.d.plugin/changefinder/changefinder.conf b/src/collectors/python.d.plugin/changefinder/changefinder.conf deleted file mode 100644 index 56a681f1e..000000000 --- a/src/collectors/python.d.plugin/changefinder/changefinder.conf +++ /dev/null @@ -1,74 +0,0 @@ -# netdata python.d.plugin configuration for example -# -# This file is in YaML format. Generally the format is: -# -# name: value -# -# There are 2 sections: -# - global variables -# - one or more JOBS -# -# JOBS allow you to collect values from multiple sources. -# Each source will have its own set of charts. -# -# JOB parameters have to be indented (using spaces only, example below). - -# ---------------------------------------------------------------------- -# Global Variables -# These variables set the defaults for all JOBs, however each JOB -# may define its own, overriding the defaults. - -# update_every sets the default data collection frequency. -# If unset, the python.d.plugin default is used. -# update_every: 5 - -# priority controls the order of charts at the netdata dashboard. -# Lower numbers move the charts towards the top of the page. -# If unset, the default for python.d.plugin is used. -# priority: 60000 - -# penalty indicates whether to apply penalty to update_every in case of failures. -# Penalty will increase every 5 failed updates in a row. Maximum penalty is 10 minutes. -# penalty: yes - -# autodetection_retry sets the job re-check interval in seconds. -# The job is not deleted if check fails. -# Attempts to start the job are made once every autodetection_retry. -# This feature is disabled by default. -# autodetection_retry: 0 - -# ---------------------------------------------------------------------- -# JOBS (data collection sources) - -local: - - # A friendly name for this job. - name: 'local' - - # What host to pull data from. - host: '127.0.0.1:19999' - - # What charts to pull data for - A regex like 'system\..*|' or 'system\..*|apps.cpu|apps.mem' etc. - charts_regex: 'system\..*' - - # Charts to exclude, useful if you would like to exclude some specific charts. - # Note: should be a ',' separated string like 'chart.name,chart.name'. - charts_to_exclude: '' - - # Get ChangeFinder scores 'per_dim' or 'per_chart'. - mode: 'per_chart' - - # Default parameters that can be passed to the changefinder library. - cf_r: 0.5 - cf_order: 1 - cf_smooth: 15 - - # The percentile above which scores will be flagged. - cf_threshold: 99 - - # The number of recent scores to use when calculating the percentile of the changefinder score. - n_score_samples: 14400 - - # Set to true if you also want to chart the percentile scores in addition to the flags. - # Mainly useful for debugging or if you want to dive deeper on how the scores are evolving over time. - show_scores: false diff --git a/src/collectors/python.d.plugin/changefinder/integrations/python.d_changefinder.md b/src/collectors/python.d.plugin/changefinder/integrations/python.d_changefinder.md deleted file mode 100644 index fe370baac..000000000 --- a/src/collectors/python.d.plugin/changefinder/integrations/python.d_changefinder.md +++ /dev/null @@ -1,217 +0,0 @@ -<!--startmeta -custom_edit_url: "https://github.com/netdata/netdata/edit/master/src/collectors/python.d.plugin/changefinder/README.md" -meta_yaml: "https://github.com/netdata/netdata/edit/master/src/collectors/python.d.plugin/changefinder/metadata.yaml" -sidebar_label: "python.d changefinder" -learn_status: "Published" -learn_rel_path: "Collecting Metrics/Other" -most_popular: False -message: "DO NOT EDIT THIS FILE DIRECTLY, IT IS GENERATED BY THE COLLECTOR'S metadata.yaml FILE" -endmeta--> - -# python.d changefinder - -Plugin: python.d.plugin -Module: changefinder - -<img src="https://img.shields.io/badge/maintained%20by-Netdata-%2300ab44" /> - -## Overview - -This collector uses the Python [changefinder](https://github.com/shunsukeaihara/changefinder) library to -perform [online](https://en.wikipedia.org/wiki/Online_machine_learning) [changepoint detection](https://en.wikipedia.org/wiki/Change_detection) -on your Netdata charts and/or dimensions. - - -Instead of this collector just _collecting_ data, it also does some computation on the data it collects to return a changepoint score for each chart or dimension you configure it to work on. This is an [online](https://en.wikipedia.org/wiki/Online_machine_learning) machine learning algorithm so there is no batch step to train the model, instead it evolves over time as more data arrives. That makes this particular algorithm quite cheap to compute at each step of data collection (see the notes section below for more details) and it should scale fairly well to work on lots of charts or hosts (if running on a parent node for example). -### Notes - It may take an hour or two (depending on your choice of `n_score_samples`) for the collector to 'settle' into it's - typical behaviour in terms of the trained models and scores you will see in the normal running of your node. Mainly - this is because it can take a while to build up a proper distribution of previous scores in over to convert the raw - score returned by the ChangeFinder algorithm into a percentile based on the most recent `n_score_samples` that have - already been produced. So when you first turn the collector on, it will have a lot of flags in the beginning and then - should 'settle down' once it has built up enough history. This is a typical characteristic of online machine learning - approaches which need some initial window of time before they can be useful. -- As this collector does most of the work in Python itself, you may want to try it out first on a test or development - system to get a sense of its performance characteristics on a node similar to where you would like to use it. -- On a development n1-standard-2 (2 vCPUs, 7.5 GB memory) vm running Ubuntu 18.04 LTS and not doing any work some of the - typical performance characteristics we saw from running this collector (with defaults) were: - - A runtime (`netdata.runtime_changefinder`) of ~30ms. - - Typically ~1% additional cpu usage. - - About ~85mb of ram (`apps.mem`) being continually used by the `python.d.plugin` under default configuration. - - -This collector is supported on all platforms. - -This collector supports collecting metrics from multiple instances of this integration, including remote instances. - - -### Default Behavior - -#### Auto-Detection - -By default this collector will work over all `system.*` charts. - -#### Limits - -The default configuration for this integration does not impose any limits on data collection. - -#### Performance Impact - -The default configuration for this integration is not expected to impose a significant performance impact on the system. - - -## Metrics - -Metrics grouped by *scope*. - -The scope defines the instance that the metric belongs to. An instance is uniquely identified by a set of labels. - - - -### Per python.d changefinder instance - - - -This scope has no labels. - -Metrics: - -| Metric | Dimensions | Unit | -|:------|:----------|:----| -| changefinder.scores | a dimension per chart | score | -| changefinder.flags | a dimension per chart | flag | - - - -## Alerts - -There are no alerts configured by default for this integration. - - -## Setup - -### Prerequisites - -#### Python Requirements - -This collector will only work with Python 3 and requires the packages below be installed. - -```bash -# become netdata user -sudo su -s /bin/bash netdata -# install required packages for the netdata user -pip3 install --user numpy==1.19.5 changefinder==0.03 scipy==1.5.4 -``` - -**Note**: if you need to tell Netdata to use Python 3 then you can pass the below command in the python plugin section -of your `netdata.conf` file. - -```yaml -[ plugin:python.d ] - # update every = 1 - command options = -ppython3 -``` - - - -### Configuration - -#### File - -The configuration file name for this integration is `python.d/changefinder.conf`. - - -You can edit the configuration file using the `edit-config` script from the -Netdata [config directory](/docs/netdata-agent/configuration/README.md#the-netdata-config-directory). - -```bash -cd /etc/netdata 2>/dev/null || cd /opt/netdata/etc/netdata -sudo ./edit-config python.d/changefinder.conf -``` -#### Options - -There are 2 sections: - -* Global variables -* One or more JOBS that can define multiple different instances to monitor. - -The following options can be defined globally: priority, penalty, autodetection_retry, update_every, but can also be defined per JOB to override the global values. - -Additionally, the following collapsed table contains all the options that can be configured inside a JOB definition. - -Every configuration JOB starts with a `job_name` value which will appear in the dashboard, unless a `name` parameter is specified. - - -<details open><summary>Config options</summary> - -| Name | Description | Default | Required | -|:----|:-----------|:-------|:--------:| -| charts_regex | what charts to pull data for - A regex like `system\..*/` or `system\..*/apps.cpu/apps.mem` etc. | system\..* | yes | -| charts_to_exclude | charts to exclude, useful if you would like to exclude some specific charts. note: should be a ',' separated string like 'chart.name,chart.name'. | | no | -| mode | get ChangeFinder scores 'per_dim' or 'per_chart'. | per_chart | yes | -| cf_r | default parameters that can be passed to the changefinder library. | 0.5 | no | -| cf_order | default parameters that can be passed to the changefinder library. | 1 | no | -| cf_smooth | default parameters that can be passed to the changefinder library. | 15 | no | -| cf_threshold | the percentile above which scores will be flagged. | 99 | no | -| n_score_samples | the number of recent scores to use when calculating the percentile of the changefinder score. | 14400 | no | -| show_scores | set to true if you also want to chart the percentile scores in addition to the flags. (mainly useful for debugging or if you want to dive deeper on how the scores are evolving over time) | no | no | - -</details> - -#### Examples - -##### Default - -Default configuration. - -```yaml -local: - name: 'local' - host: '127.0.0.1:19999' - charts_regex: 'system\..*' - charts_to_exclude: '' - mode: 'per_chart' - cf_r: 0.5 - cf_order: 1 - cf_smooth: 15 - cf_threshold: 99 - n_score_samples: 14400 - show_scores: false - -``` - - -## Troubleshooting - -### Debug Mode - -To troubleshoot issues with the `changefinder` collector, run the `python.d.plugin` with the debug option enabled. The output -should give you clues as to why the collector isn't working. - -- Navigate to the `plugins.d` directory, usually at `/usr/libexec/netdata/plugins.d/`. If that's not the case on - your system, open `netdata.conf` and look for the `plugins` setting under `[directories]`. - - ```bash - cd /usr/libexec/netdata/plugins.d/ - ``` - -- Switch to the `netdata` user. - - ```bash - sudo -u netdata -s - ``` - -- Run the `python.d.plugin` to debug the collector: - - ```bash - ./python.d.plugin changefinder debug trace - ``` - -### Debug Mode - - - -### Log Messages - - - - diff --git a/src/collectors/python.d.plugin/changefinder/metadata.yaml b/src/collectors/python.d.plugin/changefinder/metadata.yaml deleted file mode 100644 index 170d9146a..000000000 --- a/src/collectors/python.d.plugin/changefinder/metadata.yaml +++ /dev/null @@ -1,212 +0,0 @@ -plugin_name: python.d.plugin -modules: - - meta: - plugin_name: python.d.plugin - module_name: changefinder - monitored_instance: - name: python.d changefinder - link: "" - categories: - - data-collection.other - icon_filename: "" - related_resources: - integrations: - list: [] - info_provided_to_referring_integrations: - description: "" - keywords: - - change detection - - anomaly detection - - machine learning - - ml - most_popular: false - overview: - data_collection: - metrics_description: | - This collector uses the Python [changefinder](https://github.com/shunsukeaihara/changefinder) library to - perform [online](https://en.wikipedia.org/wiki/Online_machine_learning) [changepoint detection](https://en.wikipedia.org/wiki/Change_detection) - on your Netdata charts and/or dimensions. - method_description: > - Instead of this collector just _collecting_ data, it also does some computation on the data it collects to return a - changepoint score for each chart or dimension you configure it to work on. This is - an [online](https://en.wikipedia.org/wiki/Online_machine_learning) machine learning algorithm so there is no batch step - to train the model, instead it evolves over time as more data arrives. That makes this particular algorithm quite cheap - to compute at each step of data collection (see the notes section below for more details) and it should scale fairly - well to work on lots of charts or hosts (if running on a parent node for example). - - ### Notes - - It may take an hour or two (depending on your choice of `n_score_samples`) for the collector to 'settle' into it's - typical behaviour in terms of the trained models and scores you will see in the normal running of your node. Mainly - this is because it can take a while to build up a proper distribution of previous scores in over to convert the raw - score returned by the ChangeFinder algorithm into a percentile based on the most recent `n_score_samples` that have - already been produced. So when you first turn the collector on, it will have a lot of flags in the beginning and then - should 'settle down' once it has built up enough history. This is a typical characteristic of online machine learning - approaches which need some initial window of time before they can be useful. - - As this collector does most of the work in Python itself, you may want to try it out first on a test or development - system to get a sense of its performance characteristics on a node similar to where you would like to use it. - - On a development n1-standard-2 (2 vCPUs, 7.5 GB memory) vm running Ubuntu 18.04 LTS and not doing any work some of the - typical performance characteristics we saw from running this collector (with defaults) were: - - A runtime (`netdata.runtime_changefinder`) of ~30ms. - - Typically ~1% additional cpu usage. - - About ~85mb of ram (`apps.mem`) being continually used by the `python.d.plugin` under default configuration. - supported_platforms: - include: [] - exclude: [] - multi_instance: true - additional_permissions: - description: "" - default_behavior: - auto_detection: - description: "By default this collector will work over all `system.*` charts." - limits: - description: "" - performance_impact: - description: "" - setup: - prerequisites: - list: - - title: Python Requirements - description: | - This collector will only work with Python 3 and requires the packages below be installed. - - ```bash - # become netdata user - sudo su -s /bin/bash netdata - # install required packages for the netdata user - pip3 install --user numpy==1.19.5 changefinder==0.03 scipy==1.5.4 - ``` - - **Note**: if you need to tell Netdata to use Python 3 then you can pass the below command in the python plugin section - of your `netdata.conf` file. - - ```yaml - [ plugin:python.d ] - # update every = 1 - command options = -ppython3 - ``` - configuration: - file: - name: python.d/changefinder.conf - description: "" - options: - description: | - There are 2 sections: - - * Global variables - * One or more JOBS that can define multiple different instances to monitor. - - The following options can be defined globally: priority, penalty, autodetection_retry, update_every, but can also be defined per JOB to override the global values. - - Additionally, the following collapsed table contains all the options that can be configured inside a JOB definition. - - Every configuration JOB starts with a `job_name` value which will appear in the dashboard, unless a `name` parameter is specified. - folding: - title: "Config options" - enabled: true - list: - - name: charts_regex - description: what charts to pull data for - A regex like `system\..*|` or `system\..*|apps.cpu|apps.mem` etc. - default_value: "system\\..*" - required: true - - name: charts_to_exclude - description: | - charts to exclude, useful if you would like to exclude some specific charts. - note: should be a ',' separated string like 'chart.name,chart.name'. - default_value: "" - required: false - - name: mode - description: get ChangeFinder scores 'per_dim' or 'per_chart'. - default_value: "per_chart" - required: true - - name: cf_r - description: default parameters that can be passed to the changefinder library. - default_value: 0.5 - required: false - - name: cf_order - description: default parameters that can be passed to the changefinder library. - default_value: 1 - required: false - - name: cf_smooth - description: default parameters that can be passed to the changefinder library. - default_value: 15 - required: false - - name: cf_threshold - description: the percentile above which scores will be flagged. - default_value: 99 - required: false - - name: n_score_samples - description: the number of recent scores to use when calculating the percentile of the changefinder score. - default_value: 14400 - required: false - - name: show_scores - description: | - set to true if you also want to chart the percentile scores in addition to the flags. (mainly useful for debugging or if you want to dive deeper on how the scores are evolving over time) - default_value: false - required: false - examples: - folding: - enabled: true - title: "Config" - list: - - name: Default - description: Default configuration. - folding: - enabled: false - config: | - local: - name: 'local' - host: '127.0.0.1:19999' - charts_regex: 'system\..*' - charts_to_exclude: '' - mode: 'per_chart' - cf_r: 0.5 - cf_order: 1 - cf_smooth: 15 - cf_threshold: 99 - n_score_samples: 14400 - show_scores: false - troubleshooting: - problems: - list: - - name: "Debug Mode" - description: | - If you would like to log in as `netdata` user and run the collector in debug mode to see more detail. - - ```bash - # become netdata user - sudo su -s /bin/bash netdata - # run collector in debug using `nolock` option if netdata is already running the collector itself. - /usr/libexec/netdata/plugins.d/python.d.plugin changefinder debug trace nolock - ``` - - name: "Log Messages" - description: | - To see any relevant log messages you can use a command like below. - - ```bash - grep 'changefinder' /var/log/netdata/error.log - grep 'changefinder' /var/log/netdata/collector.log - ``` - alerts: [] - metrics: - folding: - title: Metrics - enabled: false - description: "" - availability: [] - scopes: - - name: global - description: "" - labels: [] - metrics: - - name: changefinder.scores - description: ChangeFinder - unit: "score" - chart_type: line - dimensions: - - name: a dimension per chart - - name: changefinder.flags - description: ChangeFinder - unit: "flag" - chart_type: stacked - dimensions: - - name: a dimension per chart diff --git a/src/collectors/python.d.plugin/dovecot/dovecot.chart.py b/src/collectors/python.d.plugin/dovecot/dovecot.chart.py deleted file mode 100644 index dfaef28b5..000000000 --- a/src/collectors/python.d.plugin/dovecot/dovecot.chart.py +++ /dev/null @@ -1,143 +0,0 @@ -# -*- coding: utf-8 -*- -# Description: dovecot netdata python.d module -# Author: Pawel Krupa (paulfantom) -# SPDX-License-Identifier: GPL-3.0-or-later - -from bases.FrameworkServices.SocketService import SocketService - -UNIX_SOCKET = '/var/run/dovecot/stats' - -ORDER = [ - 'sessions', - 'logins', - 'commands', - 'faults', - 'context_switches', - 'io', - 'net', - 'syscalls', - 'lookup', - 'cache', - 'auth', - 'auth_cache' -] - -CHARTS = { - 'sessions': { - 'options': [None, 'Dovecot Active Sessions', 'number', 'sessions', 'dovecot.sessions', 'line'], - 'lines': [ - ['num_connected_sessions', 'active sessions', 'absolute'] - ] - }, - 'logins': { - 'options': [None, 'Dovecot Logins', 'number', 'logins', 'dovecot.logins', 'line'], - 'lines': [ - ['num_logins', 'logins', 'absolute'] - ] - }, - 'commands': { - 'options': [None, 'Dovecot Commands', 'commands', 'commands', 'dovecot.commands', 'line'], - 'lines': [ - ['num_cmds', 'commands', 'absolute'] - ] - }, - 'faults': { - 'options': [None, 'Dovecot Page Faults', 'faults', 'page faults', 'dovecot.faults', 'line'], - 'lines': [ - ['min_faults', 'minor', 'absolute'], - ['maj_faults', 'major', 'absolute'] - ] - }, - 'context_switches': { - 'options': [None, 'Dovecot Context Switches', 'switches', 'context switches', 'dovecot.context_switches', - 'line'], - 'lines': [ - ['vol_cs', 'voluntary', 'absolute'], - ['invol_cs', 'involuntary', 'absolute'] - ] - }, - 'io': { - 'options': [None, 'Dovecot Disk I/O', 'KiB/s', 'disk', 'dovecot.io', 'area'], - 'lines': [ - ['disk_input', 'read', 'incremental', 1, 1024], - ['disk_output', 'write', 'incremental', -1, 1024] - ] - }, - 'net': { - 'options': [None, 'Dovecot Network Bandwidth', 'kilobits/s', 'network', 'dovecot.net', 'area'], - 'lines': [ - ['read_bytes', 'read', 'incremental', 8, 1000], - ['write_bytes', 'write', 'incremental', -8, 1000] - ] - }, - 'syscalls': { - 'options': [None, 'Dovecot Number of SysCalls', 'syscalls/s', 'system', 'dovecot.syscalls', 'line'], - 'lines': [ - ['read_count', 'read', 'incremental'], - ['write_count', 'write', 'incremental'] - ] - }, - 'lookup': { - 'options': [None, 'Dovecot Lookups', 'number/s', 'lookups', 'dovecot.lookup', 'stacked'], - 'lines': [ - ['mail_lookup_path', 'path', 'incremental'], - ['mail_lookup_attr', 'attr', 'incremental'] - ] - }, - 'cache': { - 'options': [None, 'Dovecot Cache Hits', 'hits/s', 'cache', 'dovecot.cache', 'line'], - 'lines': [ - ['mail_cache_hits', 'hits', 'incremental'] - ] - }, - 'auth': { - 'options': [None, 'Dovecot Authentications', 'attempts', 'logins', 'dovecot.auth', 'stacked'], - 'lines': [ - ['auth_successes', 'ok', 'absolute'], - ['auth_failures', 'failed', 'absolute'] - ] - }, - 'auth_cache': { - 'options': [None, 'Dovecot Authentication Cache', 'number', 'cache', 'dovecot.auth_cache', 'stacked'], - 'lines': [ - ['auth_cache_hits', 'hit', 'absolute'], - ['auth_cache_misses', 'miss', 'absolute'] - ] - } -} - - -class Service(SocketService): - def __init__(self, configuration=None, name=None): - SocketService.__init__(self, configuration=configuration, name=name) - self.order = ORDER - self.definitions = CHARTS - self.host = None # localhost - self.port = None # 24242 - self.unix_socket = UNIX_SOCKET - self.request = 'EXPORT\tglobal\r\n' - - def _get_data(self): - """ - Format data received from socket - :return: dict - """ - try: - raw = self._get_raw_data() - except (ValueError, AttributeError): - return None - - if raw is None: - self.debug('dovecot returned no data') - return None - - data = raw.split('\n')[:2] - desc = data[0].split('\t') - vals = data[1].split('\t') - ret = dict() - for i, _ in enumerate(desc): - try: - ret[str(desc[i])] = int(vals[i]) - except ValueError: - continue - return ret or None diff --git a/src/collectors/python.d.plugin/dovecot/dovecot.conf b/src/collectors/python.d.plugin/dovecot/dovecot.conf deleted file mode 100644 index 451dbc9ac..000000000 --- a/src/collectors/python.d.plugin/dovecot/dovecot.conf +++ /dev/null @@ -1,98 +0,0 @@ -# netdata python.d.plugin configuration for dovecot -# -# This file is in YaML format. Generally the format is: -# -# name: value -# -# There are 2 sections: -# - global variables -# - one or more JOBS -# -# JOBS allow you to collect values from multiple sources. -# Each source will have its own set of charts. -# -# JOB parameters have to be indented (using spaces only, example below). - -# ---------------------------------------------------------------------- -# Global Variables -# These variables set the defaults for all JOBs, however each JOB -# may define its own, overriding the defaults. - -# update_every sets the default data collection frequency. -# If unset, the python.d.plugin default is used. -# update_every: 1 - -# priority controls the order of charts at the netdata dashboard. -# Lower numbers move the charts towards the top of the page. -# If unset, the default for python.d.plugin is used. -# priority: 60000 - -# penalty indicates whether to apply penalty to update_every in case of failures. -# Penalty will increase every 5 failed updates in a row. Maximum penalty is 10 minutes. -# penalty: yes - -# autodetection_retry sets the job re-check interval in seconds. -# The job is not deleted if check fails. -# Attempts to start the job are made once every autodetection_retry. -# This feature is disabled by default. -# autodetection_retry: 0 - -# ---------------------------------------------------------------------- -# JOBS (data collection sources) -# -# The default JOBS share the same *name*. JOBS with the same name -# are mutually exclusive. Only one of them will be allowed running at -# any time. This allows autodetection to try several alternatives and -# pick the one that works. -# -# Any number of jobs is supported. -# -# All python.d.plugin JOBS (for all its modules) support a set of -# predefined parameters. These are: -# -# job_name: -# name: myname # the JOB's name as it will appear at the -# # dashboard (by default is the job_name) -# # JOBs sharing a name are mutually exclusive -# update_every: 1 # the JOB's data collection frequency -# priority: 60000 # the JOB's order on the dashboard -# penalty: yes # the JOB's penalty -# autodetection_retry: 0 # the JOB's re-check interval in seconds -# -# Additionally to the above, dovecot also supports the following: -# -# socket: 'path/to/dovecot/stats' -# -# or -# host: 'IP or HOSTNAME' # the host to connect to -# port: PORT # the port to connect to -# -# - -# ---------------------------------------------------------------------- -# AUTO-DETECTION JOBS -# only one of them will run (they have the same name) - -localhost: - name : 'local' - host : 'localhost' - port : 24242 - -localipv4: - name : 'local' - host : '127.0.0.1' - port : 24242 - -localipv6: - name : 'local' - host : '::1' - port : 24242 - -localsocket: - name : 'local' - socket : '/var/run/dovecot/stats' - -localsocket_old: - name : 'local' - socket : '/var/run/dovecot/old-stats' - diff --git a/src/collectors/python.d.plugin/dovecot/integrations/dovecot.md b/src/collectors/python.d.plugin/dovecot/integrations/dovecot.md deleted file mode 100644 index aaf207e85..000000000 --- a/src/collectors/python.d.plugin/dovecot/integrations/dovecot.md +++ /dev/null @@ -1,197 +0,0 @@ -<!--startmeta -custom_edit_url: "https://github.com/netdata/netdata/edit/master/src/collectors/python.d.plugin/dovecot/README.md" -meta_yaml: "https://github.com/netdata/netdata/edit/master/src/collectors/python.d.plugin/dovecot/metadata.yaml" -sidebar_label: "Dovecot" -learn_status: "Published" -learn_rel_path: "Collecting Metrics/Mail Servers" -most_popular: False -message: "DO NOT EDIT THIS FILE DIRECTLY, IT IS GENERATED BY THE COLLECTOR'S metadata.yaml FILE" -endmeta--> - -# Dovecot - - -<img src="https://netdata.cloud/img/dovecot.svg" width="150"/> - - -Plugin: python.d.plugin -Module: dovecot - -<img src="https://img.shields.io/badge/maintained%20by-Netdata-%2300ab44" /> - -## Overview - -This collector monitors Dovecot metrics about sessions, logins, commands, page faults and more. - -It uses the dovecot socket and executes the `EXPORT global` command to get the statistics. - -This collector is supported on all platforms. - -This collector supports collecting metrics from multiple instances of this integration, including remote instances. - - -### Default Behavior - -#### Auto-Detection - -If no configuration is given, the collector will attempt to connect to dovecot using unix socket localized in `/var/run/dovecot/stats` - -#### Limits - -The default configuration for this integration does not impose any limits on data collection. - -#### Performance Impact - -The default configuration for this integration is not expected to impose a significant performance impact on the system. - - -## Metrics - -Metrics grouped by *scope*. - -The scope defines the instance that the metric belongs to. An instance is uniquely identified by a set of labels. - - - -### Per Dovecot instance - -These metrics refer to the entire monitored application. - -This scope has no labels. - -Metrics: - -| Metric | Dimensions | Unit | -|:------|:----------|:----| -| dovecot.sessions | active sessions | number | -| dovecot.logins | logins | number | -| dovecot.commands | commands | commands | -| dovecot.faults | minor, major | faults | -| dovecot.context_switches | voluntary, involuntary | switches | -| dovecot.io | read, write | KiB/s | -| dovecot.net | read, write | kilobits/s | -| dovecot.syscalls | read, write | syscalls/s | -| dovecot.lookup | path, attr | number/s | -| dovecot.cache | hits | hits/s | -| dovecot.auth | ok, failed | attempts | -| dovecot.auth_cache | hit, miss | number | - - - -## Alerts - -There are no alerts configured by default for this integration. - - -## Setup - -### Prerequisites - -#### Dovecot configuration - -The Dovecot UNIX socket should have R/W permissions for user netdata, or Dovecot should be configured with a TCP/IP socket. - - -### Configuration - -#### File - -The configuration file name for this integration is `python.d/dovecot.conf`. - - -You can edit the configuration file using the `edit-config` script from the -Netdata [config directory](/docs/netdata-agent/configuration/README.md#the-netdata-config-directory). - -```bash -cd /etc/netdata 2>/dev/null || cd /opt/netdata/etc/netdata -sudo ./edit-config python.d/dovecot.conf -``` -#### Options - -There are 2 sections: - -* Global variables -* One or more JOBS that can define multiple different instances to monitor. - -The following options can be defined globally: priority, penalty, autodetection_retry, update_every, but can also be defined per JOB to override the global values. - -Additionally, the following collapsed table contains all the options that can be configured inside a JOB definition. - -Every configuration JOB starts with a `job_name` value which will appear in the dashboard, unless a `name` parameter is specified. - - -<details open><summary>Config options</summary> - -| Name | Description | Default | Required | -|:----|:-----------|:-------|:--------:| -| update_every | Sets the default data collection frequency. | 5 | no | -| priority | Controls the order of charts at the netdata dashboard. | 60000 | no | -| autodetection_retry | Sets the job re-check interval in seconds. | 0 | no | -| penalty | Indicates whether to apply penalty to update_every in case of failures. | yes | no | -| name | Job name. This value will overwrite the `job_name` value. JOBS with the same name are mutually exclusive. Only one of them will be allowed running at any time. This allows autodetection to try several alternatives and pick the one that works. | | no | -| socket | Use this socket to communicate with Devcot | /var/run/dovecot/stats | no | -| host | Instead of using a socket, you can point the collector to an ip for devcot statistics. | | no | -| port | Used in combination with host, configures the port devcot listens to. | | no | - -</details> - -#### Examples - -##### Local TCP - -A basic TCP configuration. - -<details open><summary>Config</summary> - -```yaml -localtcpip: - name: 'local' - host: '127.0.0.1' - port: 24242 - -``` -</details> - -##### Local socket - -A basic local socket configuration - -<details open><summary>Config</summary> - -```yaml -localsocket: - name: 'local' - socket: '/var/run/dovecot/stats' - -``` -</details> - - - -## Troubleshooting - -### Debug Mode - -To troubleshoot issues with the `dovecot` collector, run the `python.d.plugin` with the debug option enabled. The output -should give you clues as to why the collector isn't working. - -- Navigate to the `plugins.d` directory, usually at `/usr/libexec/netdata/plugins.d/`. If that's not the case on - your system, open `netdata.conf` and look for the `plugins` setting under `[directories]`. - - ```bash - cd /usr/libexec/netdata/plugins.d/ - ``` - -- Switch to the `netdata` user. - - ```bash - sudo -u netdata -s - ``` - -- Run the `python.d.plugin` to debug the collector: - - ```bash - ./python.d.plugin dovecot debug trace - ``` - - diff --git a/src/collectors/python.d.plugin/dovecot/metadata.yaml b/src/collectors/python.d.plugin/dovecot/metadata.yaml deleted file mode 100644 index b247da846..000000000 --- a/src/collectors/python.d.plugin/dovecot/metadata.yaml +++ /dev/null @@ -1,207 +0,0 @@ -plugin_name: python.d.plugin -modules: - - meta: - plugin_name: python.d.plugin - module_name: dovecot - monitored_instance: - name: Dovecot - link: 'https://www.dovecot.org/' - categories: - - data-collection.mail-servers - icon_filename: 'dovecot.svg' - related_resources: - integrations: - list: [] - info_provided_to_referring_integrations: - description: '' - keywords: - - dovecot - - imap - - mail - most_popular: false - overview: - data_collection: - metrics_description: 'This collector monitors Dovecot metrics about sessions, logins, commands, page faults and more.' - method_description: 'It uses the dovecot socket and executes the `EXPORT global` command to get the statistics.' - supported_platforms: - include: [] - exclude: [] - multi_instance: true - additional_permissions: - description: '' - default_behavior: - auto_detection: - description: 'If no configuration is given, the collector will attempt to connect to dovecot using unix socket localized in `/var/run/dovecot/stats`' - limits: - description: '' - performance_impact: - description: '' - setup: - prerequisites: - list: - - title: 'Dovecot configuration' - description: The Dovecot UNIX socket should have R/W permissions for user netdata, or Dovecot should be configured with a TCP/IP socket. - configuration: - file: - name: python.d/dovecot.conf - options: - description: | - There are 2 sections: - - * Global variables - * One or more JOBS that can define multiple different instances to monitor. - - The following options can be defined globally: priority, penalty, autodetection_retry, update_every, but can also be defined per JOB to override the global values. - - Additionally, the following collapsed table contains all the options that can be configured inside a JOB definition. - - Every configuration JOB starts with a `job_name` value which will appear in the dashboard, unless a `name` parameter is specified. - folding: - title: "Config options" - enabled: true - list: - - name: update_every - description: Sets the default data collection frequency. - default_value: 5 - required: false - - name: priority - description: Controls the order of charts at the netdata dashboard. - default_value: 60000 - required: false - - name: autodetection_retry - description: Sets the job re-check interval in seconds. - default_value: 0 - required: false - - name: penalty - description: Indicates whether to apply penalty to update_every in case of failures. - default_value: yes - required: false - - name: name - description: Job name. This value will overwrite the `job_name` value. JOBS with the same name are mutually exclusive. Only one of them will be allowed running at any time. This allows autodetection to try several alternatives and pick the one that works. - default_value: '' - required: false - - name: socket - description: Use this socket to communicate with Devcot - default_value: /var/run/dovecot/stats - required: false - - name: host - description: Instead of using a socket, you can point the collector to an ip for devcot statistics. - default_value: '' - required: false - - name: port - description: Used in combination with host, configures the port devcot listens to. - default_value: '' - required: false - examples: - folding: - enabled: true - title: "Config" - list: - - name: Local TCP - description: A basic TCP configuration. - config: | - localtcpip: - name: 'local' - host: '127.0.0.1' - port: 24242 - - name: Local socket - description: A basic local socket configuration - config: | - localsocket: - name: 'local' - socket: '/var/run/dovecot/stats' - troubleshooting: - problems: - list: [] - alerts: [] - metrics: - folding: - title: Metrics - enabled: false - description: "" - availability: [] - scopes: - - name: global - description: "These metrics refer to the entire monitored application." - labels: [] - metrics: - - name: dovecot.sessions - description: Dovecot Active Sessions - unit: "number" - chart_type: line - dimensions: - - name: active sessions - - name: dovecot.logins - description: Dovecot Logins - unit: "number" - chart_type: line - dimensions: - - name: logins - - name: dovecot.commands - description: Dovecot Commands - unit: "commands" - chart_type: line - dimensions: - - name: commands - - name: dovecot.faults - description: Dovecot Page Faults - unit: "faults" - chart_type: line - dimensions: - - name: minor - - name: major - - name: dovecot.context_switches - description: Dovecot Context Switches - unit: "switches" - chart_type: line - dimensions: - - name: voluntary - - name: involuntary - - name: dovecot.io - description: Dovecot Disk I/O - unit: "KiB/s" - chart_type: area - dimensions: - - name: read - - name: write - - name: dovecot.net - description: Dovecot Network Bandwidth - unit: "kilobits/s" - chart_type: area - dimensions: - - name: read - - name: write - - name: dovecot.syscalls - description: Dovecot Number of SysCalls - unit: "syscalls/s" - chart_type: line - dimensions: - - name: read - - name: write - - name: dovecot.lookup - description: Dovecot Lookups - unit: "number/s" - chart_type: stacked - dimensions: - - name: path - - name: attr - - name: dovecot.cache - description: Dovecot Cache Hits - unit: "hits/s" - chart_type: line - dimensions: - - name: hits - - name: dovecot.auth - description: Dovecot Authentications - unit: "attempts" - chart_type: stacked - dimensions: - - name: ok - - name: failed - - name: dovecot.auth_cache - description: Dovecot Authentication Cache - unit: "number" - chart_type: stacked - dimensions: - - name: hit - - name: miss diff --git a/src/collectors/python.d.plugin/example/README.md b/src/collectors/python.d.plugin/example/README.md deleted file mode 120000 index 55877a99a..000000000 --- a/src/collectors/python.d.plugin/example/README.md +++ /dev/null @@ -1 +0,0 @@ -integrations/example_collector.md
\ No newline at end of file diff --git a/src/collectors/python.d.plugin/example/example.chart.py b/src/collectors/python.d.plugin/example/example.chart.py deleted file mode 100644 index d6c0b6658..000000000 --- a/src/collectors/python.d.plugin/example/example.chart.py +++ /dev/null @@ -1,51 +0,0 @@ -# -*- coding: utf-8 -*- -# Description: example netdata python.d module -# Author: Put your name here (your github login) -# SPDX-License-Identifier: GPL-3.0-or-later - -from random import SystemRandom - -from bases.FrameworkServices.SimpleService import SimpleService - -priority = 90000 - -ORDER = [ - 'random', -] - -CHARTS = { - 'random': { - 'options': [None, 'A random number', 'random number', 'random', 'random', 'line'], - 'lines': [ - ['random1'] - ] - } -} - - -class Service(SimpleService): - def __init__(self, configuration=None, name=None): - SimpleService.__init__(self, configuration=configuration, name=name) - self.order = ORDER - self.definitions = CHARTS - self.random = SystemRandom() - self.num_lines = self.configuration.get('num_lines', 4) - self.lower = self.configuration.get('lower', 0) - self.upper = self.configuration.get('upper', 100) - - @staticmethod - def check(): - return True - - def get_data(self): - data = dict() - - for i in range(0, self.num_lines): - dimension_id = ''.join(['random', str(i)]) - - if dimension_id not in self.charts['random']: - self.charts['random'].add_dimension([dimension_id]) - - data[dimension_id] = self.random.randint(self.lower, self.upper) - - return data diff --git a/src/collectors/python.d.plugin/example/example.conf b/src/collectors/python.d.plugin/example/example.conf deleted file mode 100644 index 31261b840..000000000 --- a/src/collectors/python.d.plugin/example/example.conf +++ /dev/null @@ -1,87 +0,0 @@ -# netdata python.d.plugin configuration for example -# -# This file is in YaML format. Generally the format is: -# -# name: value -# -# There are 2 sections: -# - global variables -# - one or more JOBS -# -# JOBS allow you to collect values from multiple sources. -# Each source will have its own set of charts. -# -# JOB parameters have to be indented (using spaces only, example below). - -# ---------------------------------------------------------------------- -# Global Variables -# These variables set the defaults for all JOBs, however each JOB -# may define its own, overriding the defaults. - -# update_every sets the default data collection frequency. -# If unset, the python.d.plugin default is used. -# update_every: 1 - -# priority controls the order of charts at the netdata dashboard. -# Lower numbers move the charts towards the top of the page. -# If unset, the default for python.d.plugin is used. -# priority: 60000 - -# penalty indicates whether to apply penalty to update_every in case of failures. -# Penalty will increase every 5 failed updates in a row. Maximum penalty is 10 minutes. -# penalty: yes - -# autodetection_retry sets the job re-check interval in seconds. -# The job is not deleted if check fails. -# Attempts to start the job are made once every autodetection_retry. -# This feature is disabled by default. -# autodetection_retry: 0 - -# ---------------------------------------------------------------------- -# JOBS (data collection sources) -# -# The default JOBS share the same *name*. JOBS with the same name -# are mutually exclusive. Only one of them will be allowed running at -# any time. This allows autodetection to try several alternatives and -# pick the one that works. -# -# Any number of jobs is supported. -# -# All python.d.plugin JOBS (for all its modules) support a set of -# predefined parameters. These are: -# -# job_name: -# name: myname # the JOB's name as it will appear on the dashboard -# # dashboard (by default is the job_name) -# # JOBs sharing a name are mutually exclusive -# update_every: 1 # the JOB's data collection frequency -# priority: 60000 # the JOB's order on the dashboard -# penalty: yes # the JOB's penalty -# autodetection_retry: 0 # the JOB's re-check interval in seconds -# -# Additionally to the above, example also supports the following: -# -# num_lines: 4 # the number of lines to create -# lower: 0 # the lower bound of numbers to randomly sample from -# upper: 100 # the upper bound of numbers to randomly sample from -# -# ---------------------------------------------------------------------- -# AUTO-DETECTION JOBS - -four_lines: - name: "Four Lines" # the JOB's name as it will appear on the dashboard - update_every: 1 # the JOB's data collection frequency - priority: 60000 # the JOB's order on the dashboard - penalty: yes # the JOB's penalty - autodetection_retry: 0 # the JOB's re-check interval in seconds - num_lines: 4 # the number of lines to create - lower: 0 # the lower bound of numbers to randomly sample from - upper: 100 # the upper bound of numbers to randomly sample from - -# if you wanted to make another job to run in addition to the one above then -# you would just uncomment the job configuration below. -# two_lines: -# name: "Two Lines" # the JOB's name as it will appear on the dashboard -# num_lines: 2 # the number of lines to create -# lower: 50 # the lower bound of numbers to randomly sample from -# upper: 75 # the upper bound of numbers to randomly sample from diff --git a/src/collectors/python.d.plugin/example/integrations/example_collector.md b/src/collectors/python.d.plugin/example/integrations/example_collector.md deleted file mode 100644 index 03c0165b4..000000000 --- a/src/collectors/python.d.plugin/example/integrations/example_collector.md +++ /dev/null @@ -1,171 +0,0 @@ -<!--startmeta -custom_edit_url: "https://github.com/netdata/netdata/edit/master/src/collectors/python.d.plugin/example/README.md" -meta_yaml: "https://github.com/netdata/netdata/edit/master/src/collectors/python.d.plugin/example/metadata.yaml" -sidebar_label: "Example collector" -learn_status: "Published" -learn_rel_path: "Collecting Metrics/Other" -most_popular: False -message: "DO NOT EDIT THIS FILE DIRECTLY, IT IS GENERATED BY THE COLLECTOR'S metadata.yaml FILE" -endmeta--> - -# Example collector - -Plugin: python.d.plugin -Module: example - -<img src="https://img.shields.io/badge/maintained%20by-Netdata-%2300ab44" /> - -## Overview - -Example collector that generates some random numbers as metrics. - -If you want to write your own collector, read our [writing a new Python module](/src/collectors/python.d.plugin/README.md#how-to-write-a-new-module) tutorial. - - -The `get_data()` function uses `random.randint()` to generate a random number which will be collected as a metric. - - -This collector is supported on all platforms. - -This collector supports collecting metrics from multiple instances of this integration, including remote instances. - - -### Default Behavior - -#### Auto-Detection - -This integration doesn't support auto-detection. - -#### Limits - -The default configuration for this integration does not impose any limits on data collection. - -#### Performance Impact - -The default configuration for this integration is not expected to impose a significant performance impact on the system. - - -## Metrics - -Metrics grouped by *scope*. - -The scope defines the instance that the metric belongs to. An instance is uniquely identified by a set of labels. - - - -### Per Example collector instance - -These metrics refer to the entire monitored application. - - -This scope has no labels. - -Metrics: - -| Metric | Dimensions | Unit | -|:------|:----------|:----| -| example.random | random | number | - - - -## Alerts - -There are no alerts configured by default for this integration. - - -## Setup - -### Prerequisites - -No action required. - -### Configuration - -#### File - -The configuration file name for this integration is `python.d/example.conf`. - - -You can edit the configuration file using the `edit-config` script from the -Netdata [config directory](/docs/netdata-agent/configuration/README.md#the-netdata-config-directory). - -```bash -cd /etc/netdata 2>/dev/null || cd /opt/netdata/etc/netdata -sudo ./edit-config python.d/example.conf -``` -#### Options - -There are 2 sections: - -* Global variables -* One or more JOBS that can define multiple different instances to monitor. - -The following options can be defined globally: priority, penalty, autodetection_retry, update_every, but can also be defined per JOB to override the global values. - -Additionally, the following collapsed table contains all the options that can be configured inside a JOB definition. - -Every configuration JOB starts with a `job_name` value which will appear in the dashboard, unless a `name` parameter is specified. - - -<details open><summary>Config options</summary> - -| Name | Description | Default | Required | -|:----|:-----------|:-------|:--------:| -| num_lines | The number of lines to create. | 4 | no | -| lower | The lower bound of numbers to randomly sample from. | 0 | no | -| upper | The upper bound of numbers to randomly sample from. | 100 | no | -| update_every | Sets the default data collection frequency. | 1 | no | -| priority | Controls the order of charts at the netdata dashboard. | 60000 | no | -| autodetection_retry | Sets the job re-check interval in seconds. | 0 | no | -| penalty | Indicates whether to apply penalty to update_every in case of failures. | yes | no | -| name | Job name. This value will overwrite the `job_name` value. JOBS with the same name are mutually exclusive. Only one of them will be allowed running at any time. This allows autodetection to try several alternatives and pick the one that works. | | no | - -</details> - -#### Examples - -##### Basic - -A basic example configuration. - -```yaml -four_lines: - name: "Four Lines" - update_every: 1 - priority: 60000 - penalty: yes - autodetection_retry: 0 - num_lines: 4 - lower: 0 - upper: 100 - -``` - - -## Troubleshooting - -### Debug Mode - -To troubleshoot issues with the `example` collector, run the `python.d.plugin` with the debug option enabled. The output -should give you clues as to why the collector isn't working. - -- Navigate to the `plugins.d` directory, usually at `/usr/libexec/netdata/plugins.d/`. If that's not the case on - your system, open `netdata.conf` and look for the `plugins` setting under `[directories]`. - - ```bash - cd /usr/libexec/netdata/plugins.d/ - ``` - -- Switch to the `netdata` user. - - ```bash - sudo -u netdata -s - ``` - -- Run the `python.d.plugin` to debug the collector: - - ```bash - ./python.d.plugin example debug trace - ``` - - diff --git a/src/collectors/python.d.plugin/example/metadata.yaml b/src/collectors/python.d.plugin/example/metadata.yaml deleted file mode 100644 index 6b2401366..000000000 --- a/src/collectors/python.d.plugin/example/metadata.yaml +++ /dev/null @@ -1,138 +0,0 @@ -plugin_name: python.d.plugin -modules: - - meta: - plugin_name: python.d.plugin - module_name: example - monitored_instance: - name: Example collector - link: /src/collectors/python.d.plugin/example/README.md - categories: - - data-collection.other - icon_filename: "" - related_resources: - integrations: - list: [] - info_provided_to_referring_integrations: - description: "" - keywords: - - example - - netdata - - python - most_popular: false - overview: - data_collection: - metrics_description: | - Example collector that generates some random numbers as metrics. - - If you want to write your own collector, read our [writing a new Python module](/src/collectors/python.d.plugin/README.md#how-to-write-a-new-module) tutorial. - method_description: | - The `get_data()` function uses `random.randint()` to generate a random number which will be collected as a metric. - supported_platforms: - include: [] - exclude: [] - multi_instance: true - additional_permissions: - description: "" - default_behavior: - auto_detection: - description: "" - limits: - description: "" - performance_impact: - description: "" - setup: - prerequisites: - list: [] - configuration: - file: - name: python.d/example.conf - description: "" - options: - description: | - There are 2 sections: - - * Global variables - * One or more JOBS that can define multiple different instances to monitor. - - The following options can be defined globally: priority, penalty, autodetection_retry, update_every, but can also be defined per JOB to override the global values. - - Additionally, the following collapsed table contains all the options that can be configured inside a JOB definition. - - Every configuration JOB starts with a `job_name` value which will appear in the dashboard, unless a `name` parameter is specified. - folding: - title: Config options - enabled: true - list: - - name: num_lines - description: The number of lines to create. - default_value: 4 - required: false - - name: lower - description: The lower bound of numbers to randomly sample from. - default_value: 0 - required: false - - name: upper - description: The upper bound of numbers to randomly sample from. - default_value: 100 - required: false - - name: update_every - description: Sets the default data collection frequency. - default_value: 1 - required: false - - name: priority - description: Controls the order of charts at the netdata dashboard. - default_value: 60000 - required: false - - name: autodetection_retry - description: Sets the job re-check interval in seconds. - default_value: 0 - required: false - - name: penalty - description: Indicates whether to apply penalty to update_every in case of failures. - default_value: yes - required: false - - name: name - description: Job name. This value will overwrite the `job_name` value. JOBS with the same name are mutually exclusive. Only one of them will be allowed running at any time. This allows autodetection to try several alternatives and pick the one that works. - default_value: "" - required: false - examples: - folding: - enabled: true - title: Config - list: - - name: Basic - folding: - enabled: false - description: A basic example configuration. - config: | - four_lines: - name: "Four Lines" - update_every: 1 - priority: 60000 - penalty: yes - autodetection_retry: 0 - num_lines: 4 - lower: 0 - upper: 100 - troubleshooting: - problems: - list: [] - alerts: [] - metrics: - folding: - title: Metrics - enabled: false - description: "" - availability: [] - scopes: - - name: global - description: | - These metrics refer to the entire monitored application. - labels: [] - metrics: - - name: example.random - description: A random number - unit: number - chart_type: line - dimensions: - - name: random diff --git a/src/collectors/python.d.plugin/exim/exim.chart.py b/src/collectors/python.d.plugin/exim/exim.chart.py deleted file mode 100644 index 7238a1bea..000000000 --- a/src/collectors/python.d.plugin/exim/exim.chart.py +++ /dev/null @@ -1,39 +0,0 @@ -# -*- coding: utf-8 -*- -# Description: exim netdata python.d module -# Author: Pawel Krupa (paulfantom) -# SPDX-License-Identifier: GPL-3.0-or-later - -from bases.FrameworkServices.ExecutableService import ExecutableService - -EXIM_COMMAND = 'exim -bpc' - -ORDER = [ - 'qemails', -] - -CHARTS = { - 'qemails': { - 'options': [None, 'Exim Queue Emails', 'emails', 'queue', 'exim.qemails', 'line'], - 'lines': [ - ['emails', None, 'absolute'] - ] - } -} - - -class Service(ExecutableService): - def __init__(self, configuration=None, name=None): - ExecutableService.__init__(self, configuration=configuration, name=name) - self.order = ORDER - self.definitions = CHARTS - self.command = EXIM_COMMAND - - def _get_data(self): - """ - Format data received from shell command - :return: dict - """ - try: - return {'emails': int(self._get_raw_data()[0])} - except (ValueError, AttributeError): - return None diff --git a/src/collectors/python.d.plugin/exim/exim.conf b/src/collectors/python.d.plugin/exim/exim.conf deleted file mode 100644 index 3b7e65922..000000000 --- a/src/collectors/python.d.plugin/exim/exim.conf +++ /dev/null @@ -1,91 +0,0 @@ -# netdata python.d.plugin configuration for exim -# -# This file is in YaML format. Generally the format is: -# -# name: value -# -# There are 2 sections: -# - global variables -# - one or more JOBS -# -# JOBS allow you to collect values from multiple sources. -# Each source will have its own set of charts. -# -# JOB parameters have to be indented (using spaces only, example below). - -# ---------------------------------------------------------------------- -# Global Variables -# These variables set the defaults for all JOBs, however each JOB -# may define its own, overriding the defaults. - -# update_every sets the default data collection frequency. -# If unset, the python.d.plugin default is used. -# exim is slow, so once every 10 seconds -update_every: 10 - -# priority controls the order of charts at the netdata dashboard. -# Lower numbers move the charts towards the top of the page. -# If unset, the default for python.d.plugin is used. -# priority: 60000 - -# penalty indicates whether to apply penalty to update_every in case of failures. -# Penalty will increase every 5 failed updates in a row. Maximum penalty is 10 minutes. -# penalty: yes - -# autodetection_retry sets the job re-check interval in seconds. -# The job is not deleted if check fails. -# Attempts to start the job are made once every autodetection_retry. -# This feature is disabled by default. -# autodetection_retry: 0 - -# ---------------------------------------------------------------------- -# JOBS (data collection sources) -# -# The default JOBS share the same *name*. JOBS with the same name -# are mutually exclusive. Only one of them will be allowed running at -# any time. This allows autodetection to try several alternatives and -# pick the one that works. -# -# Any number of jobs is supported. -# -# All python.d.plugin JOBS (for all its modules) support a set of -# predefined parameters. These are: -# -# job_name: -# name: myname # the JOB's name as it will appear at the -# # dashboard (by default is the job_name) -# # JOBs sharing a name are mutually exclusive -# update_every: 1 # the JOB's data collection frequency -# priority: 60000 # the JOB's order on the dashboard -# penalty: yes # the JOB's penalty -# autodetection_retry: 0 # the JOB's re-check interval in seconds -# -# Additionally to the above, exim also supports the following: -# -# command: 'exim -bpc' # the command to run -# - -# ---------------------------------------------------------------------- -# REQUIRED exim CONFIGURATION -# -# netdata will query exim as user netdata. -# By default exim will refuse to respond. -# -# To allow querying exim as non-admin user, please set the following -# to your exim configuration: -# -# queue_list_requires_admin = false -# -# Your exim configuration should be in -# -# /etc/exim/exim4.conf -# or -# /etc/exim4/conf.d/main/000_local_options -# -# Please consult your distribution information to find the exact file. - -# ---------------------------------------------------------------------- -# AUTO-DETECTION JOBS - -local: - command: 'exim -bpc' diff --git a/src/collectors/python.d.plugin/exim/integrations/exim.md b/src/collectors/python.d.plugin/exim/integrations/exim.md deleted file mode 100644 index a64a5449b..000000000 --- a/src/collectors/python.d.plugin/exim/integrations/exim.md +++ /dev/null @@ -1,181 +0,0 @@ -<!--startmeta -custom_edit_url: "https://github.com/netdata/netdata/edit/master/src/collectors/python.d.plugin/exim/README.md" -meta_yaml: "https://github.com/netdata/netdata/edit/master/src/collectors/python.d.plugin/exim/metadata.yaml" -sidebar_label: "Exim" -learn_status: "Published" -learn_rel_path: "Collecting Metrics/Mail Servers" -most_popular: False -message: "DO NOT EDIT THIS FILE DIRECTLY, IT IS GENERATED BY THE COLLECTOR'S metadata.yaml FILE" -endmeta--> - -# Exim - - -<img src="https://netdata.cloud/img/exim.jpg" width="150"/> - - -Plugin: python.d.plugin -Module: exim - -<img src="https://img.shields.io/badge/maintained%20by-Netdata-%2300ab44" /> - -## Overview - -This collector monitors Exim mail queue. - -It uses the `exim` command line binary to get the statistics. - -This collector is supported on all platforms. - -This collector only supports collecting metrics from a single instance of this integration. - - -### Default Behavior - -#### Auto-Detection - -Assuming setup prerequisites are met, the collector will try to gather statistics using the method described above, even without any configuration. - -#### Limits - -The default configuration for this integration does not impose any limits on data collection. - -#### Performance Impact - -The default configuration for this integration is not expected to impose a significant performance impact on the system. - - -## Metrics - -Metrics grouped by *scope*. - -The scope defines the instance that the metric belongs to. An instance is uniquely identified by a set of labels. - - - -### Per Exim instance - -These metrics refer to the entire monitored application. - -This scope has no labels. - -Metrics: - -| Metric | Dimensions | Unit | -|:------|:----------|:----| -| exim.qemails | emails | emails | - - - -## Alerts - -There are no alerts configured by default for this integration. - - -## Setup - -### Prerequisites - -#### Exim configuration - local installation - -The module uses the `exim` binary, which can only be executed as root by default. We need to allow other users to `exim` binary. We solve that adding `queue_list_requires_admin` statement in exim configuration and set to `false`, because it is `true` by default. On many Linux distributions, the default location of `exim` configuration is in `/etc/exim.conf`. - -1. Edit the `exim` configuration with your preferred editor and add: -`queue_list_requires_admin = false` -2. Restart `exim` and Netdata - - -#### Exim configuration - WHM (CPanel) server - -On a WHM server, you can reconfigure `exim` over the WHM interface with the following steps. - -1. Login to WHM -2. Navigate to Service Configuration --> Exim Configuration Manager --> tab Advanced Editor -3. Scroll down to the button **Add additional configuration setting** and click on it. -4. In the new dropdown which will appear above we need to find and choose: -`queue_list_requires_admin` and set to `false` -5. Scroll to the end and click the **Save** button. - - - -### Configuration - -#### File - -The configuration file name for this integration is `python.d/exim.conf`. - - -You can edit the configuration file using the `edit-config` script from the -Netdata [config directory](/docs/netdata-agent/configuration/README.md#the-netdata-config-directory). - -```bash -cd /etc/netdata 2>/dev/null || cd /opt/netdata/etc/netdata -sudo ./edit-config python.d/exim.conf -``` -#### Options - -There are 2 sections: - -* Global variables -* One or more JOBS that can define multiple different instances to monitor. - -The following options can be defined globally: priority, penalty, autodetection_retry, update_every, but can also be defined per JOB to override the global values. - -Additionally, the following collapsed table contains all the options that can be configured inside a JOB definition. - -Every configuration JOB starts with a `job_name` value which will appear in the dashboard, unless a `name` parameter is specified. - - -<details open><summary>Config options</summary> - -| Name | Description | Default | Required | -|:----|:-----------|:-------|:--------:| -| update_every | Sets the default data collection frequency. | 5 | no | -| priority | Controls the order of charts at the netdata dashboard. | 60000 | no | -| autodetection_retry | Sets the job re-check interval in seconds. | 0 | no | -| penalty | Indicates whether to apply penalty to update_every in case of failures. | yes | no | -| name | Job name. This value will overwrite the `job_name` value. JOBS with the same name are mutually exclusive. Only one of them will be allowed running at any time. This allows autodetection to try several alternatives and pick the one that works. | | no | -| command | Path and command to the `exim` binary | exim -bpc | no | - -</details> - -#### Examples - -##### Local exim install - -A basic local exim install - -```yaml -local: - command: 'exim -bpc' - -``` - - -## Troubleshooting - -### Debug Mode - -To troubleshoot issues with the `exim` collector, run the `python.d.plugin` with the debug option enabled. The output -should give you clues as to why the collector isn't working. - -- Navigate to the `plugins.d` directory, usually at `/usr/libexec/netdata/plugins.d/`. If that's not the case on - your system, open `netdata.conf` and look for the `plugins` setting under `[directories]`. - - ```bash - cd /usr/libexec/netdata/plugins.d/ - ``` - -- Switch to the `netdata` user. - - ```bash - sudo -u netdata -s - ``` - -- Run the `python.d.plugin` to debug the collector: - - ```bash - ./python.d.plugin exim debug trace - ``` - - diff --git a/src/collectors/python.d.plugin/exim/metadata.yaml b/src/collectors/python.d.plugin/exim/metadata.yaml deleted file mode 100644 index a8be02d99..000000000 --- a/src/collectors/python.d.plugin/exim/metadata.yaml +++ /dev/null @@ -1,132 +0,0 @@ -plugin_name: python.d.plugin -modules: - - meta: - plugin_name: python.d.plugin - module_name: exim - monitored_instance: - name: Exim - link: "https://www.exim.org/" - categories: - - data-collection.mail-servers - icon_filename: "exim.jpg" - related_resources: - integrations: - list: [] - info_provided_to_referring_integrations: - description: "" - keywords: - - exim - - mail - - server - most_popular: false - overview: - data_collection: - metrics_description: "This collector monitors Exim mail queue." - method_description: "It uses the `exim` command line binary to get the statistics." - supported_platforms: - include: [] - exclude: [] - multi_instance: false - additional_permissions: - description: "" - default_behavior: - auto_detection: - description: "Assuming setup prerequisites are met, the collector will try to gather statistics using the method described above, even without any configuration." - limits: - description: "" - performance_impact: - description: "" - setup: - prerequisites: - list: - - title: "Exim configuration - local installation" - description: | - The module uses the `exim` binary, which can only be executed as root by default. We need to allow other users to `exim` binary. We solve that adding `queue_list_requires_admin` statement in exim configuration and set to `false`, because it is `true` by default. On many Linux distributions, the default location of `exim` configuration is in `/etc/exim.conf`. - - 1. Edit the `exim` configuration with your preferred editor and add: - `queue_list_requires_admin = false` - 2. Restart `exim` and Netdata - - title: "Exim configuration - WHM (CPanel) server" - description: | - On a WHM server, you can reconfigure `exim` over the WHM interface with the following steps. - - 1. Login to WHM - 2. Navigate to Service Configuration --> Exim Configuration Manager --> tab Advanced Editor - 3. Scroll down to the button **Add additional configuration setting** and click on it. - 4. In the new dropdown which will appear above we need to find and choose: - `queue_list_requires_admin` and set to `false` - 5. Scroll to the end and click the **Save** button. - configuration: - file: - name: python.d/exim.conf - options: - description: | - There are 2 sections: - - * Global variables - * One or more JOBS that can define multiple different instances to monitor. - - The following options can be defined globally: priority, penalty, autodetection_retry, update_every, but can also be defined per JOB to override the global values. - - Additionally, the following collapsed table contains all the options that can be configured inside a JOB definition. - - Every configuration JOB starts with a `job_name` value which will appear in the dashboard, unless a `name` parameter is specified. - folding: - title: "Config options" - enabled: true - list: - - name: update_every - description: Sets the default data collection frequency. - default_value: 5 - required: false - - name: priority - description: Controls the order of charts at the netdata dashboard. - default_value: 60000 - required: false - - name: autodetection_retry - description: Sets the job re-check interval in seconds. - default_value: 0 - required: false - - name: penalty - description: Indicates whether to apply penalty to update_every in case of failures. - default_value: yes - required: false - - name: name - description: Job name. This value will overwrite the `job_name` value. JOBS with the same name are mutually exclusive. Only one of them will be allowed running at any time. This allows autodetection to try several alternatives and pick the one that works. - default_value: "" - required: false - - name: command - description: Path and command to the `exim` binary - default_value: "exim -bpc" - required: false - examples: - folding: - enabled: false - title: "Config" - list: - - name: Local exim install - description: A basic local exim install - config: | - local: - command: 'exim -bpc' - troubleshooting: - problems: - list: [] - alerts: [] - metrics: - folding: - title: Metrics - enabled: false - description: "" - availability: [] - scopes: - - name: global - description: "These metrics refer to the entire monitored application." - labels: [] - metrics: - - name: exim.qemails - description: Exim Queue Emails - unit: "emails" - chart_type: line - dimensions: - - name: emails diff --git a/src/collectors/python.d.plugin/gearman/gearman.chart.py b/src/collectors/python.d.plugin/gearman/gearman.chart.py deleted file mode 100644 index 5e280a4d8..000000000 --- a/src/collectors/python.d.plugin/gearman/gearman.chart.py +++ /dev/null @@ -1,243 +0,0 @@ -# Description: dovecot netdata python.d module -# Author: Kyle Agronick (agronick) -# SPDX-License-Identifier: GPL-3.0+ - -# Gearman Netdata Plugin - -from copy import deepcopy - -from bases.FrameworkServices.SocketService import SocketService - -CHARTS = { - 'total_workers': { - 'options': [None, 'Total Jobs', 'Jobs', 'Total Jobs', 'gearman.total_jobs', 'line'], - 'lines': [ - ['total_pending', 'Pending', 'absolute'], - ['total_running', 'Running', 'absolute'], - ] - }, -} - - -def job_chart_template(job_name): - return { - 'options': [None, job_name, 'Jobs', 'Activity by Job', 'gearman.single_job', 'stacked'], - 'lines': [ - ['{0}_pending'.format(job_name), 'Pending', 'absolute'], - ['{0}_idle'.format(job_name), 'Idle', 'absolute'], - ['{0}_running'.format(job_name), 'Running', 'absolute'], - ] - } - - -def build_result_dict(job): - """ - Get the status for each job - :return: dict - """ - - total, running, available = job['metrics'] - - idle = available - running - pending = total - running - - return { - '{0}_pending'.format(job['job_name']): pending, - '{0}_idle'.format(job['job_name']): idle, - '{0}_running'.format(job['job_name']): running, - } - - -def parse_worker_data(job): - job_name = job[0] - job_metrics = job[1:] - - return { - 'job_name': job_name, - 'metrics': job_metrics, - } - - -class GearmanReadException(BaseException): - pass - - -class Service(SocketService): - def __init__(self, configuration=None, name=None): - super(Service, self).__init__(configuration=configuration, name=name) - self.request = "status\n" - self._keep_alive = True - - self.host = self.configuration.get('host', 'localhost') - self.port = self.configuration.get('port', 4730) - - self.tls = self.configuration.get('tls', False) - self.cert = self.configuration.get('cert', None) - self.key = self.configuration.get('key', None) - - self.active_jobs = set() - self.definitions = deepcopy(CHARTS) - self.order = ['total_workers'] - - def _get_data(self): - """ - Format data received from socket - :return: dict - """ - - try: - active_jobs = self.get_active_jobs() - except GearmanReadException: - return None - - found_jobs, job_data = self.process_jobs(active_jobs) - self.remove_stale_jobs(found_jobs) - return job_data - - def get_active_jobs(self): - active_jobs = [] - - for job in self.get_worker_data(): - parsed_job = parse_worker_data(job) - - # Gearman does not clean up old jobs - # We only care about jobs that have - # some relevant data - if not any(parsed_job['metrics']): - continue - - active_jobs.append(parsed_job) - - return active_jobs - - def get_worker_data(self): - """ - Split the data returned from Gearman - into a list of lists - - This returns the same output that you - would get from a gearadmin --status - command. - - Example output returned from - _get_raw_data(): - prefix generic_worker4 78 78 500 - generic_worker2 78 78 500 - generic_worker3 0 0 760 - generic_worker1 0 0 500 - - :return: list - """ - - try: - raw = self._get_raw_data() - except (ValueError, AttributeError): - raise GearmanReadException() - - if raw is None: - self.debug("Gearman returned no data") - raise GearmanReadException() - - workers = list() - - for line in raw.splitlines()[:-1]: - parts = line.split() - if not parts: - continue - - name = '_'.join(parts[:-3]) - try: - values = [int(w) for w in parts[-3:]] - except ValueError: - continue - - w = [name] - w.extend(values) - workers.append(w) - - return workers - - def process_jobs(self, active_jobs): - - output = { - 'total_pending': 0, - 'total_idle': 0, - 'total_running': 0, - } - found_jobs = set() - - for parsed_job in active_jobs: - - job_name = self.add_job(parsed_job) - found_jobs.add(job_name) - job_data = build_result_dict(parsed_job) - - for sum_value in ('pending', 'running', 'idle'): - output['total_{0}'.format(sum_value)] += job_data['{0}_{1}'.format(job_name, sum_value)] - - output.update(job_data) - - return found_jobs, output - - def remove_stale_jobs(self, active_job_list): - """ - Removes jobs that have no workers, pending jobs, - or running jobs - :param active_job_list: The latest list of active jobs - :type active_job_list: iterable - :return: None - """ - - for to_remove in self.active_jobs - active_job_list: - self.remove_job(to_remove) - - def add_job(self, parsed_job): - """ - Adds a job to the list of active jobs - :param parsed_job: A parsed job dict - :type parsed_job: dict - :return: None - """ - - def add_chart(job_name): - """ - Adds a new job chart - :param job_name: The name of the job to add - :type job_name: string - :return: None - """ - - job_key = 'job_{0}'.format(job_name) - template = job_chart_template(job_name) - new_chart = self.charts.add_chart([job_key] + template['options']) - for dimension in template['lines']: - new_chart.add_dimension(dimension) - - if parsed_job['job_name'] not in self.active_jobs: - add_chart(parsed_job['job_name']) - self.active_jobs.add(parsed_job['job_name']) - - return parsed_job['job_name'] - - def remove_job(self, job_name): - """ - Removes a job to the list of active jobs - :param job_name: The name of the job to remove - :type job_name: string - :return: None - """ - - def remove_chart(job_name): - """ - Removes a job chart - :param job_name: The name of the job to remove - :type job_name: string - :return: None - """ - - job_key = 'job_{0}'.format(job_name) - self.charts[job_key].obsolete() - del self.charts[job_key] - - remove_chart(job_name) - self.active_jobs.remove(job_name) diff --git a/src/collectors/python.d.plugin/gearman/gearman.conf b/src/collectors/python.d.plugin/gearman/gearman.conf deleted file mode 100644 index 635e893ef..000000000 --- a/src/collectors/python.d.plugin/gearman/gearman.conf +++ /dev/null @@ -1,75 +0,0 @@ -# netdata python.d.plugin configuration for gearman -# -# This file is in YaML format. Generally the format is: -# -# name: value -# -# There are 2 sections: -# - global variables -# - one or more JOBS -# -# JOBS allow you to collect values from multiple sources. -# Each source will have its own set of charts. -# -# JOB parameters have to be indented (using spaces only, example below). - -# ---------------------------------------------------------------------- -# Global Variables -# These variables set the defaults for all JOBs, however each JOB -# may define its own, overriding the defaults. - -# update_every sets the default data collection frequency. -# If unset, the python.d.plugin default is used. -# update_every: 1 - -# priority controls the order of charts at the netdata dashboard. -# Lower numbers move the charts towards the top of the page. -# If unset, the default for python.d.plugin is used. -# priority: 60000 - -# penalty indicates whether to apply penalty to update_every in case of failures. -# Penalty will increase every 5 failed updates in a row. Maximum penalty is 10 minutes. -# penalty: yes - -# autodetection_retry sets the job re-check interval in seconds. -# The job is not deleted if check fails. -# Attempts to start the job are made once every autodetection_retry. -# This feature is disabled by default. -# autodetection_retry: 0 - -# ---------------------------------------------------------------------- -# JOBS (data collection sources) -# -# The default JOBS share the same *name*. JOBS with the same name -# are mutually exclusive. Only one of them will be allowed running at -# any time. This allows autodetection to try several alternatives and -# pick the one that works. -# -# Any number of jobs is supported. -# -# All python.d.plugin JOBS (for all its modules) support a set of -# predefined parameters. These are: -# -# job_name: -# name: myname # the JOB's name as it will appear at the -# # dashboard (by default is the job_name) -# # JOBs sharing a name are mutually exclusive -# update_every: 1 # the JOB's data collection frequency -# priority: 60000 # the JOB's order on the dashboard -# penalty: yes # the JOB's penalty -# autodetection_retry: 0 # the JOB's re-check interval in seconds -# -# Additionally to the above, gearman also supports the following: -# -# host: localhost # The host running the Gearman server -# port: 4730 # Port of the Gearman server -# tls: no # Whether to use TLS or not -# cert: /path/to/cert # Path to cert if using TLS -# key: /path/to/key # Path to key if using TLS -# ---------------------------------------------------------------------- -# AUTO-DETECTION JOB - -localhost: - name : 'local' - host : 'localhost' - port : 4730
\ No newline at end of file diff --git a/src/collectors/python.d.plugin/gearman/integrations/gearman.md b/src/collectors/python.d.plugin/gearman/integrations/gearman.md deleted file mode 100644 index 717b0dcad..000000000 --- a/src/collectors/python.d.plugin/gearman/integrations/gearman.md +++ /dev/null @@ -1,210 +0,0 @@ -<!--startmeta -custom_edit_url: "https://github.com/netdata/netdata/edit/master/src/collectors/python.d.plugin/gearman/README.md" -meta_yaml: "https://github.com/netdata/netdata/edit/master/src/collectors/python.d.plugin/gearman/metadata.yaml" -sidebar_label: "Gearman" -learn_status: "Published" -learn_rel_path: "Collecting Metrics/Distributed Computing Systems" -most_popular: False -message: "DO NOT EDIT THIS FILE DIRECTLY, IT IS GENERATED BY THE COLLECTOR'S metadata.yaml FILE" -endmeta--> - -# Gearman - - -<img src="https://netdata.cloud/img/gearman.png" width="150"/> - - -Plugin: python.d.plugin -Module: gearman - -<img src="https://img.shields.io/badge/maintained%20by-Netdata-%2300ab44" /> - -## Overview - -Monitor Gearman metrics for proficient system task distribution. Track job counts, worker statuses, and queue lengths for effective distributed task management. - -This collector connects to a Gearman instance via either TCP or unix socket. - -This collector is supported on all platforms. - -This collector supports collecting metrics from multiple instances of this integration, including remote instances. - - -### Default Behavior - -#### Auto-Detection - -When no configuration file is found, the collector tries to connect to TCP/IP socket: localhost:4730. - -#### Limits - -The default configuration for this integration does not impose any limits on data collection. - -#### Performance Impact - -The default configuration for this integration is not expected to impose a significant performance impact on the system. - - -## Metrics - -Metrics grouped by *scope*. - -The scope defines the instance that the metric belongs to. An instance is uniquely identified by a set of labels. - - - -### Per Gearman instance - -These metrics refer to the entire monitored application. - -This scope has no labels. - -Metrics: - -| Metric | Dimensions | Unit | -|:------|:----------|:----| -| gearman.total_jobs | Pending, Running | Jobs | - -### Per gearman job - -Metrics related to Gearman jobs. Each job produces its own set of the following metrics. - -This scope has no labels. - -Metrics: - -| Metric | Dimensions | Unit | -|:------|:----------|:----| -| gearman.single_job | Pending, Idle, Runnning | Jobs | - - - -## Alerts - - -The following alerts are available: - -| Alert name | On metric | Description | -|:------------|:----------|:------------| -| [ gearman_workers_queued ](https://github.com/netdata/netdata/blob/master/src/health/health.d/gearman.conf) | gearman.single_job | average number of queued jobs over the last 10 minutes | - - -## Setup - -### Prerequisites - -#### Socket permissions - -The gearman UNIX socket should have read permission for user netdata. - - -### Configuration - -#### File - -The configuration file name for this integration is `python.d/gearman.conf`. - - -You can edit the configuration file using the `edit-config` script from the -Netdata [config directory](/docs/netdata-agent/configuration/README.md#the-netdata-config-directory). - -```bash -cd /etc/netdata 2>/dev/null || cd /opt/netdata/etc/netdata -sudo ./edit-config python.d/gearman.conf -``` -#### Options - -There are 2 sections: - -* Global variables -* One or more JOBS that can define multiple different instances to monitor. - -The following options can be defined globally: priority, penalty, autodetection_retry, update_every, but can also be defined per JOB to override the global values. - -Additionally, the following collapsed table contains all the options that can be configured inside a JOB definition. - -Every configuration JOB starts with a `job_name` value which will appear in the dashboard, unless a `name` parameter is specified. - - -<details open><summary>Config options</summary> - -| Name | Description | Default | Required | -|:----|:-----------|:-------|:--------:| -| update_every | Sets the default data collection frequency. | 5 | no | -| priority | Controls the order of charts at the netdata dashboard. | 60000 | no | -| autodetection_retry | Sets the job re-check interval in seconds. | 0 | no | -| penalty | Indicates whether to apply penalty to update_every in case of failures. | yes | no | -| name | Job name. This value will overwrite the `job_name` value. JOBS with the same name are mutually exclusive. Only one of them will be allowed running at any time. This allows autodetection to try several alternatives and pick the one that works. | | no | -| host | URL or IP where gearman is running. | localhost | no | -| port | Port of URL or IP where gearman is running. | 4730 | no | -| tls | Use tls to connect to gearman. | false | no | -| cert | Provide a certificate file if needed to connect to a TLS gearman instance. | | no | -| key | Provide a key file if needed to connect to a TLS gearman instance. | | no | - -</details> - -#### Examples - -##### Local gearman service - -A basic host and port gearman configuration for localhost. - -```yaml -localhost: - name: 'local' - host: 'localhost' - port: 4730 - -``` -##### Multi-instance - -> **Note**: When you define multiple jobs, their names must be unique. - -Collecting metrics from local and remote instances. - - -<details open><summary>Config</summary> - -```yaml -localhost: - name: 'local' - host: 'localhost' - port: 4730 - -remote: - name: 'remote' - host: '192.0.2.1' - port: 4730 - -``` -</details> - - - -## Troubleshooting - -### Debug Mode - -To troubleshoot issues with the `gearman` collector, run the `python.d.plugin` with the debug option enabled. The output -should give you clues as to why the collector isn't working. - -- Navigate to the `plugins.d` directory, usually at `/usr/libexec/netdata/plugins.d/`. If that's not the case on - your system, open `netdata.conf` and look for the `plugins` setting under `[directories]`. - - ```bash - cd /usr/libexec/netdata/plugins.d/ - ``` - -- Switch to the `netdata` user. - - ```bash - sudo -u netdata -s - ``` - -- Run the `python.d.plugin` to debug the collector: - - ```bash - ./python.d.plugin gearman debug trace - ``` - - diff --git a/src/collectors/python.d.plugin/gearman/metadata.yaml b/src/collectors/python.d.plugin/gearman/metadata.yaml deleted file mode 100644 index 4ab9c12ef..000000000 --- a/src/collectors/python.d.plugin/gearman/metadata.yaml +++ /dev/null @@ -1,168 +0,0 @@ -plugin_name: python.d.plugin -modules: - - meta: - plugin_name: python.d.plugin - module_name: gearman - monitored_instance: - name: Gearman - link: "http://gearman.org/" - categories: - - data-collection.distributed-computing-systems - icon_filename: "gearman.png" - related_resources: - integrations: - list: [] - info_provided_to_referring_integrations: - description: "" - keywords: - - gearman - - gearman job server - most_popular: false - overview: - data_collection: - metrics_description: "Monitor Gearman metrics for proficient system task distribution. Track job counts, worker statuses, and queue lengths for effective distributed task management." - method_description: "This collector connects to a Gearman instance via either TCP or unix socket." - supported_platforms: - include: [] - exclude: [] - multi_instance: true - additional_permissions: - description: "" - default_behavior: - auto_detection: - description: "When no configuration file is found, the collector tries to connect to TCP/IP socket: localhost:4730." - limits: - description: "" - performance_impact: - description: "" - setup: - prerequisites: - list: - - title: "Socket permissions" - description: The gearman UNIX socket should have read permission for user netdata. - configuration: - file: - name: python.d/gearman.conf - options: - description: | - There are 2 sections: - - * Global variables - * One or more JOBS that can define multiple different instances to monitor. - - The following options can be defined globally: priority, penalty, autodetection_retry, update_every, but can also be defined per JOB to override the global values. - - Additionally, the following collapsed table contains all the options that can be configured inside a JOB definition. - - Every configuration JOB starts with a `job_name` value which will appear in the dashboard, unless a `name` parameter is specified. - folding: - title: "Config options" - enabled: true - list: - - name: update_every - description: Sets the default data collection frequency. - default_value: 5 - required: false - - name: priority - description: Controls the order of charts at the netdata dashboard. - default_value: 60000 - required: false - - name: autodetection_retry - description: Sets the job re-check interval in seconds. - default_value: 0 - required: false - - name: penalty - description: Indicates whether to apply penalty to update_every in case of failures. - default_value: yes - required: false - - name: name - description: Job name. This value will overwrite the `job_name` value. JOBS with the same name are mutually exclusive. Only one of them will be allowed running at any time. This allows autodetection to try several alternatives and pick the one that works. - default_value: "" - required: false - - name: host - description: URL or IP where gearman is running. - default_value: "localhost" - required: false - - name: port - description: Port of URL or IP where gearman is running. - default_value: "4730" - required: false - - name: tls - description: Use tls to connect to gearman. - default_value: "false" - required: false - - name: cert - description: Provide a certificate file if needed to connect to a TLS gearman instance. - default_value: "" - required: false - - name: key - description: Provide a key file if needed to connect to a TLS gearman instance. - default_value: "" - required: false - examples: - folding: - enabled: true - title: "Config" - list: - - name: Local gearman service - description: A basic host and port gearman configuration for localhost. - folding: - enabled: false - config: | - localhost: - name: 'local' - host: 'localhost' - port: 4730 - - name: Multi-instance - description: | - > **Note**: When you define multiple jobs, their names must be unique. - - Collecting metrics from local and remote instances. - config: | - localhost: - name: 'local' - host: 'localhost' - port: 4730 - - remote: - name: 'remote' - host: '192.0.2.1' - port: 4730 - troubleshooting: - problems: - list: [] - alerts: - - name: gearman_workers_queued - link: https://github.com/netdata/netdata/blob/master/src/health/health.d/gearman.conf - metric: gearman.single_job - info: average number of queued jobs over the last 10 minutes - metrics: - folding: - title: Metrics - enabled: false - description: "" - availability: [] - scopes: - - name: global - description: "These metrics refer to the entire monitored application." - labels: [] - metrics: - - name: gearman.total_jobs - description: Total Jobs - unit: "Jobs" - chart_type: line - dimensions: - - name: Pending - - name: Running - - name: gearman job - description: "Metrics related to Gearman jobs. Each job produces its own set of the following metrics." - labels: [] - metrics: - - name: gearman.single_job - description: "{job_name}" - unit: "Jobs" - chart_type: stacked - dimensions: - - name: Pending - - name: Idle - - name: Runnning diff --git a/src/collectors/python.d.plugin/go_expvar/integrations/go_applications_expvar.md b/src/collectors/python.d.plugin/go_expvar/integrations/go_applications_expvar.md index cbe7f265f..8f086765e 100644 --- a/src/collectors/python.d.plugin/go_expvar/integrations/go_applications_expvar.md +++ b/src/collectors/python.d.plugin/go_expvar/integrations/go_applications_expvar.md @@ -310,6 +310,7 @@ app1: ### Debug Mode + To troubleshoot issues with the `go_expvar` collector, run the `python.d.plugin` with the debug option enabled. The output should give you clues as to why the collector isn't working. @@ -332,4 +333,37 @@ should give you clues as to why the collector isn't working. ./python.d.plugin go_expvar debug trace ``` +### Getting Logs + +If you're encountering problems with the `go_expvar` collector, follow these steps to retrieve logs and identify potential issues: + +- **Run the command** specific to your system (systemd, non-systemd, or Docker container). +- **Examine the output** for any warnings or error messages that might indicate issues. These messages should provide clues about the root cause of the problem. + +#### System with systemd + +Use the following command to view logs generated since the last Netdata service restart: + +```bash +journalctl _SYSTEMD_INVOCATION_ID="$(systemctl show --value --property=InvocationID netdata)" --namespace=netdata --grep go_expvar +``` + +#### System without systemd + +Locate the collector log file, typically at `/var/log/netdata/collector.log`, and use `grep` to filter for collector's name: + +```bash +grep go_expvar /var/log/netdata/collector.log +``` + +**Note**: This method shows logs from all restarts. Focus on the **latest entries** for troubleshooting current issues. + +#### Docker Container + +If your Netdata runs in a Docker container named "netdata" (replace if different), use this command: + +```bash +docker logs netdata 2>&1 | grep go_expvar +``` + diff --git a/src/collectors/python.d.plugin/haproxy/metadata.yaml b/src/collectors/python.d.plugin/haproxy/metadata.yaml index f389b066e..e748a294c 100644 --- a/src/collectors/python.d.plugin/haproxy/metadata.yaml +++ b/src/collectors/python.d.plugin/haproxy/metadata.yaml @@ -1,5 +1,5 @@ # This collector will not appear in documentation, as the go version is preferred, -# /src/go/collectors/go.d.plugin/modules/haproxy/README.md +# /src/go/plugin/go.d/modules/haproxy/README.md # # # meta: diff --git a/src/collectors/python.d.plugin/icecast/icecast.chart.py b/src/collectors/python.d.plugin/icecast/icecast.chart.py deleted file mode 100644 index a967d1779..000000000 --- a/src/collectors/python.d.plugin/icecast/icecast.chart.py +++ /dev/null @@ -1,94 +0,0 @@ -# -*- coding: utf-8 -*- -# Description: icecast netdata python.d module -# Author: Ilya Mashchenko (ilyam8) -# SPDX-License-Identifier: GPL-3.0-or-later - -import json - -from bases.FrameworkServices.UrlService import UrlService - -ORDER = [ - 'listeners', -] - -CHARTS = { - 'listeners': { - 'options': [None, 'Number Of Listeners', 'listeners', 'listeners', 'icecast.listeners', 'line'], - 'lines': [ - ] - } -} - - -class Source: - def __init__(self, idx, data): - self.name = 'source_{0}'.format(idx) - self.is_active = data.get('stream_start') and data.get('server_name') - self.listeners = data['listeners'] - - -class Service(UrlService): - def __init__(self, configuration=None, name=None): - UrlService.__init__(self, configuration=configuration, name=name) - self.order = ORDER - self.definitions = CHARTS - self.url = self.configuration.get('url') - self._manager = self._build_manager() - - def check(self): - """ - Add active sources to the "listeners" chart - :return: bool - """ - sources = self.get_sources() - if not sources: - return None - - active_sources = 0 - for idx, raw_source in enumerate(sources): - if Source(idx, raw_source).is_active: - active_sources += 1 - dim_id = 'source_{0}'.format(idx) - dim = 'source {0}'.format(idx) - self.definitions['listeners']['lines'].append([dim_id, dim]) - - return bool(active_sources) - - def _get_data(self): - """ - Get number of listeners for every source - :return: dict - """ - sources = self.get_sources() - if not sources: - return None - - data = dict() - - for idx, raw_source in enumerate(sources): - source = Source(idx, raw_source) - data[source.name] = source.listeners - - return data - - def get_sources(self): - """ - Format data received from http request and return list of sources - :return: list - """ - - raw_data = self._get_raw_data() - if not raw_data: - return None - - try: - data = json.loads(raw_data) - except ValueError as error: - self.error('JSON decode error:', error) - return None - - sources = data['icestats'].get('source') - if not sources: - return None - - return sources if isinstance(sources, list) else [sources] diff --git a/src/collectors/python.d.plugin/icecast/icecast.conf b/src/collectors/python.d.plugin/icecast/icecast.conf deleted file mode 100644 index a33074aef..000000000 --- a/src/collectors/python.d.plugin/icecast/icecast.conf +++ /dev/null @@ -1,81 +0,0 @@ -# netdata python.d.plugin configuration for icecast -# -# This file is in YaML format. Generally the format is: -# -# name: value -# -# There are 2 sections: -# - global variables -# - one or more JOBS -# -# JOBS allow you to collect values from multiple sources. -# Each source will have its own set of charts. -# -# JOB parameters have to be indented (using spaces only, example below). - -# ---------------------------------------------------------------------- -# Global Variables -# These variables set the defaults for all JOBs, however each JOB -# may define its own, overriding the defaults. - -# update_every sets the default data collection frequency. -# If unset, the python.d.plugin default is used. -# update_every: 1 - -# priority controls the order of charts at the netdata dashboard. -# Lower numbers move the charts towards the top of the page. -# If unset, the default for python.d.plugin is used. -# priority: 60000 - -# penalty indicates whether to apply penalty to update_every in case of failures. -# Penalty will increase every 5 failed updates in a row. Maximum penalty is 10 minutes. -# penalty: yes - -# autodetection_retry sets the job re-check interval in seconds. -# The job is not deleted if check fails. -# Attempts to start the job are made once every autodetection_retry. -# This feature is disabled by default. -# autodetection_retry: 0 - -# ---------------------------------------------------------------------- -# JOBS (data collection sources) -# -# The default JOBS share the same *name*. JOBS with the same name -# are mutually exclusive. Only one of them will be allowed running at -# any time. This allows autodetection to try several alternatives and -# pick the one that works. -# -# Any number of jobs is supported. -# -# All python.d.plugin JOBS (for all its modules) support a set of -# predefined parameters. These are: -# -# job_name: -# name: myname # the JOB's name as it will appear at the -# # dashboard (by default is the job_name) -# # JOBs sharing a name are mutually exclusive -# update_every: 1 # the JOB's data collection frequency -# priority: 60000 # the JOB's order on the dashboard -# penalty: yes # the JOB's penalty -# autodetection_retry: 0 # the JOB's re-check interval in seconds -# -# Additionally to the above, icecast also supports the following: -# -# url: 'URL' # the URL to fetch icecast's stats -# -# if the URL is password protected, the following are supported: -# -# user: 'username' -# pass: 'password' - -# ---------------------------------------------------------------------- -# AUTO-DETECTION JOBS -# only one of them will run (they have the same name) - -localhost: - name : 'local' - url : 'http://localhost:8443/status-json.xsl' - -localipv4: - name : 'local' - url : 'http://127.0.0.1:8443/status-json.xsl'
\ No newline at end of file diff --git a/src/collectors/python.d.plugin/icecast/integrations/icecast.md b/src/collectors/python.d.plugin/icecast/integrations/icecast.md deleted file mode 100644 index 17316b063..000000000 --- a/src/collectors/python.d.plugin/icecast/integrations/icecast.md +++ /dev/null @@ -1,166 +0,0 @@ -<!--startmeta -custom_edit_url: "https://github.com/netdata/netdata/edit/master/src/collectors/python.d.plugin/icecast/README.md" -meta_yaml: "https://github.com/netdata/netdata/edit/master/src/collectors/python.d.plugin/icecast/metadata.yaml" -sidebar_label: "Icecast" -learn_status: "Published" -learn_rel_path: "Collecting Metrics/Media Services" -most_popular: False -message: "DO NOT EDIT THIS FILE DIRECTLY, IT IS GENERATED BY THE COLLECTOR'S metadata.yaml FILE" -endmeta--> - -# Icecast - - -<img src="https://netdata.cloud/img/icecast.svg" width="150"/> - - -Plugin: python.d.plugin -Module: icecast - -<img src="https://img.shields.io/badge/maintained%20by-Netdata-%2300ab44" /> - -## Overview - -This collector monitors Icecast listener counts. - -It connects to an icecast URL and uses the `status-json.xsl` endpoint to retrieve statistics. - -This collector is supported on all platforms. - -This collector supports collecting metrics from multiple instances of this integration, including remote instances. - - -### Default Behavior - -#### Auto-Detection - -Without configuration, the collector attempts to connect to http://localhost:8443/status-json.xsl - -#### Limits - -The default configuration for this integration does not impose any limits on data collection. - -#### Performance Impact - -The default configuration for this integration is not expected to impose a significant performance impact on the system. - - -## Metrics - -Metrics grouped by *scope*. - -The scope defines the instance that the metric belongs to. An instance is uniquely identified by a set of labels. - - - -### Per Icecast instance - -These metrics refer to the entire monitored application. - -This scope has no labels. - -Metrics: - -| Metric | Dimensions | Unit | -|:------|:----------|:----| -| icecast.listeners | a dimension for each active source | listeners | - - - -## Alerts - -There are no alerts configured by default for this integration. - - -## Setup - -### Prerequisites - -#### Icecast minimum version - -Needs at least icecast version >= 2.4.0 - - -### Configuration - -#### File - -The configuration file name for this integration is `python.d/icecast.conf`. - - -You can edit the configuration file using the `edit-config` script from the -Netdata [config directory](/docs/netdata-agent/configuration/README.md#the-netdata-config-directory). - -```bash -cd /etc/netdata 2>/dev/null || cd /opt/netdata/etc/netdata -sudo ./edit-config python.d/icecast.conf -``` -#### Options - -There are 2 sections: - -* Global variables -* One or more JOBS that can define multiple different instances to monitor. - -The following options can be defined globally: priority, penalty, autodetection_retry, update_every, but can also be defined per JOB to override the global values. - -Additionally, the following collapsed table contains all the options that can be configured inside a JOB definition. - -Every configuration JOB starts with a `job_name` value which will appear in the dashboard, unless a `name` parameter is specified. - - -<details open><summary>Config options</summary> - -| Name | Description | Default | Required | -|:----|:-----------|:-------|:--------:| -| update_every | Sets the default data collection frequency. | 5 | no | -| priority | Controls the order of charts at the netdata dashboard. | 60000 | no | -| autodetection_retry | Sets the job re-check interval in seconds. | 0 | no | -| penalty | Indicates whether to apply penalty to update_every in case of failures. | yes | no | -| name | Job name. This value will overwrite the `job_name` value. JOBS with the same name are mutually exclusive. Only one of them will be allowed running at any time. This allows autodetection to try several alternatives and pick the one that works. | | no | -| url | The URL (and port) to the icecast server. Needs to also include `/status-json.xsl` | http://localhost:8443/status-json.xsl | no | -| user | Username to use to connect to `url` if it's password protected. | | no | -| pass | Password to use to connect to `url` if it's password protected. | | no | - -</details> - -#### Examples - -##### Remote Icecast server - -Configure a remote icecast server - -```yaml -remote: - url: 'http://1.2.3.4:8443/status-json.xsl' - -``` - - -## Troubleshooting - -### Debug Mode - -To troubleshoot issues with the `icecast` collector, run the `python.d.plugin` with the debug option enabled. The output -should give you clues as to why the collector isn't working. - -- Navigate to the `plugins.d` directory, usually at `/usr/libexec/netdata/plugins.d/`. If that's not the case on - your system, open `netdata.conf` and look for the `plugins` setting under `[directories]`. - - ```bash - cd /usr/libexec/netdata/plugins.d/ - ``` - -- Switch to the `netdata` user. - - ```bash - sudo -u netdata -s - ``` - -- Run the `python.d.plugin` to debug the collector: - - ```bash - ./python.d.plugin icecast debug trace - ``` - - diff --git a/src/collectors/python.d.plugin/icecast/metadata.yaml b/src/collectors/python.d.plugin/icecast/metadata.yaml deleted file mode 100644 index 4bcf5e39f..000000000 --- a/src/collectors/python.d.plugin/icecast/metadata.yaml +++ /dev/null @@ -1,127 +0,0 @@ -plugin_name: python.d.plugin -modules: - - meta: - plugin_name: python.d.plugin - module_name: icecast - monitored_instance: - name: Icecast - link: 'https://icecast.org/' - categories: - - data-collection.media-streaming-servers - icon_filename: 'icecast.svg' - related_resources: - integrations: - list: [] - info_provided_to_referring_integrations: - description: '' - keywords: - - icecast - - streaming - - media - most_popular: false - overview: - data_collection: - metrics_description: 'This collector monitors Icecast listener counts.' - method_description: 'It connects to an icecast URL and uses the `status-json.xsl` endpoint to retrieve statistics.' - supported_platforms: - include: [] - exclude: [] - multi_instance: true - additional_permissions: - description: '' - default_behavior: - auto_detection: - description: 'Without configuration, the collector attempts to connect to http://localhost:8443/status-json.xsl' - limits: - description: '' - performance_impact: - description: '' - setup: - prerequisites: - list: - - title: 'Icecast minimum version' - description: 'Needs at least icecast version >= 2.4.0' - configuration: - file: - name: python.d/icecast.conf - options: - description: | - There are 2 sections: - - * Global variables - * One or more JOBS that can define multiple different instances to monitor. - - The following options can be defined globally: priority, penalty, autodetection_retry, update_every, but can also be defined per JOB to override the global values. - - Additionally, the following collapsed table contains all the options that can be configured inside a JOB definition. - - Every configuration JOB starts with a `job_name` value which will appear in the dashboard, unless a `name` parameter is specified. - folding: - title: "Config options" - enabled: true - list: - - name: update_every - description: Sets the default data collection frequency. - default_value: 5 - required: false - - name: priority - description: Controls the order of charts at the netdata dashboard. - default_value: 60000 - required: false - - name: autodetection_retry - description: Sets the job re-check interval in seconds. - default_value: 0 - required: false - - name: penalty - description: Indicates whether to apply penalty to update_every in case of failures. - default_value: yes - required: false - - name: name - description: Job name. This value will overwrite the `job_name` value. JOBS with the same name are mutually exclusive. Only one of them will be allowed running at any time. This allows autodetection to try several alternatives and pick the one that works. - default_value: '' - required: false - - name: url - description: The URL (and port) to the icecast server. Needs to also include `/status-json.xsl` - default_value: 'http://localhost:8443/status-json.xsl' - required: false - - name: user - description: Username to use to connect to `url` if it's password protected. - default_value: '' - required: false - - name: pass - description: Password to use to connect to `url` if it's password protected. - default_value: '' - required: false - examples: - folding: - enabled: false - title: "Config" - list: - - name: Remote Icecast server - description: Configure a remote icecast server - folding: - enabled: false - config: | - remote: - url: 'http://1.2.3.4:8443/status-json.xsl' - troubleshooting: - problems: - list: [] - alerts: [] - metrics: - folding: - title: Metrics - enabled: false - description: "" - availability: [] - scopes: - - name: global - description: "These metrics refer to the entire monitored application." - labels: [] - metrics: - - name: icecast.listeners - description: Number Of Listeners - unit: "listeners" - chart_type: line - dimensions: - - name: a dimension for each active source diff --git a/src/collectors/python.d.plugin/ipfs/integrations/ipfs.md b/src/collectors/python.d.plugin/ipfs/integrations/ipfs.md deleted file mode 100644 index 71e8e28a5..000000000 --- a/src/collectors/python.d.plugin/ipfs/integrations/ipfs.md +++ /dev/null @@ -1,203 +0,0 @@ -<!--startmeta -custom_edit_url: "https://github.com/netdata/netdata/edit/master/src/collectors/python.d.plugin/ipfs/README.md" -meta_yaml: "https://github.com/netdata/netdata/edit/master/src/collectors/python.d.plugin/ipfs/metadata.yaml" -sidebar_label: "IPFS" -learn_status: "Published" -learn_rel_path: "Collecting Metrics/Storage, Mount Points and Filesystems" -most_popular: False -message: "DO NOT EDIT THIS FILE DIRECTLY, IT IS GENERATED BY THE COLLECTOR'S metadata.yaml FILE" -endmeta--> - -# IPFS - - -<img src="https://netdata.cloud/img/ipfs.svg" width="150"/> - - -Plugin: python.d.plugin -Module: ipfs - -<img src="https://img.shields.io/badge/maintained%20by-Netdata-%2300ab44" /> - -## Overview - -This collector monitors IPFS server metrics about its quality and performance. - -It connects to an http endpoint of the IPFS server to collect the metrics - -This collector is supported on all platforms. - -This collector supports collecting metrics from multiple instances of this integration, including remote instances. - - -### Default Behavior - -#### Auto-Detection - -If the endpoint is accessible by the Agent, netdata will autodetect it - -#### Limits - -Calls to the following endpoints are disabled due to IPFS bugs: - -/api/v0/stats/repo (https://github.com/ipfs/go-ipfs/issues/3874) -/api/v0/pin/ls (https://github.com/ipfs/go-ipfs/issues/7528) - - -#### Performance Impact - -The default configuration for this integration is not expected to impose a significant performance impact on the system. - - -## Metrics - -Metrics grouped by *scope*. - -The scope defines the instance that the metric belongs to. An instance is uniquely identified by a set of labels. - - - -### Per IPFS instance - -These metrics refer to the entire monitored application. - -This scope has no labels. - -Metrics: - -| Metric | Dimensions | Unit | -|:------|:----------|:----| -| ipfs.bandwidth | in, out | kilobits/s | -| ipfs.peers | peers | peers | -| ipfs.repo_size | avail, size | GiB | -| ipfs.repo_objects | objects, pinned, recursive_pins | objects | - - - -## Alerts - - -The following alerts are available: - -| Alert name | On metric | Description | -|:------------|:----------|:------------| -| [ ipfs_datastore_usage ](https://github.com/netdata/netdata/blob/master/src/health/health.d/ipfs.conf) | ipfs.repo_size | IPFS datastore utilization | - - -## Setup - -### Prerequisites - -No action required. - -### Configuration - -#### File - -The configuration file name for this integration is `python.d/ipfs.conf`. - - -You can edit the configuration file using the `edit-config` script from the -Netdata [config directory](/docs/netdata-agent/configuration/README.md#the-netdata-config-directory). - -```bash -cd /etc/netdata 2>/dev/null || cd /opt/netdata/etc/netdata -sudo ./edit-config python.d/ipfs.conf -``` -#### Options - -There are 2 sections: - -* Global variables -* One or more JOBS that can define multiple different instances to monitor. - -The following options can be defined globally: priority, penalty, autodetection_retry, update_every, but can also be defined per JOB to override the global values. - -Additionally, the following collapsed table contains all the options that can be configured inside a JOB definition. - -Every configuration JOB starts with a `job_name` value which will appear in the dashboard, unless a `name` parameter is specified. - - -<details open><summary></summary> - -| Name | Description | Default | Required | -|:----|:-----------|:-------|:--------:| -| update_every | Sets the default data collection frequency. | 5 | no | -| priority | Controls the order of charts at the netdata dashboard. | 60000 | no | -| autodetection_retry | Sets the job re-check interval in seconds. | 0 | no | -| penalty | Indicates whether to apply penalty to update_every in case of failures. | yes | no | -| name | The JOB's name as it will appear at the dashboard (by default is the job_name) | job_name | no | -| url | URL to the IPFS API | no | yes | -| repoapi | Collect repo metrics. | no | no | -| pinapi | Set status of IPFS pinned object polling. | no | no | - -</details> - -#### Examples - -##### Basic (default out-of-the-box) - -A basic example configuration, one job will run at a time. Autodetect mechanism uses it by default. - -```yaml -localhost: - name: 'local' - url: 'http://localhost:5001' - repoapi: no - pinapi: no - -``` -##### Multi-instance - -> **Note**: When you define multiple jobs, their names must be unique. - -Collecting metrics from local and remote instances. - - -<details open><summary>Config</summary> - -```yaml -localhost: - name: 'local' - url: 'http://localhost:5001' - repoapi: no - pinapi: no - -remote_host: - name: 'remote' - url: 'http://192.0.2.1:5001' - repoapi: no - pinapi: no - -``` -</details> - - - -## Troubleshooting - -### Debug Mode - -To troubleshoot issues with the `ipfs` collector, run the `python.d.plugin` with the debug option enabled. The output -should give you clues as to why the collector isn't working. - -- Navigate to the `plugins.d` directory, usually at `/usr/libexec/netdata/plugins.d/`. If that's not the case on - your system, open `netdata.conf` and look for the `plugins` setting under `[directories]`. - - ```bash - cd /usr/libexec/netdata/plugins.d/ - ``` - -- Switch to the `netdata` user. - - ```bash - sudo -u netdata -s - ``` - -- Run the `python.d.plugin` to debug the collector: - - ```bash - ./python.d.plugin ipfs debug trace - ``` - - diff --git a/src/collectors/python.d.plugin/ipfs/ipfs.chart.py b/src/collectors/python.d.plugin/ipfs/ipfs.chart.py deleted file mode 100644 index abfc9c492..000000000 --- a/src/collectors/python.d.plugin/ipfs/ipfs.chart.py +++ /dev/null @@ -1,149 +0,0 @@ -# -*- coding: utf-8 -*- -# Description: IPFS netdata python.d module -# Authors: davidak -# SPDX-License-Identifier: GPL-3.0-or-later - -import json - -from bases.FrameworkServices.UrlService import UrlService - -ORDER = [ - 'bandwidth', - 'peers', - 'repo_size', - 'repo_objects', -] - -CHARTS = { - 'bandwidth': { - 'options': [None, 'IPFS Bandwidth', 'kilobits/s', 'Bandwidth', 'ipfs.bandwidth', 'line'], - 'lines': [ - ['in', None, 'absolute', 8, 1000], - ['out', None, 'absolute', -8, 1000] - ] - }, - 'peers': { - 'options': [None, 'IPFS Peers', 'peers', 'Peers', 'ipfs.peers', 'line'], - 'lines': [ - ['peers', None, 'absolute'] - ] - }, - 'repo_size': { - 'options': [None, 'IPFS Repo Size', 'GiB', 'Size', 'ipfs.repo_size', 'area'], - 'lines': [ - ['avail', None, 'absolute', 1, 1 << 30], - ['size', None, 'absolute', 1, 1 << 30], - ] - }, - 'repo_objects': { - 'options': [None, 'IPFS Repo Objects', 'objects', 'Objects', 'ipfs.repo_objects', 'line'], - 'lines': [ - ['objects', None, 'absolute', 1, 1], - ['pinned', None, 'absolute', 1, 1], - ['recursive_pins', None, 'absolute', 1, 1] - ] - } -} - -SI_zeroes = { - 'k': 3, - 'm': 6, - 'g': 9, - 't': 12, - 'p': 15, - 'e': 18, - 'z': 21, - 'y': 24 -} - - -class Service(UrlService): - def __init__(self, configuration=None, name=None): - UrlService.__init__(self, configuration=configuration, name=name) - self.order = ORDER - self.definitions = CHARTS - self.baseurl = self.configuration.get('url', 'http://localhost:5001') - self.method = "POST" - self.do_pinapi = self.configuration.get('pinapi') - self.do_repoapi = self.configuration.get('repoapi') - self.__storage_max = None - - def _get_json(self, sub_url): - """ - :return: json decoding of the specified url - """ - self.url = self.baseurl + sub_url - try: - return json.loads(self._get_raw_data()) - except (TypeError, ValueError): - return dict() - - @staticmethod - def _recursive_pins(keys): - return sum(1 for k in keys if keys[k]['Type'] == b'recursive') - - @staticmethod - def _dehumanize(store_max): - # convert from '10Gb' to 10000000000 - if not isinstance(store_max, int): - store_max = store_max.lower() - if store_max.endswith('b'): - val, units = store_max[:-2], store_max[-2] - if units in SI_zeroes: - val += '0' * SI_zeroes[units] - store_max = val - try: - store_max = int(store_max) - except (TypeError, ValueError): - store_max = None - return store_max - - def _storagemax(self, store_cfg): - if self.__storage_max is None: - self.__storage_max = self._dehumanize(store_cfg) - return self.__storage_max - - def _get_data(self): - """ - Get data from API - :return: dict - """ - # suburl : List of (result-key, original-key, transform-func) - cfg = { - '/api/v0/stats/bw': - [ - ('in', 'RateIn', int), - ('out', 'RateOut', int), - ], - '/api/v0/swarm/peers': - [ - ('peers', 'Peers', len), - ], - } - if self.do_repoapi: - cfg.update({ - '/api/v0/stats/repo': - [ - ('size', 'RepoSize', int), - ('objects', 'NumObjects', int), - ('avail', 'StorageMax', self._storagemax), - ], - }) - - if self.do_pinapi: - cfg.update({ - '/api/v0/pin/ls': - [ - ('pinned', 'Keys', len), - ('recursive_pins', 'Keys', self._recursive_pins), - ] - }) - r = dict() - for suburl in cfg: - in_json = self._get_json(suburl) - for new_key, orig_key, xmute in cfg[suburl]: - try: - r[new_key] = xmute(in_json[orig_key]) - except Exception as error: - self.debug(error) - return r or None diff --git a/src/collectors/python.d.plugin/ipfs/ipfs.conf b/src/collectors/python.d.plugin/ipfs/ipfs.conf deleted file mode 100644 index 8b167b399..000000000 --- a/src/collectors/python.d.plugin/ipfs/ipfs.conf +++ /dev/null @@ -1,82 +0,0 @@ -# netdata python.d.plugin configuration for ipfs -# -# This file is in YaML format. Generally the format is: -# -# name: value -# -# There are 2 sections: -# - global variables -# - one or more JOBS -# -# JOBS allow you to collect values from multiple sources. -# Each source will have its own set of charts. -# -# JOB parameters have to be indented (using spaces only, example below). - -# ---------------------------------------------------------------------- -# Global Variables -# These variables set the defaults for all JOBs, however each JOB -# may define its own, overriding the defaults. - -# update_every sets the default data collection frequency. -# If unset, the python.d.plugin default is used. -# update_every: 1 - -# priority controls the order of charts at the netdata dashboard. -# Lower numbers move the charts towards the top of the page. -# If unset, the default for python.d.plugin is used. -# priority: 60000 - -# penalty indicates whether to apply penalty to update_every in case of failures. -# Penalty will increase every 5 failed updates in a row. Maximum penalty is 10 minutes. -# penalty: yes - -# autodetection_retry sets the job re-check interval in seconds. -# The job is not deleted if check fails. -# Attempts to start the job are made once every autodetection_retry. -# This feature is disabled by default. -# autodetection_retry: 0 - -# ---------------------------------------------------------------------- -# JOBS (data collection sources) -# -# The default JOBS share the same *name*. JOBS with the same name -# are mutually exclusive. Only one of them will be allowed running at -# any time. This allows autodetection to try several alternatives and -# pick the one that works. -# -# Any number of jobs is supported. -# -# All python.d.plugin JOBS (for all its modules) support a set of -# predefined parameters. These are: -# -# job_name: -# name: myname # the JOB's name as it will appear at the -# # dashboard (by default is the job_name) -# # JOBs sharing a name are mutually exclusive -# update_every: 1 # the JOB's data collection frequency -# priority: 60000 # the JOB's order on the dashboard -# penalty: yes # the JOB's penalty -# autodetection_retry: 0 # the JOB's re-check interval in seconds -# -# Additionally to the above, ipfs also supports the following: -# -# url: 'URL' # URL to the IPFS API -# repoapi: no # Collect repo metrics -# # Currently defaults to disabled due to IPFS Bug -# # https://github.com/ipfs/go-ipfs/issues/7528 -# # resulting in very high CPU Usage -# pinapi: no # Set status of IPFS pinned object polling -# # Currently defaults to disabled due to IPFS Bug -# # https://github.com/ipfs/go-ipfs/issues/3874 -# # resulting in very high CPU Usage -# -# ---------------------------------------------------------------------- -# AUTO-DETECTION JOBS -# only one of them will run (they have the same name) - -localhost: - name: 'local' - url: 'http://localhost:5001' - repoapi: no - pinapi: no diff --git a/src/collectors/python.d.plugin/ipfs/metadata.yaml b/src/collectors/python.d.plugin/ipfs/metadata.yaml deleted file mode 100644 index 55c39e31e..000000000 --- a/src/collectors/python.d.plugin/ipfs/metadata.yaml +++ /dev/null @@ -1,172 +0,0 @@ -plugin_name: python.d.plugin -modules: - - meta: - plugin_name: python.d.plugin - module_name: ipfs - monitored_instance: - name: IPFS - link: "https://ipfs.tech/" - categories: - - data-collection.storage-mount-points-and-filesystems - icon_filename: "ipfs.svg" - related_resources: - integrations: - list: [] - info_provided_to_referring_integrations: - description: "" - keywords: [] - most_popular: false - overview: - data_collection: - metrics_description: "This collector monitors IPFS server metrics about its quality and performance." - method_description: "It connects to an http endpoint of the IPFS server to collect the metrics" - supported_platforms: - include: [] - exclude: [] - multi_instance: true - additional_permissions: - description: "" - default_behavior: - auto_detection: - description: "If the endpoint is accessible by the Agent, netdata will autodetect it" - limits: - description: | - Calls to the following endpoints are disabled due to IPFS bugs: - - /api/v0/stats/repo (https://github.com/ipfs/go-ipfs/issues/3874) - /api/v0/pin/ls (https://github.com/ipfs/go-ipfs/issues/7528) - performance_impact: - description: "" - setup: - prerequisites: - list: [] - configuration: - file: - name: "python.d/ipfs.conf" - options: - description: | - There are 2 sections: - - * Global variables - * One or more JOBS that can define multiple different instances to monitor. - - The following options can be defined globally: priority, penalty, autodetection_retry, update_every, but can also be defined per JOB to override the global values. - - Additionally, the following collapsed table contains all the options that can be configured inside a JOB definition. - - Every configuration JOB starts with a `job_name` value which will appear in the dashboard, unless a `name` parameter is specified. - folding: - title: "" - enabled: true - list: - - name: update_every - description: Sets the default data collection frequency. - default_value: 5 - required: false - - name: priority - description: Controls the order of charts at the netdata dashboard. - default_value: 60000 - required: false - - name: autodetection_retry - description: Sets the job re-check interval in seconds. - default_value: 0 - required: false - - name: penalty - description: Indicates whether to apply penalty to update_every in case of failures. - default_value: yes - required: false - - name: name - description: The JOB's name as it will appear at the dashboard (by default is the job_name) - default_value: job_name - required: false - - name: url - description: URL to the IPFS API - default_value: no - required: true - - name: repoapi - description: Collect repo metrics. - default_value: no - required: false - - name: pinapi - description: Set status of IPFS pinned object polling. - default_value: no - required: false - examples: - folding: - enabled: true - title: "Config" - list: - - name: Basic (default out-of-the-box) - description: A basic example configuration, one job will run at a time. Autodetect mechanism uses it by default. - folding: - enabled: false - config: | - localhost: - name: 'local' - url: 'http://localhost:5001' - repoapi: no - pinapi: no - - name: Multi-instance - description: | - > **Note**: When you define multiple jobs, their names must be unique. - - Collecting metrics from local and remote instances. - config: | - localhost: - name: 'local' - url: 'http://localhost:5001' - repoapi: no - pinapi: no - - remote_host: - name: 'remote' - url: 'http://192.0.2.1:5001' - repoapi: no - pinapi: no - troubleshooting: - problems: - list: [] - alerts: - - name: ipfs_datastore_usage - link: https://github.com/netdata/netdata/blob/master/src/health/health.d/ipfs.conf - metric: ipfs.repo_size - info: IPFS datastore utilization - metrics: - folding: - title: Metrics - enabled: false - description: "" - availability: [] - scopes: - - name: global - description: "These metrics refer to the entire monitored application." - labels: [] - metrics: - - name: ipfs.bandwidth - description: IPFS Bandwidth - unit: "kilobits/s" - chart_type: line - dimensions: - - name: in - - name: out - - name: ipfs.peers - description: IPFS Peers - unit: "peers" - chart_type: line - dimensions: - - name: peers - - name: ipfs.repo_size - description: IPFS Repo Size - unit: "GiB" - chart_type: area - dimensions: - - name: avail - - name: size - - name: ipfs.repo_objects - description: IPFS Repo Objects - unit: "objects" - chart_type: line - dimensions: - - name: objects - - name: pinned - - name: recursive_pins diff --git a/src/collectors/python.d.plugin/memcached/memcached.chart.py b/src/collectors/python.d.plugin/memcached/memcached.chart.py deleted file mode 100644 index adb9560b7..000000000 --- a/src/collectors/python.d.plugin/memcached/memcached.chart.py +++ /dev/null @@ -1,197 +0,0 @@ -# -*- coding: utf-8 -*- -# Description: memcached netdata python.d module -# Author: Pawel Krupa (paulfantom) -# SPDX-License-Identifier: GPL-3.0-or-later - -from bases.FrameworkServices.SocketService import SocketService - -ORDER = [ - 'cache', - 'net', - 'connections', - 'items', - 'evicted_reclaimed', - 'get', - 'get_rate', - 'set_rate', - 'cas', - 'delete', - 'increment', - 'decrement', - 'touch', - 'touch_rate', -] - -CHARTS = { - 'cache': { - 'options': [None, 'Cache Size', 'MiB', 'cache', 'memcached.cache', 'stacked'], - 'lines': [ - ['avail', 'available', 'absolute', 1, 1 << 20], - ['used', 'used', 'absolute', 1, 1 << 20] - ] - }, - 'net': { - 'options': [None, 'Network', 'kilobits/s', 'network', 'memcached.net', 'area'], - 'lines': [ - ['bytes_read', 'in', 'incremental', 8, 1000], - ['bytes_written', 'out', 'incremental', -8, 1000], - ] - }, - 'connections': { - 'options': [None, 'Connections', 'connections/s', 'connections', 'memcached.connections', 'line'], - 'lines': [ - ['curr_connections', 'current', 'incremental'], - ['rejected_connections', 'rejected', 'incremental'], - ['total_connections', 'total', 'incremental'] - ] - }, - 'items': { - 'options': [None, 'Items', 'items', 'items', 'memcached.items', 'line'], - 'lines': [ - ['curr_items', 'current', 'absolute'], - ['total_items', 'total', 'absolute'] - ] - }, - 'evicted_reclaimed': { - 'options': [None, 'Evicted and Reclaimed Items', 'items', 'items', 'memcached.evicted_reclaimed', 'line'], - 'lines': [ - ['reclaimed', 'reclaimed', 'absolute'], - ['evictions', 'evicted', 'absolute'] - ] - }, - 'get': { - 'options': [None, 'Get Requests', 'requests', 'get ops', 'memcached.get', 'stacked'], - 'lines': [ - ['get_hits', 'hits', 'percent-of-absolute-row'], - ['get_misses', 'misses', 'percent-of-absolute-row'] - ] - }, - 'get_rate': { - 'options': [None, 'Get Request Rate', 'requests/s', 'get ops', 'memcached.get_rate', 'line'], - 'lines': [ - ['cmd_get', 'rate', 'incremental'] - ] - }, - 'set_rate': { - 'options': [None, 'Set Request Rate', 'requests/s', 'set ops', 'memcached.set_rate', 'line'], - 'lines': [ - ['cmd_set', 'rate', 'incremental'] - ] - }, - 'delete': { - 'options': [None, 'Delete Requests', 'requests', 'delete ops', 'memcached.delete', 'stacked'], - 'lines': [ - ['delete_hits', 'hits', 'percent-of-absolute-row'], - ['delete_misses', 'misses', 'percent-of-absolute-row'], - ] - }, - 'cas': { - 'options': [None, 'Check and Set Requests', 'requests', 'check and set ops', 'memcached.cas', 'stacked'], - 'lines': [ - ['cas_hits', 'hits', 'percent-of-absolute-row'], - ['cas_misses', 'misses', 'percent-of-absolute-row'], - ['cas_badval', 'bad value', 'percent-of-absolute-row'] - ] - }, - 'increment': { - 'options': [None, 'Increment Requests', 'requests', 'increment ops', 'memcached.increment', 'stacked'], - 'lines': [ - ['incr_hits', 'hits', 'percent-of-absolute-row'], - ['incr_misses', 'misses', 'percent-of-absolute-row'] - ] - }, - 'decrement': { - 'options': [None, 'Decrement Requests', 'requests', 'decrement ops', 'memcached.decrement', 'stacked'], - 'lines': [ - ['decr_hits', 'hits', 'percent-of-absolute-row'], - ['decr_misses', 'misses', 'percent-of-absolute-row'] - ] - }, - 'touch': { - 'options': [None, 'Touch Requests', 'requests', 'touch ops', 'memcached.touch', 'stacked'], - 'lines': [ - ['touch_hits', 'hits', 'percent-of-absolute-row'], - ['touch_misses', 'misses', 'percent-of-absolute-row'] - ] - }, - 'touch_rate': { - 'options': [None, 'Touch Request Rate', 'requests/s', 'touch ops', 'memcached.touch_rate', 'line'], - 'lines': [ - ['cmd_touch', 'rate', 'incremental'] - ] - } -} - - -class Service(SocketService): - def __init__(self, configuration=None, name=None): - SocketService.__init__(self, configuration=configuration, name=name) - self.order = ORDER - self.definitions = CHARTS - self.request = 'stats\r\n' - self.host = 'localhost' - self.port = 11211 - self._keep_alive = True - self.unix_socket = None - - def _get_data(self): - """ - Get data from socket - :return: dict - """ - response = self._get_raw_data() - if response is None: - # error has already been logged - return None - - if response.startswith('ERROR'): - self.error('received ERROR') - return None - - try: - parsed = response.split('\n') - except AttributeError: - self.error('response is invalid/empty') - return None - - # split the response - data = {} - for line in parsed: - if line.startswith('STAT'): - try: - t = line[5:].split(' ') - data[t[0]] = t[1] - except (IndexError, ValueError): - self.debug('invalid line received: ' + str(line)) - - if not data: - self.error("received data doesn't have any records") - return None - - # custom calculations - try: - data['avail'] = int(data['limit_maxbytes']) - int(data['bytes']) - data['used'] = int(data['bytes']) - except (KeyError, ValueError, TypeError): - pass - - return data - - def _check_raw_data(self, data): - if data.endswith('END\r\n'): - self.debug('received full response from memcached') - return True - - self.debug('waiting more data from memcached') - return False - - def check(self): - """ - Parse configuration, check if memcached is available - :return: boolean - """ - self._parse_config() - data = self._get_data() - if data is None: - return False - return True diff --git a/src/collectors/python.d.plugin/memcached/memcached.conf b/src/collectors/python.d.plugin/memcached/memcached.conf deleted file mode 100644 index 3286b4623..000000000 --- a/src/collectors/python.d.plugin/memcached/memcached.conf +++ /dev/null @@ -1,90 +0,0 @@ -# netdata python.d.plugin configuration for memcached -# -# This file is in YaML format. Generally the format is: -# -# name: value -# -# There are 2 sections: -# - global variables -# - one or more JOBS -# -# JOBS allow you to collect values from multiple sources. -# Each source will have its own set of charts. -# -# JOB parameters have to be indented (using spaces only, example below). - -# ---------------------------------------------------------------------- -# Global Variables -# These variables set the defaults for all JOBs, however each JOB -# may define its own, overriding the defaults. - -# update_every sets the default data collection frequency. -# If unset, the python.d.plugin default is used. -# update_every: 1 - -# priority controls the order of charts at the netdata dashboard. -# Lower numbers move the charts towards the top of the page. -# If unset, the default for python.d.plugin is used. -# priority: 60000 - -# penalty indicates whether to apply penalty to update_every in case of failures. -# Penalty will increase every 5 failed updates in a row. Maximum penalty is 10 minutes. -# penalty: yes - -# autodetection_retry sets the job re-check interval in seconds. -# The job is not deleted if check fails. -# Attempts to start the job are made once every autodetection_retry. -# This feature is disabled by default. -# autodetection_retry: 0 - -# ---------------------------------------------------------------------- -# JOBS (data collection sources) -# -# The default JOBS share the same *name*. JOBS with the same name -# are mutually exclusive. Only one of them will be allowed running at -# any time. This allows autodetection to try several alternatives and -# pick the one that works. -# -# Any number of jobs is supported. -# -# All python.d.plugin JOBS (for all its modules) support a set of -# predefined parameters. These are: -# -# job_name: -# name: myname # the JOB's name as it will appear at the -# # dashboard (by default is the job_name) -# # JOBs sharing a name are mutually exclusive -# update_every: 1 # the JOB's data collection frequency -# priority: 60000 # the JOB's order on the dashboard -# penalty: yes # the JOB's penalty -# autodetection_retry: 0 # the JOB's re-check interval in seconds -# -# Additionally to the above, memcached also supports the following: -# -# socket: 'path/to/memcached.sock' -# -# or -# host: 'IP or HOSTNAME' # the host to connect to -# port: PORT # the port to connect to -# -# - -# ---------------------------------------------------------------------- -# AUTO-DETECTION JOBS -# only one of them will run (they have the same name) - -localhost: - name : 'local' - host : 'localhost' - port : 11211 - -localipv4: - name : 'local' - host : '127.0.0.1' - port : 11211 - -localipv6: - name : 'local' - host : '::1' - port : 11211 - diff --git a/src/collectors/python.d.plugin/monit/integrations/monit.md b/src/collectors/python.d.plugin/monit/integrations/monit.md deleted file mode 100644 index d14d2a963..000000000 --- a/src/collectors/python.d.plugin/monit/integrations/monit.md +++ /dev/null @@ -1,214 +0,0 @@ -<!--startmeta -custom_edit_url: "https://github.com/netdata/netdata/edit/master/src/collectors/python.d.plugin/monit/README.md" -meta_yaml: "https://github.com/netdata/netdata/edit/master/src/collectors/python.d.plugin/monit/metadata.yaml" -sidebar_label: "Monit" -learn_status: "Published" -learn_rel_path: "Collecting Metrics/Synthetic Checks" -most_popular: False -message: "DO NOT EDIT THIS FILE DIRECTLY, IT IS GENERATED BY THE COLLECTOR'S metadata.yaml FILE" -endmeta--> - -# Monit - - -<img src="https://netdata.cloud/img/monit.png" width="150"/> - - -Plugin: python.d.plugin -Module: monit - -<img src="https://img.shields.io/badge/maintained%20by-Netdata-%2300ab44" /> - -## Overview - -This collector monitors Monit targets such as filesystems, directories, files, FIFO pipes and more. - - -It gathers data from Monit's XML interface. - - -This collector is supported on all platforms. - -This collector supports collecting metrics from multiple instances of this integration, including remote instances. - - -### Default Behavior - -#### Auto-Detection - -By default, this collector will attempt to connect to Monit at `http://localhost:2812` - -#### Limits - -The default configuration for this integration does not impose any limits on data collection. - -#### Performance Impact - -The default configuration for this integration is not expected to impose a significant performance impact on the system. - - -## Metrics - -Metrics grouped by *scope*. - -The scope defines the instance that the metric belongs to. An instance is uniquely identified by a set of labels. - - - -### Per Monit instance - -These metrics refer to the entire monitored application. - -This scope has no labels. - -Metrics: - -| Metric | Dimensions | Unit | -|:------|:----------|:----| -| monit.filesystems | a dimension per target | filesystems | -| monit.directories | a dimension per target | directories | -| monit.files | a dimension per target | files | -| monit.fifos | a dimension per target | pipes | -| monit.programs | a dimension per target | programs | -| monit.services | a dimension per target | processes | -| monit.process_uptime | a dimension per target | seconds | -| monit.process_threads | a dimension per target | threads | -| monit.process_childrens | a dimension per target | children | -| monit.hosts | a dimension per target | hosts | -| monit.host_latency | a dimension per target | milliseconds | -| monit.networks | a dimension per target | interfaces | - - - -## Alerts - -There are no alerts configured by default for this integration. - - -## Setup - -### Prerequisites - -No action required. - -### Configuration - -#### File - -The configuration file name for this integration is `python.d/monit.conf`. - - -You can edit the configuration file using the `edit-config` script from the -Netdata [config directory](/docs/netdata-agent/configuration/README.md#the-netdata-config-directory). - -```bash -cd /etc/netdata 2>/dev/null || cd /opt/netdata/etc/netdata -sudo ./edit-config python.d/monit.conf -``` -#### Options - -There are 2 sections: - -* Global variables -* One or more JOBS that can define multiple different instances to monitor. - -The following options can be defined globally: priority, penalty, autodetection_retry, update_every, but can also be defined per JOB to override the global values. - -Additionally, the following collapsed table contains all the options that can be configured inside a JOB definition. - -Every configuration JOB starts with a `job_name` value which will appear in the dashboard, unless a `name` parameter is specified. - - -<details open><summary>Config options</summary> - -| Name | Description | Default | Required | -|:----|:-----------|:-------|:--------:| -| update_every | Sets the default data collection frequency. | 1 | no | -| priority | Controls the order of charts at the netdata dashboard. | 60000 | no | -| autodetection_retry | Sets the job re-check interval in seconds. | 0 | no | -| penalty | Indicates whether to apply penalty to update_every in case of failures. | yes | no | -| name | Job name. This value will overwrite the `job_name` value. JOBS with the same name are mutually exclusive. Only one of them will be allowed running at any time. This allows autodetection to try several alternatives and pick the one that works. | local | no | -| url | The URL to fetch Monit's metrics. | http://localhost:2812 | yes | -| user | Username in case the URL is password protected. | | no | -| pass | Password in case the URL is password protected. | | no | - -</details> - -#### Examples - -##### Basic - -A basic configuration example. - -```yaml -localhost: - name : 'local' - url : 'http://localhost:2812' - -``` -##### Basic Authentication - -Example using basic username and password in order to authenticate. - -<details open><summary>Config</summary> - -```yaml -localhost: - name : 'local' - url : 'http://localhost:2812' - user: 'foo' - pass: 'bar' - -``` -</details> - -##### Multi-instance - -> **Note**: When you define multiple jobs, their names must be unique. - -Collecting metrics from local and remote instances. - - -<details open><summary>Config</summary> - -```yaml -localhost: - name: 'local' - url: 'http://localhost:2812' - -remote_job: - name: 'remote' - url: 'http://192.0.2.1:2812' - -``` -</details> - - - -## Troubleshooting - -### Debug Mode - -To troubleshoot issues with the `monit` collector, run the `python.d.plugin` with the debug option enabled. The output -should give you clues as to why the collector isn't working. - -- Navigate to the `plugins.d` directory, usually at `/usr/libexec/netdata/plugins.d/`. If that's not the case on - your system, open `netdata.conf` and look for the `plugins` setting under `[directories]`. - - ```bash - cd /usr/libexec/netdata/plugins.d/ - ``` - -- Switch to the `netdata` user. - - ```bash - sudo -u netdata -s - ``` - -- Run the `python.d.plugin` to debug the collector: - - ```bash - ./python.d.plugin monit debug trace - ``` - - diff --git a/src/collectors/python.d.plugin/monit/metadata.yaml b/src/collectors/python.d.plugin/monit/metadata.yaml deleted file mode 100644 index b51273188..000000000 --- a/src/collectors/python.d.plugin/monit/metadata.yaml +++ /dev/null @@ -1,217 +0,0 @@ -plugin_name: python.d.plugin -modules: - - meta: - plugin_name: python.d.plugin - module_name: monit - monitored_instance: - name: Monit - link: https://mmonit.com/monit/ - categories: - - data-collection.synthetic-checks - icon_filename: "monit.png" - related_resources: - integrations: - list: [] - info_provided_to_referring_integrations: - description: "" - keywords: - - monit - - mmonit - - supervision tool - - monitrc - most_popular: false - overview: - data_collection: - metrics_description: | - This collector monitors Monit targets such as filesystems, directories, files, FIFO pipes and more. - method_description: | - It gathers data from Monit's XML interface. - supported_platforms: - include: [] - exclude: [] - multi_instance: true - additional_permissions: - description: "" - default_behavior: - auto_detection: - description: By default, this collector will attempt to connect to Monit at `http://localhost:2812` - limits: - description: "" - performance_impact: - description: "" - setup: - prerequisites: - list: [] - configuration: - file: - name: "python.d/monit.conf" - options: - description: | - There are 2 sections: - - * Global variables - * One or more JOBS that can define multiple different instances to monitor. - - The following options can be defined globally: priority, penalty, autodetection_retry, update_every, but can also be defined per JOB to override the global values. - - Additionally, the following collapsed table contains all the options that can be configured inside a JOB definition. - - Every configuration JOB starts with a `job_name` value which will appear in the dashboard, unless a `name` parameter is specified. - folding: - title: "Config options" - enabled: true - list: - - name: update_every - description: Sets the default data collection frequency. - default_value: 1 - required: false - - name: priority - description: Controls the order of charts at the netdata dashboard. - default_value: 60000 - required: false - - name: autodetection_retry - description: Sets the job re-check interval in seconds. - default_value: 0 - required: false - - name: penalty - description: Indicates whether to apply penalty to update_every in case of failures. - default_value: yes - required: false - - name: name - description: > - Job name. This value will overwrite the `job_name` value. JOBS with the same name are mutually exclusive. Only one of them will be allowed running at any time. This allows autodetection to try several alternatives and pick the one that works. - default_value: "local" - required: false - - name: url - description: The URL to fetch Monit's metrics. - default_value: http://localhost:2812 - required: true - - name: user - description: Username in case the URL is password protected. - default_value: "" - required: false - - name: pass - description: Password in case the URL is password protected. - default_value: "" - required: false - examples: - folding: - enabled: true - title: "Config" - list: - - name: Basic - description: A basic configuration example. - folding: - enabled: false - config: | - localhost: - name : 'local' - url : 'http://localhost:2812' - - name: Basic Authentication - description: Example using basic username and password in order to authenticate. - config: | - localhost: - name : 'local' - url : 'http://localhost:2812' - user: 'foo' - pass: 'bar' - - name: Multi-instance - description: | - > **Note**: When you define multiple jobs, their names must be unique. - - Collecting metrics from local and remote instances. - config: | - localhost: - name: 'local' - url: 'http://localhost:2812' - - remote_job: - name: 'remote' - url: 'http://192.0.2.1:2812' - troubleshooting: - problems: - list: [] - alerts: [] - metrics: - folding: - title: Metrics - enabled: false - description: "" - availability: [] - scopes: - - name: global - description: "These metrics refer to the entire monitored application." - labels: [] - metrics: - - name: monit.filesystems - description: Filesystems - unit: "filesystems" - chart_type: line - dimensions: - - name: a dimension per target - - name: monit.directories - description: Directories - unit: "directories" - chart_type: line - dimensions: - - name: a dimension per target - - name: monit.files - description: Files - unit: "files" - chart_type: line - dimensions: - - name: a dimension per target - - name: monit.fifos - description: Pipes (fifo) - unit: "pipes" - chart_type: line - dimensions: - - name: a dimension per target - - name: monit.programs - description: Programs statuses - unit: "programs" - chart_type: line - dimensions: - - name: a dimension per target - - name: monit.services - description: Processes statuses - unit: "processes" - chart_type: line - dimensions: - - name: a dimension per target - - name: monit.process_uptime - description: Processes uptime - unit: "seconds" - chart_type: line - dimensions: - - name: a dimension per target - - name: monit.process_threads - description: Processes threads - unit: "threads" - chart_type: line - dimensions: - - name: a dimension per target - - name: monit.process_childrens - description: Child processes - unit: "children" - chart_type: line - dimensions: - - name: a dimension per target - - name: monit.hosts - description: Hosts - unit: "hosts" - chart_type: line - dimensions: - - name: a dimension per target - - name: monit.host_latency - description: Hosts latency - unit: "milliseconds" - chart_type: line - dimensions: - - name: a dimension per target - - name: monit.networks - description: Network interfaces and addresses - unit: "interfaces" - chart_type: line - dimensions: - - name: a dimension per target diff --git a/src/collectors/python.d.plugin/monit/monit.chart.py b/src/collectors/python.d.plugin/monit/monit.chart.py deleted file mode 100644 index 5d926961b..000000000 --- a/src/collectors/python.d.plugin/monit/monit.chart.py +++ /dev/null @@ -1,360 +0,0 @@ -# -*- coding: utf-8 -*- -# Description: monit netdata python.d module -# Author: Evgeniy K. (n0guest) -# SPDX-License-Identifier: GPL-3.0-or-later - -import xml.etree.ElementTree as ET -from collections import namedtuple - -from bases.FrameworkServices.UrlService import UrlService - -MonitType = namedtuple('MonitType', ('index', 'name')) - -# see enum Service_Type from monit.h (https://bitbucket.org/tildeslash/monit/src/master/src/monit.h) -# typedef enum { -# Service_Filesystem = 0, -# Service_Directory, -# Service_File, -# Service_Process, -# Service_Host, -# Service_System, -# Service_Fifo, -# Service_Program, -# Service_Net, -# Service_Last = Service_Net -# } __attribute__((__packed__)) Service_Type; - -TYPE_FILESYSTEM = MonitType(0, 'filesystem') -TYPE_DIRECTORY = MonitType(1, 'directory') -TYPE_FILE = MonitType(2, 'file') -TYPE_PROCESS = MonitType(3, 'process') -TYPE_HOST = MonitType(4, 'host') -TYPE_SYSTEM = MonitType(5, 'system') -TYPE_FIFO = MonitType(6, 'fifo') -TYPE_PROGRAM = MonitType(7, 'program') -TYPE_NET = MonitType(8, 'net') - -TYPES = ( - TYPE_FILESYSTEM, - TYPE_DIRECTORY, - TYPE_FILE, - TYPE_PROCESS, - TYPE_HOST, - TYPE_SYSTEM, - TYPE_FIFO, - TYPE_PROGRAM, - TYPE_NET, -) - -# charts order (can be overridden if you want less charts, or different order) -ORDER = [ - 'filesystem', - 'directory', - 'file', - 'process', - 'process_uptime', - 'process_threads', - 'process_children', - 'host', - 'host_latency', - 'system', - 'fifo', - 'program', - 'net' -] - -CHARTS = { - 'filesystem': { - 'options': ['filesystems', 'Filesystems', 'filesystems', 'filesystem', 'monit.filesystems', 'line'], - 'lines': [] - }, - 'directory': { - 'options': ['directories', 'Directories', 'directories', 'filesystem', 'monit.directories', 'line'], - 'lines': [] - }, - 'file': { - 'options': ['files', 'Files', 'files', 'filesystem', 'monit.files', 'line'], - 'lines': [] - }, - 'fifo': { - 'options': ['fifos', 'Pipes (fifo)', 'pipes', 'filesystem', 'monit.fifos', 'line'], - 'lines': [] - }, - 'program': { - 'options': ['programs', 'Programs statuses', 'programs', 'applications', 'monit.programs', 'line'], - 'lines': [] - }, - 'process': { - 'options': ['processes', 'Processes statuses', 'processes', 'applications', 'monit.services', 'line'], - 'lines': [] - }, - 'process_uptime': { - 'options': ['processes uptime', 'Processes uptime', 'seconds', 'applications', - 'monit.process_uptime', 'line', 'hidden'], - 'lines': [] - }, - 'process_threads': { - 'options': ['processes threads', 'Processes threads', 'threads', 'applications', - 'monit.process_threads', 'line'], - 'lines': [] - }, - 'process_children': { - 'options': ['processes childrens', 'Child processes', 'children', 'applications', - 'monit.process_childrens', 'line'], - 'lines': [] - }, - 'host': { - 'options': ['hosts', 'Hosts', 'hosts', 'network', 'monit.hosts', 'line'], - 'lines': [] - }, - 'host_latency': { - 'options': ['hosts latency', 'Hosts latency', 'milliseconds', 'network', 'monit.host_latency', 'line'], - 'lines': [] - }, - 'net': { - 'options': ['interfaces', 'Network interfaces and addresses', 'interfaces', 'network', - 'monit.networks', 'line'], - 'lines': [] - }, -} - - -class BaseMonitService(object): - def __init__(self, typ, name, status, monitor): - self.type = typ - self.name = name - self.status = status - self.monitor = monitor - - def __repr__(self): - return 'MonitService({0}:{1})'.format(self.type.name, self.name) - - def __eq__(self, other): - if not isinstance(other, BaseMonitService): - return False - return self.type == other.type and self.name == other.name - - def __ne__(self, other): - return not self == other - - def __hash__(self): - return hash(repr(self)) - - def is_running(self): - return self.status == '0' and self.monitor == '1' - - def key(self): - return '{0}_{1}'.format(self.type.name, self.name) - - def data(self): - return {self.key(): int(self.is_running())} - - -class ProcessMonitService(BaseMonitService): - def __init__(self, typ, name, status, monitor): - super(ProcessMonitService, self).__init__(typ, name, status, monitor) - self.uptime = None - self.threads = None - self.children = None - - def __eq__(self, other): - return super(ProcessMonitService, self).__eq__(other) - - def __ne__(self, other): - return super(ProcessMonitService, self).__ne__(other) - - def __hash__(self): - return super(ProcessMonitService, self).__hash__() - - def uptime_key(self): - return 'process_uptime_{0}'.format(self.name) - - def threads_key(self): - return 'process_threads_{0}'.format(self.name) - - def children_key(self): - return 'process_children_{0}'.format(self.name) - - def data(self): - base_data = super(ProcessMonitService, self).data() - # skipping bugged metrics with negative uptime (monit before v5.16) - uptime = self.uptime if self.uptime and int(self.uptime) >= 0 else None - data = { - self.uptime_key(): uptime, - self.threads_key(): self.threads, - self.children_key(): self.children, - } - data.update(base_data) - - return data - - -class HostMonitService(BaseMonitService): - def __init__(self, typ, name, status, monitor): - super(HostMonitService, self).__init__(typ, name, status, monitor) - self.latency = None - - def __eq__(self, other): - return super(HostMonitService, self).__eq__(other) - - def __ne__(self, other): - return super(HostMonitService, self).__ne__(other) - - def __hash__(self): - return super(HostMonitService, self).__hash__() - - def latency_key(self): - return 'host_latency_{0}'.format(self.name) - - def data(self): - base_data = super(HostMonitService, self).data() - latency = float(self.latency) * 1000000 if self.latency else None - data = {self.latency_key(): latency} - data.update(base_data) - - return data - - -class Service(UrlService): - def __init__(self, configuration=None, name=None): - UrlService.__init__(self, configuration=configuration, name=name) - self.order = ORDER - self.definitions = CHARTS - base_url = self.configuration.get('url', "http://localhost:2812") - self.url = '{0}/_status?format=xml&level=full'.format(base_url) - self.active_services = list() - - def parse(self, raw): - try: - root = ET.fromstring(raw) - except ET.ParseError: - self.error("URL {0} didn't return a valid XML page. Please check your settings.".format(self.url)) - return None - return root - - def _get_data(self): - raw = self._get_raw_data() - if not raw: - return None - - root = self.parse(raw) - if root is None: - return None - - services = self.get_services(root) - if not services: - return None - - if len(self.charts) > 0: - self.update_charts(services) - - data = dict() - - for svc in services: - data.update(svc.data()) - - return data - - def get_services(self, root): - services = list() - - for typ in TYPES: - if typ == TYPE_SYSTEM: - self.debug("skipping service from '{0}' category, it's useless in graphs".format(TYPE_SYSTEM.name)) - continue - - xpath_query = "./service[@type='{0}']".format(typ.index) - self.debug('Searching for {0} as {1}'.format(typ.name, xpath_query)) - - for svc_root in root.findall(xpath_query): - svc = create_service(svc_root, typ) - self.debug('=> found {0} with type={1}, status={2}, monitoring={3}'.format( - svc.name, svc.type.name, svc.status, svc.monitor)) - - services.append(svc) - - return services - - def update_charts(self, services): - remove = [svc for svc in self.active_services if svc not in services] - add = [svc for svc in services if svc not in self.active_services] - - self.remove_services_from_charts(remove) - self.add_services_to_charts(add) - - self.active_services = services - - def add_services_to_charts(self, services): - for svc in services: - if svc.type == TYPE_HOST: - self.charts['host_latency'].add_dimension([svc.latency_key(), svc.name, 'absolute', 1000, 1000000]) - if svc.type == TYPE_PROCESS: - self.charts['process_uptime'].add_dimension([svc.uptime_key(), svc.name]) - self.charts['process_threads'].add_dimension([svc.threads_key(), svc.name]) - self.charts['process_children'].add_dimension([svc.children_key(), svc.name]) - self.charts[svc.type.name].add_dimension([svc.key(), svc.name]) - - def remove_services_from_charts(self, services): - for svc in services: - if svc.type == TYPE_HOST: - self.charts['host_latency'].del_dimension(svc.latency_key(), False) - if svc.type == TYPE_PROCESS: - self.charts['process_uptime'].del_dimension(svc.uptime_key(), False) - self.charts['process_threads'].del_dimension(svc.threads_key(), False) - self.charts['process_children'].del_dimension(svc.children_key(), False) - self.charts[svc.type.name].del_dimension(svc.key(), False) - - -def create_service(root, typ): - if typ == TYPE_HOST: - return create_host_service(root) - elif typ == TYPE_PROCESS: - return create_process_service(root) - return create_base_service(root, typ) - - -def create_host_service(root): - svc = HostMonitService( - TYPE_HOST, - root.find('name').text, - root.find('status').text, - root.find('monitor').text, - ) - - latency = root.find('./icmp/responsetime') - if latency is not None: - svc.latency = latency.text - - return svc - - -def create_process_service(root): - svc = ProcessMonitService( - TYPE_PROCESS, - root.find('name').text, - root.find('status').text, - root.find('monitor').text, - ) - - uptime = root.find('uptime') - if uptime is not None: - svc.uptime = uptime.text - - threads = root.find('threads') - if threads is not None: - svc.threads = threads.text - - children = root.find('children') - if children is not None: - svc.children = children.text - - return svc - - -def create_base_service(root, typ): - return BaseMonitService( - typ, - root.find('name').text, - root.find('status').text, - root.find('monitor').text, - ) diff --git a/src/collectors/python.d.plugin/monit/monit.conf b/src/collectors/python.d.plugin/monit/monit.conf deleted file mode 100644 index 9a3fb6938..000000000 --- a/src/collectors/python.d.plugin/monit/monit.conf +++ /dev/null @@ -1,86 +0,0 @@ -# netdata python.d.plugin configuration for monit -# -# This file is in YaML format. Generally the format is: -# -# name: value -# -# There are 2 sections: -# - global variables -# - one or more JOBS -# -# JOBS allow you to collect values from multiple sources. -# Each source will have its own set of charts. -# -# JOB parameters have to be indented (using spaces only, example below). - -# ---------------------------------------------------------------------- -# Global Variables -# These variables set the defaults for all JOBs, however each JOB -# may define its own, overriding the defaults. - -# update_every sets the default data collection frequency. -# If unset, the python.d.plugin default is used. -# update_every: 1 - -# priority controls the order of charts at the netdata dashboard. -# Lower numbers move the charts towards the top of the page. -# If unset, the default for python.d.plugin is used. -# priority: 60000 - -# penalty indicates whether to apply penalty to update_every in case of failures. -# Penalty will increase every 5 failed updates in a row. Maximum penalty is 10 minutes. -# penalty: yes - -# autodetection_retry sets the job re-check interval in seconds. -# The job is not deleted if check fails. -# Attempts to start the job are made once every autodetection_retry. -# This feature is disabled by default. -# autodetection_retry: 0 - -# ---------------------------------------------------------------------- -# JOBS (data collection sources) -# -# The default JOBS share the same *name*. JOBS with the same name -# are mutually exclusive. Only one of them will be allowed running at -# any time. This allows autodetection to try several alternatives and -# pick the one that works. -# -# Any number of jobs is supported. -# -# All python.d.plugin JOBS (for all its modules) support a set of -# predefined parameters. These are: -# -# job_name: -# name: myname # the JOB's name as it will appear at the -# # dashboard (by default is the job_name) -# # JOBs sharing a name are mutually exclusive -# update_every: 1 # the JOB's data collection frequency -# priority: 60000 # the JOB's order on the dashboard -# penalty: yes # the JOB's penalty -# autodetection_retry: 0 # the JOB's re-check interval in seconds -# -# Additionally to the above, this plugin also supports the following: -# -# url: 'URL' # the URL to fetch monit's status stats -# -# if the URL is password protected, the following are supported: -# -# user: 'username' -# pass: 'password' -# -# Example -# -# local: -# name : 'Local Monit' -# url : 'http://localhost:2812' -# -# "local" will show up in Netdata logs. "Reverse Proxy" will show up in the menu -# in the monit section. - -# ---------------------------------------------------------------------- -# AUTO-DETECTION JOBS -# only one of them will run (they have the same name) - -localhost: - name : 'local' - url : 'http://localhost:2812' diff --git a/src/collectors/python.d.plugin/nsd/README.md b/src/collectors/python.d.plugin/nsd/README.md deleted file mode 120000 index 59fcfe491..000000000 --- a/src/collectors/python.d.plugin/nsd/README.md +++ /dev/null @@ -1 +0,0 @@ -integrations/name_server_daemon.md
\ No newline at end of file diff --git a/src/collectors/python.d.plugin/nsd/integrations/name_server_daemon.md b/src/collectors/python.d.plugin/nsd/integrations/name_server_daemon.md deleted file mode 100644 index 357812d3d..000000000 --- a/src/collectors/python.d.plugin/nsd/integrations/name_server_daemon.md +++ /dev/null @@ -1,199 +0,0 @@ -<!--startmeta -custom_edit_url: "https://github.com/netdata/netdata/edit/master/src/collectors/python.d.plugin/nsd/README.md" -meta_yaml: "https://github.com/netdata/netdata/edit/master/src/collectors/python.d.plugin/nsd/metadata.yaml" -sidebar_label: "Name Server Daemon" -learn_status: "Published" -learn_rel_path: "Collecting Metrics/DNS and DHCP Servers" -most_popular: False -message: "DO NOT EDIT THIS FILE DIRECTLY, IT IS GENERATED BY THE COLLECTOR'S metadata.yaml FILE" -endmeta--> - -# Name Server Daemon - - -<img src="https://netdata.cloud/img/nsd.svg" width="150"/> - - -Plugin: python.d.plugin -Module: nsd - -<img src="https://img.shields.io/badge/maintained%20by-Netdata-%2300ab44" /> - -## Overview - -This collector monitors NSD statistics like queries, zones, protocols, query types and more. - - -It uses the `nsd-control stats_noreset` command to gather metrics. - - -This collector is supported on all platforms. - -This collector only supports collecting metrics from a single instance of this integration. - - -### Default Behavior - -#### Auto-Detection - -If permissions are satisfied, the collector will be able to run `nsd-control stats_noreset`, thus collecting metrics. - -#### Limits - -The default configuration for this integration does not impose any limits on data collection. - -#### Performance Impact - -The default configuration for this integration is not expected to impose a significant performance impact on the system. - - -## Metrics - -Metrics grouped by *scope*. - -The scope defines the instance that the metric belongs to. An instance is uniquely identified by a set of labels. - - - -### Per Name Server Daemon instance - -These metrics refer to the entire monitored application. - -This scope has no labels. - -Metrics: - -| Metric | Dimensions | Unit | -|:------|:----------|:----| -| nsd.queries | queries | queries/s | -| nsd.zones | master, slave | zones | -| nsd.protocols | udp, udp6, tcp, tcp6 | queries/s | -| nsd.type | A, NS, CNAME, SOA, PTR, HINFO, MX, NAPTR, TXT, AAAA, SRV, ANY | queries/s | -| nsd.transfer | NOTIFY, AXFR | queries/s | -| nsd.rcode | NOERROR, FORMERR, SERVFAIL, NXDOMAIN, NOTIMP, REFUSED, YXDOMAIN | queries/s | - - - -## Alerts - -There are no alerts configured by default for this integration. - - -## Setup - -### Prerequisites - -#### NSD version - -The version of `nsd` must be 4.0+. - - -#### Provide Netdata the permissions to run the command - -Netdata must have permissions to run the `nsd-control stats_noreset` command. - -You can: - -- Add "netdata" user to "nsd" group: - ``` - usermod -aG nsd netdata - ``` -- Add Netdata to sudoers - 1. Edit the sudoers file: - ``` - visudo -f /etc/sudoers.d/netdata - ``` - 2. Add the entry: - ``` - Defaults:netdata !requiretty - netdata ALL=(ALL) NOPASSWD: /usr/sbin/nsd-control stats_noreset - ``` - - > Note that you will need to set the `command` option to `sudo /usr/sbin/nsd-control stats_noreset` if you use this method. - - - -### Configuration - -#### File - -The configuration file name for this integration is `python.d/nsd.conf`. - - -You can edit the configuration file using the `edit-config` script from the -Netdata [config directory](/docs/netdata-agent/configuration/README.md#the-netdata-config-directory). - -```bash -cd /etc/netdata 2>/dev/null || cd /opt/netdata/etc/netdata -sudo ./edit-config python.d/nsd.conf -``` -#### Options - -This particular collector does not need further configuration to work if permissions are satisfied, but you can always customize it's data collection behavior. - -There are 2 sections: - -* Global variables -* One or more JOBS that can define multiple different instances to monitor. - -The following options can be defined globally: priority, penalty, autodetection_retry, update_every, but can also be defined per JOB to override the global values. - -Additionally, the following collapsed table contains all the options that can be configured inside a JOB definition. - -Every configuration JOB starts with a `job_name` value which will appear in the dashboard, unless a `name` parameter is specified. - - -<details open><summary>Config options</summary> - -| Name | Description | Default | Required | -|:----|:-----------|:-------|:--------:| -| update_every | Sets the default data collection frequency. | 30 | no | -| priority | Controls the order of charts at the netdata dashboard. | 60000 | no | -| autodetection_retry | Sets the job re-check interval in seconds. | 0 | no | -| penalty | Indicates whether to apply penalty to update_every in case of failures. | yes | no | -| name | Job name. This value will overwrite the `job_name` value. JOBS with the same name are mutually exclusive. Only one of them will be allowed running at any time. This allows autodetection to try several alternatives and pick the one that works. | | no | -| command | The command to run | nsd-control stats_noreset | no | - -</details> - -#### Examples - -##### Basic - -A basic configuration example. - -```yaml -local: - name: 'nsd_local' - command: 'nsd-control stats_noreset' - -``` - - -## Troubleshooting - -### Debug Mode - -To troubleshoot issues with the `nsd` collector, run the `python.d.plugin` with the debug option enabled. The output -should give you clues as to why the collector isn't working. - -- Navigate to the `plugins.d` directory, usually at `/usr/libexec/netdata/plugins.d/`. If that's not the case on - your system, open `netdata.conf` and look for the `plugins` setting under `[directories]`. - - ```bash - cd /usr/libexec/netdata/plugins.d/ - ``` - -- Switch to the `netdata` user. - - ```bash - sudo -u netdata -s - ``` - -- Run the `python.d.plugin` to debug the collector: - - ```bash - ./python.d.plugin nsd debug trace - ``` - - diff --git a/src/collectors/python.d.plugin/nsd/metadata.yaml b/src/collectors/python.d.plugin/nsd/metadata.yaml deleted file mode 100644 index f5e2c46b0..000000000 --- a/src/collectors/python.d.plugin/nsd/metadata.yaml +++ /dev/null @@ -1,201 +0,0 @@ -plugin_name: python.d.plugin -modules: - - meta: - plugin_name: python.d.plugin - module_name: nsd - monitored_instance: - name: Name Server Daemon - link: https://nsd.docs.nlnetlabs.nl/en/latest/# - categories: - - data-collection.dns-and-dhcp-servers - icon_filename: "nsd.svg" - related_resources: - integrations: - list: [] - info_provided_to_referring_integrations: - description: "" - keywords: - - nsd - - name server daemon - most_popular: false - overview: - data_collection: - metrics_description: | - This collector monitors NSD statistics like queries, zones, protocols, query types and more. - method_description: | - It uses the `nsd-control stats_noreset` command to gather metrics. - supported_platforms: - include: [] - exclude: [] - multi_instance: false - additional_permissions: - description: "" - default_behavior: - auto_detection: - description: If permissions are satisfied, the collector will be able to run `nsd-control stats_noreset`, thus collecting metrics. - limits: - description: "" - performance_impact: - description: "" - setup: - prerequisites: - list: - - title: NSD version - description: | - The version of `nsd` must be 4.0+. - - title: Provide Netdata the permissions to run the command - description: | - Netdata must have permissions to run the `nsd-control stats_noreset` command. - - You can: - - - Add "netdata" user to "nsd" group: - ``` - usermod -aG nsd netdata - ``` - - Add Netdata to sudoers - 1. Edit the sudoers file: - ``` - visudo -f /etc/sudoers.d/netdata - ``` - 2. Add the entry: - ``` - Defaults:netdata !requiretty - netdata ALL=(ALL) NOPASSWD: /usr/sbin/nsd-control stats_noreset - ``` - - > Note that you will need to set the `command` option to `sudo /usr/sbin/nsd-control stats_noreset` if you use this method. - - configuration: - file: - name: "python.d/nsd.conf" - options: - description: | - This particular collector does not need further configuration to work if permissions are satisfied, but you can always customize it's data collection behavior. - - There are 2 sections: - - * Global variables - * One or more JOBS that can define multiple different instances to monitor. - - The following options can be defined globally: priority, penalty, autodetection_retry, update_every, but can also be defined per JOB to override the global values. - - Additionally, the following collapsed table contains all the options that can be configured inside a JOB definition. - - Every configuration JOB starts with a `job_name` value which will appear in the dashboard, unless a `name` parameter is specified. - folding: - title: "Config options" - enabled: true - list: - - name: update_every - description: Sets the default data collection frequency. - default_value: 30 - required: false - - name: priority - description: Controls the order of charts at the netdata dashboard. - default_value: 60000 - required: false - - name: autodetection_retry - description: Sets the job re-check interval in seconds. - default_value: 0 - required: false - - name: penalty - description: Indicates whether to apply penalty to update_every in case of failures. - default_value: yes - required: false - - name: name - description: > - Job name. This value will overwrite the `job_name` value. JOBS with the same name are mutually exclusive. Only one of them will be allowed - running at any time. This allows autodetection to try several alternatives and pick the one that works. - default_value: "" - required: false - - name: command - description: The command to run - default_value: "nsd-control stats_noreset" - required: false - examples: - folding: - enabled: true - title: "Config" - list: - - name: Basic - description: A basic configuration example. - folding: - enabled: false - config: | - local: - name: 'nsd_local' - command: 'nsd-control stats_noreset' - troubleshooting: - problems: - list: [] - alerts: [] - metrics: - folding: - title: Metrics - enabled: false - description: "" - availability: [] - scopes: - - name: global - description: "These metrics refer to the entire monitored application." - labels: [] - metrics: - - name: nsd.queries - description: queries - unit: "queries/s" - chart_type: line - dimensions: - - name: queries - - name: nsd.zones - description: zones - unit: "zones" - chart_type: stacked - dimensions: - - name: master - - name: slave - - name: nsd.protocols - description: protocol - unit: "queries/s" - chart_type: stacked - dimensions: - - name: udp - - name: udp6 - - name: tcp - - name: tcp6 - - name: nsd.type - description: query type - unit: "queries/s" - chart_type: stacked - dimensions: - - name: A - - name: NS - - name: CNAME - - name: SOA - - name: PTR - - name: HINFO - - name: MX - - name: NAPTR - - name: TXT - - name: AAAA - - name: SRV - - name: ANY - - name: nsd.transfer - description: transfer - unit: "queries/s" - chart_type: stacked - dimensions: - - name: NOTIFY - - name: AXFR - - name: nsd.rcode - description: return code - unit: "queries/s" - chart_type: stacked - dimensions: - - name: NOERROR - - name: FORMERR - - name: SERVFAIL - - name: NXDOMAIN - - name: NOTIMP - - name: REFUSED - - name: YXDOMAIN diff --git a/src/collectors/python.d.plugin/nsd/nsd.chart.py b/src/collectors/python.d.plugin/nsd/nsd.chart.py deleted file mode 100644 index 6f9b2cec8..000000000 --- a/src/collectors/python.d.plugin/nsd/nsd.chart.py +++ /dev/null @@ -1,105 +0,0 @@ -# -*- coding: utf-8 -*- -# Description: NSD `nsd-control stats_noreset` netdata python.d module -# Author: <383c57 at gmail.com> -# SPDX-License-Identifier: GPL-3.0-or-later - -import re - -from bases.FrameworkServices.ExecutableService import ExecutableService - -update_every = 30 - -NSD_CONTROL_COMMAND = 'nsd-control stats_noreset' -REGEX = re.compile(r'([A-Za-z0-9.]+)=(\d+)') - -ORDER = [ - 'queries', - 'zones', - 'protocol', - 'type', - 'transfer', - 'rcode', -] - -CHARTS = { - 'queries': { - 'options': [None, 'queries', 'queries/s', 'queries', 'nsd.queries', 'line'], - 'lines': [ - ['num_queries', 'queries', 'incremental'] - ] - }, - 'zones': { - 'options': [None, 'zones', 'zones', 'zones', 'nsd.zones', 'stacked'], - 'lines': [ - ['zone_master', 'master', 'absolute'], - ['zone_slave', 'slave', 'absolute'] - ] - }, - 'protocol': { - 'options': [None, 'protocol', 'queries/s', 'protocol', 'nsd.protocols', 'stacked'], - 'lines': [ - ['num_udp', 'udp', 'incremental'], - ['num_udp6', 'udp6', 'incremental'], - ['num_tcp', 'tcp', 'incremental'], - ['num_tcp6', 'tcp6', 'incremental'] - ] - }, - 'type': { - 'options': [None, 'query type', 'queries/s', 'query type', 'nsd.type', 'stacked'], - 'lines': [ - ['num_type_A', 'A', 'incremental'], - ['num_type_NS', 'NS', 'incremental'], - ['num_type_CNAME', 'CNAME', 'incremental'], - ['num_type_SOA', 'SOA', 'incremental'], - ['num_type_PTR', 'PTR', 'incremental'], - ['num_type_HINFO', 'HINFO', 'incremental'], - ['num_type_MX', 'MX', 'incremental'], - ['num_type_NAPTR', 'NAPTR', 'incremental'], - ['num_type_TXT', 'TXT', 'incremental'], - ['num_type_AAAA', 'AAAA', 'incremental'], - ['num_type_SRV', 'SRV', 'incremental'], - ['num_type_TYPE255', 'ANY', 'incremental'] - ] - }, - 'transfer': { - 'options': [None, 'transfer', 'queries/s', 'transfer', 'nsd.transfer', 'stacked'], - 'lines': [ - ['num_opcode_NOTIFY', 'NOTIFY', 'incremental'], - ['num_type_TYPE252', 'AXFR', 'incremental'] - ] - }, - 'rcode': { - 'options': [None, 'return code', 'queries/s', 'return code', 'nsd.rcode', 'stacked'], - 'lines': [ - ['num_rcode_NOERROR', 'NOERROR', 'incremental'], - ['num_rcode_FORMERR', 'FORMERR', 'incremental'], - ['num_rcode_SERVFAIL', 'SERVFAIL', 'incremental'], - ['num_rcode_NXDOMAIN', 'NXDOMAIN', 'incremental'], - ['num_rcode_NOTIMP', 'NOTIMP', 'incremental'], - ['num_rcode_REFUSED', 'REFUSED', 'incremental'], - ['num_rcode_YXDOMAIN', 'YXDOMAIN', 'incremental'] - ] - } -} - - -class Service(ExecutableService): - def __init__(self, configuration=None, name=None): - ExecutableService.__init__(self, configuration=configuration, name=name) - self.order = ORDER - self.definitions = CHARTS - self.command = NSD_CONTROL_COMMAND - - def _get_data(self): - lines = self._get_raw_data() - if not lines: - return None - - stats = dict( - (k.replace('.', '_'), int(v)) for k, v in REGEX.findall(''.join(lines)) - ) - stats.setdefault('num_opcode_NOTIFY', 0) - stats.setdefault('num_type_TYPE252', 0) - stats.setdefault('num_type_TYPE255', 0) - - return stats diff --git a/src/collectors/python.d.plugin/nsd/nsd.conf b/src/collectors/python.d.plugin/nsd/nsd.conf deleted file mode 100644 index 77a8a3177..000000000 --- a/src/collectors/python.d.plugin/nsd/nsd.conf +++ /dev/null @@ -1,91 +0,0 @@ -# netdata python.d.plugin configuration for nsd -# -# This file is in YaML format. Generally the format is: -# -# name: value -# -# There are 2 sections: -# - global variables -# - one or more JOBS -# -# JOBS allow you to collect values from multiple sources. -# Each source will have its own set of charts. -# -# JOB parameters have to be indented (using spaces only, example below). - -# ---------------------------------------------------------------------- -# Global Variables -# These variables set the defaults for all JOBs, however each JOB -# may define its own, overriding the defaults. - -# update_every sets the default data collection frequency. -# If unset, the python.d.plugin default is used. -# nsd-control is slow, so once every 30 seconds -# update_every: 30 - -# priority controls the order of charts at the netdata dashboard. -# Lower numbers move the charts towards the top of the page. -# If unset, the default for python.d.plugin is used. -# priority: 60000 - -# penalty indicates whether to apply penalty to update_every in case of failures. -# Penalty will increase every 5 failed updates in a row. Maximum penalty is 10 minutes. -# penalty: yes - -# autodetection_retry sets the job re-check interval in seconds. -# The job is not deleted if check fails. -# Attempts to start the job are made once every autodetection_retry. -# This feature is disabled by default. -# autodetection_retry: 0 - -# ---------------------------------------------------------------------- -# JOBS (data collection sources) -# -# The default JOBS share the same *name*. JOBS with the same name -# are mutually exclusive. Only one of them will be allowed running at -# any time. This allows autodetection to try several alternatives and -# pick the one that works. -# -# Any number of jobs is supported. -# -# All python.d.plugin JOBS (for all its modules) support a set of -# predefined parameters. These are: -# -# job_name: -# name: myname # the JOB's name as it will appear at the -# # dashboard (by default is the job_name) -# # JOBs sharing a name are mutually exclusive -# update_every: 1 # the JOB's data collection frequency -# priority: 60000 # the JOB's order on the dashboard -# penalty: yes # the JOB's penalty -# autodetection_retry: 0 # the JOB's re-check interval in seconds -# -# Additionally to the above, nsd also supports the following: -# -# command: 'nsd-control stats_noreset' # the command to run -# - -# ---------------------------------------------------------------------- -# IMPORTANT Information -# -# Netdata must have permissions to run `nsd-control stats_noreset` command -# -# - Example-1 (use "sudo") -# 1. sudoers (e.g. visudo -f /etc/sudoers.d/netdata) -# Defaults:netdata !requiretty -# netdata ALL=(ALL) NOPASSWD: /usr/sbin/nsd-control stats_noreset -# 2. etc/netdata/python.d/nsd.conf -# local: -# update_every: 30 -# command: 'sudo /usr/sbin/nsd-control stats_noreset' -# -# - Example-2 (add "netdata" user to "nsd" group) -# usermod -aG nsd netdata -# - -# ---------------------------------------------------------------------- -# AUTO-DETECTION JOBS - -local: - update_every: 30 - command: 'nsd-control stats_noreset' diff --git a/src/collectors/python.d.plugin/nvidia_smi/README.md b/src/collectors/python.d.plugin/nvidia_smi/README.md deleted file mode 100644 index 240b65af3..000000000 --- a/src/collectors/python.d.plugin/nvidia_smi/README.md +++ /dev/null @@ -1,81 +0,0 @@ -<!-- -title: "Nvidia GPU monitoring with Netdata" -custom_edit_url: "https://github.com/netdata/netdata/edit/master/src/collectors/python.d.plugin/nvidia_smi/README.md" -sidebar_label: "nvidia_smi-python.d.plugin" -learn_status: "Published" -learn_topic_type: "References" -learn_rel_path: "Integrations/Monitor/Devices" ---> - -# Nvidia GPU collector - -Monitors performance metrics (memory usage, fan speed, pcie bandwidth utilization, temperature, etc.) using `nvidia-smi` cli tool. - -## Requirements - -- The `nvidia-smi` tool installed and your NVIDIA GPU(s) must support the tool. Mostly the newer high end models used for AI / ML and Crypto or Pro range, read more about [nvidia_smi](https://developer.nvidia.com/nvidia-system-management-interface). -- Enable this plugin, as it's disabled by default due to minor performance issues: - ```bash - cd /etc/netdata # Replace this path with your Netdata config directory, if different - sudo ./edit-config python.d.conf - ``` - Remove the '#' before nvidia_smi so it reads: `nvidia_smi: yes`. -- On some systems when the GPU is idle the `nvidia-smi` tool unloads and there is added latency again when it is next queried. If you are running GPUs under constant workload this isn't likely to be an issue. - -If using Docker, see [Netdata Docker container with NVIDIA GPUs monitoring](https://github.com/netdata/netdata/tree/master/packaging/docker#with-nvidia-gpus-monitoring). - -## Charts - -It produces the following charts: - -- PCI Express Bandwidth Utilization in `KiB/s` -- Fan Speed in `percentage` -- GPU Utilization in `percentage` -- Memory Bandwidth Utilization in `percentage` -- Encoder/Decoder Utilization in `percentage` -- Memory Usage in `MiB` -- Temperature in `celsius` -- Clock Frequencies in `MHz` -- Power Utilization in `Watts` -- Memory Used by Each Process in `MiB` -- Memory Used by Each User in `MiB` -- Number of User on GPU in `num` - -## Configuration - -Edit the `python.d/nvidia_smi.conf` configuration file using `edit-config` from the Netdata [config -directory](/docs/netdata-agent/configuration/README.md), which is typically at `/etc/netdata`. - -```bash -cd /etc/netdata # Replace this path with your Netdata config directory, if different -sudo ./edit-config python.d/nvidia_smi.conf -``` - -Sample: - -```yaml -loop_mode : yes -poll_seconds : 1 -exclude_zero_memory_users : yes -``` - - -### Troubleshooting - -To troubleshoot issues with the `nvidia_smi` module, run the `python.d.plugin` with the debug option enabled. The -output will give you the output of the data collection job or error messages on why the collector isn't working. - -First, navigate to your plugins directory, usually they are located under `/usr/libexec/netdata/plugins.d/`. If that's -not the case on your system, open `netdata.conf` and look for the setting `plugins directory`. Once you're in the -plugin's directory, switch to the `netdata` user. - -```bash -cd /usr/libexec/netdata/plugins.d/ -sudo su -s /bin/bash netdata -``` - -Now you can manually run the `nvidia_smi` module in debug mode: - -```bash -./python.d.plugin nvidia_smi debug trace -``` diff --git a/src/collectors/python.d.plugin/nvidia_smi/metadata.yaml b/src/collectors/python.d.plugin/nvidia_smi/metadata.yaml deleted file mode 100644 index 0b049d31b..000000000 --- a/src/collectors/python.d.plugin/nvidia_smi/metadata.yaml +++ /dev/null @@ -1,166 +0,0 @@ -# This collector will not appear in documentation, as the go version is preferred, -# /src/go/collectors/go.d.plugin/modules/nvidia_smi/README.md -# -# meta: -# plugin_name: python.d.plugin -# module_name: nvidia_smi -# monitored_instance: -# name: python.d nvidia_smi -# link: '' -# categories: [] -# icon_filename: '' -# related_resources: -# integrations: -# list: [] -# info_provided_to_referring_integrations: -# description: '' -# keywords: [] -# most_popular: false -# overview: -# data_collection: -# metrics_description: '' -# method_description: '' -# supported_platforms: -# include: [] -# exclude: [] -# multi_instance: true -# additional_permissions: -# description: '' -# default_behavior: -# auto_detection: -# description: '' -# limits: -# description: '' -# performance_impact: -# description: '' -# setup: -# prerequisites: -# list: [] -# configuration: -# file: -# name: '' -# description: '' -# options: -# description: '' -# folding: -# title: '' -# enabled: true -# list: [] -# examples: -# folding: -# enabled: true -# title: '' -# list: [] -# troubleshooting: -# problems: -# list: [] -# alerts: [] -# metrics: -# folding: -# title: Metrics -# enabled: false -# description: "" -# availability: [] -# scopes: -# - name: GPU -# description: "" -# labels: [] -# metrics: -# - name: nvidia_smi.pci_bandwidth -# description: PCI Express Bandwidth Utilization -# unit: "KiB/s" -# chart_type: area -# dimensions: -# - name: rx -# - name: tx -# - name: nvidia_smi.pci_bandwidth_percent -# description: PCI Express Bandwidth Percent -# unit: "percentage" -# chart_type: area -# dimensions: -# - name: rx_percent -# - name: tx_percent -# - name: nvidia_smi.fan_speed -# description: Fan Speed -# unit: "percentage" -# chart_type: line -# dimensions: -# - name: speed -# - name: nvidia_smi.gpu_utilization -# description: GPU Utilization -# unit: "percentage" -# chart_type: line -# dimensions: -# - name: utilization -# - name: nvidia_smi.mem_utilization -# description: Memory Bandwidth Utilization -# unit: "percentage" -# chart_type: line -# dimensions: -# - name: utilization -# - name: nvidia_smi.encoder_utilization -# description: Encoder/Decoder Utilization -# unit: "percentage" -# chart_type: line -# dimensions: -# - name: encoder -# - name: decoder -# - name: nvidia_smi.memory_allocated -# description: Memory Usage -# unit: "MiB" -# chart_type: stacked -# dimensions: -# - name: free -# - name: used -# - name: nvidia_smi.bar1_memory_usage -# description: Bar1 Memory Usage -# unit: "MiB" -# chart_type: stacked -# dimensions: -# - name: free -# - name: used -# - name: nvidia_smi.temperature -# description: Temperature -# unit: "celsius" -# chart_type: line -# dimensions: -# - name: temp -# - name: nvidia_smi.clocks -# description: Clock Frequencies -# unit: "MHz" -# chart_type: line -# dimensions: -# - name: graphics -# - name: video -# - name: sm -# - name: mem -# - name: nvidia_smi.power -# description: Power Utilization -# unit: "Watts" -# chart_type: line -# dimensions: -# - name: power -# - name: nvidia_smi.power_state -# description: Power State -# unit: "state" -# chart_type: line -# dimensions: -# - name: a dimension per {power_state} -# - name: nvidia_smi.processes_mem -# description: Memory Used by Each Process -# unit: "MiB" -# chart_type: stacked -# dimensions: -# - name: a dimension per process -# - name: nvidia_smi.user_mem -# description: Memory Used by Each User -# unit: "MiB" -# chart_type: stacked -# dimensions: -# - name: a dimension per user -# - name: nvidia_smi.user_num -# description: Number of User on GPU -# unit: "num" -# chart_type: line -# dimensions: -# - name: users diff --git a/src/collectors/python.d.plugin/nvidia_smi/nvidia_smi.chart.py b/src/collectors/python.d.plugin/nvidia_smi/nvidia_smi.chart.py deleted file mode 100644 index 556a61435..000000000 --- a/src/collectors/python.d.plugin/nvidia_smi/nvidia_smi.chart.py +++ /dev/null @@ -1,651 +0,0 @@ -# -*- coding: utf-8 -*- -# Description: nvidia-smi netdata python.d module -# Original Author: Steven Noonan (tycho) -# Author: Ilya Mashchenko (ilyam8) -# User Memory Stat Author: Guido Scatena (scatenag) - -import os -import pwd -import subprocess -import threading -import xml.etree.ElementTree as et - -from bases.FrameworkServices.SimpleService import SimpleService -from bases.collection import find_binary - -disabled_by_default = True - -NVIDIA_SMI = 'nvidia-smi' - -NOT_AVAILABLE = 'N/A' - -EMPTY_ROW = '' -EMPTY_ROW_LIMIT = 500 -POLLER_BREAK_ROW = '</nvidia_smi_log>' - -PCI_BANDWIDTH = 'pci_bandwidth' -PCI_BANDWIDTH_PERCENT = 'pci_bandwidth_percent' -FAN_SPEED = 'fan_speed' -GPU_UTIL = 'gpu_utilization' -MEM_UTIL = 'mem_utilization' -ENCODER_UTIL = 'encoder_utilization' -MEM_USAGE = 'mem_usage' -BAR_USAGE = 'bar1_mem_usage' -TEMPERATURE = 'temperature' -CLOCKS = 'clocks' -POWER = 'power' -POWER_STATE = 'power_state' -PROCESSES_MEM = 'processes_mem' -USER_MEM = 'user_mem' -USER_NUM = 'user_num' - -ORDER = [ - PCI_BANDWIDTH, - PCI_BANDWIDTH_PERCENT, - FAN_SPEED, - GPU_UTIL, - MEM_UTIL, - ENCODER_UTIL, - MEM_USAGE, - BAR_USAGE, - TEMPERATURE, - CLOCKS, - POWER, - POWER_STATE, - PROCESSES_MEM, - USER_MEM, - USER_NUM, -] - -# https://docs.nvidia.com/gameworks/content/gameworkslibrary/coresdk/nvapi/group__gpupstate.html -POWER_STATES = ['P' + str(i) for i in range(0, 16)] - -# PCI Transfer data rate in gigabits per second (Gb/s) per generation -PCI_SPEED = { - "1": 2.5, - "2": 5, - "3": 8, - "4": 16, - "5": 32 -} -# PCI encoding per generation -PCI_ENCODING = { - "1": 2 / 10, - "2": 2 / 10, - "3": 2 / 130, - "4": 2 / 130, - "5": 2 / 130 -} - - -def gpu_charts(gpu): - fam = gpu.full_name() - - charts = { - PCI_BANDWIDTH: { - 'options': [None, 'PCI Express Bandwidth Utilization', 'KiB/s', fam, 'nvidia_smi.pci_bandwidth', 'area'], - 'lines': [ - ['rx_util', 'rx', 'absolute', 1, 1], - ['tx_util', 'tx', 'absolute', 1, -1], - ] - }, - PCI_BANDWIDTH_PERCENT: { - 'options': [None, 'PCI Express Bandwidth Percent', 'percentage', fam, 'nvidia_smi.pci_bandwidth_percent', - 'area'], - 'lines': [ - ['rx_util_percent', 'rx_percent'], - ['tx_util_percent', 'tx_percent'], - ] - }, - FAN_SPEED: { - 'options': [None, 'Fan Speed', 'percentage', fam, 'nvidia_smi.fan_speed', 'line'], - 'lines': [ - ['fan_speed', 'speed'], - ] - }, - GPU_UTIL: { - 'options': [None, 'GPU Utilization', 'percentage', fam, 'nvidia_smi.gpu_utilization', 'line'], - 'lines': [ - ['gpu_util', 'utilization'], - ] - }, - MEM_UTIL: { - 'options': [None, 'Memory Bandwidth Utilization', 'percentage', fam, 'nvidia_smi.mem_utilization', 'line'], - 'lines': [ - ['memory_util', 'utilization'], - ] - }, - ENCODER_UTIL: { - 'options': [None, 'Encoder/Decoder Utilization', 'percentage', fam, 'nvidia_smi.encoder_utilization', - 'line'], - 'lines': [ - ['encoder_util', 'encoder'], - ['decoder_util', 'decoder'], - ] - }, - MEM_USAGE: { - 'options': [None, 'Memory Usage', 'MiB', fam, 'nvidia_smi.memory_allocated', 'stacked'], - 'lines': [ - ['fb_memory_free', 'free'], - ['fb_memory_used', 'used'], - ] - }, - BAR_USAGE: { - 'options': [None, 'Bar1 Memory Usage', 'MiB', fam, 'nvidia_smi.bar1_memory_usage', 'stacked'], - 'lines': [ - ['bar1_memory_free', 'free'], - ['bar1_memory_used', 'used'], - ] - }, - TEMPERATURE: { - 'options': [None, 'Temperature', 'celsius', fam, 'nvidia_smi.temperature', 'line'], - 'lines': [ - ['gpu_temp', 'temp'], - ] - }, - CLOCKS: { - 'options': [None, 'Clock Frequencies', 'MHz', fam, 'nvidia_smi.clocks', 'line'], - 'lines': [ - ['graphics_clock', 'graphics'], - ['video_clock', 'video'], - ['sm_clock', 'sm'], - ['mem_clock', 'mem'], - ] - }, - POWER: { - 'options': [None, 'Power Utilization', 'Watts', fam, 'nvidia_smi.power', 'line'], - 'lines': [ - ['power_draw', 'power', 'absolute', 1, 100], - ] - }, - POWER_STATE: { - 'options': [None, 'Power State', 'state', fam, 'nvidia_smi.power_state', 'line'], - 'lines': [['power_state_' + v.lower(), v, 'absolute'] for v in POWER_STATES] - }, - PROCESSES_MEM: { - 'options': [None, 'Memory Used by Each Process', 'MiB', fam, 'nvidia_smi.processes_mem', 'stacked'], - 'lines': [] - }, - USER_MEM: { - 'options': [None, 'Memory Used by Each User', 'MiB', fam, 'nvidia_smi.user_mem', 'stacked'], - 'lines': [] - }, - USER_NUM: { - 'options': [None, 'Number of User on GPU', 'num', fam, 'nvidia_smi.user_num', 'line'], - 'lines': [ - ['user_num', 'users'], - ] - }, - } - - idx = gpu.num - - order = ['gpu{0}_{1}'.format(idx, v) for v in ORDER] - charts = dict(('gpu{0}_{1}'.format(idx, k), v) for k, v in charts.items()) - - for chart in charts.values(): - for line in chart['lines']: - line[0] = 'gpu{0}_{1}'.format(idx, line[0]) - - return order, charts - - -class NvidiaSMI: - def __init__(self): - self.command = find_binary(NVIDIA_SMI) - self.active_proc = None - - def run_once(self): - proc = subprocess.Popen([self.command, '-x', '-q'], stdout=subprocess.PIPE) - stdout, _ = proc.communicate() - return stdout - - def run_loop(self, interval): - if self.active_proc: - self.kill() - proc = subprocess.Popen([self.command, '-x', '-q', '-l', str(interval)], stdout=subprocess.PIPE) - self.active_proc = proc - return proc.stdout - - def kill(self): - if self.active_proc: - self.active_proc.kill() - self.active_proc = None - - -class NvidiaSMIPoller(threading.Thread): - def __init__(self, poll_interval): - threading.Thread.__init__(self) - self.daemon = True - - self.smi = NvidiaSMI() - self.interval = poll_interval - - self.lock = threading.RLock() - self.last_data = str() - self.exit = False - self.empty_rows = 0 - self.rows = list() - - def has_smi(self): - return bool(self.smi.command) - - def run_once(self): - return self.smi.run_once() - - def run(self): - out = self.smi.run_loop(self.interval) - - for row in out: - if self.exit or self.empty_rows > EMPTY_ROW_LIMIT: - break - self.process_row(row) - self.smi.kill() - - def process_row(self, row): - row = row.decode() - self.empty_rows += (row == EMPTY_ROW) - self.rows.append(row) - - if POLLER_BREAK_ROW in row: - self.lock.acquire() - self.last_data = '\n'.join(self.rows) - self.lock.release() - - self.rows = list() - self.empty_rows = 0 - - def is_started(self): - return self.ident is not None - - def shutdown(self): - self.exit = True - - def data(self): - self.lock.acquire() - data = self.last_data - self.lock.release() - return data - - -def handle_attr_error(method): - def on_call(*args, **kwargs): - try: - return method(*args, **kwargs) - except AttributeError: - return None - - return on_call - - -def handle_value_error(method): - def on_call(*args, **kwargs): - try: - return method(*args, **kwargs) - except ValueError: - return None - - return on_call - - -HOST_PREFIX = os.getenv('NETDATA_HOST_PREFIX') -ETC_PASSWD_PATH = '/etc/passwd' -PROC_PATH = '/proc' - -IS_INSIDE_DOCKER = False - -if HOST_PREFIX: - ETC_PASSWD_PATH = os.path.join(HOST_PREFIX, ETC_PASSWD_PATH[1:]) - PROC_PATH = os.path.join(HOST_PREFIX, PROC_PATH[1:]) - IS_INSIDE_DOCKER = True - - -def read_passwd_file(): - data = dict() - with open(ETC_PASSWD_PATH, 'r') as f: - for line in f: - line = line.strip() - if line.startswith("#"): - continue - fields = line.split(":") - # name, passwd, uid, gid, comment, home_dir, shell - if len(fields) != 7: - continue - # uid, guid - fields[2], fields[3] = int(fields[2]), int(fields[3]) - data[fields[2]] = fields - return data - - -def read_passwd_file_safe(): - try: - if IS_INSIDE_DOCKER: - return read_passwd_file() - return dict((k[2], k) for k in pwd.getpwall()) - except (OSError, IOError): - return dict() - - -def get_username_by_pid_safe(pid, passwd_file): - path = os.path.join(PROC_PATH, pid) - try: - uid = os.stat(path).st_uid - except (OSError, IOError): - return '' - try: - if IS_INSIDE_DOCKER: - return passwd_file[uid][0] - return pwd.getpwuid(uid)[0] - except KeyError: - return str(uid) - - -class GPU: - def __init__(self, num, root, exclude_zero_memory_users=False): - self.num = num - self.root = root - self.exclude_zero_memory_users = exclude_zero_memory_users - - def id(self): - return self.root.get('id') - - def name(self): - return self.root.find('product_name').text - - def full_name(self): - return 'gpu{0} {1}'.format(self.num, self.name()) - - @handle_attr_error - def pci_link_gen(self): - return self.root.find('pci').find('pci_gpu_link_info').find('pcie_gen').find('max_link_gen').text - - @handle_attr_error - def pci_link_width(self): - info = self.root.find('pci').find('pci_gpu_link_info') - return info.find('link_widths').find('max_link_width').text.split('x')[0] - - def pci_bw_max(self): - link_gen = self.pci_link_gen() - link_width = int(self.pci_link_width()) - if link_gen not in PCI_SPEED or link_gen not in PCI_ENCODING or not link_width: - return None - # Maximum PCIe Bandwidth = SPEED * WIDTH * (1 - ENCODING) - 1Gb/s. - # see details https://enterprise-support.nvidia.com/s/article/understanding-pcie-configuration-for-maximum-performance - # return max bandwidth in kilobytes per second (kB/s) - return (PCI_SPEED[link_gen] * link_width * (1 - PCI_ENCODING[link_gen]) - 1) * 1000 * 1000 / 8 - - @handle_attr_error - def rx_util(self): - return self.root.find('pci').find('rx_util').text.split()[0] - - @handle_attr_error - def tx_util(self): - return self.root.find('pci').find('tx_util').text.split()[0] - - @handle_attr_error - def fan_speed(self): - return self.root.find('fan_speed').text.split()[0] - - @handle_attr_error - def gpu_util(self): - return self.root.find('utilization').find('gpu_util').text.split()[0] - - @handle_attr_error - def memory_util(self): - return self.root.find('utilization').find('memory_util').text.split()[0] - - @handle_attr_error - def encoder_util(self): - return self.root.find('utilization').find('encoder_util').text.split()[0] - - @handle_attr_error - def decoder_util(self): - return self.root.find('utilization').find('decoder_util').text.split()[0] - - @handle_attr_error - def fb_memory_used(self): - return self.root.find('fb_memory_usage').find('used').text.split()[0] - - @handle_attr_error - def fb_memory_free(self): - return self.root.find('fb_memory_usage').find('free').text.split()[0] - - @handle_attr_error - def bar1_memory_used(self): - return self.root.find('bar1_memory_usage').find('used').text.split()[0] - - @handle_attr_error - def bar1_memory_free(self): - return self.root.find('bar1_memory_usage').find('free').text.split()[0] - - @handle_attr_error - def temperature(self): - return self.root.find('temperature').find('gpu_temp').text.split()[0] - - @handle_attr_error - def graphics_clock(self): - return self.root.find('clocks').find('graphics_clock').text.split()[0] - - @handle_attr_error - def video_clock(self): - return self.root.find('clocks').find('video_clock').text.split()[0] - - @handle_attr_error - def sm_clock(self): - return self.root.find('clocks').find('sm_clock').text.split()[0] - - @handle_attr_error - def mem_clock(self): - return self.root.find('clocks').find('mem_clock').text.split()[0] - - @handle_attr_error - def power_readings(self): - elem = self.root.find('power_readings') - return elem if elem else self.root.find('gpu_power_readings') - - @handle_attr_error - def power_state(self): - return str(self.power_readings().find('power_state').text.split()[0]) - - @handle_value_error - @handle_attr_error - def power_draw(self): - return float(self.power_readings().find('power_draw').text.split()[0]) * 100 - - @handle_attr_error - def processes(self): - processes_info = self.root.find('processes').findall('process_info') - if not processes_info: - return list() - - passwd_file = read_passwd_file_safe() - processes = list() - - for info in processes_info: - pid = info.find('pid').text - processes.append({ - 'pid': int(pid), - 'process_name': info.find('process_name').text, - 'used_memory': int(info.find('used_memory').text.split()[0]), - 'username': get_username_by_pid_safe(pid, passwd_file), - }) - return processes - - def data(self): - data = { - 'rx_util': self.rx_util(), - 'tx_util': self.tx_util(), - 'fan_speed': self.fan_speed(), - 'gpu_util': self.gpu_util(), - 'memory_util': self.memory_util(), - 'encoder_util': self.encoder_util(), - 'decoder_util': self.decoder_util(), - 'fb_memory_used': self.fb_memory_used(), - 'fb_memory_free': self.fb_memory_free(), - 'bar1_memory_used': self.bar1_memory_used(), - 'bar1_memory_free': self.bar1_memory_free(), - 'gpu_temp': self.temperature(), - 'graphics_clock': self.graphics_clock(), - 'video_clock': self.video_clock(), - 'sm_clock': self.sm_clock(), - 'mem_clock': self.mem_clock(), - 'power_draw': self.power_draw(), - } - - if self.rx_util() != NOT_AVAILABLE and self.tx_util() != NOT_AVAILABLE: - pci_bw_max = self.pci_bw_max() - if not pci_bw_max: - data['rx_util_percent'] = 0 - data['tx_util_percent'] = 0 - else: - data['rx_util_percent'] = str(int(int(self.rx_util()) * 100 / self.pci_bw_max())) - data['tx_util_percent'] = str(int(int(self.tx_util()) * 100 / self.pci_bw_max())) - - for v in POWER_STATES: - data['power_state_' + v.lower()] = 0 - p_state = self.power_state() - if p_state: - data['power_state_' + p_state.lower()] = 1 - - processes = self.processes() or [] - users = set() - for p in processes: - data['process_mem_{0}'.format(p['pid'])] = p['used_memory'] - if p['username']: - if self.exclude_zero_memory_users and p['used_memory'] == 0: - continue - users.add(p['username']) - key = 'user_mem_{0}'.format(p['username']) - if key in data: - data[key] += p['used_memory'] - else: - data[key] = p['used_memory'] - data['user_num'] = len(users) - - return dict(('gpu{0}_{1}'.format(self.num, k), v) for k, v in data.items()) - - -class Service(SimpleService): - def __init__(self, configuration=None, name=None): - super(Service, self).__init__(configuration=configuration, name=name) - self.order = list() - self.definitions = dict() - self.loop_mode = configuration.get('loop_mode', True) - poll = int(configuration.get('poll_seconds', self.get_update_every())) - self.exclude_zero_memory_users = configuration.get('exclude_zero_memory_users', False) - self.poller = NvidiaSMIPoller(poll) - - def get_data_loop_mode(self): - if not self.poller.is_started(): - self.poller.start() - - if not self.poller.is_alive(): - self.debug('poller is off') - return None - - return self.poller.data() - - def get_data_normal_mode(self): - return self.poller.run_once() - - def get_data(self): - if self.loop_mode: - last_data = self.get_data_loop_mode() - else: - last_data = self.get_data_normal_mode() - - if not last_data: - return None - - parsed = self.parse_xml(last_data) - if parsed is None: - return None - - data = dict() - for idx, root in enumerate(parsed.findall('gpu')): - gpu = GPU(idx, root, self.exclude_zero_memory_users) - gpu_data = gpu.data() - # self.debug(gpu_data) - gpu_data = dict((k, v) for k, v in gpu_data.items() if is_gpu_data_value_valid(v)) - data.update(gpu_data) - self.update_processes_mem_chart(gpu) - self.update_processes_user_mem_chart(gpu) - - return data or None - - def update_processes_mem_chart(self, gpu): - ps = gpu.processes() - if not ps: - return - chart = self.charts['gpu{0}_{1}'.format(gpu.num, PROCESSES_MEM)] - active_dim_ids = [] - for p in ps: - dim_id = 'gpu{0}_process_mem_{1}'.format(gpu.num, p['pid']) - active_dim_ids.append(dim_id) - if dim_id not in chart: - chart.add_dimension([dim_id, '{0} {1}'.format(p['pid'], p['process_name'])]) - for dim in chart: - if dim.id not in active_dim_ids: - chart.del_dimension(dim.id, hide=False) - - def update_processes_user_mem_chart(self, gpu): - ps = gpu.processes() - if not ps: - return - chart = self.charts['gpu{0}_{1}'.format(gpu.num, USER_MEM)] - active_dim_ids = [] - for p in ps: - if not p.get('username'): - continue - dim_id = 'gpu{0}_user_mem_{1}'.format(gpu.num, p['username']) - active_dim_ids.append(dim_id) - if dim_id not in chart: - chart.add_dimension([dim_id, '{0}'.format(p['username'])]) - - for dim in chart: - if dim.id not in active_dim_ids: - chart.del_dimension(dim.id, hide=False) - - def check(self): - if not self.poller.has_smi(): - self.error("couldn't find '{0}' binary".format(NVIDIA_SMI)) - return False - - raw_data = self.poller.run_once() - if not raw_data: - self.error("failed to invoke '{0}' binary".format(NVIDIA_SMI)) - return False - - parsed = self.parse_xml(raw_data) - if parsed is None: - return False - - gpus = parsed.findall('gpu') - if not gpus: - return False - - self.create_charts(gpus) - - return True - - def parse_xml(self, data): - try: - return et.fromstring(data) - except et.ParseError as error: - self.error('xml parse failed: "{0}", error: {1}'.format(data, error)) - - return None - - def create_charts(self, gpus): - for idx, root in enumerate(gpus): - order, charts = gpu_charts(GPU(idx, root)) - self.order.extend(order) - self.definitions.update(charts) - - -def is_gpu_data_value_valid(value): - try: - int(value) - except (TypeError, ValueError): - return False - return True diff --git a/src/collectors/python.d.plugin/nvidia_smi/nvidia_smi.conf b/src/collectors/python.d.plugin/nvidia_smi/nvidia_smi.conf deleted file mode 100644 index 3d2a30d41..000000000 --- a/src/collectors/python.d.plugin/nvidia_smi/nvidia_smi.conf +++ /dev/null @@ -1,68 +0,0 @@ -# netdata python.d.plugin configuration for nvidia_smi -# -# This file is in YaML format. Generally the format is: -# -# name: value -# -# There are 2 sections: -# - global variables -# - one or more JOBS -# -# JOBS allow you to collect values from multiple sources. -# Each source will have its own set of charts. -# -# JOB parameters have to be indented (using spaces only, example below). - -# ---------------------------------------------------------------------- -# Global Variables -# These variables set the defaults for all JOBs, however each JOB -# may define its own, overriding the defaults. - -# update_every sets the default data collection frequency. -# If unset, the python.d.plugin default is used. -# update_every: 1 - -# priority controls the order of charts at the netdata dashboard. -# Lower numbers move the charts towards the top of the page. -# If unset, the default for python.d.plugin is used. -# priority: 60000 - -# penalty indicates whether to apply penalty to update_every in case of failures. -# Penalty will increase every 5 failed updates in a row. Maximum penalty is 10 minutes. -# penalty: yes - -# autodetection_retry sets the job re-check interval in seconds. -# The job is not deleted if check fails. -# Attempts to start the job are made once every autodetection_retry. -# This feature is disabled by default. -# autodetection_retry: 0 - -# ---------------------------------------------------------------------- -# JOBS (data collection sources) -# -# The default JOBS share the same *name*. JOBS with the same name -# are mutually exclusive. Only one of them will be allowed running at -# any time. This allows autodetection to try several alternatives and -# pick the one that works. -# -# Any number of jobs is supported. -# -# All python.d.plugin JOBS (for all its modules) support a set of -# predefined parameters. These are: -# -# job_name: -# name: myname # the JOB's name as it will appear at the -# # dashboard (by default is the job_name) -# # JOBs sharing a name are mutually exclusive -# update_every: 1 # the JOB's data collection frequency -# priority: 60000 # the JOB's order on the dashboard -# penalty: yes # the JOB's penalty -# autodetection_retry: 0 # the JOB's re-check interval in seconds -# -# Additionally to the above, example also supports the following: -# -# loop_mode: yes/no # default is yes. If set to yes `nvidia-smi` is executed in a separate thread using `-l` option. -# poll_seconds: SECONDS # default is 1. Sets the frequency of seconds the nvidia-smi tool is polled in loop mode. -# exclude_zero_memory_users: yes/no # default is no. Whether to collect users metrics with 0Mb memory allocation. -# -# ---------------------------------------------------------------------- diff --git a/src/collectors/python.d.plugin/openldap/integrations/openldap.md b/src/collectors/python.d.plugin/openldap/integrations/openldap.md index 97199f7dd..3f363343a 100644 --- a/src/collectors/python.d.plugin/openldap/integrations/openldap.md +++ b/src/collectors/python.d.plugin/openldap/integrations/openldap.md @@ -190,6 +190,7 @@ timeout: 1 ### Debug Mode + To troubleshoot issues with the `openldap` collector, run the `python.d.plugin` with the debug option enabled. The output should give you clues as to why the collector isn't working. @@ -212,4 +213,37 @@ should give you clues as to why the collector isn't working. ./python.d.plugin openldap debug trace ``` +### Getting Logs + +If you're encountering problems with the `openldap` collector, follow these steps to retrieve logs and identify potential issues: + +- **Run the command** specific to your system (systemd, non-systemd, or Docker container). +- **Examine the output** for any warnings or error messages that might indicate issues. These messages should provide clues about the root cause of the problem. + +#### System with systemd + +Use the following command to view logs generated since the last Netdata service restart: + +```bash +journalctl _SYSTEMD_INVOCATION_ID="$(systemctl show --value --property=InvocationID netdata)" --namespace=netdata --grep openldap +``` + +#### System without systemd + +Locate the collector log file, typically at `/var/log/netdata/collector.log`, and use `grep` to filter for collector's name: + +```bash +grep openldap /var/log/netdata/collector.log +``` + +**Note**: This method shows logs from all restarts. Focus on the **latest entries** for troubleshooting current issues. + +#### Docker Container + +If your Netdata runs in a Docker container named "netdata" (replace if different), use this command: + +```bash +docker logs netdata 2>&1 | grep openldap +``` + diff --git a/src/collectors/python.d.plugin/oracledb/integrations/oracle_db.md b/src/collectors/python.d.plugin/oracledb/integrations/oracle_db.md index 5b98fbd20..4cf1b54a4 100644 --- a/src/collectors/python.d.plugin/oracledb/integrations/oracle_db.md +++ b/src/collectors/python.d.plugin/oracledb/integrations/oracle_db.md @@ -201,6 +201,7 @@ remote: ### Debug Mode + To troubleshoot issues with the `oracledb` collector, run the `python.d.plugin` with the debug option enabled. The output should give you clues as to why the collector isn't working. @@ -223,4 +224,37 @@ should give you clues as to why the collector isn't working. ./python.d.plugin oracledb debug trace ``` +### Getting Logs + +If you're encountering problems with the `oracledb` collector, follow these steps to retrieve logs and identify potential issues: + +- **Run the command** specific to your system (systemd, non-systemd, or Docker container). +- **Examine the output** for any warnings or error messages that might indicate issues. These messages should provide clues about the root cause of the problem. + +#### System with systemd + +Use the following command to view logs generated since the last Netdata service restart: + +```bash +journalctl _SYSTEMD_INVOCATION_ID="$(systemctl show --value --property=InvocationID netdata)" --namespace=netdata --grep oracledb +``` + +#### System without systemd + +Locate the collector log file, typically at `/var/log/netdata/collector.log`, and use `grep` to filter for collector's name: + +```bash +grep oracledb /var/log/netdata/collector.log +``` + +**Note**: This method shows logs from all restarts. Focus on the **latest entries** for troubleshooting current issues. + +#### Docker Container + +If your Netdata runs in a Docker container named "netdata" (replace if different), use this command: + +```bash +docker logs netdata 2>&1 | grep oracledb +``` + diff --git a/src/collectors/python.d.plugin/pandas/integrations/pandas.md b/src/collectors/python.d.plugin/pandas/integrations/pandas.md index 898e23f0a..e0b5418c5 100644 --- a/src/collectors/python.d.plugin/pandas/integrations/pandas.md +++ b/src/collectors/python.d.plugin/pandas/integrations/pandas.md @@ -340,6 +340,7 @@ sql: ### Debug Mode + To troubleshoot issues with the `pandas` collector, run the `python.d.plugin` with the debug option enabled. The output should give you clues as to why the collector isn't working. @@ -362,4 +363,37 @@ should give you clues as to why the collector isn't working. ./python.d.plugin pandas debug trace ``` +### Getting Logs + +If you're encountering problems with the `pandas` collector, follow these steps to retrieve logs and identify potential issues: + +- **Run the command** specific to your system (systemd, non-systemd, or Docker container). +- **Examine the output** for any warnings or error messages that might indicate issues. These messages should provide clues about the root cause of the problem. + +#### System with systemd + +Use the following command to view logs generated since the last Netdata service restart: + +```bash +journalctl _SYSTEMD_INVOCATION_ID="$(systemctl show --value --property=InvocationID netdata)" --namespace=netdata --grep pandas +``` + +#### System without systemd + +Locate the collector log file, typically at `/var/log/netdata/collector.log`, and use `grep` to filter for collector's name: + +```bash +grep pandas /var/log/netdata/collector.log +``` + +**Note**: This method shows logs from all restarts. Focus on the **latest entries** for troubleshooting current issues. + +#### Docker Container + +If your Netdata runs in a Docker container named "netdata" (replace if different), use this command: + +```bash +docker logs netdata 2>&1 | grep pandas +``` + diff --git a/src/collectors/python.d.plugin/postfix/integrations/postfix.md b/src/collectors/python.d.plugin/postfix/integrations/postfix.md deleted file mode 100644 index 32cc52fbb..000000000 --- a/src/collectors/python.d.plugin/postfix/integrations/postfix.md +++ /dev/null @@ -1,151 +0,0 @@ -<!--startmeta -custom_edit_url: "https://github.com/netdata/netdata/edit/master/src/collectors/python.d.plugin/postfix/README.md" -meta_yaml: "https://github.com/netdata/netdata/edit/master/src/collectors/python.d.plugin/postfix/metadata.yaml" -sidebar_label: "Postfix" -learn_status: "Published" -learn_rel_path: "Collecting Metrics/Mail Servers" -most_popular: False -message: "DO NOT EDIT THIS FILE DIRECTLY, IT IS GENERATED BY THE COLLECTOR'S metadata.yaml FILE" -endmeta--> - -# Postfix - - -<img src="https://netdata.cloud/img/postfix.svg" width="150"/> - - -Plugin: python.d.plugin -Module: postfix - -<img src="https://img.shields.io/badge/maintained%20by-Netdata-%2300ab44" /> - -## Overview - -Keep an eye on Postfix metrics for efficient mail server operations. -Improve your mail server performance with Netdata's real-time metrics and built-in alerts. - - -Monitors MTA email queue statistics using [postqueue](http://www.postfix.org/postqueue.1.html) tool. - - -This collector is supported on all platforms. - -This collector supports collecting metrics from multiple instances of this integration, including remote instances. - -Postfix has internal access controls that limit activities on the mail queue. By default, all users are allowed to view the queue. If your system is configured with stricter access controls, you need to grant the `netdata` user access to view the mail queue. In order to do it, add `netdata` to `authorized_mailq_users` in the `/etc/postfix/main.cf` file. -See the `authorized_mailq_users` setting in the [Postfix documentation](https://www.postfix.org/postconf.5.html) for more details. - - -### Default Behavior - -#### Auto-Detection - -The collector executes `postqueue -p` to get Postfix queue statistics. - -#### Limits - -The default configuration for this integration does not impose any limits on data collection. - -#### Performance Impact - -The default configuration for this integration is not expected to impose a significant performance impact on the system. - - -## Metrics - -Metrics grouped by *scope*. - -The scope defines the instance that the metric belongs to. An instance is uniquely identified by a set of labels. - - - -### Per Postfix instance - -These metrics refer to the entire monitored application. - - -This scope has no labels. - -Metrics: - -| Metric | Dimensions | Unit | -|:------|:----------|:----| -| postfix.qemails | emails | emails | -| postfix.qsize | size | KiB | - - - -## Alerts - -There are no alerts configured by default for this integration. - - -## Setup - -### Prerequisites - -No action required. - -### Configuration - -#### File - -There is no configuration file. -#### Options - -There are 2 sections: - -* Global variables -* One or more JOBS that can define multiple different instances to monitor. - -The following options can be defined globally: priority, penalty, autodetection_retry, update_every, but can also be defined per JOB to override the global values. - -Additionally, the following collapsed table contains all the options that can be configured inside a JOB definition. - -Every configuration JOB starts with a `job_name` value which will appear in the dashboard, unless a `name` parameter is specified. - - -<details open><summary>Config options</summary> - -| Name | Description | Default | Required | -|:----|:-----------|:-------|:--------:| -| update_every | Sets the default data collection frequency. | 1 | no | -| priority | Controls the order of charts at the netdata dashboard. | 60000 | no | -| autodetection_retry | Sets the job re-check interval in seconds. | 0 | no | -| penalty | Indicates whether to apply penalty to update_every in case of failures. | yes | no | -| name | Job name. This value will overwrite the `job_name` value. JOBS with the same name are mutually exclusive. Only one of them will be allowed running at any time. This allows autodetection to try several alternatives and pick the one that works. | | no | - -</details> - -#### Examples -There are no configuration examples. - - - -## Troubleshooting - -### Debug Mode - -To troubleshoot issues with the `postfix` collector, run the `python.d.plugin` with the debug option enabled. The output -should give you clues as to why the collector isn't working. - -- Navigate to the `plugins.d` directory, usually at `/usr/libexec/netdata/plugins.d/`. If that's not the case on - your system, open `netdata.conf` and look for the `plugins` setting under `[directories]`. - - ```bash - cd /usr/libexec/netdata/plugins.d/ - ``` - -- Switch to the `netdata` user. - - ```bash - sudo -u netdata -s - ``` - -- Run the `python.d.plugin` to debug the collector: - - ```bash - ./python.d.plugin postfix debug trace - ``` - - diff --git a/src/collectors/python.d.plugin/postfix/metadata.yaml b/src/collectors/python.d.plugin/postfix/metadata.yaml deleted file mode 100644 index 1bbb61164..000000000 --- a/src/collectors/python.d.plugin/postfix/metadata.yaml +++ /dev/null @@ -1,124 +0,0 @@ -plugin_name: python.d.plugin -modules: - - meta: - plugin_name: python.d.plugin - module_name: postfix - monitored_instance: - name: Postfix - link: https://www.postfix.org/ - categories: - - data-collection.mail-servers - icon_filename: "postfix.svg" - related_resources: - integrations: - list: [] - info_provided_to_referring_integrations: - description: "" - keywords: - - postfix - - mail - - mail server - most_popular: false - overview: - data_collection: - metrics_description: > - Keep an eye on Postfix metrics for efficient mail server operations. - - Improve your mail server performance with Netdata's real-time metrics and built-in alerts. - method_description: > - Monitors MTA email queue statistics using [postqueue](http://www.postfix.org/postqueue.1.html) tool. - supported_platforms: - include: [] - exclude: [] - multi_instance: true - additional_permissions: - description: > - Postfix has internal access controls that limit activities on the mail queue. By default, all users are allowed to view - the queue. If your system is configured with stricter access controls, you need to grant the `netdata` user access to - view the mail queue. In order to do it, add `netdata` to `authorized_mailq_users` in the `/etc/postfix/main.cf` file. - - See the `authorized_mailq_users` setting in - the [Postfix documentation](https://www.postfix.org/postconf.5.html) for more details. - default_behavior: - auto_detection: - description: "The collector executes `postqueue -p` to get Postfix queue statistics." - limits: - description: "" - performance_impact: - description: "" - setup: - prerequisites: - list: [] - configuration: - file: - name: "" - description: "" - options: - description: | - There are 2 sections: - - * Global variables - * One or more JOBS that can define multiple different instances to monitor. - - The following options can be defined globally: priority, penalty, autodetection_retry, update_every, but can also be defined per JOB to override the global values. - - Additionally, the following collapsed table contains all the options that can be configured inside a JOB definition. - - Every configuration JOB starts with a `job_name` value which will appear in the dashboard, unless a `name` parameter is specified. - folding: - title: Config options - enabled: true - list: - - name: update_every - description: Sets the default data collection frequency. - default_value: 1 - required: false - - name: priority - description: Controls the order of charts at the netdata dashboard. - default_value: 60000 - required: false - - name: autodetection_retry - description: Sets the job re-check interval in seconds. - default_value: 0 - required: false - - name: penalty - description: Indicates whether to apply penalty to update_every in case of failures. - default_value: yes - required: false - - name: name - description: Job name. This value will overwrite the `job_name` value. JOBS with the same name are mutually exclusive. Only one of them will be allowed running at any time. This allows autodetection to try several alternatives and pick the one that works. - default_value: "" - required: false - examples: - folding: - enabled: true - title: "" - list: [] - troubleshooting: - problems: - list: [] - alerts: [] - metrics: - folding: - title: Metrics - enabled: false - description: "" - availability: [] - scopes: - - name: global - description: | - These metrics refer to the entire monitored application. - labels: [] - metrics: - - name: postfix.qemails - description: Postfix Queue Emails - unit: "emails" - chart_type: line - dimensions: - - name: emails - - name: postfix.qsize - description: Postfix Queue Emails Size - unit: "KiB" - chart_type: area - dimensions: - - name: size diff --git a/src/collectors/python.d.plugin/postfix/postfix.chart.py b/src/collectors/python.d.plugin/postfix/postfix.chart.py deleted file mode 100644 index b650514ee..000000000 --- a/src/collectors/python.d.plugin/postfix/postfix.chart.py +++ /dev/null @@ -1,52 +0,0 @@ -# -*- coding: utf-8 -*- -# Description: postfix netdata python.d module -# Author: Pawel Krupa (paulfantom) -# SPDX-License-Identifier: GPL-3.0-or-later - -from bases.FrameworkServices.ExecutableService import ExecutableService - -POSTQUEUE_COMMAND = 'postqueue -p' - -ORDER = [ - 'qemails', - 'qsize', -] - -CHARTS = { - 'qemails': { - 'options': [None, 'Postfix Queue Emails', 'emails', 'queue', 'postfix.qemails', 'line'], - 'lines': [ - ['emails', None, 'absolute'] - ] - }, - 'qsize': { - 'options': [None, 'Postfix Queue Emails Size', 'KiB', 'queue', 'postfix.qsize', 'area'], - 'lines': [ - ['size', None, 'absolute'] - ] - } -} - - -class Service(ExecutableService): - def __init__(self, configuration=None, name=None): - ExecutableService.__init__(self, configuration=configuration, name=name) - self.order = ORDER - self.definitions = CHARTS - self.command = POSTQUEUE_COMMAND - - def _get_data(self): - """ - Format data received from shell command - :return: dict - """ - try: - raw = self._get_raw_data()[-1].split(' ') - if raw[0] == 'Mail' and raw[1] == 'queue': - return {'emails': 0, - 'size': 0} - - return {'emails': raw[4], - 'size': raw[1]} - except (ValueError, AttributeError): - return None diff --git a/src/collectors/python.d.plugin/postfix/postfix.conf b/src/collectors/python.d.plugin/postfix/postfix.conf deleted file mode 100644 index a4d2472ee..000000000 --- a/src/collectors/python.d.plugin/postfix/postfix.conf +++ /dev/null @@ -1,72 +0,0 @@ -# netdata python.d.plugin configuration for postfix -# -# This file is in YaML format. Generally the format is: -# -# name: value -# -# There are 2 sections: -# - global variables -# - one or more JOBS -# -# JOBS allow you to collect values from multiple sources. -# Each source will have its own set of charts. -# -# JOB parameters have to be indented (using spaces only, example below). - -# ---------------------------------------------------------------------- -# Global Variables -# These variables set the defaults for all JOBs, however each JOB -# may define its own, overriding the defaults. - -# update_every sets the default data collection frequency. -# If unset, the python.d.plugin default is used. -# postfix is slow, so once every 10 seconds -update_every: 10 - -# priority controls the order of charts at the netdata dashboard. -# Lower numbers move the charts towards the top of the page. -# If unset, the default for python.d.plugin is used. -# priority: 60000 - -# penalty indicates whether to apply penalty to update_every in case of failures. -# Penalty will increase every 5 failed updates in a row. Maximum penalty is 10 minutes. -# penalty: yes - -# autodetection_retry sets the job re-check interval in seconds. -# The job is not deleted if check fails. -# Attempts to start the job are made once every autodetection_retry. -# This feature is disabled by default. -# autodetection_retry: 0 - -# ---------------------------------------------------------------------- -# JOBS (data collection sources) -# -# The default JOBS share the same *name*. JOBS with the same name -# are mutually exclusive. Only one of them will be allowed running at -# any time. This allows autodetection to try several alternatives and -# pick the one that works. -# -# Any number of jobs is supported. -# -# All python.d.plugin JOBS (for all its modules) support a set of -# predefined parameters. These are: -# -# job_name: -# name: myname # the JOB's name as it will appear at the -# # dashboard (by default is the job_name) -# # JOBs sharing a name are mutually exclusive -# update_every: 1 # the JOB's data collection frequency -# priority: 60000 # the JOB's order on the dashboard -# penalty: yes # the JOB's penalty -# autodetection_retry: 0 # the JOB's re-check interval in seconds -# -# Additionally to the above, postfix also supports the following: -# -# command: 'postqueue -p' # the command to run -# - -# ---------------------------------------------------------------------- -# AUTO-DETECTION JOBS - -local: - command: 'postqueue -p' diff --git a/src/collectors/python.d.plugin/puppet/integrations/puppet.md b/src/collectors/python.d.plugin/puppet/integrations/puppet.md deleted file mode 100644 index 438f9bdc9..000000000 --- a/src/collectors/python.d.plugin/puppet/integrations/puppet.md +++ /dev/null @@ -1,215 +0,0 @@ -<!--startmeta -custom_edit_url: "https://github.com/netdata/netdata/edit/master/src/collectors/python.d.plugin/puppet/README.md" -meta_yaml: "https://github.com/netdata/netdata/edit/master/src/collectors/python.d.plugin/puppet/metadata.yaml" -sidebar_label: "Puppet" -learn_status: "Published" -learn_rel_path: "Collecting Metrics/CICD Platforms" -most_popular: False -message: "DO NOT EDIT THIS FILE DIRECTLY, IT IS GENERATED BY THE COLLECTOR'S metadata.yaml FILE" -endmeta--> - -# Puppet - - -<img src="https://netdata.cloud/img/puppet.svg" width="150"/> - - -Plugin: python.d.plugin -Module: puppet - -<img src="https://img.shields.io/badge/maintained%20by-Netdata-%2300ab44" /> - -## Overview - -This collector monitors Puppet metrics about JVM Heap, Non-Heap, CPU usage and file descriptors.' - - -It uses Puppet's metrics API endpoint to gather the metrics. - - -This collector is supported on all platforms. - -This collector supports collecting metrics from multiple instances of this integration, including remote instances. - - -### Default Behavior - -#### Auto-Detection - -By default, this collector will use `https://fqdn.example.com:8140` as the URL to look for metrics. - -#### Limits - -The default configuration for this integration does not impose any limits on data collection. - -#### Performance Impact - -The default configuration for this integration is not expected to impose a significant performance impact on the system. - - -## Metrics - -Metrics grouped by *scope*. - -The scope defines the instance that the metric belongs to. An instance is uniquely identified by a set of labels. - - - -### Per Puppet instance - -These metrics refer to the entire monitored application. - -This scope has no labels. - -Metrics: - -| Metric | Dimensions | Unit | -|:------|:----------|:----| -| puppet.jvm_heap | committed, used | MiB | -| puppet.jvm_nonheap | committed, used | MiB | -| puppet.cpu | execution, GC | percentage | -| puppet.fdopen | used | descriptors | - - - -## Alerts - -There are no alerts configured by default for this integration. - - -## Setup - -### Prerequisites - -No action required. - -### Configuration - -#### File - -The configuration file name for this integration is `python.d/puppet.conf`. - - -You can edit the configuration file using the `edit-config` script from the -Netdata [config directory](/docs/netdata-agent/configuration/README.md#the-netdata-config-directory). - -```bash -cd /etc/netdata 2>/dev/null || cd /opt/netdata/etc/netdata -sudo ./edit-config python.d/puppet.conf -``` -#### Options - -This particular collector does not need further configuration to work if permissions are satisfied, but you can always customize it's data collection behavior. - -There are 2 sections: - -* Global variables -* One or more JOBS that can define multiple different instances to monitor. - -The following options can be defined globally: priority, penalty, autodetection_retry, update_every, but can also be defined per JOB to override the global values. - -Additionally, the following collapsed table contains all the options that can be configured inside a JOB definition. - -Every configuration JOB starts with a `job_name` value which will appear in the dashboard, unless a `name` parameter is specified. - -> Notes: -> - Exact Fully Qualified Domain Name of the node should be used. -> - Usually Puppet Server/DB startup time is VERY long. So, there should be quite reasonable retry count. -> - A secured PuppetDB config may require a client certificate. This does not apply to the default PuppetDB configuration though. - - -<details open><summary>Config options</summary> - -| Name | Description | Default | Required | -|:----|:-----------|:-------|:--------:| -| url | HTTP or HTTPS URL, exact Fully Qualified Domain Name of the node should be used. | https://fqdn.example.com:8081 | yes | -| tls_verify | Control HTTPS server certificate verification. | False | no | -| tls_ca_file | Optional CA (bundle) file to use | | no | -| tls_cert_file | Optional client certificate file | | no | -| tls_key_file | Optional client key file | | no | -| update_every | Sets the default data collection frequency. | 30 | no | -| priority | Controls the order of charts at the netdata dashboard. | 60000 | no | -| autodetection_retry | Sets the job re-check interval in seconds. | 0 | no | -| penalty | Indicates whether to apply penalty to update_every in case of failures. | yes | no | -| name | Job name. This value will overwrite the `job_name` value. JOBS with the same name are mutually exclusive. Only one of them will be allowed running at any time. This allows autodetection to try several alternatives and pick the one that works. | | no | - -</details> - -#### Examples - -##### Basic - -A basic example configuration - -```yaml -puppetserver: - url: 'https://fqdn.example.com:8140' - autodetection_retry: 1 - -``` -##### TLS Certificate - -An example using a TLS certificate - -<details open><summary>Config</summary> - -```yaml -puppetdb: - url: 'https://fqdn.example.com:8081' - tls_cert_file: /path/to/client.crt - tls_key_file: /path/to/client.key - autodetection_retry: 1 - -``` -</details> - -##### Multi-instance - -> **Note**: When you define multiple jobs, their names must be unique. - -Collecting metrics from local and remote instances. - - -<details open><summary>Config</summary> - -```yaml -puppetserver1: - url: 'https://fqdn.example.com:8140' - autodetection_retry: 1 - -puppetserver2: - url: 'https://fqdn.example2.com:8140' - autodetection_retry: 1 - -``` -</details> - - - -## Troubleshooting - -### Debug Mode - -To troubleshoot issues with the `puppet` collector, run the `python.d.plugin` with the debug option enabled. The output -should give you clues as to why the collector isn't working. - -- Navigate to the `plugins.d` directory, usually at `/usr/libexec/netdata/plugins.d/`. If that's not the case on - your system, open `netdata.conf` and look for the `plugins` setting under `[directories]`. - - ```bash - cd /usr/libexec/netdata/plugins.d/ - ``` - -- Switch to the `netdata` user. - - ```bash - sudo -u netdata -s - ``` - -- Run the `python.d.plugin` to debug the collector: - - ```bash - ./python.d.plugin puppet debug trace - ``` - - diff --git a/src/collectors/python.d.plugin/puppet/metadata.yaml b/src/collectors/python.d.plugin/puppet/metadata.yaml deleted file mode 100644 index 5f68dca7f..000000000 --- a/src/collectors/python.d.plugin/puppet/metadata.yaml +++ /dev/null @@ -1,185 +0,0 @@ -plugin_name: python.d.plugin -modules: - - meta: - plugin_name: python.d.plugin - module_name: puppet - monitored_instance: - name: Puppet - link: "https://www.puppet.com/" - categories: - - data-collection.ci-cd-systems - icon_filename: "puppet.svg" - related_resources: - integrations: - list: [] - info_provided_to_referring_integrations: - description: "" - keywords: - - puppet - - jvm heap - most_popular: false - overview: - data_collection: - metrics_description: | - This collector monitors Puppet metrics about JVM Heap, Non-Heap, CPU usage and file descriptors.' - method_description: | - It uses Puppet's metrics API endpoint to gather the metrics. - supported_platforms: - include: [] - exclude: [] - multi_instance: true - additional_permissions: - description: "" - default_behavior: - auto_detection: - description: By default, this collector will use `https://fqdn.example.com:8140` as the URL to look for metrics. - limits: - description: "" - performance_impact: - description: "" - setup: - prerequisites: - list: [] - configuration: - file: - name: "python.d/puppet.conf" - options: - description: | - This particular collector does not need further configuration to work if permissions are satisfied, but you can always customize it's data collection behavior. - - There are 2 sections: - - * Global variables - * One or more JOBS that can define multiple different instances to monitor. - - The following options can be defined globally: priority, penalty, autodetection_retry, update_every, but can also be defined per JOB to override the global values. - - Additionally, the following collapsed table contains all the options that can be configured inside a JOB definition. - - Every configuration JOB starts with a `job_name` value which will appear in the dashboard, unless a `name` parameter is specified. - - > Notes: - > - Exact Fully Qualified Domain Name of the node should be used. - > - Usually Puppet Server/DB startup time is VERY long. So, there should be quite reasonable retry count. - > - A secured PuppetDB config may require a client certificate. This does not apply to the default PuppetDB configuration though. - folding: - title: "Config options" - enabled: true - list: - - name: url - description: HTTP or HTTPS URL, exact Fully Qualified Domain Name of the node should be used. - default_value: https://fqdn.example.com:8081 - required: true - - name: tls_verify - description: Control HTTPS server certificate verification. - default_value: "False" - required: false - - name: tls_ca_file - description: Optional CA (bundle) file to use - default_value: "" - required: false - - name: tls_cert_file - description: Optional client certificate file - default_value: "" - required: false - - name: tls_key_file - description: Optional client key file - default_value: "" - required: false - - name: update_every - description: Sets the default data collection frequency. - default_value: 30 - required: false - - name: priority - description: Controls the order of charts at the netdata dashboard. - default_value: 60000 - required: false - - name: autodetection_retry - description: Sets the job re-check interval in seconds. - default_value: 0 - required: false - - name: penalty - description: Indicates whether to apply penalty to update_every in case of failures. - default_value: yes - required: false - - name: name - description: > - Job name. This value will overwrite the `job_name` value. JOBS with the same name are mutually exclusive. Only one of them will be allowed running at any time. This allows autodetection to try several alternatives and pick the one that works. - default_value: "" - required: false - examples: - folding: - enabled: true - title: "Config" - list: - - name: Basic - description: A basic example configuration - folding: - enabled: false - config: | - puppetserver: - url: 'https://fqdn.example.com:8140' - autodetection_retry: 1 - - name: TLS Certificate - description: An example using a TLS certificate - config: | - puppetdb: - url: 'https://fqdn.example.com:8081' - tls_cert_file: /path/to/client.crt - tls_key_file: /path/to/client.key - autodetection_retry: 1 - - name: Multi-instance - description: | - > **Note**: When you define multiple jobs, their names must be unique. - - Collecting metrics from local and remote instances. - config: | - puppetserver1: - url: 'https://fqdn.example.com:8140' - autodetection_retry: 1 - - puppetserver2: - url: 'https://fqdn.example2.com:8140' - autodetection_retry: 1 - troubleshooting: - problems: - list: [] - alerts: [] - metrics: - folding: - title: Metrics - enabled: false - description: "" - availability: [] - scopes: - - name: global - description: "These metrics refer to the entire monitored application." - labels: [] - metrics: - - name: puppet.jvm_heap - description: JVM Heap - unit: "MiB" - chart_type: area - dimensions: - - name: committed - - name: used - - name: puppet.jvm_nonheap - description: JVM Non-Heap - unit: "MiB" - chart_type: area - dimensions: - - name: committed - - name: used - - name: puppet.cpu - description: CPU usage - unit: "percentage" - chart_type: stacked - dimensions: - - name: execution - - name: GC - - name: puppet.fdopen - description: File Descriptors - unit: "descriptors" - chart_type: line - dimensions: - - name: used diff --git a/src/collectors/python.d.plugin/puppet/puppet.chart.py b/src/collectors/python.d.plugin/puppet/puppet.chart.py deleted file mode 100644 index 0e5b781f5..000000000 --- a/src/collectors/python.d.plugin/puppet/puppet.chart.py +++ /dev/null @@ -1,121 +0,0 @@ -# -*- coding: utf-8 -*- -# Description: puppet netdata python.d module -# Author: Andrey Galkin <andrey@futoin.org> (andvgal) -# SPDX-License-Identifier: GPL-3.0-or-later -# -# This module should work both with OpenSource and PE versions -# of PuppetServer and PuppetDB. -# -# NOTE: PuppetDB may be configured to require proper TLS -# client certificate for security reasons. Use tls_key_file -# and tls_cert_file options then. -# - -import socket -from json import loads - -from bases.FrameworkServices.UrlService import UrlService - -update_every = 5 - -MiB = 1 << 20 -CPU_SCALE = 1000 - -ORDER = [ - 'jvm_heap', - 'jvm_nonheap', - 'cpu', - 'fd_open', -] - -CHARTS = { - 'jvm_heap': { - 'options': [None, 'JVM Heap', 'MiB', 'resources', 'puppet.jvm_heap', 'area'], - 'lines': [ - ['jvm_heap_committed', 'committed', 'absolute', 1, MiB], - ['jvm_heap_used', 'used', 'absolute', 1, MiB], - ], - 'variables': [ - ['jvm_heap_max'], - ['jvm_heap_init'], - ], - }, - 'jvm_nonheap': { - 'options': [None, 'JVM Non-Heap', 'MiB', 'resources', 'puppet.jvm_nonheap', 'area'], - 'lines': [ - ['jvm_nonheap_committed', 'committed', 'absolute', 1, MiB], - ['jvm_nonheap_used', 'used', 'absolute', 1, MiB], - ], - 'variables': [ - ['jvm_nonheap_max'], - ['jvm_nonheap_init'], - ], - }, - 'cpu': { - 'options': [None, 'CPU usage', 'percentage', 'resources', 'puppet.cpu', 'stacked'], - 'lines': [ - ['cpu_time', 'execution', 'absolute', 1, CPU_SCALE], - ['gc_time', 'GC', 'absolute', 1, CPU_SCALE], - ] - }, - 'fd_open': { - 'options': [None, 'File Descriptors', 'descriptors', 'resources', 'puppet.fdopen', 'line'], - 'lines': [ - ['fd_used', 'used', 'absolute'], - ], - 'variables': [ - ['fd_max'], - ], - }, -} - - -class Service(UrlService): - def __init__(self, configuration=None, name=None): - UrlService.__init__(self, configuration=configuration, name=name) - self.order = ORDER - self.definitions = CHARTS - self.url = 'https://{0}:8140'.format(socket.getfqdn()) - - def _get_data(self): - # NOTE: there are several ways to retrieve data - # 1. Only PE versions: - # https://puppet.com/docs/pe/2018.1/api_status/status_api_metrics_endpoints.html - # 2. Individual Metrics API (JMX): - # https://puppet.com/docs/pe/2018.1/api_status/metrics_api.html - # 3. Extended status at debug level: - # https://puppet.com/docs/pe/2018.1/api_status/status_api_json_endpoints.html - # - # For sake of simplicity and efficiency the status one is used.. - - raw_data = self._get_raw_data(self.url + '/status/v1/services?level=debug') - - if raw_data is None: - return None - - raw_data = loads(raw_data) - data = {} - - try: - try: - jvm_metrics = raw_data['status-service']['status']['experimental']['jvm-metrics'] - except KeyError: - jvm_metrics = raw_data['status-service']['status']['jvm-metrics'] - - heap_mem = jvm_metrics['heap-memory'] - non_heap_mem = jvm_metrics['non-heap-memory'] - - for k in ['max', 'committed', 'used', 'init']: - data['jvm_heap_' + k] = heap_mem[k] - data['jvm_nonheap_' + k] = non_heap_mem[k] - - fd_open = jvm_metrics['file-descriptors'] - data['fd_max'] = fd_open['max'] - data['fd_used'] = fd_open['used'] - - data['cpu_time'] = int(jvm_metrics['cpu-usage'] * CPU_SCALE) - data['gc_time'] = int(jvm_metrics['gc-cpu-usage'] * CPU_SCALE) - except KeyError: - pass - - return data or None diff --git a/src/collectors/python.d.plugin/puppet/puppet.conf b/src/collectors/python.d.plugin/puppet/puppet.conf deleted file mode 100644 index ff5c3d020..000000000 --- a/src/collectors/python.d.plugin/puppet/puppet.conf +++ /dev/null @@ -1,94 +0,0 @@ -# netdata python.d.plugin configuration for Puppet Server and Puppet DB -# -# This file is in YaML format. Generally the format is: -# -# name: value -# -# There are 2 sections: -# - global variables -# - one or more JOBS -# -# JOBS allow you to collect values from multiple sources. -# Each source will have its own set of charts. -# -# JOB parameters have to be indented (using spaces only, example below). - -# ---------------------------------------------------------------------- -# Global Variables -# These variables set the defaults for all JOBs, however each JOB -# may define its own, overriding the defaults. - -# update_every sets the default data collection frequency. -# If unset, the python.d.plugin default is used. -# update_every: 1 - -# priority controls the order of charts at the netdata dashboard. -# Lower numbers move the charts towards the top of the page. -# If unset, the default for python.d.plugin is used. -# priority: 60000 - -# penalty indicates whether to apply penalty to update_every in case of failures. -# Penalty will increase every 5 failed updates in a row. Maximum penalty is 10 minutes. -# penalty: yes - -# autodetection_retry sets the job re-check interval in seconds. -# The job is not deleted if check fails. -# Attempts to start the job are made once every autodetection_retry. -# This feature is disabled by default. -# autodetection_retry: 0 - -# ---------------------------------------------------------------------- -# JOBS (data collection sources) -# -# The default JOBS share the same *name*. JOBS with the same name -# are mutually exclusive. Only one of them will be allowed running at -# any time. This allows autodetection to try several alternatives and -# pick the one that works. -# -# Any number of jobs is supported. -# -# All python.d.plugin JOBS (for all its modules) support a set of -# predefined parameters. These are: -# -# job_name: -# name: myname # the JOB's name as it will appear at the -# # dashboard (by default is the job_name) -# # JOBs sharing a name are mutually exclusive -# update_every: 1 # the JOB's data collection frequency -# priority: 60000 # the JOB's order on the dashboard -# penalty: yes # the JOB's penalty -# autodetection_retry: 0 # the JOB's re-check interval in seconds -# -# These configuration comes from UrlService base: -# url: # HTTP or HTTPS URL -# tls_verify: False # Control HTTPS server certificate verification -# tls_ca_file: # Optional CA (bundle) file to use -# tls_cert_file: # Optional client certificate file -# tls_key_file: # Optional client key file -# -# ---------------------------------------------------------------------- -# AUTO-DETECTION JOBS -# only one of them will run (they have the same name) -# puppet: -# url: 'https://<FQDN>:8140' -# - -# -# Production configuration should look like below. -# -# NOTE: usually Puppet Server/DB startup time is VERY long. So, there should -# be quite reasonable retry count. -# -# NOTE: secure PuppetDB config may require client certificate. -# Not applies to default PuppetDB configuration though. -# -# puppetdb: -# url: 'https://fqdn.example.com:8081' -# tls_cert_file: /path/to/client.crt -# tls_key_file: /path/to/client.key -# autodetection_retry: 1 -# -# puppetserver: -# url: 'https://fqdn.example.com:8140' -# autodetection_retry: 1 -# diff --git a/src/collectors/python.d.plugin/python.d.conf b/src/collectors/python.d.plugin/python.d.conf index 470b4bbb7..4fcecc75d 100644 --- a/src/collectors/python.d.plugin/python.d.conf +++ b/src/collectors/python.d.plugin/python.d.conf @@ -25,43 +25,21 @@ gc_run: yes ## Garbage collection interval in seconds. Default is 300. gc_interval: 300 -# alarms: yes # am2320: yes # anomalies: no -# beanstalk: yes -# bind_rndc: yes # boinc: yes # ceph: yes -# changefinder: no -# dovecot: yes # this is just an example -example: no -# exim: yes -# gearman: yes go_expvar: no # haproxy: yes -# icecast: yes -# ipfs: yes -# memcached: yes -# monit: yes -# nvidia_smi: yes -# nsd: yes # openldap: yes # oracledb: yes # pandas: yes -# postfix: yes -# puppet: yes -# rethinkdbs: yes # retroshare: yes -# riakkv: yes # samba: yes # smartd_log: yes # spigotmc: yes -# squid: yes # traefik: yes -# tomcat: yes -# tor: yes -# uwsgi: yes # varnish: yes # w1sensor: yes # zscores: no @@ -70,17 +48,35 @@ go_expvar: no ## Disabled for existing installations. adaptec_raid: no # Removed (replaced with go.d/adaptercraid). apache: no # Removed (replaced with go.d/apache). +beanstalk: no # Removed (replaced with go.d/beanstalk). +dovecot: no # Removed (replaced with go.d/dovecot). elasticsearch: no # Removed (replaced with go.d/elasticsearch). +exim: no # Removed (replaced with go.d/exim). fail2ban: no # Removed (replaced with go.d/fail2ban). freeradius: no # Removed (replaced with go.d/freeradius). +gearman: no # Removed (replaced with go.d/gearman). hddtemp: no # Removed (replaced with go.d/hddtemp). hpssa: no # Removed (replaced with go.d/hpssa). +icecast: no # Removed (replaced with go.d/icecast) +ipfs: no # Removed (replaced with go.d/ipfs). litespeed: no # Removed (replaced with go.d/litespeed). megacli: no # Removed (replaced with go.d/megacli). +memcached: no # Removed (replaced with go.d/memcached). mongodb: no # Removed (replaced with go.d/mongodb). +monit: no # Removed (replaced with go.d/monit). mysql: no # Removed (replaced with go.d/mysql). nginx: no # Removed (replaced with go.d/nginx). +nsd: no # Removed (replaced with go.d/nsd). +nvidia_smi: no # Removed (replaced with go.d/nvidia_smi). +postfix: no # Removed (replaced with go.d/postfix). postgres: no # Removed (replaced with go.d/postgres). proxysql: no # Removed (replaced with go.d/proxysql). redis: no # Removed (replaced with go.d/redis). +rethinkdbs: no # Removed (replaced with go.d/rethinkdb). +riakkv: no # Removed (replaced with go.d/riak). sensors: no # Removed (replaced with go.d/sensors). +squid: no # Removed (replaced with go.d/squid). +tomcat: no # Removed (replaced with go.d/tomcat) +tor: no # Removed (replaced with go.d/tor). +puppet: no # Removed (replaced with go.d/puppet). +uwsgi: no # Removed (replaced with go.d/uwsgi). diff --git a/src/collectors/python.d.plugin/python_modules/third_party/lm_sensors.py b/src/collectors/python.d.plugin/python_modules/third_party/lm_sensors.py deleted file mode 100644 index f873eac83..000000000 --- a/src/collectors/python.d.plugin/python_modules/third_party/lm_sensors.py +++ /dev/null @@ -1,327 +0,0 @@ -# SPDX-License-Identifier: LGPL-2.1 -""" -@package sensors.py -Python Bindings for libsensors3 - -use the documentation of libsensors for the low level API. -see example.py for high level API usage. - -@author: Pavel Rojtberg (http://www.rojtberg.net) -@see: https://github.com/paroj/sensors.py -@copyright: LGPLv2 (same as libsensors) <http://opensource.org/licenses/LGPL-2.1> -""" - -from ctypes import * -import ctypes.util - -_libc = cdll.LoadLibrary(ctypes.util.find_library("c")) -# see https://github.com/paroj/sensors.py/issues/1 -_libc.free.argtypes = [c_void_p] - -_hdl = cdll.LoadLibrary(ctypes.util.find_library("sensors")) - -version = c_char_p.in_dll(_hdl, "libsensors_version").value.decode("ascii") - - -class SensorsError(Exception): - pass - - -class ErrorWildcards(SensorsError): - pass - - -class ErrorNoEntry(SensorsError): - pass - - -class ErrorAccessRead(SensorsError, OSError): - pass - - -class ErrorKernel(SensorsError, OSError): - pass - - -class ErrorDivZero(SensorsError, ZeroDivisionError): - pass - - -class ErrorChipName(SensorsError): - pass - - -class ErrorBusName(SensorsError): - pass - - -class ErrorParse(SensorsError): - pass - - -class ErrorAccessWrite(SensorsError, OSError): - pass - - -class ErrorIO(SensorsError, IOError): - pass - - -class ErrorRecursion(SensorsError): - pass - - -_ERR_MAP = { - 1: ErrorWildcards, - 2: ErrorNoEntry, - 3: ErrorAccessRead, - 4: ErrorKernel, - 5: ErrorDivZero, - 6: ErrorChipName, - 7: ErrorBusName, - 8: ErrorParse, - 9: ErrorAccessWrite, - 10: ErrorIO, - 11: ErrorRecursion -} - - -def raise_sensor_error(errno, message=''): - raise _ERR_MAP[abs(errno)](message) - - -class bus_id(Structure): - _fields_ = [("type", c_short), - ("nr", c_short)] - - -class chip_name(Structure): - _fields_ = [("prefix", c_char_p), - ("bus", bus_id), - ("addr", c_int), - ("path", c_char_p)] - - -class feature(Structure): - _fields_ = [("name", c_char_p), - ("number", c_int), - ("type", c_int)] - - # sensors_feature_type - IN = 0x00 - FAN = 0x01 - TEMP = 0x02 - POWER = 0x03 - ENERGY = 0x04 - CURR = 0x05 - HUMIDITY = 0x06 - MAX_MAIN = 0x7 - VID = 0x10 - INTRUSION = 0x11 - MAX_OTHER = 0x12 - BEEP_ENABLE = 0x18 - - -class subfeature(Structure): - _fields_ = [("name", c_char_p), - ("number", c_int), - ("type", c_int), - ("mapping", c_int), - ("flags", c_uint)] - - -_hdl.sensors_get_detected_chips.restype = POINTER(chip_name) -_hdl.sensors_get_features.restype = POINTER(feature) -_hdl.sensors_get_all_subfeatures.restype = POINTER(subfeature) -_hdl.sensors_get_label.restype = c_void_p # return pointer instead of str so we can free it -_hdl.sensors_get_adapter_name.restype = c_char_p # docs do not say whether to free this or not -_hdl.sensors_strerror.restype = c_char_p - -### RAW API ### -MODE_R = 1 -MODE_W = 2 -COMPUTE_MAPPING = 4 - - -def init(cfg_file=None): - file = _libc.fopen(cfg_file.encode("utf-8"), "r") if cfg_file is not None else None - - result = _hdl.sensors_init(file) - if result != 0: - raise_sensor_error(result, "sensors_init failed") - - if file is not None: - _libc.fclose(file) - - -def cleanup(): - _hdl.sensors_cleanup() - - -def parse_chip_name(orig_name): - ret = chip_name() - err = _hdl.sensors_parse_chip_name(orig_name.encode("utf-8"), byref(ret)) - - if err < 0: - raise_sensor_error(err, strerror(err)) - - return ret - - -def strerror(errnum): - return _hdl.sensors_strerror(errnum).decode("utf-8") - - -def free_chip_name(chip): - _hdl.sensors_free_chip_name(byref(chip)) - - -def get_detected_chips(match, nr): - """ - @return: (chip, next nr to query) - """ - _nr = c_int(nr) - - if match is not None: - match = byref(match) - - chip = _hdl.sensors_get_detected_chips(match, byref(_nr)) - chip = chip.contents if bool(chip) else None - return chip, _nr.value - - -def chip_snprintf_name(chip, buffer_size=200): - """ - @param buffer_size defaults to the size used in the sensors utility - """ - ret = create_string_buffer(buffer_size) - err = _hdl.sensors_snprintf_chip_name(ret, buffer_size, byref(chip)) - - if err < 0: - raise_sensor_error(err, strerror(err)) - - return ret.value.decode("utf-8") - - -def do_chip_sets(chip): - """ - @attention this function was not tested - """ - err = _hdl.sensors_do_chip_sets(byref(chip)) - if err < 0: - raise_sensor_error(err, strerror(err)) - - -def get_adapter_name(bus): - return _hdl.sensors_get_adapter_name(byref(bus)).decode("utf-8") - - -def get_features(chip, nr): - """ - @return: (feature, next nr to query) - """ - _nr = c_int(nr) - feature = _hdl.sensors_get_features(byref(chip), byref(_nr)) - feature = feature.contents if bool(feature) else None - return feature, _nr.value - - -def get_label(chip, feature): - ptr = _hdl.sensors_get_label(byref(chip), byref(feature)) - val = cast(ptr, c_char_p).value.decode("utf-8") - _libc.free(ptr) - return val - - -def get_all_subfeatures(chip, feature, nr): - """ - @return: (subfeature, next nr to query) - """ - _nr = c_int(nr) - subfeature = _hdl.sensors_get_all_subfeatures(byref(chip), byref(feature), byref(_nr)) - subfeature = subfeature.contents if bool(subfeature) else None - return subfeature, _nr.value - - -def get_value(chip, subfeature_nr): - val = c_double() - err = _hdl.sensors_get_value(byref(chip), subfeature_nr, byref(val)) - if err < 0: - raise_sensor_error(err, strerror(err)) - return val.value - - -def set_value(chip, subfeature_nr, value): - """ - @attention this function was not tested - """ - val = c_double(value) - err = _hdl.sensors_set_value(byref(chip), subfeature_nr, byref(val)) - if err < 0: - raise_sensor_error(err, strerror(err)) - - -### Convenience API ### -class ChipIterator: - def __init__(self, match=None): - self.match = parse_chip_name(match) if match is not None else None - self.nr = 0 - - def __iter__(self): - return self - - def __next__(self): - chip, self.nr = get_detected_chips(self.match, self.nr) - - if chip is None: - raise StopIteration - - return chip - - def __del__(self): - if self.match is not None: - free_chip_name(self.match) - - def next(self): # python2 compability - return self.__next__() - - -class FeatureIterator: - def __init__(self, chip): - self.chip = chip - self.nr = 0 - - def __iter__(self): - return self - - def __next__(self): - feature, self.nr = get_features(self.chip, self.nr) - - if feature is None: - raise StopIteration - - return feature - - def next(self): # python2 compability - return self.__next__() - - -class SubFeatureIterator: - def __init__(self, chip, feature): - self.chip = chip - self.feature = feature - self.nr = 0 - - def __iter__(self): - return self - - def __next__(self): - subfeature, self.nr = get_all_subfeatures(self.chip, self.feature, self.nr) - - if subfeature is None: - raise StopIteration - - return subfeature - - def next(self): # python2 compability - return self.__next__() diff --git a/src/collectors/python.d.plugin/rethinkdbs/integrations/rethinkdb.md b/src/collectors/python.d.plugin/rethinkdbs/integrations/rethinkdb.md deleted file mode 100644 index f7da12dd6..000000000 --- a/src/collectors/python.d.plugin/rethinkdbs/integrations/rethinkdb.md +++ /dev/null @@ -1,190 +0,0 @@ -<!--startmeta -custom_edit_url: "https://github.com/netdata/netdata/edit/master/src/collectors/python.d.plugin/rethinkdbs/README.md" -meta_yaml: "https://github.com/netdata/netdata/edit/master/src/collectors/python.d.plugin/rethinkdbs/metadata.yaml" -sidebar_label: "RethinkDB" -learn_status: "Published" -learn_rel_path: "Collecting Metrics/Databases" -most_popular: False -message: "DO NOT EDIT THIS FILE DIRECTLY, IT IS GENERATED BY THE COLLECTOR'S metadata.yaml FILE" -endmeta--> - -# RethinkDB - - -<img src="https://netdata.cloud/img/rethinkdb.png" width="150"/> - - -Plugin: python.d.plugin -Module: rethinkdbs - -<img src="https://img.shields.io/badge/maintained%20by-Netdata-%2300ab44" /> - -## Overview - -This collector monitors metrics about RethinkDB clusters and database servers. - -It uses the `rethinkdb` python module to connect to a RethinkDB server instance and gather statistics. - -This collector is supported on all platforms. - -This collector supports collecting metrics from multiple instances of this integration, including remote instances. - - -### Default Behavior - -#### Auto-Detection - -When no configuration file is found, the collector tries to connect to 127.0.0.1:28015. - -#### Limits - -The default configuration for this integration does not impose any limits on data collection. - -#### Performance Impact - -The default configuration for this integration is not expected to impose a significant performance impact on the system. - - -## Metrics - -Metrics grouped by *scope*. - -The scope defines the instance that the metric belongs to. An instance is uniquely identified by a set of labels. - - - -### Per RethinkDB instance - -These metrics refer to the entire monitored application. - -This scope has no labels. - -Metrics: - -| Metric | Dimensions | Unit | -|:------|:----------|:----| -| rethinkdb.cluster_connected_servers | connected, missing | servers | -| rethinkdb.cluster_clients_active | active | clients | -| rethinkdb.cluster_queries | queries | queries/s | -| rethinkdb.cluster_documents | reads, writes | documents/s | - -### Per database server - - - -This scope has no labels. - -Metrics: - -| Metric | Dimensions | Unit | -|:------|:----------|:----| -| rethinkdb.client_connections | connections | connections | -| rethinkdb.clients_active | active | clients | -| rethinkdb.queries | queries | queries/s | -| rethinkdb.documents | reads, writes | documents/s | - - - -## Alerts - -There are no alerts configured by default for this integration. - - -## Setup - -### Prerequisites - -#### Required python module - -The collector requires the `rethinkdb` python module to be installed. - - -### Configuration - -#### File - -The configuration file name for this integration is `python.d/rethinkdbs.conf`. - - -You can edit the configuration file using the `edit-config` script from the -Netdata [config directory](/docs/netdata-agent/configuration/README.md#the-netdata-config-directory). - -```bash -cd /etc/netdata 2>/dev/null || cd /opt/netdata/etc/netdata -sudo ./edit-config python.d/rethinkdbs.conf -``` -#### Options - -There are 2 sections: - -* Global variables -* One or more JOBS that can define multiple different instances to monitor. - -The following options can be defined globally: priority, penalty, autodetection_retry, update_every, but can also be defined per JOB to override the global values. - -Additionally, the following collapsed table contains all the options that can be configured inside a JOB definition. - -Every configuration JOB starts with a `job_name` value which will appear in the dashboard, unless a `name` parameter is specified. - - -<details open><summary>Config options</summary> - -| Name | Description | Default | Required | -|:----|:-----------|:-------|:--------:| -| update_every | Sets the default data collection frequency. | 5 | no | -| priority | Controls the order of charts at the netdata dashboard. | 60000 | no | -| autodetection_retry | Sets the job re-check interval in seconds. | 0 | no | -| penalty | Indicates whether to apply penalty to update_every in case of failures. | yes | no | -| name | Job name. This value will overwrite the `job_name` value. JOBS with the same name are mutually exclusive. Only one of them will be allowed running at any time. This allows autodetection to try several alternatives and pick the one that works. | | no | -| host | Hostname or ip of the RethinkDB server. | localhost | no | -| port | Port to connect to the RethinkDB server. | 28015 | no | -| user | The username to use to connect to the RethinkDB server. | admin | no | -| password | The password to use to connect to the RethinkDB server. | | no | -| timeout | Set a connect timeout to the RethinkDB server. | 2 | no | - -</details> - -#### Examples - -##### Local RethinkDB server - -An example of a configuration for a local RethinkDB server - -```yaml -localhost: - name: 'local' - host: '127.0.0.1' - port: 28015 - user: "user" - password: "pass" - -``` - - -## Troubleshooting - -### Debug Mode - -To troubleshoot issues with the `rethinkdbs` collector, run the `python.d.plugin` with the debug option enabled. The output -should give you clues as to why the collector isn't working. - -- Navigate to the `plugins.d` directory, usually at `/usr/libexec/netdata/plugins.d/`. If that's not the case on - your system, open `netdata.conf` and look for the `plugins` setting under `[directories]`. - - ```bash - cd /usr/libexec/netdata/plugins.d/ - ``` - -- Switch to the `netdata` user. - - ```bash - sudo -u netdata -s - ``` - -- Run the `python.d.plugin` to debug the collector: - - ```bash - ./python.d.plugin rethinkdbs debug trace - ``` - - diff --git a/src/collectors/python.d.plugin/rethinkdbs/metadata.yaml b/src/collectors/python.d.plugin/rethinkdbs/metadata.yaml deleted file mode 100644 index bbc50eac6..000000000 --- a/src/collectors/python.d.plugin/rethinkdbs/metadata.yaml +++ /dev/null @@ -1,188 +0,0 @@ -plugin_name: python.d.plugin -modules: - - meta: - plugin_name: python.d.plugin - module_name: rethinkdbs - monitored_instance: - name: RethinkDB - link: 'https://rethinkdb.com/' - categories: - - data-collection.database-servers - icon_filename: 'rethinkdb.png' - related_resources: - integrations: - list: [] - info_provided_to_referring_integrations: - description: '' - keywords: - - rethinkdb - - database - - db - most_popular: false - overview: - data_collection: - metrics_description: 'This collector monitors metrics about RethinkDB clusters and database servers.' - method_description: 'It uses the `rethinkdb` python module to connect to a RethinkDB server instance and gather statistics.' - supported_platforms: - include: [] - exclude: [] - multi_instance: true - additional_permissions: - description: '' - default_behavior: - auto_detection: - description: 'When no configuration file is found, the collector tries to connect to 127.0.0.1:28015.' - limits: - description: '' - performance_impact: - description: '' - setup: - prerequisites: - list: - - title: 'Required python module' - description: 'The collector requires the `rethinkdb` python module to be installed.' - configuration: - file: - name: python.d/rethinkdbs.conf - options: - description: | - There are 2 sections: - - * Global variables - * One or more JOBS that can define multiple different instances to monitor. - - The following options can be defined globally: priority, penalty, autodetection_retry, update_every, but can also be defined per JOB to override the global values. - - Additionally, the following collapsed table contains all the options that can be configured inside a JOB definition. - - Every configuration JOB starts with a `job_name` value which will appear in the dashboard, unless a `name` parameter is specified. - folding: - title: "Config options" - enabled: true - list: - - name: update_every - description: Sets the default data collection frequency. - default_value: 5 - required: false - - name: priority - description: Controls the order of charts at the netdata dashboard. - default_value: 60000 - required: false - - name: autodetection_retry - description: Sets the job re-check interval in seconds. - default_value: 0 - required: false - - name: penalty - description: Indicates whether to apply penalty to update_every in case of failures. - default_value: yes - required: false - - name: name - description: Job name. This value will overwrite the `job_name` value. JOBS with the same name are mutually exclusive. Only one of them will be allowed running at any time. This allows autodetection to try several alternatives and pick the one that works. - default_value: '' - required: false - - name: host - description: Hostname or ip of the RethinkDB server. - default_value: 'localhost' - required: false - - name: port - description: Port to connect to the RethinkDB server. - default_value: '28015' - required: false - - name: user - description: The username to use to connect to the RethinkDB server. - default_value: 'admin' - required: false - - name: password - description: The password to use to connect to the RethinkDB server. - default_value: '' - required: false - - name: timeout - description: Set a connect timeout to the RethinkDB server. - default_value: '2' - required: false - examples: - folding: - enabled: false - title: "Config" - list: - - name: Local RethinkDB server - description: An example of a configuration for a local RethinkDB server - folding: - enabled: false - config: | - localhost: - name: 'local' - host: '127.0.0.1' - port: 28015 - user: "user" - password: "pass" - troubleshooting: - problems: - list: [] - alerts: [] - metrics: - folding: - title: Metrics - enabled: false - description: "" - availability: [] - scopes: - - name: global - description: "These metrics refer to the entire monitored application." - labels: [] - metrics: - - name: rethinkdb.cluster_connected_servers - description: Connected Servers - unit: "servers" - chart_type: stacked - dimensions: - - name: connected - - name: missing - - name: rethinkdb.cluster_clients_active - description: Active Clients - unit: "clients" - chart_type: line - dimensions: - - name: active - - name: rethinkdb.cluster_queries - description: Queries - unit: "queries/s" - chart_type: line - dimensions: - - name: queries - - name: rethinkdb.cluster_documents - description: Documents - unit: "documents/s" - chart_type: line - dimensions: - - name: reads - - name: writes - - name: database server - description: "" - labels: [] - metrics: - - name: rethinkdb.client_connections - description: Client Connections - unit: "connections" - chart_type: line - dimensions: - - name: connections - - name: rethinkdb.clients_active - description: Active Clients - unit: "clients" - chart_type: line - dimensions: - - name: active - - name: rethinkdb.queries - description: Queries - unit: "queries/s" - chart_type: line - dimensions: - - name: queries - - name: rethinkdb.documents - description: Documents - unit: "documents/s" - chart_type: line - dimensions: - - name: reads - - name: writes diff --git a/src/collectors/python.d.plugin/rethinkdbs/rethinkdbs.chart.py b/src/collectors/python.d.plugin/rethinkdbs/rethinkdbs.chart.py deleted file mode 100644 index e3fbc3632..000000000 --- a/src/collectors/python.d.plugin/rethinkdbs/rethinkdbs.chart.py +++ /dev/null @@ -1,247 +0,0 @@ -# -*- coding: utf-8 -*- -# Description: rethinkdb netdata python.d module -# Author: Ilya Mashchenko (ilyam8) -# SPDX-License-Identifier: GPL-3.0-or-later - -try: - import rethinkdb as rdb - - HAS_RETHINKDB = True -except ImportError: - HAS_RETHINKDB = False - -from bases.FrameworkServices.SimpleService import SimpleService - -ORDER = [ - 'cluster_connected_servers', - 'cluster_clients_active', - 'cluster_queries', - 'cluster_documents', -] - - -def cluster_charts(): - return { - 'cluster_connected_servers': { - 'options': [None, 'Connected Servers', 'servers', 'cluster', 'rethinkdb.cluster_connected_servers', - 'stacked'], - 'lines': [ - ['cluster_servers_connected', 'connected'], - ['cluster_servers_missing', 'missing'], - ] - }, - 'cluster_clients_active': { - 'options': [None, 'Active Clients', 'clients', 'cluster', 'rethinkdb.cluster_clients_active', - 'line'], - 'lines': [ - ['cluster_clients_active', 'active'], - ] - }, - 'cluster_queries': { - 'options': [None, 'Queries', 'queries/s', 'cluster', 'rethinkdb.cluster_queries', 'line'], - 'lines': [ - ['cluster_queries_per_sec', 'queries'], - ] - }, - 'cluster_documents': { - 'options': [None, 'Documents', 'documents/s', 'cluster', 'rethinkdb.cluster_documents', 'line'], - 'lines': [ - ['cluster_read_docs_per_sec', 'reads'], - ['cluster_written_docs_per_sec', 'writes'], - ] - }, - } - - -def server_charts(n): - o = [ - '{0}_client_connections'.format(n), - '{0}_clients_active'.format(n), - '{0}_queries'.format(n), - '{0}_documents'.format(n), - ] - f = 'server {0}'.format(n) - - c = { - o[0]: { - 'options': [None, 'Client Connections', 'connections', f, 'rethinkdb.client_connections', 'line'], - 'lines': [ - ['{0}_client_connections'.format(n), 'connections'], - ] - }, - o[1]: { - 'options': [None, 'Active Clients', 'clients', f, 'rethinkdb.clients_active', 'line'], - 'lines': [ - ['{0}_clients_active'.format(n), 'active'], - ] - }, - o[2]: { - 'options': [None, 'Queries', 'queries/s', f, 'rethinkdb.queries', 'line'], - 'lines': [ - ['{0}_queries_total'.format(n), 'queries', 'incremental'], - ] - }, - o[3]: { - 'options': [None, 'Documents', 'documents/s', f, 'rethinkdb.documents', 'line'], - 'lines': [ - ['{0}_read_docs_total'.format(n), 'reads', 'incremental'], - ['{0}_written_docs_total'.format(n), 'writes', 'incremental'], - ] - }, - } - - return o, c - - -class Cluster: - def __init__(self, raw): - self.raw = raw - - def data(self): - qe = self.raw['query_engine'] - - return { - 'cluster_clients_active': qe['clients_active'], - 'cluster_queries_per_sec': qe['queries_per_sec'], - 'cluster_read_docs_per_sec': qe['read_docs_per_sec'], - 'cluster_written_docs_per_sec': qe['written_docs_per_sec'], - 'cluster_servers_connected': 0, - 'cluster_servers_missing': 0, - } - - -class Server: - def __init__(self, raw): - self.name = raw['server'] - self.raw = raw - - def error(self): - return self.raw.get('error') - - def data(self): - qe = self.raw['query_engine'] - - d = { - 'client_connections': qe['client_connections'], - 'clients_active': qe['clients_active'], - 'queries_total': qe['queries_total'], - 'read_docs_total': qe['read_docs_total'], - 'written_docs_total': qe['written_docs_total'], - } - - return dict(('{0}_{1}'.format(self.name, k), d[k]) for k in d) - - -# https://pypi.org/project/rethinkdb/2.4.0/ -# rdb.RethinkDB() can be used as rdb drop in replacement. -# https://github.com/rethinkdb/rethinkdb-python#quickstart -def get_rethinkdb(): - if hasattr(rdb, 'RethinkDB'): - return rdb.RethinkDB() - return rdb - - -class Service(SimpleService): - def __init__(self, configuration=None, name=None): - SimpleService.__init__(self, configuration=configuration, name=name) - self.order = list(ORDER) - self.definitions = cluster_charts() - self.host = self.configuration.get('host', '127.0.0.1') - self.port = self.configuration.get('port', 28015) - self.user = self.configuration.get('user', 'admin') - self.password = self.configuration.get('password') - self.timeout = self.configuration.get('timeout', 2) - self.rdb = None - self.conn = None - self.alive = True - - def check(self): - if not HAS_RETHINKDB: - self.error('"rethinkdb" module is needed to use rethinkdbs.py') - return False - - self.debug("rethinkdb driver version {0}".format(rdb.__version__)) - self.rdb = get_rethinkdb() - - if not self.connect(): - return None - - stats = self.get_stats() - - if not stats: - return None - - for v in stats[1:]: - if get_id(v) == 'server': - o, c = server_charts(v['server']) - self.order.extend(o) - self.definitions.update(c) - - return True - - def get_data(self): - if not self.is_alive(): - return None - - stats = self.get_stats() - - if not stats: - return None - - data = dict() - - # cluster - data.update(Cluster(stats[0]).data()) - - # servers - for v in stats[1:]: - if get_id(v) != 'server': - continue - - s = Server(v) - - if s.error(): - data['cluster_servers_missing'] += 1 - else: - data['cluster_servers_connected'] += 1 - data.update(s.data()) - - return data - - def get_stats(self): - try: - return list(self.rdb.db('rethinkdb').table('stats').run(self.conn).items) - except rdb.errors.ReqlError: - self.alive = False - return None - - def connect(self): - try: - self.conn = self.rdb.connect( - host=self.host, - port=self.port, - user=self.user, - password=self.password, - timeout=self.timeout, - ) - self.alive = True - return True - except rdb.errors.ReqlError as error: - self.error('Connection to {0}:{1} failed: {2}'.format(self.host, self.port, error)) - return False - - def reconnect(self): - # The connection is already closed after rdb.errors.ReqlError, - # so we do not need to call conn.close() - if self.connect(): - return True - return False - - def is_alive(self): - if not self.alive: - return self.reconnect() - return True - - -def get_id(v): - return v['id'][0] diff --git a/src/collectors/python.d.plugin/rethinkdbs/rethinkdbs.conf b/src/collectors/python.d.plugin/rethinkdbs/rethinkdbs.conf deleted file mode 100644 index d671acbb0..000000000 --- a/src/collectors/python.d.plugin/rethinkdbs/rethinkdbs.conf +++ /dev/null @@ -1,76 +0,0 @@ -# netdata python.d.plugin configuration for rethinkdb -# -# This file is in YaML format. Generally the format is: -# -# name: value -# -# There are 2 sections: -# - global variables -# - one or more JOBS -# -# JOBS allow you to collect values from multiple sources. -# Each source will have its own set of charts. -# -# JOB parameters have to be indented (using spaces only, example below). - -# ---------------------------------------------------------------------- -# Global Variables -# These variables set the defaults for all JOBs, however each JOB -# may define its own, overriding the defaults. - -# update_every sets the default data collection frequency. -# If unset, the python.d.plugin default is used. -# update_every: 1 - -# priority controls the order of charts at the netdata dashboard. -# Lower numbers move the charts towards the top of the page. -# If unset, the default for python.d.plugin is used. -# priority: 60000 - -# penalty indicates whether to apply penalty to update_every in case of failures. -# Penalty will increase every 5 failed updates in a row. Maximum penalty is 10 minutes. -# penalty: yes - -# autodetection_retry sets the job re-check interval in seconds. -# The job is not deleted if check fails. -# Attempts to start the job are made once every autodetection_retry. -# This feature is disabled by default. -# autodetection_retry: 0 - -# ---------------------------------------------------------------------- -# JOBS (data collection sources) -# -# The default JOBS share the same *name*. JOBS with the same name -# are mutually exclusive. Only one of them will be allowed running at -# any time. This allows autodetection to try several alternatives and -# pick the one that works. -# -# Any number of jobs is supported. -# -# All python.d.plugin JOBS (for all its modules) support a set of -# predefined parameters. These are: -# -# job_name: -# name: myname # the JOB's name as it will appear at the -# # dashboard (by default is the job_name) -# # JOBs sharing a name are mutually exclusive -# update_every: 1 # the JOB's data collection frequency -# priority: 60000 # the JOB's order on the dashboard -# penalty: yes # the JOB's penalty -# autodetection_retry: 0 # the JOB's re-check interval in seconds -# -# Additionally to the above, rethinkdb also supports the following: -# -# host: IP or HOSTNAME # default is 'localhost' -# port: PORT # default is 28015 -# user: USERNAME # default is 'admin' -# password: PASSWORD # not set by default -# timeout: TIMEOUT # default is 2 - -# ---------------------------------------------------------------------- -# AUTO-DETECTION JOBS -# only one of them will run (they have the same name) - -local: - name: 'local' - host: 'localhost' diff --git a/src/collectors/python.d.plugin/retroshare/README.md b/src/collectors/python.d.plugin/retroshare/README.md deleted file mode 120000 index 4e4c2cdb7..000000000 --- a/src/collectors/python.d.plugin/retroshare/README.md +++ /dev/null @@ -1 +0,0 @@ -integrations/retroshare.md
\ No newline at end of file diff --git a/src/collectors/python.d.plugin/retroshare/integrations/retroshare.md b/src/collectors/python.d.plugin/retroshare/integrations/retroshare.md deleted file mode 100644 index b045127ee..000000000 --- a/src/collectors/python.d.plugin/retroshare/integrations/retroshare.md +++ /dev/null @@ -1,191 +0,0 @@ -<!--startmeta -custom_edit_url: "https://github.com/netdata/netdata/edit/master/src/collectors/python.d.plugin/retroshare/README.md" -meta_yaml: "https://github.com/netdata/netdata/edit/master/src/collectors/python.d.plugin/retroshare/metadata.yaml" -sidebar_label: "RetroShare" -learn_status: "Published" -learn_rel_path: "Collecting Metrics/Media Services" -most_popular: False -message: "DO NOT EDIT THIS FILE DIRECTLY, IT IS GENERATED BY THE COLLECTOR'S metadata.yaml FILE" -endmeta--> - -# RetroShare - - -<img src="https://netdata.cloud/img/retroshare.png" width="150"/> - - -Plugin: python.d.plugin -Module: retroshare - -<img src="https://img.shields.io/badge/maintained%20by-Netdata-%2300ab44" /> - -## Overview - -This collector monitors RetroShare statistics such as application bandwidth, peers, and DHT metrics. - -It connects to the RetroShare web interface to gather metrics. - -This collector is supported on all platforms. - -This collector supports collecting metrics from multiple instances of this integration, including remote instances. - - -### Default Behavior - -#### Auto-Detection - -The collector will attempt to connect and detect a RetroShare web interface through http://localhost:9090, even without any configuration. - -#### Limits - -The default configuration for this integration does not impose any limits on data collection. - -#### Performance Impact - -The default configuration for this integration is not expected to impose a significant performance impact on the system. - - -## Metrics - -Metrics grouped by *scope*. - -The scope defines the instance that the metric belongs to. An instance is uniquely identified by a set of labels. - - - -### Per RetroShare instance - -These metrics refer to the entire monitored application. - -This scope has no labels. - -Metrics: - -| Metric | Dimensions | Unit | -|:------|:----------|:----| -| retroshare.bandwidth | Upload, Download | kilobits/s | -| retroshare.peers | All friends, Connected friends | peers | -| retroshare.dht | DHT nodes estimated, RS nodes estimated | peers | - - - -## Alerts - - -The following alerts are available: - -| Alert name | On metric | Description | -|:------------|:----------|:------------| -| [ retroshare_dht_working ](https://github.com/netdata/netdata/blob/master/src/health/health.d/retroshare.conf) | retroshare.dht | number of DHT peers | - - -## Setup - -### Prerequisites - -#### RetroShare web interface - -RetroShare needs to be configured to enable the RetroShare WEB Interface and allow access from the Netdata host. - - - -### Configuration - -#### File - -The configuration file name for this integration is `python.d/retroshare.conf`. - - -You can edit the configuration file using the `edit-config` script from the -Netdata [config directory](/docs/netdata-agent/configuration/README.md#the-netdata-config-directory). - -```bash -cd /etc/netdata 2>/dev/null || cd /opt/netdata/etc/netdata -sudo ./edit-config python.d/retroshare.conf -``` -#### Options - -There are 2 sections: - -* Global variables -* One or more JOBS that can define multiple different instances to monitor. - -The following options can be defined globally: priority, penalty, autodetection_retry, update_every, but can also be defined per JOB to override the global values. - -Additionally, the following collapsed table contains all the options that can be configured inside a JOB definition. - -Every configuration JOB starts with a `job_name` value which will appear in the dashboard, unless a `name` parameter is specified. - - -<details open><summary>Config options</summary> - -| Name | Description | Default | Required | -|:----|:-----------|:-------|:--------:| -| update_every | Sets the default data collection frequency. | 5 | no | -| priority | Controls the order of charts at the netdata dashboard. | 60000 | no | -| autodetection_retry | Sets the job re-check interval in seconds. | 0 | no | -| penalty | Indicates whether to apply penalty to update_every in case of failures. | yes | no | -| name | Job name. This value will overwrite the `job_name` value. JOBS with the same name are mutually exclusive. Only one of them will be allowed running at any time. This allows autodetection to try several alternatives and pick the one that works. | | no | -| url | The URL to the RetroShare Web UI. | http://localhost:9090 | no | - -</details> - -#### Examples - -##### Local RetroShare Web UI - -A basic configuration for a RetroShare server running on localhost. - -<details open><summary>Config</summary> - -```yaml -localhost: - name: 'local retroshare' - url: 'http://localhost:9090' - -``` -</details> - -##### Remote RetroShare Web UI - -A basic configuration for a remote RetroShare server. - -<details open><summary>Config</summary> - -```yaml -remote: - name: 'remote retroshare' - url: 'http://1.2.3.4:9090' - -``` -</details> - - - -## Troubleshooting - -### Debug Mode - -To troubleshoot issues with the `retroshare` collector, run the `python.d.plugin` with the debug option enabled. The output -should give you clues as to why the collector isn't working. - -- Navigate to the `plugins.d` directory, usually at `/usr/libexec/netdata/plugins.d/`. If that's not the case on - your system, open `netdata.conf` and look for the `plugins` setting under `[directories]`. - - ```bash - cd /usr/libexec/netdata/plugins.d/ - ``` - -- Switch to the `netdata` user. - - ```bash - sudo -u netdata -s - ``` - -- Run the `python.d.plugin` to debug the collector: - - ```bash - ./python.d.plugin retroshare debug trace - ``` - - diff --git a/src/collectors/python.d.plugin/retroshare/metadata.yaml b/src/collectors/python.d.plugin/retroshare/metadata.yaml deleted file mode 100644 index e0270e1dd..000000000 --- a/src/collectors/python.d.plugin/retroshare/metadata.yaml +++ /dev/null @@ -1,144 +0,0 @@ -plugin_name: python.d.plugin -modules: - - meta: - plugin_name: python.d.plugin - module_name: retroshare - monitored_instance: - name: RetroShare - link: "https://retroshare.cc/" - categories: - - data-collection.media-streaming-servers - icon_filename: "retroshare.png" - related_resources: - integrations: - list: [] - info_provided_to_referring_integrations: - description: "" - keywords: - - retroshare - - p2p - most_popular: false - overview: - data_collection: - metrics_description: "This collector monitors RetroShare statistics such as application bandwidth, peers, and DHT metrics." - method_description: "It connects to the RetroShare web interface to gather metrics." - supported_platforms: - include: [] - exclude: [] - multi_instance: true - additional_permissions: - description: "" - default_behavior: - auto_detection: - description: "The collector will attempt to connect and detect a RetroShare web interface through http://localhost:9090, even without any configuration." - limits: - description: "" - performance_impact: - description: "" - setup: - prerequisites: - list: - - title: "RetroShare web interface" - description: | - RetroShare needs to be configured to enable the RetroShare WEB Interface and allow access from the Netdata host. - configuration: - file: - name: python.d/retroshare.conf - options: - description: | - There are 2 sections: - - * Global variables - * One or more JOBS that can define multiple different instances to monitor. - - The following options can be defined globally: priority, penalty, autodetection_retry, update_every, but can also be defined per JOB to override the global values. - - Additionally, the following collapsed table contains all the options that can be configured inside a JOB definition. - - Every configuration JOB starts with a `job_name` value which will appear in the dashboard, unless a `name` parameter is specified. - folding: - title: "Config options" - enabled: true - list: - - name: update_every - description: Sets the default data collection frequency. - default_value: 5 - required: false - - name: priority - description: Controls the order of charts at the netdata dashboard. - default_value: 60000 - required: false - - name: autodetection_retry - description: Sets the job re-check interval in seconds. - default_value: 0 - required: false - - name: penalty - description: Indicates whether to apply penalty to update_every in case of failures. - default_value: yes - required: false - - name: name - description: Job name. This value will overwrite the `job_name` value. JOBS with the same name are mutually exclusive. Only one of them will be allowed running at any time. This allows autodetection to try several alternatives and pick the one that works. - default_value: "" - required: false - - name: url - description: The URL to the RetroShare Web UI. - default_value: "http://localhost:9090" - required: false - examples: - folding: - enabled: true - title: "Config" - list: - - name: Local RetroShare Web UI - description: A basic configuration for a RetroShare server running on localhost. - config: | - localhost: - name: 'local retroshare' - url: 'http://localhost:9090' - - name: Remote RetroShare Web UI - description: A basic configuration for a remote RetroShare server. - config: | - remote: - name: 'remote retroshare' - url: 'http://1.2.3.4:9090' - - troubleshooting: - problems: - list: [] - alerts: - - name: retroshare_dht_working - link: https://github.com/netdata/netdata/blob/master/src/health/health.d/retroshare.conf - metric: retroshare.dht - info: number of DHT peers - metrics: - folding: - title: Metrics - enabled: false - description: "" - availability: [] - scopes: - - name: global - description: "These metrics refer to the entire monitored application." - labels: [] - metrics: - - name: retroshare.bandwidth - description: RetroShare Bandwidth - unit: "kilobits/s" - chart_type: area - dimensions: - - name: Upload - - name: Download - - name: retroshare.peers - description: RetroShare Peers - unit: "peers" - chart_type: line - dimensions: - - name: All friends - - name: Connected friends - - name: retroshare.dht - description: Retroshare DHT - unit: "peers" - chart_type: line - dimensions: - - name: DHT nodes estimated - - name: RS nodes estimated diff --git a/src/collectors/python.d.plugin/retroshare/retroshare.chart.py b/src/collectors/python.d.plugin/retroshare/retroshare.chart.py deleted file mode 100644 index 3f9593e94..000000000 --- a/src/collectors/python.d.plugin/retroshare/retroshare.chart.py +++ /dev/null @@ -1,78 +0,0 @@ -# -*- coding: utf-8 -*- -# Description: RetroShare netdata python.d module -# Authors: sehraf -# SPDX-License-Identifier: GPL-3.0-or-later - -import json - -from bases.FrameworkServices.UrlService import UrlService - -ORDER = [ - 'bandwidth', - 'peers', - 'dht', -] - -CHARTS = { - 'bandwidth': { - 'options': [None, 'RetroShare Bandwidth', 'kilobits/s', 'RetroShare', 'retroshare.bandwidth', 'area'], - 'lines': [ - ['bandwidth_up_kb', 'Upload'], - ['bandwidth_down_kb', 'Download'] - ] - }, - 'peers': { - 'options': [None, 'RetroShare Peers', 'peers', 'RetroShare', 'retroshare.peers', 'line'], - 'lines': [ - ['peers_all', 'All friends'], - ['peers_connected', 'Connected friends'] - ] - }, - 'dht': { - 'options': [None, 'Retroshare DHT', 'peers', 'RetroShare', 'retroshare.dht', 'line'], - 'lines': [ - ['dht_size_all', 'DHT nodes estimated'], - ['dht_size_rs', 'RS nodes estimated'] - ] - } -} - - -class Service(UrlService): - def __init__(self, configuration=None, name=None): - UrlService.__init__(self, configuration=configuration, name=name) - self.order = ORDER - self.definitions = CHARTS - self.baseurl = self.configuration.get('url', 'http://localhost:9090') - - def _get_stats(self): - """ - Format data received from http request - :return: dict - """ - try: - raw = self._get_raw_data() - parsed = json.loads(raw) - if str(parsed['returncode']) != 'ok': - return None - except (TypeError, ValueError): - return None - - return parsed['data'][0] - - def _get_data(self): - """ - Get data from API - :return: dict - """ - self.url = self.baseurl + '/api/v2/stats' - data = self._get_stats() - if data is None: - return None - - data['bandwidth_up_kb'] = data['bandwidth_up_kb'] * -1 - if data['dht_active'] is False: - data['dht_size_all'] = None - data['dht_size_rs'] = None - - return data diff --git a/src/collectors/python.d.plugin/retroshare/retroshare.conf b/src/collectors/python.d.plugin/retroshare/retroshare.conf deleted file mode 100644 index 3d0af538d..000000000 --- a/src/collectors/python.d.plugin/retroshare/retroshare.conf +++ /dev/null @@ -1,72 +0,0 @@ -# netdata python.d.plugin configuration for RetroShare -# -# This file is in YaML format. Generally the format is: -# -# name: value -# -# There are 2 sections: -# - global variables -# - one or more JOBS -# -# JOBS allow you to collect values from multiple sources. -# Each source will have its own set of charts. -# -# JOB parameters have to be indented (using spaces only, example below). - -# ---------------------------------------------------------------------- -# Global Variables -# These variables set the defaults for all JOBs, however each JOB -# may define its own, overriding the defaults. - -# update_every sets the default data collection frequency. -# If unset, the python.d.plugin default is used. -# update_every: 1 - -# priority controls the order of charts at the netdata dashboard. -# Lower numbers move the charts towards the top of the page. -# If unset, the default for python.d.plugin is used. -# priority: 60000 - -# penalty indicates whether to apply penalty to update_every in case of failures. -# Penalty will increase every 5 failed updates in a row. Maximum penalty is 10 minutes. -# penalty: yes - -# autodetection_retry sets the job re-check interval in seconds. -# The job is not deleted if check fails. -# Attempts to start the job are made once every autodetection_retry. -# This feature is disabled by default. -# autodetection_retry: 0 - -# ---------------------------------------------------------------------- -# JOBS (data collection sources) -# -# The default JOBS share the same *name*. JOBS with the same name -# are mutually exclusive. Only one of them will be allowed running at -# any time. This allows autodetection to try several alternatives and -# pick the one that works. -# -# Any number of jobs is supported. -# -# All python.d.plugin JOBS (for all its modules) support a set of -# predefined parameters. These are: -# -# job_name: -# name: myname # the JOB's name as it will appear at the -# # dashboard (by default is the job_name) -# # JOBs sharing a name are mutually exclusive -# update_every: 1 # the JOB's data collection frequency -# priority: 60000 # the JOB's order on the dashboard -# penalty: yes # the JOB's penalty -# autodetection_retry: 0 # the JOB's re-check interval in seconds -# -# Additionally to the above, RetroShare also supports the following: -# -# - url: 'url' # the URL to the WebUI -# -# ---------------------------------------------------------------------- -# AUTO-DETECTION JOBS -# only one of them will run (they have the same name) - -localhost: - name: 'local' - url: 'http://localhost:9090' diff --git a/src/collectors/python.d.plugin/riakkv/README.md b/src/collectors/python.d.plugin/riakkv/README.md deleted file mode 120000 index f43ece09b..000000000 --- a/src/collectors/python.d.plugin/riakkv/README.md +++ /dev/null @@ -1 +0,0 @@ -integrations/riakkv.md
\ No newline at end of file diff --git a/src/collectors/python.d.plugin/riakkv/integrations/riakkv.md b/src/collectors/python.d.plugin/riakkv/integrations/riakkv.md deleted file mode 100644 index a671b9c76..000000000 --- a/src/collectors/python.d.plugin/riakkv/integrations/riakkv.md +++ /dev/null @@ -1,220 +0,0 @@ -<!--startmeta -custom_edit_url: "https://github.com/netdata/netdata/edit/master/src/collectors/python.d.plugin/riakkv/README.md" -meta_yaml: "https://github.com/netdata/netdata/edit/master/src/collectors/python.d.plugin/riakkv/metadata.yaml" -sidebar_label: "RiakKV" -learn_status: "Published" -learn_rel_path: "Collecting Metrics/Databases" -most_popular: False -message: "DO NOT EDIT THIS FILE DIRECTLY, IT IS GENERATED BY THE COLLECTOR'S metadata.yaml FILE" -endmeta--> - -# RiakKV - - -<img src="https://netdata.cloud/img/riak.svg" width="150"/> - - -Plugin: python.d.plugin -Module: riakkv - -<img src="https://img.shields.io/badge/maintained%20by-Netdata-%2300ab44" /> - -## Overview - -This collector monitors RiakKV metrics about throughput, latency, resources and more.' - - -This collector reads the database stats from the `/stats` endpoint. - -This collector is supported on all platforms. - -This collector supports collecting metrics from multiple instances of this integration, including remote instances. - - -### Default Behavior - -#### Auto-Detection - -If the /stats endpoint is accessible, RiakKV instances on the local host running on port 8098 will be autodetected. - -#### Limits - -The default configuration for this integration does not impose any limits on data collection. - -#### Performance Impact - -The default configuration for this integration is not expected to impose a significant performance impact on the system. - - -## Metrics - -Metrics grouped by *scope*. - -The scope defines the instance that the metric belongs to. An instance is uniquely identified by a set of labels. - - - -### Per RiakKV instance - -These metrics refer to the entire monitored application. - -This scope has no labels. - -Metrics: - -| Metric | Dimensions | Unit | -|:------|:----------|:----| -| riak.kv.throughput | gets, puts | operations/s | -| riak.dt.vnode_updates | counters, sets, maps | operations/s | -| riak.search | queries | queries/s | -| riak.search.documents | indexed | documents/s | -| riak.consistent.operations | gets, puts | operations/s | -| riak.kv.latency.get | mean, median, 95, 99, 100 | ms | -| riak.kv.latency.put | mean, median, 95, 99, 100 | ms | -| riak.dt.latency.counter_merge | mean, median, 95, 99, 100 | ms | -| riak.dt.latency.set_merge | mean, median, 95, 99, 100 | ms | -| riak.dt.latency.map_merge | mean, median, 95, 99, 100 | ms | -| riak.search.latency.query | median, min, 95, 99, 999, max | ms | -| riak.search.latency.index | median, min, 95, 99, 999, max | ms | -| riak.consistent.latency.get | mean, median, 95, 99, 100 | ms | -| riak.consistent.latency.put | mean, median, 95, 99, 100 | ms | -| riak.vm | processes | total | -| riak.vm.memory.processes | allocated, used | MB | -| riak.kv.siblings_encountered.get | mean, median, 95, 99, 100 | siblings | -| riak.kv.objsize.get | mean, median, 95, 99, 100 | KB | -| riak.search.vnodeq_size | mean, median, 95, 99, 100 | messages | -| riak.search.index | errors | errors | -| riak.core.protobuf_connections | active | connections | -| riak.core.repairs | read | repairs | -| riak.core.fsm_active | get, put, secondary index, list keys | fsms | -| riak.core.fsm_rejected | get, put | fsms | -| riak.search.index | bad_entry, extract_fail | writes | - - - -## Alerts - - -The following alerts are available: - -| Alert name | On metric | Description | -|:------------|:----------|:------------| -| [ riakkv_1h_kv_get_mean_latency ](https://github.com/netdata/netdata/blob/master/src/health/health.d/riakkv.conf) | riak.kv.latency.get | average time between reception of client GET request and subsequent response to client over the last hour | -| [ riakkv_kv_get_slow ](https://github.com/netdata/netdata/blob/master/src/health/health.d/riakkv.conf) | riak.kv.latency.get | average time between reception of client GET request and subsequent response to the client over the last 3 minutes, compared to the average over the last hour | -| [ riakkv_1h_kv_put_mean_latency ](https://github.com/netdata/netdata/blob/master/src/health/health.d/riakkv.conf) | riak.kv.latency.put | average time between reception of client PUT request and subsequent response to the client over the last hour | -| [ riakkv_kv_put_slow ](https://github.com/netdata/netdata/blob/master/src/health/health.d/riakkv.conf) | riak.kv.latency.put | average time between reception of client PUT request and subsequent response to the client over the last 3 minutes, compared to the average over the last hour | -| [ riakkv_vm_high_process_count ](https://github.com/netdata/netdata/blob/master/src/health/health.d/riakkv.conf) | riak.vm | number of processes running in the Erlang VM | -| [ riakkv_list_keys_active ](https://github.com/netdata/netdata/blob/master/src/health/health.d/riakkv.conf) | riak.core.fsm_active | number of currently running list keys finite state machines | - - -## Setup - -### Prerequisites - -#### Configure RiakKV to enable /stats endpoint - -You can follow the RiakKV configuration reference documentation for how to enable this. - -Source : https://docs.riak.com/riak/kv/2.2.3/configuring/reference/#client-interfaces - - - -### Configuration - -#### File - -The configuration file name for this integration is `python.d/riakkv.conf`. - - -You can edit the configuration file using the `edit-config` script from the -Netdata [config directory](/docs/netdata-agent/configuration/README.md#the-netdata-config-directory). - -```bash -cd /etc/netdata 2>/dev/null || cd /opt/netdata/etc/netdata -sudo ./edit-config python.d/riakkv.conf -``` -#### Options - -There are 2 sections: - -* Global variables -* One or more JOBS that can define multiple different instances to monitor. - -The following options can be defined globally: priority, penalty, autodetection_retry, update_every, but can also be defined per JOB to override the global values. - -Additionally, the following collapsed table contains all the options that can be configured inside a JOB definition. - -Every configuration JOB starts with a `job_name` value which will appear in the dashboard, unless a `name` parameter is specified. - - -<details open><summary>Config options</summary> - -| Name | Description | Default | Required | -|:----|:-----------|:-------|:--------:| -| update_every | Sets the default data collection frequency. | 5 | no | -| priority | Controls the order of charts at the netdata dashboard. | 60000 | no | -| autodetection_retry | Sets the job re-check interval in seconds. | 0 | no | -| penalty | Indicates whether to apply penalty to update_every in case of failures. | yes | no | -| url | The url of the server | no | yes | - -</details> - -#### Examples - -##### Basic (default) - -A basic example configuration per job - -```yaml -local: -url: 'http://localhost:8098/stats' - -``` -##### Multi-instance - -> **Note**: When you define multiple jobs, their names must be unique. - -Collecting metrics from local and remote instances. - - -<details open><summary>Config</summary> - -```yaml -local: - url: 'http://localhost:8098/stats' - -remote: - url: 'http://192.0.2.1:8098/stats' - -``` -</details> - - - -## Troubleshooting - -### Debug Mode - -To troubleshoot issues with the `riakkv` collector, run the `python.d.plugin` with the debug option enabled. The output -should give you clues as to why the collector isn't working. - -- Navigate to the `plugins.d` directory, usually at `/usr/libexec/netdata/plugins.d/`. If that's not the case on - your system, open `netdata.conf` and look for the `plugins` setting under `[directories]`. - - ```bash - cd /usr/libexec/netdata/plugins.d/ - ``` - -- Switch to the `netdata` user. - - ```bash - sudo -u netdata -s - ``` - -- Run the `python.d.plugin` to debug the collector: - - ```bash - ./python.d.plugin riakkv debug trace - ``` - - diff --git a/src/collectors/python.d.plugin/riakkv/riakkv.chart.py b/src/collectors/python.d.plugin/riakkv/riakkv.chart.py deleted file mode 100644 index c390c8bc0..000000000 --- a/src/collectors/python.d.plugin/riakkv/riakkv.chart.py +++ /dev/null @@ -1,334 +0,0 @@ -# -*- coding: utf-8 -*- -# Description: riak netdata python.d module -# -# See also: -# https://docs.riak.com/riak/kv/latest/using/reference/statistics-monitoring/index.html - -from json import loads - -from bases.FrameworkServices.UrlService import UrlService - -# Riak updates the metrics at the /stats endpoint every 1 second. -# If we use `update_every = 1` here, that means we might get weird jitter in the graph, -# so the default is set to 2 seconds to prevent it. -update_every = 2 - -# charts order (can be overridden if you want less charts, or different order) -ORDER = [ - # Throughput metrics - # https://docs.riak.com/riak/kv/latest/using/reference/statistics-monitoring/index.html#throughput-metrics - # Collected in totals. - "kv.node_operations", # K/V node operations. - "dt.vnode_updates", # Data type vnode updates. - "search.queries", # Search queries on the node. - "search.documents", # Documents indexed by Search. - "consistent.operations", # Consistent node operations. - - # Latency metrics - # https://docs.riak.com/riak/kv/latest/using/reference/statistics-monitoring/index.html#throughput-metrics - # Collected for the past minute in milliseconds, - # returned from riak in microseconds. - "kv.latency.get", # K/V GET FSM traversal latency. - "kv.latency.put", # K/V PUT FSM traversal latency. - "dt.latency.counter", # Update Counter Data type latency. - "dt.latency.set", # Update Set Data type latency. - "dt.latency.map", # Update Map Data type latency. - "search.latency.query", # Search query latency. - "search.latency.index", # Time it takes for search to index a new document. - "consistent.latency.get", # Strong consistent read latency. - "consistent.latency.put", # Strong consistent write latency. - - # Erlang resource usage metrics - # https://docs.riak.com/riak/kv/latest/using/reference/statistics-monitoring/index.html#erlang-resource-usage-metrics - # Processes collected as a gauge, - # memory collected as Megabytes, returned as bytes from Riak. - "vm.processes", # Number of processes currently running in the Erlang VM. - "vm.memory.processes", # Total amount of memory allocated & used for Erlang processes. - - # General Riak Load / Health metrics - # https://docs.riak.com/riak/kv/latest/using/reference/statistics-monitoring/index.html#general-riak-load-health-metrics - # The following are collected by Riak over the past minute: - "kv.siblings_encountered.get", # Siblings encountered during GET operations by this node. - "kv.objsize.get", # Object size encountered by this node. - "search.vnodeq_size", # Number of unprocessed messages in the vnode message queues (Search). - # The following are calculated in total, or as gauges: - "search.index_errors", # Errors of the search subsystem while indexing documents. - "core.pbc", # Number of currently active protocol buffer connections. - "core.repairs", # Total read repair operations coordinated by this node. - "core.fsm_active", # Active finite state machines by kind. - "core.fsm_rejected", # Rejected finite state machines by kind. - - # General Riak Search Load / Health metrics - # https://docs.riak.com/riak/kv/latest/using/reference/statistics-monitoring/index.html#general-riak-search-load-health-metrics - # Reported as counters. - "search.errors", # Write and read errors of the Search subsystem. -] - -CHARTS = { - # Throughput metrics - "kv.node_operations": { - "options": [None, "Reads & writes coordinated by this node", "operations/s", "throughput", "riak.kv.throughput", - "line"], - "lines": [ - ["node_gets_total", "gets", "incremental"], - ["node_puts_total", "puts", "incremental"] - ] - }, - "dt.vnode_updates": { - "options": [None, "Update operations coordinated by local vnodes by data type", "operations/s", "throughput", - "riak.dt.vnode_updates", "line"], - "lines": [ - ["vnode_counter_update_total", "counters", "incremental"], - ["vnode_set_update_total", "sets", "incremental"], - ["vnode_map_update_total", "maps", "incremental"], - ] - }, - "search.queries": { - "options": [None, "Search queries on the node", "queries/s", "throughput", "riak.search", "line"], - "lines": [ - ["search_query_throughput_count", "queries", "incremental"] - ] - }, - "search.documents": { - "options": [None, "Documents indexed by search", "documents/s", "throughput", "riak.search.documents", "line"], - "lines": [ - ["search_index_throughput_count", "indexed", "incremental"] - ] - }, - "consistent.operations": { - "options": [None, "Consistent node operations", "operations/s", "throughput", "riak.consistent.operations", - "line"], - "lines": [ - ["consistent_gets_total", "gets", "incremental"], - ["consistent_puts_total", "puts", "incremental"], - ] - }, - - # Latency metrics - "kv.latency.get": { - "options": [None, "Time between reception of a client GET request and subsequent response to client", "ms", - "latency", "riak.kv.latency.get", "line"], - "lines": [ - ["node_get_fsm_time_mean", "mean", "absolute", 1, 1000], - ["node_get_fsm_time_median", "median", "absolute", 1, 1000], - ["node_get_fsm_time_95", "95", "absolute", 1, 1000], - ["node_get_fsm_time_99", "99", "absolute", 1, 1000], - ["node_get_fsm_time_100", "100", "absolute", 1, 1000], - ] - }, - "kv.latency.put": { - "options": [None, "Time between reception of a client PUT request and subsequent response to client", "ms", - "latency", "riak.kv.latency.put", "line"], - "lines": [ - ["node_put_fsm_time_mean", "mean", "absolute", 1, 1000], - ["node_put_fsm_time_median", "median", "absolute", 1, 1000], - ["node_put_fsm_time_95", "95", "absolute", 1, 1000], - ["node_put_fsm_time_99", "99", "absolute", 1, 1000], - ["node_put_fsm_time_100", "100", "absolute", 1, 1000], - ] - }, - "dt.latency.counter": { - "options": [None, "Time it takes to perform an Update Counter operation", "ms", "latency", - "riak.dt.latency.counter_merge", "line"], - "lines": [ - ["object_counter_merge_time_mean", "mean", "absolute", 1, 1000], - ["object_counter_merge_time_median", "median", "absolute", 1, 1000], - ["object_counter_merge_time_95", "95", "absolute", 1, 1000], - ["object_counter_merge_time_99", "99", "absolute", 1, 1000], - ["object_counter_merge_time_100", "100", "absolute", 1, 1000], - ] - }, - "dt.latency.set": { - "options": [None, "Time it takes to perform an Update Set operation", "ms", "latency", - "riak.dt.latency.set_merge", "line"], - "lines": [ - ["object_set_merge_time_mean", "mean", "absolute", 1, 1000], - ["object_set_merge_time_median", "median", "absolute", 1, 1000], - ["object_set_merge_time_95", "95", "absolute", 1, 1000], - ["object_set_merge_time_99", "99", "absolute", 1, 1000], - ["object_set_merge_time_100", "100", "absolute", 1, 1000], - ] - }, - "dt.latency.map": { - "options": [None, "Time it takes to perform an Update Map operation", "ms", "latency", - "riak.dt.latency.map_merge", "line"], - "lines": [ - ["object_map_merge_time_mean", "mean", "absolute", 1, 1000], - ["object_map_merge_time_median", "median", "absolute", 1, 1000], - ["object_map_merge_time_95", "95", "absolute", 1, 1000], - ["object_map_merge_time_99", "99", "absolute", 1, 1000], - ["object_map_merge_time_100", "100", "absolute", 1, 1000], - ] - }, - "search.latency.query": { - "options": [None, "Search query latency", "ms", "latency", "riak.search.latency.query", "line"], - "lines": [ - ["search_query_latency_median", "median", "absolute", 1, 1000], - ["search_query_latency_min", "min", "absolute", 1, 1000], - ["search_query_latency_95", "95", "absolute", 1, 1000], - ["search_query_latency_99", "99", "absolute", 1, 1000], - ["search_query_latency_999", "999", "absolute", 1, 1000], - ["search_query_latency_max", "max", "absolute", 1, 1000], - ] - }, - "search.latency.index": { - "options": [None, "Time it takes Search to index a new document", "ms", "latency", "riak.search.latency.index", - "line"], - "lines": [ - ["search_index_latency_median", "median", "absolute", 1, 1000], - ["search_index_latency_min", "min", "absolute", 1, 1000], - ["search_index_latency_95", "95", "absolute", 1, 1000], - ["search_index_latency_99", "99", "absolute", 1, 1000], - ["search_index_latency_999", "999", "absolute", 1, 1000], - ["search_index_latency_max", "max", "absolute", 1, 1000], - ] - }, - - # Riak Strong Consistency metrics - "consistent.latency.get": { - "options": [None, "Strongly consistent read latency", "ms", "latency", "riak.consistent.latency.get", "line"], - "lines": [ - ["consistent_get_time_mean", "mean", "absolute", 1, 1000], - ["consistent_get_time_median", "median", "absolute", 1, 1000], - ["consistent_get_time_95", "95", "absolute", 1, 1000], - ["consistent_get_time_99", "99", "absolute", 1, 1000], - ["consistent_get_time_100", "100", "absolute", 1, 1000], - ] - }, - "consistent.latency.put": { - "options": [None, "Strongly consistent write latency", "ms", "latency", "riak.consistent.latency.put", "line"], - "lines": [ - ["consistent_put_time_mean", "mean", "absolute", 1, 1000], - ["consistent_put_time_median", "median", "absolute", 1, 1000], - ["consistent_put_time_95", "95", "absolute", 1, 1000], - ["consistent_put_time_99", "99", "absolute", 1, 1000], - ["consistent_put_time_100", "100", "absolute", 1, 1000], - ] - }, - - # BEAM metrics - "vm.processes": { - "options": [None, "Total processes running in the Erlang VM", "total", "vm", "riak.vm", "line"], - "lines": [ - ["sys_process_count", "processes", "absolute"], - ] - }, - "vm.memory.processes": { - "options": [None, "Memory allocated & used by Erlang processes", "MB", "vm", "riak.vm.memory.processes", - "line"], - "lines": [ - ["memory_processes", "allocated", "absolute", 1, 1024 * 1024], - ["memory_processes_used", "used", "absolute", 1, 1024 * 1024] - ] - }, - - # General Riak Load/Health metrics - "kv.siblings_encountered.get": { - "options": [None, "Number of siblings encountered during GET operations by this node during the past minute", - "siblings", "load", "riak.kv.siblings_encountered.get", "line"], - "lines": [ - ["node_get_fsm_siblings_mean", "mean", "absolute"], - ["node_get_fsm_siblings_median", "median", "absolute"], - ["node_get_fsm_siblings_95", "95", "absolute"], - ["node_get_fsm_siblings_99", "99", "absolute"], - ["node_get_fsm_siblings_100", "100", "absolute"], - ] - }, - "kv.objsize.get": { - "options": [None, "Object size encountered by this node during the past minute", "KB", "load", - "riak.kv.objsize.get", "line"], - "lines": [ - ["node_get_fsm_objsize_mean", "mean", "absolute", 1, 1024], - ["node_get_fsm_objsize_median", "median", "absolute", 1, 1024], - ["node_get_fsm_objsize_95", "95", "absolute", 1, 1024], - ["node_get_fsm_objsize_99", "99", "absolute", 1, 1024], - ["node_get_fsm_objsize_100", "100", "absolute", 1, 1024], - ] - }, - "search.vnodeq_size": { - "options": [None, - "Number of unprocessed messages in the vnode message queues of Search on this node in the past minute", - "messages", "load", "riak.search.vnodeq_size", "line"], - "lines": [ - ["riak_search_vnodeq_mean", "mean", "absolute"], - ["riak_search_vnodeq_median", "median", "absolute"], - ["riak_search_vnodeq_95", "95", "absolute"], - ["riak_search_vnodeq_99", "99", "absolute"], - ["riak_search_vnodeq_100", "100", "absolute"], - ] - }, - "search.index_errors": { - "options": [None, "Number of document index errors encountered by Search", "errors", "load", - "riak.search.index", "line"], - "lines": [ - ["search_index_fail_count", "errors", "absolute"] - ] - }, - "core.pbc": { - "options": [None, "Protocol buffer connections by status", "connections", "load", - "riak.core.protobuf_connections", "line"], - "lines": [ - ["pbc_active", "active", "absolute"], - # ["pbc_connects", "established_pastmin", "absolute"] - ] - }, - "core.repairs": { - "options": [None, "Number of repair operations this node has coordinated", "repairs", "load", - "riak.core.repairs", "line"], - "lines": [ - ["read_repairs", "read", "absolute"] - ] - }, - "core.fsm_active": { - "options": [None, "Active finite state machines by kind", "fsms", "load", "riak.core.fsm_active", "line"], - "lines": [ - ["node_get_fsm_active", "get", "absolute"], - ["node_put_fsm_active", "put", "absolute"], - ["index_fsm_active", "secondary index", "absolute"], - ["list_fsm_active", "list keys", "absolute"] - ] - }, - "core.fsm_rejected": { - # Writing "Sidejob's" here seems to cause some weird issues: it results in this chart being rendered in - # its own context and additionally, moves the entire Riak graph all the way up to the top of the Netdata - # dashboard for some reason. - "options": [None, "Finite state machines being rejected by Sidejobs overload protection", "fsms", "load", - "riak.core.fsm_rejected", "line"], - "lines": [ - ["node_get_fsm_rejected", "get", "absolute"], - ["node_put_fsm_rejected", "put", "absolute"] - ] - }, - - # General Riak Search Load / Health metrics - "search.errors": { - "options": [None, "Number of writes to Search failed due to bad data format by reason", "writes", "load", - "riak.search.index", "line"], - "lines": [ - ["search_index_bad_entry_count", "bad_entry", "absolute"], - ["search_index_extract_fail_count", "extract_fail", "absolute"], - ] - } -} - - -class Service(UrlService): - def __init__(self, configuration=None, name=None): - UrlService.__init__(self, configuration=configuration, name=name) - self.order = ORDER - self.definitions = CHARTS - - def _get_data(self): - """ - Format data received from http request - :return: dict - """ - raw = self._get_raw_data() - if not raw: - return None - - try: - return loads(raw) - except (TypeError, ValueError) as err: - self.error(err) - return None diff --git a/src/collectors/python.d.plugin/riakkv/riakkv.conf b/src/collectors/python.d.plugin/riakkv/riakkv.conf deleted file mode 100644 index be01c48ac..000000000 --- a/src/collectors/python.d.plugin/riakkv/riakkv.conf +++ /dev/null @@ -1,68 +0,0 @@ -# netdata python.d.plugin configuration for riak -# -# This file is in YaML format. Generally the format is: -# -# name: value -# -# There are 2 sections: -# - global variables -# - one or more JOBS -# -# JOBS allow you to collect values from multiple sources. -# Each source will have its own set of charts. -# -# JOB parameters have to be indented (using spaces only, example below). - -# ---------------------------------------------------------------------- -# Global Variables -# These variables set the defaults for all JOBs, however each JOB -# may define its own, overriding the defaults. - -# update_every sets the default data collection frequency. -# If unset, the python.d.plugin default is used. -# update_every: 1 - -# priority controls the order of charts at the netdata dashboard. -# Lower numbers move the charts towards the top of the page. -# If unset, the default for python.d.plugin is used. -# priority: 60000 - -# penalty indicates whether to apply penalty to update_every in case of failures. -# Penalty will increase every 5 failed updates in a row. Maximum penalty is 10 minutes. -# penalty: yes - -# autodetection_retry sets the job re-check interval in seconds. -# The job is not deleted if check fails. -# Attempts to start the job are made once every autodetection_retry. -# This feature is disabled by default. -# autodetection_retry: 0 - -# ---------------------------------------------------------------------- -# JOBS (data collection sources) -# -# The default JOBS share the same *name*. JOBS with the same name -# are mutually exclusive. Only one of them will be allowed running at -# any time. This allows autodetection to try several alternatives and -# pick the one that works. -# -# Any number of jobs is supported. -# -# All python.d.plugin JOBS (for all its modules) support a set of -# predefined parameters. These are: -# -# job_name: -# name: myname # the JOB's name as it will appear at the -# # dashboard (by default is the job_name) -# # JOBs sharing a name are mutually exclusive -# update_every: 1 # the JOB's data collection frequency -# priority: 60000 # the JOB's order on the dashboard -# penalty: yes # the JOB's penalty -# autodetection_retry: 0 # the JOB's re-check interval in seconds -# -# -# ---------------------------------------------------------------------- -# AUTO-DETECTION JOBS -# only one of them will run (they have the same name) - -local: - url : 'http://localhost:8098/stats' diff --git a/src/collectors/python.d.plugin/samba/integrations/samba.md b/src/collectors/python.d.plugin/samba/integrations/samba.md index b4a551a8e..4d6f8fcc3 100644 --- a/src/collectors/python.d.plugin/samba/integrations/samba.md +++ b/src/collectors/python.d.plugin/samba/integrations/samba.md @@ -196,6 +196,7 @@ my_job_name: ### Debug Mode + To troubleshoot issues with the `samba` collector, run the `python.d.plugin` with the debug option enabled. The output should give you clues as to why the collector isn't working. @@ -218,4 +219,37 @@ should give you clues as to why the collector isn't working. ./python.d.plugin samba debug trace ``` +### Getting Logs + +If you're encountering problems with the `samba` collector, follow these steps to retrieve logs and identify potential issues: + +- **Run the command** specific to your system (systemd, non-systemd, or Docker container). +- **Examine the output** for any warnings or error messages that might indicate issues. These messages should provide clues about the root cause of the problem. + +#### System with systemd + +Use the following command to view logs generated since the last Netdata service restart: + +```bash +journalctl _SYSTEMD_INVOCATION_ID="$(systemctl show --value --property=InvocationID netdata)" --namespace=netdata --grep samba +``` + +#### System without systemd + +Locate the collector log file, typically at `/var/log/netdata/collector.log`, and use `grep` to filter for collector's name: + +```bash +grep samba /var/log/netdata/collector.log +``` + +**Note**: This method shows logs from all restarts. Focus on the **latest entries** for troubleshooting current issues. + +#### Docker Container + +If your Netdata runs in a Docker container named "netdata" (replace if different), use this command: + +```bash +docker logs netdata 2>&1 | grep samba +``` + diff --git a/src/collectors/python.d.plugin/spigotmc/integrations/spigotmc.md b/src/collectors/python.d.plugin/spigotmc/integrations/spigotmc.md index 8f7fdaf4d..2e5e60669 100644 --- a/src/collectors/python.d.plugin/spigotmc/integrations/spigotmc.md +++ b/src/collectors/python.d.plugin/spigotmc/integrations/spigotmc.md @@ -191,6 +191,7 @@ remote_server: ### Debug Mode + To troubleshoot issues with the `spigotmc` collector, run the `python.d.plugin` with the debug option enabled. The output should give you clues as to why the collector isn't working. @@ -213,4 +214,37 @@ should give you clues as to why the collector isn't working. ./python.d.plugin spigotmc debug trace ``` +### Getting Logs + +If you're encountering problems with the `spigotmc` collector, follow these steps to retrieve logs and identify potential issues: + +- **Run the command** specific to your system (systemd, non-systemd, or Docker container). +- **Examine the output** for any warnings or error messages that might indicate issues. These messages should provide clues about the root cause of the problem. + +#### System with systemd + +Use the following command to view logs generated since the last Netdata service restart: + +```bash +journalctl _SYSTEMD_INVOCATION_ID="$(systemctl show --value --property=InvocationID netdata)" --namespace=netdata --grep spigotmc +``` + +#### System without systemd + +Locate the collector log file, typically at `/var/log/netdata/collector.log`, and use `grep` to filter for collector's name: + +```bash +grep spigotmc /var/log/netdata/collector.log +``` + +**Note**: This method shows logs from all restarts. Focus on the **latest entries** for troubleshooting current issues. + +#### Docker Container + +If your Netdata runs in a Docker container named "netdata" (replace if different), use this command: + +```bash +docker logs netdata 2>&1 | grep spigotmc +``` + diff --git a/src/collectors/python.d.plugin/squid/integrations/squid.md b/src/collectors/python.d.plugin/squid/integrations/squid.md deleted file mode 100644 index 10f927af7..000000000 --- a/src/collectors/python.d.plugin/squid/integrations/squid.md +++ /dev/null @@ -1,199 +0,0 @@ -<!--startmeta -custom_edit_url: "https://github.com/netdata/netdata/edit/master/src/collectors/python.d.plugin/squid/README.md" -meta_yaml: "https://github.com/netdata/netdata/edit/master/src/collectors/python.d.plugin/squid/metadata.yaml" -sidebar_label: "Squid" -learn_status: "Published" -learn_rel_path: "Collecting Metrics/Web Servers and Web Proxies" -most_popular: False -message: "DO NOT EDIT THIS FILE DIRECTLY, IT IS GENERATED BY THE COLLECTOR'S metadata.yaml FILE" -endmeta--> - -# Squid - - -<img src="https://netdata.cloud/img/squid.png" width="150"/> - - -Plugin: python.d.plugin -Module: squid - -<img src="https://img.shields.io/badge/maintained%20by-Netdata-%2300ab44" /> - -## Overview - -This collector monitors statistics about the Squid Clients and Servers, like bandwidth and requests. - - -It collects metrics from the endpoint where Squid exposes its `counters` data. - -This collector is supported on all platforms. - -This collector supports collecting metrics from multiple instances of this integration, including remote instances. - - -### Default Behavior - -#### Auto-Detection - -By default, this collector will try to autodetect where Squid presents its `counters` data, by trying various configurations. - -#### Limits - -The default configuration for this integration does not impose any limits on data collection. - -#### Performance Impact - -The default configuration for this integration is not expected to impose a significant performance impact on the system. - - -## Metrics - -Metrics grouped by *scope*. - -The scope defines the instance that the metric belongs to. An instance is uniquely identified by a set of labels. - - - -### Per Squid instance - -These metrics refer to each monitored Squid instance. - -This scope has no labels. - -Metrics: - -| Metric | Dimensions | Unit | -|:------|:----------|:----| -| squid.clients_net | in, out, hits | kilobits/s | -| squid.clients_requests | requests, hits, errors | requests/s | -| squid.servers_net | in, out | kilobits/s | -| squid.servers_requests | requests, errors | requests/s | - - - -## Alerts - -There are no alerts configured by default for this integration. - - -## Setup - -### Prerequisites - -#### Configure Squid's Cache Manager - -Take a look at [Squid's official documentation](https://wiki.squid-cache.org/Features/CacheManager/Index#controlling-access-to-the-cache-manager) on how to configure access to the Cache Manager. - - - -### Configuration - -#### File - -The configuration file name for this integration is `python.d/squid.conf`. - - -You can edit the configuration file using the `edit-config` script from the -Netdata [config directory](/docs/netdata-agent/configuration/README.md#the-netdata-config-directory). - -```bash -cd /etc/netdata 2>/dev/null || cd /opt/netdata/etc/netdata -sudo ./edit-config python.d/squid.conf -``` -#### Options - -There are 2 sections: - -* Global variables -* One or more JOBS that can define multiple different instances to monitor. - -The following options can be defined globally: priority, penalty, autodetection_retry, update_every, but can also be defined per JOB to override the global values. - -Additionally, the following collapsed table contains all the options that can be configured inside a JOB definition. - -Every configuration JOB starts with a `job_name` value which will appear in the dashboard, unless a `name` parameter is specified. - - -<details open><summary>Config options</summary> - -| Name | Description | Default | Required | -|:----|:-----------|:-------|:--------:| -| update_every | Sets the default data collection frequency. | 1 | no | -| priority | Controls the order of charts at the netdata dashboard. | 60000 | no | -| autodetection_retry | Sets the job re-check interval in seconds. | 0 | no | -| penalty | Indicates whether to apply penalty to update_every in case of failures. | yes | no | -| name | Job name. This value will overwrite the `job_name` value. JOBS with the same name are mutually exclusive. Only one of them will be allowed running at any time. This allows autodetection to try several alternatives and pick the one that works. | local | no | -| host | The host to connect to. | | yes | -| port | The port to connect to. | | yes | -| request | The URL to request from Squid. | | yes | - -</details> - -#### Examples - -##### Basic - -A basic configuration example. - -```yaml -example_job_name: - name: 'local' - host: 'localhost' - port: 3128 - request: 'cache_object://localhost:3128/counters' - -``` -##### Multi-instance - -> **Note**: When you define multiple jobs, their names must be unique. - -Collecting metrics from local and remote instances. - - -<details open><summary>Config</summary> - -```yaml -local_job: - name: 'local' - host: '127.0.0.1' - port: 3128 - request: 'cache_object://127.0.0.1:3128/counters' - -remote_job: - name: 'remote' - host: '192.0.2.1' - port: 3128 - request: 'cache_object://192.0.2.1:3128/counters' - -``` -</details> - - - -## Troubleshooting - -### Debug Mode - -To troubleshoot issues with the `squid` collector, run the `python.d.plugin` with the debug option enabled. The output -should give you clues as to why the collector isn't working. - -- Navigate to the `plugins.d` directory, usually at `/usr/libexec/netdata/plugins.d/`. If that's not the case on - your system, open `netdata.conf` and look for the `plugins` setting under `[directories]`. - - ```bash - cd /usr/libexec/netdata/plugins.d/ - ``` - -- Switch to the `netdata` user. - - ```bash - sudo -u netdata -s - ``` - -- Run the `python.d.plugin` to debug the collector: - - ```bash - ./python.d.plugin squid debug trace - ``` - - diff --git a/src/collectors/python.d.plugin/squid/squid.chart.py b/src/collectors/python.d.plugin/squid/squid.chart.py deleted file mode 100644 index bcae2d892..000000000 --- a/src/collectors/python.d.plugin/squid/squid.chart.py +++ /dev/null @@ -1,123 +0,0 @@ -# -*- coding: utf-8 -*- -# Description: squid netdata python.d module -# Author: Pawel Krupa (paulfantom) -# SPDX-License-Identifier: GPL-3.0-or-later - -from bases.FrameworkServices.SocketService import SocketService - -ORDER = [ - 'clients_net', - 'clients_requests', - 'servers_net', - 'servers_requests', -] - -CHARTS = { - 'clients_net': { - 'options': [None, 'Squid Client Bandwidth', 'kilobits/s', 'clients', 'squid.clients_net', 'area'], - 'lines': [ - ['client_http_kbytes_in', 'in', 'incremental', 8, 1], - ['client_http_kbytes_out', 'out', 'incremental', -8, 1], - ['client_http_hit_kbytes_out', 'hits', 'incremental', -8, 1] - ] - }, - 'clients_requests': { - 'options': [None, 'Squid Client Requests', 'requests/s', 'clients', 'squid.clients_requests', 'line'], - 'lines': [ - ['client_http_requests', 'requests', 'incremental'], - ['client_http_hits', 'hits', 'incremental'], - ['client_http_errors', 'errors', 'incremental', -1, 1] - ] - }, - 'servers_net': { - 'options': [None, 'Squid Server Bandwidth', 'kilobits/s', 'servers', 'squid.servers_net', 'area'], - 'lines': [ - ['server_all_kbytes_in', 'in', 'incremental', 8, 1], - ['server_all_kbytes_out', 'out', 'incremental', -8, 1] - ] - }, - 'servers_requests': { - 'options': [None, 'Squid Server Requests', 'requests/s', 'servers', 'squid.servers_requests', 'line'], - 'lines': [ - ['server_all_requests', 'requests', 'incremental'], - ['server_all_errors', 'errors', 'incremental', -1, 1] - ] - } -} - - -class Service(SocketService): - def __init__(self, configuration=None, name=None): - SocketService.__init__(self, configuration=configuration, name=name) - self._keep_alive = True - self.request = '' - self.host = 'localhost' - self.port = 3128 - self.order = ORDER - self.definitions = CHARTS - - def _get_data(self): - """ - Get data via http request - :return: dict - """ - response = self._get_raw_data() - - data = dict() - try: - raw = '' - for tmp in response.split('\r\n'): - if tmp.startswith('sample_time'): - raw = tmp - break - - if raw.startswith('<'): - self.error('invalid data received') - return None - - for row in raw.split('\n'): - if row.startswith(('client', 'server.all')): - tmp = row.split('=') - data[tmp[0].replace('.', '_').strip(' ')] = int(tmp[1]) - - except (ValueError, AttributeError, TypeError): - self.error('invalid data received') - return None - - if not data: - self.error('no data received') - return None - return data - - def _check_raw_data(self, data): - header = data[:1024].lower() - - if 'connection: keep-alive' in header: - self._keep_alive = True - else: - self._keep_alive = False - - if data[-7:] == '\r\n0\r\n\r\n' and 'transfer-encoding: chunked' in header: # HTTP/1.1 response - self.debug('received full response from squid') - return True - - self.debug('waiting more data from squid') - return False - - def check(self): - """ - Parse essential configuration, autodetect squid configuration (if needed), and check if data is available - :return: boolean - """ - self._parse_config() - # format request - req = self.request.decode() - if not req.startswith('GET'): - req = 'GET ' + req - if not req.endswith(' HTTP/1.1\r\n\r\n'): - req += ' HTTP/1.1\r\n\r\n' - self.request = req.encode() - if self._get_data() is not None: - return True - else: - return False diff --git a/src/collectors/python.d.plugin/squid/squid.conf b/src/collectors/python.d.plugin/squid/squid.conf deleted file mode 100644 index b90a52c0c..000000000 --- a/src/collectors/python.d.plugin/squid/squid.conf +++ /dev/null @@ -1,167 +0,0 @@ -# netdata python.d.plugin configuration for squid -# -# This file is in YaML format. Generally the format is: -# -# name: value -# -# There are 2 sections: -# - global variables -# - one or more JOBS -# -# JOBS allow you to collect values from multiple sources. -# Each source will have its own set of charts. -# -# JOB parameters have to be indented (using spaces only, example below). - -# ---------------------------------------------------------------------- -# Global Variables -# These variables set the defaults for all JOBs, however each JOB -# may define its own, overriding the defaults. - -# update_every sets the default data collection frequency. -# If unset, the python.d.plugin default is used. -# update_every: 1 - -# priority controls the order of charts at the netdata dashboard. -# Lower numbers move the charts towards the top of the page. -# If unset, the default for python.d.plugin is used. -# priority: 60000 - -# penalty indicates whether to apply penalty to update_every in case of failures. -# Penalty will increase every 5 failed updates in a row. Maximum penalty is 10 minutes. -# penalty: yes - -# autodetection_retry sets the job re-check interval in seconds. -# The job is not deleted if check fails. -# Attempts to start the job are made once every autodetection_retry. -# This feature is disabled by default. -# autodetection_retry: 0 - -# ---------------------------------------------------------------------- -# JOBS (data collection sources) -# -# The default JOBS share the same *name*. JOBS with the same name -# are mutually exclusive. Only one of them will be allowed running at -# any time. This allows autodetection to try several alternatives and -# pick the one that works. -# -# Any number of jobs is supported. -# -# All python.d.plugin JOBS (for all its modules) support a set of -# predefined parameters. These are: -# -# job_name: -# name: myname # the JOB's name as it will appear at the -# # dashboard (by default is the job_name) -# # JOBs sharing a name are mutually exclusive -# update_every: 1 # the JOB's data collection frequency -# priority: 60000 # the JOB's order on the dashboard -# penalty: yes # the JOB's penalty -# autodetection_retry: 0 # the JOB's re-check interval in seconds -# -# Additionally to the above, squid also supports the following: -# -# host : 'IP or HOSTNAME' # the host to connect to -# port : PORT # the port to connect to -# request: 'URL' # the URL to request from squid -# - -# ---------------------------------------------------------------------- -# SQUID CONFIGURATION -# -# See: -# http://wiki.squid-cache.org/Features/CacheManager -# -# In short, add to your squid configuration these: -# -# http_access allow localhost manager -# http_access deny manager -# -# To remotely monitor a squid: -# -# acl managerAdmin src 192.0.2.1 -# http_access allow localhost manager -# http_access allow managerAdmin manager -# http_access deny manager -# - -# ---------------------------------------------------------------------- -# AUTO-DETECTION JOBS -# only one of them will run (they have the same name) - -tcp3128old: - name : 'local' - host : 'localhost' - port : 3128 - request : 'cache_object://localhost:3128/counters' - -tcp8080old: - name : 'local' - host : 'localhost' - port : 8080 - request : 'cache_object://localhost:3128/counters' - -tcp3128new: - name : 'local' - host : 'localhost' - port : 3128 - request : '/squid-internal-mgr/counters' - -tcp8080new: - name : 'local' - host : 'localhost' - port : 8080 - request : '/squid-internal-mgr/counters' - -# IPv4 - -tcp3128oldipv4: - name : 'local' - host : '127.0.0.1' - port : 3128 - request : 'cache_object://127.0.0.1:3128/counters' - -tcp8080oldipv4: - name : 'local' - host : '127.0.0.1' - port : 8080 - request : 'cache_object://127.0.0.1:3128/counters' - -tcp3128newipv4: - name : 'local' - host : '127.0.0.1' - port : 3128 - request : '/squid-internal-mgr/counters' - -tcp8080newipv4: - name : 'local' - host : '127.0.0.1' - port : 8080 - request : '/squid-internal-mgr/counters' - -# IPv6 - -tcp3128oldipv6: - name : 'local' - host : '::1' - port : 3128 - request : 'cache_object://[::1]:3128/counters' - -tcp8080oldipv6: - name : 'local' - host : '::1' - port : 8080 - request : 'cache_object://[::1]:3128/counters' - -tcp3128newipv6: - name : 'local' - host : '::1' - port : 3128 - request : '/squid-internal-mgr/counters' - -tcp8080newipv6: - name : 'local' - host : '::1' - port : 8080 - request : '/squid-internal-mgr/counters' - diff --git a/src/collectors/python.d.plugin/tomcat/integrations/tomcat.md b/src/collectors/python.d.plugin/tomcat/integrations/tomcat.md deleted file mode 100644 index 64938ad62..000000000 --- a/src/collectors/python.d.plugin/tomcat/integrations/tomcat.md +++ /dev/null @@ -1,203 +0,0 @@ -<!--startmeta -custom_edit_url: "https://github.com/netdata/netdata/edit/master/src/collectors/python.d.plugin/tomcat/README.md" -meta_yaml: "https://github.com/netdata/netdata/edit/master/src/collectors/python.d.plugin/tomcat/metadata.yaml" -sidebar_label: "Tomcat" -learn_status: "Published" -learn_rel_path: "Collecting Metrics/Web Servers and Web Proxies" -most_popular: False -message: "DO NOT EDIT THIS FILE DIRECTLY, IT IS GENERATED BY THE COLLECTOR'S metadata.yaml FILE" -endmeta--> - -# Tomcat - - -<img src="https://netdata.cloud/img/tomcat.svg" width="150"/> - - -Plugin: python.d.plugin -Module: tomcat - -<img src="https://img.shields.io/badge/maintained%20by-Netdata-%2300ab44" /> - -## Overview - -This collector monitors Tomcat metrics about bandwidth, processing time, threads and more. - - -It parses the information provided by the http endpoint of the `/manager/status` in XML format - - -This collector is supported on all platforms. - -This collector supports collecting metrics from multiple instances of this integration, including remote instances. - -You need to provide the username and the password, to access the webserver's status page. Create a seperate user with read only rights for this particular endpoint - -### Default Behavior - -#### Auto-Detection - -If the Netdata Agent and the Tomcat webserver are in the same host, without configuration, module attempts to connect to http://localhost:8080/manager/status?XML=true, without any credentials. So it will probably fail. - -#### Limits - -This module is not supporting SSL communication. If you want a Netdata Agent to monitor a Tomcat deployment, you shouldnt try to monitor it via public network (public internet). Credentials are passed by Netdata in an unsecure port - -#### Performance Impact - -The default configuration for this integration is not expected to impose a significant performance impact on the system. - - -## Metrics - -Metrics grouped by *scope*. - -The scope defines the instance that the metric belongs to. An instance is uniquely identified by a set of labels. - - - -### Per Tomcat instance - -These metrics refer to the entire monitored application. - -This scope has no labels. - -Metrics: - -| Metric | Dimensions | Unit | -|:------|:----------|:----| -| tomcat.accesses | accesses, errors | requests/s | -| tomcat.bandwidth | sent, received | KiB/s | -| tomcat.processing_time | processing time | seconds | -| tomcat.threads | current, busy | current threads | -| tomcat.jvm | free, eden, survivor, tenured, code cache, compressed, metaspace | MiB | -| tomcat.jvm_eden | used, committed, max | MiB | -| tomcat.jvm_survivor | used, committed, max | MiB | -| tomcat.jvm_tenured | used, committed, max | MiB | - - - -## Alerts - -There are no alerts configured by default for this integration. - - -## Setup - -### Prerequisites - -#### Create a read-only `netdata` user, to monitor the `/status` endpoint. - -This is necessary for configuring the collector. - - -### Configuration - -#### File - -The configuration file name for this integration is `python.d/tomcat.conf`. - - -You can edit the configuration file using the `edit-config` script from the -Netdata [config directory](/docs/netdata-agent/configuration/README.md#the-netdata-config-directory). - -```bash -cd /etc/netdata 2>/dev/null || cd /opt/netdata/etc/netdata -sudo ./edit-config python.d/tomcat.conf -``` -#### Options - -There are 2 sections: - -* Global variables -* One or more JOBS that can define multiple different instances to monitor. - -The following options can be defined globally: priority, penalty, autodetection_retry, update_every, but can also be defined per JOB to override the global values.Additionally, the following collapsed table contains all the options that can be configured inside a JOB definition. - -Every configuration JOB starts with a `job_name` value which will appear in the dashboard, unless a `name` parameter is specified. - - -<details open><summary>Config options per job</summary> - -| Name | Description | Default | Required | -|:----|:-----------|:-------|:--------:| -| update_every | Sets the default data collection frequency. | 5 | no | -| priority | Controls the order of charts at the netdata dashboard. | 60000 | no | -| autodetection_retry | Sets the job re-check interval in seconds. | 0 | no | -| penalty | Indicates whether to apply penalty to update_every in case of failures. | yes | no | -| url | The URL of the Tomcat server's status endpoint. Always add the suffix ?XML=true. | no | yes | -| user | A valid user with read permission to access the /manager/status endpoint of the server. Required if the endpoint is password protected | no | no | -| pass | A valid password for the user in question. Required if the endpoint is password protected | no | no | -| connector_name | The connector component that communicates with a web connector via the AJP protocol, e.g ajp-bio-8009 | | no | - -</details> - -#### Examples - -##### Basic - -A basic example configuration - -```yaml -localhost: - name : 'local' - url : 'http://localhost:8080/manager/status?XML=true' - -``` -##### Using an IPv4 endpoint - -A typical configuration using an IPv4 endpoint - -<details open><summary>Config</summary> - -```yaml -local_ipv4: - name : 'local' - url : 'http://127.0.0.1:8080/manager/status?XML=true' - -``` -</details> - -##### Using an IPv6 endpoint - -A typical configuration using an IPv6 endpoint - -<details open><summary>Config</summary> - -```yaml -local_ipv6: - name : 'local' - url : 'http://[::1]:8080/manager/status?XML=true' - -``` -</details> - - - -## Troubleshooting - -### Debug Mode - -To troubleshoot issues with the `tomcat` collector, run the `python.d.plugin` with the debug option enabled. The output -should give you clues as to why the collector isn't working. - -- Navigate to the `plugins.d` directory, usually at `/usr/libexec/netdata/plugins.d/`. If that's not the case on - your system, open `netdata.conf` and look for the `plugins` setting under `[directories]`. - - ```bash - cd /usr/libexec/netdata/plugins.d/ - ``` - -- Switch to the `netdata` user. - - ```bash - sudo -u netdata -s - ``` - -- Run the `python.d.plugin` to debug the collector: - - ```bash - ./python.d.plugin tomcat debug trace - ``` - - diff --git a/src/collectors/python.d.plugin/tomcat/metadata.yaml b/src/collectors/python.d.plugin/tomcat/metadata.yaml deleted file mode 100644 index e68526073..000000000 --- a/src/collectors/python.d.plugin/tomcat/metadata.yaml +++ /dev/null @@ -1,200 +0,0 @@ -plugin_name: python.d.plugin -modules: - - meta: - plugin_name: python.d.plugin - module_name: tomcat - monitored_instance: - name: Tomcat - link: "https://tomcat.apache.org/" - categories: - - data-collection.web-servers-and-web-proxies - icon_filename: "tomcat.svg" - related_resources: - integrations: - list: [] - info_provided_to_referring_integrations: - description: "" - keywords: - - apache - - tomcat - - webserver - - websocket - - jakarta - - javaEE - most_popular: false - overview: - data_collection: - metrics_description: | - This collector monitors Tomcat metrics about bandwidth, processing time, threads and more. - method_description: | - It parses the information provided by the http endpoint of the `/manager/status` in XML format - supported_platforms: - include: [] - exclude: [] - multi_instance: true - additional_permissions: - description: "You need to provide the username and the password, to access the webserver's status page. Create a seperate user with read only rights for this particular endpoint" - default_behavior: - auto_detection: - description: "If the Netdata Agent and the Tomcat webserver are in the same host, without configuration, module attempts to connect to http://localhost:8080/manager/status?XML=true, without any credentials. So it will probably fail." - limits: - description: "This module is not supporting SSL communication. If you want a Netdata Agent to monitor a Tomcat deployment, you shouldnt try to monitor it via public network (public internet). Credentials are passed by Netdata in an unsecure port" - performance_impact: - description: "" - setup: - prerequisites: - list: - - title: Create a read-only `netdata` user, to monitor the `/status` endpoint. - description: This is necessary for configuring the collector. - configuration: - file: - name: "python.d/tomcat.conf" - options: - description: | - There are 2 sections: - - * Global variables - * One or more JOBS that can define multiple different instances to monitor. - - The following options can be defined globally: priority, penalty, autodetection_retry, update_every, but can also be defined per JOB to override the global values.Additionally, the following collapsed table contains all the options that can be configured inside a JOB definition. - - Every configuration JOB starts with a `job_name` value which will appear in the dashboard, unless a `name` parameter is specified. - folding: - title: "Config options per job" - enabled: true - list: - - name: update_every - description: Sets the default data collection frequency. - default_value: 5 - required: false - - name: priority - description: Controls the order of charts at the netdata dashboard. - default_value: 60000 - required: false - - name: autodetection_retry - description: Sets the job re-check interval in seconds. - default_value: 0 - required: false - - name: penalty - description: Indicates whether to apply penalty to update_every in case of failures. - default_value: yes - required: false - - name: url - description: The URL of the Tomcat server's status endpoint. Always add the suffix ?XML=true. - default_value: no - required: true - - name: user - description: A valid user with read permission to access the /manager/status endpoint of the server. Required if the endpoint is password protected - default_value: no - required: false - - name: pass - description: A valid password for the user in question. Required if the endpoint is password protected - default_value: no - required: false - - name: connector_name - description: The connector component that communicates with a web connector via the AJP protocol, e.g ajp-bio-8009 - default_value: "" - required: false - examples: - folding: - enabled: true - title: "Config" - list: - - name: Basic - folding: - enabled: false - description: A basic example configuration - config: | - localhost: - name : 'local' - url : 'http://localhost:8080/manager/status?XML=true' - - name: Using an IPv4 endpoint - description: A typical configuration using an IPv4 endpoint - config: | - local_ipv4: - name : 'local' - url : 'http://127.0.0.1:8080/manager/status?XML=true' - - name: Using an IPv6 endpoint - description: A typical configuration using an IPv6 endpoint - config: | - local_ipv6: - name : 'local' - url : 'http://[::1]:8080/manager/status?XML=true' - troubleshooting: - problems: - list: [] - alerts: [] - metrics: - folding: - title: Metrics - enabled: false - description: "" - availability: [] - scopes: - - name: global - description: "These metrics refer to the entire monitored application." - labels: [] - metrics: - - name: tomcat.accesses - description: Requests - unit: "requests/s" - chart_type: area - dimensions: - - name: accesses - - name: errors - - name: tomcat.bandwidth - description: Bandwidth - unit: "KiB/s" - chart_type: area - dimensions: - - name: sent - - name: received - - name: tomcat.processing_time - description: processing time - unit: "seconds" - chart_type: area - dimensions: - - name: processing time - - name: tomcat.threads - description: Threads - unit: "current threads" - chart_type: area - dimensions: - - name: current - - name: busy - - name: tomcat.jvm - description: JVM Memory Pool Usage - unit: "MiB" - chart_type: stacked - dimensions: - - name: free - - name: eden - - name: survivor - - name: tenured - - name: code cache - - name: compressed - - name: metaspace - - name: tomcat.jvm_eden - description: Eden Memory Usage - unit: "MiB" - chart_type: area - dimensions: - - name: used - - name: committed - - name: max - - name: tomcat.jvm_survivor - description: Survivor Memory Usage - unit: "MiB" - chart_type: area - dimensions: - - name: used - - name: committed - - name: max - - name: tomcat.jvm_tenured - description: Tenured Memory Usage - unit: "MiB" - chart_type: area - dimensions: - - name: used - - name: committed - - name: max diff --git a/src/collectors/python.d.plugin/tomcat/tomcat.chart.py b/src/collectors/python.d.plugin/tomcat/tomcat.chart.py deleted file mode 100644 index 90315f8c7..000000000 --- a/src/collectors/python.d.plugin/tomcat/tomcat.chart.py +++ /dev/null @@ -1,199 +0,0 @@ -# -*- coding: utf-8 -*- -# Description: tomcat netdata python.d module -# Author: Pawel Krupa (paulfantom) -# Author: Wei He (Wing924) -# SPDX-License-Identifier: GPL-3.0-or-later - -import re -import xml.etree.ElementTree as ET - -from bases.FrameworkServices.UrlService import UrlService - -MiB = 1 << 20 - -# Regex fix for Tomcat single quote XML attributes -# affecting Tomcat < 8.5.24 & 9.0.2 running with Java > 9 -# cf. https://bz.apache.org/bugzilla/show_bug.cgi?id=61603 -single_quote_regex = re.compile(r"='([^']+)'([^']+)''") - -ORDER = [ - 'accesses', - 'bandwidth', - 'processing_time', - 'threads', - 'jvm', - 'jvm_eden', - 'jvm_survivor', - 'jvm_tenured', -] - -CHARTS = { - 'accesses': { - 'options': [None, 'Requests', 'requests/s', 'statistics', 'tomcat.accesses', 'area'], - 'lines': [ - ['requestCount', 'accesses', 'incremental'], - ['errorCount', 'errors', 'incremental'], - ] - }, - 'bandwidth': { - 'options': [None, 'Bandwidth', 'KiB/s', 'statistics', 'tomcat.bandwidth', 'area'], - 'lines': [ - ['bytesSent', 'sent', 'incremental', 1, 1024], - ['bytesReceived', 'received', 'incremental', 1, 1024], - ] - }, - 'processing_time': { - 'options': [None, 'processing time', 'seconds', 'statistics', 'tomcat.processing_time', 'area'], - 'lines': [ - ['processingTime', 'processing time', 'incremental', 1, 1000] - ] - }, - 'threads': { - 'options': [None, 'Threads', 'current threads', 'statistics', 'tomcat.threads', 'area'], - 'lines': [ - ['currentThreadCount', 'current', 'absolute'], - ['currentThreadsBusy', 'busy', 'absolute'] - ] - }, - 'jvm': { - 'options': [None, 'JVM Memory Pool Usage', 'MiB', 'memory', 'tomcat.jvm', 'stacked'], - 'lines': [ - ['free', 'free', 'absolute', 1, MiB], - ['eden_used', 'eden', 'absolute', 1, MiB], - ['survivor_used', 'survivor', 'absolute', 1, MiB], - ['tenured_used', 'tenured', 'absolute', 1, MiB], - ['code_cache_used', 'code cache', 'absolute', 1, MiB], - ['compressed_used', 'compressed', 'absolute', 1, MiB], - ['metaspace_used', 'metaspace', 'absolute', 1, MiB], - ] - }, - 'jvm_eden': { - 'options': [None, 'Eden Memory Usage', 'MiB', 'memory', 'tomcat.jvm_eden', 'area'], - 'lines': [ - ['eden_used', 'used', 'absolute', 1, MiB], - ['eden_committed', 'committed', 'absolute', 1, MiB], - ['eden_max', 'max', 'absolute', 1, MiB] - ] - }, - 'jvm_survivor': { - 'options': [None, 'Survivor Memory Usage', 'MiB', 'memory', 'tomcat.jvm_survivor', 'area'], - 'lines': [ - ['survivor_used', 'used', 'absolute', 1, MiB], - ['survivor_committed', 'committed', 'absolute', 1, MiB], - ['survivor_max', 'max', 'absolute', 1, MiB], - ] - }, - 'jvm_tenured': { - 'options': [None, 'Tenured Memory Usage', 'MiB', 'memory', 'tomcat.jvm_tenured', 'area'], - 'lines': [ - ['tenured_used', 'used', 'absolute', 1, MiB], - ['tenured_committed', 'committed', 'absolute', 1, MiB], - ['tenured_max', 'max', 'absolute', 1, MiB] - ] - } -} - - -class Service(UrlService): - def __init__(self, configuration=None, name=None): - UrlService.__init__(self, configuration=configuration, name=name) - self.order = ORDER - self.definitions = CHARTS - self.url = self.configuration.get('url', 'http://127.0.0.1:8080/manager/status?XML=true') - self.connector_name = self.configuration.get('connector_name', None) - self.parse = self.xml_parse - - def xml_parse(self, data): - try: - return ET.fromstring(data) - except ET.ParseError: - self.debug('%s is not a valid XML page. Please add "?XML=true" to tomcat status page.' % self.url) - return None - - def xml_single_quote_fix_parse(self, data): - data = single_quote_regex.sub(r"='\g<1>\g<2>'", data) - return self.xml_parse(data) - - def check(self): - self._manager = self._build_manager() - - raw_data = self._get_raw_data() - if not raw_data: - return False - - if single_quote_regex.search(raw_data): - self.warning('Tomcat status page is returning invalid single quote XML, please consider upgrading ' - 'your Tomcat installation. See https://bz.apache.org/bugzilla/show_bug.cgi?id=61603') - self.parse = self.xml_single_quote_fix_parse - - return self.parse(raw_data) is not None - - def _get_data(self): - """ - Format data received from http request - :return: dict - """ - data = None - raw_data = self._get_raw_data() - if raw_data: - xml = self.parse(raw_data) - if xml is None: - return None - - data = {} - - jvm = xml.find('jvm') - - connector = None - if self.connector_name: - for conn in xml.findall('connector'): - if self.connector_name in conn.get('name'): - connector = conn - break - else: - connector = xml.find('connector') - - memory = jvm.find('memory') - data['free'] = memory.get('free') - data['total'] = memory.get('total') - - for pool in jvm.findall('memorypool'): - name = pool.get('name') - if 'Eden Space' in name: - data['eden_used'] = pool.get('usageUsed') - data['eden_committed'] = pool.get('usageCommitted') - data['eden_max'] = pool.get('usageMax') - elif 'Survivor Space' in name: - data['survivor_used'] = pool.get('usageUsed') - data['survivor_committed'] = pool.get('usageCommitted') - data['survivor_max'] = pool.get('usageMax') - elif 'Tenured Gen' in name or 'Old Gen' in name: - data['tenured_used'] = pool.get('usageUsed') - data['tenured_committed'] = pool.get('usageCommitted') - data['tenured_max'] = pool.get('usageMax') - elif name == 'Code Cache': - data['code_cache_used'] = pool.get('usageUsed') - data['code_cache_committed'] = pool.get('usageCommitted') - data['code_cache_max'] = pool.get('usageMax') - elif name == 'Compressed': - data['compressed_used'] = pool.get('usageUsed') - data['compressed_committed'] = pool.get('usageCommitted') - data['compressed_max'] = pool.get('usageMax') - elif name == 'Metaspace': - data['metaspace_used'] = pool.get('usageUsed') - data['metaspace_committed'] = pool.get('usageCommitted') - data['metaspace_max'] = pool.get('usageMax') - - if connector is not None: - thread_info = connector.find('threadInfo') - data['currentThreadsBusy'] = thread_info.get('currentThreadsBusy') - data['currentThreadCount'] = thread_info.get('currentThreadCount') - - request_info = connector.find('requestInfo') - data['processingTime'] = request_info.get('processingTime') - data['requestCount'] = request_info.get('requestCount') - data['errorCount'] = request_info.get('errorCount') - data['bytesReceived'] = request_info.get('bytesReceived') - data['bytesSent'] = request_info.get('bytesSent') - - return data or None diff --git a/src/collectors/python.d.plugin/tomcat/tomcat.conf b/src/collectors/python.d.plugin/tomcat/tomcat.conf deleted file mode 100644 index 009591bdf..000000000 --- a/src/collectors/python.d.plugin/tomcat/tomcat.conf +++ /dev/null @@ -1,89 +0,0 @@ -# netdata python.d.plugin configuration for tomcat -# -# This file is in YaML format. Generally the format is: -# -# name: value -# -# There are 2 sections: -# - global variables -# - one or more JOBS -# -# JOBS allow you to collect values from multiple sources. -# Each source will have its own set of charts. -# -# JOB parameters have to be indented (using spaces only, example below). - -# ---------------------------------------------------------------------- -# Global Variables -# These variables set the defaults for all JOBs, however each JOB -# may define its own, overriding the defaults. - -# update_every sets the default data collection frequency. -# If unset, the python.d.plugin default is used. -# update_every: 1 - -# priority controls the order of charts at the netdata dashboard. -# Lower numbers move the charts towards the top of the page. -# If unset, the default for python.d.plugin is used. -# priority: 60000 - -# penalty indicates whether to apply penalty to update_every in case of failures. -# Penalty will increase every 5 failed updates in a row. Maximum penalty is 10 minutes. -# penalty: yes - -# autodetection_retry sets the job re-check interval in seconds. -# The job is not deleted if check fails. -# Attempts to start the job are made once every autodetection_retry. -# This feature is disabled by default. -# autodetection_retry: 0 - -# ---------------------------------------------------------------------- -# JOBS (data collection sources) -# -# The default JOBS share the same *name*. JOBS with the same name -# are mutually exclusive. Only one of them will be allowed running at -# any time. This allows autodetection to try several alternatives and -# pick the one that works. -# -# Any number of jobs is supported. -# -# All python.d.plugin JOBS (for all its modules) support a set of -# predefined parameters. These are: -# -# job_name: -# name: myname # the JOB's name as it will appear at the -# # dashboard (by default is the job_name) -# # JOBs sharing a name are mutually exclusive -# update_every: 1 # the JOB's data collection frequency -# priority: 60000 # the JOB's order on the dashboard -# penalty: yes # the JOB's penalty -# autodetection_retry: 0 # the JOB's re-check interval in seconds -# -# Additionally to the above, tomcat also supports the following: -# -# url: 'URL' # the URL to fetch nginx's status stats -# -# if the URL is password protected, the following are supported: -# -# user: 'username' -# pass: 'password' -# -# if you have multiple connectors, the following are supported: -# -# connector_name: 'ajp-bio-8009' # default is null, which use first connector in status XML -# -# ---------------------------------------------------------------------- -# AUTO-DETECTION JOBS -# only one of them will run (they have the same name) - -localhost: - name : 'local' - url : 'http://localhost:8080/manager/status?XML=true' - -localipv4: - name : 'local' - url : 'http://127.0.0.1:8080/manager/status?XML=true' - -localipv6: - name : 'local' - url : 'http://[::1]:8080/manager/status?XML=true' diff --git a/src/collectors/python.d.plugin/tor/integrations/tor.md b/src/collectors/python.d.plugin/tor/integrations/tor.md deleted file mode 100644 index 728245cfa..000000000 --- a/src/collectors/python.d.plugin/tor/integrations/tor.md +++ /dev/null @@ -1,197 +0,0 @@ -<!--startmeta -custom_edit_url: "https://github.com/netdata/netdata/edit/master/src/collectors/python.d.plugin/tor/README.md" -meta_yaml: "https://github.com/netdata/netdata/edit/master/src/collectors/python.d.plugin/tor/metadata.yaml" -sidebar_label: "Tor" -learn_status: "Published" -learn_rel_path: "Collecting Metrics/VPNs" -most_popular: False -message: "DO NOT EDIT THIS FILE DIRECTLY, IT IS GENERATED BY THE COLLECTOR'S metadata.yaml FILE" -endmeta--> - -# Tor - - -<img src="https://netdata.cloud/img/tor.svg" width="150"/> - - -Plugin: python.d.plugin -Module: tor - -<img src="https://img.shields.io/badge/maintained%20by-Netdata-%2300ab44" /> - -## Overview - -This collector monitors Tor bandwidth traffic . - -It connects to the Tor control port to collect traffic statistics. - -This collector is supported on all platforms. - -This collector supports collecting metrics from multiple instances of this integration, including remote instances. - - -### Default Behavior - -#### Auto-Detection - -If no configuration is provided the collector will try to connect to 127.0.0.1:9051 to detect a running tor instance. - -#### Limits - -The default configuration for this integration does not impose any limits on data collection. - -#### Performance Impact - -The default configuration for this integration is not expected to impose a significant performance impact on the system. - - -## Metrics - -Metrics grouped by *scope*. - -The scope defines the instance that the metric belongs to. An instance is uniquely identified by a set of labels. - - - -### Per Tor instance - -These metrics refer to the entire monitored application. - -This scope has no labels. - -Metrics: - -| Metric | Dimensions | Unit | -|:------|:----------|:----| -| tor.traffic | read, write | KiB/s | - - - -## Alerts - -There are no alerts configured by default for this integration. - - -## Setup - -### Prerequisites - -#### Required python module - -The `stem` python library needs to be installed. - - -#### Required Tor configuration - -Add to /etc/tor/torrc: - -ControlPort 9051 - -For more options please read the manual. - - - -### Configuration - -#### File - -The configuration file name for this integration is `python.d/tor.conf`. - - -You can edit the configuration file using the `edit-config` script from the -Netdata [config directory](/docs/netdata-agent/configuration/README.md#the-netdata-config-directory). - -```bash -cd /etc/netdata 2>/dev/null || cd /opt/netdata/etc/netdata -sudo ./edit-config python.d/tor.conf -``` -#### Options - -There are 2 sections: - -* Global variables -* One or more JOBS that can define multiple different instances to monitor. - -The following options can be defined globally: priority, penalty, autodetection_retry, update_every, but can also be defined per JOB to override the global values. - -Additionally, the following collapsed table contains all the options that can be configured inside a JOB definition. - -Every configuration JOB starts with a `job_name` value which will appear in the dashboard, unless a `name` parameter is specified. - - -<details open><summary>Config options</summary> - -| Name | Description | Default | Required | -|:----|:-----------|:-------|:--------:| -| update_every | Sets the default data collection frequency. | 5 | no | -| priority | Controls the order of charts at the netdata dashboard. | 60000 | no | -| autodetection_retry | Sets the job re-check interval in seconds. | 0 | no | -| penalty | Indicates whether to apply penalty to update_every in case of failures. | yes | no | -| name | Job name. This value will overwrite the `job_name` value. JOBS with the same name are mutually exclusive. Only one of them will be allowed running at any time. This allows autodetection to try several alternatives and pick the one that works. | | no | -| control_addr | Tor control IP address | 127.0.0.1 | no | -| control_port | Tor control port. Can be either a tcp port, or a path to a socket file. | 9051 | no | -| password | Tor control password | | no | - -</details> - -#### Examples - -##### Local TCP - -A basic TCP configuration. `local_addr` is ommited and will default to `127.0.0.1` - -<details open><summary>Config</summary> - -```yaml -local_tcp: - name: 'local' - control_port: 9051 - password: <password> # if required - -``` -</details> - -##### Local socket - -A basic local socket configuration - -<details open><summary>Config</summary> - -```yaml -local_socket: - name: 'local' - control_port: '/var/run/tor/control' - password: <password> # if required - -``` -</details> - - - -## Troubleshooting - -### Debug Mode - -To troubleshoot issues with the `tor` collector, run the `python.d.plugin` with the debug option enabled. The output -should give you clues as to why the collector isn't working. - -- Navigate to the `plugins.d` directory, usually at `/usr/libexec/netdata/plugins.d/`. If that's not the case on - your system, open `netdata.conf` and look for the `plugins` setting under `[directories]`. - - ```bash - cd /usr/libexec/netdata/plugins.d/ - ``` - -- Switch to the `netdata` user. - - ```bash - sudo -u netdata -s - ``` - -- Run the `python.d.plugin` to debug the collector: - - ```bash - ./python.d.plugin tor debug trace - ``` - - diff --git a/src/collectors/python.d.plugin/tor/metadata.yaml b/src/collectors/python.d.plugin/tor/metadata.yaml deleted file mode 100644 index 8647eca23..000000000 --- a/src/collectors/python.d.plugin/tor/metadata.yaml +++ /dev/null @@ -1,143 +0,0 @@ -plugin_name: python.d.plugin -modules: - - meta: - plugin_name: python.d.plugin - module_name: tor - monitored_instance: - name: Tor - link: 'https://www.torproject.org/' - categories: - - data-collection.vpns - icon_filename: 'tor.svg' - related_resources: - integrations: - list: [] - info_provided_to_referring_integrations: - description: '' - keywords: - - tor - - traffic - - vpn - most_popular: false - overview: - data_collection: - metrics_description: 'This collector monitors Tor bandwidth traffic .' - method_description: 'It connects to the Tor control port to collect traffic statistics.' - supported_platforms: - include: [] - exclude: [] - multi_instance: true - additional_permissions: - description: '' - default_behavior: - auto_detection: - description: 'If no configuration is provided the collector will try to connect to 127.0.0.1:9051 to detect a running tor instance.' - limits: - description: '' - performance_impact: - description: '' - setup: - prerequisites: - list: - - title: 'Required python module' - description: | - The `stem` python library needs to be installed. - - title: 'Required Tor configuration' - description: | - Add to /etc/tor/torrc: - - ControlPort 9051 - - For more options please read the manual. - configuration: - file: - name: python.d/tor.conf - options: - description: | - There are 2 sections: - - * Global variables - * One or more JOBS that can define multiple different instances to monitor. - - The following options can be defined globally: priority, penalty, autodetection_retry, update_every, but can also be defined per JOB to override the global values. - - Additionally, the following collapsed table contains all the options that can be configured inside a JOB definition. - - Every configuration JOB starts with a `job_name` value which will appear in the dashboard, unless a `name` parameter is specified. - folding: - title: "Config options" - enabled: true - list: - - name: update_every - description: Sets the default data collection frequency. - default_value: 5 - required: false - - name: priority - description: Controls the order of charts at the netdata dashboard. - default_value: 60000 - required: false - - name: autodetection_retry - description: Sets the job re-check interval in seconds. - default_value: 0 - required: false - - name: penalty - description: Indicates whether to apply penalty to update_every in case of failures. - default_value: yes - required: false - - name: name - description: Job name. This value will overwrite the `job_name` value. JOBS with the same name are mutually exclusive. Only one of them will be allowed running at any time. This allows autodetection to try several alternatives and pick the one that works. - default_value: '' - required: false - - name: control_addr - description: Tor control IP address - default_value: 127.0.0.1 - required: false - - name: control_port - description: Tor control port. Can be either a tcp port, or a path to a socket file. - default_value: 9051 - required: false - - name: password - description: Tor control password - default_value: '' - required: false - examples: - folding: - enabled: true - title: "Config" - list: - - name: Local TCP - description: A basic TCP configuration. `local_addr` is ommited and will default to `127.0.0.1` - config: | - local_tcp: - name: 'local' - control_port: 9051 - password: <password> # if required - - name: Local socket - description: A basic local socket configuration - config: | - local_socket: - name: 'local' - control_port: '/var/run/tor/control' - password: <password> # if required - troubleshooting: - problems: - list: [] - alerts: [] - metrics: - folding: - title: Metrics - enabled: false - description: "" - availability: [] - scopes: - - name: global - description: "These metrics refer to the entire monitored application." - labels: [] - metrics: - - name: tor.traffic - description: Tor Traffic - unit: "KiB/s" - chart_type: area - dimensions: - - name: read - - name: write diff --git a/src/collectors/python.d.plugin/tor/tor.chart.py b/src/collectors/python.d.plugin/tor/tor.chart.py deleted file mode 100644 index f7bc2d79b..000000000 --- a/src/collectors/python.d.plugin/tor/tor.chart.py +++ /dev/null @@ -1,109 +0,0 @@ -# -*- coding: utf-8 -*- -# Description: adaptec_raid netdata python.d module -# Author: Federico Ceratto <federico.ceratto@gmail.com> -# Author: Ilya Mashchenko (ilyam8) -# SPDX-License-Identifier: GPL-3.0-or-later - - -from bases.FrameworkServices.SimpleService import SimpleService - -try: - import stem - import stem.connection - import stem.control - - STEM_AVAILABLE = True -except ImportError: - STEM_AVAILABLE = False - -DEF_PORT = 'default' -DEF_ADDR = '127.0.0.1' - -ORDER = [ - 'traffic', -] - -CHARTS = { - 'traffic': { - 'options': [None, 'Tor Traffic', 'KiB/s', 'traffic', 'tor.traffic', 'area'], - 'lines': [ - ['read', 'read', 'incremental', 1, 1024], - ['write', 'write', 'incremental', 1, -1024], - ] - } -} - - -class Service(SimpleService): - """Provide netdata service for Tor""" - - def __init__(self, configuration=None, name=None): - super(Service, self).__init__(configuration=configuration, name=name) - self.order = ORDER - self.definitions = CHARTS - self.port = self.configuration.get('control_port', DEF_PORT) - self.addr = self.configuration.get('control_addr', DEF_ADDR) - self.password = self.configuration.get('password') - self.use_socket = isinstance(self.port, str) and self.port != DEF_PORT and not self.port.isdigit() - self.conn = None - self.alive = False - - def check(self): - if not STEM_AVAILABLE: - self.error('the stem library is missing') - return False - - return self.connect() - - def get_data(self): - if not self.alive and not self.reconnect(): - return None - - data = dict() - - try: - data['read'] = self.conn.get_info('traffic/read') - data['write'] = self.conn.get_info('traffic/written') - except stem.ControllerError as error: - self.debug(error) - self.alive = False - - return data or None - - def authenticate(self): - try: - self.conn.authenticate(password=self.password) - except stem.connection.AuthenticationFailure as error: - self.error('authentication error: {0}'.format(error)) - return False - return True - - def connect_via_port(self): - try: - self.conn = stem.control.Controller.from_port(address=self.addr, port=self.port) - except (stem.SocketError, ValueError) as error: - self.error(error) - - def connect_via_socket(self): - try: - self.conn = stem.control.Controller.from_socket_file(path=self.port) - except (stem.SocketError, ValueError) as error: - self.error(error) - - def connect(self): - if self.conn: - self.conn.close() - self.conn = None - - if self.use_socket: - self.connect_via_socket() - else: - self.connect_via_port() - - if self.conn and self.authenticate(): - self.alive = True - - return self.alive - - def reconnect(self): - return self.connect() diff --git a/src/collectors/python.d.plugin/tor/tor.conf b/src/collectors/python.d.plugin/tor/tor.conf deleted file mode 100644 index c7c98dc0b..000000000 --- a/src/collectors/python.d.plugin/tor/tor.conf +++ /dev/null @@ -1,81 +0,0 @@ -# netdata python.d.plugin configuration for tor -# -# This file is in YaML format. Generally the format is: -# -# name: value -# -# There are 2 sections: -# - global variables -# - one or more JOBS -# -# JOBS allow you to collect values from multiple sources. -# Each source will have its own set of charts. -# -# JOB parameters have to be indented (using spaces only, example below). - -# ---------------------------------------------------------------------- -# Global Variables -# These variables set the defaults for all JOBs, however each JOB -# may define its own, overriding the defaults. - -# update_every sets the default data collection frequency. -# If unset, the python.d.plugin default is used. -# update_every: 1 - -# priority controls the order of charts at the netdata dashboard. -# Lower numbers move the charts towards the top of the page. -# If unset, the default for python.d.plugin is used. -# priority: 60000 - -# penalty indicates whether to apply penalty to update_every in case of failures. -# Penalty will increase every 5 failed updates in a row. Maximum penalty is 10 minutes. -# penalty: yes - -# autodetection_retry sets the job re-check interval in seconds. -# The job is not deleted if check fails. -# Attempts to start the job are made once every autodetection_retry. -# This feature is disabled by default. -# autodetection_retry: 0 - -# ---------------------------------------------------------------------- -# JOBS (data collection sources) -# -# The default JOBS share the same *name*. JOBS with the same name -# are mutually exclusive. Only one of them will be allowed running at -# any time. This allows autodetection to try several alternatives and -# pick the one that works. -# -# Any number of jobs is supported. -# -# All python.d.plugin JOBS (for all its modules) support a set of -# predefined parameters. These are: -# -# job_name: -# name: myname # the JOB's name as it will appear at the -# # dashboard (by default is the job_name) -# # JOBs sharing a name are mutually exclusive -# update_every: 1 # the JOB's data collection frequency -# priority: 60000 # the JOB's order on the dashboard -# penalty: yes # the JOB's penalty -# autodetection_retry: 0 # the JOB's re-check interval in seconds -# -# Additionally to the above, tor plugin also supports the following: -# -# control_addr: 'address' # tor control IP address (defaults to '127.0.0.1') -# control_port: 'port' # tor control port -# password: 'password' # tor control password -# -# ---------------------------------------------------------------------- -# AUTO-DETECTION JOBS -# only one of them will run (they have the same name) -# -# local_tcp: -# name: 'local' -# control_port: 9051 -# control_addr: 127.0.0.1 -# password: <password> -# -# local_socket: -# name: 'local' -# control_port: '/var/run/tor/control' -# password: <password> diff --git a/src/collectors/python.d.plugin/traefik/metadata.yaml b/src/collectors/python.d.plugin/traefik/metadata.yaml index 1d65a3dfe..5382ad54f 100644 --- a/src/collectors/python.d.plugin/traefik/metadata.yaml +++ b/src/collectors/python.d.plugin/traefik/metadata.yaml @@ -1,5 +1,5 @@ # This collector will not appear in documentation, as the go version is preferred, -# /src/go/collectors/go.d.plugin/modules/traefik/README.md +# /src/go/plugin/go.d/modules/traefik/README.md # # meta: # plugin_name: python.d.plugin diff --git a/src/collectors/python.d.plugin/uwsgi/integrations/uwsgi.md b/src/collectors/python.d.plugin/uwsgi/integrations/uwsgi.md deleted file mode 100644 index 508d9d195..000000000 --- a/src/collectors/python.d.plugin/uwsgi/integrations/uwsgi.md +++ /dev/null @@ -1,219 +0,0 @@ -<!--startmeta -custom_edit_url: "https://github.com/netdata/netdata/edit/master/src/collectors/python.d.plugin/uwsgi/README.md" -meta_yaml: "https://github.com/netdata/netdata/edit/master/src/collectors/python.d.plugin/uwsgi/metadata.yaml" -sidebar_label: "uWSGI" -learn_status: "Published" -learn_rel_path: "Collecting Metrics/Web Servers and Web Proxies" -most_popular: False -message: "DO NOT EDIT THIS FILE DIRECTLY, IT IS GENERATED BY THE COLLECTOR'S metadata.yaml FILE" -endmeta--> - -# uWSGI - - -<img src="https://netdata.cloud/img/uwsgi.svg" width="150"/> - - -Plugin: python.d.plugin -Module: uwsgi - -<img src="https://img.shields.io/badge/maintained%20by-Netdata-%2300ab44" /> - -## Overview - -This collector monitors uWSGI metrics about requests, workers, memory and more. - -It collects every metric exposed from the stats server of uWSGI, either from the `stats.socket` or from the web server's TCP/IP socket. - -This collector is supported on all platforms. - -This collector supports collecting metrics from multiple instances of this integration, including remote instances. - - -### Default Behavior - -#### Auto-Detection - -This collector will auto-detect uWSGI instances deployed on the local host, running on port 1717, or exposing stats on socket `tmp/stats.socket`. - -#### Limits - -The default configuration for this integration does not impose any limits on data collection. - -#### Performance Impact - -The default configuration for this integration is not expected to impose a significant performance impact on the system. - - -## Metrics - -Metrics grouped by *scope*. - -The scope defines the instance that the metric belongs to. An instance is uniquely identified by a set of labels. - - - -### Per uWSGI instance - -These metrics refer to the entire monitored application. - -This scope has no labels. - -Metrics: - -| Metric | Dimensions | Unit | -|:------|:----------|:----| -| uwsgi.requests | a dimension per worker | requests/s | -| uwsgi.tx | a dimension per worker | KiB/s | -| uwsgi.avg_rt | a dimension per worker | milliseconds | -| uwsgi.memory_rss | a dimension per worker | MiB | -| uwsgi.memory_vsz | a dimension per worker | MiB | -| uwsgi.exceptions | exceptions | exceptions | -| uwsgi.harakiris | harakiris | harakiris | -| uwsgi.respawns | respawns | respawns | - - - -## Alerts - -There are no alerts configured by default for this integration. - - -## Setup - -### Prerequisites - -#### Enable the uWSGI Stats server - -Make sure that you uWSGI exposes it's metrics via a Stats server. - -Source: https://uwsgi-docs.readthedocs.io/en/latest/StatsServer.html - - - -### Configuration - -#### File - -The configuration file name for this integration is `python.d/uwsgi.conf`. - - -You can edit the configuration file using the `edit-config` script from the -Netdata [config directory](/docs/netdata-agent/configuration/README.md#the-netdata-config-directory). - -```bash -cd /etc/netdata 2>/dev/null || cd /opt/netdata/etc/netdata -sudo ./edit-config python.d/uwsgi.conf -``` -#### Options - -There are 2 sections: - -* Global variables -* One or more JOBS that can define multiple different instances to monitor. - -The following options can be defined globally: priority, penalty, autodetection_retry, update_every, but can also be defined per JOB to override the global values. - -Additionally, the following collapsed table contains all the options that can be configured inside a JOB definition. - -Every configuration JOB starts with a `job_name` value which will appear in the dashboard, unless a `name` parameter is specified. - - -<details open><summary>Config options</summary> - -| Name | Description | Default | Required | -|:----|:-----------|:-------|:--------:| -| update_every | Sets the default data collection frequency. | 5 | no | -| priority | Controls the order of charts at the netdata dashboard. | 60000 | no | -| autodetection_retry | Sets the job re-check interval in seconds. | 0 | no | -| penalty | Indicates whether to apply penalty to update_every in case of failures. | yes | no | -| name | The JOB's name as it will appear at the dashboard (by default is the job_name) | job_name | no | -| socket | The 'path/to/uwsgistats.sock' | no | no | -| host | The host to connect to | no | no | -| port | The port to connect to | no | no | - -</details> - -#### Examples - -##### Basic (default out-of-the-box) - -A basic example configuration, one job will run at a time. Autodetect mechanism uses it by default. As all JOBs have the same name, only one can run at a time. - -<details open><summary>Config</summary> - -```yaml -socket: - name : 'local' - socket : '/tmp/stats.socket' - -localhost: - name : 'local' - host : 'localhost' - port : 1717 - -localipv4: - name : 'local' - host : '127.0.0.1' - port : 1717 - -localipv6: - name : 'local' - host : '::1' - port : 1717 - -``` -</details> - -##### Multi-instance - -> **Note**: When you define multiple jobs, their names must be unique. - -Collecting metrics from local and remote instances. - - -<details open><summary>Config</summary> - -```yaml -local: - name : 'local' - host : 'localhost' - port : 1717 - -remote: - name : 'remote' - host : '192.0.2.1' - port : 1717 - -``` -</details> - - - -## Troubleshooting - -### Debug Mode - -To troubleshoot issues with the `uwsgi` collector, run the `python.d.plugin` with the debug option enabled. The output -should give you clues as to why the collector isn't working. - -- Navigate to the `plugins.d` directory, usually at `/usr/libexec/netdata/plugins.d/`. If that's not the case on - your system, open `netdata.conf` and look for the `plugins` setting under `[directories]`. - - ```bash - cd /usr/libexec/netdata/plugins.d/ - ``` - -- Switch to the `netdata` user. - - ```bash - sudo -u netdata -s - ``` - -- Run the `python.d.plugin` to debug the collector: - - ```bash - ./python.d.plugin uwsgi debug trace - ``` - - diff --git a/src/collectors/python.d.plugin/uwsgi/metadata.yaml b/src/collectors/python.d.plugin/uwsgi/metadata.yaml deleted file mode 100644 index cdb090ac1..000000000 --- a/src/collectors/python.d.plugin/uwsgi/metadata.yaml +++ /dev/null @@ -1,201 +0,0 @@ -plugin_name: python.d.plugin -modules: - - meta: - plugin_name: python.d.plugin - module_name: uwsgi - monitored_instance: - name: uWSGI - link: "https://github.com/unbit/uwsgi/tree/2.0.21" - categories: - - data-collection.web-servers-and-web-proxies - icon_filename: "uwsgi.svg" - related_resources: - integrations: - list: [] - info_provided_to_referring_integrations: - description: "" - keywords: - - application server - - python - - web applications - most_popular: false - overview: - data_collection: - metrics_description: "This collector monitors uWSGI metrics about requests, workers, memory and more." - method_description: "It collects every metric exposed from the stats server of uWSGI, either from the `stats.socket` or from the web server's TCP/IP socket." - supported_platforms: - include: [] - exclude: [] - multi_instance: true - additional_permissions: - description: "" - default_behavior: - auto_detection: - description: "This collector will auto-detect uWSGI instances deployed on the local host, running on port 1717, or exposing stats on socket `tmp/stats.socket`." - limits: - description: "" - performance_impact: - description: "" - setup: - prerequisites: - list: - - title: Enable the uWSGI Stats server - description: | - Make sure that you uWSGI exposes it's metrics via a Stats server. - - Source: https://uwsgi-docs.readthedocs.io/en/latest/StatsServer.html - configuration: - file: - name: "python.d/uwsgi.conf" - options: - description: | - There are 2 sections: - - * Global variables - * One or more JOBS that can define multiple different instances to monitor. - - The following options can be defined globally: priority, penalty, autodetection_retry, update_every, but can also be defined per JOB to override the global values. - - Additionally, the following collapsed table contains all the options that can be configured inside a JOB definition. - - Every configuration JOB starts with a `job_name` value which will appear in the dashboard, unless a `name` parameter is specified. - folding: - title: "Config options" - enabled: true - list: - - name: update_every - description: Sets the default data collection frequency. - default_value: 5 - required: false - - name: priority - description: Controls the order of charts at the netdata dashboard. - default_value: 60000 - required: false - - name: autodetection_retry - description: Sets the job re-check interval in seconds. - default_value: 0 - required: false - - name: penalty - description: Indicates whether to apply penalty to update_every in case of failures. - default_value: yes - required: false - - name: name - description: The JOB's name as it will appear at the dashboard (by default is the job_name) - default_value: job_name - required: false - - name: socket - description: The 'path/to/uwsgistats.sock' - default_value: no - required: false - - name: host - description: The host to connect to - default_value: no - required: false - - name: port - description: The port to connect to - default_value: no - required: false - examples: - folding: - enabled: true - title: "Config" - list: - - name: Basic (default out-of-the-box) - description: A basic example configuration, one job will run at a time. Autodetect mechanism uses it by default. As all JOBs have the same name, only one can run at a time. - config: | - socket: - name : 'local' - socket : '/tmp/stats.socket' - - localhost: - name : 'local' - host : 'localhost' - port : 1717 - - localipv4: - name : 'local' - host : '127.0.0.1' - port : 1717 - - localipv6: - name : 'local' - host : '::1' - port : 1717 - - name: Multi-instance - description: | - > **Note**: When you define multiple jobs, their names must be unique. - - Collecting metrics from local and remote instances. - config: | - local: - name : 'local' - host : 'localhost' - port : 1717 - - remote: - name : 'remote' - host : '192.0.2.1' - port : 1717 - troubleshooting: - problems: - list: [] - alerts: [] - metrics: - folding: - title: Metrics - enabled: false - description: "" - availability: [] - scopes: - - name: global - description: "These metrics refer to the entire monitored application." - labels: [] - metrics: - - name: uwsgi.requests - description: Requests - unit: "requests/s" - chart_type: stacked - dimensions: - - name: a dimension per worker - - name: uwsgi.tx - description: Transmitted data - unit: "KiB/s" - chart_type: stacked - dimensions: - - name: a dimension per worker - - name: uwsgi.avg_rt - description: Average request time - unit: "milliseconds" - chart_type: line - dimensions: - - name: a dimension per worker - - name: uwsgi.memory_rss - description: RSS (Resident Set Size) - unit: "MiB" - chart_type: stacked - dimensions: - - name: a dimension per worker - - name: uwsgi.memory_vsz - description: VSZ (Virtual Memory Size) - unit: "MiB" - chart_type: stacked - dimensions: - - name: a dimension per worker - - name: uwsgi.exceptions - description: Exceptions - unit: "exceptions" - chart_type: line - dimensions: - - name: exceptions - - name: uwsgi.harakiris - description: Harakiris - unit: "harakiris" - chart_type: line - dimensions: - - name: harakiris - - name: uwsgi.respawns - description: Respawns - unit: "respawns" - chart_type: line - dimensions: - - name: respawns diff --git a/src/collectors/python.d.plugin/uwsgi/uwsgi.chart.py b/src/collectors/python.d.plugin/uwsgi/uwsgi.chart.py deleted file mode 100644 index e4d900005..000000000 --- a/src/collectors/python.d.plugin/uwsgi/uwsgi.chart.py +++ /dev/null @@ -1,177 +0,0 @@ -# -*- coding: utf-8 -*- -# Description: uwsgi netdata python.d module -# Author: Robbert Segeren (robbert-ef) -# SPDX-License-Identifier: GPL-3.0-or-later - -import json -from copy import deepcopy - -from bases.FrameworkServices.SocketService import SocketService - -ORDER = [ - 'requests', - 'tx', - 'avg_rt', - 'memory_rss', - 'memory_vsz', - 'exceptions', - 'harakiri', - 'respawn', -] - -DYNAMIC_CHARTS = [ - 'requests', - 'tx', - 'avg_rt', - 'memory_rss', - 'memory_vsz', -] - -# NOTE: lines are created dynamically in `check()` method -CHARTS = { - 'requests': { - 'options': [None, 'Requests', 'requests/s', 'requests', 'uwsgi.requests', 'stacked'], - 'lines': [ - ['requests', 'requests', 'incremental'] - ] - }, - 'tx': { - 'options': [None, 'Transmitted data', 'KiB/s', 'requests', 'uwsgi.tx', 'stacked'], - 'lines': [ - ['tx', 'tx', 'incremental'] - ] - }, - 'avg_rt': { - 'options': [None, 'Average request time', 'milliseconds', 'requests', 'uwsgi.avg_rt', 'line'], - 'lines': [ - ['avg_rt', 'avg_rt', 'absolute'] - ] - }, - 'memory_rss': { - 'options': [None, 'RSS (Resident Set Size)', 'MiB', 'memory', 'uwsgi.memory_rss', 'stacked'], - 'lines': [ - ['memory_rss', 'memory_rss', 'absolute', 1, 1 << 20] - ] - }, - 'memory_vsz': { - 'options': [None, 'VSZ (Virtual Memory Size)', 'MiB', 'memory', 'uwsgi.memory_vsz', 'stacked'], - 'lines': [ - ['memory_vsz', 'memory_vsz', 'absolute', 1, 1 << 20] - ] - }, - 'exceptions': { - 'options': [None, 'Exceptions', 'exceptions', 'exceptions', 'uwsgi.exceptions', 'line'], - 'lines': [ - ['exceptions', 'exceptions', 'incremental'] - ] - }, - 'harakiri': { - 'options': [None, 'Harakiris', 'harakiris', 'harakiris', 'uwsgi.harakiris', 'line'], - 'lines': [ - ['harakiri_count', 'harakiris', 'incremental'] - ] - }, - 'respawn': { - 'options': [None, 'Respawns', 'respawns', 'respawns', 'uwsgi.respawns', 'line'], - 'lines': [ - ['respawn_count', 'respawns', 'incremental'] - ] - }, -} - - -class Service(SocketService): - def __init__(self, configuration=None, name=None): - super(Service, self).__init__(configuration=configuration, name=name) - self.order = ORDER - self.definitions = deepcopy(CHARTS) - self.url = self.configuration.get('host', 'localhost') - self.port = self.configuration.get('port', 1717) - # Clear dynamic dimensions, these are added during `_get_data()` to allow adding workers at run-time - for chart in DYNAMIC_CHARTS: - self.definitions[chart]['lines'] = [] - self.last_result = {} - self.workers = [] - - def read_data(self): - """ - Read data from socket and parse as JSON. - :return: (dict) stats - """ - raw_data = self._get_raw_data() - if not raw_data: - return None - try: - return json.loads(raw_data) - except ValueError as err: - self.error(err) - return None - - def check(self): - """ - Parse configuration and check if we can read data. - :return: boolean - """ - self._parse_config() - return bool(self.read_data()) - - def add_worker_dimensions(self, key): - """ - Helper to add dimensions for a worker. - :param key: (int or str) worker identifier - :return: - """ - for chart in DYNAMIC_CHARTS: - for line in CHARTS[chart]['lines']: - dimension_id = '{}_{}'.format(line[0], key) - dimension_name = str(key) - - dimension = [dimension_id, dimension_name] + line[2:] - self.charts[chart].add_dimension(dimension) - - @staticmethod - def _check_raw_data(data): - # The server will close the connection when it's done sending - # data, so just keep looping until that happens. - return False - - def _get_data(self): - """ - Read data from socket - :return: dict - """ - stats = self.read_data() - if not stats: - return None - - result = { - 'exceptions': 0, - 'harakiri_count': 0, - 'respawn_count': 0, - } - - for worker in stats['workers']: - key = worker['pid'] - - # Add dimensions for new workers - if key not in self.workers: - self.add_worker_dimensions(key) - self.workers.append(key) - - result['requests_{}'.format(key)] = worker['requests'] - result['tx_{}'.format(key)] = worker['tx'] - result['avg_rt_{}'.format(key)] = worker['avg_rt'] - - # avg_rt is not reset by uwsgi, so reset here - if self.last_result.get('requests_{}'.format(key)) == worker['requests']: - result['avg_rt_{}'.format(key)] = 0 - - result['memory_rss_{}'.format(key)] = worker['rss'] - result['memory_vsz_{}'.format(key)] = worker['vsz'] - - result['exceptions'] += worker['exceptions'] - result['harakiri_count'] += worker['harakiri_count'] - result['respawn_count'] += worker['respawn_count'] - - self.last_result = result - return result diff --git a/src/collectors/python.d.plugin/uwsgi/uwsgi.conf b/src/collectors/python.d.plugin/uwsgi/uwsgi.conf deleted file mode 100644 index 7d09e7330..000000000 --- a/src/collectors/python.d.plugin/uwsgi/uwsgi.conf +++ /dev/null @@ -1,92 +0,0 @@ -# netdata python.d.plugin configuration for uwsgi -# -# This file is in YaML format. Generally the format is: -# -# name: value -# -# There are 2 sections: -# - global variables -# - one or more JOBS -# -# JOBS allow you to collect values from multiple sources. -# Each source will have its own set of charts. -# -# JOB parameters have to be indented (using spaces only, example below). - -# ---------------------------------------------------------------------- -# Global Variables -# These variables set the defaults for all JOBs, however each JOB -# may define its own, overriding the defaults. - -# update_every sets the default data collection frequency. -# If unset, the python.d.plugin default is used. -# update_every: 1 - -# priority controls the order of charts at the netdata dashboard. -# Lower numbers move the charts towards the top of the page. -# If unset, the default for python.d.plugin is used. -# priority: 60000 - -# penalty indicates whether to apply penalty to update_every in case of failures. -# Penalty will increase every 5 failed updates in a row. Maximum penalty is 10 minutes. -# penalty: yes - -# autodetection_retry sets the job re-check interval in seconds. -# The job is not deleted if check fails. -# Attempts to start the job are made once every autodetection_retry. -# This feature is disabled by default. -# autodetection_retry: 0 - -# ---------------------------------------------------------------------- -# JOBS (data collection sources) -# -# The default JOBS share the same *name*. JOBS with the same name -# are mutually exclusive. Only one of them will be allowed running at -# any time. This allows autodetection to try several alternatives and -# pick the one that works. -# -# Any number of jobs is supported. -# -# All python.d.plugin JOBS (for all its modules) support a set of -# predefined parameters. These are: -# -# job_name: -# name: myname # the JOB's name as it will appear at the -# # dashboard (by default is the job_name) -# # JOBs sharing a name are mutually exclusive -# update_every: 1 # the JOB's data collection frequency -# priority: 60000 # the JOB's order on the dashboard -# penalty: yes # the JOB's penalty -# autodetection_retry: 0 # the JOB's re-check interval in seconds -# -# Additionally to the above, uwsgi also supports the following: -# -# socket: 'path/to/uwsgistats.sock' -# -# or -# host: 'IP or HOSTNAME' # the host to connect to -# port: PORT # the port to connect to -# -# ---------------------------------------------------------------------- -# AUTO-DETECTION JOBS -# only one of them will run (they have the same name) -# - -socket: - name : 'local' - socket : '/tmp/stats.socket' - -localhost: - name : 'local' - host : 'localhost' - port : 1717 - -localipv4: - name : 'local' - host : '127.0.0.1' - port : 1717 - -localipv6: - name : 'local' - host : '::1' - port : 1717 diff --git a/src/collectors/python.d.plugin/varnish/integrations/varnish.md b/src/collectors/python.d.plugin/varnish/integrations/varnish.md index 64da800a3..5850dcc4c 100644 --- a/src/collectors/python.d.plugin/varnish/integrations/varnish.md +++ b/src/collectors/python.d.plugin/varnish/integrations/varnish.md @@ -188,6 +188,7 @@ job_name: ### Debug Mode + To troubleshoot issues with the `varnish` collector, run the `python.d.plugin` with the debug option enabled. The output should give you clues as to why the collector isn't working. @@ -210,4 +211,37 @@ should give you clues as to why the collector isn't working. ./python.d.plugin varnish debug trace ``` +### Getting Logs + +If you're encountering problems with the `varnish` collector, follow these steps to retrieve logs and identify potential issues: + +- **Run the command** specific to your system (systemd, non-systemd, or Docker container). +- **Examine the output** for any warnings or error messages that might indicate issues. These messages should provide clues about the root cause of the problem. + +#### System with systemd + +Use the following command to view logs generated since the last Netdata service restart: + +```bash +journalctl _SYSTEMD_INVOCATION_ID="$(systemctl show --value --property=InvocationID netdata)" --namespace=netdata --grep varnish +``` + +#### System without systemd + +Locate the collector log file, typically at `/var/log/netdata/collector.log`, and use `grep` to filter for collector's name: + +```bash +grep varnish /var/log/netdata/collector.log +``` + +**Note**: This method shows logs from all restarts. Focus on the **latest entries** for troubleshooting current issues. + +#### Docker Container + +If your Netdata runs in a Docker container named "netdata" (replace if different), use this command: + +```bash +docker logs netdata 2>&1 | grep varnish +``` + diff --git a/src/collectors/python.d.plugin/w1sensor/integrations/1-wire_sensors.md b/src/collectors/python.d.plugin/w1sensor/integrations/1-wire_sensors.md index 35517aeda..15582879e 100644 --- a/src/collectors/python.d.plugin/w1sensor/integrations/1-wire_sensors.md +++ b/src/collectors/python.d.plugin/w1sensor/integrations/1-wire_sensors.md @@ -142,6 +142,7 @@ sensors: ### Debug Mode + To troubleshoot issues with the `w1sensor` collector, run the `python.d.plugin` with the debug option enabled. The output should give you clues as to why the collector isn't working. @@ -164,4 +165,37 @@ should give you clues as to why the collector isn't working. ./python.d.plugin w1sensor debug trace ``` +### Getting Logs + +If you're encountering problems with the `w1sensor` collector, follow these steps to retrieve logs and identify potential issues: + +- **Run the command** specific to your system (systemd, non-systemd, or Docker container). +- **Examine the output** for any warnings or error messages that might indicate issues. These messages should provide clues about the root cause of the problem. + +#### System with systemd + +Use the following command to view logs generated since the last Netdata service restart: + +```bash +journalctl _SYSTEMD_INVOCATION_ID="$(systemctl show --value --property=InvocationID netdata)" --namespace=netdata --grep w1sensor +``` + +#### System without systemd + +Locate the collector log file, typically at `/var/log/netdata/collector.log`, and use `grep` to filter for collector's name: + +```bash +grep w1sensor /var/log/netdata/collector.log +``` + +**Note**: This method shows logs from all restarts. Focus on the **latest entries** for troubleshooting current issues. + +#### Docker Container + +If your Netdata runs in a Docker container named "netdata" (replace if different), use this command: + +```bash +docker logs netdata 2>&1 | grep w1sensor +``` + diff --git a/src/collectors/python.d.plugin/zscores/integrations/python.d_zscores.md b/src/collectors/python.d.plugin/zscores/integrations/python.d_zscores.md index 1aceec67d..a5d2a7e47 100644 --- a/src/collectors/python.d.plugin/zscores/integrations/python.d_zscores.md +++ b/src/collectors/python.d.plugin/zscores/integrations/python.d_zscores.md @@ -170,6 +170,7 @@ local: ### Debug Mode + To troubleshoot issues with the `zscores` collector, run the `python.d.plugin` with the debug option enabled. The output should give you clues as to why the collector isn't working. @@ -192,4 +193,37 @@ should give you clues as to why the collector isn't working. ./python.d.plugin zscores debug trace ``` +### Getting Logs + +If you're encountering problems with the `zscores` collector, follow these steps to retrieve logs and identify potential issues: + +- **Run the command** specific to your system (systemd, non-systemd, or Docker container). +- **Examine the output** for any warnings or error messages that might indicate issues. These messages should provide clues about the root cause of the problem. + +#### System with systemd + +Use the following command to view logs generated since the last Netdata service restart: + +```bash +journalctl _SYSTEMD_INVOCATION_ID="$(systemctl show --value --property=InvocationID netdata)" --namespace=netdata --grep zscores +``` + +#### System without systemd + +Locate the collector log file, typically at `/var/log/netdata/collector.log`, and use `grep` to filter for collector's name: + +```bash +grep zscores /var/log/netdata/collector.log +``` + +**Note**: This method shows logs from all restarts. Focus on the **latest entries** for troubleshooting current issues. + +#### Docker Container + +If your Netdata runs in a Docker container named "netdata" (replace if different), use this command: + +```bash +docker logs netdata 2>&1 | grep zscores +``` + diff --git a/src/collectors/systemd-journal.plugin/systemd-journal.c b/src/collectors/systemd-journal.plugin/systemd-journal.c index 57d7ecbc4..6da9c687e 100644 --- a/src/collectors/systemd-journal.plugin/systemd-journal.c +++ b/src/collectors/systemd-journal.plugin/systemd-journal.c @@ -1037,7 +1037,7 @@ static ND_SD_JOURNAL_STATUS netdata_systemd_journal_query_one_file( struct journal_file *jf, FUNCTION_QUERY_STATUS *fqs) { sd_journal *j = NULL; - errno = 0; + errno_clear(); fstat_cache_enable_on_thread(); diff --git a/src/collectors/tc.plugin/plugin_tc.c b/src/collectors/tc.plugin/plugin_tc.c index d2599f728..da2a39194 100644 --- a/src/collectors/tc.plugin/plugin_tc.c +++ b/src/collectors/tc.plugin/plugin_tc.c @@ -834,7 +834,7 @@ static inline void tc_split_words(char *str, char **words, int max_words) { while(i < max_words) words[i++] = NULL; } -static pid_t tc_child_pid = 0; +static POPEN_INSTANCE *tc_child_instance = NULL; static void tc_main_cleanup(void *pptr) { struct netdata_static_thread *static_thread = CLEANUP_FUNCTION_GET_PTR(pptr); @@ -847,16 +847,10 @@ static void tc_main_cleanup(void *pptr) { collector_info("cleaning up..."); - if(tc_child_pid) { - collector_info("TC: killing with SIGTERM tc-qos-helper process %d", tc_child_pid); - if(killpid(tc_child_pid) != -1) { - siginfo_t info; - - collector_info("TC: waiting for tc plugin child process pid %d to exit...", tc_child_pid); - netdata_waitid(P_PID, (id_t) tc_child_pid, &info, WEXITED); - } - - tc_child_pid = 0; + if(tc_child_instance) { + collector_info("TC: stopping the running tc-qos-helper script"); + int code = spawn_popen_wait(tc_child_instance); (void)code; + tc_child_instance = NULL; } static_thread->enabled = NETDATA_MAIN_THREAD_EXITED; @@ -921,21 +915,20 @@ void *tc_main(void *ptr) { char *tc_script = config_get("plugin:tc", "script to run to get tc values", command); while(service_running(SERVICE_COLLECTORS)) { - FILE *fp_child_input, *fp_child_output; struct tc_device *device = NULL; struct tc_class *class = NULL; snprintfz(command, TC_LINE_MAX, "exec %s %d", tc_script, localhost->rrd_update_every); netdata_log_debug(D_TC_LOOP, "executing '%s'", command); - fp_child_output = netdata_popen(command, (pid_t *)&tc_child_pid, &fp_child_input); - if(unlikely(!fp_child_output)) { + tc_child_instance = spawn_popen_run(command); + if(!tc_child_instance) { collector_error("TC: Cannot popen(\"%s\", \"r\").", command); goto cleanup; } char buffer[TC_LINE_MAX+1] = ""; - while(fgets(buffer, TC_LINE_MAX, fp_child_output) != NULL) { + while(fgets(buffer, TC_LINE_MAX, tc_child_instance->child_stdout_fp) != NULL) { if(unlikely(!service_running(SERVICE_COLLECTORS))) break; buffer[TC_LINE_MAX] = '\0'; @@ -1142,8 +1135,8 @@ void *tc_main(void *ptr) { } // fgets() failed or loop broke - int code = netdata_pclose(fp_child_input, fp_child_output, (pid_t)tc_child_pid); - tc_child_pid = 0; + int code = spawn_popen_kill(tc_child_instance); + tc_child_instance = NULL; if(unlikely(device)) { // tc_device_free(device); diff --git a/src/collectors/windows.plugin/perflib-network.c b/src/collectors/windows.plugin/perflib-network.c index 2f1bc3c53..ecadd1e87 100644 --- a/src/collectors/windows.plugin/perflib-network.c +++ b/src/collectors/windows.plugin/perflib-network.c @@ -312,7 +312,7 @@ static bool do_network_interface(PERF_DATA_BLOCK *pDataBlock, int update_every, d->collected_metadata = true;
}
- if(perflibGetInstanceCounter(pDataBlock, pObjectType, pi, &d->traffic.received) ||
+ if(perflibGetInstanceCounter(pDataBlock, pObjectType, pi, &d->traffic.received) &&
perflibGetInstanceCounter(pDataBlock, pObjectType, pi, &d->traffic.sent)) {
if(d->traffic.received.current.Data == 0 && d->traffic.sent.current.Data == 0)
@@ -350,7 +350,7 @@ static bool do_network_interface(PERF_DATA_BLOCK *pDataBlock, int update_every, rrdset_done(d->traffic.st);
}
- if(perflibGetInstanceCounter(pDataBlock, pObjectType, pi, &d->packets.received) ||
+ if(perflibGetInstanceCounter(pDataBlock, pObjectType, pi, &d->packets.received) &&
perflibGetInstanceCounter(pDataBlock, pObjectType, pi, &d->packets.sent)) {
if (unlikely(!d->packets.st)) {
diff --git a/src/collectors/windows.plugin/perflib-objects.c b/src/collectors/windows.plugin/perflib-objects.c new file mode 100644 index 000000000..6628ff864 --- /dev/null +++ b/src/collectors/windows.plugin/perflib-objects.c @@ -0,0 +1,47 @@ +// SPDX-License-Identifier: GPL-3.0-or-later
+
+#include "windows_plugin.h"
+#include "windows-internals.h"
+
+#define _COMMON_PLUGIN_NAME "windows.plugin"
+#define _COMMON_PLUGIN_MODULE_NAME "PerflibObjects"
+#include "../common-contexts/common-contexts.h"
+
+static void initialize(void) {
+ ;
+}
+
+static bool do_objects(PERF_DATA_BLOCK *pDataBlock, int update_every) {
+ PERF_OBJECT_TYPE *pObjectType = perflibFindObjectTypeByName(pDataBlock, "Objects");
+ if (!pObjectType)
+ return false;
+
+ static COUNTER_DATA semaphores = { .key = "Semaphores" };
+
+ if(perflibGetObjectCounter(pDataBlock, pObjectType, &semaphores)) {
+ ULONGLONG sem = semaphores.current.Data;
+ common_semaphore_ipc(sem, WINDOWS_MAX_KERNEL_OBJECT, _COMMON_PLUGIN_MODULE_NAME, update_every);
+ }
+
+ return true;
+}
+
+int do_PerflibObjects(int update_every, usec_t dt __maybe_unused) {
+ static bool initialized = false;
+
+ if(unlikely(!initialized)) {
+ initialize();
+ initialized = true;
+ }
+
+ DWORD id = RegistryFindIDByName("Objects");
+ if(id == PERFLIB_REGISTRY_NAME_NOT_FOUND)
+ return -1;
+
+ PERF_DATA_BLOCK *pDataBlock = perflibGetPerformanceData(id);
+ if(!pDataBlock) return -1;
+
+ do_objects(pDataBlock, update_every);
+
+ return 0;
+}
diff --git a/src/collectors/windows.plugin/perflib-processor.c b/src/collectors/windows.plugin/perflib-processor.c index d149c6aad..4c7d86c90 100644 --- a/src/collectors/windows.plugin/perflib-processor.c +++ b/src/collectors/windows.plugin/perflib-processor.c @@ -3,6 +3,10 @@ #include "windows_plugin.h"
#include "windows-internals.h"
+#define _COMMON_PLUGIN_NAME "windows.plugin"
+#define _COMMON_PLUGIN_MODULE_NAME "PerflibProcesses"
+#include "../common-contexts/common-contexts.h"
+
struct processor {
bool collected_metadata;
@@ -22,6 +26,8 @@ struct processor { COUNTER_DATA percentDPCTime;
COUNTER_DATA percentInterruptTime;
COUNTER_DATA percentIdleTime;
+
+ COUNTER_DATA interruptsPerSec;
};
struct processor total = { 0 };
@@ -33,6 +39,7 @@ void initialize_processor_keys(struct processor *p) { p->percentDPCTime.key = "% DPC Time";
p->percentInterruptTime.key = "% Interrupt Time";
p->percentIdleTime.key = "% Idle Time";
+ p->interruptsPerSec.key = "Interrupts/sec";
}
void dict_processor_insert_cb(const DICTIONARY_ITEM *item __maybe_unused, void *value, void *data __maybe_unused) {
@@ -57,6 +64,7 @@ static bool do_processors(PERF_DATA_BLOCK *pDataBlock, int update_every) { static const RRDVAR_ACQUIRED *cpus_var = NULL;
int cores_found = 0;
+ uint64_t totalIPC = 0;
PERF_INSTANCE_DEFINITION *pi = NULL;
for(LONG i = 0; i < pObjectType->NumInstances ; i++) {
@@ -96,6 +104,8 @@ static bool do_processors(PERF_DATA_BLOCK *pDataBlock, int update_every) { perflibGetInstanceCounter(pDataBlock, pObjectType, pi, &p->percentInterruptTime);
perflibGetInstanceCounter(pDataBlock, pObjectType, pi, &p->percentIdleTime);
+ perflibGetInstanceCounter(pDataBlock, pObjectType, pi, &p->interruptsPerSec);
+
if(!p->st) {
p->st = rrdset_create_localhost(
is_total ? "system" : "cpu"
@@ -130,6 +140,8 @@ static bool do_processors(PERF_DATA_BLOCK *pDataBlock, int update_every) { uint64_t irq = p->percentInterruptTime.current.Data;
uint64_t idle = p->percentIdleTime.current.Data;
+ totalIPC += p->interruptsPerSec.current.Data;
+
rrddim_set_by_pointer(p->st, p->rd_user, (collected_number)user);
rrddim_set_by_pointer(p->st, p->rd_system, (collected_number)system);
rrddim_set_by_pointer(p->st, p->rd_irq, (collected_number)irq);
@@ -167,6 +179,8 @@ static bool do_processors(PERF_DATA_BLOCK *pDataBlock, int update_every) { if(cpus_var)
rrdvar_host_variable_set(localhost, cpus_var, cores_found);
+ common_interrupts(totalIPC, update_every, NULL);
+
return true;
}
diff --git a/src/collectors/windows.plugin/windows_plugin.c b/src/collectors/windows.plugin/windows_plugin.c index 2d357b9b1..35ef857be 100644 --- a/src/collectors/windows.plugin/windows_plugin.c +++ b/src/collectors/windows.plugin/windows_plugin.c @@ -24,6 +24,7 @@ static struct proc_module { {.name = "PerflibMemory", .dim = "PerflibMemory", .func = do_PerflibMemory}, {.name = "PerflibStorage", .dim = "PerflibStorage", .func = do_PerflibStorage}, {.name = "PerflibNetwork", .dim = "PerflibNetwork", .func = do_PerflibNetwork}, + {.name = "PerflibObjects", .dim = "PerflibObjects", .func = do_PerflibObjects}, // the terminator of this array {.name = NULL, .dim = NULL, .func = NULL} diff --git a/src/collectors/windows.plugin/windows_plugin.h b/src/collectors/windows.plugin/windows_plugin.h index f76b9a782..73c1ecda1 100644 --- a/src/collectors/windows.plugin/windows_plugin.h +++ b/src/collectors/windows.plugin/windows_plugin.h @@ -7,6 +7,10 @@ #define PLUGIN_WINDOWS_NAME "windows.plugin" +// https://learn.microsoft.com/es-es/windows/win32/sysinfo/kernel-objects?redirectedfrom=MSDN +// 2^24 +#define WINDOWS_MAX_KERNEL_OBJECT 16777216 + void *win_plugin_main(void *ptr); extern char windows_shared_buffer[8192]; @@ -19,6 +23,7 @@ int do_PerflibNetwork(int update_every, usec_t dt); int do_PerflibProcesses(int update_every, usec_t dt); int do_PerflibProcessor(int update_every, usec_t dt); int do_PerflibMemory(int update_every, usec_t dt); +int do_PerflibObjects(int update_every, usec_t dt); #include "perflib.h" diff --git a/src/collectors/xenstat.plugin/xenstat_plugin.c b/src/collectors/xenstat.plugin/xenstat_plugin.c index b17b746f5..e4b8a2bd0 100644 --- a/src/collectors/xenstat.plugin/xenstat_plugin.c +++ b/src/collectors/xenstat.plugin/xenstat_plugin.c @@ -986,7 +986,7 @@ int main(int argc, char **argv) { netdata_log_error("xenstat.plugin: ignoring parameter '%s'", argv[i]); } - errno = 0; + errno_clear(); if(freq >= netdata_update_every) netdata_update_every = freq; diff --git a/src/daemon/analytics.c b/src/daemon/analytics.c index 33f6f357f..0e5c221c4 100644 --- a/src/daemon/analytics.c +++ b/src/daemon/analytics.c @@ -1,5 +1,6 @@ // SPDX-License-Identifier: GPL-3.0-or-later +#include "analytics.h" #include "common.h" #include "buildinfo.h" @@ -325,18 +326,15 @@ void analytics_alarms_notifications(void) strcat(script, " dump_methods"); - pid_t command_pid; - netdata_log_debug(D_ANALYTICS, "Executing %s", script); BUFFER *b = buffer_create(1000, NULL); int cnt = 0; - FILE *fp_child_input; - FILE *fp_child_output = netdata_popen(script, &command_pid, &fp_child_input); - if (fp_child_output) { + POPEN_INSTANCE *instance = spawn_popen_run(script); + if (instance) { char line[200 + 1]; - while (fgets(line, 200, fp_child_output) != NULL) { + while (fgets(line, 200, instance->child_stdout_fp) != NULL) { char *end = line; while (*end && *end != '\n') end++; @@ -349,7 +347,7 @@ void analytics_alarms_notifications(void) cnt++; } - netdata_pclose(fp_child_input, fp_child_output, command_pid); + spawn_popen_wait(instance); } freez(script); @@ -470,8 +468,6 @@ void analytics_alarms(void) */ void analytics_misc(void) { - spinlock_init(&analytics_data.spinlock); - #ifdef ENABLE_ACLK analytics_set_data(&analytics_data.netdata_host_cloud_available, "true"); analytics_set_data_str(&analytics_data.netdata_host_aclk_implementation, "Next Generation"); @@ -1002,8 +998,6 @@ void analytics_statistic_send(const analytics_statistic_t *statistic) { char *command_to_run = mallocz( sizeof(char) * (strlen(statistic->action) + strlen(action_result) + strlen(action_data) + strlen(as_script) + analytics_data.data_length + (ANALYTICS_NO_OF_ITEMS * 3) + 15)); - pid_t command_pid; - sprintf( command_to_run, "%s '%s' '%s' '%s' '%s' '%s' '%s' '%s' '%s' '%s' '%s' '%s' '%s' '%s' '%s' '%s' '%s' '%s' '%s' '%s' '%s' '%s' '%s' '%s' '%s' '%s' '%s' '%s' '%s' '%s' '%s' '%s' '%s' '%s' '%s' '%s' '%s' '%s' '%s' '%s' '%s' '%s' '%s' '%s' ", @@ -1056,12 +1050,11 @@ void analytics_statistic_send(const analytics_statistic_t *statistic) { "%s '%s' '%s' '%s'", as_script, statistic->action, action_result, action_data); - FILE *fp_child_input; - FILE *fp_child_output = netdata_popen(command_to_run, &command_pid, &fp_child_input); - if (fp_child_output) { + POPEN_INSTANCE *instance = spawn_popen_run(command_to_run); + if (instance) { char buffer[4 + 1]; - char *s = fgets(buffer, 4, fp_child_output); - int exit_code = netdata_pclose(fp_child_input, fp_child_output, command_pid); + char *s = fgets(buffer, 4, instance->child_stdout_fp); + int exit_code = spawn_popen_wait(instance); if (exit_code) nd_log(NDLS_DAEMON, NDLP_NOTICE, @@ -1081,3 +1074,8 @@ void analytics_statistic_send(const analytics_statistic_t *statistic) { freez(command_to_run); } + +void analytics_init(void) +{ + spinlock_init(&analytics_data.spinlock); +} diff --git a/src/daemon/analytics.h b/src/daemon/analytics.h index 501eb7b55..747cf6070 100644 --- a/src/daemon/analytics.h +++ b/src/daemon/analytics.h @@ -86,6 +86,7 @@ void analytics_log_dashboard(void); void analytics_gather_mutable_meta_data(void); void analytics_report_oom_score(long long int score); void get_system_timezone(void); +void analytics_init(void); typedef struct { const char *action; diff --git a/src/daemon/buildinfo.c b/src/daemon/buildinfo.c index 4ee5b43de..ace96199a 100644 --- a/src/daemon/buildinfo.c +++ b/src/daemon/buildinfo.c @@ -75,6 +75,7 @@ typedef enum __attribute__((packed)) { BIB_LIB_LIBCAP, BIB_LIB_LIBCRYPTO, BIB_LIB_LIBYAML, + BIB_LIB_LIBMNL, BIB_PLUGIN_APPS, BIB_PLUGIN_LINUX_CGROUPS, BIB_PLUGIN_LINUX_CGROUP_NETWORK, @@ -96,7 +97,6 @@ typedef enum __attribute__((packed)) { BIB_PLUGIN_SLABINFO, BIB_PLUGIN_XEN, BIB_PLUGIN_XEN_VBD_ERROR, - BIB_PLUGIN_LOGS_MANAGEMENT, BIB_EXPORT_AWS_KINESIS, BIB_EXPORT_GCP_PUBSUB, BIB_EXPORT_MONGOC, @@ -698,6 +698,14 @@ static struct { .json = "libyaml", .value = NULL, }, + [BIB_LIB_LIBMNL] = { + .category = BIC_LIBS, + .type = BIT_BOOLEAN, + .analytics = "libmnl", + .print = "libmnl (library for working with netfilter)", + .json = "libmnl", + .value = NULL, + }, [BIB_PLUGIN_APPS] = { .category = BIC_PLUGINS, .type = BIT_BOOLEAN, @@ -866,14 +874,6 @@ static struct { .json = "xen-vbd-error", .value = NULL, }, - [BIB_PLUGIN_LOGS_MANAGEMENT] = { - .category = BIC_PLUGINS, - .type = BIT_BOOLEAN, - .analytics = "Logs Management", - .print = "Logs Management", - .json = "logs-management", - .value = NULL, - }, [BIB_EXPORT_MONGOC] = { .category = BIC_EXPORTERS, .type = BIT_BOOLEAN, @@ -1177,6 +1177,9 @@ __attribute__((constructor)) void initialize_build_info(void) { #ifdef HAVE_LIBYAML build_info_set_status(BIB_LIB_LIBYAML, true); #endif +#ifdef HAVE_LIBMNL + build_info_set_status(BIB_LIB_LIBMNL, true); +#endif #ifdef ENABLE_PLUGIN_APPS build_info_set_status(BIB_PLUGIN_APPS, true); @@ -1217,9 +1220,6 @@ __attribute__((constructor)) void initialize_build_info(void) { #ifdef HAVE_XENSTAT_VBD_ERROR build_info_set_status(BIB_PLUGIN_XEN_VBD_ERROR, true); #endif -#ifdef ENABLE_LOGSMANAGEMENT - build_info_set_status(BIB_PLUGIN_LOGS_MANAGEMENT, true); -#endif build_info_set_status(BIB_EXPORT_PROMETHEUS_EXPORTER, true); build_info_set_status(BIB_EXPORT_GRAPHITE, true); @@ -1278,9 +1278,18 @@ static void populate_system_info(void) { system_info = localhost->system_info; } else { + bool started_spawn_server = false; + if(!netdata_main_spawn_server) { + started_spawn_server = true; + netdata_main_spawn_server_init(NULL, 0, NULL); + } + system_info = callocz(1, sizeof(struct rrdhost_system_info)); get_system_info(system_info); free_system_info = true; + + if(started_spawn_server) + netdata_main_spawn_server_cleanup(); } build_info_set_value_strdupz(BIB_OS_KERNEL_NAME, system_info->kernel_name); diff --git a/src/daemon/commands.c b/src/daemon/commands.c index 70ba11d42..230e8527e 100644 --- a/src/daemon/commands.c +++ b/src/daemon/commands.c @@ -136,7 +136,7 @@ static cmd_status_t cmd_help_execute(char *args, char **message) "dumpconfig\n" " Returns the current netdata.conf on stdout.\n" #ifdef ENABLE_ACLK - "remove-stale-node node_id|machine_guid\n" + "remove-stale-node node_id|machine_guid|hostname|ALL_NODES\n" " Unregisters and removes a node from the cloud.\n" #endif "version\n" @@ -164,7 +164,7 @@ static cmd_status_t cmd_reopen_logs_execute(char *args, char **message) (void)message; nd_log_limits_unlimited(); - nd_log_reopen_log_files(); + nd_log_reopen_log_files(true); nd_log_limits_reset(); return CMD_STATUS_SUCCESS; @@ -306,10 +306,17 @@ static cmd_status_t cmd_ping_execute(char *args, char **message) static cmd_status_t cmd_aclk_state(char *args, char **message) { netdata_log_info("COMMAND: Reopening aclk/cloud state."); +#ifdef ENABLE_ACLK if (strstr(args, "json")) *message = aclk_state_json(); else *message = aclk_state(); +#else + if (strstr(args, "json")) + *message = strdupz("{\"aclk-available\":false}"); + else + *message = strdupz("ACLK Available: No"); +#endif return CMD_STATUS_SUCCESS; } @@ -338,13 +345,48 @@ static cmd_status_t cmd_dumpconfig(char *args, char **message) } #ifdef ENABLE_ACLK + +static int remove_ephemeral_host(BUFFER *wb, RRDHOST *host, bool report_error) +{ + if (host == localhost) { + if (report_error) + buffer_sprintf(wb, "You cannot unregister the parent node (%s)", rrdhost_hostname(host)); + return 0; + } + + if (rrdhost_is_online(host)) { + if (report_error) + buffer_sprintf(wb, "Cannot unregister a live node (%s)", rrdhost_hostname(host)); + return 0; + } + + if (!rrdhost_option_check(host, RRDHOST_OPTION_EPHEMERAL_HOST)) { + rrdhost_option_set(host, RRDHOST_OPTION_EPHEMERAL_HOST); + sql_set_host_label(&host->host_uuid, "_is_ephemeral", "true"); + aclk_host_state_update(host, 0, 0); + unregister_node(host->machine_guid); + freez(host->node_id); + host->node_id = NULL; + buffer_sprintf(wb, "Unregistering node with machine guid %s, hostname = %s", host->machine_guid, rrdhost_hostname(host)); + rrd_wrlock(); + rrdhost_free___while_having_rrd_wrlock(host, true); + rrd_wrunlock(); + return 1; + } + if (report_error) + buffer_sprintf(wb, "Node with machine guid %s, hostname = %s is already unregistered", host->machine_guid, rrdhost_hostname(host)); + return 0; +} + +#define SQL_HOSTNAME_TO_REMOVE "SELECT host_id FROM host WHERE (hostname = @hostname OR @hostname = 'ALL_NODES')" + static cmd_status_t cmd_remove_node(char *args, char **message) { (void)args; BUFFER *wb = buffer_create(1024, NULL); if (strlen(args) == 0) { - buffer_sprintf(wb, "Please specify a machine or node UUID"); + buffer_sprintf(wb, "Please specify a machine or node UUID or hostname"); goto done; } @@ -353,32 +395,43 @@ static cmd_status_t cmd_remove_node(char *args, char **message) if (!host) host = find_host_by_node_id(args); - if (!host) - buffer_sprintf(wb, "Node with machine or node UUID \"%s\" not found", args); - else { + if (!host) { + sqlite3_stmt *res = NULL; - if (host == localhost) { - buffer_sprintf(wb, "You cannot unregister the parent node"); - goto done; - } + bool report_error = strcmp(args, "ALL_NODES"); - if (rrdhost_is_online(host)) { - buffer_sprintf(wb, "Cannot unregister a live node"); + if (!PREPARE_STATEMENT(db_meta, SQL_HOSTNAME_TO_REMOVE, &res)) { + buffer_sprintf(wb, "Failed to prepare database statement to check for stale nodes"); goto done; } - if (!rrdhost_option_check(host, RRDHOST_OPTION_EPHEMERAL_HOST)) { - rrdhost_option_set(host, RRDHOST_OPTION_EPHEMERAL_HOST); - sql_set_host_label(&host->host_uuid, "_is_ephemeral", "true"); - aclk_host_state_update(host, 0, 0); - unregister_node(host->machine_guid); - freez(host->node_id); - host->node_id = NULL; - buffer_sprintf(wb, "Unregistering node with machine guid %s, hostname = %s", host->machine_guid, rrdhost_hostname(host)); + int param = 0; + SQLITE_BIND_FAIL(done0, sqlite3_bind_text(res, ++param, args, -1, SQLITE_STATIC)); + + param = 0; + int cnt = 0; + while (sqlite3_step_monitored(res) == SQLITE_ROW) { + char guid[UUID_STR_LEN]; + uuid_unparse_lower(*(nd_uuid_t *)sqlite3_column_blob(res, 0), guid); + host = rrdhost_find_by_guid(guid); + if (host) { + if (cnt) + buffer_fast_strcat(wb, "\n", 1); + cnt += remove_ephemeral_host(wb, host, report_error); + } } - else - buffer_sprintf(wb, "Node with machine guid %s, hostname = %s is already unregistered", host->machine_guid, rrdhost_hostname(host)); + if (!cnt && buffer_strlen(wb) == 0) { + if (report_error) + buffer_sprintf(wb, "No match for \"%s\"", args); + else + buffer_sprintf(wb, "No stale nodes found"); + } + done0: + REPORT_BIND_FAIL(res, param); + SQLITE_FINALIZE(res); } + else + (void) remove_ephemeral_host(wb, host, true); done: *message = strdupz(buffer_tostring(wb)); diff --git a/src/daemon/common.c b/src/daemon/common.c index a64d53585..6c824eec6 100644 --- a/src/daemon/common.c +++ b/src/daemon/common.c @@ -44,7 +44,7 @@ long get_netdata_cpus(void) { long cores_user_configured = config_get_number(CONFIG_SECTION_GLOBAL, "cpu cores", processors); - errno = 0; + errno_clear(); internal_error(true, "System CPUs: %ld, (" "system: %ld, cgroups cpuset v1: %ld, cgroups cpuset v2: %ld, netdata.conf: %ld" diff --git a/src/daemon/common.h b/src/daemon/common.h index 102ec81e2..1dea19c5b 100644 --- a/src/daemon/common.h +++ b/src/daemon/common.h @@ -84,9 +84,6 @@ // global GUID map functions -// netdata agent spawn server -#include "spawn/spawn.h" - // the netdata daemon #include "daemon.h" #include "main.h" diff --git a/src/daemon/config/README.md b/src/daemon/config/README.md index c59f55620..3c0912fba 100644 --- a/src/daemon/config/README.md +++ b/src/daemon/config/README.md @@ -128,16 +128,21 @@ Please note that your data history will be lost if you have modified `history` p ### [logs] section options +There are additional configuration options for the logs. For more info, see [Netdata Logging](/src/libnetdata/log/README.md). + | setting | default | info | |:----------------------------------:|:-----------------------------:|:---------------------------------------------------------------------------------------------------------------------------------------------------------------------------------------------------------------------------------------------------------------------------------------------------------------------------------| | debug flags | `0x0000000000000000` | Bitmap of debug options to enable. For more information check [Tracing Options](/src/daemon/README.md#debugging). | -| debug | `/var/log/netdata/debug.log` | The filename to save debug information. This file will not be created if debugging is not enabled. You can also set it to `syslog` to send the debug messages to syslog, or `none` to disable this log. For more information check [Tracing Options](/src/daemon/README.md#debugging). | -| error | `/var/log/netdata/error.log` | The filename to save error messages for Netdata daemon and all plugins (`stderr` is sent here for all Netdata programs, including the plugins). You can also set it to `syslog` to send the errors to syslog, or `none` to disable this log. | -| access | `/var/log/netdata/access.log` | The filename to save the log of web clients accessing Netdata charts. You can also set it to `syslog` to send the access log to syslog, or `none` to disable this log. | -| facility | `daemon` | A facility keyword is used to specify the type of system that is logging the message. | -| errors flood protection period | `1200` | Length of period (in sec) during which the number of errors should not exceed the `errors to trigger flood protection`. | -| errors to trigger flood protection | `200` | Number of errors written to the log in `errors flood protection period` sec before flood protection is activated. | -| severity level | `info` | Controls which log messages are logged, with error being the most important. Supported values: `info` and `error`. | +| debug | `/var/log/netdata/debug.log` | The filename to save debug information. This file will not be created if debugging is not enabled. You can also set it to `syslog` to send the debug messages to syslog, or `off` to disable this log. For more information check [Tracing Options](/src/daemon/README.md#debugging). | +| error | `/var/log/netdata/error.log` | The filename to save error messages for Netdata daemon and all plugins (`stderr` is sent here for all Netdata programs, including the plugins). You can also set it to `syslog` to send the errors to syslog, or `off` to disable this log. | +| access | `/var/log/netdata/access.log` | The filename to save the log of web clients accessing Netdata charts. You can also set it to `syslog` to send the access log to syslog, or `off` to disable this log. | +| collector | `journal` | The filename to save the log of Netdata collectors. You can also set it to `syslog` to send the access log to syslog, or `off` to disable this log. Defaults to `Journal` if using systemd. | +| health | `journal` | The filename to save the log of Netdata health collectors. You can also set it to `syslog` to send the access log to syslog, or `off` to disable this log. Defaults to `Journal` if using systemd. | +| daemon | `journal` | The filename to save the log of Netdata daemon. You can also set it to `syslog` to send the access log to syslog, or `off` to disable this log. Defaults to `Journal` if using systemd. | +| facility | `daemon` | A facility keyword is used to specify the type of system that is logging the message. | +| logs flood protection period | `60` | Length of period (in sec) during which the number of errors should not exceed the `errors to trigger flood protection`. | +| logs to trigger flood protection | `1000` | Number of errors written to the log in `errors flood protection period` sec before flood protection is activated. | +| level | `info` | Controls which log messages are logged, with error being the most important. Supported values: `info` and `error`. | ### [environment variables] section options diff --git a/src/daemon/daemon.c b/src/daemon/daemon.c index f77b748a8..2392d4cc1 100644 --- a/src/daemon/daemon.c +++ b/src/daemon/daemon.c @@ -381,14 +381,14 @@ static void sched_setscheduler_set(void) { priority = (int)config_get_number(CONFIG_SECTION_GLOBAL, "process scheduling priority", priority); #ifdef HAVE_SCHED_GET_PRIORITY_MIN - errno = 0; + errno_clear(); if(priority < sched_get_priority_min(policy)) { netdata_log_error("scheduler %s (%d) priority %d is below the minimum %d. Using the minimum.", name, policy, priority, sched_get_priority_min(policy)); priority = sched_get_priority_min(policy); } #endif #ifdef HAVE_SCHED_GET_PRIORITY_MAX - errno = 0; + errno_clear(); if(priority > sched_get_priority_max(policy)) { netdata_log_error("scheduler %s (%d) priority %d is above the maximum %d. Using the maximum.", name, policy, priority, sched_get_priority_max(policy)); priority = sched_get_priority_max(policy); @@ -407,7 +407,7 @@ static void sched_setscheduler_set(void) { .sched_priority = priority }; - errno = 0; + errno_clear(); i = sched_setscheduler(0, policy, ¶m); if(i != 0) { netdata_log_error("Cannot adjust netdata scheduling policy to %s (%d), with priority %d. Falling back to nice.", diff --git a/src/daemon/global_statistics.c b/src/daemon/global_statistics.c index 429f68c0d..17fd53761 100644 --- a/src/daemon/global_statistics.c +++ b/src/daemon/global_statistics.c @@ -5,17 +5,18 @@ #define GLOBAL_STATS_RESET_WEB_USEC_MAX 0x01 #define WORKER_JOB_GLOBAL 0 -#define WORKER_JOB_REGISTRY 1 -#define WORKER_JOB_WORKERS 2 -#define WORKER_JOB_DBENGINE 3 -#define WORKER_JOB_HEARTBEAT 4 -#define WORKER_JOB_STRINGS 5 -#define WORKER_JOB_DICTIONARIES 6 -#define WORKER_JOB_MALLOC_TRACE 7 -#define WORKER_JOB_SQLITE3 8 - -#if WORKER_UTILIZATION_MAX_JOB_TYPES < 9 -#error WORKER_UTILIZATION_MAX_JOB_TYPES has to be at least 9 +#define WORKER_JOB_GLOBAL_EXT 1 +#define WORKER_JOB_REGISTRY 2 +#define WORKER_JOB_WORKERS 3 +#define WORKER_JOB_DBENGINE 4 +#define WORKER_JOB_HEARTBEAT 5 +#define WORKER_JOB_STRINGS 6 +#define WORKER_JOB_DICTIONARIES 7 +#define WORKER_JOB_MALLOC_TRACE 8 +#define WORKER_JOB_SQLITE3 9 + +#if WORKER_UTILIZATION_MAX_JOB_TYPES < 10 +#error WORKER_UTILIZATION_MAX_JOB_TYPES has to be at least 10 #endif bool global_statistics_enabled = true; @@ -249,13 +250,9 @@ static inline void global_statistics_copy(struct global_statistics *gs, uint8_t ((stats).memory.dict + (stats).memory.values + (stats).memory.index) static void global_statistics_charts(void) { - static unsigned long long old_web_requests = 0, - old_web_usec = 0, - old_content_size = 0, - old_compressed_content_size = 0; + static unsigned long long old_web_requests = 0, old_web_usec = 0; - static collected_number compression_ratio = -1, - average_response_time = -1; + static collected_number average_response_time = -1; static time_t netdata_boottime_time = 0; if (!netdata_boottime_time) @@ -265,7 +262,6 @@ static void global_statistics_charts(void) { struct global_statistics gs; struct rusage me; - struct replication_query_statistics replication = replication_get_query_statistics(); global_statistics_copy(&gs, GLOBAL_STATS_RESET_WEB_USEC_MAX); getrusage(RUSAGE_SELF, &me); @@ -301,167 +297,6 @@ static void global_statistics_charts(void) { rrdset_done(st_cpu); } - // ---------------------------------------------------------------- - - { - static RRDSET *st_memory = NULL; - static RRDDIM *rd_database = NULL; - static RRDDIM *rd_collectors = NULL; - static RRDDIM *rd_hosts = NULL; - static RRDDIM *rd_rrd = NULL; - static RRDDIM *rd_contexts = NULL; - static RRDDIM *rd_health = NULL; - static RRDDIM *rd_functions = NULL; - static RRDDIM *rd_labels = NULL; - static RRDDIM *rd_strings = NULL; - static RRDDIM *rd_streaming = NULL; - static RRDDIM *rd_replication = NULL; - static RRDDIM *rd_buffers = NULL; - static RRDDIM *rd_workers = NULL; - static RRDDIM *rd_aral = NULL; - static RRDDIM *rd_judy = NULL; - static RRDDIM *rd_other = NULL; - - if (unlikely(!st_memory)) { - st_memory = rrdset_create_localhost( - "netdata", - "memory", - NULL, - "netdata", - NULL, - "Netdata Memory", - "bytes", - "netdata", - "stats", - 130100, - localhost->rrd_update_every, - RRDSET_TYPE_STACKED); - - rd_database = rrddim_add(st_memory, "db", NULL, 1, 1, RRD_ALGORITHM_ABSOLUTE); - rd_collectors = rrddim_add(st_memory, "collectors", NULL, 1, 1, RRD_ALGORITHM_ABSOLUTE); - rd_hosts = rrddim_add(st_memory, "hosts", NULL, 1, 1, RRD_ALGORITHM_ABSOLUTE); - rd_rrd = rrddim_add(st_memory, "rrdset rrddim", NULL, 1, 1, RRD_ALGORITHM_ABSOLUTE); - rd_contexts = rrddim_add(st_memory, "contexts", NULL, 1, 1, RRD_ALGORITHM_ABSOLUTE); - rd_health = rrddim_add(st_memory, "health", NULL, 1, 1, RRD_ALGORITHM_ABSOLUTE); - rd_functions = rrddim_add(st_memory, "functions", NULL, 1, 1, RRD_ALGORITHM_ABSOLUTE); - rd_labels = rrddim_add(st_memory, "labels", NULL, 1, 1, RRD_ALGORITHM_ABSOLUTE); - rd_strings = rrddim_add(st_memory, "strings", NULL, 1, 1, RRD_ALGORITHM_ABSOLUTE); - rd_streaming = rrddim_add(st_memory, "streaming", NULL, 1, 1, RRD_ALGORITHM_ABSOLUTE); - rd_replication = rrddim_add(st_memory, "replication", NULL, 1, 1, RRD_ALGORITHM_ABSOLUTE); - rd_buffers = rrddim_add(st_memory, "buffers", NULL, 1, 1, RRD_ALGORITHM_ABSOLUTE); - rd_workers = rrddim_add(st_memory, "workers", NULL, 1, 1, RRD_ALGORITHM_ABSOLUTE); - rd_aral = rrddim_add(st_memory, "aral", NULL, 1, 1, RRD_ALGORITHM_ABSOLUTE); - rd_judy = rrddim_add(st_memory, "judy", NULL, 1, 1, RRD_ALGORITHM_ABSOLUTE); - rd_other = rrddim_add(st_memory, "other", NULL, 1, 1, RRD_ALGORITHM_ABSOLUTE); - } - - size_t buffers = - netdata_buffers_statistics.query_targets_size + - netdata_buffers_statistics.rrdset_done_rda_size + - netdata_buffers_statistics.buffers_aclk + - netdata_buffers_statistics.buffers_api + - netdata_buffers_statistics.buffers_functions + - netdata_buffers_statistics.buffers_sqlite + - netdata_buffers_statistics.buffers_exporters + - netdata_buffers_statistics.buffers_health + - netdata_buffers_statistics.buffers_streaming + - netdata_buffers_statistics.cbuffers_streaming + - netdata_buffers_statistics.buffers_web + - replication_allocated_buffers() + - aral_by_size_overhead() + - judy_aral_overhead(); - - size_t strings = 0; - string_statistics(NULL, NULL, NULL, NULL, NULL, &strings, NULL, NULL); - - rrddim_set_by_pointer(st_memory, rd_database, (collected_number)dbengine_total_memory + (collected_number)rrddim_db_memory_size); - rrddim_set_by_pointer(st_memory, rd_collectors, (collected_number)dictionary_stats_memory_total(dictionary_stats_category_collectors)); - rrddim_set_by_pointer(st_memory, rd_hosts, (collected_number)dictionary_stats_memory_total(dictionary_stats_category_rrdhost) + (collected_number)netdata_buffers_statistics.rrdhost_allocations_size); - rrddim_set_by_pointer(st_memory, rd_rrd, (collected_number)dictionary_stats_memory_total(dictionary_stats_category_rrdset_rrddim)); - rrddim_set_by_pointer(st_memory, rd_contexts, (collected_number)dictionary_stats_memory_total(dictionary_stats_category_rrdcontext)); - rrddim_set_by_pointer(st_memory, rd_health, (collected_number)dictionary_stats_memory_total(dictionary_stats_category_rrdhealth)); - rrddim_set_by_pointer(st_memory, rd_functions, (collected_number)dictionary_stats_memory_total(dictionary_stats_category_functions)); - rrddim_set_by_pointer(st_memory, rd_labels, (collected_number)dictionary_stats_memory_total(dictionary_stats_category_rrdlabels)); - rrddim_set_by_pointer(st_memory, rd_strings, (collected_number)strings); - rrddim_set_by_pointer(st_memory, rd_streaming, (collected_number)netdata_buffers_statistics.rrdhost_senders + (collected_number)netdata_buffers_statistics.rrdhost_receivers); - rrddim_set_by_pointer(st_memory, rd_replication, (collected_number)dictionary_stats_memory_total(dictionary_stats_category_replication) + (collected_number)replication_allocated_memory()); - rrddim_set_by_pointer(st_memory, rd_buffers, (collected_number)buffers); - rrddim_set_by_pointer(st_memory, rd_workers, (collected_number) workers_allocated_memory()); - rrddim_set_by_pointer(st_memory, rd_aral, (collected_number) aral_by_size_structures()); - rrddim_set_by_pointer(st_memory, rd_judy, (collected_number) judy_aral_structures()); - rrddim_set_by_pointer(st_memory, rd_other, (collected_number)dictionary_stats_memory_total(dictionary_stats_category_other)); - - rrdset_done(st_memory); - } - - { - static RRDSET *st_memory_buffers = NULL; - static RRDDIM *rd_queries = NULL; - static RRDDIM *rd_collectors = NULL; - static RRDDIM *rd_buffers_aclk = NULL; - static RRDDIM *rd_buffers_api = NULL; - static RRDDIM *rd_buffers_functions = NULL; - static RRDDIM *rd_buffers_sqlite = NULL; - static RRDDIM *rd_buffers_exporters = NULL; - static RRDDIM *rd_buffers_health = NULL; - static RRDDIM *rd_buffers_streaming = NULL; - static RRDDIM *rd_cbuffers_streaming = NULL; - static RRDDIM *rd_buffers_replication = NULL; - static RRDDIM *rd_buffers_web = NULL; - static RRDDIM *rd_buffers_aral = NULL; - static RRDDIM *rd_buffers_judy = NULL; - - if (unlikely(!st_memory_buffers)) { - st_memory_buffers = rrdset_create_localhost( - "netdata", - "memory_buffers", - NULL, - "netdata", - NULL, - "Netdata Memory Buffers", - "bytes", - "netdata", - "stats", - 130101, - localhost->rrd_update_every, - RRDSET_TYPE_STACKED); - - rd_queries = rrddim_add(st_memory_buffers, "queries", NULL, 1, 1, RRD_ALGORITHM_ABSOLUTE); - rd_collectors = rrddim_add(st_memory_buffers, "collection", NULL, 1, 1, RRD_ALGORITHM_ABSOLUTE); - rd_buffers_aclk = rrddim_add(st_memory_buffers, "aclk", NULL, 1, 1, RRD_ALGORITHM_ABSOLUTE); - rd_buffers_api = rrddim_add(st_memory_buffers, "api", NULL, 1, 1, RRD_ALGORITHM_ABSOLUTE); - rd_buffers_functions = rrddim_add(st_memory_buffers, "functions", NULL, 1, 1, RRD_ALGORITHM_ABSOLUTE); - rd_buffers_sqlite = rrddim_add(st_memory_buffers, "sqlite", NULL, 1, 1, RRD_ALGORITHM_ABSOLUTE); - rd_buffers_exporters = rrddim_add(st_memory_buffers, "exporters", NULL, 1, 1, RRD_ALGORITHM_ABSOLUTE); - rd_buffers_health = rrddim_add(st_memory_buffers, "health", NULL, 1, 1, RRD_ALGORITHM_ABSOLUTE); - rd_buffers_streaming = rrddim_add(st_memory_buffers, "streaming", NULL, 1, 1, RRD_ALGORITHM_ABSOLUTE); - rd_cbuffers_streaming = rrddim_add(st_memory_buffers, "streaming cbuf", NULL, 1, 1, RRD_ALGORITHM_ABSOLUTE); - rd_buffers_replication = rrddim_add(st_memory_buffers, "replication", NULL, 1, 1, RRD_ALGORITHM_ABSOLUTE); - rd_buffers_web = rrddim_add(st_memory_buffers, "web", NULL, 1, 1, RRD_ALGORITHM_ABSOLUTE); - rd_buffers_aral = rrddim_add(st_memory_buffers, "aral", NULL, 1, 1, RRD_ALGORITHM_ABSOLUTE); - rd_buffers_judy = rrddim_add(st_memory_buffers, "judy", NULL, 1, 1, RRD_ALGORITHM_ABSOLUTE); - } - - rrddim_set_by_pointer(st_memory_buffers, rd_queries, (collected_number)netdata_buffers_statistics.query_targets_size + (collected_number) onewayalloc_allocated_memory()); - rrddim_set_by_pointer(st_memory_buffers, rd_collectors, (collected_number)netdata_buffers_statistics.rrdset_done_rda_size); - rrddim_set_by_pointer(st_memory_buffers, rd_buffers_aclk, (collected_number)netdata_buffers_statistics.buffers_aclk); - rrddim_set_by_pointer(st_memory_buffers, rd_buffers_api, (collected_number)netdata_buffers_statistics.buffers_api); - rrddim_set_by_pointer(st_memory_buffers, rd_buffers_functions, (collected_number)netdata_buffers_statistics.buffers_functions); - rrddim_set_by_pointer(st_memory_buffers, rd_buffers_sqlite, (collected_number)netdata_buffers_statistics.buffers_sqlite); - rrddim_set_by_pointer(st_memory_buffers, rd_buffers_exporters, (collected_number)netdata_buffers_statistics.buffers_exporters); - rrddim_set_by_pointer(st_memory_buffers, rd_buffers_health, (collected_number)netdata_buffers_statistics.buffers_health); - rrddim_set_by_pointer(st_memory_buffers, rd_buffers_streaming, (collected_number)netdata_buffers_statistics.buffers_streaming); - rrddim_set_by_pointer(st_memory_buffers, rd_cbuffers_streaming, (collected_number)netdata_buffers_statistics.cbuffers_streaming); - rrddim_set_by_pointer(st_memory_buffers, rd_buffers_replication, (collected_number)replication_allocated_buffers()); - rrddim_set_by_pointer(st_memory_buffers, rd_buffers_web, (collected_number)netdata_buffers_statistics.buffers_web); - rrddim_set_by_pointer(st_memory_buffers, rd_buffers_aral, (collected_number)aral_by_size_overhead()); - rrddim_set_by_pointer(st_memory_buffers, rd_buffers_judy, (collected_number)judy_aral_overhead()); - - rrdset_done(st_memory_buffers); - } - - // ---------------------------------------------------------------- - { static RRDSET *st_uptime = NULL; static RRDDIM *rd_uptime = NULL; @@ -624,9 +459,174 @@ static void global_statistics_charts(void) { rrddim_set_by_pointer(st_duration, rd_max, ((gs.web_usec_max)?(collected_number)gs.web_usec_max:average_response_time)); rrdset_done(st_duration); + } +} + +static void global_statistics_extended_charts(void) { + static unsigned long long old_content_size = 0, old_compressed_content_size = 0; + static collected_number compression_ratio = -1; + + struct global_statistics gs; + struct replication_query_statistics replication = replication_get_query_statistics(); + global_statistics_copy(&gs, GLOBAL_STATS_RESET_WEB_USEC_MAX); + + { + static RRDSET *st_memory = NULL; + static RRDDIM *rd_database = NULL; + static RRDDIM *rd_collectors = NULL; + static RRDDIM *rd_hosts = NULL; + static RRDDIM *rd_rrd = NULL; + static RRDDIM *rd_contexts = NULL; + static RRDDIM *rd_health = NULL; + static RRDDIM *rd_functions = NULL; + static RRDDIM *rd_labels = NULL; + static RRDDIM *rd_strings = NULL; + static RRDDIM *rd_streaming = NULL; + static RRDDIM *rd_replication = NULL; + static RRDDIM *rd_buffers = NULL; + static RRDDIM *rd_workers = NULL; + static RRDDIM *rd_aral = NULL; + static RRDDIM *rd_judy = NULL; + static RRDDIM *rd_other = NULL; + + if (unlikely(!st_memory)) { + st_memory = rrdset_create_localhost( + "netdata", + "memory", + NULL, + "netdata", + NULL, + "Netdata Memory", + "bytes", + "netdata", + "stats", + 130100, + localhost->rrd_update_every, + RRDSET_TYPE_STACKED); + + rd_database = rrddim_add(st_memory, "db", NULL, 1, 1, RRD_ALGORITHM_ABSOLUTE); + rd_collectors = rrddim_add(st_memory, "collectors", NULL, 1, 1, RRD_ALGORITHM_ABSOLUTE); + rd_hosts = rrddim_add(st_memory, "hosts", NULL, 1, 1, RRD_ALGORITHM_ABSOLUTE); + rd_rrd = rrddim_add(st_memory, "rrdset rrddim", NULL, 1, 1, RRD_ALGORITHM_ABSOLUTE); + rd_contexts = rrddim_add(st_memory, "contexts", NULL, 1, 1, RRD_ALGORITHM_ABSOLUTE); + rd_health = rrddim_add(st_memory, "health", NULL, 1, 1, RRD_ALGORITHM_ABSOLUTE); + rd_functions = rrddim_add(st_memory, "functions", NULL, 1, 1, RRD_ALGORITHM_ABSOLUTE); + rd_labels = rrddim_add(st_memory, "labels", NULL, 1, 1, RRD_ALGORITHM_ABSOLUTE); + rd_strings = rrddim_add(st_memory, "strings", NULL, 1, 1, RRD_ALGORITHM_ABSOLUTE); + rd_streaming = rrddim_add(st_memory, "streaming", NULL, 1, 1, RRD_ALGORITHM_ABSOLUTE); + rd_replication = rrddim_add(st_memory, "replication", NULL, 1, 1, RRD_ALGORITHM_ABSOLUTE); + rd_buffers = rrddim_add(st_memory, "buffers", NULL, 1, 1, RRD_ALGORITHM_ABSOLUTE); + rd_workers = rrddim_add(st_memory, "workers", NULL, 1, 1, RRD_ALGORITHM_ABSOLUTE); + rd_aral = rrddim_add(st_memory, "aral", NULL, 1, 1, RRD_ALGORITHM_ABSOLUTE); + rd_judy = rrddim_add(st_memory, "judy", NULL, 1, 1, RRD_ALGORITHM_ABSOLUTE); + rd_other = rrddim_add(st_memory, "other", NULL, 1, 1, RRD_ALGORITHM_ABSOLUTE); + } + + size_t buffers = + netdata_buffers_statistics.query_targets_size + + netdata_buffers_statistics.rrdset_done_rda_size + + netdata_buffers_statistics.buffers_aclk + + netdata_buffers_statistics.buffers_api + + netdata_buffers_statistics.buffers_functions + + netdata_buffers_statistics.buffers_sqlite + + netdata_buffers_statistics.buffers_exporters + + netdata_buffers_statistics.buffers_health + + netdata_buffers_statistics.buffers_streaming + + netdata_buffers_statistics.cbuffers_streaming + + netdata_buffers_statistics.buffers_web + + replication_allocated_buffers() + + aral_by_size_overhead() + + judy_aral_overhead(); + + size_t strings = 0; + string_statistics(NULL, NULL, NULL, NULL, NULL, &strings, NULL, NULL); + + rrddim_set_by_pointer(st_memory, rd_database, (collected_number)dbengine_total_memory + (collected_number)rrddim_db_memory_size); + rrddim_set_by_pointer(st_memory, rd_collectors, (collected_number)dictionary_stats_memory_total(dictionary_stats_category_collectors)); + rrddim_set_by_pointer(st_memory, rd_hosts, (collected_number)dictionary_stats_memory_total(dictionary_stats_category_rrdhost) + (collected_number)netdata_buffers_statistics.rrdhost_allocations_size); + rrddim_set_by_pointer(st_memory, rd_rrd, (collected_number)dictionary_stats_memory_total(dictionary_stats_category_rrdset_rrddim)); + rrddim_set_by_pointer(st_memory, rd_contexts, (collected_number)dictionary_stats_memory_total(dictionary_stats_category_rrdcontext)); + rrddim_set_by_pointer(st_memory, rd_health, (collected_number)dictionary_stats_memory_total(dictionary_stats_category_rrdhealth)); + rrddim_set_by_pointer(st_memory, rd_functions, (collected_number)dictionary_stats_memory_total(dictionary_stats_category_functions)); + rrddim_set_by_pointer(st_memory, rd_labels, (collected_number)dictionary_stats_memory_total(dictionary_stats_category_rrdlabels)); + rrddim_set_by_pointer(st_memory, rd_strings, (collected_number)strings); + rrddim_set_by_pointer(st_memory, rd_streaming, (collected_number)netdata_buffers_statistics.rrdhost_senders + (collected_number)netdata_buffers_statistics.rrdhost_receivers); + rrddim_set_by_pointer(st_memory, rd_replication, (collected_number)dictionary_stats_memory_total(dictionary_stats_category_replication) + (collected_number)replication_allocated_memory()); + rrddim_set_by_pointer(st_memory, rd_buffers, (collected_number)buffers); + rrddim_set_by_pointer(st_memory, rd_workers, (collected_number) workers_allocated_memory()); + rrddim_set_by_pointer(st_memory, rd_aral, (collected_number) aral_by_size_structures()); + rrddim_set_by_pointer(st_memory, rd_judy, (collected_number) judy_aral_structures()); + rrddim_set_by_pointer(st_memory, rd_other, (collected_number)dictionary_stats_memory_total(dictionary_stats_category_other)); + + rrdset_done(st_memory); + } + + { + static RRDSET *st_memory_buffers = NULL; + static RRDDIM *rd_queries = NULL; + static RRDDIM *rd_collectors = NULL; + static RRDDIM *rd_buffers_aclk = NULL; + static RRDDIM *rd_buffers_api = NULL; + static RRDDIM *rd_buffers_functions = NULL; + static RRDDIM *rd_buffers_sqlite = NULL; + static RRDDIM *rd_buffers_exporters = NULL; + static RRDDIM *rd_buffers_health = NULL; + static RRDDIM *rd_buffers_streaming = NULL; + static RRDDIM *rd_cbuffers_streaming = NULL; + static RRDDIM *rd_buffers_replication = NULL; + static RRDDIM *rd_buffers_web = NULL; + static RRDDIM *rd_buffers_aral = NULL; + static RRDDIM *rd_buffers_judy = NULL; + + if (unlikely(!st_memory_buffers)) { + st_memory_buffers = rrdset_create_localhost( + "netdata", + "memory_buffers", + NULL, + "netdata", + NULL, + "Netdata Memory Buffers", + "bytes", + "netdata", + "stats", + 130101, + localhost->rrd_update_every, + RRDSET_TYPE_STACKED); + + rd_queries = rrddim_add(st_memory_buffers, "queries", NULL, 1, 1, RRD_ALGORITHM_ABSOLUTE); + rd_collectors = rrddim_add(st_memory_buffers, "collection", NULL, 1, 1, RRD_ALGORITHM_ABSOLUTE); + rd_buffers_aclk = rrddim_add(st_memory_buffers, "aclk", NULL, 1, 1, RRD_ALGORITHM_ABSOLUTE); + rd_buffers_api = rrddim_add(st_memory_buffers, "api", NULL, 1, 1, RRD_ALGORITHM_ABSOLUTE); + rd_buffers_functions = rrddim_add(st_memory_buffers, "functions", NULL, 1, 1, RRD_ALGORITHM_ABSOLUTE); + rd_buffers_sqlite = rrddim_add(st_memory_buffers, "sqlite", NULL, 1, 1, RRD_ALGORITHM_ABSOLUTE); + rd_buffers_exporters = rrddim_add(st_memory_buffers, "exporters", NULL, 1, 1, RRD_ALGORITHM_ABSOLUTE); + rd_buffers_health = rrddim_add(st_memory_buffers, "health", NULL, 1, 1, RRD_ALGORITHM_ABSOLUTE); + rd_buffers_streaming = rrddim_add(st_memory_buffers, "streaming", NULL, 1, 1, RRD_ALGORITHM_ABSOLUTE); + rd_cbuffers_streaming = rrddim_add(st_memory_buffers, "streaming cbuf", NULL, 1, 1, RRD_ALGORITHM_ABSOLUTE); + rd_buffers_replication = rrddim_add(st_memory_buffers, "replication", NULL, 1, 1, RRD_ALGORITHM_ABSOLUTE); + rd_buffers_web = rrddim_add(st_memory_buffers, "web", NULL, 1, 1, RRD_ALGORITHM_ABSOLUTE); + rd_buffers_aral = rrddim_add(st_memory_buffers, "aral", NULL, 1, 1, RRD_ALGORITHM_ABSOLUTE); + rd_buffers_judy = rrddim_add(st_memory_buffers, "judy", NULL, 1, 1, RRD_ALGORITHM_ABSOLUTE); + } + + rrddim_set_by_pointer(st_memory_buffers, rd_queries, (collected_number)netdata_buffers_statistics.query_targets_size + (collected_number) onewayalloc_allocated_memory()); + rrddim_set_by_pointer(st_memory_buffers, rd_collectors, (collected_number)netdata_buffers_statistics.rrdset_done_rda_size); + rrddim_set_by_pointer(st_memory_buffers, rd_buffers_aclk, (collected_number)netdata_buffers_statistics.buffers_aclk); + rrddim_set_by_pointer(st_memory_buffers, rd_buffers_api, (collected_number)netdata_buffers_statistics.buffers_api); + rrddim_set_by_pointer(st_memory_buffers, rd_buffers_functions, (collected_number)netdata_buffers_statistics.buffers_functions); + rrddim_set_by_pointer(st_memory_buffers, rd_buffers_sqlite, (collected_number)netdata_buffers_statistics.buffers_sqlite); + rrddim_set_by_pointer(st_memory_buffers, rd_buffers_exporters, (collected_number)netdata_buffers_statistics.buffers_exporters); + rrddim_set_by_pointer(st_memory_buffers, rd_buffers_health, (collected_number)netdata_buffers_statistics.buffers_health); + rrddim_set_by_pointer(st_memory_buffers, rd_buffers_streaming, (collected_number)netdata_buffers_statistics.buffers_streaming); + rrddim_set_by_pointer(st_memory_buffers, rd_cbuffers_streaming, (collected_number)netdata_buffers_statistics.cbuffers_streaming); + rrddim_set_by_pointer(st_memory_buffers, rd_buffers_replication, (collected_number)replication_allocated_buffers()); + rrddim_set_by_pointer(st_memory_buffers, rd_buffers_web, (collected_number)netdata_buffers_statistics.buffers_web); + rrddim_set_by_pointer(st_memory_buffers, rd_buffers_aral, (collected_number)aral_by_size_overhead()); + rrddim_set_by_pointer(st_memory_buffers, rd_buffers_judy, (collected_number)judy_aral_overhead()); + + rrdset_done(st_memory_buffers); } - // ---------------------------------------------------------------- { static RRDSET *st_compression = NULL; @@ -671,8 +671,6 @@ static void global_statistics_charts(void) { rrdset_done(st_compression); } - // ---------------------------------------------------------------- - { static RRDSET *st_queries = NULL; static RRDDIM *rd_api_data_queries = NULL; @@ -722,8 +720,6 @@ static void global_statistics_charts(void) { rrdset_done(st_queries); } - // ---------------------------------------------------------------- - { static RRDSET *st_points_read = NULL; static RRDDIM *rd_api_data_points_read = NULL; @@ -773,8 +769,6 @@ static void global_statistics_charts(void) { rrdset_done(st_points_read); } - // ---------------------------------------------------------------- - if(gs.api_data_result_points_generated || replication.points_generated) { static RRDSET *st_points_generated = NULL; static RRDDIM *rd_api_data_points_generated = NULL; @@ -818,7 +812,7 @@ static void global_statistics_charts(void) { rrdset_done(st_points_generated); } - // ---------------------------------------------------------------- + ml_update_global_statistics_charts(gs.ml_models_consulted); { static RRDSET *st_points_stored = NULL; @@ -853,10 +847,6 @@ static void global_statistics_charts(void) { rrdset_done(st_points_stored); } - ml_update_global_statistics_charts(gs.ml_models_consulted); - - // ---------------------------------------------------------------- - #ifdef ENABLE_DBENGINE if (tier_page_type[0] == RRDENG_PAGE_TYPE_GORILLA_32BIT) { @@ -921,7 +911,6 @@ static void global_statistics_charts(void) { } #endif } - // ---------------------------------------------------------------------------- // sqlite3 statistics @@ -4203,6 +4192,7 @@ static void worker_utilization_finish(void) { static void global_statistics_register_workers(void) { worker_register("STATS"); worker_register_job_name(WORKER_JOB_GLOBAL, "global"); + worker_register_job_name(WORKER_JOB_GLOBAL_EXT, "global_ext"); worker_register_job_name(WORKER_JOB_REGISTRY, "registry"); worker_register_job_name(WORKER_JOB_DBENGINE, "dbengine"); worker_register_job_name(WORKER_JOB_STRINGS, "strings"); @@ -4239,6 +4229,7 @@ void *global_statistics_main(void *ptr) usec_t step = update_every * USEC_PER_SEC; heartbeat_t hb; heartbeat_init(&hb); + usec_t real_step = USEC_PER_SEC; // keep the randomness at zero // to make sure we are not close to any other thread @@ -4246,36 +4237,15 @@ void *global_statistics_main(void *ptr) while (service_running(SERVICE_COLLECTORS)) { worker_is_idle(); - heartbeat_next(&hb, step); + heartbeat_next(&hb, USEC_PER_SEC); + if (real_step < step) { + real_step += USEC_PER_SEC; + continue; + } + real_step = USEC_PER_SEC; worker_is_busy(WORKER_JOB_GLOBAL); global_statistics_charts(); - - worker_is_busy(WORKER_JOB_REGISTRY); - registry_statistics(); - -#ifdef ENABLE_DBENGINE - if(dbengine_enabled) { - worker_is_busy(WORKER_JOB_DBENGINE); - dbengine2_statistics_charts(); - } -#endif - - worker_is_busy(WORKER_JOB_HEARTBEAT); - update_heartbeat_charts(); - - worker_is_busy(WORKER_JOB_STRINGS); - update_strings_charts(); - -#ifdef DICT_WITH_STATS - worker_is_busy(WORKER_JOB_DICTIONARIES); - dictionary_statistics(); -#endif - -#ifdef NETDATA_TRACE_ALLOCATIONS - worker_is_busy(WORKER_JOB_MALLOC_TRACE); - malloc_trace_statistics(); -#endif } return NULL; @@ -4283,12 +4253,13 @@ void *global_statistics_main(void *ptr) // --------------------------------------------------------------------------------------------------------------------- -// workers thread +// global statistics extended thread -static void global_statistics_workers_cleanup(void *pptr) +static void global_statistics_extended_cleanup(void *pptr) { struct netdata_static_thread *static_thread = CLEANUP_FUNCTION_GET_PTR(pptr); - if(!static_thread) return; + if (!static_thread) + return; static_thread->enabled = NETDATA_MAIN_THREAD_EXITING; @@ -4300,66 +4271,62 @@ static void global_statistics_workers_cleanup(void *pptr) static_thread->enabled = NETDATA_MAIN_THREAD_EXITED; } -void *global_statistics_workers_main(void *ptr) +void *global_statistics_extended_main(void *ptr) { - CLEANUP_FUNCTION_REGISTER(global_statistics_workers_cleanup) cleanup_ptr = ptr; + CLEANUP_FUNCTION_REGISTER(global_statistics_extended_cleanup) cleanup_ptr = ptr; global_statistics_register_workers(); int update_every = - (int)config_get_number(CONFIG_SECTION_GLOBAL_STATISTICS, "update every", localhost->rrd_update_every); + (int)config_get_number(CONFIG_SECTION_GLOBAL_STATISTICS, "update every", localhost->rrd_update_every); if (update_every < localhost->rrd_update_every) update_every = localhost->rrd_update_every; usec_t step = update_every * USEC_PER_SEC; heartbeat_t hb; heartbeat_init(&hb); + usec_t real_step = USEC_PER_SEC; while (service_running(SERVICE_COLLECTORS)) { worker_is_idle(); - heartbeat_next(&hb, step); - - worker_is_busy(WORKER_JOB_WORKERS); - worker_utilization_charts(); - } - - return NULL; -} - -// --------------------------------------------------------------------------------------------------------------------- -// sqlite3 thread - -static void global_statistics_sqlite3_cleanup(void *pptr) -{ - struct netdata_static_thread *static_thread = CLEANUP_FUNCTION_GET_PTR(pptr); - if(!static_thread) return; + heartbeat_next(&hb, USEC_PER_SEC); + if (real_step < step) { + real_step += USEC_PER_SEC; + continue; + } + real_step = USEC_PER_SEC; - static_thread->enabled = NETDATA_MAIN_THREAD_EXITING; + worker_is_busy(WORKER_JOB_HEARTBEAT); + update_heartbeat_charts(); - worker_unregister(); - netdata_log_info("cleaning up..."); + worker_is_busy(WORKER_JOB_GLOBAL_EXT); + global_statistics_extended_charts(); - static_thread->enabled = NETDATA_MAIN_THREAD_EXITED; -} +#ifdef ENABLE_DBENGINE + if(dbengine_enabled) { + worker_is_busy(WORKER_JOB_DBENGINE); + dbengine2_statistics_charts(); + } +#endif -void *global_statistics_sqlite3_main(void *ptr) -{ - CLEANUP_FUNCTION_REGISTER(global_statistics_sqlite3_cleanup) cleanup_ptr = ptr; + worker_is_busy(WORKER_JOB_REGISTRY); + registry_statistics(); - global_statistics_register_workers(); + worker_is_busy(WORKER_JOB_STRINGS); + update_strings_charts(); - int update_every = - (int)config_get_number(CONFIG_SECTION_GLOBAL_STATISTICS, "update every", localhost->rrd_update_every); - if (update_every < localhost->rrd_update_every) - update_every = localhost->rrd_update_every; +#ifdef DICT_WITH_STATS + worker_is_busy(WORKER_JOB_DICTIONARIES); + dictionary_statistics(); +#endif - usec_t step = update_every * USEC_PER_SEC; - heartbeat_t hb; - heartbeat_init(&hb); +#ifdef NETDATA_TRACE_ALLOCATIONS + worker_is_busy(WORKER_JOB_MALLOC_TRACE); + malloc_trace_statistics(); +#endif - while (service_running(SERVICE_COLLECTORS)) { - worker_is_idle(); - heartbeat_next(&hb, step); + worker_is_busy(WORKER_JOB_WORKERS); + worker_utilization_charts(); worker_is_busy(WORKER_JOB_SQLITE3); sqlite3_statistics_charts(); @@ -4367,4 +4334,3 @@ void *global_statistics_sqlite3_main(void *ptr) return NULL; } - diff --git a/src/daemon/main.c b/src/daemon/main.c index e2db02097..17fef8449 100644 --- a/src/daemon/main.c +++ b/src/daemon/main.c @@ -7,6 +7,10 @@ #include "database/engine/page_test.h" +#ifdef OS_WINDOWS +#include "win_system-info.h" +#endif + #ifdef ENABLE_SENTRY #include "sentry-native/sentry-native.h" #endif @@ -22,7 +26,6 @@ int libuv_worker_threads = MIN_LIBUV_WORKER_THREADS; bool ieee754_doubles = false; time_t netdata_start_time = 0; struct netdata_static_thread *static_threads; -bool i_am_the_spawn_server = false; struct config netdata_config = { .first_section = NULL, @@ -321,8 +324,7 @@ static bool service_wait_exit(SERVICE_TYPE service, usec_t timeout_ut) { void web_client_cache_destroy(void); void netdata_cleanup_and_exit(int ret, const char *action, const char *action_result, const char *action_data) { - if (i_am_the_spawn_server) - exit(ret); + netdata_exit = 1; watcher_shutdown_begin(); @@ -344,6 +346,9 @@ void netdata_cleanup_and_exit(int ret, const char *action, const char *action_re (void) rename(agent_crash_file, agent_incomplete_shutdown_file); watcher_step_complete(WATCHER_STEP_ID_CREATE_SHUTDOWN_FILE); + netdata_main_spawn_server_cleanup(); + watcher_step_complete(WATCHER_STEP_ID_DESTROY_MAIN_SPAWN_SERVER); + #ifdef ENABLE_DBENGINE if(dbengine_enabled) { for (size_t tier = 0; tier < storage_tiers; tier++) @@ -488,10 +493,14 @@ void netdata_cleanup_and_exit(int ret, const char *action, const char *action_re (void) unlink(agent_incomplete_shutdown_file); watcher_step_complete(WATCHER_STEP_ID_REMOVE_INCOMPLETE_SHUTDOWN_FILE); - + watcher_shutdown_end(); watcher_thread_stop(); +#ifdef OS_WINDOWS + return; +#endif + #ifdef ENABLE_SENTRY if (ret) abort(); @@ -613,39 +622,6 @@ void web_server_config_options(void) } } - -// killpid kills pid with SIGTERM. -int killpid(pid_t pid) { - int ret; - netdata_log_debug(D_EXIT, "Request to kill pid %d", pid); - - int signal = SIGTERM; -//#ifdef NETDATA_INTERNAL_CHECKS -// if(service_running(SERVICE_COLLECTORS)) -// signal = SIGABRT; -//#endif - - errno = 0; - ret = kill(pid, signal); - if (ret == -1) { - switch(errno) { - case ESRCH: - // We wanted the process to exit so just let the caller handle. - return ret; - - case EPERM: - netdata_log_error("Cannot kill pid %d, but I do not have enough permissions.", pid); - break; - - default: - netdata_log_error("Cannot kill pid %d, but I received an error.", pid); - break; - } - } - - return ret; -} - static void set_nofile_limit(struct rlimit *rl) { // get the num files allowed if(getrlimit(RLIMIT_NOFILE, rl) != 0) { @@ -693,8 +669,6 @@ void cancel_main_threads() { } } - netdata_exit = 1; - while(found && max > 0) { max -= step; netdata_log_info("Waiting %d threads to finish...", found); @@ -1325,7 +1299,7 @@ static void post_conf_load(char **user) } static bool load_netdata_conf(char *filename, char overwrite_used, char **user) { - errno = 0; + errno_clear(); int ret = 0; @@ -1362,6 +1336,7 @@ static inline void coverity_remove_taint(char *s) } int get_system_info(struct rrdhost_system_info *system_info) { +#if !defined(OS_WINDOWS) char *script; script = mallocz(sizeof(char) * (strlen(netdata_configured_primary_plugins_dir) + strlen("system-info.sh") + 2)); sprintf(script, "%s/%s", netdata_configured_primary_plugins_dir, "system-info.sh"); @@ -1371,15 +1346,12 @@ int get_system_info(struct rrdhost_system_info *system_info) { return 1; } - pid_t command_pid; - - FILE *fp_child_input; - FILE *fp_child_output = netdata_popen(script, &command_pid, &fp_child_input); - if(fp_child_output) { + POPEN_INSTANCE *instance = spawn_popen_run(script); + if(instance) { char line[200 + 1]; // Removed the double strlens, if the Coverity tainted string warning reappears I'll revert. // One time init code, but I'm curious about the warning... - while (fgets(line, 200, fp_child_output) != NULL) { + while (fgets(line, 200, instance->child_stdout_fp) != NULL) { char *value=line; while (*value && *value != '=') value++; if (*value=='=') { @@ -1398,9 +1370,12 @@ int get_system_info(struct rrdhost_system_info *system_info) { } } } - netdata_pclose(fp_child_input, fp_child_output, command_pid); + spawn_popen_wait(instance); } freez(script); +#else + netdata_windows_get_system_info(system_info); +#endif return 0; } @@ -1452,35 +1427,34 @@ int unittest_prepare_rrd(char **user) { return 0; } -int main(int argc, char **argv) { - // initialize the system clocks +int netdata_main(int argc, char **argv) { clocks_init(); - netdata_start_time = now_realtime_sec(); + string_init(); + analytics_init(); + netdata_start_time = now_realtime_sec(); usec_t started_ut = now_monotonic_usec(); usec_t last_ut = started_ut; const char *prev_msg = NULL; int i; int config_loaded = 0; - int dont_fork = 0; bool close_open_fds = true; size_t default_stacksize; char *user = NULL; +#ifdef OS_WINDOWS + int dont_fork = 1; +#else + int dont_fork = 0; +#endif + static_threads = static_threads_get(); netdata_ready = false; // set the name for logging program_name = "netdata"; - if (argc > 1 && strcmp(argv[1], SPAWN_SERVER_COMMAND_LINE_ARGUMENT) == 0) { - // don't run netdata, this is the spawn server - i_am_the_spawn_server = true; - spawn_server(); - exit(0); - } - // parse options { int num_opts = sizeof(option_definitions) / sizeof(struct option_def); @@ -1945,7 +1919,7 @@ int main(int argc, char **argv) { if (close_open_fds == true) { // close all open file descriptors, except the standard ones // the caller may have left open files (lxc-attach has this issue) - for_each_open_fd(OPEN_FD_ACTION_CLOSE, OPEN_FD_EXCLUDE_STDIN | OPEN_FD_EXCLUDE_STDOUT | OPEN_FD_EXCLUDE_STDERR); + os_close_all_non_std_open_fds_except(NULL, 0); } if(!config_loaded) { @@ -2175,6 +2149,7 @@ int main(int argc, char **argv) { (void)dont_fork; #endif + netdata_main_spawn_server_init("plugins", argc, (const char **)argv); watcher_thread_start(); // init sentry @@ -2203,19 +2178,7 @@ int main(int argc, char **argv) { // initialize internal registry delta_startup_time("initialize registry"); registry_init(); - - // fork the spawn server - delta_startup_time("fork the spawn server"); - spawn_init(); - - /* - * Libuv uv_spawn() uses SIGCHLD internally: - * https://github.com/libuv/libuv/blob/cc51217a317e96510fbb284721d5e6bc2af31e33/src/unix/process.c#L485 - * and inadvertently replaces the netdata signal handler which was setup during initialization. - * Thusly, we must explicitly restore the signal handler for SIGCHLD. - * Warning: extreme care is needed when mixing and matching POSIX and libuv. - */ - signals_restore_SIGCHLD(); + netdata_random_session_id_generate(); // ------------------------------------------------------------------------ // initialize rrd, registry, health, rrdpush, etc. @@ -2264,6 +2227,7 @@ int main(int argc, char **argv) { if (claiming_pending_arguments) claim_agent(claiming_pending_arguments, false, NULL); + load_claiming_state(); // ------------------------------------------------------------------------ @@ -2349,22 +2313,21 @@ int main(int argc, char **argv) { } #endif - // ------------------------------------------------------------------------ - // initialize WebRTC - webrtc_initialize(); - // ------------------------------------------------------------------------ - // unblock signals - signals_unblock(); - // ------------------------------------------------------------------------ - // Handle signals + return 10; +} - signals_handle(); +#ifndef OS_WINDOWS +int main(int argc, char *argv[]) +{ + int rc = netdata_main(argc, argv); + if (rc != 10) + return rc; - // should never reach this point - // but we need it for rpmlint #2752 + signals_handle(); return 1; } +#endif diff --git a/src/daemon/main.h b/src/daemon/main.h index faf7d5b69..3188623b6 100644 --- a/src/daemon/main.h +++ b/src/daemon/main.h @@ -8,7 +8,6 @@ extern struct config netdata_config; void cancel_main_threads(void); -int killpid(pid_t pid); typedef enum { ABILITY_DATA_QUERIES = (1 << 0), diff --git a/src/daemon/signals.c b/src/daemon/signals.c index c014452b7..4e4d7c4d4 100644 --- a/src/daemon/signals.c +++ b/src/daemon/signals.c @@ -2,6 +2,12 @@ #include "common.h" +/* + * IMPORTANT: Libuv uv_spawn() uses SIGCHLD internally: + * https://github.com/libuv/libuv/blob/cc51217a317e96510fbb284721d5e6bc2af31e33/src/unix/process.c#L485 + * Extreme care is needed when mixing and matching POSIX and libuv. + */ + typedef enum signal_action { NETDATA_SIGNAL_END_OF_LIST, NETDATA_SIGNAL_IGNORE, @@ -9,7 +15,6 @@ typedef enum signal_action { NETDATA_SIGNAL_REOPEN_LOGS, NETDATA_SIGNAL_RELOAD_HEALTH, NETDATA_SIGNAL_FATAL, - NETDATA_SIGNAL_CHILD, } SIGNAL_ACTION; static struct { @@ -25,7 +30,6 @@ static struct { { SIGHUP, "SIGHUP", 0, NETDATA_SIGNAL_REOPEN_LOGS }, { SIGUSR2, "SIGUSR2", 0, NETDATA_SIGNAL_RELOAD_HEALTH }, { SIGBUS, "SIGBUS", 0, NETDATA_SIGNAL_FATAL }, - { SIGCHLD, "SIGCHLD", 0, NETDATA_SIGNAL_CHILD }, // terminator { 0, "NONE", 0, NETDATA_SIGNAL_END_OF_LIST } @@ -93,18 +97,6 @@ void signals_init(void) { } } -void signals_restore_SIGCHLD(void) -{ - struct sigaction sa; - - sa.sa_flags = 0; - sigfillset(&sa.sa_mask); - sa.sa_handler = signal_handler; - - if(sigaction(SIGCHLD, &sa, NULL) == -1) - netdata_log_error("SIGNAL: Failed to change signal handler for: SIGCHLD"); -} - void signals_reset(void) { struct sigaction sa; sigemptyset(&sa.sa_mask); @@ -118,64 +110,6 @@ void signals_reset(void) { } } -// reap_child reaps the child identified by pid. -static void reap_child(pid_t pid) { - siginfo_t i; - - errno = 0; - netdata_log_debug(D_CHILDS, "SIGNAL: reap_child(%d)...", pid); - if (netdata_waitid(P_PID, (id_t)pid, &i, WEXITED|WNOHANG) == -1) { - if (errno != ECHILD) - netdata_log_error("SIGNAL: waitid(%d): failed to wait for child", pid); - else - netdata_log_info("SIGNAL: waitid(%d): failed - it seems the child is already reaped", pid); - return; - } - else if (i.si_pid == 0) { - // Process didn't exit, this shouldn't happen. - netdata_log_error("SIGNAL: waitid(%d): reports pid 0 - child has not exited", pid); - return; - } - - switch (i.si_code) { - case CLD_EXITED: - netdata_log_info("SIGNAL: reap_child(%d) exited with code: %d", pid, i.si_status); - break; - case CLD_KILLED: - netdata_log_info("SIGNAL: reap_child(%d) killed by signal: %d", pid, i.si_status); - break; - case CLD_DUMPED: - netdata_log_info("SIGNAL: reap_child(%d) dumped core by signal: %d", pid, i.si_status); - break; - case CLD_STOPPED: - netdata_log_info("SIGNAL: reap_child(%d) stopped by signal: %d", pid, i.si_status); - break; - case CLD_TRAPPED: - netdata_log_info("SIGNAL: reap_child(%d) trapped by signal: %d", pid, i.si_status); - break; - case CLD_CONTINUED: - netdata_log_info("SIGNAL: reap_child(%d) continued by signal: %d", pid, i.si_status); - break; - default: - netdata_log_info("SIGNAL: reap_child(%d) gave us a SIGCHLD with code %d and status %d.", pid, i.si_code, i.si_status); - break; - } -} - -// reap_children reaps all pending children which are not managed by myp. -static void reap_children() { - siginfo_t i; - - while(1) { - i.si_pid = 0; - if (netdata_waitid(P_ALL, (id_t)0, &i, WEXITED|WNOHANG|WNOWAIT) == -1 || i.si_pid == 0) - // nothing to do - return; - - reap_child(i.si_pid); - } -} - void signals_handle(void) { while(1) { @@ -183,6 +117,7 @@ void signals_handle(void) { // is delivered that either terminates the process or causes the invocation // of a signal-catching function. if(pause() == -1 && errno == EINTR) { + errno_clear(); // loop once, but keep looping while signals are coming in // this is needed because a few operations may take some time @@ -226,10 +161,6 @@ void signals_handle(void) { fatal("SIGNAL: Received %s. netdata now exits.", name); break; - case NETDATA_SIGNAL_CHILD: - reap_children(); - break; - default: netdata_log_info("SIGNAL: Received %s. No signal handler configured. Ignoring it.", name); break; diff --git a/src/daemon/signals.h b/src/daemon/signals.h index 12b1ed198..26dbc6dcd 100644 --- a/src/daemon/signals.h +++ b/src/daemon/signals.h @@ -6,7 +6,6 @@ void signals_init(void); void signals_block(void); void signals_unblock(void); -void signals_restore_SIGCHLD(void); void signals_reset(void); void signals_handle(void) NORETURN; diff --git a/src/daemon/static_threads.c b/src/daemon/static_threads.c index 4199e9306..c6ec79956 100644 --- a/src/daemon/static_threads.c +++ b/src/daemon/static_threads.c @@ -6,8 +6,7 @@ void *aclk_main(void *ptr); void *analytics_main(void *ptr); void *cpuidlejitter_main(void *ptr); void *global_statistics_main(void *ptr); -void *global_statistics_workers_main(void *ptr); -void *global_statistics_sqlite3_main(void *ptr); +void *global_statistics_extended_main(void *ptr); void *health_main(void *ptr); void *pluginsd_main(void *ptr); void *service_main(void *ptr); @@ -51,24 +50,13 @@ const struct netdata_static_thread static_threads_common[] = { .config_name = "netdata monitoring", .env_name = "NETDATA_INTERNALS_MONITORING", .global_variable = &global_statistics_enabled, - .enabled = 0, + .enabled = 1, .thread = NULL, .init_routine = NULL, .start_routine = global_statistics_main }, { - .name = "STATS_WORKERS", - .config_section = CONFIG_SECTION_PLUGINS, - .config_name = "netdata monitoring extended", - .env_name = "NETDATA_INTERNALS_EXTENDED_MONITORING", - .global_variable = &global_statistics_enabled, - .enabled = 0, // this is ignored - check main() for "netdata monitoring extended" - .thread = NULL, - .init_routine = NULL, - .start_routine = global_statistics_workers_main - }, - { - .name = "STATS_SQLITE3", + .name = "STATS_GLOBAL_EXT", .config_section = CONFIG_SECTION_PLUGINS, .config_name = "netdata monitoring extended", .env_name = "NETDATA_INTERNALS_EXTENDED_MONITORING", @@ -76,7 +64,7 @@ const struct netdata_static_thread static_threads_common[] = { .enabled = 0, // this is ignored - check main() for "netdata monitoring extended" .thread = NULL, .init_routine = NULL, - .start_routine = global_statistics_sqlite3_main + .start_routine = global_statistics_extended_main }, { .name = "PLUGINSD", @@ -105,8 +93,6 @@ const struct netdata_static_thread static_threads_common[] = { .init_routine = NULL, .start_routine = statsd_main }, -#ifndef OS_WINDOWS - // this crashes the debugger under windows { .name = "EXPORTING", .config_section = NULL, @@ -116,7 +102,6 @@ const struct netdata_static_thread static_threads_common[] = { .init_routine = NULL, .start_routine = exporting_main }, -#endif { .name = "SNDR[localhost]", .config_section = NULL, diff --git a/src/daemon/unit_test.c b/src/daemon/unit_test.c index e7a743603..0f15f67d7 100644 --- a/src/daemon/unit_test.c +++ b/src/daemon/unit_test.c @@ -1674,22 +1674,7 @@ int test_sqlite(void) { return 1; } - BUFFER *sql = buffer_create(ACLK_SYNC_QUERY_SIZE, NULL); - char *uuid_str = "0000_000"; - - buffer_sprintf(sql, TABLE_ACLK_ALERT, uuid_str); - rc = sqlite3_exec_monitored(db_mt, buffer_tostring(sql), 0, 0, NULL); - if (rc != SQLITE_OK) - goto error; - - buffer_free(sql); fprintf(stderr,"SQLite is OK\n"); - rc = sqlite3_close_v2(db_mt); + (void) sqlite3_close_v2(db_mt); return 0; -error: - rc = sqlite3_close_v2(db_mt); - fprintf(stderr,"SQLite statement failed: %s\n", buffer_tostring(sql)); - buffer_free(sql); - fprintf(stderr,"SQLite tests failed\n"); - return 1; } diff --git a/src/daemon/watcher.c b/src/daemon/watcher.c index 1e0090e24..6584073e3 100644 --- a/src/daemon/watcher.c +++ b/src/daemon/watcher.c @@ -65,6 +65,7 @@ void *watcher_main(void *arg) usec_t shutdown_start_time = now_monotonic_usec(); watcher_wait_for_step(WATCHER_STEP_ID_CREATE_SHUTDOWN_FILE); + watcher_wait_for_step(WATCHER_STEP_ID_DESTROY_MAIN_SPAWN_SERVER); watcher_wait_for_step(WATCHER_STEP_ID_DBENGINE_EXIT_MODE); watcher_wait_for_step(WATCHER_STEP_ID_CLOSE_WEBRTC_CONNECTIONS); watcher_wait_for_step(WATCHER_STEP_ID_DISABLE_MAINTENANCE_NEW_QUERIES_NEW_WEB_REQUESTS_NEW_STREAMING_CONNECTIONS_AND_ACLK); @@ -105,6 +106,8 @@ void watcher_thread_start() { watcher_steps[WATCHER_STEP_ID_CREATE_SHUTDOWN_FILE].msg = "create shutdown file"; + watcher_steps[WATCHER_STEP_ID_DESTROY_MAIN_SPAWN_SERVER].msg = + "destroy main spawn server"; watcher_steps[WATCHER_STEP_ID_DBENGINE_EXIT_MODE].msg = "dbengine exit mode"; watcher_steps[WATCHER_STEP_ID_CLOSE_WEBRTC_CONNECTIONS].msg = diff --git a/src/daemon/watcher.h b/src/daemon/watcher.h index b785ca436..9809e45fb 100644 --- a/src/daemon/watcher.h +++ b/src/daemon/watcher.h @@ -7,6 +7,7 @@ typedef enum { WATCHER_STEP_ID_CREATE_SHUTDOWN_FILE = 0, + WATCHER_STEP_ID_DESTROY_MAIN_SPAWN_SERVER, WATCHER_STEP_ID_DBENGINE_EXIT_MODE, WATCHER_STEP_ID_CLOSE_WEBRTC_CONNECTIONS, WATCHER_STEP_ID_DISABLE_MAINTENANCE_NEW_QUERIES_NEW_WEB_REQUESTS_NEW_STREAMING_CONNECTIONS_AND_ACLK, diff --git a/src/daemon/win_system-info.c b/src/daemon/win_system-info.c new file mode 100644 index 000000000..2d67862fb --- /dev/null +++ b/src/daemon/win_system-info.c @@ -0,0 +1,318 @@ +// SPDX-License-Identifier: GPL-3.0-or-later + +#include "win_system-info.h" + +#ifdef OS_WINDOWS + +// Hardware +static char *netdata_windows_arch(DWORD value) +{ + switch (value) { + case 9: + return "x86_64"; + case 5: + return "ARM"; + case 12: + return "ARM64"; + case 6: + return "Intel Intaniun-based"; + case 0: + return "x86"; + default: + return NETDATA_DEFAULT_SYSTEM_INFO_VALUE_UNKNOWN; + } +} + +static DWORD netdata_windows_cpu_frequency(HKEY lKey) +{ + DWORD freq = 0; + long ret = netdata_registry_get_dword_from_open_key(&freq, lKey, "~MHz"); + if (ret != ERROR_SUCCESS) + return freq; + + freq *= 1000000; + return freq; +} + +static void netdata_windows_cpu_from_system_info(struct rrdhost_system_info *systemInfo) +{ + SYSTEM_INFO sysInfo; + GetSystemInfo(&sysInfo); + + char cpuData[256]; + (void)snprintf(cpuData, 255, "%d", sysInfo.dwNumberOfProcessors); + (void)rrdhost_set_system_info_variable(systemInfo, "NETDATA_SYSTEM_CPU_LOGICAL_CPU_COUNT", cpuData); + + char *arch = netdata_windows_arch(sysInfo.wProcessorArchitecture); + (void)rrdhost_set_system_info_variable(systemInfo, "NETDATA_SYSTEM_ARCHITECTURE", arch); + + (void)rrdhost_set_system_info_variable( + systemInfo, "NETDATA_SYSTEM_VIRTUALIZATION", NETDATA_DEFAULT_SYSTEM_INFO_VALUE_NONE); + + (void)rrdhost_set_system_info_variable( + systemInfo, "NETDATA_SYSTEM_VIRT_DETECTION", NETDATA_DEFAULT_SYSTEM_INFO_VALUE_NONE); + + (void)rrdhost_set_system_info_variable( + systemInfo, "NETDATA_SYSTEM_CONTAINER", NETDATA_DEFAULT_SYSTEM_INFO_VALUE_NONE); + + (void)rrdhost_set_system_info_variable( + systemInfo, "NETDATA_SYSTEM_CONTAINER_DETECTION", NETDATA_DEFAULT_SYSTEM_INFO_VALUE_NONE); + +} + +static void netdata_windows_cpu_vendor_model(struct rrdhost_system_info *systemInfo, + HKEY lKey, + char *variable, + char *key) +{ + char cpuData[256]; + long ret = netdata_registry_get_string_from_open_key(cpuData, 255, lKey, key); + (void)rrdhost_set_system_info_variable(systemInfo, + variable, + (ret == ERROR_SUCCESS) ? cpuData : NETDATA_DEFAULT_SYSTEM_INFO_VALUE_UNKNOWN); +} + +static void netdata_windows_cpu_from_registry(struct rrdhost_system_info *systemInfo) +{ + HKEY lKey; + long ret = RegOpenKeyEx(HKEY_LOCAL_MACHINE, + "HARDWARE\\DESCRIPTION\\System\\CentralProcessor\\0", + 0, + KEY_READ, + &lKey); + if (ret != ERROR_SUCCESS) + return; + + ULONGLONG cpuFreq = netdata_windows_cpu_frequency(lKey); + char cpuData[256]; + if (cpuFreq) + (void)snprintf(cpuData, 255, "%lu", (unsigned long)cpuFreq); + + (void)rrdhost_set_system_info_variable(systemInfo, + "NETDATA_SYSTEM_CPU_FREQ", + (!cpuFreq) ? NETDATA_DEFAULT_SYSTEM_INFO_VALUE_UNKNOWN : cpuData); + + netdata_windows_cpu_vendor_model(systemInfo, lKey, "NETDATA_SYSTEM_CPU_VENDOR", "VendorIdentifier"); + netdata_windows_cpu_vendor_model(systemInfo, lKey, "NETDATA_SYSTEM_CPU_MODEL", "ProcessorNameString"); + (void)rrdhost_set_system_info_variable(systemInfo, "NETDATA_SYSTEM_CPU_DETECTION", NETDATA_WIN_DETECTION_METHOD); +} + +static void netdata_windows_get_cpu(struct rrdhost_system_info *systemInfo) +{ + netdata_windows_cpu_from_system_info(systemInfo); + + netdata_windows_cpu_from_registry(systemInfo); +} + +static void netdata_windows_get_mem(struct rrdhost_system_info *systemInfo) +{ + ULONGLONG size; + char memSize[256]; + if (!GetPhysicallyInstalledSystemMemory(&size)) + size = 0; + else + (void)snprintf(memSize, 255, "%llu", size); + + (void)rrdhost_set_system_info_variable(systemInfo, + "NETDATA_SYSTEM_TOTAL_RAM", + (!size) ? NETDATA_DEFAULT_SYSTEM_INFO_VALUE_UNKNOWN : memSize); + (void)rrdhost_set_system_info_variable(systemInfo, "NETDATA_SYSTEM_RAM_DETECTION", NETDATA_WIN_DETECTION_METHOD); +} + +static ULONGLONG netdata_windows_get_disk_size(char *cVolume) +{ + HANDLE disk = CreateFile(cVolume, GENERIC_READ, FILE_SHARE_VALID_FLAGS, 0, OPEN_EXISTING, 0, 0); + if (!disk) + return 0; + + GET_LENGTH_INFORMATION length; + DWORD ret; + + if (!DeviceIoControl(disk, IOCTL_DISK_GET_LENGTH_INFO, 0, 0, &length, sizeof(length), &ret, 0)) + return 0; + + CloseHandle(disk); + + return length.Length.QuadPart; +} + +static void netdata_windows_get_total_disk_size(struct rrdhost_system_info *systemInfo) +{ + ULONGLONG total = 0; + char cVolume[8]; + snprintf(cVolume, 7, "\\\\.\\C:"); + + DWORD lDrives = GetLogicalDrives(); + if (!lDrives) { + return; + } + + int i; +#define ND_POSSIBLE_VOLUMES 26 + for (i = 0; i < ND_POSSIBLE_VOLUMES; i++) { + if (!(lDrives & 1 << i)) + continue; + + cVolume[4] = 'A' + i; + total += netdata_windows_get_disk_size(cVolume); + } + + char diskSize[256]; + (void)snprintf(diskSize, 255, "%llu", total); + (void)rrdhost_set_system_info_variable(systemInfo, "NETDATA_SYSTEM_TOTAL_DISK_SIZE", diskSize); + (void)rrdhost_set_system_info_variable(systemInfo, "NETDATA_SYSTEM_DISK_DETECTION", NETDATA_WIN_DETECTION_METHOD); +} + +// Host +static DWORD netdata_windows_get_current_build() +{ + char cBuild[64]; + if (!netdata_registry_get_string( + cBuild, 63, HKEY_LOCAL_MACHINE, "SOFTWARE\\Microsoft\\Windows NT\\CurrentVersion", "CurrentBuild")) + return 0; + + errno_clear(); + + DWORD version = strtol(cBuild, NULL, 10); + if (errno == ERANGE) + return 0; + + return version; +} + +static void netdata_windows_discover_os_version(char *os, size_t length, DWORD build) +{ + char versionName[256]; + if (!netdata_registry_get_string(versionName, + 255, + HKEY_LOCAL_MACHINE, + "SOFTWARE\\Microsoft\\Windows NT\\CurrentVersion", + "DisplayVersion")) + { + (void)snprintf(os, length, "Microsoft Windows"); + return; + } + + if (IsWindowsServer()) { + (void)snprintf(os, length, "Microsoft Windows Version %s", versionName); + return; + } + +#define ND_WIN_VER_LENGTH 16 + char version[ND_WIN_VER_LENGTH + 1]; + if (IsWindows10OrGreater()) { + // https://learn.microsoft.com/en-us/windows/release-health/windows11-release-information + (void)snprintf(version, ND_WIN_VER_LENGTH, (build < 22000) ? "10" : "11"); + } else if (IsWindows8Point1OrGreater()) { + (void)snprintf(version, ND_WIN_VER_LENGTH, "8.1"); + } else if (IsWindows8OrGreater()) { + (void)snprintf(version, ND_WIN_VER_LENGTH, "8"); + } else if (IsWindows7SP1OrGreater()) { + (void)snprintf(version, ND_WIN_VER_LENGTH, "7 SP1"); + } else if (IsWindows7OrGreater()) { + (void)snprintf(version, ND_WIN_VER_LENGTH, "7"); + } else if (IsWindowsVistaSP2OrGreater()) { + (void)snprintf(version, ND_WIN_VER_LENGTH, "Vista SP2"); + } else if (IsWindowsVistaSP1OrGreater()) { + (void)snprintf(version, ND_WIN_VER_LENGTH, "Vista SP1"); + } else if (IsWindowsVistaOrGreater()) { + (void)snprintf(version, ND_WIN_VER_LENGTH, "Vista"); + } + // We are not testing older, because it is not supported anymore by Microsoft + + (void)snprintf(os, length, "Microsoft Windows Version %s, Build %d (Name: Windows %s)", versionName, build, version); +} + +static void netdata_windows_os_version(char *out, DWORD length) +{ + if (netdata_registry_get_string(out, + length, + HKEY_LOCAL_MACHINE, + "SOFTWARE\\Microsoft\\Windows NT\\CurrentVersion", + "ProductName")) + return; + + (void)snprintf(out, length, "%s", NETDATA_DEFAULT_SYSTEM_INFO_VALUE_UNKNOWN); +} + +static void netdata_windows_os_kernel_version(char *out, DWORD length, DWORD build) +{ + char version[8]; + if (!netdata_registry_get_string(version, + 7, + HKEY_LOCAL_MACHINE, + "SOFTWARE\\Microsoft\\Windows NT\\CurrentVersion", + "CurrentVersion")) + version[0] = '\0'; + + (void)snprintf(out, length, "%s (build: %u)", version, build); +} + +static void netdata_windows_host(struct rrdhost_system_info *systemInfo) +{ + char osVersion[4096]; + (void)rrdhost_set_system_info_variable(systemInfo, "NETDATA_HOST_OS_NAME", "Microsoft Windows"); + + DWORD build = netdata_windows_get_current_build(); + + netdata_windows_discover_os_version(osVersion, 4095, build); + (void)rrdhost_set_system_info_variable(systemInfo, "NETDATA_HOST_OS_ID", osVersion); + + (void)rrdhost_set_system_info_variable( + systemInfo, "NETDATA_HOST_OS_ID_LIKE", NETDATA_DEFAULT_SYSTEM_INFO_VALUE_UNKNOWN); + + netdata_windows_os_version(osVersion, 4095); + (void)rrdhost_set_system_info_variable(systemInfo, "NETDATA_HOST_OS_VERSION", osVersion); + (void)rrdhost_set_system_info_variable(systemInfo, "NETDATA_HOST_OS_VERSION_ID", osVersion); + + (void)rrdhost_set_system_info_variable(systemInfo, "NETDATA_HOST_OS_DETECTION", NETDATA_WIN_DETECTION_METHOD); + + (void)rrdhost_set_system_info_variable(systemInfo, "NETDATA_SYSTEM_KERNEL_NAME", "Windows"); + + netdata_windows_os_kernel_version(osVersion, 4095, build); + (void)rrdhost_set_system_info_variable(systemInfo, "NETDATA_SYSTEM_KERNEL_VERSION", osVersion); + + (void)rrdhost_set_system_info_variable( + systemInfo, "NETDATA_HOST_IS_K8S_NODE", NETDATA_DEFAULT_SYSTEM_INFO_VALUE_FALSE); +} + +// Cloud +static void netdata_windows_cloud(struct rrdhost_system_info *systemInfo) +{ + (void)rrdhost_set_system_info_variable( + systemInfo, "NETDATA_INSTANCE_CLOUD_TYPE", NETDATA_DEFAULT_SYSTEM_INFO_VALUE_UNKNOWN); + (void)rrdhost_set_system_info_variable( + systemInfo, "NETDATA_INSTANCE_CLOUD_INSTANCE_TYPE", NETDATA_DEFAULT_SYSTEM_INFO_VALUE_UNKNOWN); + (void)rrdhost_set_system_info_variable( + systemInfo, "NETDATA_INSTANCE_CLOUD_INSTANCE_REGION", NETDATA_DEFAULT_SYSTEM_INFO_VALUE_UNKNOWN); +} + +// Container +static void netdata_windows_container(struct rrdhost_system_info *systemInfo) +{ + (void)rrdhost_set_system_info_variable( + systemInfo, "NETDATA_CONTAINER_OS_NAME", NETDATA_DEFAULT_SYSTEM_INFO_VALUE_NONE); + (void)rrdhost_set_system_info_variable( + systemInfo, "NETDATA_CONTAINER_OS_ID", NETDATA_DEFAULT_SYSTEM_INFO_VALUE_NONE); + (void)rrdhost_set_system_info_variable( + systemInfo, "NETDATA_CONTAINER_OS_ID_LIKE", NETDATA_DEFAULT_SYSTEM_INFO_VALUE_NONE); + (void)rrdhost_set_system_info_variable( + systemInfo, "NETDATA_CONTAINER_OS_VERSION", NETDATA_DEFAULT_SYSTEM_INFO_VALUE_NONE); + (void)rrdhost_set_system_info_variable( + systemInfo, "NETDATA_CONTAINER_OS_VERSION_ID", NETDATA_DEFAULT_SYSTEM_INFO_VALUE_NONE); + (void)rrdhost_set_system_info_variable( + systemInfo, "NETDATA_CONTAINER_OS_DETECTION", NETDATA_DEFAULT_SYSTEM_INFO_VALUE_NONE); + (void)rrdhost_set_system_info_variable( + systemInfo, "NETDATA_CONTAINER_IS_OFFICIAL_IMAGE", NETDATA_DEFAULT_SYSTEM_INFO_VALUE_FALSE); +} + +void netdata_windows_get_system_info(struct rrdhost_system_info *systemInfo) +{ + netdata_windows_cloud(systemInfo); + netdata_windows_container(systemInfo); + netdata_windows_host(systemInfo); + netdata_windows_get_cpu(systemInfo); + netdata_windows_get_mem(systemInfo); + netdata_windows_get_total_disk_size(systemInfo); +} +#endif diff --git a/src/daemon/win_system-info.h b/src/daemon/win_system-info.h new file mode 100644 index 000000000..a4f0906f1 --- /dev/null +++ b/src/daemon/win_system-info.h @@ -0,0 +1,20 @@ +// SPDX-License-Identifier: GPL-3.0-or-later + +#ifndef _NETDATA_WIN_SYSTEM_INFO_H_ +#define _NETDATA_WIN_SYSTEM_INFO_H_ + +// the netdata database +#include "database/rrd.h" + +#define NETDATA_DEFAULT_SYSTEM_INFO_VALUE_UNKNOWN "unknown" +#define NETDATA_DEFAULT_SYSTEM_INFO_VALUE_NONE "none" +#define NETDATA_DEFAULT_SYSTEM_INFO_VALUE_FALSE "false" + +#ifdef OS_WINDOWS +#include "windows.h" +#include "versionhelpers.h" + +void netdata_windows_get_system_info(struct rrdhost_system_info *system_info); +#endif + +#endif // _NETDATA_WIN_SYSTEM_INFO_H_ diff --git a/src/daemon/winsvc.cc b/src/daemon/winsvc.cc new file mode 100644 index 000000000..9c5eb49ff --- /dev/null +++ b/src/daemon/winsvc.cc @@ -0,0 +1,252 @@ +extern "C" { + +#include "daemon.h" +#include "libnetdata/libnetdata.h" + +int netdata_main(int argc, char *argv[]); +void signals_handle(void); + +} + +#include <windows.h> + +__attribute__((format(printf, 1, 2))) +static void netdata_service_log(const char *fmt, ...) +{ + char path[FILENAME_MAX + 1]; + snprintfz(path, FILENAME_MAX, "%s/service.log", LOG_DIR); + + FILE *fp = fopen(path, "a"); + if (fp == NULL) { + return; + } + + SYSTEMTIME time; + GetSystemTime(&time); + fprintf(fp, "%d:%d:%d - ", time.wHour, time.wMinute, time.wSecond); + + va_list args; + va_start(args, fmt); + vfprintf(fp, fmt, args); + va_end(args); + + fprintf(fp, "\n"); + + fflush(fp); + fclose(fp); +} + +static SERVICE_STATUS_HANDLE svc_status_handle = nullptr; +static SERVICE_STATUS svc_status = {}; + +static HANDLE svc_stop_event_handle = nullptr; + +static ND_THREAD *cleanup_thread = nullptr; + +static bool ReportSvcStatus(DWORD dwCurrentState, DWORD dwWin32ExitCode, DWORD dwWaitHint, DWORD dwControlsAccepted) +{ + static DWORD dwCheckPoint = 1; + svc_status.dwCurrentState = dwCurrentState; + svc_status.dwWin32ExitCode = dwWin32ExitCode; + svc_status.dwWaitHint = dwWaitHint; + svc_status.dwControlsAccepted = dwControlsAccepted; + + if (dwCurrentState == SERVICE_RUNNING || dwCurrentState == SERVICE_STOPPED) + { + svc_status.dwCheckPoint = 0; + } + else + { + svc_status.dwCheckPoint = dwCheckPoint++; + } + + if (!SetServiceStatus(svc_status_handle, &svc_status)) { + netdata_service_log("@ReportSvcStatus: SetServiceStatusFailed (%d)", GetLastError()); + return false; + } + + return true; +} + +static HANDLE CreateEventHandle(const char *msg) +{ + HANDLE h = CreateEvent(NULL, TRUE, FALSE, NULL); + + if (!h) + { + netdata_service_log(msg); + + if (!ReportSvcStatus(SERVICE_STOPPED, GetLastError(), 1000, 0)) + { + netdata_service_log("Failed to set service status to stopped."); + } + + return NULL; + } + + return h; +} + +static void *call_netdata_cleanup(void *arg) +{ + UNUSED(arg); + + // Wait until we have to stop the service + netdata_service_log("Cleanup thread waiting for stop event..."); + WaitForSingleObject(svc_stop_event_handle, INFINITE); + + // Stop the agent + netdata_service_log("Running netdata cleanup..."); + netdata_cleanup_and_exit(0, NULL, NULL, NULL); + + // Close event handle + netdata_service_log("Closing stop event handle..."); + CloseHandle(svc_stop_event_handle); + + // Set status to stopped + netdata_service_log("Reporting the service as stopped..."); + ReportSvcStatus(SERVICE_STOPPED, 0, 0, 0); + + return nullptr; +} + +static void WINAPI ServiceControlHandler(DWORD controlCode) +{ + switch (controlCode) + { + case SERVICE_CONTROL_STOP: + { + if (svc_status.dwCurrentState != SERVICE_RUNNING) + return; + + // Set service status to stop-pending + netdata_service_log("Setting service status to stop-pending..."); + if (!ReportSvcStatus(SERVICE_STOP_PENDING, 0, 5000, 0)) + return; + + // Create cleanup thread + netdata_service_log("Creating cleanup thread..."); + char tag[NETDATA_THREAD_TAG_MAX + 1]; + snprintfz(tag, NETDATA_THREAD_TAG_MAX, "%s", "CLEANUP"); + cleanup_thread = nd_thread_create(tag, NETDATA_THREAD_OPTION_JOINABLE, call_netdata_cleanup, NULL); + + // Signal the stop request + netdata_service_log("Signalling the cleanup thread..."); + SetEvent(svc_stop_event_handle); + break; + } + case SERVICE_CONTROL_INTERROGATE: + { + ReportSvcStatus(svc_status.dwCurrentState, svc_status.dwWin32ExitCode, svc_status.dwWaitHint, svc_status.dwControlsAccepted); + break; + } + default: + break; + } +} + +void WINAPI ServiceMain(DWORD argc, LPSTR* argv) +{ + UNUSED(argc); + UNUSED(argv); + + // Create service status handle + netdata_service_log("Creating service status handle..."); + svc_status_handle = RegisterServiceCtrlHandler("Netdata", ServiceControlHandler); + if (!svc_status_handle) + { + netdata_service_log("@ServiceMain() - RegisterServiceCtrlHandler() failed..."); + return; + } + + // Set status to start-pending + netdata_service_log("Setting service status to start-pending..."); + svc_status.dwServiceType = SERVICE_WIN32_OWN_PROCESS; + svc_status.dwServiceSpecificExitCode = 0; + svc_status.dwCheckPoint = 0; + if (!ReportSvcStatus(SERVICE_START_PENDING, 0, 5000, 0)) + { + netdata_service_log("Failed to set service status to start pending."); + return; + } + + // Create stop service event handle + netdata_service_log("Creating stop service event handle..."); + svc_stop_event_handle = CreateEventHandle("Failed to create stop event handle"); + if (!svc_stop_event_handle) + return; + + // Set status to running + netdata_service_log("Setting service status to running..."); + if (!ReportSvcStatus(SERVICE_RUNNING, 0, 5000, SERVICE_ACCEPT_STOP)) + { + netdata_service_log("Failed to set service status to running."); + return; + } + + // Run the agent + netdata_service_log("Running the agent..."); + netdata_main(argc, argv); + + netdata_service_log("Agent has been started..."); +} + +static bool update_path() { + const char *old_path = getenv("PATH"); + + if (!old_path) { + if (setenv("PATH", "/usr/bin", 1) != 0) { + netdata_service_log("Failed to set PATH to /usr/bin"); + return false; + } + + return true; + } + + size_t new_path_length = strlen(old_path) + strlen("/usr/bin") + 2; + char *new_path = (char *) callocz(new_path_length, sizeof(char)); + snprintfz(new_path, new_path_length, "/usr/bin:%s", old_path); + + if (setenv("PATH", new_path, 1) != 0) { + netdata_service_log("Failed to add /usr/bin to PATH"); + freez(new_path); + return false; + } + + freez(new_path); + return true; +} + +int main(int argc, char *argv[]) +{ + bool tty = isatty(fileno(stdin)) == 1; + + if (!update_path()) { + return 1; + } + + if (tty) + { + int rc = netdata_main(argc, argv); + if (rc != 10) + return rc; + + signals_handle(); + return 1; + } + else + { + SERVICE_TABLE_ENTRY serviceTable[] = { + { strdupz("Netdata"), ServiceMain }, + { nullptr, nullptr } + }; + + if (!StartServiceCtrlDispatcher(serviceTable)) + { + netdata_service_log("@main() - StartServiceCtrlDispatcher() failed..."); + return 1; + } + + return 0; + } +} diff --git a/src/database/engine/rrdengine.c b/src/database/engine/rrdengine.c index 2d6583ead..a989877fc 100644 --- a/src/database/engine/rrdengine.c +++ b/src/database/engine/rrdengine.c @@ -1517,7 +1517,7 @@ static void *journal_v2_indexing_tp_worker(struct rrdengine_instance *ctx __mayb break; } - errno = 0; + errno_clear(); if(count) nd_log(NDLS_DAEMON, NDLP_DEBUG, "DBENGINE: journal indexing done; %u files processed", diff --git a/src/database/rrd.h b/src/database/rrd.h index 097e25025..bd31e21e1 100644 --- a/src/database/rrd.h +++ b/src/database/rrd.h @@ -1043,7 +1043,6 @@ struct alarm_entry { STRING *recipient; time_t exec_run_timestamp; int exec_code; - uint64_t exec_spawn_serial; STRING *source; STRING *units; @@ -1069,6 +1068,8 @@ struct alarm_entry { time_t last_repeat; + POPEN_INSTANCE *popen_instance; + struct alarm_entry *next; struct alarm_entry *next_in_progress; struct alarm_entry *prev_in_progress; diff --git a/src/database/rrdhost.c b/src/database/rrdhost.c index 6bf2c2551..b3d786cff 100644 --- a/src/database/rrdhost.c +++ b/src/database/rrdhost.c @@ -935,7 +935,13 @@ void dbengine_init(char *hostname) { config_set_number(CONFIG_SECTION_DB, "dbengine tier 0 disk space MB", default_multidb_disk_quota_mb); } +#ifdef OS_WINDOWS + // FIXME: for whatever reason joining the initialization threads + // fails on Windows. + bool parallel_initialization = false; +#else bool parallel_initialization = (storage_tiers <= (size_t)get_netdata_cpus()) ? true : false; +#endif struct dbengine_initialization tiers_init[RRD_STORAGE_TIERS] = {}; @@ -1488,18 +1494,16 @@ static void rrdhost_load_kubernetes_labels(void) { return; } - pid_t pid; - FILE *fp_child_input; - FILE *fp_child_output = netdata_popen(label_script, &pid, &fp_child_input); - if(!fp_child_output) return; + POPEN_INSTANCE *instance = spawn_popen_run(label_script); + if(!instance) return; char buffer[1000 + 1]; - while (fgets(buffer, 1000, fp_child_output) != NULL) + while (fgets(buffer, 1000, instance->child_stdout_fp) != NULL) rrdlabels_add_pair(localhost->rrdlabels, buffer, RRDLABEL_SRC_AUTO|RRDLABEL_SRC_K8S); // Non-zero exit code means that all the script output is error messages. We've shown already any message that didn't include a ':' // Here we'll inform with an ERROR that the script failed, show whatever (if anything) was added to the list of labels, free the memory and set the return to null - int rc = netdata_pclose(fp_child_input, fp_child_output, pid); + int rc = spawn_popen_wait(instance); if(rc) nd_log(NDLS_DAEMON, NDLP_ERR, "%s exited abnormally. Failed to get kubernetes labels.", diff --git a/src/database/rrdlabels.c b/src/database/rrdlabels.c index b82fa76d2..65e2dc9e4 100644 --- a/src/database/rrdlabels.c +++ b/src/database/rrdlabels.c @@ -412,32 +412,6 @@ __attribute__((constructor)) void initialize_labels_keys_char_map(void) { label_names_char_map[i] = label_values_char_map[i]; // apply overrides to the label names map - label_names_char_map['A'] = 'a'; - label_names_char_map['B'] = 'b'; - label_names_char_map['C'] = 'c'; - label_names_char_map['D'] = 'd'; - label_names_char_map['E'] = 'e'; - label_names_char_map['F'] = 'f'; - label_names_char_map['G'] = 'g'; - label_names_char_map['H'] = 'h'; - label_names_char_map['I'] = 'i'; - label_names_char_map['J'] = 'j'; - label_names_char_map['K'] = 'k'; - label_names_char_map['L'] = 'l'; - label_names_char_map['M'] = 'm'; - label_names_char_map['N'] = 'n'; - label_names_char_map['O'] = 'o'; - label_names_char_map['P'] = 'p'; - label_names_char_map['Q'] = 'q'; - label_names_char_map['R'] = 'r'; - label_names_char_map['S'] = 's'; - label_names_char_map['T'] = 't'; - label_names_char_map['U'] = 'u'; - label_names_char_map['V'] = 'v'; - label_names_char_map['W'] = 'w'; - label_names_char_map['X'] = 'x'; - label_names_char_map['Y'] = 'y'; - label_names_char_map['Z'] = 'z'; label_names_char_map['='] = '_'; label_names_char_map[':'] = '_'; label_names_char_map['+'] = '_'; @@ -1652,13 +1626,13 @@ static int rrdlabels_unittest_add_pairs() { errors += rrdlabels_unittest_add_a_pair("\"tag=1\": country:\"Gre\\\"ece\"", "tag_1", "country:Gre_ece"); errors += rrdlabels_unittest_add_a_pair("\"tag=1\" = country:\"Gre\\\"ece\"", "tag_1", "country:Gre_ece"); - errors += rrdlabels_unittest_add_a_pair("\t'LABE=L'\t=\t\"World\" peace", "labe_l", "World peace"); - errors += rrdlabels_unittest_add_a_pair("\t'LA\\'B:EL'\t=\tcountry:\"World\":\"Europe\":\"Greece\"", "la_b_el", "country:World:Europe:Greece"); - errors += rrdlabels_unittest_add_a_pair("\t'LA\\'B:EL'\t=\tcountry\\\"World\"\\\"Europe\"\\\"Greece\"", "la_b_el", "country/World/Europe/Greece"); + errors += rrdlabels_unittest_add_a_pair("\t'LABE=L'\t=\t\"World\" peace", "LABE_L", "World peace"); + errors += rrdlabels_unittest_add_a_pair("\t'LA\\'B:EL'\t=\tcountry:\"World\":\"Europe\":\"Greece\"", "LA_B_EL", "country:World:Europe:Greece"); + errors += rrdlabels_unittest_add_a_pair("\t'LA\\'B:EL'\t=\tcountry\\\"World\"\\\"Europe\"\\\"Greece\"", "LA_B_EL", "country/World/Europe/Greece"); - errors += rrdlabels_unittest_add_a_pair("NAME=\"VALUE\"", "name", "VALUE"); - errors += rrdlabels_unittest_add_a_pair("\"NAME\" : \"VALUE\"", "name", "VALUE"); - errors += rrdlabels_unittest_add_a_pair("NAME: \"VALUE\"", "name", "VALUE"); + errors += rrdlabels_unittest_add_a_pair("NAME=\"VALUE\"", "NAME", "VALUE"); + errors += rrdlabels_unittest_add_a_pair("\"NAME\" : \"VALUE\"", "NAME", "VALUE"); + errors += rrdlabels_unittest_add_a_pair("NAME: \"VALUE\"", "NAME", "VALUE"); return errors; } diff --git a/src/database/sqlite/sqlite_aclk.c b/src/database/sqlite/sqlite_aclk.c index 8dc2231b4..027ee8f93 100644 --- a/src/database/sqlite/sqlite_aclk.c +++ b/src/database/sqlite/sqlite_aclk.c @@ -9,7 +9,6 @@ struct aclk_sync_config_s { uv_thread_t thread; uv_loop_t loop; uv_timer_t timer_req; - time_t cleanup_after; // Start a cleanup after this timestamp uv_async_t async; bool initialized; SPINLOCK cmd_queue_lock; @@ -24,7 +23,7 @@ void sanity_check(void) { #ifdef ENABLE_ACLK static struct aclk_database_cmd aclk_database_deq_cmd(void) { - struct aclk_database_cmd ret; + struct aclk_database_cmd ret = { 0 }; spinlock_lock(&aclk_sync_config.cmd_queue_lock); if(aclk_sync_config.cmd_base) { @@ -35,7 +34,6 @@ static struct aclk_database_cmd aclk_database_deq_cmd(void) } else { ret.opcode = ACLK_DATABASE_NOOP; - ret.completion = NULL; } spinlock_unlock(&aclk_sync_config.cmd_queue_lock); @@ -176,70 +174,24 @@ static int create_host_callback(void *data, int argc, char **argv, char **column #ifdef ENABLE_ACLK -#define SQL_SELECT_HOST_BY_UUID "SELECT host_id FROM host WHERE host_id = @host_id" -static int is_host_available(nd_uuid_t *host_id) -{ - sqlite3_stmt *res = NULL; - int rc = 0; - - if (!REQUIRE_DB(db_meta)) - return 1; - - if (!PREPARE_STATEMENT(db_meta, SQL_SELECT_HOST_BY_UUID, &res)) - return 1; - - int param = 0; - SQLITE_BIND_FAIL(done, sqlite3_bind_blob(res, ++param, host_id, sizeof(*host_id), SQLITE_STATIC)); - - param = 0; - rc = sqlite3_step_monitored(res); - -done: - REPORT_BIND_FAIL(res, param); - SQLITE_FINALIZE(res); - return (rc == SQLITE_ROW); -} +#define SQL_SELECT_ACLK_ALERT_TABLES \ + "SELECT 'DROP '||type||' IF EXISTS '||name||';' FROM sqlite_schema WHERE name LIKE 'aclk_alert_%' AND type IN ('table', 'trigger', 'index')" -// OPCODE: ACLK_DATABASE_DELETE_HOST -static void sql_delete_aclk_table_list(char *host_guid) +static void sql_delete_aclk_table_list(void) { - char uuid_str[UUID_STR_LEN]; - char host_str[UUID_STR_LEN]; - - int rc; - nd_uuid_t host_uuid; - - if (unlikely(!host_guid)) - return; - - rc = uuid_parse(host_guid, host_uuid); - freez(host_guid); - if (rc) - return; - - uuid_unparse_lower(host_uuid, host_str); - uuid_unparse_lower_fix(&host_uuid, uuid_str); - - if (is_host_available(&host_uuid)) - return; - sqlite3_stmt *res = NULL; - BUFFER *sql = buffer_create(ACLK_SYNC_QUERY_SIZE, &netdata_buffers_statistics.buffers_sqlite); - buffer_sprintf(sql,"SELECT 'drop '||type||' IF EXISTS '||name||';' FROM sqlite_schema " \ - "WHERE name LIKE 'aclk_%%_%s' AND type IN ('table', 'trigger', 'index')", uuid_str); + BUFFER *sql = buffer_create(ACLK_SYNC_QUERY_SIZE, NULL); - if (!PREPARE_STATEMENT(db_meta, buffer_tostring(sql), &res)) + if (!PREPARE_STATEMENT(db_meta, SQL_SELECT_ACLK_ALERT_TABLES, &res)) goto fail; - buffer_flush(sql); - while (sqlite3_step_monitored(res) == SQLITE_ROW) buffer_strcat(sql, (char *) sqlite3_column_text(res, 0)); SQLITE_FINALIZE(res); - rc = db_execute(db_meta, buffer_tostring(sql)); + int rc = db_execute(db_meta, buffer_tostring(sql)); if (unlikely(rc)) netdata_log_error("Failed to drop unused ACLK tables"); @@ -285,53 +237,6 @@ skip: freez(machine_guid); } - -static int sql_check_aclk_table(void *data __maybe_unused, int argc __maybe_unused, char **argv __maybe_unused, char **column __maybe_unused) -{ - struct aclk_database_cmd cmd; - memset(&cmd, 0, sizeof(cmd)); - cmd.opcode = ACLK_DATABASE_DELETE_HOST; - cmd.param[0] = strdupz((char *) argv[0]); - aclk_database_enq_cmd(&cmd); - return 0; -} - -#define SQL_SELECT_ACLK_ACTIVE_LIST "SELECT REPLACE(SUBSTR(name,19),'_','-') FROM sqlite_schema " \ - "WHERE name LIKE 'aclk_chart_latest_%' AND type IN ('table')" - -static void sql_check_aclk_table_list(void) -{ - char *err_msg = NULL; - int rc = sqlite3_exec_monitored(db_meta, SQL_SELECT_ACLK_ACTIVE_LIST, sql_check_aclk_table, NULL, &err_msg); - if (rc != SQLITE_OK) { - error_report("Query failed when trying to check for obsolete ACLK sync tables, %s", err_msg); - sqlite3_free(err_msg); - } -} - -#define SQL_ALERT_CLEANUP "DELETE FROM aclk_alert_%s WHERE date_submitted IS NOT NULL AND CAST(date_cloud_ack AS INT) < unixepoch()-%d" - -static int sql_maint_aclk_sync_database(void *data __maybe_unused, int argc __maybe_unused, char **argv, char **column __maybe_unused) -{ - char sql[ACLK_SYNC_QUERY_SIZE]; - snprintfz(sql,sizeof(sql) - 1, SQL_ALERT_CLEANUP, (char *) argv[0], ACLK_DELETE_ACK_ALERTS_INTERNAL); - if (unlikely(db_execute(db_meta, sql))) - error_report("Failed to clean stale ACLK alert entries"); - return 0; -} - -#define SQL_SELECT_ACLK_ALERT_LIST "SELECT SUBSTR(name,12) FROM sqlite_schema WHERE name LIKE 'aclk_alert_%' AND type IN ('table')" - -static void sql_maint_aclk_sync_database_all(void) -{ - char *err_msg = NULL; - int rc = sqlite3_exec_monitored(db_meta, SQL_SELECT_ACLK_ALERT_LIST, sql_maint_aclk_sync_database, NULL, &err_msg); - if (rc != SQLITE_OK) { - error_report("Query failed when trying to check for obsolete ACLK sync tables, %s", err_msg); - sqlite3_free(err_msg); - } -} - static int aclk_config_parameters(void *data __maybe_unused, int argc __maybe_unused, char **argv, char **column __maybe_unused) { char uuid_str[UUID_STR_LEN]; @@ -339,7 +244,7 @@ static int aclk_config_parameters(void *data __maybe_unused, int argc __maybe_un RRDHOST *host = rrdhost_find_by_guid(uuid_str); if (host != localhost) - sql_create_aclk_table(host, (nd_uuid_t *) argv[0], (nd_uuid_t *) argv[1]); + create_aclk_config(host, (nd_uuid_t *)argv[0], (nd_uuid_t *)argv[1]); return 0; } @@ -356,16 +261,7 @@ static void timer_cb(uv_timer_t *handle) uv_stop(handle->loop); uv_update_time(handle->loop); - struct aclk_sync_config_s *config = handle->data; - struct aclk_database_cmd cmd; - memset(&cmd, 0, sizeof(cmd)); - - if (config->cleanup_after < now_realtime_sec()) { - cmd.opcode = ACLK_DATABASE_CLEANUP; - aclk_database_enq_cmd(&cmd); - config->cleanup_after += ACLK_DATABASE_CLEANUP_INTERVAL; - } - + struct aclk_database_cmd cmd = { 0 }; if (aclk_connected) { cmd.opcode = ACLK_DATABASE_PUSH_ALERT; aclk_database_enq_cmd(&cmd); @@ -373,7 +269,7 @@ static void timer_cb(uv_timer_t *handle) } } -static void aclk_synchronization(void *arg __maybe_unused) +static void aclk_synchronization(void *arg) { struct aclk_sync_config_s *config = arg; uv_thread_set_name_np("ACLKSYNC"); @@ -381,14 +277,9 @@ static void aclk_synchronization(void *arg __maybe_unused) service_register(SERVICE_THREAD_TYPE_EVENT_LOOP, NULL, NULL, NULL, true); worker_register_job_name(ACLK_DATABASE_NOOP, "noop"); - worker_register_job_name(ACLK_DATABASE_CLEANUP, "cleanup"); - worker_register_job_name(ACLK_DATABASE_DELETE_HOST, "node delete"); worker_register_job_name(ACLK_DATABASE_NODE_STATE, "node state"); worker_register_job_name(ACLK_DATABASE_PUSH_ALERT, "alert push"); worker_register_job_name(ACLK_DATABASE_PUSH_ALERT_CONFIG, "alert conf push"); - worker_register_job_name(ACLK_DATABASE_PUSH_ALERT_CHECKPOINT,"alert checkpoint"); - worker_register_job_name(ACLK_DATABASE_PUSH_ALERT_SNAPSHOT, "alert snapshot"); - worker_register_job_name(ACLK_DATABASE_QUEUE_REMOVED_ALERTS, "alerts check"); worker_register_job_name(ACLK_DATABASE_TIMER, "timer"); uv_loop_t *loop = &config->loop; @@ -401,9 +292,10 @@ static void aclk_synchronization(void *arg __maybe_unused) netdata_log_info("Starting ACLK synchronization thread"); - config->cleanup_after = now_realtime_sec() + ACLK_DATABASE_CLEANUP_FIRST; config->initialized = true; + sql_delete_aclk_table_list(); + while (likely(service_running(SERVICE_ACLKSYNC))) { enum aclk_database_opcode opcode; worker_is_idle(); @@ -422,26 +314,17 @@ static void aclk_synchronization(void *arg __maybe_unused) worker_is_busy(opcode); switch (opcode) { + default: case ACLK_DATABASE_NOOP: /* the command queue was empty, do nothing */ break; -// MAINTENANCE - case ACLK_DATABASE_CLEANUP: - // Scan all aclk_alert_ tables and cleanup as needed - sql_maint_aclk_sync_database_all(); - sql_check_aclk_table_list(); - break; - - case ACLK_DATABASE_DELETE_HOST: - sql_delete_aclk_table_list(cmd.param[0]); - break; // NODE STATE case ACLK_DATABASE_NODE_STATE:; RRDHOST *host = cmd.param[0]; int live = (host == localhost || host->receiver || !(rrdhost_flag_check(host, RRDHOST_FLAG_ORPHAN))) ? 1 : 0; struct aclk_sync_cfg_t *ahc = host->aclk_config; if (unlikely(!ahc)) - sql_create_aclk_table(host, &host->host_uuid, host->node_id); + create_aclk_config(host, &host->host_uuid, host->node_id); aclk_host_state_update(host, live, 1); break; case ACLK_DATABASE_NODE_UNREGISTER: @@ -455,17 +338,7 @@ static void aclk_synchronization(void *arg __maybe_unused) case ACLK_DATABASE_PUSH_ALERT: aclk_push_alert_events_for_all_hosts(); break; - case ACLK_DATABASE_PUSH_ALERT_SNAPSHOT:; - aclk_push_alert_snapshot_event(cmd.param[0]); - break; - case ACLK_DATABASE_QUEUE_REMOVED_ALERTS: - sql_process_queue_removed_alerts_to_aclk(cmd.param[0]); - break; - default: - break; } - if (cmd.completion) - completion_mark_complete(cmd.completion); } while (opcode != ACLK_DATABASE_NOOP); } @@ -489,39 +362,11 @@ static void aclk_synchronization_init(void) // ------------------------------------------------------------- -void sql_create_aclk_table(RRDHOST *host __maybe_unused, nd_uuid_t *host_uuid __maybe_unused, nd_uuid_t *node_id __maybe_unused) +void create_aclk_config(RRDHOST *host __maybe_unused, nd_uuid_t *host_uuid __maybe_unused, nd_uuid_t *node_id __maybe_unused) { #ifdef ENABLE_ACLK - char uuid_str[UUID_STR_LEN]; - char host_guid[UUID_STR_LEN]; - int rc; - - uuid_unparse_lower_fix(host_uuid, uuid_str); - uuid_unparse_lower(*host_uuid, host_guid); - - char sql[ACLK_SYNC_QUERY_SIZE]; - - snprintfz(sql, sizeof(sql) - 1, TABLE_ACLK_ALERT, uuid_str); - rc = db_execute(db_meta, sql); - if (unlikely(rc)) - error_report("Failed to create ACLK alert table for host %s", host ? rrdhost_hostname(host) : host_guid); - else { - snprintfz(sql, sizeof(sql) - 1, INDEX_ACLK_ALERT1, uuid_str, uuid_str); - rc = db_execute(db_meta, sql); - if (unlikely(rc)) - error_report( - "Failed to create ACLK alert table index 1 for host %s", host ? string2str(host->hostname) : host_guid); - - snprintfz(sql, sizeof(sql) - 1, INDEX_ACLK_ALERT2, uuid_str, uuid_str); - rc = db_execute(db_meta, sql); - if (unlikely(rc)) - error_report( - "Failed to create ACLK alert table index 2 for host %s", host ? string2str(host->hostname) : host_guid); - } - if (likely(host) && unlikely(host->aclk_config)) - return; - if (unlikely(!host)) + if (!host || host->aclk_config) return; struct aclk_sync_cfg_t *wc = callocz(1, sizeof(struct aclk_sync_cfg_t)); @@ -535,8 +380,7 @@ void sql_create_aclk_table(RRDHOST *host __maybe_unused, nd_uuid_t *host_uuid __ } wc->host = host; - strcpy(wc->uuid_str, uuid_str); - wc->alert_updates = 0; + wc->stream_alerts = false; time_t now = now_realtime_sec(); wc->node_info_send_time = (host == localhost || NULL == localhost) ? now - 25 : now; #endif @@ -579,7 +423,7 @@ void sql_aclk_sync_init(void) if (!number_of_children) aclk_queue_node_info(localhost, true); - rc = sqlite3_exec_monitored(db_meta, SQL_FETCH_ALL_INSTANCES,aclk_config_parameters, NULL,&err_msg); + rc = sqlite3_exec_monitored(db_meta, SQL_FETCH_ALL_INSTANCES, aclk_config_parameters, NULL, &err_msg); if (rc != SQLITE_OK) { error_report("SQLite error when configuring host ACLK synchonization parameters, rc = %d (%s)", rc, err_msg); @@ -591,15 +435,12 @@ void sql_aclk_sync_init(void) #endif } -// Public - static inline void queue_aclk_sync_cmd(enum aclk_database_opcode opcode, const void *param0, const void *param1) { struct aclk_database_cmd cmd; cmd.opcode = opcode; cmd.param[0] = (void *) param0; cmd.param[1] = (void *) param1; - cmd.completion = NULL; aclk_database_enq_cmd(&cmd); } @@ -612,35 +453,12 @@ void aclk_push_alert_config(const char *node_id, const char *config_hash) queue_aclk_sync_cmd(ACLK_DATABASE_PUSH_ALERT_CONFIG, strdupz(node_id), strdupz(config_hash)); } -void aclk_push_node_alert_snapshot(const char *node_id) -{ - if (unlikely(!aclk_sync_config.initialized)) - return; - - queue_aclk_sync_cmd(ACLK_DATABASE_PUSH_ALERT_SNAPSHOT, strdupz(node_id), NULL); -} - - -void aclk_push_node_removed_alerts(const char *node_id) -{ - if (unlikely(!aclk_sync_config.initialized)) - return; - - queue_aclk_sync_cmd(ACLK_DATABASE_QUEUE_REMOVED_ALERTS, strdupz(node_id), NULL); -} - void schedule_node_info_update(RRDHOST *host __maybe_unused) { #ifdef ENABLE_ACLK if (unlikely(!host)) return; - - struct aclk_database_cmd cmd; - memset(&cmd, 0, sizeof(cmd)); - cmd.opcode = ACLK_DATABASE_NODE_STATE; - cmd.param[0] = host; - cmd.completion = NULL; - aclk_database_enq_cmd(&cmd); + queue_aclk_sync_cmd(ACLK_DATABASE_NODE_STATE, host, NULL); #endif } @@ -649,12 +467,6 @@ void unregister_node(const char *machine_guid) { if (unlikely(!machine_guid)) return; - - struct aclk_database_cmd cmd; - memset(&cmd, 0, sizeof(cmd)); - cmd.opcode = ACLK_DATABASE_NODE_UNREGISTER; - cmd.param[0] = strdupz(machine_guid); - cmd.completion = NULL; - aclk_database_enq_cmd(&cmd); + queue_aclk_sync_cmd(ACLK_DATABASE_NODE_UNREGISTER, strdupz(machine_guid), NULL); } #endif diff --git a/src/database/sqlite/sqlite_aclk.h b/src/database/sqlite/sqlite_aclk.h index ce9fed840..ec8cfa9dd 100644 --- a/src/database/sqlite/sqlite_aclk.h +++ b/src/database/sqlite/sqlite_aclk.h @@ -3,21 +3,9 @@ #ifndef NETDATA_SQLITE_ACLK_H #define NETDATA_SQLITE_ACLK_H -#define ACLK_MAX_ALERT_UPDATES "5" -#define ACLK_DATABASE_CLEANUP_FIRST (1200) -#define ACLK_DATABASE_CLEANUP_INTERVAL (3600) -#define ACLK_DELETE_ACK_ALERTS_INTERNAL (86400) +#define ACLK_MAX_ALERT_UPDATES "50" #define ACLK_SYNC_QUERY_SIZE 512 -static inline void uuid_unparse_lower_fix(nd_uuid_t *uuid, char *out) -{ - uuid_unparse_lower(*uuid, out); - out[8] = '_'; - out[13] = '_'; - out[18] = '_'; - out[23] = '_'; -} - static inline int uuid_parse_fix(char *in, nd_uuid_t uuid) { in[8] = '-'; @@ -32,25 +20,11 @@ static inline int claimed() return localhost->aclk_state.claimed_id != NULL; } -#define TABLE_ACLK_ALERT \ - "CREATE TABLE IF NOT EXISTS aclk_alert_%s (sequence_id INTEGER PRIMARY KEY, " \ - "alert_unique_id, date_created, date_submitted, date_cloud_ack, filtered_alert_unique_id NOT NULL, " \ - "UNIQUE(alert_unique_id))" - -#define INDEX_ACLK_ALERT1 "CREATE INDEX IF NOT EXISTS aclk_alert_index1_%s ON aclk_alert_%s (filtered_alert_unique_id)" -#define INDEX_ACLK_ALERT2 "CREATE INDEX IF NOT EXISTS aclk_alert_index2_%s ON aclk_alert_%s (date_submitted)" - enum aclk_database_opcode { ACLK_DATABASE_NOOP = 0, - - ACLK_DATABASE_CLEANUP, - ACLK_DATABASE_DELETE_HOST, ACLK_DATABASE_NODE_STATE, ACLK_DATABASE_PUSH_ALERT, ACLK_DATABASE_PUSH_ALERT_CONFIG, - ACLK_DATABASE_PUSH_ALERT_SNAPSHOT, - ACLK_DATABASE_PUSH_ALERT_CHECKPOINT, - ACLK_DATABASE_QUEUE_REMOVED_ALERTS, ACLK_DATABASE_NODE_UNREGISTER, ACLK_DATABASE_TIMER, @@ -62,29 +36,25 @@ enum aclk_database_opcode { struct aclk_database_cmd { enum aclk_database_opcode opcode; void *param[2]; - struct completion *completion; struct aclk_database_cmd *prev, *next; }; typedef struct aclk_sync_cfg_t { RRDHOST *host; - int alert_updates; - int alert_checkpoint_req; - int alert_queue_removed; + int8_t send_snapshot; + bool stream_alerts; + int alert_count; + int snapshot_count; + int checkpoint_count; time_t node_info_send_time; time_t node_collectors_send; - char uuid_str[UUID_STR_LEN]; char node_id[UUID_STR_LEN]; char *alerts_snapshot_uuid; // will contain the snapshot_uuid value if snapshot was requested - uint64_t alerts_log_first_sequence_id; - uint64_t alerts_log_last_sequence_id; } aclk_sync_cfg_t; -void sql_create_aclk_table(RRDHOST *host, nd_uuid_t *host_uuid, nd_uuid_t *node_id); +void create_aclk_config(RRDHOST *host, nd_uuid_t *host_uuid, nd_uuid_t *node_id); void sql_aclk_sync_init(void); void aclk_push_alert_config(const char *node_id, const char *config_hash); -void aclk_push_node_alert_snapshot(const char *node_id); -void aclk_push_node_removed_alerts(const char *node_id); void schedule_node_info_update(RRDHOST *host); #ifdef ENABLE_ACLK void unregister_node(const char *machine_guid); diff --git a/src/database/sqlite/sqlite_aclk_alert.c b/src/database/sqlite/sqlite_aclk_alert.c index 0982d32bd..3e7076169 100644 --- a/src/database/sqlite/sqlite_aclk_alert.c +++ b/src/database/sqlite/sqlite_aclk_alert.c @@ -5,7 +5,6 @@ #ifdef ENABLE_ACLK #include "../../aclk/aclk_alarm_api.h" -#endif #define SQLITE3_COLUMN_STRDUPZ_OR_NULL(res, param) \ ({ \ @@ -13,33 +12,6 @@ sqlite3_column_bytes((res), (_param)) ? strdupz((char *)sqlite3_column_text((res), (_param))) : NULL; \ }) -#define SQL_UPDATE_FILTERED_ALERT \ - "UPDATE aclk_alert_%s SET filtered_alert_unique_id = @new_alert, date_created = UNIXEPOCH() " \ - "WHERE filtered_alert_unique_id = @old_alert" - -static void update_filtered(ALARM_ENTRY *ae, int64_t unique_id, char *uuid_str) -{ - sqlite3_stmt *res = NULL; - - char sql[ACLK_SYNC_QUERY_SIZE]; - snprintfz(sql, sizeof(sql) - 1, SQL_UPDATE_FILTERED_ALERT, uuid_str); - - if (!PREPARE_STATEMENT(db_meta, sql, &res)) - return; - - int param = 0; - SQLITE_BIND_FAIL(done, sqlite3_bind_int64(res, ++param, ae->unique_id)); - SQLITE_BIND_FAIL(done, sqlite3_bind_int64(res, ++param, unique_id)); - - param = 0; - if (likely(sqlite3_step_monitored(res) == SQLITE_DONE)) - ae->flags |= HEALTH_ENTRY_FLAG_ACLK_QUEUED; - -done: - REPORT_BIND_FAIL(res, param); - SQLITE_FINALIZE(res); -} - #define SQL_SELECT_VARIABLE_ALERT_BY_UNIQUE_ID \ "SELECT hld.unique_id FROM health_log hl, alert_hash ah, health_log_detail hld " \ "WHERE hld.unique_id = @unique_id AND hl.config_hash_id = ah.hash_id AND hld.health_log_id = hl.health_log_id " \ @@ -47,9 +19,9 @@ done: static inline bool is_event_from_alert_variable_config(int64_t unique_id, nd_uuid_t *host_id) { - sqlite3_stmt *res = NULL; + static __thread sqlite3_stmt *res = NULL; - if (!PREPARE_STATEMENT(db_meta, SQL_SELECT_VARIABLE_ALERT_BY_UNIQUE_ID, &res)) + if (!PREPARE_COMPILED_STATEMENT(db_meta, SQL_SELECT_VARIABLE_ALERT_BY_UNIQUE_ID, &res)) return false; bool ret = false; @@ -63,115 +35,141 @@ static inline bool is_event_from_alert_variable_config(int64_t unique_id, nd_uui done: REPORT_BIND_FAIL(res, param); - SQLITE_FINALIZE(res); + SQLITE_RESET(res); return ret; } #define MAX_REMOVED_PERIOD 604800 //a week -//decide if some events should be sent or not -#define SQL_SELECT_ALERT_BY_ID \ - "SELECT hld.new_status, hl.config_hash_id, hld.unique_id FROM health_log hl, aclk_alert_%s aa, health_log_detail hld " \ - "WHERE hl.host_id = @host_id AND hld.unique_id = aa.filtered_alert_unique_id " \ - "AND hld.alarm_id = @alarm_id AND hl.health_log_id = hld.health_log_id " \ - "ORDER BY hld.rowid DESC LIMIT 1" +#define SQL_UPDATE_ALERT_VERSION_TRANSITION \ + "UPDATE alert_version SET unique_id = @unique_id WHERE health_log_id = @health_log_id" -static bool should_send_to_cloud(RRDHOST *host, ALARM_ENTRY *ae) +static void update_alert_version_transition(int64_t health_log_id, int64_t unique_id) { - sqlite3_stmt *res = NULL; + static __thread sqlite3_stmt *res = NULL; - if (ae->new_status == RRDCALC_STATUS_UNINITIALIZED || - (ae->new_status == RRDCALC_STATUS_REMOVED && - !(ae->old_status == RRDCALC_STATUS_WARNING || ae->old_status == RRDCALC_STATUS_CRITICAL))) - return 0; + if (!PREPARE_COMPILED_STATEMENT(db_meta, SQL_UPDATE_ALERT_VERSION_TRANSITION, &res)) + return; - if (unlikely(uuid_is_null(ae->config_hash_id) || !host->aclk_config)) - return 0; + int param = 0; + SQLITE_BIND_FAIL(done, sqlite3_bind_int64(res, ++param, unique_id)); + SQLITE_BIND_FAIL(done, sqlite3_bind_int64(res, ++param, health_log_id)); + + param = 0; + int rc = sqlite3_step_monitored(res); + if (rc != SQLITE_DONE) + error_report("Failed to update alert_version to latest transition"); + +done: + REPORT_BIND_FAIL(res, param); + SQLITE_RESET(res); +} - char sql[ACLK_SYNC_QUERY_SIZE]; +//decide if some events should be sent or not + +#define SQL_SELECT_LAST_ALERT_STATUS "SELECT status FROM alert_version WHERE health_log_id = @health_log_id " - //get the previous sent event of this alarm_id - //base the search on the last filtered event - snprintfz(sql, sizeof(sql) - 1, SQL_SELECT_ALERT_BY_ID, host->aclk_config->uuid_str); +static bool cloud_status_matches(int64_t health_log_id, RRDCALC_STATUS status) +{ + static __thread sqlite3_stmt *res = NULL; - if (!PREPARE_STATEMENT(db_meta, sql, &res)) + if (!PREPARE_COMPILED_STATEMENT(db_meta, SQL_SELECT_LAST_ALERT_STATUS, &res)) return true; bool send = false; int param = 0; - SQLITE_BIND_FAIL(done, sqlite3_bind_blob(res, ++param, &host->host_uuid, sizeof(host->host_uuid), SQLITE_STATIC)); - SQLITE_BIND_FAIL(done, sqlite3_bind_int(res, ++param, (int) ae->alarm_id)); + SQLITE_BIND_FAIL(done, sqlite3_bind_int(res, ++param, health_log_id)); param = 0; int rc = sqlite3_step_monitored(res); if (likely(rc == SQLITE_ROW)) { - nd_uuid_t config_hash_id; - RRDCALC_STATUS status = (RRDCALC_STATUS)sqlite3_column_int(res, 0); - - if (sqlite3_column_type(res, 1) != SQLITE_NULL) - uuid_copy(config_hash_id, *((nd_uuid_t *)sqlite3_column_blob(res, 1))); - - int64_t unique_id = sqlite3_column_int64(res, 2); - - if (ae->new_status != (RRDCALC_STATUS)status || !uuid_eq(ae->config_hash_id, config_hash_id)) - send = true; - else - update_filtered(ae, unique_id, host->aclk_config->uuid_str); - } else - send = true; + RRDCALC_STATUS current_status = (RRDCALC_STATUS)sqlite3_column_int(res, 0); + send = (current_status == status); + } done: REPORT_BIND_FAIL(res, param); - SQLITE_FINALIZE(res); + SQLITE_RESET(res); return send; } #define SQL_QUEUE_ALERT_TO_CLOUD \ - "INSERT INTO aclk_alert_%s (alert_unique_id, date_created, filtered_alert_unique_id) " \ - "VALUES (@alert_unique_id, UNIXEPOCH(), @alert_unique_id) ON CONFLICT (alert_unique_id) DO NOTHING" - -void sql_queue_alarm_to_aclk(RRDHOST *host, ALARM_ENTRY *ae, bool skip_filter) + "INSERT INTO aclk_queue (host_id, health_log_id, unique_id, date_created)" \ + " VALUES (@host_id, @health_log_id, @unique_id, UNIXEPOCH())" \ + " ON CONFLICT(host_id, health_log_id) DO UPDATE SET unique_id=excluded.unique_id, " \ + " date_created=excluded.date_created" + +// +// Attempt to insert an alert to the submit queue to reach the cloud +// +// The alert will NOT be added in the submit queue if +// - Cloud is already aware of the alert status +// - The transition refers to a variable +// +static int insert_alert_to_submit_queue(RRDHOST *host, int64_t health_log_id, uint32_t unique_id, RRDCALC_STATUS status) { - sqlite3_stmt *res = NULL; - char sql[ACLK_SYNC_QUERY_SIZE]; + static __thread sqlite3_stmt *res = NULL; - if (!service_running(SERVICE_ACLK)) - return; + if (cloud_status_matches(health_log_id, status)) { + update_alert_version_transition(health_log_id, unique_id); + return 1; + } - if (!claimed() || ae->flags & HEALTH_ENTRY_FLAG_ACLK_QUEUED) - return; + if (is_event_from_alert_variable_config(unique_id, &host->host_uuid)) + return 2; - if (false == skip_filter && !should_send_to_cloud(host, ae)) - return; + if (!PREPARE_COMPILED_STATEMENT(db_meta, SQL_QUEUE_ALERT_TO_CLOUD, &res)) + return -1; - if (is_event_from_alert_variable_config(ae->unique_id, &host->host_uuid)) - return; + int param = 0; + SQLITE_BIND_FAIL(done, sqlite3_bind_blob(res, ++param, &host->host_uuid, sizeof(host->host_uuid), SQLITE_STATIC)); + SQLITE_BIND_FAIL(done, sqlite3_bind_int64(res, ++param, health_log_id)); + SQLITE_BIND_FAIL(done, sqlite3_bind_int64(res, ++param, (int64_t) unique_id)); - snprintfz(sql, sizeof(sql) - 1, SQL_QUEUE_ALERT_TO_CLOUD, host->aclk_config->uuid_str); + param = 0; + int rc = execute_insert(res); + if (unlikely(rc != SQLITE_DONE)) + error_report("Failed to insert alert in the submit queue %"PRIu32", rc = %d", unique_id, rc); - if (!PREPARE_STATEMENT(db_meta, sql, &res)) - return; +done: + REPORT_BIND_FAIL(res, param); + SQLITE_RESET(res); + return 0; +} + +#define SQL_DELETE_QUEUE_ALERT_TO_CLOUD \ + "DELETE FROM aclk_queue WHERE host_id = @host_id AND sequence_id BETWEEN @seq1 AND @seq2" + +// +// Delete a range of alerts from the submit queue (after being sent to the the cloud) +// +static int delete_alert_from_submit_queue(RRDHOST *host, int64_t first_seq_id, int64_t last_seq_id) +{ + static __thread sqlite3_stmt *res = NULL; + + if (!PREPARE_COMPILED_STATEMENT(db_meta, SQL_DELETE_QUEUE_ALERT_TO_CLOUD, &res)) + return -1; int param = 0; - SQLITE_BIND_FAIL(done, sqlite3_bind_int64(res, ++param, ae->unique_id)); + SQLITE_BIND_FAIL(done, sqlite3_bind_blob(res, ++param, &host->host_uuid, sizeof(host->host_uuid), SQLITE_STATIC)); + SQLITE_BIND_FAIL(done, sqlite3_bind_int64(res, ++param, first_seq_id)); + SQLITE_BIND_FAIL(done, sqlite3_bind_int64(res, ++param, last_seq_id)); param = 0; - int rc = execute_insert(res); - if (unlikely(rc == SQLITE_DONE)) { - ae->flags |= HEALTH_ENTRY_FLAG_ACLK_QUEUED; - rrdhost_flag_set(host, RRDHOST_FLAG_ACLK_STREAM_ALERTS); - } else - error_report("Failed to store alert event %"PRIu32", rc = %d", ae->unique_id, rc); + int rc = sqlite3_step_monitored(res); + if (rc != SQLITE_DONE) + error_report("Failed to delete submitted to ACLK"); done: REPORT_BIND_FAIL(res, param); - SQLITE_FINALIZE(res); + SQLITE_RESET(res); + return 0; } int rrdcalc_status_to_proto_enum(RRDCALC_STATUS status) { -#ifdef ENABLE_ACLK + switch(status) { case RRDCALC_STATUS_REMOVED: return ALARM_STATUS_REMOVED; @@ -191,10 +189,6 @@ int rrdcalc_status_to_proto_enum(RRDCALC_STATUS status) default: return ALARM_STATUS_UNKNOWN; } -#else - UNUSED(status); - return 1; -#endif } static inline char *sqlite3_uuid_unparse_strdupz(sqlite3_stmt *res, int iCol) { @@ -219,245 +213,437 @@ static inline char *sqlite3_text_strdupz_empty(sqlite3_stmt *res, int iCol) { return strdupz(ret); } +#define SQL_UPDATE_ALERT_VERSION \ + "INSERT INTO alert_version (health_log_id, unique_id, status, version, date_submitted)" \ + " VALUES (@health_log_id, @unique_id, @status, @version, UNIXEPOCH())" \ + " ON CONFLICT(health_log_id) DO UPDATE SET status = excluded.status, version = excluded.version, " \ + " unique_id=excluded.unique_id, date_submitted=excluded.date_submitted" + +// +// Store a new alert transition along with the version after sending to the cloud +// - Update an existing alert with the updated version, status, transition and date submitted +// +static void sql_update_alert_version(int64_t health_log_id, int64_t unique_id, RRDCALC_STATUS status, uint64_t version) +{ + static __thread sqlite3_stmt *res = NULL; + + if (!PREPARE_COMPILED_STATEMENT(db_meta, SQL_UPDATE_ALERT_VERSION, &res)) + return; + + int param = 0; + SQLITE_BIND_FAIL(done, sqlite3_bind_int64(res, ++param, health_log_id)); + SQLITE_BIND_FAIL(done, sqlite3_bind_int64(res, ++param, unique_id)); + SQLITE_BIND_FAIL(done, sqlite3_bind_int(res, ++param, status)); + SQLITE_BIND_FAIL(done, sqlite3_bind_int64(res, ++param, version)); + + param = 0; + int rc = sqlite3_step_monitored(res); + if (rc != SQLITE_DONE) + error_report("Failed to execute sql_update_alert_version"); + +done: + REPORT_BIND_FAIL(res, param); + SQLITE_RESET(res); +} -static void aclk_push_alert_event(struct aclk_sync_cfg_t *wc __maybe_unused) +#define SQL_SELECT_ALERT_TO_DUMMY \ + "SELECT aq.sequence_id, hld.unique_id, hld.when_key, hld.new_status, hld.health_log_id" \ + " FROM health_log hl, aclk_queue aq, alert_hash ah, health_log_detail hld" \ + " WHERE hld.unique_id = aq.unique_id AND hl.config_hash_id = ah.hash_id" \ + " AND hl.host_id = @host_id AND aq.host_id = hl.host_id AND hl.health_log_id = hld.health_log_id" \ + " ORDER BY aq.sequence_id ASC" + +// +// Check all queued alerts for a host and commit them as if they have been send to the cloud +// this will produce new versions as needed. We need this because we are about to send a +// a snapshot so we can include the latest transition. +// +static void commit_alert_events(RRDHOST *host) { -#ifdef ENABLE_ACLK - int rc; + sqlite3_stmt *res = NULL; - if (unlikely(!wc->alert_updates)) { - nd_log(NDLS_ACCESS, NDLP_NOTICE, - "ACLK STA [%s (%s)]: Ignoring alert push event, updates have been turned off for this node.", - wc->node_id, - wc->host ? rrdhost_hostname(wc->host) : "N/A"); + if (!PREPARE_STATEMENT(db_meta, SQL_SELECT_ALERT_TO_DUMMY, &res)) return; + + int param = 0; + SQLITE_BIND_FAIL(done, sqlite3_bind_blob(res, ++param, &host->host_uuid, sizeof(host->host_uuid), SQLITE_STATIC)); + + int64_t first_sequence_id = 0; + int64_t last_sequence_id = 0; + + param = 0; + while (sqlite3_step_monitored(res) == SQLITE_ROW) { + + last_sequence_id = sqlite3_column_int64(res, 0); + if (first_sequence_id == 0) + first_sequence_id = last_sequence_id; + + int64_t unique_id = sqlite3_column_int(res, 1); + int64_t version = sqlite3_column_int64(res, 2); + RRDCALC_STATUS status = (RRDCALC_STATUS)sqlite3_column_int(res, 3); + int64_t health_log_id = sqlite3_column_int64(res, 4); + + sql_update_alert_version(health_log_id, unique_id, status, version); } + if (first_sequence_id) + delete_alert_from_submit_queue(host, first_sequence_id, last_sequence_id); + +done: + REPORT_BIND_FAIL(res, param); + SQLITE_FINALIZE(res); +} + +typedef enum { + SEQUENCE_ID, + UNIQUE_ID, + ALARM_ID, + CONFIG_HASH_ID, + UPDATED_BY_ID, + WHEN_KEY, + DURATION, + NON_CLEAR_DURATION, + FLAGS, + EXEC_RUN_TIMESTAMP, + DELAY_UP_TO_TIMESTAMP, + NAME, + CHART, + EXEC, + RECIPIENT, + SOURCE, + UNITS, + INFO, + EXEC_CODE, + NEW_STATUS, + OLD_STATUS, + DELAY, + NEW_VALUE, + OLD_VALUE, + LAST_REPEAT, + CHART_CONTEXT, + TRANSITION_ID, + ALARM_EVENT_ID, + CHART_NAME, + SUMMARY, + HEALTH_LOG_ID, + VERSION +} HealthLogDetails; + +void health_alarm_log_populate( + struct alarm_log_entry *alarm_log, + sqlite3_stmt *res, + RRDHOST *host, + RRDCALC_STATUS *status) +{ + char old_value_string[100 + 1]; + char new_value_string[100 + 1]; + + RRDCALC_STATUS current_status = (RRDCALC_STATUS)sqlite3_column_int(res, NEW_STATUS); + if (status) + *status = current_status; + + char *source = (char *) sqlite3_column_text(res, SOURCE); + alarm_log->command = source ? health_edit_command_from_source(source) : strdupz("UNKNOWN=0=UNKNOWN"); + + alarm_log->chart = strdupz((char *) sqlite3_column_text(res, CHART)); + alarm_log->name = strdupz((char *) sqlite3_column_text(res, NAME)); + + alarm_log->when = sqlite3_column_int64(res, WHEN_KEY); + + alarm_log->config_hash = sqlite3_uuid_unparse_strdupz(res, CONFIG_HASH_ID); + + alarm_log->utc_offset = host->utc_offset; + alarm_log->timezone = strdupz(rrdhost_abbrev_timezone(host)); + alarm_log->exec_path = sqlite3_column_bytes(res, EXEC) ? + strdupz((char *)sqlite3_column_text(res, EXEC)) : + strdupz((char *)string2str(host->health.health_default_exec)); + + alarm_log->conf_source = source ? strdupz(source) : strdupz(""); + + time_t duration = sqlite3_column_int64(res, DURATION); + alarm_log->duration = (duration > 0) ? duration : 0; + + alarm_log->non_clear_duration = sqlite3_column_int64(res, NON_CLEAR_DURATION); + + alarm_log->status = rrdcalc_status_to_proto_enum(current_status); + alarm_log->old_status = rrdcalc_status_to_proto_enum((RRDCALC_STATUS)sqlite3_column_int64(res, OLD_STATUS)); + alarm_log->delay = sqlite3_column_int64(res, DELAY); + alarm_log->delay_up_to_timestamp = sqlite3_column_int64(res, DELAY_UP_TO_TIMESTAMP); + alarm_log->last_repeat = sqlite3_column_int64(res, LAST_REPEAT); + + uint64_t flags = sqlite3_column_int64(res, FLAGS); + char *recipient = (char *) sqlite3_column_text(res, RECIPIENT); + alarm_log->silenced = + ((flags & HEALTH_ENTRY_FLAG_SILENCED) || (recipient && !strncmp(recipient, "silent", 6))) ? 1 : 0; + + double value = sqlite3_column_double(res, NEW_VALUE); + double old_value = sqlite3_column_double(res, OLD_VALUE); + + alarm_log->value_string = + sqlite3_column_type(res, NEW_VALUE) == SQLITE_NULL ? + strdupz((char *)"-") : + strdupz((char *)format_value_and_unit( + new_value_string, 100, value, (char *)sqlite3_column_text(res, UNITS), -1)); + + alarm_log->old_value_string = + sqlite3_column_type(res, OLD_VALUE) == SQLITE_NULL ? + strdupz((char *)"-") : + strdupz((char *)format_value_and_unit( + old_value_string, 100, old_value, (char *)sqlite3_column_text(res, UNITS), -1)); + + alarm_log->value = (!isnan(value)) ? (NETDATA_DOUBLE)value : 0; + alarm_log->old_value = (!isnan(old_value)) ? (NETDATA_DOUBLE)old_value : 0; + + alarm_log->updated = (flags & HEALTH_ENTRY_FLAG_UPDATED) ? 1 : 0; + alarm_log->rendered_info = sqlite3_text_strdupz_empty(res, INFO); + alarm_log->chart_context = sqlite3_text_strdupz_empty(res, CHART_CONTEXT); + alarm_log->chart_name = sqlite3_text_strdupz_empty(res, CHART_NAME); + + alarm_log->transition_id = sqlite3_uuid_unparse_strdupz(res, TRANSITION_ID); + alarm_log->event_id = sqlite3_column_int64(res, ALARM_EVENT_ID); + alarm_log->version = sqlite3_column_int64(res, VERSION); + + alarm_log->summary = sqlite3_text_strdupz_empty(res, SUMMARY); + + alarm_log->health_log_id = sqlite3_column_int64(res, HEALTH_LOG_ID); + alarm_log->unique_id = sqlite3_column_int64(res, UNIQUE_ID); + alarm_log->alarm_id = sqlite3_column_int64(res, ALARM_ID); + alarm_log->sequence_id = sqlite3_column_int64(res, SEQUENCE_ID); +} + +#define SQL_SELECT_ALERT_TO_PUSH \ + "SELECT aq.sequence_id, hld.unique_id, hld.alarm_id, hl.config_hash_id, hld.updated_by_id, hld.when_key," \ + " hld.duration, hld.non_clear_duration, hld.flags, hld.exec_run_timestamp, hld.delay_up_to_timestamp, hl.name," \ + " hl.chart, hl.exec, hl.recipient, ah.source, hl.units, hld.info, hld.exec_code, hld.new_status," \ + " hld.old_status, hld.delay, hld.new_value, hld.old_value, hld.last_repeat, hl.chart_context, hld.transition_id," \ + " hld.alarm_event_id, hl.chart_name, hld.summary, hld.health_log_id, hld.when_key" \ + " FROM health_log hl, aclk_queue aq, alert_hash ah, health_log_detail hld" \ + " WHERE hld.unique_id = aq.unique_id AND hl.config_hash_id = ah.hash_id" \ + " AND hl.host_id = @host_id AND aq.host_id = hl.host_id AND hl.health_log_id = hld.health_log_id" \ + " ORDER BY aq.sequence_id ASC LIMIT "ACLK_MAX_ALERT_UPDATES + +static void aclk_push_alert_event(RRDHOST *host __maybe_unused) +{ + char *claim_id = get_agent_claimid(); - if (unlikely(!claim_id)) + if (!claim_id || !host->node_id) return; - if (unlikely(!wc->host)) { + sqlite3_stmt *res = NULL; + + if (!PREPARE_STATEMENT(db_meta, SQL_SELECT_ALERT_TO_PUSH, &res)) { freez(claim_id); return; } - BUFFER *sql = buffer_create(1024, &netdata_buffers_statistics.buffers_sqlite); - - sqlite3_stmt *res = NULL; + int param = 0; + SQLITE_BIND_FAIL(done, sqlite3_bind_blob(res, ++param, &host->host_uuid, sizeof(host->host_uuid), SQLITE_STATIC)); - buffer_sprintf( - sql, - "SELECT aa.sequence_id, hld.unique_id, hld.alarm_id, hl.config_hash_id, hld.updated_by_id, hld.when_key, " - " hld.duration, hld.non_clear_duration, hld.flags, hld.exec_run_timestamp, hld.delay_up_to_timestamp, hl.name, " - " hl.chart, hl.exec, hl.recipient, ha.source, hl.units, hld.info, hld.exec_code, hld.new_status, " - " hld.old_status, hld.delay, hld.new_value, hld.old_value, hld.last_repeat, hl.chart_context, hld.transition_id, " - " hld.alarm_event_id, hl.chart_name, hld.summary " - " FROM health_log hl, aclk_alert_%s aa, alert_hash ha, health_log_detail hld " - " WHERE hld.unique_id = aa.alert_unique_id AND hl.config_hash_id = ha.hash_id AND aa.date_submitted IS NULL " - " AND hl.host_id = @host_id AND hl.health_log_id = hld.health_log_id " - " ORDER BY aa.sequence_id ASC LIMIT "ACLK_MAX_ALERT_UPDATES, - wc->uuid_str); - - if (!PREPARE_STATEMENT(db_meta, buffer_tostring(sql), &res)) { - - BUFFER *sql_fix = buffer_create(1024, &netdata_buffers_statistics.buffers_sqlite); - buffer_sprintf(sql_fix, TABLE_ACLK_ALERT, wc->uuid_str); - - rc = db_execute(db_meta, buffer_tostring(sql_fix)); - if (unlikely(rc)) - error_report("Failed to create ACLK alert table for host %s", rrdhost_hostname(wc->host)); - buffer_free(sql_fix); - - // Try again - if (!PREPARE_STATEMENT(db_meta, buffer_tostring(sql), &res)) { - buffer_free(sql); - freez(claim_id); - return; - } - } + char node_id_str[UUID_STR_LEN]; + uuid_unparse_lower(*host->node_id, node_id_str); - rc = sqlite3_bind_blob(res, 1, &wc->host->host_uuid, sizeof(wc->host->host_uuid), SQLITE_STATIC); - if (unlikely(rc != SQLITE_OK)) { - error_report("Failed to bind host_id for pushing alert event."); - goto done; - } + struct alarm_log_entry alarm_log; + alarm_log.node_id = node_id_str; + alarm_log.claim_id = claim_id; - uint64_t first_sequence_id = 0; - uint64_t last_sequence_id = 0; + int64_t first_id = 0; + int64_t last_id = 0; + param = 0; + RRDCALC_STATUS status; + struct aclk_sync_cfg_t *wc = host->aclk_config; while (sqlite3_step_monitored(res) == SQLITE_ROW) { - struct alarm_log_entry alarm_log; - char old_value_string[100 + 1]; - char new_value_string[100 + 1]; - - alarm_log.node_id = wc->node_id; - alarm_log.claim_id = claim_id; - alarm_log.chart = strdupz((char *)sqlite3_column_text(res, 12)); - alarm_log.name = strdupz((char *)sqlite3_column_text(res, 11)); - alarm_log.when = (time_t) sqlite3_column_int64(res, 5); - alarm_log.config_hash = sqlite3_uuid_unparse_strdupz(res, 3); - alarm_log.utc_offset = wc->host->utc_offset; - alarm_log.timezone = strdupz(rrdhost_abbrev_timezone(wc->host)); - alarm_log.exec_path = sqlite3_column_bytes(res, 13) > 0 ? strdupz((char *)sqlite3_column_text(res, 13)) : - strdupz((char *)string2str(wc->host->health.health_default_exec)); - alarm_log.conf_source = sqlite3_column_bytes(res, 15) > 0 ? strdupz((char *)sqlite3_column_text(res, 15)) : strdupz(""); - - char *edit_command = sqlite3_column_bytes(res, 15) > 0 ? - health_edit_command_from_source((char *)sqlite3_column_text(res, 15)) : - strdupz("UNKNOWN=0=UNKNOWN"); - alarm_log.command = strdupz(edit_command); - - time_t duration = (time_t) sqlite3_column_int64(res, 6); - alarm_log.duration = (duration > 0) ? duration : 0; - alarm_log.non_clear_duration = (time_t) sqlite3_column_int64(res, 7); - alarm_log.status = rrdcalc_status_to_proto_enum((RRDCALC_STATUS) sqlite3_column_int(res, 19)); - alarm_log.old_status = rrdcalc_status_to_proto_enum((RRDCALC_STATUS) sqlite3_column_int(res, 20)); - alarm_log.delay = (int) sqlite3_column_int(res, 21); - alarm_log.delay_up_to_timestamp = (time_t) sqlite3_column_int64(res, 10); - alarm_log.last_repeat = (time_t) sqlite3_column_int64(res, 24); - alarm_log.silenced = ((sqlite3_column_int64(res, 8) & HEALTH_ENTRY_FLAG_SILENCED) || - (sqlite3_column_type(res, 14) != SQLITE_NULL && - !strncmp((char *)sqlite3_column_text(res, 14), "silent", 6))) ? - 1 : - 0; - alarm_log.value_string = - sqlite3_column_type(res, 22) == SQLITE_NULL ? - strdupz((char *)"-") : - strdupz((char *)format_value_and_unit( - new_value_string, 100, sqlite3_column_double(res, 22), (char *)sqlite3_column_text(res, 16), -1)); - alarm_log.old_value_string = - sqlite3_column_type(res, 23) == SQLITE_NULL ? - strdupz((char *)"-") : - strdupz((char *)format_value_and_unit( - old_value_string, 100, sqlite3_column_double(res, 23), (char *)sqlite3_column_text(res, 16), -1)); - alarm_log.value = (NETDATA_DOUBLE) sqlite3_column_double(res, 22); - alarm_log.old_value = (NETDATA_DOUBLE) sqlite3_column_double(res, 23); - alarm_log.updated = (sqlite3_column_int64(res, 8) & HEALTH_ENTRY_FLAG_UPDATED) ? 1 : 0; - alarm_log.rendered_info = sqlite3_text_strdupz_empty(res, 17); - alarm_log.chart_context = sqlite3_text_strdupz_empty(res, 25); - alarm_log.transition_id = sqlite3_uuid_unparse_strdupz(res, 26); - alarm_log.event_id = (time_t) sqlite3_column_int64(res, 27); - alarm_log.chart_name = sqlite3_text_strdupz_empty(res, 28); - alarm_log.summary = sqlite3_text_strdupz_empty(res, 29); - + health_alarm_log_populate(&alarm_log, res, host, &status); aclk_send_alarm_log_entry(&alarm_log); + wc->alert_count++; - if (first_sequence_id == 0) - first_sequence_id = (uint64_t) sqlite3_column_int64(res, 0); + last_id = alarm_log.sequence_id; + if (first_id == 0) + first_id = last_id; - if (wc->alerts_log_first_sequence_id == 0) - wc->alerts_log_first_sequence_id = (uint64_t) sqlite3_column_int64(res, 0); - - last_sequence_id = (uint64_t) sqlite3_column_int64(res, 0); - wc->alerts_log_last_sequence_id = (uint64_t) sqlite3_column_int64(res, 0); + sql_update_alert_version(alarm_log.health_log_id, alarm_log.unique_id, status, alarm_log.version); destroy_alarm_log_entry(&alarm_log); - freez(edit_command); } - if (first_sequence_id) { - buffer_flush(sql); - buffer_sprintf( - sql, - "UPDATE aclk_alert_%s SET date_submitted=unixepoch() " - "WHERE +date_submitted IS NULL AND sequence_id BETWEEN %" PRIu64 " AND %" PRIu64, - wc->uuid_str, - first_sequence_id, - last_sequence_id); - - if (unlikely(db_execute(db_meta, buffer_tostring(sql)))) - error_report("Failed to mark ACLK alert entries as submitted for host %s", rrdhost_hostname(wc->host)); - + if (first_id) { + nd_log( + NDLS_ACCESS, + NDLP_DEBUG, + "ACLK RES [%s (%s)]: ALERTS SENT from %ld - %ld", + node_id_str, + rrdhost_hostname(host), + first_id, + last_id); + + delete_alert_from_submit_queue(host, first_id, last_id); // Mark to do one more check - rrdhost_flag_set(wc->host, RRDHOST_FLAG_ACLK_STREAM_ALERTS); - - } else { - if (wc->alerts_log_first_sequence_id) - nd_log(NDLS_ACCESS, NDLP_DEBUG, - "ACLK RES [%s (%s)]: ALERTS SENT from %" PRIu64 " to %" PRIu64 "", - wc->node_id, - wc->host ? rrdhost_hostname(wc->host) : "N/A", - wc->alerts_log_first_sequence_id, - wc->alerts_log_last_sequence_id); - wc->alerts_log_first_sequence_id = 0; - wc->alerts_log_last_sequence_id = 0; + rrdhost_flag_set(host, RRDHOST_FLAG_ACLK_STREAM_ALERTS); } done: + REPORT_BIND_FAIL(res, param); SQLITE_FINALIZE(res); freez(claim_id); - buffer_free(sql); -#endif } -void aclk_push_alert_events_for_all_hosts(void) +#define SQL_DELETE_PROCESSED_ROWS \ + "DELETE FROM alert_queue WHERE host_id = @host_id AND rowid between @row1 AND @row2" + +static void delete_alert_from_pending_queue(RRDHOST *host, int64_t row1, int64_t row2) { - RRDHOST *host; + static __thread sqlite3_stmt *res = NULL; - dfe_start_reentrant(rrdhost_root_index, host) { - if (rrdhost_flag_check(host, RRDHOST_FLAG_ARCHIVED) || - !rrdhost_flag_check(host, RRDHOST_FLAG_ACLK_STREAM_ALERTS)) - continue; + if (!PREPARE_COMPILED_STATEMENT(db_meta, SQL_DELETE_PROCESSED_ROWS, &res)) + return; - rrdhost_flag_clear(host, RRDHOST_FLAG_ACLK_STREAM_ALERTS); + int param = 0; + SQLITE_BIND_FAIL(done, sqlite3_bind_blob(res, ++param, &host->host_uuid, sizeof(host->host_uuid), SQLITE_STATIC)); + SQLITE_BIND_FAIL(done, sqlite3_bind_int64(res, ++param, row1)); + SQLITE_BIND_FAIL(done, sqlite3_bind_int64(res, ++param, row2)); - struct aclk_sync_cfg_t *wc = host->aclk_config; - if (likely(wc)) - aclk_push_alert_event(wc); - } - dfe_done(host); + param = 0; + int rc = sqlite3_step_monitored(res); + if (rc != SQLITE_DONE) + error_report("Failed to delete processed rows, rc = %d", rc); + +done: + REPORT_BIND_FAIL(res, param); + SQLITE_RESET(res); } -void sql_queue_existing_alerts_to_aclk(RRDHOST *host) +#define SQL_REBUILD_HOST_ALERT_VERSION_TABLE \ + "INSERT INTO alert_version (health_log_id, unique_id, status, version, date_submitted) " \ + " SELECT hl.health_log_id, hld.unique_id, hld.new_status, hld.when_key, UNIXEPOCH() " \ + " FROM health_log hl, health_log_detail hld WHERE " \ + " hl.host_id = @host_id AND hld.health_log_id = hl.health_log_id AND hld.transition_id = hl.last_transition_id" + +#define SQL_DELETE_HOST_ALERT_VERSION_TABLE \ + "DELETE FROM alert_version WHERE health_log_id IN (SELECT health_log_id FROM health_log WHERE host_id = @host_id)" + +void rebuild_host_alert_version_table(RRDHOST *host) { sqlite3_stmt *res = NULL; - int rc; - struct aclk_sync_cfg_t *wc = host->aclk_config; + if (!PREPARE_STATEMENT(db_meta, SQL_DELETE_HOST_ALERT_VERSION_TABLE, &res)) + return; - BUFFER *sql = buffer_create(1024, &netdata_buffers_statistics.buffers_sqlite); + int param = 0; + SQLITE_BIND_FAIL(done, sqlite3_bind_blob(res, ++param, &host->host_uuid, sizeof(host->host_uuid), SQLITE_STATIC)); - rw_spinlock_write_lock(&host->health_log.spinlock); + param = 0; + int rc = execute_insert(res); + if (rc != SQLITE_DONE) { + netdata_log_error("Failed to delete the host alert version table"); + goto done; + } - buffer_sprintf(sql, "DELETE FROM aclk_alert_%s", wc->uuid_str); - if (unlikely(db_execute(db_meta, buffer_tostring(sql)))) - goto skip; + SQLITE_FINALIZE(res); + if (!PREPARE_STATEMENT(db_meta, SQL_REBUILD_HOST_ALERT_VERSION_TABLE, &res)) + return; + + SQLITE_BIND_FAIL(done, sqlite3_bind_blob(res, ++param, &host->host_uuid, sizeof(host->host_uuid), SQLITE_STATIC)); + + param = 0; + rc = execute_insert(res); + if (rc != SQLITE_DONE) + netdata_log_error("Failed to rebuild the host alert version table"); + +done: + REPORT_BIND_FAIL(res, param); + SQLITE_FINALIZE(res); +} - buffer_flush(sql); +#define SQL_PROCESS_ALERT_PENDING_QUEUE \ + "SELECT health_log_id, unique_id, status, rowid" \ + " FROM alert_queue WHERE host_id = @host_id AND date_scheduled <= UNIXEPOCH() ORDER BY rowid ASC" - buffer_sprintf( - sql, - "INSERT INTO aclk_alert_%s (alert_unique_id, date_created, filtered_alert_unique_id) " - "SELECT hld.unique_id alert_unique_id, unixepoch(), hld.unique_id alert_unique_id FROM health_log_detail hld, health_log hl " - "WHERE hld.new_status <> 0 AND hld.new_status <> -2 AND hl.health_log_id = hld.health_log_id AND hl.config_hash_id IS NOT NULL " - "AND hld.updated_by_id = 0 AND hl.host_id = @host_id ORDER BY hld.unique_id ASC ON CONFLICT (alert_unique_id) DO NOTHING", - wc->uuid_str); +bool process_alert_pending_queue(RRDHOST *host) +{ + static __thread sqlite3_stmt *res = NULL; - if (!PREPARE_STATEMENT(db_meta, buffer_tostring(sql), &res)) - goto skip; + if (!PREPARE_COMPILED_STATEMENT(db_meta, SQL_PROCESS_ALERT_PENDING_QUEUE, &res)) + return false; int param = 0; + int added =0, count = 0; SQLITE_BIND_FAIL(done, sqlite3_bind_blob(res, ++param, &host->host_uuid, sizeof(host->host_uuid), SQLITE_STATIC)); param = 0; - rc = execute_insert(res); - if (unlikely(rc != SQLITE_DONE)) - error_report("Failed to queue existing alerts, rc = %d", rc); - else - rrdhost_flag_set(host, RRDHOST_FLAG_ACLK_STREAM_ALERTS); + int64_t start_row = 0; + int64_t end_row = 0; + while (sqlite3_step_monitored(res) == SQLITE_ROW) { + + int64_t health_log_id = sqlite3_column_int64(res, 0); + uint32_t unique_id = sqlite3_column_int64(res, 1); + RRDCALC_STATUS new_status = sqlite3_column_int(res, 2); + int64_t row = sqlite3_column_int64(res, 3); + + if (host->aclk_config) { + int ret = insert_alert_to_submit_queue(host, health_log_id, unique_id, new_status); + if (ret == 0) + added++; + } + + if (!start_row) + start_row = row; + end_row = row; + + count++; + } + if (start_row) + delete_alert_from_pending_queue(host, start_row, end_row); + + if(count) + nd_log(NDLS_ACCESS, NDLP_NOTICE, "ACLK STA [%s (N/A)]: Processed %d entries, queued %d", rrdhost_hostname(host), count, added); done: REPORT_BIND_FAIL(res, param); - SQLITE_FINALIZE(res); + SQLITE_RESET(res); + return added > 0; +} + +void aclk_push_alert_events_for_all_hosts(void) +{ + RRDHOST *host; -skip: - rw_spinlock_write_unlock(&host->health_log.spinlock); - buffer_free(sql); + // Checking if we shutting down + if (!service_running(SERVICE_ACLK)) + return; + + dfe_start_reentrant(rrdhost_root_index, host) { + if (!rrdhost_flag_check(host, RRDHOST_FLAG_ACLK_STREAM_ALERTS) || + rrdhost_flag_check(host, RRDHOST_FLAG_PENDING_CONTEXT_LOAD)) + continue; + + rrdhost_flag_clear(host, RRDHOST_FLAG_ACLK_STREAM_ALERTS); + + struct aclk_sync_cfg_t *wc = host->aclk_config; + if (!wc || false == wc->stream_alerts || rrdhost_flag_check(host, RRDHOST_FLAG_ARCHIVED)) { + (void)process_alert_pending_queue(host); + commit_alert_events(host); + continue; + } + + if (wc->send_snapshot) { + rrdhost_flag_set(host, RRDHOST_FLAG_ACLK_STREAM_ALERTS); + if (wc->send_snapshot == 1) + continue; + (void)process_alert_pending_queue(host); + commit_alert_events(host); + rebuild_host_alert_version_table(host); + send_alert_snapshot_to_cloud(host); + wc->snapshot_count++; + wc->send_snapshot = 0; + } + else + aclk_push_alert_event(host); + } + dfe_done(host); } -void aclk_send_alarm_configuration(char *config_hash) +void aclk_send_alert_configuration(char *config_hash) { if (unlikely(!config_hash)) return; @@ -484,7 +670,6 @@ void aclk_send_alarm_configuration(char *config_hash) void aclk_push_alert_config_event(char *node_id __maybe_unused, char *config_hash __maybe_unused) { -#ifdef ENABLE_ACLK sqlite3_stmt *res = NULL; struct aclk_sync_cfg_t *wc; @@ -586,91 +771,60 @@ done: SQLITE_FINALIZE(res); freez(config_hash); freez(node_id); -#endif } +#define SQL_ALERT_VERSION_CALC \ + "SELECT SUM(version) FROM health_log hl, alert_version av" \ + " WHERE hl.host_id = @host_uuid AND hl.health_log_id = av.health_log_id AND av.status <> -2" -// Start streaming alerts -void aclk_start_alert_streaming(char *node_id, bool resets) -{ - nd_uuid_t node_uuid; - - if (unlikely(!node_id || uuid_parse(node_id, node_uuid))) - return; - - struct aclk_sync_cfg_t *wc; - - RRDHOST *host = find_host_by_node_id(node_id); - if (unlikely(!host || !(wc = host->aclk_config))) - return; - - if (unlikely(!host->health.health_enabled)) { - nd_log(NDLS_ACCESS, NDLP_NOTICE, "ACLK STA [%s (N/A)]: Ignoring request to stream alert state changes, health is disabled.", node_id); - return; - } - - if (resets) { - nd_log(NDLS_ACCESS, NDLP_DEBUG, "ACLK REQ [%s (%s)]: STREAM ALERTS ENABLED (RESET REQUESTED)", node_id, wc->host ? rrdhost_hostname(wc->host) : "N/A"); - sql_queue_existing_alerts_to_aclk(host); - } else - nd_log(NDLS_ACCESS, NDLP_DEBUG, "ACLK REQ [%s (%s)]: STREAM ALERTS ENABLED", node_id, wc->host ? rrdhost_hostname(wc->host) : "N/A"); - - wc->alert_updates = 1; - wc->alert_queue_removed = SEND_REMOVED_AFTER_HEALTH_LOOPS; -} - -#define SQL_QUEUE_REMOVE_ALERTS \ - "INSERT INTO aclk_alert_%s (alert_unique_id, date_created, filtered_alert_unique_id) " \ - "SELECT hld.unique_id alert_unique_id, UNIXEPOCH(), hld.unique_id alert_unique_id FROM health_log hl, health_log_detail hld " \ - "WHERE hl.host_id = @host_id AND hl.health_log_id = hld.health_log_id AND hld.new_status = -2 AND hld.updated_by_id = 0 " \ - "AND hld.unique_id NOT IN (SELECT alert_unique_id FROM aclk_alert_%s) " \ - "AND hl.config_hash_id NOT IN (SELECT hash_id FROM alert_hash WHERE warn IS NULL AND crit IS NULL) " \ - "AND hl.name || hl.chart NOT IN (select name || chart FROM health_log WHERE name = hl.name AND " \ - "chart = hl.chart AND alarm_id > hl.alarm_id AND host_id = hl.host_id) " \ - "ORDER BY hld.unique_id ASC ON CONFLICT (alert_unique_id) DO NOTHING" - -void sql_process_queue_removed_alerts_to_aclk(char *node_id) +static uint64_t calculate_node_alert_version(RRDHOST *host) { - struct aclk_sync_cfg_t *wc; - RRDHOST *host = find_host_by_node_id(node_id); - freez(node_id); - - if (unlikely(!host || !(wc = host->aclk_config))) - return; - - sqlite3_stmt *res = NULL; - - CLEAN_BUFFER *wb = buffer_create(1024, NULL); // Note buffer auto free on function return - buffer_sprintf(wb, SQL_QUEUE_REMOVE_ALERTS, wc->uuid_str, wc->uuid_str); + static __thread sqlite3_stmt *res = NULL; - if (!PREPARE_STATEMENT(db_meta, buffer_tostring(wb), &res)) - return; + if (!PREPARE_COMPILED_STATEMENT(db_meta, SQL_ALERT_VERSION_CALC, &res)) + return 0; + uint64_t version = 0; int param = 0; SQLITE_BIND_FAIL(done, sqlite3_bind_blob(res, ++param, &host->host_uuid, sizeof(host->host_uuid), SQLITE_STATIC)); param = 0; - int rc = execute_insert(res); - if (likely(rc == SQLITE_DONE)) { - nd_log(NDLS_ACCESS, NDLP_DEBUG, "ACLK STA [%s (%s)]: QUEUED REMOVED ALERTS", wc->node_id, rrdhost_hostname(wc->host)); - rrdhost_flag_set(wc->host, RRDHOST_FLAG_ACLK_STREAM_ALERTS); - wc->alert_queue_removed = 0; + while (sqlite3_step_monitored(res) == SQLITE_ROW) { + version = (uint64_t)sqlite3_column_int64(res, 0); } done: REPORT_BIND_FAIL(res, param); - SQLITE_FINALIZE(res); + SQLITE_RESET(res); + return version; } -void sql_queue_removed_alerts_to_aclk(RRDHOST *host) +static void schedule_alert_snapshot_if_needed(struct aclk_sync_cfg_t *wc, uint64_t cloud_version) { - if (unlikely(!host->aclk_config || !claimed() || !host->node_id)) - return; - - char node_id[UUID_STR_LEN]; - uuid_unparse_lower(*host->node_id, node_id); + uint64_t local_version = calculate_node_alert_version(wc->host); + if (local_version != cloud_version) { + nd_log( + NDLS_ACCESS, + NDLP_NOTICE, + "Scheduling alert snapshot for host \"%s\", node \"%s\" (version: cloud %zu, local %zu)", + rrdhost_hostname(wc->host), + wc->node_id, + cloud_version, + local_version); - aclk_push_node_removed_alerts(node_id); + wc->send_snapshot = 1; + rrdhost_flag_set(wc->host, RRDHOST_FLAG_ACLK_STREAM_ALERTS); + } + else + nd_log( + NDLS_ACCESS, + NDLP_DEBUG, + "Alert check on \"%s\", node \"%s\" (version: cloud %zu, local %zu)", + rrdhost_hostname(wc->host), + wc->node_id, + cloud_version, + local_version); + wc->checkpoint_count++; } void aclk_process_send_alarm_snapshot(char *node_id, char *claim_id __maybe_unused, char *snapshot_uuid) @@ -699,371 +853,202 @@ void aclk_process_send_alarm_snapshot(char *node_id, char *claim_id __maybe_unus wc->alerts_snapshot_uuid = strdupz(snapshot_uuid); - aclk_push_node_alert_snapshot(node_id); + wc->send_snapshot = 1; + rrdhost_flag_set(host, RRDHOST_FLAG_ACLK_STREAM_ALERTS); } -#ifdef ENABLE_ACLK -void health_alarm_entry2proto_nolock(struct alarm_log_entry *alarm_log, ALARM_ENTRY *ae, RRDHOST *host) -{ - char *edit_command = ae->source ? health_edit_command_from_source(ae_source(ae)) : strdupz("UNKNOWN=0=UNKNOWN"); - char config_hash_id[UUID_STR_LEN]; - uuid_unparse_lower(ae->config_hash_id, config_hash_id); - char transition_id[UUID_STR_LEN]; - uuid_unparse_lower(ae->transition_id, transition_id); - - alarm_log->chart = strdupz(ae_chart_id(ae)); - alarm_log->name = strdupz(ae_name(ae)); - - alarm_log->when = ae->when; - - alarm_log->config_hash = strdupz((char *)config_hash_id); - - alarm_log->utc_offset = host->utc_offset; - alarm_log->timezone = strdupz(rrdhost_abbrev_timezone(host)); - alarm_log->exec_path = ae->exec ? strdupz(ae_exec(ae)) : strdupz((char *)string2str(host->health.health_default_exec)); - alarm_log->conf_source = ae->source ? strdupz(ae_source(ae)) : strdupz((char *)""); +#define SQL_COUNT_SNAPSHOT_ENTRIES \ + "SELECT COUNT(1) FROM alert_version av, health_log hl " \ + "WHERE hl.host_id = @host_id AND hl.health_log_id = av.health_log_id AND av.status <> -2" - alarm_log->command = strdupz((char *)edit_command); - - alarm_log->duration = (time_t)ae->duration; - alarm_log->non_clear_duration = (time_t)ae->non_clear_duration; - alarm_log->status = rrdcalc_status_to_proto_enum((RRDCALC_STATUS)ae->new_status); - alarm_log->old_status = rrdcalc_status_to_proto_enum((RRDCALC_STATUS)ae->old_status); - alarm_log->delay = ae->delay; - alarm_log->delay_up_to_timestamp = (time_t)ae->delay_up_to_timestamp; - alarm_log->last_repeat = (time_t)ae->last_repeat; - - alarm_log->silenced = - ((ae->flags & HEALTH_ENTRY_FLAG_SILENCED) || (ae->recipient && !strncmp(ae_recipient(ae), "silent", 6))) ? - 1 : - 0; +static int calculate_alert_snapshot_entries(nd_uuid_t *host_uuid) +{ + int count = 0; - alarm_log->value_string = strdupz(ae_new_value_string(ae)); - alarm_log->old_value_string = strdupz(ae_old_value_string(ae)); + sqlite3_stmt *res = NULL; - alarm_log->value = (!isnan(ae->new_value)) ? (NETDATA_DOUBLE)ae->new_value : 0; - alarm_log->old_value = (!isnan(ae->old_value)) ? (NETDATA_DOUBLE)ae->old_value : 0; + if (!PREPARE_STATEMENT(db_meta, SQL_COUNT_SNAPSHOT_ENTRIES, &res)) + return 0; - alarm_log->updated = (ae->flags & HEALTH_ENTRY_FLAG_UPDATED) ? 1 : 0; - alarm_log->rendered_info = strdupz(ae_info(ae)); - alarm_log->chart_context = strdupz(ae_chart_context(ae)); - alarm_log->chart_name = strdupz(ae_chart_name(ae)); + int param = 0; + SQLITE_BIND_FAIL(done, sqlite3_bind_blob(res, ++param, host_uuid, sizeof(*host_uuid), SQLITE_STATIC)); - alarm_log->transition_id = strdupz((char *)transition_id); - alarm_log->event_id = (uint64_t) ae->alarm_event_id; + param = 0; + int rc = sqlite3_step_monitored(res); + if (rc == SQLITE_ROW) + count = sqlite3_column_int(res, 0); + else + error_report("Failed to select snapshot count"); - alarm_log->summary = strdupz(ae_summary(ae)); +done: + REPORT_BIND_FAIL(res, param); + SQLITE_FINALIZE(res); - freez(edit_command); + return count; } -#endif - -#ifdef ENABLE_ACLK -static bool have_recent_alarm_unsafe(RRDHOST *host, int64_t alarm_id, int64_t mark) -{ - ALARM_ENTRY *ae = host->health_log.alarms; - - while (ae) { - if (ae->alarm_id == alarm_id && ae->unique_id >mark && - (ae->new_status != RRDCALC_STATUS_WARNING && ae->new_status != RRDCALC_STATUS_CRITICAL)) - return true; - ae = ae->next; - } - return false; -} -#endif +#define SQL_GET_SNAPSHOT_ENTRIES \ + " SELECT 0, hld.unique_id, hld.alarm_id, hl.config_hash_id, hld.updated_by_id, hld.when_key, " \ + " hld.duration, hld.non_clear_duration, hld.flags, hld.exec_run_timestamp, hld.delay_up_to_timestamp, hl.name, " \ + " hl.chart, hl.exec, hl.recipient, ah.source, hl.units, hld.info, hld.exec_code, hld.new_status, " \ + " hld.old_status, hld.delay, hld.new_value, hld.old_value, hld.last_repeat, hl.chart_context, hld.transition_id, " \ + " hld.alarm_event_id, hl.chart_name, hld.summary, hld.health_log_id, av.version " \ + " FROM health_log hl, alert_hash ah, health_log_detail hld, alert_version av " \ + " WHERE hl.config_hash_id = ah.hash_id" \ + " AND hl.host_id = @host_id AND hl.health_log_id = hld.health_log_id " \ + " AND hld.health_log_id = av.health_log_id AND av.unique_id = hld.unique_id AND av.status <> -2" #define ALARM_EVENTS_PER_CHUNK 1000 -void aclk_push_alert_snapshot_event(char *node_id __maybe_unused) +void send_alert_snapshot_to_cloud(RRDHOST *host __maybe_unused) { -#ifdef ENABLE_ACLK - RRDHOST *host = find_host_by_node_id(node_id); + struct aclk_sync_cfg_t *wc = host->aclk_config; if (unlikely(!host)) { - nd_log(NDLS_ACCESS, NDLP_WARNING, "AC [%s (N/A)]: Node id not found", node_id); - freez(node_id); + nd_log(NDLS_ACCESS, NDLP_WARNING, "AC [%s (N/A)]: Node id not found", wc->node_id); return; } - freez(node_id); - struct aclk_sync_cfg_t *wc = host->aclk_config; - - // we perhaps we don't need this for snapshots - if (unlikely(!wc->alert_updates)) { - nd_log(NDLS_ACCESS, NDLP_NOTICE, - "ACLK STA [%s (%s)]: Ignoring alert snapshot event, updates have been turned off for this node.", - wc->node_id, - wc->host ? rrdhost_hostname(wc->host) : "N/A"); + char *claim_id = get_agent_claimid(); + if (unlikely(!claim_id)) return; - } - if (unlikely(!wc->alerts_snapshot_uuid)) + // Check database for this node to see how many alerts we will need to put in the snapshot + int cnt = calculate_alert_snapshot_entries(&host->host_uuid); + if (!cnt) { + freez(claim_id); return; + } - char *claim_id = get_agent_claimid(); - if (unlikely(!claim_id)) + sqlite3_stmt *res = NULL; + if (!PREPARE_STATEMENT(db_meta, SQL_GET_SNAPSHOT_ENTRIES, &res)) return; - nd_log(NDLS_ACCESS, NDLP_DEBUG, "ACLK REQ [%s (%s)]: Sending alerts snapshot, snapshot_uuid %s", wc->node_id, rrdhost_hostname(wc->host), wc->alerts_snapshot_uuid); - - uint32_t cnt = 0; + int param = 0; + SQLITE_BIND_FAIL(done, sqlite3_bind_blob(res, ++param, &host->host_uuid, sizeof(host->host_uuid), SQLITE_STATIC)); - rw_spinlock_read_lock(&host->health_log.spinlock); + nd_uuid_t local_snapshot_uuid; + char snapshot_uuid_str[UUID_STR_LEN]; + uuid_generate_random(local_snapshot_uuid); + uuid_unparse_lower(local_snapshot_uuid, snapshot_uuid_str); + char *snapshot_uuid = &snapshot_uuid_str[0]; - ALARM_ENTRY *ae = host->health_log.alarms; + nd_log(NDLS_ACCESS, NDLP_DEBUG, + "ACLK REQ [%s (%s)]: Sending %d alerts snapshot, snapshot_uuid %s", wc->node_id, rrdhost_hostname(host), + cnt, snapshot_uuid); - for (; ae; ae = ae->next) { - if (likely(ae->updated_by_id)) - continue; + uint32_t chunks; + chunks = (cnt / ALARM_EVENTS_PER_CHUNK) + (cnt % ALARM_EVENTS_PER_CHUNK != 0); - if (unlikely(ae->new_status == RRDCALC_STATUS_UNINITIALIZED)) - continue; + alarm_snapshot_proto_ptr_t snapshot_proto = NULL; + struct alarm_snapshot alarm_snap; + struct alarm_log_entry alarm_log; - if (have_recent_alarm_unsafe(host, ae->alarm_id, ae->unique_id)) - continue; + alarm_snap.node_id = wc->node_id; + alarm_snap.claim_id = claim_id; + alarm_snap.snapshot_uuid = snapshot_uuid; + alarm_snap.chunks = chunks; + alarm_snap.chunk = 1; - if (is_event_from_alert_variable_config(ae->unique_id, &host->host_uuid)) - continue; + alarm_log.node_id = wc->node_id; + alarm_log.claim_id = claim_id; + cnt = 0; + param = 0; + uint64_t version = 0; + int total_count = 0; + while (sqlite3_step_monitored(res) == SQLITE_ROW) { cnt++; - } - - if (cnt) { - uint32_t chunks; - - chunks = (cnt / ALARM_EVENTS_PER_CHUNK) + (cnt % ALARM_EVENTS_PER_CHUNK != 0); - ae = host->health_log.alarms; - - cnt = 0; - struct alarm_snapshot alarm_snap; - alarm_snap.node_id = wc->node_id; - alarm_snap.claim_id = claim_id; - alarm_snap.snapshot_uuid = wc->alerts_snapshot_uuid; - alarm_snap.chunks = chunks; - alarm_snap.chunk = 1; - - alarm_snapshot_proto_ptr_t snapshot_proto = NULL; - - for (; ae; ae = ae->next) { - if (likely(ae->updated_by_id) || unlikely(ae->new_status == RRDCALC_STATUS_UNINITIALIZED)) - continue; - - if (have_recent_alarm_unsafe(host, ae->alarm_id, ae->unique_id)) - continue; - - if (is_event_from_alert_variable_config(ae->unique_id, &host->host_uuid)) - continue; - - cnt++; + total_count++; - struct alarm_log_entry alarm_log; - alarm_log.node_id = wc->node_id; - alarm_log.claim_id = claim_id; + if (!snapshot_proto) + snapshot_proto = generate_alarm_snapshot_proto(&alarm_snap); - if (!snapshot_proto) - snapshot_proto = generate_alarm_snapshot_proto(&alarm_snap); + health_alarm_log_populate(&alarm_log, res, host, NULL); - health_alarm_entry2proto_nolock(&alarm_log, ae, host); - add_alarm_log_entry2snapshot(snapshot_proto, &alarm_log); + add_alarm_log_entry2snapshot(snapshot_proto, &alarm_log); + version += alarm_log.version; - if (cnt == ALARM_EVENTS_PER_CHUNK) { + if (cnt == ALARM_EVENTS_PER_CHUNK) { + if (aclk_connected) aclk_send_alarm_snapshot(snapshot_proto); - cnt = 0; - if (alarm_snap.chunk < chunks) { - alarm_snap.chunk++; - snapshot_proto = generate_alarm_snapshot_proto(&alarm_snap); - } + cnt = 0; + if (alarm_snap.chunk < chunks) { + alarm_snap.chunk++; + snapshot_proto = generate_alarm_snapshot_proto(&alarm_snap); } - destroy_alarm_log_entry(&alarm_log); } - if (cnt) - aclk_send_alarm_snapshot(snapshot_proto); + destroy_alarm_log_entry(&alarm_log); } + if (cnt) + aclk_send_alarm_snapshot(snapshot_proto); - rw_spinlock_read_unlock(&host->health_log.spinlock); - wc->alerts_snapshot_uuid = NULL; - - freez(claim_id); -#endif -} - -#define SQL_DELETE_ALERT_ENTRIES "DELETE FROM aclk_alert_%s WHERE date_created < UNIXEPOCH() - @period" - -void sql_aclk_alert_clean_dead_entries(RRDHOST *host) -{ - struct aclk_sync_cfg_t *wc = host->aclk_config; - if (unlikely(!wc)) - return; - - char sql[ACLK_SYNC_QUERY_SIZE]; - snprintfz(sql, sizeof(sql) - 1, SQL_DELETE_ALERT_ENTRIES, wc->uuid_str); - - sqlite3_stmt *res = NULL; - - if (!PREPARE_STATEMENT(db_meta, sql, &res)) - return; - - int param = 0; - SQLITE_BIND_FAIL(done, sqlite3_bind_int64(res, ++param, MAX_REMOVED_PERIOD)); - - param = 0; - int rc = sqlite3_step_monitored(res); - if (rc != SQLITE_DONE) - error_report("Failed to execute DELETE query for cleaning stale ACLK alert entries."); + nd_log( + NDLS_ACCESS, + NDLP_DEBUG, + "ACLK REQ [%s (%s)]: Sent! %d alerts snapshot, snapshot_uuid %s (version = %zu)", + wc->node_id, + rrdhost_hostname(host), + cnt, + snapshot_uuid, + version); done: REPORT_BIND_FAIL(res, param); SQLITE_FINALIZE(res); -} -#define SQL_GET_MIN_MAX_ALERT_SEQ "SELECT MIN(sequence_id), MAX(sequence_id), " \ - "(SELECT MAX(sequence_id) FROM aclk_alert_%s WHERE date_submitted IS NOT NULL) " \ - "FROM aclk_alert_%s WHERE date_submitted IS NULL" -int get_proto_alert_status(RRDHOST *host, struct proto_alert_status *proto_alert_status) -{ - - struct aclk_sync_cfg_t *wc = host->aclk_config; - if (!wc) - return 1; - - proto_alert_status->alert_updates = wc->alert_updates; - - char sql[ACLK_SYNC_QUERY_SIZE]; - snprintfz(sql, sizeof(sql) - 1, SQL_GET_MIN_MAX_ALERT_SEQ, wc->uuid_str, wc->uuid_str); - - sqlite3_stmt *res = NULL; - if (!PREPARE_STATEMENT(db_meta, sql, &res)) - return 1; - - while (sqlite3_step_monitored(res) == SQLITE_ROW) { - proto_alert_status->pending_min_sequence_id = - sqlite3_column_bytes(res, 0) > 0 ? (uint64_t)sqlite3_column_int64(res, 0) : 0; - proto_alert_status->pending_max_sequence_id = - sqlite3_column_bytes(res, 1) > 0 ? (uint64_t)sqlite3_column_int64(res, 1) : 0; - proto_alert_status->last_submitted_sequence_id = - sqlite3_column_bytes(res, 2) > 0 ? (uint64_t)sqlite3_column_int64(res, 2) : 0; - } - - SQLITE_FINALIZE(res); - - return 0; + freez(claim_id); } -void aclk_send_alarm_checkpoint(char *node_id, char *claim_id __maybe_unused) +// Start streaming alerts +void aclk_start_alert_streaming(char *node_id, uint64_t cloud_version) { - if (unlikely(!node_id)) + nd_uuid_t node_uuid; + + if (unlikely(!node_id || uuid_parse(node_id, node_uuid))) return; struct aclk_sync_cfg_t *wc; RRDHOST *host = find_host_by_node_id(node_id); - if (unlikely(!host || !(wc = host->aclk_config))) - nd_log(NDLS_ACCESS, NDLP_WARNING, "ACLK REQ [%s (N/A)]: ALERTS CHECKPOINT REQUEST RECEIVED FOR INVALID NODE", node_id); - else { - nd_log(NDLS_ACCESS, NDLP_DEBUG, "ACLK REQ [%s (%s)]: ALERTS CHECKPOINT REQUEST RECEIVED", node_id, rrdhost_hostname(host)); - wc->alert_checkpoint_req = SEND_CHECKPOINT_AFTER_HEALTH_LOOPS; - } -} - -typedef struct active_alerts { - char *name; - char *chart; - RRDCALC_STATUS status; -} active_alerts_t; - -static inline int compare_active_alerts(const void *a, const void *b) -{ - active_alerts_t *active_alerts_a = (active_alerts_t *)a; - active_alerts_t *active_alerts_b = (active_alerts_t *)b; - - if (!(strcmp(active_alerts_a->name, active_alerts_b->name))) { - return strcmp(active_alerts_a->chart, active_alerts_b->chart); - } else - return strcmp(active_alerts_a->name, active_alerts_b->name); -} - -#define BATCH_ALLOCATED 10 -void aclk_push_alarm_checkpoint(RRDHOST *host __maybe_unused) -{ -#ifdef ENABLE_ACLK - struct aclk_sync_cfg_t *wc = host->aclk_config; - if (unlikely(!wc)) { - nd_log(NDLS_ACCESS, NDLP_WARNING, "ACLK REQ [%s (N/A)]: ALERTS CHECKPOINT REQUEST RECEIVED FOR INVALID NODE", rrdhost_hostname(host)); + if (unlikely(!host || !(wc = host->aclk_config))) { + nd_log(NDLS_ACCESS, NDLP_NOTICE, "ACLK STA [%s (N/A)]: Ignoring request to stream alert state changes, invalid node.", node_id); return; } - if (rrdhost_flag_check(host, RRDHOST_FLAG_ACLK_STREAM_ALERTS)) { - //postpone checkpoint send - wc->alert_checkpoint_req += 3; - nd_log(NDLS_ACCESS, NDLP_NOTICE, "ACLK REQ [%s (N/A)]: ALERTS CHECKPOINT POSTPONED", rrdhost_hostname(host)); + if (unlikely(!host->health.health_enabled)) { + nd_log(NDLS_ACCESS, NDLP_NOTICE, "ACLK STA [%s (N/A)]: Ignoring request to stream alert state changes, health is disabled.", node_id); return; } - RRDCALC *rc; - uint32_t cnt = 0; - size_t len = 0; - - active_alerts_t *active_alerts = callocz(BATCH_ALLOCATED, sizeof(active_alerts_t)); - foreach_rrdcalc_in_rrdhost_read(host, rc) { - if(unlikely(!rc->rrdset || !rc->rrdset->last_collected_time.tv_sec)) - continue; + nd_log(NDLS_ACCESS, NDLP_DEBUG, "ACLK REQ [%s (%s)]: STREAM ALERTS ENABLED", node_id, wc->host ? rrdhost_hostname(wc->host) : "N/A"); + schedule_alert_snapshot_if_needed(wc, cloud_version); + wc->stream_alerts = true; +} - if (rc->status == RRDCALC_STATUS_WARNING || - rc->status == RRDCALC_STATUS_CRITICAL) { +// Do checkpoint alert version check +void aclk_alert_version_check(char *node_id, char *claim_id, uint64_t cloud_version) +{ + nd_uuid_t node_uuid; - if (cnt && !(cnt % BATCH_ALLOCATED)) { - active_alerts = reallocz(active_alerts, (BATCH_ALLOCATED * ((cnt / BATCH_ALLOCATED) + 1)) * sizeof(active_alerts_t)); - } + if (unlikely(!node_id || !claim_id || !claimed() || uuid_parse(node_id, node_uuid))) + return; - active_alerts[cnt].name = (char *)rrdcalc_name(rc); - len += string_strlen(rc->config.name); - active_alerts[cnt].chart = (char *)rrdcalc_chart_name(rc); - len += string_strlen(rc->chart); - active_alerts[cnt].status = rc->status; - len++; - cnt++; - } - } - foreach_rrdcalc_in_rrdhost_done(rc); - - BUFFER *alarms_to_hash; - if (cnt) { - qsort(active_alerts, cnt, sizeof(active_alerts_t), compare_active_alerts); - - alarms_to_hash = buffer_create(len, NULL); - for (uint32_t i = 0; i < cnt; i++) { - buffer_strcat(alarms_to_hash, active_alerts[i].name); - buffer_strcat(alarms_to_hash, active_alerts[i].chart); - if (active_alerts[i].status == RRDCALC_STATUS_WARNING) - buffer_fast_strcat(alarms_to_hash, "W", 1); - else if (active_alerts[i].status == RRDCALC_STATUS_CRITICAL) - buffer_fast_strcat(alarms_to_hash, "C", 1); - } - } else { - alarms_to_hash = buffer_create(1, NULL); - buffer_strcat(alarms_to_hash, ""); - len = 0; + char *agent_claim_id = get_agent_claimid(); + if (claim_id && agent_claim_id && strcmp(agent_claim_id, claim_id) != 0) { + nd_log(NDLS_ACCESS, NDLP_NOTICE, "ACLK REQ [%s (N/A)]: ALERTS CHECKPOINT VALIDATION REQUEST RECEIVED WITH INVALID CLAIM ID", node_id); + goto done; } - freez(active_alerts); - char hash[SHA256_DIGEST_LENGTH + 1]; - if (hash256_string((const unsigned char *)buffer_tostring(alarms_to_hash), len, hash)) { - hash[SHA256_DIGEST_LENGTH] = 0; + struct aclk_sync_cfg_t *wc; + RRDHOST *host = find_host_by_node_id(node_id); - struct alarm_checkpoint alarm_checkpoint; - char *claim_id = get_agent_claimid(); - alarm_checkpoint.claim_id = claim_id; - alarm_checkpoint.node_id = wc->node_id; - alarm_checkpoint.checksum = (char *)hash; + if ((!host || !(wc = host->aclk_config))) + nd_log(NDLS_ACCESS, NDLP_NOTICE, "ACLK REQ [%s (N/A)]: ALERTS CHECKPOINT VALIDATION REQUEST RECEIVED FOR INVALID NODE", node_id); + else + schedule_alert_snapshot_if_needed(wc, cloud_version); - aclk_send_provide_alarm_checkpoint(&alarm_checkpoint); - freez(claim_id); - nd_log(NDLS_ACCESS, NDLP_DEBUG, "ACLK RES [%s (%s)]: ALERTS CHECKPOINT SENT", wc->node_id, rrdhost_hostname(host)); - } else - nd_log(NDLS_ACCESS, NDLP_ERR, "ACLK RES [%s (%s)]: FAILED TO CREATE ALERTS CHECKPOINT HASH", wc->node_id, rrdhost_hostname(host)); +done: + freez(agent_claim_id); +} - wc->alert_checkpoint_req = 0; - buffer_free(alarms_to_hash); #endif -} diff --git a/src/database/sqlite/sqlite_aclk_alert.h b/src/database/sqlite/sqlite_aclk_alert.h index cfb3468b9..17a58154f 100644 --- a/src/database/sqlite/sqlite_aclk_alert.h +++ b/src/database/sqlite/sqlite_aclk_alert.h @@ -5,28 +5,14 @@ extern sqlite3 *db_meta; -#define SEND_REMOVED_AFTER_HEALTH_LOOPS 3 -#define SEND_CHECKPOINT_AFTER_HEALTH_LOOPS 4 - -struct proto_alert_status { - int alert_updates; - uint64_t pending_min_sequence_id; - uint64_t pending_max_sequence_id; - uint64_t last_submitted_sequence_id; -}; - -void aclk_send_alarm_configuration (char *config_hash); +void aclk_send_alert_configuration(char *config_hash); void aclk_push_alert_config_event(char *node_id, char *config_hash); -void aclk_start_alert_streaming(char *node_id, bool resets); -void sql_queue_removed_alerts_to_aclk(RRDHOST *host); -void sql_process_queue_removed_alerts_to_aclk(char *node_id); -void aclk_send_alarm_checkpoint(char *node_id, char *claim_id); -void aclk_push_alarm_checkpoint(RRDHOST *host); +void aclk_start_alert_streaming(char *node_id, uint64_t cloud_version); +void aclk_alert_version_check(char *node_id, char *claim_id, uint64_t cloud_version); -void aclk_push_alert_snapshot_event(char *node_id); +void send_alert_snapshot_to_cloud(RRDHOST *host __maybe_unused); void aclk_process_send_alarm_snapshot(char *node_id, char *claim_id, char *snapshot_uuid); -int get_proto_alert_status(RRDHOST *host, struct proto_alert_status *proto_alert_status); -void sql_queue_alarm_to_aclk(RRDHOST *host, ALARM_ENTRY *ae, bool skip_filter); +bool process_alert_pending_queue(RRDHOST *host); void aclk_push_alert_events_for_all_hosts(void); #endif //NETDATA_SQLITE_ACLK_ALERT_H diff --git a/src/database/sqlite/sqlite_aclk_node.c b/src/database/sqlite/sqlite_aclk_node.c index 3134438db..70d1ebda1 100644 --- a/src/database/sqlite/sqlite_aclk_node.c +++ b/src/database/sqlite/sqlite_aclk_node.c @@ -90,13 +90,7 @@ static void build_node_info(RRDHOST *host) node_info.data.custom_info = config_get(CONFIG_SECTION_WEB, "custom dashboard_info.js", ""); node_info.data.machine_guid = host->machine_guid; - struct capability node_caps[] = { - {.name = "ml", .version = host->system_info->ml_capable, .enabled = host->system_info->ml_enabled}, - {.name = "mc", - .version = host->system_info->mc_version ? host->system_info->mc_version : 0, - .enabled = host->system_info->mc_version ? 1 : 0}, - {.name = NULL, .version = 0, .enabled = 0}}; - node_info.node_capabilities = node_caps; + node_info.node_capabilities = (struct capability *)aclk_get_agent_capas(); node_info.data.ml_info.ml_capable = host->system_info->ml_capable; node_info.data.ml_info.ml_enabled = host->system_info->ml_enabled; diff --git a/src/database/sqlite/sqlite_context.c b/src/database/sqlite/sqlite_context.c index 1e49dd2bf..1d0c768e5 100644 --- a/src/database/sqlite/sqlite_context.c +++ b/src/database/sqlite/sqlite_context.c @@ -43,7 +43,7 @@ int sql_init_context_database(int memory) return 1; } - errno = 0; + errno_clear(); netdata_log_info("SQLite database %s initialization", sqlite_database); char buf[1024 + 1] = ""; diff --git a/src/database/sqlite/sqlite_db_migration.c b/src/database/sqlite/sqlite_db_migration.c index 88abd8492..44a5e97c2 100644 --- a/src/database/sqlite/sqlite_db_migration.c +++ b/src/database/sqlite/sqlite_db_migration.c @@ -518,7 +518,7 @@ static int migrate_database(sqlite3 *database, int target_version, char *db_name } if (likely(user_version == target_version)) { - errno = 0; + errno_clear(); netdata_log_info("%s database version is %d (no migration needed)", db_name, target_version); return target_version; } diff --git a/src/database/sqlite/sqlite_functions.c b/src/database/sqlite/sqlite_functions.c index 5c18ff8ed..e62743f59 100644 --- a/src/database/sqlite/sqlite_functions.c +++ b/src/database/sqlite/sqlite_functions.c @@ -43,7 +43,7 @@ SQLITE_API int sqlite3_step_monitored(sqlite3_stmt *stmt) { return rc; } -static bool mark_database_to_recover(sqlite3_stmt *res, sqlite3 *database) +static bool mark_database_to_recover(sqlite3_stmt *res, sqlite3 *database, int rc) { if (!res && !database) @@ -54,7 +54,7 @@ static bool mark_database_to_recover(sqlite3_stmt *res, sqlite3 *database) if (db_meta == database) { char recover_file[FILENAME_MAX + 1]; - snprintfz(recover_file, FILENAME_MAX, "%s/.netdata-meta.db.recover", netdata_configured_cache_dir); + snprintfz(recover_file, FILENAME_MAX, "%s/.netdata-meta.db.%s", netdata_configured_cache_dir, SQLITE_CORRUPT == rc ? "recover" : "delete" ); int fd = open(recover_file, O_WRONLY | O_CREAT | O_TRUNC | O_CLOEXEC, 444); if (fd >= 0) { close(fd); @@ -69,7 +69,7 @@ int execute_insert(sqlite3_stmt *res) int rc; rc = sqlite3_step_monitored(res); if (rc == SQLITE_CORRUPT) { - (void)mark_database_to_recover(res, NULL); + (void)mark_database_to_recover(res, NULL, rc); error_report("SQLite error %d", rc); } return rc; @@ -229,8 +229,8 @@ int init_database_batch(sqlite3 *database, const char *batch[], const char *desc analytics_set_data_str(&analytics_data.netdata_fail_reason, error_str); sqlite3_free(err_msg); freez(error_str); - if (SQLITE_CORRUPT == rc) { - if (mark_database_to_recover(NULL, database)) + if (SQLITE_CORRUPT == rc || SQLITE_NOTADB == rc) { + if (mark_database_to_recover(NULL, database, rc)) error_report("Database is corrupted will attempt to fix"); return SQLITE_CORRUPT; } @@ -263,7 +263,7 @@ int db_execute(sqlite3 *db, const char *cmd) } if (rc == SQLITE_CORRUPT) - mark_database_to_recover(NULL, db); + mark_database_to_recover(NULL, db, rc); break; } return (rc != SQLITE_OK); diff --git a/src/database/sqlite/sqlite_health.c b/src/database/sqlite/sqlite_health.c index 51e38d05a..a632fd494 100644 --- a/src/database/sqlite/sqlite_health.c +++ b/src/database/sqlite/sqlite_health.c @@ -55,15 +55,137 @@ done: } /* Health related SQL queries - Inserts an entry in the table + * + * Inserts an entry in the tables + * alert_queue + * health_log + * health_log_detail + * */ +int calculate_delay(RRDCALC_STATUS old_status, RRDCALC_STATUS new_status) +{ + int delay = ALERT_TRANSITION_DELAY_NONE; + switch(old_status) { + case RRDCALC_STATUS_REMOVED: + switch (new_status) { + case RRDCALC_STATUS_UNINITIALIZED: + delay = ALERT_TRANSITION_DELAY_LONG; + break; + case RRDCALC_STATUS_CLEAR: + delay = ALERT_TRANSITION_DELAY_SHORT; + break; + default: + delay = ALERT_TRANSITION_DELAY_NONE; + break; + } + break; + case RRDCALC_STATUS_UNDEFINED: + case RRDCALC_STATUS_UNINITIALIZED: + switch (new_status) { + case RRDCALC_STATUS_REMOVED: + case RRDCALC_STATUS_UNINITIALIZED: + case RRDCALC_STATUS_UNDEFINED: + delay = ALERT_TRANSITION_DELAY_LONG; + break; + case RRDCALC_STATUS_CLEAR: + delay = ALERT_TRANSITION_DELAY_SHORT; + break; + default: + delay = ALERT_TRANSITION_DELAY_NONE; + break; + } + break; + case RRDCALC_STATUS_CLEAR: + switch (new_status) { + case RRDCALC_STATUS_REMOVED: + case RRDCALC_STATUS_UNINITIALIZED: + case RRDCALC_STATUS_UNDEFINED: + delay = ALERT_TRANSITION_DELAY_LONG; + break; + case RRDCALC_STATUS_WARNING: + case RRDCALC_STATUS_CRITICAL: + default: + delay = ALERT_TRANSITION_DELAY_NONE; + break; + + } + break; + case RRDCALC_STATUS_WARNING: + case RRDCALC_STATUS_CRITICAL: + switch (new_status) { + case RRDCALC_STATUS_REMOVED: + case RRDCALC_STATUS_UNINITIALIZED: + case RRDCALC_STATUS_UNDEFINED: + delay = ALERT_TRANSITION_DELAY_LONG; + break; + case RRDCALC_STATUS_CLEAR: + delay = ALERT_TRANSITION_DELAY_SHORT; + break; + default: + delay = ALERT_TRANSITION_DELAY_NONE; + break; + } + break; + default: + delay = ALERT_TRANSITION_DELAY_NONE; + break; + } + return delay; +} + +#ifdef ENABLE_ACLK +#define SQL_INSERT_ALERT_PENDING_QUEUE \ + "INSERT INTO alert_queue (host_id, health_log_id, unique_id, alarm_id, status, date_scheduled)" \ + " VALUES (@host_id, @health_log_id, @unique_id, @alarm_id, @new_status, UNIXEPOCH() + @delay)" \ + " ON CONFLICT (host_id, health_log_id, alarm_id)" \ + " DO UPDATE SET status = excluded.status, unique_id = excluded.unique_id, " \ + " date_scheduled = MIN(date_scheduled, excluded.date_scheduled)" + +static void insert_alert_queue( + RRDHOST *host, + uint64_t health_log_id, + int64_t unique_id, + uint32_t alarm_id, + RRDCALC_STATUS old_status, + RRDCALC_STATUS new_status) +{ + static __thread sqlite3_stmt *res = NULL; + int rc; + + if (!host->aclk_config) + return; + + if (!PREPARE_COMPILED_STATEMENT(db_meta, SQL_INSERT_ALERT_PENDING_QUEUE, &res)) + return; + + int submit_delay = calculate_delay(old_status, new_status); + + int param = 0; + SQLITE_BIND_FAIL(done, sqlite3_bind_blob(res, ++param, &host->host_uuid, sizeof(host->host_uuid), SQLITE_STATIC)); + SQLITE_BIND_FAIL(done, sqlite3_bind_int64(res, ++param, (sqlite3_int64)health_log_id)); + SQLITE_BIND_FAIL(done, sqlite3_bind_int64(res, ++param, unique_id)); + SQLITE_BIND_FAIL(done, sqlite3_bind_int64(res, ++param, alarm_id)); + SQLITE_BIND_FAIL(done, sqlite3_bind_int(res, ++param, new_status)); + SQLITE_BIND_FAIL(done, sqlite3_bind_int(res, ++param, submit_delay)); + + param = 0; + rc = execute_insert(res); + if (rc != SQLITE_DONE) + error_report( + "HEALTH [%s]: Failed to execute insert_alert_queue, rc = %d", rrdhost_hostname(host), rc); + +done: + REPORT_BIND_FAIL(res, param); + SQLITE_RESET(res); +} +#endif #define SQL_INSERT_HEALTH_LOG_DETAIL \ "INSERT INTO health_log_detail (health_log_id, unique_id, alarm_id, alarm_event_id, " \ "updated_by_id, updates_id, when_key, duration, non_clear_duration, flags, exec_run_timestamp, delay_up_to_timestamp, " \ "info, exec_code, new_status, old_status, delay, new_value, old_value, last_repeat, transition_id, global_id, summary) " \ - "VALUES (@health_log_id,@unique_id,@alarm_id,@alarm_event_id,@updated_by_id,@updates_id,@when_key,@duration," \ + " VALUES (@health_log_id,@unique_id,@alarm_id,@alarm_event_id,@updated_by_id,@updates_id,@when_key,@duration," \ "@non_clear_duration,@flags,@exec_run_timestamp,@delay_up_to_timestamp, @info,@exec_code,@new_status,@old_status," \ "@delay,@new_value,@old_value,@last_repeat,@transition_id,@global_id,@summary)" @@ -150,6 +272,11 @@ static void sql_health_alarm_log_insert(RRDHOST *host, ALARM_ENTRY *ae) if (rc == SQLITE_ROW) { health_log_id = (size_t)sqlite3_column_int64(res, 0); sql_health_alarm_log_insert_detail(host, health_log_id, ae); +#ifdef ENABLE_ACLK + if (netdata_cloud_enabled) + insert_alert_queue( + host, health_log_id, (int64_t)ae->unique_id, (int64_t)ae->alarm_id, ae->old_status, ae->new_status); +#endif } else error_report("HEALTH [%s]: Failed to execute SQL_INSERT_HEALTH_LOG, rc = %d", rrdhost_hostname(host), rc); @@ -162,14 +289,8 @@ void sql_health_alarm_log_save(RRDHOST *host, ALARM_ENTRY *ae) { if (ae->flags & HEALTH_ENTRY_FLAG_SAVED) sql_health_alarm_log_update(host, ae); - else { + else sql_health_alarm_log_insert(host, ae); -#ifdef ENABLE_ACLK - if (netdata_cloud_enabled) { - sql_queue_alarm_to_aclk(host, ae, false); - } -#endif - } } /* @@ -179,44 +300,18 @@ void sql_health_alarm_log_save(RRDHOST *host, ALARM_ENTRY *ae) * */ -#define SQL_CLEANUP_HEALTH_LOG_DETAIL_NOT_CLAIMED \ +#define SQL_CLEANUP_HEALTH_LOG_DETAIL \ "DELETE FROM health_log_detail WHERE health_log_id IN " \ - "(SELECT health_log_id FROM health_log WHERE host_id = @host_id) AND when_key < UNIXEPOCH() - @history " \ - "AND updated_by_id <> 0 AND transition_id NOT IN " \ - "(SELECT last_transition_id FROM health_log hl WHERE hl.host_id = @host_id)" - -#define SQL_CLEANUP_HEALTH_LOG_DETAIL_CLAIMED(guid) \ - "DELETE from health_log_detail WHERE unique_id NOT IN " \ - "(SELECT filtered_alert_unique_id FROM aclk_alert_%s) " \ - "AND unique_id IN (SELECT hld.unique_id FROM health_log hl, health_log_detail hld WHERE " \ - "hl.host_id = @host_id AND hl.health_log_id = hld.health_log_id) " \ - "AND health_log_id IN (SELECT health_log_id FROM health_log WHERE host_id = @host_id) " \ - "AND when_key < unixepoch() - @history " \ - "AND updated_by_id <> 0 AND transition_id NOT IN " \ - "(SELECT last_transition_id FROM health_log hl WHERE hl.host_id = @host_id)", \ - guid - -void sql_health_alarm_log_cleanup(RRDHOST *host, bool claimed) { + " (SELECT health_log_id FROM health_log WHERE host_id = @host_id) AND when_key < UNIXEPOCH() - @history " \ + " AND updated_by_id <> 0 AND transition_id NOT IN " \ + " (SELECT last_transition_id FROM health_log hl WHERE hl.host_id = @host_id)" + +void sql_health_alarm_log_cleanup(RRDHOST *host) +{ sqlite3_stmt *res = NULL; int rc; - char command[MAX_HEALTH_SQL_SIZE + 1]; - - REQUIRE_DB(db_meta); - - char uuid_str[UUID_STR_LEN]; - uuid_unparse_lower_fix(&host->host_uuid, uuid_str); - snprintfz(command, sizeof(command) - 1, "aclk_alert_%s", uuid_str); - bool aclk_table_exists = table_exists_in_database(db_meta, command); - - char *sql = SQL_CLEANUP_HEALTH_LOG_DETAIL_NOT_CLAIMED; - - if (claimed && aclk_table_exists) { - snprintfz(command, sizeof(command) - 1, SQL_CLEANUP_HEALTH_LOG_DETAIL_CLAIMED(uuid_str)); - sql = command; - } - - if (!PREPARE_STATEMENT(db_meta, sql, &res)) + if (!PREPARE_STATEMENT(db_meta, SQL_CLEANUP_HEALTH_LOG_DETAIL, &res)) return; int param = 0; @@ -228,33 +323,21 @@ void sql_health_alarm_log_cleanup(RRDHOST *host, bool claimed) { if (unlikely(rc != SQLITE_DONE)) error_report("Failed to cleanup health log detail table, rc = %d", rc); - if (aclk_table_exists) - sql_aclk_alert_clean_dead_entries(host); - done: REPORT_BIND_FAIL(res, param); SQLITE_FINALIZE(res); } -#define SQL_INJECT_REMOVED \ - "INSERT INTO health_log_detail (health_log_id, unique_id, alarm_id, alarm_event_id, updated_by_id, updates_id, when_key, " \ - "duration, non_clear_duration, flags, exec_run_timestamp, delay_up_to_timestamp, info, exec_code, new_status, old_status, " \ - "delay, new_value, old_value, last_repeat, transition_id, global_id, summary) " \ - "SELECT health_log_id, ?1, ?2, ?3, 0, ?4, UNIXEPOCH(), 0, 0, flags, exec_run_timestamp, UNIXEPOCH(), info, exec_code, -2, " \ - "new_status, delay, NULL, new_value, 0, ?5, NOW_USEC(0), summary FROM health_log_detail WHERE unique_id = ?6 AND transition_id = ?7" - -#define SQL_INJECT_REMOVED_UPDATE_DETAIL \ - "UPDATE health_log_detail SET flags = flags | ?1, updated_by_id = ?2 WHERE unique_id = ?3 AND transition_id = ?4" - -#define SQL_INJECT_REMOVED_UPDATE_LOG \ - "UPDATE health_log SET last_transition_id = ?1 WHERE alarm_id = ?2 AND last_transition_id = ?3 AND host_id = ?4" +#define SQL_UPDATE_TRANSITION_IN_HEALTH_LOG \ + "UPDATE health_log SET last_transition_id = @transition WHERE alarm_id = @alarm_id AND " \ + " last_transition_id = @prev_trans AND host_id = @host_id" -bool sql_update_removed_in_health_log(RRDHOST *host, uint32_t alarm_id, nd_uuid_t *transition_id, nd_uuid_t *last_transition) +bool sql_update_transition_in_health_log(RRDHOST *host, uint32_t alarm_id, nd_uuid_t *transition_id, nd_uuid_t *last_transition) { int rc = 0; sqlite3_stmt *res; - if (!PREPARE_STATEMENT(db_meta, SQL_INJECT_REMOVED_UPDATE_LOG, &res)) + if (!PREPARE_STATEMENT(db_meta, SQL_UPDATE_TRANSITION_IN_HEALTH_LOG, &res)) return false; int param = 0; @@ -275,12 +358,16 @@ done: return (param == 0 && rc == SQLITE_DONE); } -bool sql_update_removed_in_health_log_detail(uint32_t unique_id, uint32_t max_unique_id, nd_uuid_t *prev_transition_id) +#define SQL_SET_UPDATED_BY_IN_HEALTH_LOG_DETAIL \ + "UPDATE health_log_detail SET flags = flags | @flag, updated_by_id = @updated_by WHERE" \ + " unique_id = @unique_id AND transition_id = @transition_id" + +bool sql_set_updated_by_in_health_log_detail(uint32_t unique_id, uint32_t max_unique_id, nd_uuid_t *prev_transition_id) { int rc = 0; sqlite3_stmt *res; - if (!PREPARE_STATEMENT(db_meta, SQL_INJECT_REMOVED_UPDATE_DETAIL, &res)) + if (!PREPARE_STATEMENT(db_meta, SQL_SET_UPDATED_BY_IN_HEALTH_LOG_DETAIL, &res)) return false; int param = 0; @@ -301,7 +388,16 @@ done: return (param == 0 && rc == SQLITE_DONE); } -void sql_inject_removed_status( +#define SQL_INJECT_REMOVED \ + "INSERT INTO health_log_detail (health_log_id, unique_id, alarm_id, alarm_event_id, updated_by_id, updates_id, when_key, " \ + "duration, non_clear_duration, flags, exec_run_timestamp, delay_up_to_timestamp, info, exec_code, new_status, old_status, " \ + "delay, new_value, old_value, last_repeat, transition_id, global_id, summary) " \ + "SELECT health_log_id, @max_unique_id, @alarm_id, @alarm_event_id, 0, @unique_id, UNIXEPOCH(), 0, 0, flags, " \ + " exec_run_timestamp, UNIXEPOCH(), info, exec_code, -2, " \ + " new_status, delay, NULL, new_value, 0, @transition_id, NOW_USEC(0), summary FROM health_log_detail " \ + " WHERE unique_id = @unique_id AND transition_id = @last_transition_id RETURNING health_log_id, old_status" + +static void sql_inject_removed_status( RRDHOST *host, uint32_t alarm_id, uint32_t alarm_event_id, @@ -326,19 +422,27 @@ void sql_inject_removed_status( SQLITE_BIND_FAIL(done, sqlite3_bind_int64(res, ++param, (sqlite3_int64) alarm_event_id + 1)); SQLITE_BIND_FAIL(done, sqlite3_bind_int64(res, ++param, (sqlite3_int64) unique_id)); SQLITE_BIND_FAIL(done, sqlite3_bind_blob(res, ++param, &transition_id, sizeof(transition_id), SQLITE_STATIC)); - SQLITE_BIND_FAIL(done, sqlite3_bind_int64(res, ++param, (sqlite3_int64) unique_id)); SQLITE_BIND_FAIL(done, sqlite3_bind_blob(res, ++param, last_transition, sizeof(*last_transition), SQLITE_STATIC)); param = 0; - int rc = execute_insert(res); - if (rc == SQLITE_DONE) { + //int rc = execute_insert(res); + while (sqlite3_step_monitored(res) == SQLITE_ROW) { //update the old entry in health_log_detail - sql_update_removed_in_health_log_detail(unique_id, max_unique_id, last_transition); + sql_set_updated_by_in_health_log_detail(unique_id, max_unique_id, last_transition); //update the old entry in health_log - sql_update_removed_in_health_log(host, alarm_id, &transition_id, last_transition); + sql_update_transition_in_health_log(host, alarm_id, &transition_id, last_transition); + +#ifdef ENABLE_ACLK + if (netdata_cloud_enabled) { + int64_t health_log_id = sqlite3_column_int64(res, 0); + RRDCALC_STATUS old_status = (RRDCALC_STATUS)sqlite3_column_double(res, 1); + insert_alert_queue( + host, health_log_id, (int64_t)unique_id, (int64_t)alarm_id, old_status, RRDCALC_STATUS_REMOVED); + } +#endif } - else - error_report("HEALTH [N/A]: Failed to execute SQL_INJECT_REMOVED, rc = %d", rc); + //else + // error_report("HEALTH [N/A]: Failed to execute SQL_INJECT_REMOVED, rc = %d", rc); done: REPORT_BIND_FAIL(res, param); @@ -461,7 +565,7 @@ void sql_alert_cleanup(bool cli) { UNUSED(cli); - errno = 0; + errno_clear(); if (sql_init_meta_database(DB_CHECK_NONE, 0)) { netdata_log_error("Failed to open database"); return; @@ -489,7 +593,6 @@ void sql_alert_cleanup(bool cli) void sql_health_alarm_log_load(RRDHOST *host) { sqlite3_stmt *res = NULL; - int ret; ssize_t errored = 0, loaded = 0; if (!REQUIRE_DB(db_meta)) @@ -500,21 +603,19 @@ void sql_health_alarm_log_load(RRDHOST *host) if (!PREPARE_STATEMENT(db_meta, SQL_LOAD_HEALTH_LOG, &res)) return; - ret = sqlite3_bind_blob(res, 1, &host->host_uuid, sizeof(host->host_uuid), SQLITE_STATIC); - if (unlikely(ret != SQLITE_OK)) { - error_report("Failed to bind host_id parameter for SQL_LOAD_HEALTH_LOG."); - SQLITE_FINALIZE(res); - return; - } + int param = 0; + SQLITE_BIND_FAIL(done, sqlite3_bind_blob(res, ++param, &host->host_uuid, sizeof(host->host_uuid), SQLITE_STATIC)); DICTIONARY *all_rrdcalcs = dictionary_create( DICT_OPTION_NAME_LINK_DONT_CLONE | DICT_OPTION_VALUE_LINK_DONT_CLONE | DICT_OPTION_DONT_OVERWRITE_VALUE); + RRDCALC *rc; foreach_rrdcalc_in_rrdhost_read(host, rc) { dictionary_set(all_rrdcalcs, rrdcalc_name(rc), rc, sizeof(*rc)); } foreach_rrdcalc_in_rrdhost_done(rc); + param = 0; rw_spinlock_read_lock(&host->health_log.spinlock); while (sqlite3_step_monitored(res) == SQLITE_ROW) { @@ -618,8 +719,6 @@ void sql_health_alarm_log_load(RRDHOST *host) ae->summary = SQLITE3_COLUMN_STRINGDUP_OR_NULL(res, 33); char value_string[100 + 1]; - string_freez(ae->old_value_string); - string_freez(ae->new_value_string); ae->old_value_string = string_strdupz(format_value_and_unit(value_string, 100, ae->old_value, ae_units(ae), -1)); ae->new_value_string = string_strdupz(format_value_and_unit(value_string, 100, ae->new_value, ae_units(ae), -1)); @@ -631,7 +730,6 @@ void sql_health_alarm_log_load(RRDHOST *host) if(unlikely(ae->alarm_id >= host->health_max_alarm_id)) host->health_max_alarm_id = ae->alarm_id; - loaded++; } @@ -650,7 +748,8 @@ void sql_health_alarm_log_load(RRDHOST *host) nd_log(NDLS_DAEMON, errored ? NDLP_WARNING : NDLP_DEBUG, "[%s]: Table health_log, loaded %zd alarm entries, errors in %zd entries.", rrdhost_hostname(host), loaded, errored); - +done: + REPORT_BIND_FAIL(res, param); SQLITE_FINALIZE(res); } diff --git a/src/database/sqlite/sqlite_health.h b/src/database/sqlite/sqlite_health.h index 99f67a3a6..73a85e2b2 100644 --- a/src/database/sqlite/sqlite_health.h +++ b/src/database/sqlite/sqlite_health.h @@ -6,14 +6,17 @@ #include "daemon/common.h" #include "sqlite3.h" +#define ALERT_TRANSITION_DELAY_LONG (600) +#define ALERT_TRANSITION_DELAY_SHORT (10) +#define ALERT_TRANSITION_DELAY_NONE (0) + struct sql_alert_transition_data; struct sql_alert_config_data; struct rrd_alert_prototype; void sql_health_alarm_log_load(RRDHOST *host); void sql_health_alarm_log_save(RRDHOST *host, ALARM_ENTRY *ae); -void sql_health_alarm_log_cleanup(RRDHOST *host, bool claimed); +void sql_health_alarm_log_cleanup(RRDHOST *host); void sql_alert_store_config(struct rrd_alert_prototype *ap); -void sql_aclk_alert_clean_dead_entries(RRDHOST *host); int sql_health_get_last_executed_event(RRDHOST *host, ALARM_ENTRY *ae, RRDCALC_STATUS *last_executed_status); void sql_health_alarm_log2json(RRDHOST *host, BUFFER *wb, time_t after, const char *chart); int health_migrate_old_health_log_table(char *table); diff --git a/src/database/sqlite/sqlite_metadata.c b/src/database/sqlite/sqlite_metadata.c index 5573f7994..1b801b731 100644 --- a/src/database/sqlite/sqlite_metadata.c +++ b/src/database/sqlite/sqlite_metadata.c @@ -28,6 +28,17 @@ const char *database_config[] = { "CREATE TABLE IF NOT EXISTS chart_label(chart_id blob, source_type int, label_key text, " "label_value text, date_created int, PRIMARY KEY (chart_id, label_key))", + "CREATE TRIGGER IF NOT EXISTS del_chart_label AFTER DELETE ON chart " + "BEGIN DELETE FROM chart_label WHERE chart_id = old.chart_id; END", + + "CREATE TRIGGER IF NOT EXISTS del_chart " + "AFTER DELETE ON dimension " + "FOR EACH ROW " + "BEGIN" + " DELETE FROM chart WHERE chart_id = OLD.chart_id " + " AND NOT EXISTS (SELECT 1 FROM dimension WHERE chart_id = OLD.chart_id);" + "END", + "CREATE TABLE IF NOT EXISTS node_instance (host_id blob PRIMARY KEY, claim_id, node_id, date_created)", "CREATE TABLE IF NOT EXISTS alert_hash(hash_id blob PRIMARY KEY, date_updated int, alarm text, template text, " @@ -67,6 +78,18 @@ const char *database_config[] = { "CREATE INDEX IF NOT EXISTS health_log_d_ind_7 on health_log_detail (alarm_id)", "CREATE INDEX IF NOT EXISTS health_log_d_ind_8 on health_log_detail (new_status, updated_by_id)", +#ifdef ENABLE_ACLK + "CREATE TABLE IF NOT EXISTS alert_queue " + " (host_id BLOB, health_log_id INT, unique_id INT, alarm_id INT, status INT, date_scheduled INT, " + " UNIQUE(host_id, health_log_id, alarm_id))", + + "CREATE TABLE IF NOT EXISTS alert_version (health_log_id INTEGER PRIMARY KEY, unique_id INT, status INT, " + "version INT, date_submitted INT)", + + "CREATE TABLE IF NOT EXISTS aclk_queue (sequence_id INTEGER PRIMARY KEY, host_id blob, health_log_id INT, " + "unique_id INT, date_created INT, UNIQUE(host_id, health_log_id))", +#endif + NULL }; @@ -251,7 +274,7 @@ static inline void set_host_node_id(RRDHOST *host, nd_uuid_t *node_id) } if (unlikely(!wc)) - sql_create_aclk_table(host, &host->host_uuid, node_id); + create_aclk_config(host, &host->host_uuid, node_id); else uuid_unparse_lower(*node_id, wc->node_id); } @@ -668,6 +691,18 @@ int sql_init_meta_database(db_check_action_type_t rebuild, int memory) if (rebuild & DB_CHECK_RECOVER) return 0; } + + snprintfz(sqlite_database, sizeof(sqlite_database) - 1, "%s/.netdata-meta.db.delete", netdata_configured_cache_dir); + rc = unlink(sqlite_database); + snprintfz(sqlite_database, FILENAME_MAX, "%s/netdata-meta.db", netdata_configured_cache_dir); + if (rc == 0) { + char new_sqlite_database[FILENAME_MAX + 1]; + snprintfz(new_sqlite_database, sizeof(new_sqlite_database) - 1, "%s/netdata-meta.bad", netdata_configured_cache_dir); + rc = rename(sqlite_database, new_sqlite_database); + if (rc) + error_report("Failed to rename %s to %s", sqlite_database, new_sqlite_database); + } + // note: sqlite_database contains the right name } else strncpyz(sqlite_database, ":memory:", sizeof(sqlite_database) - 1); @@ -699,7 +734,7 @@ int sql_init_meta_database(db_check_action_type_t rebuild, int memory) } if (rebuild & DB_CHECK_ANALYZE) { - errno = 0; + errno_clear(); netdata_log_info("Running ANALYZE on %s", sqlite_database); rc = sqlite3_exec_monitored(db_meta, "ANALYZE", 0, 0, &err_msg); if (rc != SQLITE_OK) { @@ -713,7 +748,7 @@ int sql_init_meta_database(db_check_action_type_t rebuild, int memory) return 1; } - errno = 0; + errno_clear(); netdata_log_info("SQLite database %s initialization", sqlite_database); rc = sqlite3_create_function(db_meta, "u2h", 1, SQLITE_ANY | SQLITE_DETERMINISTIC, 0, sqlite_uuid_parse, 0, 0); @@ -1430,11 +1465,10 @@ static void cleanup_health_log(struct metadata_wc *wc) RRDHOST *host; - bool is_claimed = claimed(); dfe_start_reentrant(rrdhost_root_index, host){ if (rrdhost_flag_check(host, RRDHOST_FLAG_ARCHIVED)) continue; - sql_health_alarm_log_cleanup(host, is_claimed); + sql_health_alarm_log_cleanup(host); if (unlikely(metadata_flag_check(wc, METADATA_FLAG_SHUTDOWN))) break; } @@ -1445,6 +1479,9 @@ static void cleanup_health_log(struct metadata_wc *wc) (void) db_execute(db_meta,"DELETE FROM health_log WHERE host_id NOT IN (SELECT host_id FROM host)"); (void) db_execute(db_meta,"DELETE FROM health_log_detail WHERE health_log_id NOT IN (SELECT health_log_id FROM health_log)"); +#ifdef ENABLE_ACLK + (void) db_execute(db_meta,"DELETE FROM alert_version WHERE health_log_id NOT IN (SELECT health_log_id FROM health_log)"); +#endif } // diff --git a/src/exporting/send_data.c b/src/exporting/send_data.c index b79f0a3e3..097b7fd4b 100644 --- a/src/exporting/send_data.c +++ b/src/exporting/send_data.c @@ -77,7 +77,7 @@ void simple_connector_receive_response(int *sock, struct instance *instance) ERR_clear_error(); #endif - errno = 0; + errno_clear(); // loop through to collect all data while (*sock != -1 && errno != EWOULDBLOCK) { diff --git a/src/go/collectors/go.d.plugin/cmd/godplugin/main.go b/src/go/cmd/godplugin/main.go index 5ff6c7263..cae9fa1b4 100644 --- a/src/go/collectors/go.d.plugin/cmd/godplugin/main.go +++ b/src/go/cmd/godplugin/main.go @@ -12,20 +12,22 @@ import ( "path/filepath" "strings" - "github.com/netdata/netdata/go/go.d.plugin/agent" - "github.com/netdata/netdata/go/go.d.plugin/agent/executable" - "github.com/netdata/netdata/go/go.d.plugin/cli" - "github.com/netdata/netdata/go/go.d.plugin/logger" - "github.com/netdata/netdata/go/go.d.plugin/pkg/buildinfo" - "github.com/netdata/netdata/go/go.d.plugin/pkg/multipath" + "github.com/netdata/netdata/go/plugins/logger" + "github.com/netdata/netdata/go/plugins/pkg/buildinfo" + "github.com/netdata/netdata/go/plugins/pkg/executable" + "github.com/netdata/netdata/go/plugins/plugin/go.d/agent" + "github.com/netdata/netdata/go/plugins/plugin/go.d/cli" + "github.com/netdata/netdata/go/plugins/plugin/go.d/pkg/multipath" "github.com/jessevdk/go-flags" "golang.org/x/net/http/httpproxy" - _ "github.com/netdata/netdata/go/go.d.plugin/modules" + _ "github.com/netdata/netdata/go/plugins/plugin/go.d/modules" ) var ( + cygwinBasePath = os.Getenv("NETDATA_CYGWIN_BASE_PATH") + name = "go.d" userDir = os.Getenv("NETDATA_USER_CONFIG_DIR") stockDir = os.Getenv("NETDATA_STOCK_CONFIG_DIR") @@ -35,6 +37,14 @@ var ( envLogLevel = os.Getenv("NETDATA_LOG_LEVEL") ) +func init() { + userDir = handleDirOnWin(userDir) + stockDir = handleDirOnWin(stockDir) + varLibDir = handleDirOnWin(varLibDir) + lockDir = handleDirOnWin(lockDir) + watchPath = handleDirOnWin(watchPath) +} + func confDir(opts *cli.Option) multipath.MultiPath { if len(opts.ConfDir) > 0 { return opts.ConfDir @@ -48,7 +58,10 @@ func confDir(opts *cli.Option) multipath.MultiPath { dirs = append(dirs, filepath.Join(executable.Directory, "/../../../../etc/netdata")) - for _, dir := range []string{"/etc/netdata", "/opt/netdata/etc/netdata"} { + for _, dir := range []string{ + handleDirOnWin("/etc/netdata"), + handleDirOnWin("/opt/netdata/etc/netdata"), + } { if isDirExists(dir) { dirs = append(dirs, dir) break @@ -57,7 +70,10 @@ func confDir(opts *cli.Option) multipath.MultiPath { dirs = append(dirs, filepath.Join(executable.Directory, "/../../../../usr/lib/netdata/conf.d")) - for _, dir := range []string{"/usr/lib/netdata/conf.d", "/opt/netdata/usr/lib/netdata/conf.d"} { + for _, dir := range []string{ + handleDirOnWin("/usr/lib/netdata/conf.d"), + handleDirOnWin("/opt/netdata/usr/lib/netdata/conf.d"), + } { if isDirExists(dir) { dirs = append(dirs, dir) break @@ -170,3 +186,18 @@ func isDirExists(dir string) bool { } return !errors.Is(err, fs.ErrNotExist) } + +func handleDirOnWin(path string) string { + base := cygwinBasePath + + // TODO: temp workaround for debug mode + if base == "" && strings.HasPrefix(executable.Directory, "C:\\msys64") { + base = "C:\\msys64" + } + + if base == "" || !strings.HasPrefix(path, "/") { + return path + } + + return filepath.Join(base, path) +} diff --git a/src/go/collectors/go.d.plugin/README.md b/src/go/collectors/go.d.plugin/README.md deleted file mode 100644 index 5100e518c..000000000 --- a/src/go/collectors/go.d.plugin/README.md +++ /dev/null @@ -1,227 +0,0 @@ -<!-- -title: go.d.plugin -description: "go.d.plugin is an external plugin for Netdata, responsible for running individual data collectors written in Go." -custom_edit_url: "/src/go/collectors/go.d.plugin/README.md" -sidebar_label: "go.d.plugin" -learn_status: "Published" -learn_topic_type: "Tasks" -learn_rel_path: "Developers/External plugins/go.d.plugin" -sidebar_position: 1 ---> - -# go.d.plugin - -`go.d.plugin` is a [Netdata](https://github.com/netdata/netdata) external plugin. It is an **orchestrator** for data -collection modules written in `go`. - -1. It runs as an independent process (`ps fax` shows it). -2. It is started and stopped automatically by Netdata. -3. It communicates with Netdata via a unidirectional pipe (sending data to the Netdata daemon). -4. Supports any number of data collection modules. -5. Allows each module to have any number of data collection jobs. - -## Bug reports, feature requests, and questions - -Are welcome! We are using [netdata/netdata](https://github.com/netdata/netdata/) repository for bugs, feature requests, -and questions. - -- [GitHub Issues](https://github.com/netdata/netdata/issues/new/choose): report bugs or open a new feature request. -- [GitHub Discussions](https://github.com/netdata/netdata/discussions): ask a question or suggest a new idea. - -## Install - -Go.d.plugin is shipped with Netdata. - -### Required Linux capabilities - -All capabilities are set automatically during Netdata installation using -the [official installation method](/packaging/installer/README.md#install-on-linux-with-one-line-installer). -No further action required. If you have used a different installation method and need to set the capabilities manually, -see the appropriate collector readme. - -| Capability | Required by | -|:--------------------|:------------------------------------------------------------------------------------------------------------------:| -| CAP_NET_RAW | [Ping](https://github.com/netdata/netdata/tree/master/src/go/collectors/go.d.plugin/modules/ping#readme) | -| CAP_NET_ADMIN | [Wireguard](https://github.com/netdata/netdata/tree/master/src/go/collectors/go.d.plugin/modules/wireguard#readme) | -| CAP_DAC_READ_SEARCH | [Filecheck](https://github.com/netdata/netdata/tree/master/src/go/collectors/go.d.plugin/modules/filecheck#readme) | - -## Available modules - -| Name | Monitors | -|:------------------------------------------------------------------------------------------------------------------------------|:-----------------------------:| -| [adaptec_raid](https://github.com/netdata/netdata/tree/master/src/go/collectors/go.d.plugin/modules/adaptecraid) | Adaptec Hardware RAID | -| [activemq](https://github.com/netdata/netdata/tree/master/src/go/collectors/go.d.plugin/modules/activemq) | ActiveMQ | -| [apache](https://github.com/netdata/netdata/tree/master/src/go/collectors/go.d.plugin/modules/apache) | Apache | -| [bind](https://github.com/netdata/netdata/tree/master/src/go/collectors/go.d.plugin/modules/bind) | ISC Bind | -| [cassandra](https://github.com/netdata/netdata/tree/master/src/go/collectors/go.d.plugin/modules/cassandra) | Cassandra | -| [chrony](https://github.com/netdata/netdata/tree/master/src/go/collectors/go.d.plugin/modules/chrony) | Chrony | -| [clickhouse](https://github.com/netdata/netdata/tree/master/src/go/collectors/go.d.plugin/modules/clickhouse) | ClickHouse | -| [cockroachdb](https://github.com/netdata/netdata/tree/master/src/go/collectors/go.d.plugin/modules/cockroachdb) | CockroachDB | -| [consul](https://github.com/netdata/netdata/tree/master/src/go/collectors/go.d.plugin/modules/consul) | Consul | -| [coredns](https://github.com/netdata/netdata/tree/master/src/go/collectors/go.d.plugin/modules/coredns) | CoreDNS | -| [couchbase](https://github.com/netdata/netdata/tree/master/src/go/collectors/go.d.plugin/modules/couchbase) | Couchbase | -| [couchdb](https://github.com/netdata/netdata/tree/master/src/go/collectors/go.d.plugin/modules/couchdb) | CouchDB | -| [dmcache](https://github.com/netdata/netdata/tree/master/src/go/collectors/go.d.plugin/modules/dmcache) | DMCache | -| [dnsdist](https://github.com/netdata/netdata/tree/master/src/go/collectors/go.d.plugin/modules/dnsdist) | Dnsdist | -| [dnsmasq](https://github.com/netdata/netdata/tree/master/src/go/collectors/go.d.plugin/modules/dnsmasq) | Dnsmasq DNS Forwarder | -| [dnsmasq_dhcp](https://github.com/netdata/netdata/tree/master/src/go/collectors/go.d.plugin/modules/dnsmasq_dhcp) | Dnsmasq DHCP | -| [dns_query](https://github.com/netdata/netdata/tree/master/src/go/collectors/go.d.plugin/modules/dnsquery) | DNS Query RTT | -| [docker](https://github.com/netdata/netdata/tree/master/src/go/collectors/go.d.plugin/modules/docker) | Docker Engine | -| [docker_engine](https://github.com/netdata/netdata/tree/master/src/go/collectors/go.d.plugin/modules/docker_engine) | Docker Engine | -| [dockerhub](https://github.com/netdata/netdata/tree/master/src/go/collectors/go.d.plugin/modules/dockerhub) | Docker Hub | -| [elasticsearch](https://github.com/netdata/netdata/tree/master/src/go/collectors/go.d.plugin/modules/elasticsearch) | Elasticsearch/OpenSearch | -| [envoy](https://github.com/netdata/netdata/tree/master/src/go/collectors/go.d.plugin/modules/envoy) | Envoy | -| [example](https://github.com/netdata/netdata/tree/master/src/go/collectors/go.d.plugin/modules/example) | - | -| [fail2ban](https://github.com/netdata/netdata/tree/master/src/go/collectors/go.d.plugin/modules/fail2ban) | Fail2Ban Jails | -| [filecheck](https://github.com/netdata/netdata/tree/master/src/go/collectors/go.d.plugin/modules/filecheck) | Files and Directories | -| [fluentd](https://github.com/netdata/netdata/tree/master/src/go/collectors/go.d.plugin/modules/fluentd) | Fluentd | -| [freeradius](https://github.com/netdata/netdata/tree/master/src/go/collectors/go.d.plugin/modules/freeradius) | FreeRADIUS | -| [haproxy](https://github.com/netdata/netdata/tree/master/src/go/collectors/go.d.plugin/modules/haproxy) | HAProxy | -| [hddtemp](https://github.com/netdata/netdata/tree/master/src/go/collectors/go.d.plugin/modules/hddtemp) | Disks temperature | -| [hdfs](https://github.com/netdata/netdata/tree/master/src/go/collectors/go.d.plugin/modules/hdfs) | HDFS | -| [hpssa](https://github.com/netdata/netdata/tree/master/src/go/collectors/go.d.plugin/modules/hpssa) | HPE Smart Array | -| [httpcheck](https://github.com/netdata/netdata/tree/master/src/go/collectors/go.d.plugin/modules/httpcheck) | Any HTTP Endpoint | -| [intelgpu](https://github.com/netdata/netdata/tree/master/src/go/collectors/go.d.plugin/modules/intelgpu) | Intel integrated GPU | -| [isc_dhcpd](https://github.com/netdata/netdata/tree/master/src/go/collectors/go.d.plugin/modules/isc_dhcpd) | ISC DHCP | -| [k8s_kubelet](https://github.com/netdata/netdata/tree/master/src/go/collectors/go.d.plugin/modules/k8s_kubelet) | Kubelet | -| [k8s_kubeproxy](https://github.com/netdata/netdata/tree/master/src/go/collectors/go.d.plugin/modules/k8s_kubeproxy) | Kube-proxy | -| [k8s_state](https://github.com/netdata/netdata/tree/master/src/go/collectors/go.d.plugin/modules/k8s_state) | Kubernetes cluster state | -| [lighttpd](https://github.com/netdata/netdata/tree/master/src/go/collectors/go.d.plugin/modules/lighttpd) | Lighttpd | -| [litespeed](https://github.com/netdata/netdata/tree/master/src/go/collectors/go.d.plugin/modules/litespeed) | Litespeed | -| [logind](https://github.com/netdata/netdata/tree/master/src/go/collectors/go.d.plugin/modules/logind) | systemd-logind | -| [logstash](https://github.com/netdata/netdata/tree/master/src/go/collectors/go.d.plugin/modules/logstash) | Logstash | -| [lvm](https://github.com/netdata/netdata/tree/master/src/go/collectors/go.d.plugin/modules/lvm) | LVM logical volumes | -| [megacli](https://github.com/netdata/netdata/tree/master/src/go/collectors/go.d.plugin/modules/megacli) | MegaCli Hardware Raid | -| [mongoDB](https://github.com/netdata/netdata/tree/master/src/go/collectors/go.d.plugin/modules/mongodb) | MongoDB | -| [mysql](https://github.com/netdata/netdata/tree/master/src/go/collectors/go.d.plugin/modules/mysql) | MySQL | -| [nginx](https://github.com/netdata/netdata/tree/master/src/go/collectors/go.d.plugin/modules/nginx) | NGINX | -| [nginxplus](https://github.com/netdata/netdata/tree/master/src/go/collectors/go.d.plugin/modules/nginxplus) | NGINX Plus | -| [nginxvts](https://github.com/netdata/netdata/tree/master/src/go/collectors/go.d.plugin/modules/nginxvts) | NGINX VTS | -| [ntpd](https://github.com/netdata/netdata/tree/master/src/go/collectors/go.d.plugin/modules/ntpd) | NTP daemon | -| [nvme](https://github.com/netdata/netdata/tree/master/src/go/collectors/go.d.plugin/modules/nvme) | NVMe devices | -| [openvpn](https://github.com/netdata/netdata/tree/master/src/go/collectors/go.d.plugin/modules/openvpn) | OpenVPN | -| [openvpn_status_log](https://github.com/netdata/netdata/tree/master/src/go/collectors/go.d.plugin/modules/openvpn_status_log) | OpenVPN | -| [pgbouncer](https://github.com/netdata/netdata/tree/master/src/go/collectors/go.d.plugin/modules/pgbouncer) | PgBouncer | -| [phpdaemon](https://github.com/netdata/netdata/tree/master/src/go/collectors/go.d.plugin/modules/phpdaemon) | phpDaemon | -| [phpfpm](https://github.com/netdata/netdata/tree/master/src/go/collectors/go.d.plugin/modules/phpfpm) | PHP-FPM | -| [pihole](https://github.com/netdata/netdata/tree/master/src/go/collectors/go.d.plugin/modules/pihole) | Pi-hole | -| [pika](https://github.com/netdata/netdata/tree/master/src/go/collectors/go.d.plugin/modules/pika) | Pika | -| [ping](https://github.com/netdata/netdata/tree/master/src/go/collectors/go.d.plugin/modules/ping) | Any network host | -| [prometheus](https://github.com/netdata/netdata/tree/master/src/go/collectors/go.d.plugin/modules/prometheus) | Any Prometheus Endpoint | -| [portcheck](https://github.com/netdata/netdata/tree/master/src/go/collectors/go.d.plugin/modules/portcheck) | Any TCP Endpoint | -| [postgres](https://github.com/netdata/netdata/tree/master/src/go/collectors/go.d.plugin/modules/postgres) | PostgreSQL | -| [powerdns](https://github.com/netdata/netdata/tree/master/src/go/collectors/go.d.plugin/modules/powerdns) | PowerDNS Authoritative Server | -| [powerdns_recursor](https://github.com/netdata/netdata/tree/master/src/go/collectors/go.d.plugin/modules/powerdns_recursor) | PowerDNS Recursor | -| [proxysql](https://github.com/netdata/netdata/tree/master/src/go/collectors/go.d.plugin/modules/proxysql) | ProxySQL | -| [pulsar](https://github.com/netdata/netdata/tree/master/src/go/collectors/go.d.plugin/modules/portcheck) | Apache Pulsar | -| [rabbitmq](https://github.com/netdata/netdata/tree/master/src/go/collectors/go.d.plugin/modules/rabbitmq) | RabbitMQ | -| [redis](https://github.com/netdata/netdata/tree/master/src/go/collectors/go.d.plugin/modules/redis) | Redis | -| [rspamd](https://github.com/netdata/netdata/tree/master/src/go/collectors/go.d.plugin/modules/rspamd) | Rspamd | -| [scaleio](https://github.com/netdata/netdata/tree/master/src/go/collectors/go.d.plugin/modules/scaleio) | Dell EMC ScaleIO | -| [sensors](https://github.com/netdata/netdata/tree/master/src/go/collectors/go.d.plugin/modules) | Hardware Sensors | -| [SNMP](https://github.com/netdata/netdata/blob/master/src/go/collectors/go.d.plugin/modules/snmp) | SNMP | -| [squidlog](https://github.com/netdata/netdata/tree/master/src/go/collectors/go.d.plugin/modules/squidlog) | Squid | -| [smartctl](https://github.com/netdata/netdata/tree/master/src/go/collectors/go.d.plugin/modules/smartctl) | S.M.A.R.T Storage Devices | -| [storcli](https://github.com/netdata/netdata/tree/master/src/go/collectors/go.d.plugin/modules/storcli) | Broadcom Hardware RAID | -| [supervisord](https://github.com/netdata/netdata/tree/master/src/go/collectors/go.d.plugin/modules/supervisord) | Supervisor | -| [systemdunits](https://github.com/netdata/netdata/tree/master/src/go/collectors/go.d.plugin/modules/systemdunits) | Systemd unit state | -| [tengine](https://github.com/netdata/netdata/tree/master/src/go/collectors/go.d.plugin/modules/tengine) | Tengine | -| [traefik](https://github.com/netdata/netdata/tree/master/src/go/collectors/go.d.plugin/modules/traefik) | Traefik | -| [upsd](https://github.com/netdata/netdata/tree/master/src/go/collectors/go.d.plugin/modules/upsd) | UPSd (Nut) | -| [unbound](https://github.com/netdata/netdata/tree/master/src/go/collectors/go.d.plugin/modules/unbound) | Unbound | -| [vcsa](https://github.com/netdata/netdata/tree/master/src/go/collectors/go.d.plugin/modules/vcsa) | vCenter Server Appliance | -| [vernemq](https://github.com/netdata/netdata/tree/master/src/go/collectors/go.d.plugin/modules/vernemq) | VerneMQ | -| [vsphere](https://github.com/netdata/netdata/tree/master/src/go/collectors/go.d.plugin/modules/vsphere) | VMware vCenter Server | -| [web_log](https://github.com/netdata/netdata/tree/master/src/go/collectors/go.d.plugin/modules/weblog) | Apache/NGINX | -| [wireguard](https://github.com/netdata/netdata/tree/master/src/go/collectors/go.d.plugin/modules/wireguard) | WireGuard | -| [whoisquery](https://github.com/netdata/netdata/tree/master/src/go/collectors/go.d.plugin/modules/whoisquery) | Domain Expiry | -| [windows](https://github.com/netdata/netdata/tree/master/src/go/collectors/go.d.plugin/modules/windows) | Windows | -| [x509check](https://github.com/netdata/netdata/tree/master/src/go/collectors/go.d.plugin/modules/x509check) | Digital Certificates | -| [zfspool](https://github.com/netdata/netdata/tree/master/src/go/collectors/go.d.plugin/modules/zfspool) | ZFS Pools | -| [zookeeper](https://github.com/netdata/netdata/tree/master/src/go/collectors/go.d.plugin/modules/zookeeper) | ZooKeeper | - -## Configuration - -Edit the `go.d.conf` configuration file using `edit-config` from the -Netdata [config directory](/docs/netdata-agent/configuration/README.md#the-netdata-config-directory), -which is typically at `/etc/netdata`. - -```bash -cd /etc/netdata # Replace this path with your Netdata config directory -sudo ./edit-config go.d.conf -``` - -Configurations are written in [YAML](http://yaml.org/). - -- [plugin configuration](https://github.com/netdata/netdata/blob/master/src/go/collectors/go.d.plugin/config/go.d.conf) -- [specific module configuration](https://github.com/netdata/netdata/tree/master/src/go/collectors/go.d.plugin/config/go.d) - -### Enable a collector - -To enable a collector you should edit `go.d.conf` to uncomment the collector in question and change it from `no` -to `yes`. - -For example, to enable the `example` plugin you would need to update `go.d.conf` from something like: - -```yaml -modules: -# example: no -``` - -to - -```yaml -modules: - example: yes -``` - -Then [restart netdata](/packaging/installer/README.md#maintaining-a-netdata-agent-installation) -for the change to take effect. - -## Contributing - -If you want to contribute to this project, we are humbled. Please take a look at -our [contributing guidelines](https://github.com/netdata/.github/blob/main/CONTRIBUTING.md) and don't hesitate to -contact us in our forums. - -### How to develop a collector - -Read [how to write a Netdata collector in Go](/src/go/collectors/go.d.plugin/docs/how-to-write-a-module.md). - -## Troubleshooting - -Plugin CLI: - -```sh -Usage: - orchestrator [OPTIONS] [update every] - -Application Options: - -m, --modules= module name to run (default: all) - -c, --config-dir= config dir to read - -w, --watch-path= config path to watch - -d, --debug debug mode - -v, --version display the version and exit - -Help Options: - -h, --help Show this help message -``` - -To debug specific module: - -```sh -# become user netdata -sudo su -s /bin/bash netdata - -# run plugin in debug mode -./go.d.plugin -d -m <module name> -``` - -Change `<module name>` to the [module name](#available-modules) you want to debug. - -## Netdata Community - -This repository follows the Netdata Code of Conduct and is part of the Netdata Community. - -- [Community Forums](https://community.netdata.cloud) -- [Netdata Code of Conduct](https://github.com/netdata/.github/blob/main/CODE_OF_CONDUCT.md) diff --git a/src/go/collectors/go.d.plugin/agent/functions/manager.go b/src/go/collectors/go.d.plugin/agent/functions/manager.go deleted file mode 100644 index 365d0670b..000000000 --- a/src/go/collectors/go.d.plugin/agent/functions/manager.go +++ /dev/null @@ -1,136 +0,0 @@ -// SPDX-License-Identifier: GPL-3.0-or-later - -package functions - -import ( - "bufio" - "context" - "encoding/json" - "fmt" - "io" - "log/slog" - "os" - "strconv" - "strings" - "sync" - "time" - - "github.com/netdata/netdata/go/go.d.plugin/agent/netdataapi" - "github.com/netdata/netdata/go/go.d.plugin/agent/safewriter" - "github.com/netdata/netdata/go/go.d.plugin/logger" - - "github.com/mattn/go-isatty" - "github.com/muesli/cancelreader" -) - -var isTerminal = isatty.IsTerminal(os.Stdout.Fd()) || isatty.IsTerminal(os.Stdin.Fd()) - -func NewManager() *Manager { - return &Manager{ - Logger: logger.New().With( - slog.String("component", "functions manager"), - ), - Input: os.Stdin, - api: netdataapi.New(safewriter.Stdout), - mux: &sync.Mutex{}, - FunctionRegistry: make(map[string]func(Function)), - } -} - -type Manager struct { - *logger.Logger - - Input io.Reader - api *netdataapi.API - mux *sync.Mutex - FunctionRegistry map[string]func(Function) -} - -func (m *Manager) Run(ctx context.Context) { - m.Info("instance is started") - defer func() { m.Info("instance is stopped") }() - - if !isTerminal { - r, err := cancelreader.NewReader(m.Input) - if err != nil { - m.Errorf("fail to create cancel reader: %v", err) - return - } - - go func() { <-ctx.Done(); r.Cancel() }() - - var wg sync.WaitGroup - - wg.Add(1) - go func() { defer wg.Done(); m.run(r) }() - - wg.Wait() - _ = r.Close() - } - - <-ctx.Done() -} - -func (m *Manager) run(r io.Reader) { - sc := bufio.NewScanner(r) - - for sc.Scan() { - text := sc.Text() - - var fn *Function - var err error - - // FIXME: if we are waiting for FUNCTION_PAYLOAD_END and a new FUNCTION* appears, - // we need to discard the current one and switch to the new one - switch { - case strings.HasPrefix(text, "FUNCTION "): - fn, err = parseFunction(text) - case strings.HasPrefix(text, "FUNCTION_PAYLOAD "): - fn, err = parseFunctionWithPayload(text, sc) - case text == "": - continue - default: - m.Warningf("unexpected line: '%s'", text) - continue - } - - if err != nil { - m.Warningf("parse function: %v ('%s')", err, text) - continue - } - - function, ok := m.lookupFunction(fn.Name) - if !ok { - m.Infof("skipping execution of '%s': unregistered function", fn.Name) - m.respf(fn, 501, "unregistered function: %s", fn.Name) - continue - } - if function == nil { - m.Warningf("skipping execution of '%s': nil function registered", fn.Name) - m.respf(fn, 501, "nil function: %s", fn.Name) - continue - } - - function(*fn) - } -} - -func (m *Manager) lookupFunction(name string) (func(Function), bool) { - m.mux.Lock() - defer m.mux.Unlock() - - f, ok := m.FunctionRegistry[name] - return f, ok -} - -func (m *Manager) respf(fn *Function, code int, msgf string, a ...any) { - bs, _ := json.Marshal(struct { - Status int `json:"status"` - Message string `json:"message"` - }{ - Status: code, - Message: fmt.Sprintf(msgf, a...), - }) - ts := strconv.FormatInt(time.Now().Unix(), 10) - m.api.FUNCRESULT(fn.UID, "application/json", string(bs), strconv.Itoa(code), ts) -} diff --git a/src/go/collectors/go.d.plugin/config/go.d/snmp.conf b/src/go/collectors/go.d.plugin/config/go.d/snmp.conf deleted file mode 100644 index 32a4addb2..000000000 --- a/src/go/collectors/go.d.plugin/config/go.d/snmp.conf +++ /dev/null @@ -1,48 +0,0 @@ -## All available configuration options, their descriptions and default values: -## https://github.com/netdata/netdata/tree/master/src/go/collectors/go.d.plugin/modules/snmp#readme - -#jobs: -# - name: switch -# update_every: 10 -# hostname: "192.0.2.1" -# community: public -# options: -# version: 2 -# user: -# name: "username" -# level: "authPriv" -# auth_proto: "sha256" -# auth_key: "auth_protocol_passphrase" -# priv_proto: "aes256" -# priv_key: "priv_protocol_passphrase" -# charts: -# - id: "bandwidth_port1" -# title: "Switch Bandwidth for port 1" -# units: "kilobits/s" -# type: "area" -# family: "ports" -# dimensions: -# - name: "in" -# oid: "1.3.6.1.2.1.2.2.1.10.1" -# algorithm: "incremental" -# multiplier: 8 -# divisor: 1000 -# - name: "out" -# oid: "1.3.6.1.2.1.2.2.1.16.1" -# multiplier: -8 -# divisor: 1000 -# - id: "bandwidth_port2" -# title: "Switch Bandwidth for port 2" -# units: "kilobits/s" -# type: "area" -# family: "ports" -# dimensions: -# - name: "in" -# oid: "1.3.6.1.2.1.2.2.1.10.2" -# algorithm: "incremental" -# multiplier: 8 -# divisor: 1000 -# - name: "out" -# oid: "1.3.6.1.2.1.2.2.1.16.2" -# multiplier: -8 -# divisor: 1000 diff --git a/src/go/collectors/go.d.plugin/modules/chrony/charts.go b/src/go/collectors/go.d.plugin/modules/chrony/charts.go deleted file mode 100644 index 6b8f42897..000000000 --- a/src/go/collectors/go.d.plugin/modules/chrony/charts.go +++ /dev/null @@ -1,148 +0,0 @@ -// SPDX-License-Identifier: GPL-3.0-or-later - -package chrony - -import ( - "github.com/netdata/netdata/go/go.d.plugin/agent/module" -) - -var charts = module.Charts{ - { - ID: "stratum", - Title: "Distance to the reference clock", - Units: "level", - Fam: "stratum", - Ctx: "chrony.stratum", - Dims: module.Dims{ - {ID: "stratum", Name: "stratum"}, - }, - }, - { - ID: "current_correction", - Title: "Current correction", - Units: "seconds", - Fam: "correction", - Ctx: "chrony.current_correction", - Dims: module.Dims{ - {ID: "current_correction", Div: scaleFactor}, - }, - }, - { - ID: "root_delay", - Title: "Network path delay to stratum-1", - Units: "seconds", - Fam: "root", - Ctx: "chrony.root_delay", - Dims: module.Dims{ - {ID: "root_delay", Div: scaleFactor}, - }, - }, - { - ID: "root_dispersion", - Title: "Dispersion accumulated back to stratum-1", - Units: "seconds", - Fam: "root", - Ctx: "chrony.root_dispersion", - Dims: module.Dims{ - {ID: "root_dispersion", Div: scaleFactor}, - }, - }, - { - ID: "last_offset", - Title: "Offset on the last clock update", - Units: "seconds", - Fam: "offset", - Ctx: "chrony.last_offset", - Dims: module.Dims{ - {ID: "last_offset", Name: "offset", Div: scaleFactor}, - }, - }, - { - ID: "rms_offset", - Title: "Long-term average of the offset value", - Units: "seconds", - Fam: "offset", - Ctx: "chrony.rms_offset", - Dims: module.Dims{ - {ID: "rms_offset", Name: "offset", Div: scaleFactor}, - }, - }, - { - ID: "frequency", - Title: "Frequency", - Units: "ppm", - Fam: "frequency", - Ctx: "chrony.frequency", - Dims: module.Dims{ - {ID: "frequency", Div: scaleFactor}, - }, - }, - { - ID: "residual_frequency", - Title: "Residual frequency", - Units: "ppm", - Fam: "frequency", - Ctx: "chrony.residual_frequency", - Dims: module.Dims{ - {ID: "residual_frequency", Div: scaleFactor}, - }, - }, - { - ID: "skew", - Title: "Skew", - Units: "ppm", - Fam: "frequency", - Ctx: "chrony.skew", - Dims: module.Dims{ - {ID: "skew", Div: scaleFactor}, - }, - }, - { - ID: "update_interval", - Title: "Interval between the last two clock updates", - Units: "seconds", - Fam: "updates", - Ctx: "chrony.update_interval", - Dims: module.Dims{ - {ID: "update_interval", Div: scaleFactor}, - }, - }, - { - ID: "ref_measurement_time", - Title: "Time since the last measurement", - Units: "seconds", - Fam: "updates", - Ctx: "chrony.ref_measurement_time", - Dims: module.Dims{ - {ID: "ref_measurement_time"}, - }, - }, - { - ID: "leap_status", - Title: "Leap status", - Units: "status", - Fam: "leap status", - Ctx: "chrony.leap_status", - Dims: module.Dims{ - {ID: "leap_status_normal", Name: "normal"}, - {ID: "leap_status_insert_second", Name: "insert_second"}, - {ID: "leap_status_delete_second", Name: "delete_second"}, - {ID: "leap_status_unsynchronised", Name: "unsynchronised"}, - }, - }, - { - ID: "activity", - Title: "Peers activity", - Units: "sources", - Fam: "activity", - Ctx: "chrony.activity", - Type: module.Stacked, - Dims: module.Dims{ - {ID: "online_sources", Name: "online"}, - {ID: "offline_sources", Name: "offline"}, - {ID: "burst_online_sources", Name: "burst_online"}, - {ID: "burst_offline_sources", Name: "burst_offline"}, - {ID: "unresolved_sources", Name: "unresolved"}, - }, - }, -} diff --git a/src/go/collectors/go.d.plugin/modules/chrony/client.go b/src/go/collectors/go.d.plugin/modules/chrony/client.go deleted file mode 100644 index e850ff239..000000000 --- a/src/go/collectors/go.d.plugin/modules/chrony/client.go +++ /dev/null @@ -1,61 +0,0 @@ -// SPDX-License-Identifier: GPL-3.0-or-later - -package chrony - -import ( - "fmt" - "net" - - "github.com/facebook/time/ntp/chrony" -) - -func newChronyClient(c Config) (chronyClient, error) { - conn, err := net.DialTimeout("udp", c.Address, c.Timeout.Duration()) - if err != nil { - return nil, err - } - - client := &simpleClient{ - conn: conn, - client: &chrony.Client{Connection: conn}, - } - return client, nil -} - -type simpleClient struct { - conn net.Conn - client *chrony.Client -} - -func (sc *simpleClient) Tracking() (*chrony.ReplyTracking, error) { - reply, err := sc.client.Communicate(chrony.NewTrackingPacket()) - if err != nil { - return nil, err - } - - tracking, ok := reply.(*chrony.ReplyTracking) - if !ok { - return nil, fmt.Errorf("unexpected reply type, want=%T, got=%T", &chrony.ReplyTracking{}, reply) - } - return tracking, nil -} - -func (sc *simpleClient) Activity() (*chrony.ReplyActivity, error) { - reply, err := sc.client.Communicate(chrony.NewActivityPacket()) - if err != nil { - return nil, err - } - - activity, ok := reply.(*chrony.ReplyActivity) - if !ok { - return nil, fmt.Errorf("unexpected reply type, want=%T, got=%T", &chrony.ReplyActivity{}, reply) - } - return activity, nil -} - -func (sc *simpleClient) Close() { - if sc.conn != nil { - _ = sc.conn.Close() - sc.conn = nil - } -} diff --git a/src/go/collectors/go.d.plugin/modules/chrony/collect.go b/src/go/collectors/go.d.plugin/modules/chrony/collect.go deleted file mode 100644 index 06a9ecc79..000000000 --- a/src/go/collectors/go.d.plugin/modules/chrony/collect.go +++ /dev/null @@ -1,97 +0,0 @@ -// SPDX-License-Identifier: GPL-3.0-or-later - -package chrony - -import ( - "fmt" - "time" -) - -const scaleFactor = 1000000000 - -func (c *Chrony) collect() (map[string]int64, error) { - if c.client == nil { - client, err := c.newClient(c.Config) - if err != nil { - return nil, err - } - c.client = client - } - - mx := make(map[string]int64) - - if err := c.collectTracking(mx); err != nil { - return nil, err - } - if err := c.collectActivity(mx); err != nil { - return mx, err - } - - return mx, nil -} - -const ( - // https://github.com/mlichvar/chrony/blob/7daf34675a5a2487895c74d1578241ca91a4eb70/ntp.h#L70-L75 - leapStatusNormal = 0 - leapStatusInsertSecond = 1 - leapStatusDeleteSecond = 2 - leapStatusUnsynchronised = 3 -) - -func (c *Chrony) collectTracking(mx map[string]int64) error { - reply, err := c.client.Tracking() - if err != nil { - return fmt.Errorf("error on collecting tracking: %v", err) - } - - mx["stratum"] = int64(reply.Stratum) - mx["leap_status_normal"] = boolToInt(reply.LeapStatus == leapStatusNormal) - mx["leap_status_insert_second"] = boolToInt(reply.LeapStatus == leapStatusInsertSecond) - mx["leap_status_delete_second"] = boolToInt(reply.LeapStatus == leapStatusDeleteSecond) - mx["leap_status_unsynchronised"] = boolToInt(reply.LeapStatus == leapStatusUnsynchronised) - mx["root_delay"] = int64(reply.RootDelay * scaleFactor) - mx["root_dispersion"] = int64(reply.RootDispersion * scaleFactor) - mx["skew"] = int64(reply.SkewPPM * scaleFactor) - mx["last_offset"] = int64(reply.LastOffset * scaleFactor) - mx["rms_offset"] = int64(reply.RMSOffset * scaleFactor) - mx["update_interval"] = int64(reply.LastUpdateInterval * scaleFactor) - // handle chrony restarts - if reply.RefTime.Year() != 1970 { - mx["ref_measurement_time"] = time.Now().Unix() - reply.RefTime.Unix() - } - mx["residual_frequency"] = int64(reply.ResidFreqPPM * scaleFactor) - // https://github.com/mlichvar/chrony/blob/5b04f3ca902e5d10aa5948fb7587d30b43941049/client.c#L1706 - mx["current_correction"] = abs(int64(reply.CurrentCorrection * scaleFactor)) - mx["frequency"] = abs(int64(reply.FreqPPM * scaleFactor)) - - return nil -} - -func (c *Chrony) collectActivity(mx map[string]int64) error { - reply, err := c.client.Activity() - if err != nil { - return fmt.Errorf("error on collecting activity: %v", err) - } - - mx["online_sources"] = int64(reply.Online) - mx["offline_sources"] = int64(reply.Offline) - mx["burst_online_sources"] = int64(reply.BurstOnline) - mx["burst_offline_sources"] = int64(reply.BurstOffline) - mx["unresolved_sources"] = int64(reply.Unresolved) - - return nil -} - -func boolToInt(v bool) int64 { - if v { - return 1 - } - return 0 -} - -func abs(v int64) int64 { - if v < 0 { - return -v - } - return v -} diff --git a/src/go/collectors/go.d.plugin/modules/dnsmasq/collect.go b/src/go/collectors/go.d.plugin/modules/dnsmasq/collect.go deleted file mode 100644 index 2561688d7..000000000 --- a/src/go/collectors/go.d.plugin/modules/dnsmasq/collect.go +++ /dev/null @@ -1,126 +0,0 @@ -// SPDX-License-Identifier: GPL-3.0-or-later - -package dnsmasq - -import ( - "fmt" - "strconv" - "strings" - - "github.com/miekg/dns" -) - -func (d *Dnsmasq) collect() (map[string]int64, error) { - r, err := d.queryCacheStatistics() - if err != nil { - return nil, err - } - - ms := make(map[string]int64) - if err = d.collectResponse(ms, r); err != nil { - return nil, err - } - - return ms, nil -} - -func (d *Dnsmasq) collectResponse(ms map[string]int64, resp *dns.Msg) error { - /* - ;; flags: qr aa rd ra; QUERY: 7, ANSWER: 7, AUTHORITY: 0, ADDITIONAL: 0 - - ;; QUESTION SECTION: - ;cachesize.bind. CH TXT - ;insertions.bind. CH TXT - ;evictions.bind. CH TXT - ;hits.bind. CH TXT - ;misses.bind. CH TXT - ;auth.bind. CH TXT - ;servers.bind. CH TXT - - ;; ANSWER SECTION: - cachesize.bind. 0 CH TXT "150" - insertions.bind. 0 CH TXT "1" - evictions.bind. 0 CH TXT "0" - hits.bind. 0 CH TXT "176" - misses.bind. 0 CH TXT "4" - auth.bind. 0 CH TXT "0" - servers.bind. 0 CH TXT "10.0.0.1#53 0 0" "1.1.1.1#53 4 3" "1.0.0.1#53 3 0" - */ - for _, a := range resp.Answer { - txt, ok := a.(*dns.TXT) - if !ok { - continue - } - - idx := strings.IndexByte(txt.Hdr.Name, '.') - if idx == -1 { - continue - } - - switch name := txt.Hdr.Name[:idx]; name { - case "servers": - for _, entry := range txt.Txt { - parts := strings.Fields(entry) - if len(parts) != 3 { - return fmt.Errorf("parse %s (%s): unexpected format", txt.Hdr.Name, entry) - } - queries, err := strconv.ParseFloat(parts[1], 64) - if err != nil { - return fmt.Errorf("parse '%s' (%s): %v", txt.Hdr.Name, entry, err) - } - failedQueries, err := strconv.ParseFloat(parts[2], 64) - if err != nil { - return fmt.Errorf("parse '%s' (%s): %v", txt.Hdr.Name, entry, err) - } - - ms["queries"] += int64(queries) - ms["failed_queries"] += int64(failedQueries) - } - case "cachesize", "insertions", "evictions", "hits", "misses", "auth": - if len(txt.Txt) != 1 { - return fmt.Errorf("parse '%s' (%v): unexpected format", txt.Hdr.Name, txt.Txt) - } - v, err := strconv.ParseFloat(txt.Txt[0], 64) - if err != nil { - return fmt.Errorf("parse '%s' (%s): %v", txt.Hdr.Name, txt.Txt[0], err) - } - - ms[name] = int64(v) - } - } - return nil -} - -func (d *Dnsmasq) queryCacheStatistics() (*dns.Msg, error) { - msg := &dns.Msg{ - MsgHdr: dns.MsgHdr{ - Id: dns.Id(), - RecursionDesired: true, - }, - Question: []dns.Question{ - {Name: "cachesize.bind.", Qtype: dns.TypeTXT, Qclass: dns.ClassCHAOS}, - {Name: "insertions.bind.", Qtype: dns.TypeTXT, Qclass: dns.ClassCHAOS}, - {Name: "evictions.bind.", Qtype: dns.TypeTXT, Qclass: dns.ClassCHAOS}, - {Name: "hits.bind.", Qtype: dns.TypeTXT, Qclass: dns.ClassCHAOS}, - {Name: "misses.bind.", Qtype: dns.TypeTXT, Qclass: dns.ClassCHAOS}, - // TODO: collect auth.bind if available - // auth.bind query is only supported if dnsmasq has been built - // to support running as an authoritative name server. See https://github.com/netdata/netdata/issues/13766 - //{Name: "auth.bind.", Qtype: dns.TypeTXT, Qclass: dns.ClassCHAOS}, - {Name: "servers.bind.", Qtype: dns.TypeTXT, Qclass: dns.ClassCHAOS}, - }, - } - - r, _, err := d.dnsClient.Exchange(msg, d.Address) - if err != nil { - return nil, err - } - if r == nil { - return nil, fmt.Errorf("'%s' returned an empty response", d.Address) - } - if r.Rcode != dns.RcodeSuccess { - s := dns.RcodeToString[r.Rcode] - return nil, fmt.Errorf("'%s' returned '%s' (%d) response code", d.Address, s, r.Rcode) - } - return r, nil -} diff --git a/src/go/collectors/go.d.plugin/modules/init.go b/src/go/collectors/go.d.plugin/modules/init.go deleted file mode 100644 index bd3b39508..000000000 --- a/src/go/collectors/go.d.plugin/modules/init.go +++ /dev/null @@ -1,98 +0,0 @@ -// SPDX-License-Identifier: GPL-3.0-or-later - -package modules - -import ( - _ "github.com/netdata/netdata/go/go.d.plugin/modules/activemq" - _ "github.com/netdata/netdata/go/go.d.plugin/modules/adaptecraid" - _ "github.com/netdata/netdata/go/go.d.plugin/modules/apache" - _ "github.com/netdata/netdata/go/go.d.plugin/modules/bind" - _ "github.com/netdata/netdata/go/go.d.plugin/modules/cassandra" - _ "github.com/netdata/netdata/go/go.d.plugin/modules/chrony" - _ "github.com/netdata/netdata/go/go.d.plugin/modules/clickhouse" - _ "github.com/netdata/netdata/go/go.d.plugin/modules/cockroachdb" - _ "github.com/netdata/netdata/go/go.d.plugin/modules/consul" - _ "github.com/netdata/netdata/go/go.d.plugin/modules/coredns" - _ "github.com/netdata/netdata/go/go.d.plugin/modules/couchbase" - _ "github.com/netdata/netdata/go/go.d.plugin/modules/couchdb" - _ "github.com/netdata/netdata/go/go.d.plugin/modules/dmcache" - _ "github.com/netdata/netdata/go/go.d.plugin/modules/dnsdist" - _ "github.com/netdata/netdata/go/go.d.plugin/modules/dnsmasq" - _ "github.com/netdata/netdata/go/go.d.plugin/modules/dnsmasq_dhcp" - _ "github.com/netdata/netdata/go/go.d.plugin/modules/dnsquery" - _ "github.com/netdata/netdata/go/go.d.plugin/modules/docker" - _ "github.com/netdata/netdata/go/go.d.plugin/modules/docker_engine" - _ "github.com/netdata/netdata/go/go.d.plugin/modules/dockerhub" - _ "github.com/netdata/netdata/go/go.d.plugin/modules/elasticsearch" - _ "github.com/netdata/netdata/go/go.d.plugin/modules/envoy" - _ "github.com/netdata/netdata/go/go.d.plugin/modules/example" - _ "github.com/netdata/netdata/go/go.d.plugin/modules/fail2ban" - _ "github.com/netdata/netdata/go/go.d.plugin/modules/filecheck" - _ "github.com/netdata/netdata/go/go.d.plugin/modules/fluentd" - _ "github.com/netdata/netdata/go/go.d.plugin/modules/freeradius" - _ "github.com/netdata/netdata/go/go.d.plugin/modules/geth" - _ "github.com/netdata/netdata/go/go.d.plugin/modules/haproxy" - _ "github.com/netdata/netdata/go/go.d.plugin/modules/hddtemp" - _ "github.com/netdata/netdata/go/go.d.plugin/modules/hdfs" - _ "github.com/netdata/netdata/go/go.d.plugin/modules/hpssa" - _ "github.com/netdata/netdata/go/go.d.plugin/modules/httpcheck" - _ "github.com/netdata/netdata/go/go.d.plugin/modules/intelgpu" - _ "github.com/netdata/netdata/go/go.d.plugin/modules/isc_dhcpd" - _ "github.com/netdata/netdata/go/go.d.plugin/modules/k8s_kubelet" - _ "github.com/netdata/netdata/go/go.d.plugin/modules/k8s_kubeproxy" - _ "github.com/netdata/netdata/go/go.d.plugin/modules/k8s_state" - _ "github.com/netdata/netdata/go/go.d.plugin/modules/lighttpd" - _ "github.com/netdata/netdata/go/go.d.plugin/modules/litespeed" - _ "github.com/netdata/netdata/go/go.d.plugin/modules/logind" - _ "github.com/netdata/netdata/go/go.d.plugin/modules/logstash" - _ "github.com/netdata/netdata/go/go.d.plugin/modules/lvm" - _ "github.com/netdata/netdata/go/go.d.plugin/modules/megacli" - _ "github.com/netdata/netdata/go/go.d.plugin/modules/mongodb" - _ "github.com/netdata/netdata/go/go.d.plugin/modules/mysql" - _ "github.com/netdata/netdata/go/go.d.plugin/modules/nginx" - _ "github.com/netdata/netdata/go/go.d.plugin/modules/nginxplus" - _ "github.com/netdata/netdata/go/go.d.plugin/modules/nginxvts" - _ "github.com/netdata/netdata/go/go.d.plugin/modules/ntpd" - _ "github.com/netdata/netdata/go/go.d.plugin/modules/nvidia_smi" - _ "github.com/netdata/netdata/go/go.d.plugin/modules/nvme" - _ "github.com/netdata/netdata/go/go.d.plugin/modules/openvpn" - _ "github.com/netdata/netdata/go/go.d.plugin/modules/openvpn_status_log" - _ "github.com/netdata/netdata/go/go.d.plugin/modules/pgbouncer" - _ "github.com/netdata/netdata/go/go.d.plugin/modules/phpdaemon" - _ "github.com/netdata/netdata/go/go.d.plugin/modules/phpfpm" - _ "github.com/netdata/netdata/go/go.d.plugin/modules/pihole" - _ "github.com/netdata/netdata/go/go.d.plugin/modules/pika" - _ "github.com/netdata/netdata/go/go.d.plugin/modules/ping" - _ "github.com/netdata/netdata/go/go.d.plugin/modules/portcheck" - _ "github.com/netdata/netdata/go/go.d.plugin/modules/postgres" - _ "github.com/netdata/netdata/go/go.d.plugin/modules/powerdns" - _ "github.com/netdata/netdata/go/go.d.plugin/modules/powerdns_recursor" - _ "github.com/netdata/netdata/go/go.d.plugin/modules/prometheus" - _ "github.com/netdata/netdata/go/go.d.plugin/modules/proxysql" - _ "github.com/netdata/netdata/go/go.d.plugin/modules/pulsar" - _ "github.com/netdata/netdata/go/go.d.plugin/modules/rabbitmq" - _ "github.com/netdata/netdata/go/go.d.plugin/modules/redis" - _ "github.com/netdata/netdata/go/go.d.plugin/modules/rspamd" - _ "github.com/netdata/netdata/go/go.d.plugin/modules/scaleio" - _ "github.com/netdata/netdata/go/go.d.plugin/modules/sensors" - _ "github.com/netdata/netdata/go/go.d.plugin/modules/smartctl" - _ "github.com/netdata/netdata/go/go.d.plugin/modules/snmp" - _ "github.com/netdata/netdata/go/go.d.plugin/modules/squidlog" - _ "github.com/netdata/netdata/go/go.d.plugin/modules/storcli" - _ "github.com/netdata/netdata/go/go.d.plugin/modules/supervisord" - _ "github.com/netdata/netdata/go/go.d.plugin/modules/systemdunits" - _ "github.com/netdata/netdata/go/go.d.plugin/modules/tengine" - _ "github.com/netdata/netdata/go/go.d.plugin/modules/traefik" - _ "github.com/netdata/netdata/go/go.d.plugin/modules/unbound" - _ "github.com/netdata/netdata/go/go.d.plugin/modules/upsd" - _ "github.com/netdata/netdata/go/go.d.plugin/modules/vcsa" - _ "github.com/netdata/netdata/go/go.d.plugin/modules/vernemq" - _ "github.com/netdata/netdata/go/go.d.plugin/modules/vsphere" - _ "github.com/netdata/netdata/go/go.d.plugin/modules/weblog" - _ "github.com/netdata/netdata/go/go.d.plugin/modules/whoisquery" - _ "github.com/netdata/netdata/go/go.d.plugin/modules/windows" - _ "github.com/netdata/netdata/go/go.d.plugin/modules/wireguard" - _ "github.com/netdata/netdata/go/go.d.plugin/modules/x509check" - _ "github.com/netdata/netdata/go/go.d.plugin/modules/zfspool" - _ "github.com/netdata/netdata/go/go.d.plugin/modules/zookeeper" -) diff --git a/src/go/collectors/go.d.plugin/modules/nvidia_smi/collect.go b/src/go/collectors/go.d.plugin/modules/nvidia_smi/collect.go deleted file mode 100644 index 0830b54a3..000000000 --- a/src/go/collectors/go.d.plugin/modules/nvidia_smi/collect.go +++ /dev/null @@ -1,72 +0,0 @@ -// SPDX-License-Identifier: GPL-3.0-or-later - -package nvidia_smi - -import ( - "errors" - "strconv" - "strings" -) - -func (nv *NvidiaSMI) collect() (map[string]int64, error) { - if nv.exec == nil { - return nil, errors.New("nvidia-smi exec is not initialized") - } - - mx := make(map[string]int64) - - if err := nv.collectGPUInfo(mx); err != nil { - return nil, err - } - - return mx, nil -} - -func (nv *NvidiaSMI) collectGPUInfo(mx map[string]int64) error { - if nv.UseCSVFormat { - return nv.collectGPUInfoCSV(mx) - } - return nv.collectGPUInfoXML(mx) -} - -func addMetric(mx map[string]int64, key, value string, mul int) { - if !isValidValue(value) { - return - } - - value = removeUnits(value) - - v, err := strconv.ParseFloat(value, 64) - if err != nil { - return - } - - if mul > 0 { - v *= float64(mul) - } - - mx[key] = int64(v) -} - -func isValidValue(v string) bool { - return v != "" && v != "N/A" && v != "[N/A]" -} - -func parseFloat(s string) float64 { - v, _ := strconv.ParseFloat(removeUnits(s), 64) - return v -} - -func removeUnits(s string) string { - if i := strings.IndexByte(s, ' '); i != -1 { - s = s[:i] - } - return s -} - -func boolToInt(v bool) int64 { - if v { - return 1 - } - return 0 -} diff --git a/src/go/collectors/go.d.plugin/modules/nvidia_smi/collect_csv.go b/src/go/collectors/go.d.plugin/modules/nvidia_smi/collect_csv.go deleted file mode 100644 index 2584aaffe..000000000 --- a/src/go/collectors/go.d.plugin/modules/nvidia_smi/collect_csv.go +++ /dev/null @@ -1,198 +0,0 @@ -// SPDX-License-Identifier: GPL-3.0-or-later - -package nvidia_smi - -import ( - "bufio" - "bytes" - "encoding/csv" - "errors" - "fmt" - "io" - "regexp" - "strconv" - "strings" -) - -// use of property aliases is not implemented ('"<property>" or "<alias>"' in help-query-gpu) -var knownProperties = map[string]bool{ - "uuid": true, - "name": true, - "fan.speed": true, - "pstate": true, - "utilization.gpu": true, - "utilization.memory": true, - "memory.used": true, - "memory.free": true, - "memory.reserved": true, - "temperature.gpu": true, - "clocks.current.graphics": true, - "clocks.current.video": true, - "clocks.current.sm": true, - "clocks.current.memory": true, - "power.draw": true, -} - -var reHelpProperty = regexp.MustCompile(`"([a-zA-Z_.]+)"`) - -func (nv *NvidiaSMI) collectGPUInfoCSV(mx map[string]int64) error { - if len(nv.gpuQueryProperties) == 0 { - bs, err := nv.exec.queryHelpQueryGPU() - if err != nil { - return err - } - - sc := bufio.NewScanner(bytes.NewBuffer(bs)) - - for sc.Scan() { - if !strings.HasPrefix(sc.Text(), "\"") { - continue - } - matches := reHelpProperty.FindAllString(sc.Text(), -1) - if len(matches) == 0 { - continue - } - for _, v := range matches { - if v = strings.Trim(v, "\""); knownProperties[v] { - nv.gpuQueryProperties = append(nv.gpuQueryProperties, v) - } - } - } - nv.Debugf("found query GPU properties: %v", nv.gpuQueryProperties) - } - - bs, err := nv.exec.queryGPUInfoCSV(nv.gpuQueryProperties) - if err != nil { - return err - } - - nv.Debugf("GPU info:\n%s", bs) - - r := csv.NewReader(bytes.NewBuffer(bs)) - r.Comma = ',' - r.ReuseRecord = true - r.TrimLeadingSpace = true - - // skip headers - if _, err := r.Read(); err != nil && err != io.EOF { - return err - } - - var gpusInfo []csvGPUInfo - for { - record, err := r.Read() - if err != nil { - if errors.Is(err, io.EOF) { - break - } - return err - } - - if len(record) != len(nv.gpuQueryProperties) { - return fmt.Errorf("record values (%d) != queried properties (%d)", len(record), len(nv.gpuQueryProperties)) - } - - var gpu csvGPUInfo - for i, v := range record { - switch nv.gpuQueryProperties[i] { - case "uuid": - gpu.uuid = v - case "name": - gpu.name = v - case "fan.speed": - gpu.fanSpeed = v - case "pstate": - gpu.pstate = v - case "utilization.gpu": - gpu.utilizationGPU = v - case "utilization.memory": - gpu.utilizationMemory = v - case "memory.used": - gpu.memoryUsed = v - case "memory.free": - gpu.memoryFree = v - case "memory.reserved": - gpu.memoryReserved = v - case "temperature.gpu": - gpu.temperatureGPU = v - case "clocks.current.graphics": - gpu.clocksCurrentGraphics = v - case "clocks.current.video": - gpu.clocksCurrentVideo = v - case "clocks.current.sm": - gpu.clocksCurrentSM = v - case "clocks.current.memory": - gpu.clocksCurrentMemory = v - case "power.draw": - gpu.powerDraw = v - } - } - gpusInfo = append(gpusInfo, gpu) - } - - seen := make(map[string]bool) - - for _, gpu := range gpusInfo { - if !isValidValue(gpu.uuid) || !isValidValue(gpu.name) { - continue - } - - px := "gpu_" + gpu.uuid + "_" - - seen[px] = true - - if !nv.gpus[px] { - nv.gpus[px] = true - nv.addGPUCSVCharts(gpu) - } - - addMetric(mx, px+"fan_speed_perc", gpu.fanSpeed, 0) - addMetric(mx, px+"gpu_utilization", gpu.utilizationGPU, 0) - addMetric(mx, px+"mem_utilization", gpu.utilizationMemory, 0) - addMetric(mx, px+"frame_buffer_memory_usage_free", gpu.memoryFree, 1024*1024) // MiB => bytes - addMetric(mx, px+"frame_buffer_memory_usage_used", gpu.memoryUsed, 1024*1024) // MiB => bytes - addMetric(mx, px+"frame_buffer_memory_usage_reserved", gpu.memoryReserved, 1024*1024) // MiB => bytes - addMetric(mx, px+"temperature", gpu.temperatureGPU, 0) - addMetric(mx, px+"graphics_clock", gpu.clocksCurrentGraphics, 0) - addMetric(mx, px+"video_clock", gpu.clocksCurrentVideo, 0) - addMetric(mx, px+"sm_clock", gpu.clocksCurrentSM, 0) - addMetric(mx, px+"mem_clock", gpu.clocksCurrentMemory, 0) - addMetric(mx, px+"power_draw", gpu.powerDraw, 0) - for i := 0; i < 16; i++ { - if s := "P" + strconv.Itoa(i); gpu.pstate == s { - mx[px+"performance_state_"+s] = 1 - } else { - mx[px+"performance_state_"+s] = 0 - } - } - } - - for px := range nv.gpus { - if !seen[px] { - delete(nv.gpus, px) - nv.removeCharts(px) - } - } - - return nil -} - -type ( - csvGPUInfo struct { - uuid string - name string - fanSpeed string - pstate string - utilizationGPU string - utilizationMemory string - memoryUsed string - memoryFree string - memoryReserved string - temperatureGPU string - clocksCurrentGraphics string - clocksCurrentVideo string - clocksCurrentSM string - clocksCurrentMemory string - powerDraw string - } -) diff --git a/src/go/collectors/go.d.plugin/modules/nvidia_smi/exec.go b/src/go/collectors/go.d.plugin/modules/nvidia_smi/exec.go deleted file mode 100644 index ff26f59c8..000000000 --- a/src/go/collectors/go.d.plugin/modules/nvidia_smi/exec.go +++ /dev/null @@ -1,78 +0,0 @@ -// SPDX-License-Identifier: GPL-3.0-or-later - -package nvidia_smi - -import ( - "context" - "errors" - "fmt" - "os/exec" - "strings" - "time" - - "github.com/netdata/netdata/go/go.d.plugin/logger" -) - -func newNvidiaSMIExec(path string, cfg Config, log *logger.Logger) (*nvidiaSMIExec, error) { - return &nvidiaSMIExec{ - binPath: path, - timeout: cfg.Timeout.Duration(), - Logger: log, - }, nil -} - -type nvidiaSMIExec struct { - binPath string - timeout time.Duration - *logger.Logger -} - -func (e *nvidiaSMIExec) queryGPUInfoXML() ([]byte, error) { - ctx, cancel := context.WithTimeout(context.Background(), e.timeout) - defer cancel() - - cmd := exec.CommandContext(ctx, e.binPath, "-q", "-x") - - e.Debugf("executing '%s'", cmd) - bs, err := cmd.Output() - if err != nil { - return nil, fmt.Errorf("error on '%s': %v", cmd, err) - } - - return bs, nil -} - -func (e *nvidiaSMIExec) queryGPUInfoCSV(properties []string) ([]byte, error) { - if len(properties) == 0 { - return nil, errors.New("can not query CSV GPU Info without properties") - } - - ctx, cancel := context.WithTimeout(context.Background(), e.timeout) - defer cancel() - - cmd := exec.CommandContext(ctx, e.binPath, "--query-gpu="+strings.Join(properties, ","), "--format=csv,nounits") - - e.Debugf("executing '%s'", cmd) - - bs, err := cmd.Output() - if err != nil { - return nil, fmt.Errorf("error on '%s': %v", cmd, err) - } - - return bs, nil -} - -func (e *nvidiaSMIExec) queryHelpQueryGPU() ([]byte, error) { - ctx, cancel := context.WithTimeout(context.Background(), e.timeout) - defer cancel() - - cmd := exec.CommandContext(ctx, e.binPath, "--help-query-gpu") - - e.Debugf("executing '%s'", cmd) - bs, err := cmd.Output() - if err != nil { - return nil, fmt.Errorf("error on '%s': %v", cmd, err) - } - - return bs, err -} diff --git a/src/go/collectors/go.d.plugin/modules/nvidia_smi/nvidia_smi.go b/src/go/collectors/go.d.plugin/modules/nvidia_smi/nvidia_smi.go deleted file mode 100644 index 0002d4bf2..000000000 --- a/src/go/collectors/go.d.plugin/modules/nvidia_smi/nvidia_smi.go +++ /dev/null @@ -1,117 +0,0 @@ -// SPDX-License-Identifier: GPL-3.0-or-later - -package nvidia_smi - -import ( - _ "embed" - "errors" - "time" - - "github.com/netdata/netdata/go/go.d.plugin/agent/module" - "github.com/netdata/netdata/go/go.d.plugin/pkg/web" -) - -//go:embed "config_schema.json" -var configSchema string - -func init() { - module.Register("nvidia_smi", module.Creator{ - JobConfigSchema: configSchema, - Defaults: module.Defaults{ - Disabled: true, - UpdateEvery: 10, - }, - Create: func() module.Module { return New() }, - Config: func() any { return &Config{} }, - }) -} - -func New() *NvidiaSMI { - return &NvidiaSMI{ - Config: Config{ - Timeout: web.Duration(time.Second * 10), - UseCSVFormat: false, - }, - binName: "nvidia-smi", - charts: &module.Charts{}, - gpus: make(map[string]bool), - migs: make(map[string]bool), - } - -} - -type Config struct { - UpdateEvery int `yaml:"update_every,omitempty" json:"update_every"` - Timeout web.Duration `yaml:"timeout,omitempty" json:"timeout"` - BinaryPath string `yaml:"binary_path" json:"binary_path"` - UseCSVFormat bool `yaml:"use_csv_format" json:"use_csv_format"` -} - -type ( - NvidiaSMI struct { - module.Base - Config `yaml:",inline" json:""` - - charts *module.Charts - - exec nvidiaSMI - binName string - - gpuQueryProperties []string - - gpus map[string]bool - migs map[string]bool - } - nvidiaSMI interface { - queryGPUInfoXML() ([]byte, error) - queryGPUInfoCSV(properties []string) ([]byte, error) - queryHelpQueryGPU() ([]byte, error) - } -) - -func (nv *NvidiaSMI) Configuration() any { - return nv.Config -} - -func (nv *NvidiaSMI) Init() error { - if nv.exec == nil { - smi, err := nv.initNvidiaSMIExec() - if err != nil { - nv.Error(err) - return err - } - nv.exec = smi - } - - return nil -} - -func (nv *NvidiaSMI) Check() error { - mx, err := nv.collect() - if err != nil { - nv.Error(err) - return err - } - if len(mx) == 0 { - return errors.New("no metrics collected") - } - return nil -} - -func (nv *NvidiaSMI) Charts() *module.Charts { - return nv.charts -} - -func (nv *NvidiaSMI) Collect() map[string]int64 { - mx, err := nv.collect() - if err != nil { - nv.Error(err) - } - - if len(mx) == 0 { - return nil - } - return mx -} - -func (nv *NvidiaSMI) Cleanup() {} diff --git a/src/go/collectors/go.d.plugin/modules/nvidia_smi/testdata/help-query-gpu.txt b/src/go/collectors/go.d.plugin/modules/nvidia_smi/testdata/help-query-gpu.txt deleted file mode 100644 index 2dd3285e1..000000000 --- a/src/go/collectors/go.d.plugin/modules/nvidia_smi/testdata/help-query-gpu.txt +++ /dev/null @@ -1,414 +0,0 @@ -List of valid properties to query for the switch "--query-gpu=": - -"timestamp" -The timestamp of when the query was made in format "YYYY/MM/DD HH:MM:SS.msec". - -"driver_version" -The version of the installed NVIDIA display driver. This is an alphanumeric string. - -"count" -The number of NVIDIA GPUs in the system. - -"name" or "gpu_name" -The official product name of the GPU. This is an alphanumeric string. For all products. - -"serial" or "gpu_serial" -This number matches the serial number physically printed on each board. It is a globally unique immutable alphanumeric value. - -"uuid" or "gpu_uuid" -This value is the globally unique immutable alphanumeric identifier of the GPU. It does not correspond to any physical label on the board. - -"pci.bus_id" or "gpu_bus_id" -PCI bus id as "domain:bus:device.function", in hex. - -"pci.domain" -PCI domain number, in hex. - -"pci.bus" -PCI bus number, in hex. - -"pci.device" -PCI device number, in hex. - -"pci.device_id" -PCI vendor device id, in hex - -"pci.sub_device_id" -PCI Sub System id, in hex - -"pcie.link.gen.current" -The current PCI-E link generation. These may be reduced when the GPU is not in use. - -"pcie.link.gen.max" -The maximum PCI-E link generation possible with this GPU and system configuration. For example, if the GPU supports a higher PCIe generation than the system supports then this reports the system PCIe generation. - -"pcie.link.width.current" -The current PCI-E link width. These may be reduced when the GPU is not in use. - -"pcie.link.width.max" -The maximum PCI-E link width possible with this GPU and system configuration. For example, if the GPU supports a higher PCIe generation than the system supports then this reports the system PCIe generation. - -"index" -Zero based index of the GPU. Can change at each boot. - -"display_mode" -A flag that indicates whether a physical display (e.g. monitor) is currently connected to any of the GPU's connectors. "Enabled" indicates an attached display. "Disabled" indicates otherwise. - -"display_active" -A flag that indicates whether a display is initialized on the GPU's (e.g. memory is allocated on the device for display). Display can be active even when no monitor is physically attached. "Enabled" indicates an active display. "Disabled" indicates otherwise. - -"persistence_mode" -A flag that indicates whether persistence mode is enabled for the GPU. Value is either "Enabled" or "Disabled". When persistence mode is enabled the NVIDIA driver remains loaded even when no active clients, such as X11 or nvidia-smi, exist. This minimizes the driver load latency associated with running dependent apps, such as CUDA programs. Linux only. - -"accounting.mode" -A flag that indicates whether accounting mode is enabled for the GPU. Value is either "Enabled" or "Disabled". When accounting is enabled statistics are calculated for each compute process running on the GPU.Statistics can be queried during the lifetime or after termination of the process.The execution time of process is reported as 0 while the process is in running state and updated to actualexecution time after the process has terminated. See --help-query-accounted-apps for more info. - -"accounting.buffer_size" -The size of the circular buffer that holds list of processes that can be queried for accounting stats. This is the maximum number of processes that accounting information will be stored for before information about oldest processes will get overwritten by information about new processes. - -Section about driver_model properties -On Windows, the TCC and WDDM driver models are supported. The driver model can be changed with the (-dm) or (-fdm) flags. The TCC driver model is optimized for compute applications. I.E. kernel launch times will be quicker with TCC. The WDDM driver model is designed for graphics applications and is not recommended for compute applications. Linux does not support multiple driver models, and will always have the value of "N/A". Only for selected products. Please see feature matrix in NVML documentation. - -"driver_model.current" -The driver model currently in use. Always "N/A" on Linux. - -"driver_model.pending" -The driver model that will be used on the next reboot. Always "N/A" on Linux. - -"vbios_version" -The BIOS of the GPU board. - -Section about inforom properties -Version numbers for each object in the GPU board's inforom storage. The inforom is a small, persistent store of configuration and state data for the GPU. All inforom version fields are numerical. It can be useful to know these version numbers because some GPU features are only available with inforoms of a certain version or higher. - -"inforom.img" or "inforom.image" -Global version of the infoROM image. Image version just like VBIOS version uniquely describes the exact version of the infoROM flashed on the board in contrast to infoROM object version which is only an indicator of supported features. - -"inforom.oem" -Version for the OEM configuration data. - -"inforom.ecc" -Version for the ECC recording data. - -"inforom.pwr" or "inforom.power" -Version for the power management data. - -Section about gom properties -GOM allows to reduce power usage and optimize GPU throughput by disabling GPU features. Each GOM is designed to meet specific user needs. -In "All On" mode everything is enabled and running at full speed. -The "Compute" mode is designed for running only compute tasks. Graphics operations are not allowed. -The "Low Double Precision" mode is designed for running graphics applications that don't require high bandwidth double precision. -GOM can be changed with the (--gom) flag. - -"gom.current" or "gpu_operation_mode.current" -The GOM currently in use. - -"gom.pending" or "gpu_operation_mode.pending" -The GOM that will be used on the next reboot. - -"fan.speed" -The fan speed value is the percent of the product's maximum noise tolerance fan speed that the device's fan is currently intended to run at. This value may exceed 100% in certain cases. Note: The reported speed is the intended fan speed. If the fan is physically blocked and unable to spin, this output will not match the actual fan speed. Many parts do not report fan speeds because they rely on cooling via fans in the surrounding enclosure. - -"pstate" -The current performance state for the GPU. States range from P0 (maximum performance) to P12 (minimum performance). - -Section about clocks_throttle_reasons properties -Retrieves information about factors that are reducing the frequency of clocks. If all throttle reasons are returned as "Not Active" it means that clocks are running as high as possible. - -"clocks_throttle_reasons.supported" -Bitmask of supported clock throttle reasons. See nvml.h for more details. - -"clocks_throttle_reasons.active" -Bitmask of active clock throttle reasons. See nvml.h for more details. - -"clocks_throttle_reasons.gpu_idle" -Nothing is running on the GPU and the clocks are dropping to Idle state. This limiter may be removed in a later release. - -"clocks_throttle_reasons.applications_clocks_setting" -GPU clocks are limited by applications clocks setting. E.g. can be changed by nvidia-smi --applications-clocks= - -"clocks_throttle_reasons.sw_power_cap" -SW Power Scaling algorithm is reducing the clocks below requested clocks because the GPU is consuming too much power. E.g. SW power cap limit can be changed with nvidia-smi --power-limit= - -"clocks_throttle_reasons.hw_slowdown" -HW Slowdown (reducing the core clocks by a factor of 2 or more) is engaged. This is an indicator of: - HW Thermal Slowdown: temperature being too high - HW Power Brake Slowdown: External Power Brake Assertion is triggered (e.g. by the system power supply) - * Power draw is too high and Fast Trigger protection is reducing the clocks - * May be also reported during PState or clock change - * This behavior may be removed in a later release - -"clocks_throttle_reasons.hw_thermal_slowdown" -HW Thermal Slowdown (reducing the core clocks by a factor of 2 or more) is engaged. This is an indicator of temperature being too high - -"clocks_throttle_reasons.hw_power_brake_slowdown" -HW Power Brake Slowdown (reducing the core clocks by a factor of 2 or more) is engaged. This is an indicator of External Power Brake Assertion being triggered (e.g. by the system power supply) - -"clocks_throttle_reasons.sw_thermal_slowdown" -SW Thermal capping algorithm is reducing clocks below requested clocks because GPU temperature is higher than Max Operating Temp. - -"clocks_throttle_reasons.sync_boost" -Sync Boost This GPU has been added to a Sync boost group with nvidia-smi or DCGM in - * order to maximize performance per watt. All GPUs in the sync boost group - * will boost to the minimum possible clocks across the entire group. Look at - * the throttle reasons for other GPUs in the system to see why those GPUs are - * holding this one at lower clocks. - -Section about memory properties -On-board memory information. Reported total memory is affected by ECC state. If ECC is enabled the total available memory is decreased by several percent, due to the requisite parity bits. The driver may also reserve a small amount of memory for internal use, even without active work on the GPU. - -"memory.total" -Total installed GPU memory. - -"memory.reserved" -Total memory reserved by the NVIDIA driver and firmware. - -"memory.used" -Total memory allocated by active contexts. - -"memory.free" -Total free memory. - -"compute_mode" -The compute mode flag indicates whether individual or multiple compute applications may run on the GPU. -"0: Default" means multiple contexts are allowed per device. -"1: Exclusive_Thread", deprecated, use Exclusive_Process instead -"2: Prohibited" means no contexts are allowed per device (no compute apps). -"3: Exclusive_Process" means only one context is allowed per device, usable from multiple threads at a time. - -"compute_cap" -The CUDA Compute Capability, represented as Major DOT Minor. - -Section about utilization properties -Utilization rates report how busy each GPU is over time, and can be used to determine how much an application is using the GPUs in the system. - -"utilization.gpu" -Percent of time over the past sample period during which one or more kernels was executing on the GPU. -The sample period may be between 1 second and 1/6 second depending on the product. - -"utilization.memory" -Percent of time over the past sample period during which global (device) memory was being read or written. -The sample period may be between 1 second and 1/6 second depending on the product. - -Section about encoder.stats properties -Encoder stats report number of encoder sessions, average FPS and average latency in us for given GPUs in the system. - -"encoder.stats.sessionCount" -Number of encoder sessions running on the GPU. - -"encoder.stats.averageFps" -Average FPS of all sessions running on the GPU. - -"encoder.stats.averageLatency" -Average latency in microseconds of all sessions running on the GPU. - -Section about ecc.mode properties -A flag that indicates whether ECC support is enabled. May be either "Enabled" or "Disabled". Changes to ECC mode require a reboot. Requires Inforom ECC object version 1.0 or higher. - -"ecc.mode.current" -The ECC mode that the GPU is currently operating under. - -"ecc.mode.pending" -The ECC mode that the GPU will operate under after the next reboot. - -Section about ecc.errors properties -NVIDIA GPUs can provide error counts for various types of ECC errors. Some ECC errors are either single or double bit, where single bit errors are corrected and double bit errors are uncorrectable. Texture memory errors may be correctable via resend or uncorrectable if the resend fails. These errors are available across two timescales (volatile and aggregate). Single bit ECC errors are automatically corrected by the HW and do not result in data corruption. Double bit errors are detected but not corrected. Please see the ECC documents on the web for information on compute application behavior when double bit errors occur. Volatile error counters track the number of errors detected since the last driver load. Aggregate error counts persist indefinitely and thus act as a lifetime counter. - -"ecc.errors.corrected.volatile.device_memory" -Errors detected in global device memory. - -"ecc.errors.corrected.volatile.dram" -Errors detected in global device memory. - -"ecc.errors.corrected.volatile.register_file" -Errors detected in register file memory. - -"ecc.errors.corrected.volatile.l1_cache" -Errors detected in the L1 cache. - -"ecc.errors.corrected.volatile.l2_cache" -Errors detected in the L2 cache. - -"ecc.errors.corrected.volatile.texture_memory" -Parity errors detected in texture memory. - -"ecc.errors.corrected.volatile.cbu" -Parity errors detected in CBU. - -"ecc.errors.corrected.volatile.sram" -Errors detected in global SRAMs. - -"ecc.errors.corrected.volatile.total" -Total errors detected across entire chip. - -"ecc.errors.corrected.aggregate.device_memory" -Errors detected in global device memory. - -"ecc.errors.corrected.aggregate.dram" -Errors detected in global device memory. - -"ecc.errors.corrected.aggregate.register_file" -Errors detected in register file memory. - -"ecc.errors.corrected.aggregate.l1_cache" -Errors detected in the L1 cache. - -"ecc.errors.corrected.aggregate.l2_cache" -Errors detected in the L2 cache. - -"ecc.errors.corrected.aggregate.texture_memory" -Parity errors detected in texture memory. - -"ecc.errors.corrected.aggregate.cbu" -Parity errors detected in CBU. - -"ecc.errors.corrected.aggregate.sram" -Errors detected in global SRAMs. - -"ecc.errors.corrected.aggregate.total" -Total errors detected across entire chip. - -"ecc.errors.uncorrected.volatile.device_memory" -Errors detected in global device memory. - -"ecc.errors.uncorrected.volatile.dram" -Errors detected in global device memory. - -"ecc.errors.uncorrected.volatile.register_file" -Errors detected in register file memory. - -"ecc.errors.uncorrected.volatile.l1_cache" -Errors detected in the L1 cache. - -"ecc.errors.uncorrected.volatile.l2_cache" -Errors detected in the L2 cache. - -"ecc.errors.uncorrected.volatile.texture_memory" -Parity errors detected in texture memory. - -"ecc.errors.uncorrected.volatile.cbu" -Parity errors detected in CBU. - -"ecc.errors.uncorrected.volatile.sram" -Errors detected in global SRAMs. - -"ecc.errors.uncorrected.volatile.total" -Total errors detected across entire chip. - -"ecc.errors.uncorrected.aggregate.device_memory" -Errors detected in global device memory. - -"ecc.errors.uncorrected.aggregate.dram" -Errors detected in global device memory. - -"ecc.errors.uncorrected.aggregate.register_file" -Errors detected in register file memory. - -"ecc.errors.uncorrected.aggregate.l1_cache" -Errors detected in the L1 cache. - -"ecc.errors.uncorrected.aggregate.l2_cache" -Errors detected in the L2 cache. - -"ecc.errors.uncorrected.aggregate.texture_memory" -Parity errors detected in texture memory. - -"ecc.errors.uncorrected.aggregate.cbu" -Parity errors detected in CBU. - -"ecc.errors.uncorrected.aggregate.sram" -Errors detected in global SRAMs. - -"ecc.errors.uncorrected.aggregate.total" -Total errors detected across entire chip. - -Section about retired_pages properties -NVIDIA GPUs can retire pages of GPU device memory when they become unreliable. This can happen when multiple single bit ECC errors occur for the same page, or on a double bit ECC error. When a page is retired, the NVIDIA driver will hide it such that no driver, or application memory allocations can access it. - -"retired_pages.single_bit_ecc.count" or "retired_pages.sbe" -The number of GPU device memory pages that have been retired due to multiple single bit ECC errors. - -"retired_pages.double_bit.count" or "retired_pages.dbe" -The number of GPU device memory pages that have been retired due to a double bit ECC error. - -"retired_pages.pending" -Checks if any GPU device memory pages are pending retirement on the next reboot. Pages that are pending retirement can still be allocated, and may cause further reliability issues. - -"temperature.gpu" - Core GPU temperature. in degrees C. - -"temperature.memory" - HBM memory temperature. in degrees C. - -"power.management" -A flag that indicates whether power management is enabled. Either "Supported" or "[Not Supported]". Requires Inforom PWR object version 3.0 or higher or Kepler device. - -"power.draw" -The last measured power draw for the entire board, in watts. Only available if power management is supported. This reading is accurate to within +/- 5 watts. - -"power.limit" -The software power limit in watts. Set by software like nvidia-smi. On Kepler devices Power Limit can be adjusted using [-pl | --power-limit=] switches. - -"enforced.power.limit" -The power management algorithm's power ceiling, in watts. Total board power draw is manipulated by the power management algorithm such that it stays under this value. This value is the minimum of various power limiters. - -"power.default_limit" -The default power management algorithm's power ceiling, in watts. Power Limit will be set back to Default Power Limit after driver unload. - -"power.min_limit" -The minimum value in watts that power limit can be set to. - -"power.max_limit" -The maximum value in watts that power limit can be set to. - -"clocks.current.graphics" or "clocks.gr" -Current frequency of graphics (shader) clock. - -"clocks.current.sm" or "clocks.sm" -Current frequency of SM (Streaming Multiprocessor) clock. - -"clocks.current.memory" or "clocks.mem" -Current frequency of memory clock. - -"clocks.current.video" or "clocks.video" -Current frequency of video encoder/decoder clock. - -Section about clocks.applications properties -User specified frequency at which applications will be running at. Can be changed with [-ac | --applications-clocks] switches. - -"clocks.applications.graphics" or "clocks.applications.gr" -User specified frequency of graphics (shader) clock. - -"clocks.applications.memory" or "clocks.applications.mem" -User specified frequency of memory clock. - -Section about clocks.default_applications properties -Default frequency at which applications will be running at. Application clocks can be changed with [-ac | --applications-clocks] switches. Application clocks can be set to default using [-rac | --reset-applications-clocks] switches. - -"clocks.default_applications.graphics" or "clocks.default_applications.gr" -Default frequency of applications graphics (shader) clock. - -"clocks.default_applications.memory" or "clocks.default_applications.mem" -Default frequency of applications memory clock. - -Section about clocks.max properties -Maximum frequency at which parts of the GPU are design to run. - -"clocks.max.graphics" or "clocks.max.gr" -Maximum frequency of graphics (shader) clock. - -"clocks.max.sm" or "clocks.max.sm" -Maximum frequency of SM (Streaming Multiprocessor) clock. - -"clocks.max.memory" or "clocks.max.mem" -Maximum frequency of memory clock. - -Section about mig.mode properties -A flag that indicates whether MIG mode is enabled. May be either "Enabled" or "Disabled". Changes to MIG mode require a GPU reset. - -"mig.mode.current" -The MIG mode that the GPU is currently operating under. - -"mig.mode.pending" -The MIG mode that the GPU will operate under after reset. - diff --git a/src/go/collectors/go.d.plugin/modules/nvidia_smi/testdata/tesla-p100.csv b/src/go/collectors/go.d.plugin/modules/nvidia_smi/testdata/tesla-p100.csv deleted file mode 100644 index 9a4c1e1a9..000000000 --- a/src/go/collectors/go.d.plugin/modules/nvidia_smi/testdata/tesla-p100.csv +++ /dev/null @@ -1,2 +0,0 @@ -name, uuid, fan.speed [%], pstate, memory.reserved [MiB], memory.used [MiB], memory.free [MiB], utilization.gpu [%], utilization.memory [%], temperature.gpu, power.draw [W], clocks.current.graphics [MHz], clocks.current.sm [MHz], clocks.current.memory [MHz], clocks.current.video [MHz] -Tesla P100-PCIE-16GB, GPU-ef1b2c9b-38d8-2090-2bd1-f567a3eb42a6, [N/A], P0, 103, 0, 16280, 0, 0, 37, 28.16, 405, 405, 715, 835
\ No newline at end of file diff --git a/src/go/collectors/go.d.plugin/modules/snmp/charts.go b/src/go/collectors/go.d.plugin/modules/snmp/charts.go deleted file mode 100644 index 9899ec7aa..000000000 --- a/src/go/collectors/go.d.plugin/modules/snmp/charts.go +++ /dev/null @@ -1,116 +0,0 @@ -// SPDX-License-Identifier: GPL-3.0-or-later - -package snmp - -import ( - "fmt" - "strings" - - "github.com/netdata/netdata/go/go.d.plugin/agent/module" -) - -func newCharts(configs []ChartConfig) (*module.Charts, error) { - charts := &module.Charts{} - for _, cfg := range configs { - if len(cfg.IndexRange) == 2 { - cs, err := newChartsFromIndexRange(cfg) - if err != nil { - return nil, err - } - if err := charts.Add(*cs...); err != nil { - return nil, err - } - } else { - chart, err := newChart(cfg) - if err != nil { - return nil, err - } - if err = charts.Add(chart); err != nil { - return nil, err - } - } - } - return charts, nil -} - -func newChartsFromIndexRange(cfg ChartConfig) (*module.Charts, error) { - var addPrio int - charts := &module.Charts{} - for i := cfg.IndexRange[0]; i <= cfg.IndexRange[1]; i++ { - chart, err := newChartWithOIDIndex(i, cfg) - if err != nil { - return nil, err - } - chart.Priority += addPrio - addPrio += 1 - if err = charts.Add(chart); err != nil { - return nil, err - } - } - return charts, nil -} - -func newChartWithOIDIndex(oidIndex int, cfg ChartConfig) (*module.Chart, error) { - chart, err := newChart(cfg) - if err != nil { - return nil, err - } - - chart.ID = fmt.Sprintf("%s_%d", chart.ID, oidIndex) - chart.Title = fmt.Sprintf("%s %d", chart.Title, oidIndex) - for _, dim := range chart.Dims { - dim.ID = fmt.Sprintf("%s.%d", dim.ID, oidIndex) - } - - return chart, nil -} - -func newChart(cfg ChartConfig) (*module.Chart, error) { - chart := &module.Chart{ - ID: cfg.ID, - Title: cfg.Title, - Units: cfg.Units, - Fam: cfg.Family, - Ctx: fmt.Sprintf("snmp.%s", cfg.ID), - Type: module.ChartType(cfg.Type), - Priority: cfg.Priority, - } - - if chart.Title == "" { - chart.Title = "Untitled chart" - } - if chart.Units == "" { - chart.Units = "num" - } - if chart.Priority < module.Priority { - chart.Priority += module.Priority - } - - seen := make(map[string]struct{}) - var a string - for _, cfg := range cfg.Dimensions { - if cfg.Algorithm != "" { - seen[cfg.Algorithm] = struct{}{} - a = cfg.Algorithm - } - dim := &module.Dim{ - ID: strings.TrimPrefix(cfg.OID, "."), - Name: cfg.Name, - Algo: module.DimAlgo(cfg.Algorithm), - Mul: cfg.Multiplier, - Div: cfg.Divisor, - } - if err := chart.AddDim(dim); err != nil { - return nil, err - } - } - if len(seen) == 1 && a != "" && len(chart.Dims) > 1 { - for _, d := range chart.Dims { - if d.Algo == "" { - d.Algo = module.DimAlgo(a) - } - } - } - - return chart, nil -} diff --git a/src/go/collectors/go.d.plugin/modules/snmp/collect.go b/src/go/collectors/go.d.plugin/modules/snmp/collect.go deleted file mode 100644 index 9f0e78d7e..000000000 --- a/src/go/collectors/go.d.plugin/modules/snmp/collect.go +++ /dev/null @@ -1,55 +0,0 @@ -// SPDX-License-Identifier: GPL-3.0-or-later - -package snmp - -import ( - "github.com/gosnmp/gosnmp" -) - -func (s *SNMP) collect() (map[string]int64, error) { - collected := make(map[string]int64) - - if err := s.collectOIDs(collected); err != nil { - return nil, err - } - - return collected, nil -} - -func (s *SNMP) collectOIDs(collected map[string]int64) error { - for i, end := 0, 0; i < len(s.oids); i += s.Options.MaxOIDs { - if end = i + s.Options.MaxOIDs; end > len(s.oids) { - end = len(s.oids) - } - - oids := s.oids[i:end] - resp, err := s.snmpClient.Get(oids) - if err != nil { - s.Errorf("cannot get SNMP data: %v", err) - return err - } - - for i, oid := range oids { - if i >= len(resp.Variables) { - continue - } - - switch v := resp.Variables[i]; v.Type { - case gosnmp.Boolean, - gosnmp.Counter32, - gosnmp.Counter64, - gosnmp.Gauge32, - gosnmp.TimeTicks, - gosnmp.Uinteger32, - gosnmp.OpaqueFloat, - gosnmp.OpaqueDouble, - gosnmp.Integer: - collected[oid] = gosnmp.ToBigInt(v.Value).Int64() - default: - s.Debugf("skipping OID '%s' (unsupported type '%s')", oid, v.Type) - } - } - } - - return nil -} diff --git a/src/go/collectors/go.d.plugin/modules/snmp/init.go b/src/go/collectors/go.d.plugin/modules/snmp/init.go deleted file mode 100644 index 5802d6682..000000000 --- a/src/go/collectors/go.d.plugin/modules/snmp/init.go +++ /dev/null @@ -1,189 +0,0 @@ -// SPDX-License-Identifier: GPL-3.0-or-later - -package snmp - -import ( - "errors" - "fmt" - "time" - - "github.com/gosnmp/gosnmp" -) - -var newSNMPClient = gosnmp.NewHandler - -func (s *SNMP) validateConfig() error { - if len(s.ChartsInput) == 0 { - return errors.New("'charts' are required but not set") - } - - if s.Options.Version == gosnmp.Version3.String() { - if s.User.Name == "" { - return errors.New("'user.name' is required when using SNMPv3 but not set") - } - if _, err := parseSNMPv3SecurityLevel(s.User.SecurityLevel); err != nil { - return err - } - if _, err := parseSNMPv3AuthProtocol(s.User.AuthProto); err != nil { - return err - } - if _, err := parseSNMPv3PrivProtocol(s.User.PrivProto); err != nil { - return err - } - } - - return nil -} - -func (s *SNMP) initSNMPClient() (gosnmp.Handler, error) { - client := newSNMPClient() - - if client.SetTarget(s.Hostname); client.Target() == "" { - s.Warningf("'hostname' not set, using the default value: '%s'", defaultHostname) - client.SetTarget(defaultHostname) - } - if client.SetPort(uint16(s.Options.Port)); client.Port() <= 0 || client.Port() > 65535 { - s.Warningf("'options.port' is invalid, changing to the default value: '%d' => '%d'", s.Options.Port, defaultPort) - client.SetPort(defaultPort) - } - if client.SetRetries(s.Options.Retries); client.Retries() < 1 || client.Retries() > 10 { - s.Warningf("'options.retries' is invalid, changing to the default value: '%d' => '%d'", s.Options.Retries, defaultRetries) - client.SetRetries(defaultRetries) - } - if client.SetTimeout(time.Duration(s.Options.Timeout) * time.Second); client.Timeout().Seconds() < 1 { - s.Warningf("'options.timeout' is invalid, changing to the default value: '%d' => '%d'", s.Options.Timeout, defaultTimeout) - client.SetTimeout(defaultTimeout * time.Second) - } - if client.SetMaxOids(s.Options.MaxOIDs); client.MaxOids() < 1 { - s.Warningf("'options.max_request_size' is invalid, changing to the default value: '%d' => '%d'", s.Options.MaxOIDs, defaultMaxOIDs) - client.SetMaxOids(defaultMaxOIDs) - } - - ver, err := parseSNMPVersion(s.Options.Version) - if err != nil { - s.Warningf("'options.version' is invalid, changing to the default value: '%s' => '%s'", - s.Options.Version, defaultVersion) - ver = defaultVersion - } - comm := s.Community - if comm == "" && (ver <= gosnmp.Version2c) { - s.Warningf("'community' not set, using the default value: '%s'", defaultCommunity) - comm = defaultCommunity - } - - switch ver { - case gosnmp.Version1: - client.SetCommunity(comm) - client.SetVersion(gosnmp.Version1) - case gosnmp.Version2c: - client.SetCommunity(comm) - client.SetVersion(gosnmp.Version2c) - case gosnmp.Version3: - client.SetVersion(gosnmp.Version3) - client.SetSecurityModel(gosnmp.UserSecurityModel) - client.SetMsgFlags(safeParseSNMPv3SecurityLevel(s.User.SecurityLevel)) - client.SetSecurityParameters(&gosnmp.UsmSecurityParameters{ - UserName: s.User.Name, - AuthenticationProtocol: safeParseSNMPv3AuthProtocol(s.User.AuthProto), - AuthenticationPassphrase: s.User.AuthKey, - PrivacyProtocol: safeParseSNMPv3PrivProtocol(s.User.PrivProto), - PrivacyPassphrase: s.User.PrivKey, - }) - default: - return nil, fmt.Errorf("invalid SNMP version: %s", s.Options.Version) - } - - return client, nil -} - -func (s *SNMP) initOIDs() (oids []string) { - for _, c := range *s.charts { - for _, d := range c.Dims { - oids = append(oids, d.ID) - } - } - return oids -} - -func parseSNMPVersion(version string) (gosnmp.SnmpVersion, error) { - switch version { - case "0", "1": - return gosnmp.Version1, nil - case "2", "2c", "": - return gosnmp.Version2c, nil - case "3": - return gosnmp.Version3, nil - default: - return gosnmp.Version2c, fmt.Errorf("invalid snmp version value (%s)", version) - } -} - -func safeParseSNMPv3SecurityLevel(level string) gosnmp.SnmpV3MsgFlags { - v, _ := parseSNMPv3SecurityLevel(level) - return v -} - -func parseSNMPv3SecurityLevel(level string) (gosnmp.SnmpV3MsgFlags, error) { - switch level { - case "1", "none", "noAuthNoPriv", "": - return gosnmp.NoAuthNoPriv, nil - case "2", "authNoPriv": - return gosnmp.AuthNoPriv, nil - case "3", "authPriv": - return gosnmp.AuthPriv, nil - default: - return gosnmp.NoAuthNoPriv, fmt.Errorf("invalid snmpv3 user security level value (%s)", level) - } -} - -func safeParseSNMPv3AuthProtocol(protocol string) gosnmp.SnmpV3AuthProtocol { - v, _ := parseSNMPv3AuthProtocol(protocol) - return v -} - -func parseSNMPv3AuthProtocol(protocol string) (gosnmp.SnmpV3AuthProtocol, error) { - switch protocol { - case "1", "none", "noAuth", "": - return gosnmp.NoAuth, nil - case "2", "md5": - return gosnmp.MD5, nil - case "3", "sha": - return gosnmp.SHA, nil - case "4", "sha224": - return gosnmp.SHA224, nil - case "5", "sha256": - return gosnmp.SHA256, nil - case "6", "sha384": - return gosnmp.SHA384, nil - case "7", "sha512": - return gosnmp.SHA512, nil - default: - return gosnmp.NoAuth, fmt.Errorf("invalid snmpv3 user auth protocol value (%s)", protocol) - } -} - -func safeParseSNMPv3PrivProtocol(protocol string) gosnmp.SnmpV3PrivProtocol { - v, _ := parseSNMPv3PrivProtocol(protocol) - return v -} - -func parseSNMPv3PrivProtocol(protocol string) (gosnmp.SnmpV3PrivProtocol, error) { - switch protocol { - case "1", "none", "noPriv", "": - return gosnmp.NoPriv, nil - case "2", "des": - return gosnmp.DES, nil - case "3", "aes": - return gosnmp.AES, nil - case "4", "aes192": - return gosnmp.AES192, nil - case "5", "aes256": - return gosnmp.AES256, nil - case "6", "aes192c": - return gosnmp.AES192C, nil - case "7", "aes256c": - return gosnmp.AES256C, nil - default: - return gosnmp.NoPriv, fmt.Errorf("invalid snmpv3 user priv protocol value (%s)", protocol) - } -} diff --git a/src/go/collectors/go.d.plugin/modules/snmp/snmp.go b/src/go/collectors/go.d.plugin/modules/snmp/snmp.go deleted file mode 100644 index 6f4081f50..000000000 --- a/src/go/collectors/go.d.plugin/modules/snmp/snmp.go +++ /dev/null @@ -1,201 +0,0 @@ -// SPDX-License-Identifier: GPL-3.0-or-later - -package snmp - -import ( - _ "embed" - "errors" - "fmt" - "strings" - - "github.com/netdata/netdata/go/go.d.plugin/agent/module" - - "github.com/gosnmp/gosnmp" -) - -//go:embed "config_schema.json" -var configSchema string - -func init() { - module.Register("snmp", module.Creator{ - JobConfigSchema: configSchema, - Defaults: module.Defaults{ - UpdateEvery: defaultUpdateEvery, - }, - Create: func() module.Module { return New() }, - Config: func() any { return &Config{} }, - }) -} - -const ( - defaultUpdateEvery = 10 - defaultHostname = "127.0.0.1" - defaultCommunity = "public" - defaultVersion = gosnmp.Version2c - defaultPort = 161 - defaultRetries = 1 - defaultTimeout = defaultUpdateEvery - defaultMaxOIDs = 60 -) - -func New() *SNMP { - return &SNMP{ - Config: Config{ - Hostname: defaultHostname, - Community: defaultCommunity, - Options: Options{ - Port: defaultPort, - Retries: defaultRetries, - Timeout: defaultUpdateEvery, - Version: defaultVersion.String(), - MaxOIDs: defaultMaxOIDs, - }, - User: User{ - Name: "", - SecurityLevel: "authPriv", - AuthProto: "sha512", - AuthKey: "", - PrivProto: "aes192c", - PrivKey: "", - }, - }, - } -} - -type ( - Config struct { - UpdateEvery int `yaml:"update_every,omitempty" json:"update_every"` - Hostname string `yaml:"hostname" json:"hostname"` - Community string `yaml:"community,omitempty" json:"community"` - User User `yaml:"user,omitempty" json:"user"` - Options Options `yaml:"options,omitempty" json:"options"` - ChartsInput []ChartConfig `yaml:"charts,omitempty" json:"charts"` - } - User struct { - Name string `yaml:"name,omitempty" json:"name"` - SecurityLevel string `yaml:"level,omitempty" json:"level"` - AuthProto string `yaml:"auth_proto,omitempty" json:"auth_proto"` - AuthKey string `yaml:"auth_key,omitempty" json:"auth_key"` - PrivProto string `yaml:"priv_proto,omitempty" json:"priv_proto"` - PrivKey string `yaml:"priv_key,omitempty" json:"priv_key"` - } - Options struct { - Port int `yaml:"port,omitempty" json:"port"` - Retries int `yaml:"retries,omitempty" json:"retries"` - Timeout int `yaml:"timeout,omitempty" json:"timeout"` - Version string `yaml:"version,omitempty" json:"version"` - MaxOIDs int `yaml:"max_request_size,omitempty" json:"max_request_size"` - } - ChartConfig struct { - ID string `yaml:"id" json:"id"` - Title string `yaml:"title" json:"title"` - Units string `yaml:"units" json:"units"` - Family string `yaml:"family" json:"family"` - Type string `yaml:"type" json:"type"` - Priority int `yaml:"priority" json:"priority"` - IndexRange []int `yaml:"multiply_range,omitempty" json:"multiply_range"` - Dimensions []DimensionConfig `yaml:"dimensions" json:"dimensions"` - } - DimensionConfig struct { - OID string `yaml:"oid" json:"oid"` - Name string `yaml:"name" json:"name"` - Algorithm string `yaml:"algorithm" json:"algorithm"` - Multiplier int `yaml:"multiplier" json:"multiplier"` - Divisor int `yaml:"divisor" json:"divisor"` - } -) - -type SNMP struct { - module.Base - Config `yaml:",inline" json:""` - - charts *module.Charts - - snmpClient gosnmp.Handler - - oids []string -} - -func (s *SNMP) Configuration() any { - return s.Config -} - -func (s *SNMP) Init() error { - err := s.validateConfig() - if err != nil { - s.Errorf("config validation: %v", err) - return err - } - - snmpClient, err := s.initSNMPClient() - if err != nil { - s.Errorf("SNMP client initialization: %v", err) - return err - } - - s.Info(snmpClientConnInfo(snmpClient)) - - err = snmpClient.Connect() - if err != nil { - s.Errorf("SNMP client connect: %v", err) - return err - } - s.snmpClient = snmpClient - - charts, err := newCharts(s.ChartsInput) - if err != nil { - s.Errorf("Population of charts failed: %v", err) - return err - } - s.charts = charts - - s.oids = s.initOIDs() - - return nil -} - -func (s *SNMP) Check() error { - mx, err := s.collect() - if err != nil { - s.Error(err) - return err - } - if len(mx) == 0 { - return errors.New("no metrics collected") - } - return nil -} - -func (s *SNMP) Charts() *module.Charts { - return s.charts -} - -func (s *SNMP) Collect() map[string]int64 { - mx, err := s.collect() - if err != nil { - s.Error(err) - } - - if len(mx) == 0 { - return nil - } - return mx -} - -func (s *SNMP) Cleanup() { - if s.snmpClient != nil { - _ = s.snmpClient.Close() - } -} - -func snmpClientConnInfo(c gosnmp.Handler) string { - var info strings.Builder - info.WriteString(fmt.Sprintf("hostname=%s,port=%d,snmp_version=%s", c.Target(), c.Port(), c.Version())) - switch c.Version() { - case gosnmp.Version1, gosnmp.Version2c: - info.WriteString(fmt.Sprintf(",community=%s", c.Community())) - case gosnmp.Version3: - info.WriteString(fmt.Sprintf(",security_level=%d,%s", c.MsgFlags(), c.SecurityParameters().Description())) - } - return info.String() -} diff --git a/src/go/collectors/go.d.plugin/modules/snmp/snmp_test.go b/src/go/collectors/go.d.plugin/modules/snmp/snmp_test.go deleted file mode 100644 index 04d9db3f9..000000000 --- a/src/go/collectors/go.d.plugin/modules/snmp/snmp_test.go +++ /dev/null @@ -1,520 +0,0 @@ -// SPDX-License-Identifier: GPL-3.0-or-later - -package snmp - -import ( - "errors" - "fmt" - "os" - "strings" - "testing" - - "github.com/golang/mock/gomock" - "github.com/gosnmp/gosnmp" - snmpmock "github.com/gosnmp/gosnmp/mocks" - "github.com/netdata/netdata/go/go.d.plugin/agent/module" - "github.com/stretchr/testify/assert" - "github.com/stretchr/testify/require" -) - -var ( - dataConfigJSON, _ = os.ReadFile("testdata/config.json") - dataConfigYAML, _ = os.ReadFile("testdata/config.yaml") -) - -func Test_testDataIsValid(t *testing.T) { - for name, data := range map[string][]byte{ - "dataConfigJSON": dataConfigJSON, - "dataConfigYAML": dataConfigYAML, - } { - require.NotNil(t, data, name) - } -} - -func TestSNMP_ConfigurationSerialize(t *testing.T) { - module.TestConfigurationSerialize(t, &SNMP{}, dataConfigJSON, dataConfigYAML) -} - -func TestSNMP_Init(t *testing.T) { - tests := map[string]struct { - prepareSNMP func() *SNMP - wantFail bool - }{ - "fail with default config": { - wantFail: true, - prepareSNMP: func() *SNMP { - return New() - }, - }, - "fail when 'charts' not set": { - wantFail: true, - prepareSNMP: func() *SNMP { - snmp := New() - snmp.Config = prepareV2Config() - snmp.ChartsInput = nil - return snmp - }, - }, - "fail when using SNMPv3 but 'user.name' not set": { - wantFail: true, - prepareSNMP: func() *SNMP { - snmp := New() - snmp.Config = prepareV3Config() - snmp.User.Name = "" - return snmp - }, - }, - "fail when using SNMPv3 but 'user.level' is invalid": { - wantFail: true, - prepareSNMP: func() *SNMP { - snmp := New() - snmp.Config = prepareV3Config() - snmp.User.SecurityLevel = "invalid" - return snmp - }, - }, - "fail when using SNMPv3 but 'user.auth_proto' is invalid": { - wantFail: true, - prepareSNMP: func() *SNMP { - snmp := New() - snmp.Config = prepareV3Config() - snmp.User.AuthProto = "invalid" - return snmp - }, - }, - "fail when using SNMPv3 but 'user.priv_proto' is invalid": { - wantFail: true, - prepareSNMP: func() *SNMP { - snmp := New() - snmp.Config = prepareV3Config() - snmp.User.PrivProto = "invalid" - return snmp - }, - }, - "success when using SNMPv1 with valid config": { - wantFail: false, - prepareSNMP: func() *SNMP { - snmp := New() - snmp.Config = prepareV1Config() - return snmp - }, - }, - "success when using SNMPv2 with valid config": { - wantFail: false, - prepareSNMP: func() *SNMP { - snmp := New() - snmp.Config = prepareV2Config() - return snmp - }, - }, - "success when using SNMPv3 with valid config": { - wantFail: false, - prepareSNMP: func() *SNMP { - snmp := New() - snmp.Config = prepareV3Config() - return snmp - }, - }, - } - - for name, test := range tests { - t.Run(name, func(t *testing.T) { - snmp := test.prepareSNMP() - - if test.wantFail { - assert.Error(t, snmp.Init()) - } else { - assert.NoError(t, snmp.Init()) - } - }) - } -} - -func TestSNMP_Check(t *testing.T) { - tests := map[string]struct { - prepareSNMP func(m *snmpmock.MockHandler) *SNMP - wantFail bool - }{ - "success when 'max_request_size' > returned OIDs": { - wantFail: false, - prepareSNMP: func(m *snmpmock.MockHandler) *SNMP { - snmp := New() - snmp.Config = prepareV2Config() - - m.EXPECT().Get(gomock.Any()).Return(&gosnmp.SnmpPacket{ - Variables: []gosnmp.SnmpPDU{ - {Value: 10, Type: gosnmp.Gauge32}, - {Value: 20, Type: gosnmp.Gauge32}, - }, - }, nil).Times(1) - - return snmp - }, - }, - "success when 'max_request_size' < returned OIDs": { - wantFail: false, - prepareSNMP: func(m *snmpmock.MockHandler) *SNMP { - snmp := New() - snmp.Config = prepareV2Config() - snmp.Config.Options.MaxOIDs = 1 - - m.EXPECT().Get(gomock.Any()).Return(&gosnmp.SnmpPacket{ - Variables: []gosnmp.SnmpPDU{ - {Value: 10, Type: gosnmp.Gauge32}, - {Value: 20, Type: gosnmp.Gauge32}, - }, - }, nil).Times(2) - - return snmp - }, - }, - "success when using 'multiply_range'": { - wantFail: false, - prepareSNMP: func(m *snmpmock.MockHandler) *SNMP { - snmp := New() - snmp.Config = prepareConfigWithIndexRange(prepareV2Config, 0, 1) - - m.EXPECT().Get(gomock.Any()).Return(&gosnmp.SnmpPacket{ - Variables: []gosnmp.SnmpPDU{ - {Value: 10, Type: gosnmp.Gauge32}, - {Value: 20, Type: gosnmp.Gauge32}, - {Value: 30, Type: gosnmp.Gauge32}, - {Value: 40, Type: gosnmp.Gauge32}, - }, - }, nil).Times(1) - - return snmp - }, - }, - "fail when snmp client Get fails": { - wantFail: true, - prepareSNMP: func(m *snmpmock.MockHandler) *SNMP { - snmp := New() - snmp.Config = prepareV2Config() - - m.EXPECT().Get(gomock.Any()).Return(nil, errors.New("mock Get() error")).Times(1) - - return snmp - }, - }, - "fail when all OIDs type is unsupported": { - wantFail: true, - prepareSNMP: func(m *snmpmock.MockHandler) *SNMP { - snmp := New() - snmp.Config = prepareV2Config() - - m.EXPECT().Get(gomock.Any()).Return(&gosnmp.SnmpPacket{ - Variables: []gosnmp.SnmpPDU{ - {Value: nil, Type: gosnmp.NoSuchInstance}, - {Value: nil, Type: gosnmp.NoSuchInstance}, - }, - }, nil).Times(1) - - return snmp - }, - }, - } - - for name, test := range tests { - t.Run(name, func(t *testing.T) { - mockSNMP, cleanup := mockInit(t) - defer cleanup() - - newSNMPClient = func() gosnmp.Handler { return mockSNMP } - defaultMockExpects(mockSNMP) - - snmp := test.prepareSNMP(mockSNMP) - require.NoError(t, snmp.Init()) - - if test.wantFail { - assert.Error(t, snmp.Check()) - } else { - assert.NoError(t, snmp.Check()) - } - }) - } -} - -func TestSNMP_Collect(t *testing.T) { - tests := map[string]struct { - prepareSNMP func(m *snmpmock.MockHandler) *SNMP - wantCollected map[string]int64 - }{ - "success when collecting supported type": { - prepareSNMP: func(m *snmpmock.MockHandler) *SNMP { - snmp := New() - snmp.Config = prepareConfigWithIndexRange(prepareV2Config, 0, 3) - - m.EXPECT().Get(gomock.Any()).Return(&gosnmp.SnmpPacket{ - Variables: []gosnmp.SnmpPDU{ - {Value: 10, Type: gosnmp.Counter32}, - {Value: 20, Type: gosnmp.Counter64}, - {Value: 30, Type: gosnmp.Gauge32}, - {Value: 1, Type: gosnmp.Boolean}, - {Value: 40, Type: gosnmp.Gauge32}, - {Value: 50, Type: gosnmp.TimeTicks}, - {Value: 60, Type: gosnmp.Uinteger32}, - {Value: 70, Type: gosnmp.Integer}, - }, - }, nil).Times(1) - - return snmp - }, - wantCollected: map[string]int64{ - "1.3.6.1.2.1.2.2.1.10.0": 10, - "1.3.6.1.2.1.2.2.1.16.0": 20, - "1.3.6.1.2.1.2.2.1.10.1": 30, - "1.3.6.1.2.1.2.2.1.16.1": 1, - "1.3.6.1.2.1.2.2.1.10.2": 40, - "1.3.6.1.2.1.2.2.1.16.2": 50, - "1.3.6.1.2.1.2.2.1.10.3": 60, - "1.3.6.1.2.1.2.2.1.16.3": 70, - }, - }, - "success when collecting supported and unsupported type": { - prepareSNMP: func(m *snmpmock.MockHandler) *SNMP { - snmp := New() - snmp.Config = prepareConfigWithIndexRange(prepareV2Config, 0, 2) - - m.EXPECT().Get(gomock.Any()).Return(&gosnmp.SnmpPacket{ - Variables: []gosnmp.SnmpPDU{ - {Value: 10, Type: gosnmp.Counter32}, - {Value: 20, Type: gosnmp.Counter64}, - {Value: 30, Type: gosnmp.Gauge32}, - {Value: nil, Type: gosnmp.NoSuchInstance}, - {Value: nil, Type: gosnmp.NoSuchInstance}, - {Value: nil, Type: gosnmp.NoSuchInstance}, - }, - }, nil).Times(1) - - return snmp - }, - wantCollected: map[string]int64{ - "1.3.6.1.2.1.2.2.1.10.0": 10, - "1.3.6.1.2.1.2.2.1.16.0": 20, - "1.3.6.1.2.1.2.2.1.10.1": 30, - }, - }, - "fails when collecting unsupported type": { - prepareSNMP: func(m *snmpmock.MockHandler) *SNMP { - snmp := New() - snmp.Config = prepareConfigWithIndexRange(prepareV2Config, 0, 2) - - m.EXPECT().Get(gomock.Any()).Return(&gosnmp.SnmpPacket{ - Variables: []gosnmp.SnmpPDU{ - {Value: nil, Type: gosnmp.NoSuchInstance}, - {Value: nil, Type: gosnmp.NoSuchInstance}, - {Value: nil, Type: gosnmp.NoSuchObject}, - {Value: "192.0.2.0", Type: gosnmp.NsapAddress}, - {Value: []uint8{118, 101, 116}, Type: gosnmp.OctetString}, - {Value: ".1.3.6.1.2.1.4.32.1.5.2.1.4.10.19.0.0.16", Type: gosnmp.ObjectIdentifier}, - }, - }, nil).Times(1) - - return snmp - }, - wantCollected: nil, - }, - } - - for name, test := range tests { - t.Run(name, func(t *testing.T) { - mockSNMP, cleanup := mockInit(t) - defer cleanup() - - newSNMPClient = func() gosnmp.Handler { return mockSNMP } - defaultMockExpects(mockSNMP) - - snmp := test.prepareSNMP(mockSNMP) - require.NoError(t, snmp.Init()) - - collected := snmp.Collect() - - assert.Equal(t, test.wantCollected, collected) - }) - } -} - -func TestSNMP_Cleanup(t *testing.T) { - tests := map[string]struct { - prepareSNMP func(t *testing.T, m *snmpmock.MockHandler) *SNMP - }{ - "cleanup call if snmpClient initialized": { - prepareSNMP: func(t *testing.T, m *snmpmock.MockHandler) *SNMP { - snmp := New() - snmp.Config = prepareV2Config() - require.NoError(t, snmp.Init()) - - m.EXPECT().Close().Times(1) - - return snmp - }, - }, - "cleanup call does not panic if snmpClient not initialized": { - prepareSNMP: func(t *testing.T, m *snmpmock.MockHandler) *SNMP { - snmp := New() - snmp.Config = prepareV2Config() - require.NoError(t, snmp.Init()) - snmp.snmpClient = nil - - return snmp - }, - }, - } - - for name, test := range tests { - t.Run(name, func(t *testing.T) { - mockSNMP, cleanup := mockInit(t) - defer cleanup() - - newSNMPClient = func() gosnmp.Handler { return mockSNMP } - defaultMockExpects(mockSNMP) - - snmp := test.prepareSNMP(t, mockSNMP) - assert.NotPanics(t, snmp.Cleanup) - }) - } -} - -func TestSNMP_Charts(t *testing.T) { - tests := map[string]struct { - prepareSNMP func(t *testing.T, m *snmpmock.MockHandler) *SNMP - wantNumCharts int - }{ - "without 'multiply_range': got expected number of charts": { - wantNumCharts: 1, - prepareSNMP: func(t *testing.T, m *snmpmock.MockHandler) *SNMP { - snmp := New() - snmp.Config = prepareV2Config() - require.NoError(t, snmp.Init()) - - return snmp - }, - }, - "with 'multiply_range': got expected number of charts": { - wantNumCharts: 10, - prepareSNMP: func(t *testing.T, m *snmpmock.MockHandler) *SNMP { - snmp := New() - snmp.Config = prepareConfigWithIndexRange(prepareV2Config, 0, 9) - require.NoError(t, snmp.Init()) - - return snmp - }, - }, - } - - for name, test := range tests { - t.Run(name, func(t *testing.T) { - mockSNMP, cleanup := mockInit(t) - defer cleanup() - - newSNMPClient = func() gosnmp.Handler { return mockSNMP } - defaultMockExpects(mockSNMP) - - snmp := test.prepareSNMP(t, mockSNMP) - assert.Equal(t, test.wantNumCharts, len(*snmp.Charts())) - }) - } -} - -func mockInit(t *testing.T) (*snmpmock.MockHandler, func()) { - mockCtl := gomock.NewController(t) - cleanup := func() { mockCtl.Finish() } - mockSNMP := snmpmock.NewMockHandler(mockCtl) - - return mockSNMP, cleanup -} - -func defaultMockExpects(m *snmpmock.MockHandler) { - m.EXPECT().Target().AnyTimes() - m.EXPECT().Port().AnyTimes() - m.EXPECT().Retries().AnyTimes() - m.EXPECT().Timeout().AnyTimes() - m.EXPECT().MaxOids().AnyTimes() - m.EXPECT().Version().AnyTimes() - m.EXPECT().Community().AnyTimes() - m.EXPECT().SetTarget(gomock.Any()).AnyTimes() - m.EXPECT().SetPort(gomock.Any()).AnyTimes() - m.EXPECT().SetRetries(gomock.Any()).AnyTimes() - m.EXPECT().SetMaxOids(gomock.Any()).AnyTimes() - m.EXPECT().SetLogger(gomock.Any()).AnyTimes() - m.EXPECT().SetTimeout(gomock.Any()).AnyTimes() - m.EXPECT().SetCommunity(gomock.Any()).AnyTimes() - m.EXPECT().SetVersion(gomock.Any()).AnyTimes() - m.EXPECT().SetSecurityModel(gomock.Any()).AnyTimes() - m.EXPECT().SetMsgFlags(gomock.Any()).AnyTimes() - m.EXPECT().SetSecurityParameters(gomock.Any()).AnyTimes() - m.EXPECT().Connect().Return(nil).AnyTimes() -} - -func prepareConfigWithIndexRange(p func() Config, start, end int) Config { - if start > end || start < 0 || end < 1 { - panic(fmt.Sprintf("invalid index range ('%d'-'%d')", start, end)) - } - cfg := p() - for i := range cfg.ChartsInput { - cfg.ChartsInput[i].IndexRange = []int{start, end} - } - return cfg -} - -func prepareV3Config() Config { - cfg := prepareV2Config() - cfg.Options.Version = gosnmp.Version3.String() - cfg.User = User{ - Name: "name", - SecurityLevel: "authPriv", - AuthProto: strings.ToLower(gosnmp.MD5.String()), - AuthKey: "auth_key", - PrivProto: strings.ToLower(gosnmp.AES.String()), - PrivKey: "priv_key", - } - return cfg -} - -func prepareV2Config() Config { - cfg := prepareV1Config() - cfg.Options.Version = gosnmp.Version2c.String() - return cfg -} - -func prepareV1Config() Config { - return Config{ - UpdateEvery: defaultUpdateEvery, - Hostname: defaultHostname, - Community: defaultCommunity, - Options: Options{ - Port: defaultPort, - Retries: defaultRetries, - Timeout: defaultTimeout, - Version: gosnmp.Version1.String(), - MaxOIDs: defaultMaxOIDs, - }, - ChartsInput: []ChartConfig{ - { - ID: "test_chart1", - Title: "This is Test Chart1", - Units: "kilobits/s", - Family: "family", - Type: module.Area.String(), - Priority: module.Priority, - Dimensions: []DimensionConfig{ - { - OID: "1.3.6.1.2.1.2.2.1.10", - Name: "in", - Algorithm: module.Incremental.String(), - Multiplier: 8, - Divisor: 1000, - }, - { - OID: "1.3.6.1.2.1.2.2.1.16", - Name: "out", - Algorithm: module.Incremental.String(), - Multiplier: 8, - Divisor: 1000, - }, - }, - }, - }, - } -} diff --git a/src/go/collectors/go.d.plugin/modules/vsphere/vsphere_test.go b/src/go/collectors/go.d.plugin/modules/vsphere/vsphere_test.go deleted file mode 100644 index 8c0045d88..000000000 --- a/src/go/collectors/go.d.plugin/modules/vsphere/vsphere_test.go +++ /dev/null @@ -1,488 +0,0 @@ -// SPDX-License-Identifier: GPL-3.0-or-later -package vsphere - -import ( - "crypto/tls" - "os" - "strings" - "testing" - "time" - - "github.com/netdata/netdata/go/go.d.plugin/agent/module" - "github.com/netdata/netdata/go/go.d.plugin/modules/vsphere/discover" - "github.com/netdata/netdata/go/go.d.plugin/modules/vsphere/match" - rs "github.com/netdata/netdata/go/go.d.plugin/modules/vsphere/resources" - "github.com/netdata/netdata/go/go.d.plugin/pkg/web" - - "github.com/stretchr/testify/assert" - "github.com/stretchr/testify/require" - "github.com/vmware/govmomi/performance" - "github.com/vmware/govmomi/simulator" -) - -var ( - dataConfigJSON, _ = os.ReadFile("testdata/config.json") - dataConfigYAML, _ = os.ReadFile("testdata/config.yaml") -) - -func Test_testDataIsValid(t *testing.T) { - for name, data := range map[string][]byte{ - "dataConfigJSON": dataConfigJSON, - "dataConfigYAML": dataConfigYAML, - } { - require.NotNil(t, data, name) - } -} - -func TestVSphere_ConfigurationSerialize(t *testing.T) { - module.TestConfigurationSerialize(t, &VSphere{}, dataConfigJSON, dataConfigYAML) -} - -func TestVSphere_Init(t *testing.T) { - vSphere, _, teardown := prepareVSphereSim(t) - defer teardown() - - assert.NoError(t, vSphere.Init()) - assert.NotNil(t, vSphere.discoverer) - assert.NotNil(t, vSphere.scraper) - assert.NotNil(t, vSphere.resources) - assert.NotNil(t, vSphere.discoveryTask) - assert.True(t, vSphere.discoveryTask.isRunning()) -} - -func TestVSphere_Init_ReturnsFalseIfURLNotSet(t *testing.T) { - vSphere, _, teardown := prepareVSphereSim(t) - defer teardown() - vSphere.URL = "" - - assert.Error(t, vSphere.Init()) -} - -func TestVSphere_Init_ReturnsFalseIfUsernameNotSet(t *testing.T) { - vSphere, _, teardown := prepareVSphereSim(t) - defer teardown() - vSphere.Username = "" - - assert.Error(t, vSphere.Init()) -} - -func TestVSphere_Init_ReturnsFalseIfPasswordNotSet(t *testing.T) { - vSphere, _, teardown := prepareVSphereSim(t) - defer teardown() - vSphere.Password = "" - - assert.Error(t, vSphere.Init()) -} - -func TestVSphere_Init_ReturnsFalseIfClientWrongTLSCA(t *testing.T) { - vSphere, _, teardown := prepareVSphereSim(t) - defer teardown() - vSphere.Client.TLSConfig.TLSCA = "testdata/tls" - - assert.Error(t, vSphere.Init()) -} - -func TestVSphere_Init_ReturnsFalseIfConnectionRefused(t *testing.T) { - vSphere, _, teardown := prepareVSphereSim(t) - defer teardown() - vSphere.URL = "http://127.0.0.1:32001" - - assert.Error(t, vSphere.Init()) -} - -func TestVSphere_Init_ReturnsFalseIfInvalidHostVMIncludeFormat(t *testing.T) { - vSphere, _, teardown := prepareVSphereSim(t) - defer teardown() - - vSphere.HostsInclude = match.HostIncludes{"invalid"} - assert.Error(t, vSphere.Init()) - - vSphere.HostsInclude = vSphere.HostsInclude[:0] - - vSphere.VMsInclude = match.VMIncludes{"invalid"} - assert.Error(t, vSphere.Init()) -} - -func TestVSphere_Check(t *testing.T) { - assert.NoError(t, New().Check()) -} - -func TestVSphere_Charts(t *testing.T) { - assert.NotNil(t, New().Charts()) -} - -func TestVSphere_Cleanup(t *testing.T) { - vSphere, _, teardown := prepareVSphereSim(t) - defer teardown() - - require.NoError(t, vSphere.Init()) - - vSphere.Cleanup() - time.Sleep(time.Second) - assert.True(t, vSphere.discoveryTask.isStopped()) - assert.False(t, vSphere.discoveryTask.isRunning()) -} - -func TestVSphere_Cleanup_NotPanicsIfNotInitialized(t *testing.T) { - assert.NotPanics(t, New().Cleanup) -} - -func TestVSphere_Collect(t *testing.T) { - vSphere, model, teardown := prepareVSphereSim(t) - defer teardown() - - require.NoError(t, vSphere.Init()) - - vSphere.scraper = mockScraper{vSphere.scraper} - - expected := map[string]int64{ - "host-20_cpu.usage.average": 100, - "host-20_disk.maxTotalLatency.latest": 100, - "host-20_disk.read.average": 100, - "host-20_disk.write.average": 100, - "host-20_mem.active.average": 100, - "host-20_mem.consumed.average": 100, - "host-20_mem.granted.average": 100, - "host-20_mem.shared.average": 100, - "host-20_mem.sharedcommon.average": 100, - "host-20_mem.swapinRate.average": 100, - "host-20_mem.swapoutRate.average": 100, - "host-20_mem.usage.average": 100, - "host-20_net.bytesRx.average": 100, - "host-20_net.bytesTx.average": 100, - "host-20_net.droppedRx.summation": 100, - "host-20_net.droppedTx.summation": 100, - "host-20_net.errorsRx.summation": 100, - "host-20_net.errorsTx.summation": 100, - "host-20_net.packetsRx.summation": 100, - "host-20_net.packetsTx.summation": 100, - "host-20_overall.status.gray": 1, - "host-20_overall.status.green": 0, - "host-20_overall.status.red": 0, - "host-20_overall.status.yellow": 0, - "host-20_sys.uptime.latest": 100, - "host-34_cpu.usage.average": 100, - "host-34_disk.maxTotalLatency.latest": 100, - "host-34_disk.read.average": 100, - "host-34_disk.write.average": 100, - "host-34_mem.active.average": 100, - "host-34_mem.consumed.average": 100, - "host-34_mem.granted.average": 100, - "host-34_mem.shared.average": 100, - "host-34_mem.sharedcommon.average": 100, - "host-34_mem.swapinRate.average": 100, - "host-34_mem.swapoutRate.average": 100, - "host-34_mem.usage.average": 100, - "host-34_net.bytesRx.average": 100, - "host-34_net.bytesTx.average": 100, - "host-34_net.droppedRx.summation": 100, - "host-34_net.droppedTx.summation": 100, - "host-34_net.errorsRx.summation": 100, - "host-34_net.errorsTx.summation": 100, - "host-34_net.packetsRx.summation": 100, - "host-34_net.packetsTx.summation": 100, - "host-34_overall.status.gray": 1, - "host-34_overall.status.green": 0, - "host-34_overall.status.red": 0, - "host-34_overall.status.yellow": 0, - "host-34_sys.uptime.latest": 100, - "host-42_cpu.usage.average": 100, - "host-42_disk.maxTotalLatency.latest": 100, - "host-42_disk.read.average": 100, - "host-42_disk.write.average": 100, - "host-42_mem.active.average": 100, - "host-42_mem.consumed.average": 100, - "host-42_mem.granted.average": 100, - "host-42_mem.shared.average": 100, - "host-42_mem.sharedcommon.average": 100, - "host-42_mem.swapinRate.average": 100, - "host-42_mem.swapoutRate.average": 100, - "host-42_mem.usage.average": 100, - "host-42_net.bytesRx.average": 100, - "host-42_net.bytesTx.average": 100, - "host-42_net.droppedRx.summation": 100, - "host-42_net.droppedTx.summation": 100, - "host-42_net.errorsRx.summation": 100, - "host-42_net.errorsTx.summation": 100, - "host-42_net.packetsRx.summation": 100, - "host-42_net.packetsTx.summation": 100, - "host-42_overall.status.gray": 1, - "host-42_overall.status.green": 0, - "host-42_overall.status.red": 0, - "host-42_overall.status.yellow": 0, - "host-42_sys.uptime.latest": 100, - "host-50_cpu.usage.average": 100, - "host-50_disk.maxTotalLatency.latest": 100, - "host-50_disk.read.average": 100, - "host-50_disk.write.average": 100, - "host-50_mem.active.average": 100, - "host-50_mem.consumed.average": 100, - "host-50_mem.granted.average": 100, - "host-50_mem.shared.average": 100, - "host-50_mem.sharedcommon.average": 100, - "host-50_mem.swapinRate.average": 100, - "host-50_mem.swapoutRate.average": 100, - "host-50_mem.usage.average": 100, - "host-50_net.bytesRx.average": 100, - "host-50_net.bytesTx.average": 100, - "host-50_net.droppedRx.summation": 100, - "host-50_net.droppedTx.summation": 100, - "host-50_net.errorsRx.summation": 100, - "host-50_net.errorsTx.summation": 100, - "host-50_net.packetsRx.summation": 100, - "host-50_net.packetsTx.summation": 100, - "host-50_overall.status.gray": 1, - "host-50_overall.status.green": 0, - "host-50_overall.status.red": 0, - "host-50_overall.status.yellow": 0, - "host-50_sys.uptime.latest": 100, - "vm-55_cpu.usage.average": 200, - "vm-55_disk.maxTotalLatency.latest": 200, - "vm-55_disk.read.average": 200, - "vm-55_disk.write.average": 200, - "vm-55_mem.active.average": 200, - "vm-55_mem.consumed.average": 200, - "vm-55_mem.granted.average": 200, - "vm-55_mem.shared.average": 200, - "vm-55_mem.swapinRate.average": 200, - "vm-55_mem.swapoutRate.average": 200, - "vm-55_mem.swapped.average": 200, - "vm-55_mem.usage.average": 200, - "vm-55_net.bytesRx.average": 200, - "vm-55_net.bytesTx.average": 200, - "vm-55_net.droppedRx.summation": 200, - "vm-55_net.droppedTx.summation": 200, - "vm-55_net.packetsRx.summation": 200, - "vm-55_net.packetsTx.summation": 200, - "vm-55_overall.status.gray": 0, - "vm-55_overall.status.green": 1, - "vm-55_overall.status.red": 0, - "vm-55_overall.status.yellow": 0, - "vm-55_sys.uptime.latest": 200, - "vm-58_cpu.usage.average": 200, - "vm-58_disk.maxTotalLatency.latest": 200, - "vm-58_disk.read.average": 200, - "vm-58_disk.write.average": 200, - "vm-58_mem.active.average": 200, - "vm-58_mem.consumed.average": 200, - "vm-58_mem.granted.average": 200, - "vm-58_mem.shared.average": 200, - "vm-58_mem.swapinRate.average": 200, - "vm-58_mem.swapoutRate.average": 200, - "vm-58_mem.swapped.average": 200, - "vm-58_mem.usage.average": 200, - "vm-58_net.bytesRx.average": 200, - "vm-58_net.bytesTx.average": 200, - "vm-58_net.droppedRx.summation": 200, - "vm-58_net.droppedTx.summation": 200, - "vm-58_net.packetsRx.summation": 200, - "vm-58_net.packetsTx.summation": 200, - "vm-58_overall.status.gray": 0, - "vm-58_overall.status.green": 1, - "vm-58_overall.status.red": 0, - "vm-58_overall.status.yellow": 0, - "vm-58_sys.uptime.latest": 200, - "vm-61_cpu.usage.average": 200, - "vm-61_disk.maxTotalLatency.latest": 200, - "vm-61_disk.read.average": 200, - "vm-61_disk.write.average": 200, - "vm-61_mem.active.average": 200, - "vm-61_mem.consumed.average": 200, - "vm-61_mem.granted.average": 200, - "vm-61_mem.shared.average": 200, - "vm-61_mem.swapinRate.average": 200, - "vm-61_mem.swapoutRate.average": 200, - "vm-61_mem.swapped.average": 200, - "vm-61_mem.usage.average": 200, - "vm-61_net.bytesRx.average": 200, - "vm-61_net.bytesTx.average": 200, - "vm-61_net.droppedRx.summation": 200, - "vm-61_net.droppedTx.summation": 200, - "vm-61_net.packetsRx.summation": 200, - "vm-61_net.packetsTx.summation": 200, - "vm-61_overall.status.gray": 0, - "vm-61_overall.status.green": 1, - "vm-61_overall.status.red": 0, - "vm-61_overall.status.yellow": 0, - "vm-61_sys.uptime.latest": 200, - "vm-64_cpu.usage.average": 200, - "vm-64_disk.maxTotalLatency.latest": 200, - "vm-64_disk.read.average": 200, - "vm-64_disk.write.average": 200, - "vm-64_mem.active.average": 200, - "vm-64_mem.consumed.average": 200, - "vm-64_mem.granted.average": 200, - "vm-64_mem.shared.average": 200, - "vm-64_mem.swapinRate.average": 200, - "vm-64_mem.swapoutRate.average": 200, - "vm-64_mem.swapped.average": 200, - "vm-64_mem.usage.average": 200, - "vm-64_net.bytesRx.average": 200, - "vm-64_net.bytesTx.average": 200, - "vm-64_net.droppedRx.summation": 200, - "vm-64_net.droppedTx.summation": 200, - "vm-64_net.packetsRx.summation": 200, - "vm-64_net.packetsTx.summation": 200, - "vm-64_overall.status.gray": 0, - "vm-64_overall.status.green": 1, - "vm-64_overall.status.red": 0, - "vm-64_overall.status.yellow": 0, - "vm-64_sys.uptime.latest": 200, - } - - collected := vSphere.Collect() - require.Equal(t, expected, collected) - - count := model.Count() - assert.Len(t, vSphere.discoveredHosts, count.Host) - assert.Len(t, vSphere.discoveredVMs, count.Machine) - assert.Len(t, vSphere.charted, count.Host+count.Machine) - - assert.Len(t, *vSphere.Charts(), count.Host*len(hostChartsTmpl)+count.Machine*len(vmChartsTmpl)) - ensureCollectedHasAllChartsDimsVarsIDs(t, vSphere, collected) -} - -func TestVSphere_Collect_RemoveHostsVMsInRuntime(t *testing.T) { - vSphere, _, teardown := prepareVSphereSim(t) - defer teardown() - - require.NoError(t, vSphere.Init()) - require.NoError(t, vSphere.Check()) - - okHostID := "host-50" - okVMID := "vm-64" - vSphere.discoverer.(*discover.Discoverer).HostMatcher = mockHostMatcher{okHostID} - vSphere.discoverer.(*discover.Discoverer).VMMatcher = mockVMMatcher{okVMID} - - require.NoError(t, vSphere.discoverOnce()) - - numOfRuns := 5 - for i := 0; i < numOfRuns; i++ { - vSphere.Collect() - } - - host := vSphere.resources.Hosts.Get(okHostID) - for k, v := range vSphere.discoveredHosts { - if k == host.ID { - assert.Equal(t, 0, v) - } else { - assert.Equal(t, numOfRuns, v) - } - } - - vm := vSphere.resources.VMs.Get(okVMID) - for id, fails := range vSphere.discoveredVMs { - if id == vm.ID { - assert.Equal(t, 0, fails) - } else { - assert.Equal(t, numOfRuns, fails) - } - - } - - for i := numOfRuns; i < failedUpdatesLimit; i++ { - vSphere.Collect() - } - - assert.Len(t, vSphere.discoveredHosts, 1) - assert.Len(t, vSphere.discoveredVMs, 1) - assert.Len(t, vSphere.charted, 2) - - for _, c := range *vSphere.Charts() { - if strings.HasPrefix(c.ID, okHostID) || strings.HasPrefix(c.ID, okVMID) { - assert.False(t, c.Obsolete) - } else { - assert.True(t, c.Obsolete) - } - } -} - -func TestVSphere_Collect_Run(t *testing.T) { - vSphere, model, teardown := prepareVSphereSim(t) - defer teardown() - - vSphere.DiscoveryInterval = web.Duration(time.Second * 2) - require.NoError(t, vSphere.Init()) - require.NoError(t, vSphere.Check()) - - runs := 20 - for i := 0; i < runs; i++ { - assert.True(t, len(vSphere.Collect()) > 0) - if i < 6 { - time.Sleep(time.Second) - } - } - - count := model.Count() - assert.Len(t, vSphere.discoveredHosts, count.Host) - assert.Len(t, vSphere.discoveredVMs, count.Machine) - assert.Len(t, vSphere.charted, count.Host+count.Machine) - assert.Len(t, *vSphere.charts, count.Host*len(hostChartsTmpl)+count.Machine*len(vmChartsTmpl)) -} - -func ensureCollectedHasAllChartsDimsVarsIDs(t *testing.T, vSphere *VSphere, collected map[string]int64) { - for _, chart := range *vSphere.Charts() { - for _, dim := range chart.Dims { - _, ok := collected[dim.ID] - assert.Truef(t, ok, "collected metrics has no data for dim '%s' chart '%s'", dim.ID, chart.ID) - } - for _, v := range chart.Vars { - _, ok := collected[v.ID] - assert.Truef(t, ok, "collected metrics has no data for var '%s' chart '%s'", v.ID, chart.ID) - } - } -} - -func prepareVSphereSim(t *testing.T) (vSphere *VSphere, model *simulator.Model, teardown func()) { - model, srv := createSim(t) - vSphere = New() - teardown = func() { model.Remove(); srv.Close(); vSphere.Cleanup() } - - vSphere.Username = "administrator" - vSphere.Password = "password" - vSphere.URL = srv.URL.String() - vSphere.TLSConfig.InsecureSkipVerify = true - - return vSphere, model, teardown -} - -func createSim(t *testing.T) (*simulator.Model, *simulator.Server) { - model := simulator.VPX() - err := model.Create() - require.NoError(t, err) - model.Service.TLS = new(tls.Config) - return model, model.Service.NewServer() -} - -type mockScraper struct { - scraper -} - -func (s mockScraper) ScrapeHosts(hosts rs.Hosts) []performance.EntityMetric { - ms := s.scraper.ScrapeHosts(hosts) - return populateMetrics(ms, 100) -} -func (s mockScraper) ScrapeVMs(vms rs.VMs) []performance.EntityMetric { - ms := s.scraper.ScrapeVMs(vms) - return populateMetrics(ms, 200) -} - -func populateMetrics(ms []performance.EntityMetric, value int64) []performance.EntityMetric { - for i := range ms { - for ii := range ms[i].Value { - v := &ms[i].Value[ii].Value - if *v == nil { - *v = append(*v, value) - } else { - (*v)[0] = value - } - } - } - return ms -} - -type mockHostMatcher struct{ name string } -type mockVMMatcher struct{ name string } - -func (m mockHostMatcher) Match(host *rs.Host) bool { return m.name == host.ID } -func (m mockVMMatcher) Match(vm *rs.VM) bool { return m.name == vm.ID } diff --git a/src/go/collectors/go.d.plugin/go.mod b/src/go/go.mod index 47802583c..25153fc61 100644 --- a/src/go/collectors/go.d.plugin/go.mod +++ b/src/go/go.mod @@ -1,4 +1,4 @@ -module github.com/netdata/netdata/go/go.d.plugin +module github.com/netdata/netdata/go/plugins go 1.22.0 @@ -10,49 +10,50 @@ require ( github.com/Wing924/ltsv v0.3.1 github.com/apparentlymart/go-cidr v1.1.0 github.com/araddon/dateparse v0.0.0-20210429162001-6b43995a97de - github.com/axiomhq/hyperloglog v0.0.0-20240319100328-84253e514e02 + github.com/axiomhq/hyperloglog v0.1.0 github.com/blang/semver/v4 v4.0.0 github.com/bmatcuk/doublestar/v4 v4.6.1 github.com/clbanning/rfile/v2 v2.0.0-20231024120205-ac3fca974b0e github.com/cloudflare/cfssl v1.6.5 github.com/coreos/go-systemd/v22 v22.5.0 - github.com/docker/docker v27.0.0+incompatible - github.com/facebook/time v0.0.0-20240419201005-e4f24e18edf7 + github.com/docker/docker v27.1.2+incompatible + github.com/facebook/time v0.0.0-20240626113945-18207c5d8ddc github.com/fsnotify/fsnotify v1.7.0 github.com/go-redis/redis/v8 v8.11.5 github.com/go-sql-driver/mysql v1.8.1 github.com/godbus/dbus/v5 v5.1.0 - github.com/gofrs/flock v0.8.1 + github.com/gofrs/flock v0.12.1 github.com/golang/mock v1.6.0 - github.com/gosnmp/gosnmp v1.37.0 + github.com/gosnmp/gosnmp v1.38.0 github.com/ilyam8/hashstructure v1.1.0 github.com/jackc/pgx/v4 v4.18.3 + github.com/jackc/pgx/v5 v5.6.0 github.com/jessevdk/go-flags v1.6.1 github.com/kanocz/fcgi_client v0.0.0-20210113082628-fff85c8adfb7 - github.com/likexian/whois v1.15.3 - github.com/likexian/whois-parser v1.24.16 - github.com/lmittmann/tint v1.0.4 + github.com/likexian/whois v1.15.4 + github.com/likexian/whois-parser v1.24.19 + github.com/lmittmann/tint v1.0.5 github.com/mattn/go-isatty v0.0.20 github.com/mattn/go-xmlrpc v0.0.3 - github.com/miekg/dns v1.1.61 + github.com/miekg/dns v1.1.62 github.com/mitchellh/go-homedir v1.1.0 - github.com/muesli/cancelreader v0.2.2 - github.com/prometheus-community/pro-bing v0.4.0 - github.com/prometheus/common v0.54.0 + github.com/prometheus-community/pro-bing v0.4.1 + github.com/prometheus/common v0.55.0 github.com/prometheus/prometheus v2.5.0+incompatible github.com/stretchr/testify v1.9.0 - github.com/tidwall/gjson v1.17.1 + github.com/tidwall/gjson v1.17.3 github.com/valyala/fastjson v1.6.4 - github.com/vmware/govmomi v0.37.3 - go.mongodb.org/mongo-driver v1.15.1 - golang.org/x/net v0.26.0 - golang.org/x/text v0.16.0 + github.com/vmware/govmomi v0.42.0 + go.mongodb.org/mongo-driver v1.16.1 + golang.org/x/net v0.28.0 + golang.org/x/text v0.17.0 golang.zx2c4.com/wireguard/wgctrl v0.0.0-20220504211119-3d4a969bb56b gopkg.in/ini.v1 v1.67.0 + gopkg.in/rethinkdb/rethinkdb-go.v6 v6.2.2 gopkg.in/yaml.v2 v2.4.0 - k8s.io/api v0.30.2 - k8s.io/apimachinery v0.30.2 - k8s.io/client-go v0.30.2 + k8s.io/api v0.31.0 + k8s.io/apimachinery v0.31.0 + k8s.io/client-go v0.31.0 layeh.com/radius v0.0.0-20190322222518-890bc1058917 ) @@ -70,9 +71,9 @@ require ( github.com/docker/go-connections v0.4.0 // indirect github.com/docker/go-units v0.5.0 // indirect github.com/emicklei/go-restful/v3 v3.11.0 // indirect - github.com/evanphx/json-patch v5.6.0+incompatible // indirect github.com/felixge/httpsnoop v1.0.4 // indirect - github.com/go-logr/logr v1.4.1 // indirect + github.com/fxamacker/cbor/v2 v2.7.0 // indirect + github.com/go-logr/logr v1.4.2 // indirect github.com/go-logr/stdr v1.2.2 // indirect github.com/go-openapi/jsonpointer v0.20.0 // indirect github.com/go-openapi/jsonreference v0.20.2 // indirect @@ -86,6 +87,7 @@ require ( github.com/google/gofuzz v1.2.0 // indirect github.com/google/uuid v1.6.0 // indirect github.com/grafana/regexp v0.0.0-20221122212121-6b5c0a4cb7fd // indirect + github.com/hailocab/go-hostpool v0.0.0-20160125115350-e80d13ce29ed // indirect github.com/huandu/xstrings v1.3.3 // indirect github.com/imdario/mergo v0.3.16 // indirect github.com/jackc/chunkreader/v2 v2.0.1 // indirect @@ -95,6 +97,7 @@ require ( github.com/jackc/pgproto3/v2 v2.3.3 // indirect github.com/jackc/pgservicefile v0.0.0-20221227161230-091c0ba34f0a // indirect github.com/jackc/pgtype v1.14.0 // indirect + github.com/jackc/puddle/v2 v2.2.1 // indirect github.com/josharian/intern v1.0.0 // indirect github.com/josharian/native v1.1.0 // indirect github.com/json-iterator/go v1.1.12 // indirect @@ -109,10 +112,11 @@ require ( github.com/moby/docker-image-spec v1.3.1 // indirect github.com/modern-go/concurrent v0.0.0-20180306012644-bacd9c7ef1dd // indirect github.com/modern-go/reflect2 v1.0.2 // indirect - github.com/montanaflynn/stats v0.0.0-20171201202039-1bf9dbcd8cbe // indirect + github.com/montanaflynn/stats v0.7.1 // indirect github.com/munnerz/goautoneg v0.0.0-20191010083416-a7dc8b61c822 // indirect github.com/opencontainers/go-digest v1.0.0 // indirect github.com/opencontainers/image-spec v1.0.2 // indirect + github.com/opentracing/opentracing-go v1.1.0 // indirect github.com/pkg/errors v0.9.1 // indirect github.com/pmezard/go-difflib v1.0.1-0.20181226105442-5d4384ee4fb2 // indirect github.com/prometheus/client_model v0.6.1 // indirect @@ -122,6 +126,7 @@ require ( github.com/spf13/pflag v1.0.5 // indirect github.com/tidwall/match v1.1.1 // indirect github.com/tidwall/pretty v1.2.0 // indirect + github.com/x448/float16 v0.8.4 // indirect github.com/xdg-go/pbkdf2 v1.0.0 // indirect github.com/xdg-go/scram v1.1.2 // indirect github.com/xdg-go/stringprep v1.0.4 // indirect @@ -130,23 +135,25 @@ require ( go.opentelemetry.io/otel v1.22.0 // indirect go.opentelemetry.io/otel/metric v1.22.0 // indirect go.opentelemetry.io/otel/trace v1.22.0 // indirect - golang.org/x/crypto v0.24.0 // indirect + golang.org/x/crypto v0.26.0 // indirect golang.org/x/exp v0.0.0-20240119083558-1b970713d09a // indirect golang.org/x/mod v0.18.0 // indirect - golang.org/x/oauth2 v0.19.0 // indirect - golang.org/x/sync v0.7.0 // indirect - golang.org/x/sys v0.21.0 // indirect - golang.org/x/term v0.21.0 // indirect + golang.org/x/oauth2 v0.21.0 // indirect + golang.org/x/sync v0.8.0 // indirect + golang.org/x/sys v0.23.0 // indirect + golang.org/x/term v0.23.0 // indirect golang.org/x/time v0.5.0 // indirect golang.org/x/tools v0.22.0 // indirect golang.org/x/xerrors v0.0.0-20220907171357-04be3eba64a2 // indirect golang.zx2c4.com/wireguard v0.0.0-20230325221338-052af4a8072b // indirect - google.golang.org/protobuf v1.34.0 // indirect + google.golang.org/protobuf v1.34.2 // indirect + gopkg.in/cenkalti/backoff.v2 v2.2.1 // indirect + gopkg.in/evanphx/json-patch.v4 v4.12.0 // indirect gopkg.in/inf.v0 v0.9.1 // indirect gopkg.in/yaml.v3 v3.0.1 // indirect - k8s.io/klog/v2 v2.120.1 // indirect + k8s.io/klog/v2 v2.130.1 // indirect k8s.io/kube-openapi v0.0.0-20240228011516-70dd3763d340 // indirect - k8s.io/utils v0.0.0-20230726121419-3b25d923346b // indirect + k8s.io/utils v0.0.0-20240711033017-18e509b52bc8 // indirect sigs.k8s.io/json v0.0.0-20221116044647-bc3834ca7abd // indirect sigs.k8s.io/structured-merge-diff/v4 v4.4.1 // indirect sigs.k8s.io/yaml v1.4.0 // indirect diff --git a/src/go/collectors/go.d.plugin/go.sum b/src/go/go.sum index b2eb24d0f..c572aa7c4 100644 --- a/src/go/collectors/go.d.plugin/go.sum +++ b/src/go/go.sum @@ -20,12 +20,16 @@ github.com/apparentlymart/go-cidr v1.1.0 h1:2mAhrMoF+nhXqxTzSZMUzDHkLjmIHC+Zzn4t github.com/apparentlymart/go-cidr v1.1.0/go.mod h1:EBcsNrHc3zQeuaeCeCtQruQm+n9/YjEn/vI25Lg7Gwc= github.com/araddon/dateparse v0.0.0-20210429162001-6b43995a97de h1:FxWPpzIjnTlhPwqqXc4/vE0f7GvRjuAsbW+HOIe8KnA= github.com/araddon/dateparse v0.0.0-20210429162001-6b43995a97de/go.mod h1:DCaWoUhZrYW9p1lxo/cm8EmUOOzAPSEZNGF2DK1dJgw= -github.com/axiomhq/hyperloglog v0.0.0-20240319100328-84253e514e02 h1:bXAPYSbdYbS5VTy92NIUbeDI1qyggi+JYh5op9IFlcQ= -github.com/axiomhq/hyperloglog v0.0.0-20240319100328-84253e514e02/go.mod h1:k08r+Yj1PRAmuayFiRK6MYuR5Ve4IuZtTfxErMIh0+c= +github.com/axiomhq/hyperloglog v0.1.0 h1:1KGnEY6jlfxOVu4UF0MgILDt3izucjr4Hh9mQbYZ0hY= +github.com/axiomhq/hyperloglog v0.1.0/go.mod h1:k08r+Yj1PRAmuayFiRK6MYuR5Ve4IuZtTfxErMIh0+c= +github.com/bitly/go-hostpool v0.1.0 h1:XKmsF6k5el6xHG3WPJ8U0Ku/ye7njX7W81Ng7O2ioR0= +github.com/bitly/go-hostpool v0.1.0/go.mod h1:4gOCgp6+NZnVqlKyZ/iBZFTAJKembaVENUpMkpg42fw= github.com/blang/semver/v4 v4.0.0 h1:1PFHFE6yCCTv8C1TeyNNarDzntLi7wMI5i/pzqYIsAM= github.com/blang/semver/v4 v4.0.0/go.mod h1:IbckMUScFkM3pff0VJDNKRiT6TG/YpiHIM2yvyW5YoQ= github.com/bmatcuk/doublestar/v4 v4.6.1 h1:FH9SifrbvJhnlQpztAx++wlkk70QBf0iBWDwNy7PA4I= github.com/bmatcuk/doublestar/v4 v4.6.1/go.mod h1:xBQ8jztBU6kakFMg+8WGxn0c6z1fTSPVIjEY1Wr7jzc= +github.com/bmizerany/assert v0.0.0-20160611221934-b7ed37b82869 h1:DDGfHa7BWjL4YnC6+E63dPcxHo2sUxDIu8g3QgEJdRY= +github.com/bmizerany/assert v0.0.0-20160611221934-b7ed37b82869/go.mod h1:Ekp36dRnpXw/yCqJaO+ZrUyxD+3VXMFFr56k5XYrpB4= github.com/cenkalti/backoff/v4 v4.2.1 h1:y4OZtCnogmCPw98Zjyt5a6+QwPLGkiQsYW5oUqylYbM= github.com/cenkalti/backoff/v4 v4.2.1/go.mod h1:Y3VNntkOUPxTVeUxJ/G5vcM//AlwfmyYozVcomhLiZE= github.com/cespare/xxhash/v2 v2.2.0 h1:DC2CZ1Ep5Y4k3ZQ899DldepgrayRUGE6BBZ/cd9Cj44= @@ -54,27 +58,28 @@ github.com/dgryski/go-rendezvous v0.0.0-20200823014737-9f7001d12a5f h1:lO4WD4F/r github.com/dgryski/go-rendezvous v0.0.0-20200823014737-9f7001d12a5f/go.mod h1:cuUVRXasLTGF7a8hSLbxyZXjz+1KgoB3wDUb6vlszIc= github.com/distribution/reference v0.5.0 h1:/FUIFXtfc/x2gpa5/VGfiGLuOIdYa1t65IKK2OFGvA0= github.com/distribution/reference v0.5.0/go.mod h1:BbU0aIcezP1/5jX/8MP0YiH4SdvB5Y4f/wlDRiLyi3E= -github.com/docker/docker v27.0.0+incompatible h1:JRugTYuelmWlW0M3jakcIadDx2HUoUO6+Tf2C5jVfwA= -github.com/docker/docker v27.0.0+incompatible/go.mod h1:eEKB0N0r5NX/I1kEveEz05bcu8tLC/8azJZsviup8Sk= +github.com/docker/docker v27.1.2+incompatible h1:AhGzR1xaQIy53qCkxARaFluI00WPGtXn0AJuoQsVYTY= +github.com/docker/docker v27.1.2+incompatible/go.mod h1:eEKB0N0r5NX/I1kEveEz05bcu8tLC/8azJZsviup8Sk= github.com/docker/go-connections v0.4.0 h1:El9xVISelRB7BuFusrZozjnkIM5YnzCViNKohAFqRJQ= github.com/docker/go-connections v0.4.0/go.mod h1:Gbd7IOopHjR8Iph03tsViu4nIes5XhDvyHbTtUxmeec= github.com/docker/go-units v0.5.0 h1:69rxXcBk27SvSaaxTtLh/8llcHD8vYHT7WSdRZ/jvr4= github.com/docker/go-units v0.5.0/go.mod h1:fgPhTUdO+D/Jk86RDLlptpiXQzgHJF7gydDDbaIK4Dk= github.com/emicklei/go-restful/v3 v3.11.0 h1:rAQeMHw1c7zTmncogyy8VvRZwtkmkZ4FxERmMY4rD+g= github.com/emicklei/go-restful/v3 v3.11.0/go.mod h1:6n3XBCmQQb25CM2LCACGz8ukIrRry+4bhvbpWn3mrbc= -github.com/evanphx/json-patch v5.6.0+incompatible h1:jBYDEEiFBPxA0v50tFdvOzQQTCvpL6mnFh5mB2/l16U= -github.com/evanphx/json-patch v5.6.0+incompatible/go.mod h1:50XU6AFN0ol/bzJsmQLiYLvXMP4fmwYFNcr97nuDLSk= -github.com/facebook/time v0.0.0-20240419201005-e4f24e18edf7 h1:ux8H/t/+FqQ5rB+GeBu4mfQmkn5ASu1sMVs2mdrTypQ= -github.com/facebook/time v0.0.0-20240419201005-e4f24e18edf7/go.mod h1:IzbLjofnIgln16a+BfuCTMi8IaC3PuBra2hi4jPPmNE= +github.com/facebook/time v0.0.0-20240626113945-18207c5d8ddc h1:0VQsg5ZXW9MPUxzemUHW7UBK8gfIO8K+YJGbdv4kBIM= +github.com/facebook/time v0.0.0-20240626113945-18207c5d8ddc/go.mod h1:2UFAomOuD2vAK1x68czUtCVjAqmyWCEnAXOlmGqf+G0= github.com/felixge/httpsnoop v1.0.4 h1:NFTV2Zj1bL4mc9sqWACXbQFVBBg2W3GPvqp8/ESS2Wg= github.com/felixge/httpsnoop v1.0.4/go.mod h1:m8KPJKqk1gH5J9DgRY2ASl2lWCfGKXixSwevea8zH2U= +github.com/fsnotify/fsnotify v1.4.7/go.mod h1:jwhsz4b93w/PPRr/qN1Yymfu8t87LnFCMoQvtojpjFo= github.com/fsnotify/fsnotify v1.7.0 h1:8JEhPFa5W2WU7YfeZzPNqzMP6Lwt7L2715Ggo0nosvA= github.com/fsnotify/fsnotify v1.7.0/go.mod h1:40Bi/Hjc2AVfZrqy+aj+yEI+/bRxZnMJyTJwOpGvigM= +github.com/fxamacker/cbor/v2 v2.7.0 h1:iM5WgngdRBanHcxugY4JySA0nk1wZorNOpTgCMedv5E= +github.com/fxamacker/cbor/v2 v2.7.0/go.mod h1:pxXPTn3joSm21Gbwsv0w9OSA2y1HFR9qXEeXQVeNoDQ= github.com/go-kit/log v0.1.0/go.mod h1:zbhenjAZHb184qTLMA9ZjW7ThYL0H2mk7Q6pNt4vbaY= github.com/go-logfmt/logfmt v0.5.0/go.mod h1:wCYkCAKZfumFQihp8CzCvQ3paCTfi41vtzG1KdI/P7A= github.com/go-logr/logr v1.2.2/go.mod h1:jdQByPbusPIv2/zmleS9BjJVeZ6kBagPoEUsqbVz/1A= -github.com/go-logr/logr v1.4.1 h1:pKouT5E8xu9zeFC39JXRDukb6JFQPXM5p5I91188VAQ= -github.com/go-logr/logr v1.4.1/go.mod h1:9T104GzyrTigFIr8wt5mBrctHMim0Nb2HLGrmQ40KvY= +github.com/go-logr/logr v1.4.2 h1:6pFjapn8bFcIbiKo3XT4j/BhANplGihG6tvd+8rYgrY= +github.com/go-logr/logr v1.4.2/go.mod h1:9T104GzyrTigFIr8wt5mBrctHMim0Nb2HLGrmQ40KvY= github.com/go-logr/stdr v1.2.2 h1:hSWxHoqTgW2S2qGc0LTAI563KZ5YKYRhT3MFKZMbjag= github.com/go-logr/stdr v1.2.2/go.mod h1:mMo/vtBO5dYbehREoey6XUKy/eSumjCCveDpRre4VKE= github.com/go-openapi/jsonpointer v0.19.6/go.mod h1:osyAmYz/mB/C3I+WsTTSgw1ONzaLJoLCyoi6/zppojs= @@ -90,19 +95,21 @@ github.com/go-redis/redis/v8 v8.11.5/go.mod h1:gREzHqY1hg6oD9ngVRbLStwAWKhA0FEgq github.com/go-sql-driver/mysql v1.8.1 h1:LedoTUt/eveggdHS9qUFC1EFSa8bU2+1pZjSRpvNJ1Y= github.com/go-sql-driver/mysql v1.8.1/go.mod h1:wEBSXgmK//2ZFJyE+qWnIsVGmvmEKlqwuVSjsCm7DZg= github.com/go-stack/stack v1.8.0/go.mod h1:v0f6uXyyMGvRgIKkXu+yp6POWl0qKG85gN/melR3HDY= -github.com/go-task/slim-sprig v0.0.0-20230315185526-52ccab3ef572 h1:tfuBGBXKqDEevZMzYi5KSi8KkcZtzBcTgAUUtapy0OI= -github.com/go-task/slim-sprig v0.0.0-20230315185526-52ccab3ef572/go.mod h1:9Pwr4B2jHnOSGXyyzV8ROjYa2ojvAY6HCGYYfMoC3Ls= +github.com/go-task/slim-sprig/v3 v3.0.0 h1:sUs3vkvUymDpBKi3qH1YSqBQk9+9D/8M2mN1vB6EwHI= +github.com/go-task/slim-sprig/v3 v3.0.0/go.mod h1:W848ghGpv3Qj3dhTPRyJypKRiqCdHZiAzKg9hl15HA8= github.com/godbus/dbus/v5 v5.0.4/go.mod h1:xhWf0FNVPg57R7Z0UbKHbJfkEywrmjJnf7w5xrFpKfA= github.com/godbus/dbus/v5 v5.1.0 h1:4KLkAxT3aOY8Li4FRJe/KvhoNFFxo0m6fNuFUO8QJUk= github.com/godbus/dbus/v5 v5.1.0/go.mod h1:xhWf0FNVPg57R7Z0UbKHbJfkEywrmjJnf7w5xrFpKfA= -github.com/gofrs/flock v0.8.1 h1:+gYjHKf32LDeiEEFhQaotPbLuUXjY5ZqxKgXy7n59aw= -github.com/gofrs/flock v0.8.1/go.mod h1:F1TvTiK9OcQqauNUHlbJvyl9Qa1QvF/gOUDKA14jxHU= +github.com/gofrs/flock v0.12.1 h1:MTLVXXHf8ekldpJk3AKicLij9MdwOWkZ+a/jHHZby9E= +github.com/gofrs/flock v0.12.1/go.mod h1:9zxTsyu5xtJ9DK+1tFZyibEV7y3uwDxPPfbxeeHCoD0= github.com/gofrs/uuid v4.0.0+incompatible h1:1SD/1F5pU8p29ybwgQSwpQk+mwdRrXCYuPhW6m+TnJw= github.com/gofrs/uuid v4.0.0+incompatible/go.mod h1:b2aQJv3Z4Fp6yNu3cdSllBxTCLRxnplIgP/c0N/04lM= github.com/gogo/protobuf v1.3.2 h1:Ov1cvc58UF3b5XjBnZv7+opcTcQFZebYjWzi34vdm4Q= github.com/gogo/protobuf v1.3.2/go.mod h1:P1XiOD3dCwIKUDQYPy72D8LYyHL2YPYrpS2s69NZV8Q= github.com/golang/mock v1.6.0 h1:ErTB+efbowRARo13NNdxyJji2egdxLGQhRaY+DUumQc= github.com/golang/mock v1.6.0/go.mod h1:p6yTPP+5HYm5mzsMV8JkE6ZKdX+/wYM6Hr+LicevLPs= +github.com/golang/protobuf v1.2.0/go.mod h1:6lQm79b+lXiMfvg/cZm0SGofjICqVBUtrP5yJMmIC1U= +github.com/golang/protobuf v1.3.4/go.mod h1:vzj43D7+SQXF/4pzW/hwtAqwc6iTitCiVSaWz5lYuqw= github.com/golang/protobuf v1.5.4 h1:i7eJL8qZTpSEXOPTxNKhASYpMn+8e5Q6AdndVa1dWek= github.com/golang/protobuf v1.5.4/go.mod h1:lnTiLA8Wa4RWRcIUkrtSVa5nRhsEGBg48fD6rSs7xps= github.com/golang/snappy v0.0.4 h1:yAGX7huGHXlcLOEtBnF4w7FQwA26wojNCwOYAEhLjQM= @@ -117,19 +124,22 @@ github.com/google/go-cmp v0.6.0/go.mod h1:17dUlkBOakJ0+DkrSSNjCkIjxS6bF9zb3elmeN github.com/google/gofuzz v1.0.0/go.mod h1:dBl0BpW6vV/+mYPU4Po3pmUjxk6FQPldtuIdl/M65Eg= github.com/google/gofuzz v1.2.0 h1:xRy4A+RhZaiKjJ1bPfwQ8sedCA+YS2YcCHW6ec7JMi0= github.com/google/gofuzz v1.2.0/go.mod h1:dBl0BpW6vV/+mYPU4Po3pmUjxk6FQPldtuIdl/M65Eg= -github.com/google/pprof v0.0.0-20240117000934-35fc243c5815 h1:WzfWbQz/Ze8v6l++GGbGNFZnUShVpP/0xffCPLL+ax8= -github.com/google/pprof v0.0.0-20240117000934-35fc243c5815/go.mod h1:czg5+yv1E0ZGTi6S6vVK1mke0fV+FaUhNGcd6VRS9Ik= +github.com/google/pprof v0.0.0-20240525223248-4bfdf5a9a2af h1:kmjWCqn2qkEml422C2Rrd27c3VGxi6a/6HNq8QmHRKM= +github.com/google/pprof v0.0.0-20240525223248-4bfdf5a9a2af/go.mod h1:K1liHPHnj73Fdn/EKuT8nrFqBihUSKXoLYU0BuatOYo= github.com/google/renameio v0.1.0/go.mod h1:KWCgfxg9yswjAJkECMjeO8J8rahYeXnNhOm40UhjYkI= github.com/google/uuid v1.1.1/go.mod h1:TIyPZe4MgqvfeYDBFedMoGGpEw/LqOeaOT+nhxU+yHo= github.com/google/uuid v1.6.0 h1:NIvaJDMOsjHA8n1jAhLSgzrAzy1Hgr+hNrb57e+94F0= github.com/google/uuid v1.6.0/go.mod h1:TIyPZe4MgqvfeYDBFedMoGGpEw/LqOeaOT+nhxU+yHo= -github.com/gosnmp/gosnmp v1.37.0 h1:/Tf8D3b9wrnNuf/SfbvO+44mPrjVphBhRtcGg22V07Y= -github.com/gosnmp/gosnmp v1.37.0/go.mod h1:GDH9vNqpsD7f2HvZhKs5dlqSEcAS6s6Qp099oZRCR+M= +github.com/gosnmp/gosnmp v1.38.0 h1:I5ZOMR8kb0DXAFg/88ACurnuwGwYkXWq3eLpJPHMEYc= +github.com/gosnmp/gosnmp v1.38.0/go.mod h1:FE+PEZvKrFz9afP9ii1W3cprXuVZ17ypCcyyfYuu5LY= github.com/grafana/regexp v0.0.0-20221122212121-6b5c0a4cb7fd h1:PpuIBO5P3e9hpqBD0O/HjhShYuM6XE0i/lbE6J94kww= github.com/grafana/regexp v0.0.0-20221122212121-6b5c0a4cb7fd/go.mod h1:M5qHK+eWfAv8VR/265dIuEpL3fNfeC21tXXp9itM24A= github.com/grpc-ecosystem/grpc-gateway v1.16.0 h1:gmcG1KaJ57LophUzW0Hy8NmPhnMZb4M0+kPpLofRdBo= github.com/grpc-ecosystem/grpc-gateway/v2 v2.18.0 h1:RtRsiaGvWxcwd8y3BiRZxsylPT8hLWZ5SPcfI+3IDNk= github.com/grpc-ecosystem/grpc-gateway/v2 v2.18.0/go.mod h1:TzP6duP4Py2pHLVPPQp42aoYI92+PCrVotyR5e8Vqlk= +github.com/hailocab/go-hostpool v0.0.0-20160125115350-e80d13ce29ed h1:5upAirOpQc1Q53c0bnx2ufif5kANL7bfZWcc6VJWJd8= +github.com/hailocab/go-hostpool v0.0.0-20160125115350-e80d13ce29ed/go.mod h1:tMWxXQ9wFIaZeTI9F+hmhFiGpFmhOHzyShyFUhRm0H4= +github.com/hpcloud/tail v1.0.0/go.mod h1:ab1qPbhIpdTxEkNHXyeSf5vhxWSCs/tWer42PpOxQnU= github.com/huandu/xstrings v1.3.3 h1:/Gcsuc1x8JVbJ9/rlye4xZnVAbEkGauT8lbebqcQws4= github.com/huandu/xstrings v1.3.3/go.mod h1:y5/lhBue+AyNmUVz9RLU9xbLR0o4KIIExikq4ovT0aE= github.com/ilyam8/hashstructure v1.1.0 h1:N8t8hzzKLf2Da87XgC/DBYqXUmSbclgx+2cZxS5/klU= @@ -181,9 +191,13 @@ github.com/jackc/pgx/v4 v4.0.0-pre1.0.20190824185557-6972a5742186/go.mod h1:X+GQ github.com/jackc/pgx/v4 v4.12.1-0.20210724153913-640aa07df17c/go.mod h1:1QD0+tgSXP7iUjYm9C1NxKhny7lq6ee99u/z+IHFcgs= github.com/jackc/pgx/v4 v4.18.3 h1:dE2/TrEsGX3RBprb3qryqSV9Y60iZN1C6i8IrmW9/BA= github.com/jackc/pgx/v4 v4.18.3/go.mod h1:Ey4Oru5tH5sB6tV7hDmfWFahwF15Eb7DNXlRKx2CkVw= +github.com/jackc/pgx/v5 v5.6.0 h1:SWJzexBzPL5jb0GEsrPMLIsi/3jOo7RHlzTjcAeDrPY= +github.com/jackc/pgx/v5 v5.6.0/go.mod h1:DNZ/vlrUnhWCoFGxHAG8U2ljioxukquj7utPDgtQdTw= github.com/jackc/puddle v0.0.0-20190413234325-e4ced69a3a2b/go.mod h1:m4B5Dj62Y0fbyuIc15OsIqK0+JU8nkqQjsgx7dvjSWk= github.com/jackc/puddle v0.0.0-20190608224051-11cab39313c9/go.mod h1:m4B5Dj62Y0fbyuIc15OsIqK0+JU8nkqQjsgx7dvjSWk= github.com/jackc/puddle v1.1.3/go.mod h1:m4B5Dj62Y0fbyuIc15OsIqK0+JU8nkqQjsgx7dvjSWk= +github.com/jackc/puddle/v2 v2.2.1 h1:RhxXJtFG022u4ibrCSMSiu5aOq1i77R3OHKNJj77OAk= +github.com/jackc/puddle/v2 v2.2.1/go.mod h1:vriiEXHvEE654aYKXXjOvZM39qJ0q+azkZFrfEOc3H4= github.com/jessevdk/go-flags v1.6.1 h1:Cvu5U8UGrLay1rZfv/zP7iLpSHGUZ/Ou68T0iX1bBK4= github.com/jessevdk/go-flags v1.6.1/go.mod h1:Mk8T1hIAWpOiJiHa9rJASDK2UGWji0EuPGBnNLMooyc= github.com/josharian/intern v1.0.0 h1:vlS4z54oSdjm0bgjRigI+G1HpF+tI+9rE5LLzOg8HmY= @@ -218,12 +232,12 @@ github.com/lib/pq v1.10.9 h1:YXG7RB+JIjhP29X+OtkiDnYaXQwpS4JEWq7dtCCRUEw= github.com/lib/pq v1.10.9/go.mod h1:AlVN5x4E4T544tWzH6hKfbfQvm3HdbOxrmggDNAPY9o= github.com/likexian/gokit v0.25.15 h1:QjospM1eXhdMMHwZRpMKKAHY/Wig9wgcREmLtf9NslY= github.com/likexian/gokit v0.25.15/go.mod h1:S2QisdsxLEHWeD/XI0QMVeggp+jbxYqUxMvSBil7MRg= -github.com/likexian/whois v1.15.3 h1:0emFSUSUj98Q12Wer3iM3eROPXjg+CyUBlibGPNbKHw= -github.com/likexian/whois v1.15.3/go.mod h1:a6sGAAKEb+O3JRBuW2x/QDM80l5hJ07p0+SjQkJ1c+0= -github.com/likexian/whois-parser v1.24.16 h1:WdHt6ICtapm/2M2ue84n541nHDbNBD7M8HsxgXKcEV8= -github.com/likexian/whois-parser v1.24.16/go.mod h1:k5zmKRZ7xPg1TLv3BGT4g/LOPRIMhvdNMeB0F53V/jk= -github.com/lmittmann/tint v1.0.4 h1:LeYihpJ9hyGvE0w+K2okPTGUdVLfng1+nDNVR4vWISc= -github.com/lmittmann/tint v1.0.4/go.mod h1:HIS3gSy7qNwGCj+5oRjAutErFBl4BzdQP6cJZ0NfMwE= +github.com/likexian/whois v1.15.4 h1:r5En62c+S9HKFgJtdh2WsdmRGTcxE4WUtGBdZkSBXmM= +github.com/likexian/whois v1.15.4/go.mod h1:rXFTPcQdNlPQBJCQpPWTSIDGzzmgKBftmhdOOcLpwXk= +github.com/likexian/whois-parser v1.24.19 h1:vT8lWhnV8ogkdaYLyef6IvE5VTHVCwlUDG5BUXCx06k= +github.com/likexian/whois-parser v1.24.19/go.mod h1:rAtaofg2luol09H+ogDzGIfcG8ig1NtM5R16uQADDz4= +github.com/lmittmann/tint v1.0.5 h1:NQclAutOfYsqs2F1Lenue6OoWCajs5wJcP3DfWVpePw= +github.com/lmittmann/tint v1.0.5/go.mod h1:HIS3gSy7qNwGCj+5oRjAutErFBl4BzdQP6cJZ0NfMwE= github.com/mailru/easyjson v0.7.7 h1:UGYAvKxe3sBsEDzO8ZeWOSlIQfWFlxbzLZe7hwFURr0= github.com/mailru/easyjson v0.7.7/go.mod h1:xzfreul335JAWq5oZzymOObrkdz5UnU4kGfJJLY9Nlc= github.com/mattn/go-colorable v0.1.1/go.mod h1:FuOcm+DKB9mbwrcAfNl7/TZVBZ6rcnceauSikq3lYCQ= @@ -242,8 +256,8 @@ github.com/mdlayher/netlink v1.7.2 h1:/UtM3ofJap7Vl4QWCPDGXY8d3GIY2UGSDbK+QWmY8/ github.com/mdlayher/netlink v1.7.2/go.mod h1:xraEF7uJbxLhc5fpHL4cPe221LI2bdttWlU+ZGLfQSw= github.com/mdlayher/socket v0.4.1 h1:eM9y2/jlbs1M615oshPQOHZzj6R6wMT7bX5NPiQvn2U= github.com/mdlayher/socket v0.4.1/go.mod h1:cAqeGjoufqdxWkD7DkpyS+wcefOtmu5OQ8KuoJGIReA= -github.com/miekg/dns v1.1.61 h1:nLxbwF3XxhwVSm8g9Dghm9MHPaUZuqhPiGL+675ZmEs= -github.com/miekg/dns v1.1.61/go.mod h1:mnAarhS3nWaW+NVP2wTkYVIZyHNJ098SJZUki3eykwQ= +github.com/miekg/dns v1.1.62 h1:cN8OuEF1/x5Rq6Np+h1epln8OiyPWV+lROx9LxcGgIQ= +github.com/miekg/dns v1.1.62/go.mod h1:mvDlcItzm+br7MToIKqkglaGhlFMHJ9DTNNWONWXbNQ= github.com/mikioh/ipaddr v0.0.0-20190404000644-d465c8ab6721 h1:RlZweED6sbSArvlE924+mUcZuXKLBHA35U7LN621Bws= github.com/mikioh/ipaddr v0.0.0-20190404000644-d465c8ab6721/go.mod h1:Ickgr2WtCLZ2MDGd4Gr0geeCH5HybhRJbonOgQpvSxc= github.com/mitchellh/copystructure v1.0.0 h1:Laisrj+bAB6b/yJwB5Bt3ITZhGJdqmxquMKeZ+mmkFQ= @@ -262,44 +276,49 @@ github.com/modern-go/concurrent v0.0.0-20180306012644-bacd9c7ef1dd h1:TRLaZ9cD/w github.com/modern-go/concurrent v0.0.0-20180306012644-bacd9c7ef1dd/go.mod h1:6dJC0mAP4ikYIbvyc7fijjWJddQyLn8Ig3JB5CqoB9Q= github.com/modern-go/reflect2 v1.0.2 h1:xBagoLtFs94CBntxluKeaWgTMpvLxC4ur3nMaC9Gz0M= github.com/modern-go/reflect2 v1.0.2/go.mod h1:yWuevngMOJpCy52FWWMvUC8ws7m/LJsjYzDa0/r8luk= -github.com/montanaflynn/stats v0.0.0-20171201202039-1bf9dbcd8cbe h1:iruDEfMl2E6fbMZ9s0scYfZQ84/6SPL6zC8ACM2oIL0= -github.com/montanaflynn/stats v0.0.0-20171201202039-1bf9dbcd8cbe/go.mod h1:wL8QJuTMNUDYhXwkmfOly8iTdp5TEcJFWZD2D7SIkUc= +github.com/montanaflynn/stats v0.7.1 h1:etflOAAHORrCC44V+aR6Ftzort912ZU+YLiSTuV8eaE= +github.com/montanaflynn/stats v0.7.1/go.mod h1:etXPPgVO6n31NxCd9KQUMvCM+ve0ruNzt6R8Bnaayow= github.com/morikuni/aec v1.0.0 h1:nP9CBfwrvYnBRgY6qfDQkygYDmYwOilePFkwzv4dU8A= github.com/morikuni/aec v1.0.0/go.mod h1:BbKIizmSmc5MMPqRYbxO4ZU0S0+P200+tUnFx7PXmsc= -github.com/muesli/cancelreader v0.2.2 h1:3I4Kt4BQjOR54NavqnDogx/MIoWBFa0StPA8ELUXHmA= -github.com/muesli/cancelreader v0.2.2/go.mod h1:3XuTXfFS2VjM+HTLZY9Ak0l6eUKfijIfMUZ4EgX0QYo= github.com/munnerz/goautoneg v0.0.0-20191010083416-a7dc8b61c822 h1:C3w9PqII01/Oq1c1nUAm88MOHcQC9l5mIlSMApZMrHA= github.com/munnerz/goautoneg v0.0.0-20191010083416-a7dc8b61c822/go.mod h1:+n7T8mK8HuQTcFwEeznm/DIxMOiR9yIdICNftLE1DvQ= +github.com/niemeyer/pretty v0.0.0-20200227124842-a10e7caefd8e/go.mod h1:zD1mROLANZcx1PVRCS0qkT7pwLkGfwJo4zjcN/Tysno= github.com/nxadm/tail v1.4.8 h1:nPr65rt6Y5JFSKQO7qToXr7pePgD6Gwiw05lkbyAQTE= github.com/nxadm/tail v1.4.8/go.mod h1:+ncqLTQzXmGhMZNUePPaPqPvBxHAIsmXswZKocGu+AU= +github.com/onsi/ginkgo v1.6.0/go.mod h1:lLunBs/Ym6LB5Z9jYTR76FiuTmxDTDusOGeTQH+WWjE= +github.com/onsi/ginkgo v1.12.0/go.mod h1:oUhWkIvk5aDxtKvDDuw8gItl8pKl42LzjC9KZE0HfGg= github.com/onsi/ginkgo v1.16.5 h1:8xi0RTUf59SOSfEtZMvwTvXYMzG4gV23XVHOZiXNtnE= github.com/onsi/ginkgo v1.16.5/go.mod h1:+E8gABHa3K6zRBolWtd+ROzc/U5bkGt0FwiG042wbpU= -github.com/onsi/ginkgo/v2 v2.15.0 h1:79HwNRBAZHOEwrczrgSOPy+eFTTlIGELKy5as+ClttY= -github.com/onsi/ginkgo/v2 v2.15.0/go.mod h1:HlxMHtYF57y6Dpf+mc5529KKmSq9h2FpCF+/ZkwUxKM= -github.com/onsi/gomega v1.31.0 h1:54UJxxj6cPInHS3a35wm6BK/F9nHYueZ1NVujHDrnXE= -github.com/onsi/gomega v1.31.0/go.mod h1:DW9aCi7U6Yi40wNVAvT6kzFnEVEI5n3DloYBiKiT6zk= +github.com/onsi/ginkgo/v2 v2.19.0 h1:9Cnnf7UHo57Hy3k6/m5k3dRfGTMXGvxhHFvkDTCTpvA= +github.com/onsi/ginkgo/v2 v2.19.0/go.mod h1:rlwLi9PilAFJ8jCg9UE1QP6VBpd6/xj3SRC0d6TU0To= +github.com/onsi/gomega v1.7.1/go.mod h1:XdKZgCCFLUoM/7CFJVPcG8C1xQ1AJ0vpAezJrB7JYyY= +github.com/onsi/gomega v1.9.0/go.mod h1:Ho0h+IUsWyvy1OpqCwxlQ/21gkhVunqlU8fDGcoTdcA= +github.com/onsi/gomega v1.19.0 h1:4ieX6qQjPP/BfC3mpsAtIGGlxTWPeA3Inl/7DtXw1tw= +github.com/onsi/gomega v1.19.0/go.mod h1:LY+I3pBVzYsTBU1AnDwOSxaYi9WoWiqgwooUqq9yPro= github.com/opencontainers/go-digest v1.0.0 h1:apOUWs51W5PlhuyGyz9FCeeBIOUDA/6nW8Oi/yOhh5U= github.com/opencontainers/go-digest v1.0.0/go.mod h1:0JzlMkj0TRzQZfJkVvzbP0HBR3IKzErnv2BNG4W4MAM= github.com/opencontainers/image-spec v1.0.2 h1:9yCKha/T5XdGtO0q9Q9a6T5NUCsTn/DrBg0D7ufOcFM= github.com/opencontainers/image-spec v1.0.2/go.mod h1:BtxoFyWECRxE4U/7sNtV5W15zMzWCbyJoFRP3s7yZA0= +github.com/opentracing/opentracing-go v1.1.0 h1:pWlfV3Bxv7k65HYwkikxat0+s3pV4bsqf19k25Ur8rU= +github.com/opentracing/opentracing-go v1.1.0/go.mod h1:UkNAQd3GIcIGf0SeVgPpRdFStlNbqXla1AfSYxPUl2o= github.com/pkg/errors v0.8.1/go.mod h1:bwawxfHBFNV+L2hUp1rHADufV3IMtnDRdf1r5NINEl0= github.com/pkg/errors v0.9.1 h1:FEBLx1zS214owpjy7qsBeixbURkuhQAwrK5UwLGTwt4= github.com/pkg/errors v0.9.1/go.mod h1:bwawxfHBFNV+L2hUp1rHADufV3IMtnDRdf1r5NINEl0= github.com/pmezard/go-difflib v1.0.0/go.mod h1:iKH77koFhYxTK1pcRnkKkqfTogsbg7gZNVY4sRDYZ/4= github.com/pmezard/go-difflib v1.0.1-0.20181226105442-5d4384ee4fb2 h1:Jamvg5psRIccs7FGNTlIRMkT8wgtp5eCXdBlqhYGL6U= github.com/pmezard/go-difflib v1.0.1-0.20181226105442-5d4384ee4fb2/go.mod h1:iKH77koFhYxTK1pcRnkKkqfTogsbg7gZNVY4sRDYZ/4= -github.com/prometheus-community/pro-bing v0.4.0 h1:YMbv+i08gQz97OZZBwLyvmmQEEzyfyrrjEaAchdy3R4= -github.com/prometheus-community/pro-bing v0.4.0/go.mod h1:b7wRYZtCcPmt4Sz319BykUU241rWLe1VFXyiyWK/dH4= +github.com/prometheus-community/pro-bing v0.4.1 h1:aMaJwyifHZO0y+h8+icUz0xbToHbia0wdmzdVZ+Kl3w= +github.com/prometheus-community/pro-bing v0.4.1/go.mod h1:aLsw+zqCaDoa2RLVVSX3+UiCkBBXTMtZC3c7EkfWnAE= github.com/prometheus/client_model v0.6.1 h1:ZKSh/rekM+n3CeS952MLRAdFwIKqeY8b62p8ais2e9E= github.com/prometheus/client_model v0.6.1/go.mod h1:OrxVMOVHjw3lKMa8+x6HeMGkHMQyHDk9E3jmP2AmGiY= -github.com/prometheus/common v0.54.0 h1:ZlZy0BgJhTwVZUn7dLOkwCZHUkrAqd3WYtcFCWnM1D8= -github.com/prometheus/common v0.54.0/go.mod h1:/TQgMJP5CuVYveyT7n/0Ix8yLNNXy9yRSkhnLTHPDIQ= +github.com/prometheus/common v0.55.0 h1:KEi6DK7lXW/m7Ig5i47x0vRzuBsHuvJdi5ee6Y3G1dc= +github.com/prometheus/common v0.55.0/go.mod h1:2SECS4xJG1kd8XF9IcM1gMX6510RAEL65zxzNImwdc8= github.com/prometheus/prometheus v0.50.1 h1:N2L+DYrxqPh4WZStU+o1p/gQlBaqFbcLBTjlp3vpdXw= github.com/prometheus/prometheus v0.50.1/go.mod h1:FvE8dtQ1Ww63IlyKBn1V4s+zMwF9kHkVNkQBR1pM4CU= github.com/rivo/uniseg v0.1.0/go.mod h1:J6wj4VEh+S6ZtnVlnTBMWIodfgj8LQOQFoIToxlJtxc= github.com/rogpeppe/go-internal v1.3.0/go.mod h1:M8bDsm7K2OlrFYOpmOWEs/qY81heoFRclV5y23lUDJ4= -github.com/rogpeppe/go-internal v1.10.0 h1:TMyTOH3F/DB16zRVcYyreMH6GnZZrwQVAoYjRBZyWFQ= -github.com/rogpeppe/go-internal v1.10.0/go.mod h1:UQnix2H7Ngw/k4C5ijL5+65zddjncjaFoBhdsK/akog= +github.com/rogpeppe/go-internal v1.12.0 h1:exVL4IDcn6na9z1rAb56Vxr+CgyK3nn3O+epU5NdKM8= +github.com/rogpeppe/go-internal v1.12.0/go.mod h1:E+RYuTGaKKdloAfM02xzb0FW3Paa99yedzYV+kq4uf4= github.com/rs/xid v1.2.1/go.mod h1:+uKXf+4Djp6Md1KODXJxgGQPKngRmWyn10oCKFzNHOQ= github.com/rs/zerolog v1.13.0/go.mod h1:YbFCdg8HfsridGWAh22vktObvhZbQsZXe4/zB0OKkWU= github.com/rs/zerolog v1.15.0/go.mod h1:xYTKnLHcpfU2225ny5qZjxnj9NvkumZYjJHlAThCjNc= @@ -308,6 +327,7 @@ github.com/scylladb/termtables v0.0.0-20191203121021-c4c0b6d42ff4/go.mod h1:C1a7 github.com/shopspring/decimal v0.0.0-20180709203117-cd690d0c9e24/go.mod h1:M+9NzErvs504Cn4c5DxATwIqPbtswREoFCre64PpcG4= github.com/shopspring/decimal v1.2.0 h1:abSATXmQEYyShuxI4/vyW3tV1MrKAJzCZ/0zLUXYbsQ= github.com/shopspring/decimal v1.2.0/go.mod h1:DKyhrW/HYNuLGql+MJL6WCR6knT2jwCFRcu2hWCYk4o= +github.com/sirupsen/logrus v1.0.6/go.mod h1:pMByvHTf9Beacp5x1UXfOR9xyW/9antXMhjMPG0dEzc= github.com/sirupsen/logrus v1.4.1/go.mod h1:ni0Sbl8bgC9z8RoU9G6nDWqqs/fq4eDPysMBDgk/93Q= github.com/sirupsen/logrus v1.4.2/go.mod h1:tLMulIdttU9McNUspp0xgXVQah82FyeX6MwdIuYE2rE= github.com/sirupsen/logrus v1.9.3 h1:dueUQJ1C2q9oE3F7wvmSGAaVtTmUizReu6fjN8uqzbQ= @@ -321,6 +341,8 @@ github.com/stretchr/objx v0.1.1/go.mod h1:HFkY916IF+rwdDfMAkV7OtwuqBVzrE8GR6GFx+ github.com/stretchr/objx v0.2.0/go.mod h1:qt09Ya8vawLte6SNmTgCsAVtYtaKzEcn8ATUoHMkEqE= github.com/stretchr/objx v0.4.0/go.mod h1:YvHI0jy2hoMjB+UWwv71VJQ9isScKT/TqJzVSSt89Yw= github.com/stretchr/objx v0.5.0/go.mod h1:Yh+to48EsGEfYuaHDzXPcE3xhTkx73EhmCGUpEOglKo= +github.com/stretchr/objx v0.5.2 h1:xuMeJ0Sdp5ZMRXx/aWO6RZxdr3beISkG5/G/aIRr3pY= +github.com/stretchr/objx v0.5.2/go.mod h1:FRsXN1f5AsAjCGJKqEizvkpNtU+EGNCLh3NxZ/8L+MA= github.com/stretchr/testify v1.2.2/go.mod h1:a8OnRcib4nhh0OaRAV+Yts87kKdq0PP7pXfy6kDkUVs= github.com/stretchr/testify v1.3.0/go.mod h1:M5WIy9Dh21IEIfnGCwXGc5bZfKNJtfHm1UVUgZn+9EI= github.com/stretchr/testify v1.4.0/go.mod h1:j7eGeouHqKxXV5pUuKE4zz7dFj8WfuZ+81PSLYec5m4= @@ -331,16 +353,18 @@ github.com/stretchr/testify v1.8.0/go.mod h1:yNjHg4UonilssWZ8iaSj1OCr/vHnekPRkoO github.com/stretchr/testify v1.8.1/go.mod h1:w2LPCIKwWwSfY2zedu0+kehJoqGctiVI29o6fzry7u4= github.com/stretchr/testify v1.9.0 h1:HtqpIVDClZ4nwg75+f6Lvsy/wHu+3BoSGCbBAcpTsTg= github.com/stretchr/testify v1.9.0/go.mod h1:r2ic/lqez/lEtzL7wO/rwa5dbSLXVDPFyf8C91i36aY= -github.com/tidwall/gjson v1.17.1 h1:wlYEnwqAHgzmhNUFfw7Xalt2JzQvsMx2Se4PcoFCT/U= -github.com/tidwall/gjson v1.17.1/go.mod h1:/wbyibRr2FHMks5tjHJ5F8dMZh3AcwJEMf5vlfC0lxk= +github.com/tidwall/gjson v1.17.3 h1:bwWLZU7icoKRG+C+0PNwIKC6FCJO/Q3p2pZvuP0jN94= +github.com/tidwall/gjson v1.17.3/go.mod h1:/wbyibRr2FHMks5tjHJ5F8dMZh3AcwJEMf5vlfC0lxk= github.com/tidwall/match v1.1.1 h1:+Ho715JplO36QYgwN9PGYNhgZvoUSc9X2c80KVTi+GA= github.com/tidwall/match v1.1.1/go.mod h1:eRSPERbgtNPcGhD8UCthc6PmLEQXEWd3PRB5JTxsfmM= github.com/tidwall/pretty v1.2.0 h1:RWIZEg2iJ8/g6fDDYzMpobmaoGh5OLl4AXtGUGPcqCs= github.com/tidwall/pretty v1.2.0/go.mod h1:ITEVvHYasfjBbM0u2Pg8T2nJnzm8xPwvNhhsoaGGjNU= github.com/valyala/fastjson v1.6.4 h1:uAUNq9Z6ymTgGhcm0UynUAB6tlbakBrz6CQFax3BXVQ= github.com/valyala/fastjson v1.6.4/go.mod h1:CLCAqky6SMuOcxStkYQvblddUtoRxhYMGLrsQns1aXY= -github.com/vmware/govmomi v0.37.3 h1:L2y2Ba09tYiZwdPtdF64Ox9QZeJ8vlCUGcAF9SdODn4= -github.com/vmware/govmomi v0.37.3/go.mod h1:mtGWtM+YhTADHlCgJBiskSRPOZRsN9MSjPzaZLte/oQ= +github.com/vmware/govmomi v0.42.0 h1:MbvAlVfjNBE1mHMaQ7yOSop1KLB0/93x6VAGuCtjqtI= +github.com/vmware/govmomi v0.42.0/go.mod h1:1H5LWwsBif8HKZqbFp0FdoKTHyJE4FzL6ACequMKYQg= +github.com/x448/float16 v0.8.4 h1:qLwI1I70+NjRFUR3zs1JPUCgaCXSh3SW62uAKT1mSBM= +github.com/x448/float16 v0.8.4/go.mod h1:14CWIYCyZA/cWjXOioeEpHeN/83MdbZDRQHoFcYsOfg= github.com/xdg-go/pbkdf2 v1.0.0 h1:Su7DPu48wXMwC3bs7MCNG+z4FhcyEuz5dlvchbq0B0c= github.com/xdg-go/pbkdf2 v1.0.0/go.mod h1:jrpuAogTd400dnrH08LKmI/xc1MbPOebTwRqcT5RDeI= github.com/xdg-go/scram v1.1.2 h1:FHX5I5B4i4hKRVRBCFRxq1iQRej7WO3hhBuJf+UUySY= @@ -354,8 +378,8 @@ github.com/yuin/goldmark v1.2.1/go.mod h1:3hX8gzYuyVAZsxl0MRgGTJEmQBFcNTphYh9dec github.com/yuin/goldmark v1.3.5/go.mod h1:mwnBkeHKe2W/ZEtQ+71ViKU8L12m81fl3OWwC1Zlc8k= github.com/yuin/goldmark v1.4.13/go.mod h1:6yULJ656Px+3vBD8DxQVa3kxgyrAnzto9xy5taEt/CY= github.com/zenazn/goji v0.9.0/go.mod h1:7S9M489iMyHBNxwZnk9/EHS098H4/F6TATF2mIxtB1Q= -go.mongodb.org/mongo-driver v1.15.1 h1:l+RvoUOoMXFmADTLfYDm7On9dRm7p4T80/lEQM+r7HU= -go.mongodb.org/mongo-driver v1.15.1/go.mod h1:Vzb0Mk/pa7e6cWw85R4F/endUC3u0U9jGcNU603k65c= +go.mongodb.org/mongo-driver v1.16.1 h1:rIVLL3q0IHM39dvE+z2ulZLp9ENZKThVfuvN/IiN4l8= +go.mongodb.org/mongo-driver v1.16.1/go.mod h1:oB6AhJQvFQL4LEHyXi6aJzQJtBiTQHiAd83l0GdFaiw= go.opentelemetry.io/contrib/instrumentation/net/http/otelhttp v0.47.0 h1:sv9kVfal0MK0wBMCOGr+HeJm9v803BkJxGrk2au7j08= go.opentelemetry.io/contrib/instrumentation/net/http/otelhttp v0.47.0/go.mod h1:SK2UL73Zy1quvRPonmOmRDiWk1KBV3LyIeeIxcEApWw= go.opentelemetry.io/otel v1.22.0 h1:xS7Ku+7yTFvDfDraDIJVpw7XPyuHlB9MCiqqX5mcJ6Y= @@ -388,14 +412,15 @@ golang.org/x/crypto v0.0.0-20190411191339-88737f569e3a/go.mod h1:WFFai1msRO1wXaE golang.org/x/crypto v0.0.0-20190510104115-cbcb75029529/go.mod h1:yigFU9vqHzYiE8UmvKecakEJjdnWj3jj499lnFckfCI= golang.org/x/crypto v0.0.0-20190820162420-60c769a6c586/go.mod h1:yigFU9vqHzYiE8UmvKecakEJjdnWj3jj499lnFckfCI= golang.org/x/crypto v0.0.0-20191011191535-87dc89f01550/go.mod h1:yigFU9vqHzYiE8UmvKecakEJjdnWj3jj499lnFckfCI= +golang.org/x/crypto v0.0.0-20200302210943-78000ba7a073/go.mod h1:LzIPMQfyMNhhGPhUkYOs5KpL4U8rLKemX1yGLhDgUto= golang.org/x/crypto v0.0.0-20200622213623-75b288015ac9/go.mod h1:LzIPMQfyMNhhGPhUkYOs5KpL4U8rLKemX1yGLhDgUto= golang.org/x/crypto v0.0.0-20201203163018-be400aefbc4c/go.mod h1:jdWPYTVW3xRLrWPugEBEK3UY2ZEsg3UU495nc5E+M+I= golang.org/x/crypto v0.0.0-20210616213533-5ff15b29337e/go.mod h1:GvvjBRRGRdwPK5ydBHafDWAxML/pGHZbMvKqRZ5+Abc= golang.org/x/crypto v0.0.0-20210711020723-a769d52b0f97/go.mod h1:GvvjBRRGRdwPK5ydBHafDWAxML/pGHZbMvKqRZ5+Abc= golang.org/x/crypto v0.0.0-20210921155107-089bfa567519/go.mod h1:GvvjBRRGRdwPK5ydBHafDWAxML/pGHZbMvKqRZ5+Abc= golang.org/x/crypto v0.3.0/go.mod h1:hebNnKkNXi2UzZN1eVRvBB7co0a+JxK6XbPiWVs/3J4= -golang.org/x/crypto v0.24.0 h1:mnl8DM0o513X8fdIkmyFE/5hTYxbwYOjDS/+rK6qpRI= -golang.org/x/crypto v0.24.0/go.mod h1:Z1PMYSOR5nyMcyAVAIQSKCDwalqy85Aqn1x3Ws4L5DM= +golang.org/x/crypto v0.26.0 h1:RrRspgV4mU+YwB4FYnuBoKsUapNIL5cohGAmSH3azsw= +golang.org/x/crypto v0.26.0/go.mod h1:GY7jblb9wI+FOo5y8/S2oY4zWP07AkOJ4+jxCqdqn54= golang.org/x/exp v0.0.0-20240119083558-1b970713d09a h1:Q8/wZp0KX97QFTc2ywcOE0YRjZPVIx+MXInMzdvQqcA= golang.org/x/exp v0.0.0-20240119083558-1b970713d09a/go.mod h1:idGWGoKP1toJGkd5/ig9ZLuPcZBC3ewk7SzmH0uou08= golang.org/x/lint v0.0.0-20190930215403-16217165b5de/go.mod h1:6SW0HCj/g11FgYtHlgUYUwCkIfeOF89ocIRzGO/8vkc= @@ -407,6 +432,7 @@ golang.org/x/mod v0.4.2/go.mod h1:s0Qsj1ACt9ePp/hMypM3fl4fZqREWJwdYDEqhRiZZUA= golang.org/x/mod v0.6.0-dev.0.20220419223038-86c51ed26bb4/go.mod h1:jJ57K6gSWd91VN4djpZkiMVwK6gcyfeH4XE8wZrZaV4= golang.org/x/mod v0.18.0 h1:5+9lSbEzPSdWkH32vYPBwEpX8KwDbM52Ud9xBUvNlb0= golang.org/x/mod v0.18.0/go.mod h1:hTbmBsO62+eylJbnUtE2MGJUyE7QWk4xUqPFrRgJ+7c= +golang.org/x/net v0.0.0-20180906233101-161cd47e91fd/go.mod h1:mL1N/T3taQHkDXs73rZJwtUhF3w3ftmwwsq0BUmARs4= golang.org/x/net v0.0.0-20190311183353-d8887717615a/go.mod h1:t9HGtf8HONx5eT2rtn7q6eTqICYqUVnKs3thJo3Qplg= golang.org/x/net v0.0.0-20190404232315-eb5bcb51f2a3/go.mod h1:t9HGtf8HONx5eT2rtn7q6eTqICYqUVnKs3thJo3Qplg= golang.org/x/net v0.0.0-20190620200207-3b0461eec859/go.mod h1:z5CRVTTTmAJ677TzLLGU+0bjPO0LkuOLi4/5GtJWs/s= @@ -417,18 +443,20 @@ golang.org/x/net v0.0.0-20210226172049-e18ecbb05110/go.mod h1:m0MpNAwzfU5UDzcl9v golang.org/x/net v0.0.0-20210405180319-a5a99cb37ef4/go.mod h1:p54w0d4576C0XHj96bSt6lcn1PtDYWL6XObtHCRCNQM= golang.org/x/net v0.0.0-20220722155237-a158d28d115b/go.mod h1:XRhObCWvk6IyKnWLug+ECip1KBveYUHfp+8e9klMJ9c= golang.org/x/net v0.2.0/go.mod h1:KqCZLdyyvdV855qA2rE3GC2aiw5xGR5TEjj8smXukLY= -golang.org/x/net v0.26.0 h1:soB7SVo0PWrY4vPW/+ay0jKDNScG2X9wFeYlXIvJsOQ= -golang.org/x/net v0.26.0/go.mod h1:5YKkiSynbBIh3p6iOc/vibscux0x38BZDkn8sCUPxHE= -golang.org/x/oauth2 v0.19.0 h1:9+E/EZBCbTLNrbN35fHv/a/d/mOBatymz1zbtQrXpIg= -golang.org/x/oauth2 v0.19.0/go.mod h1:vYi7skDa1x015PmRRYZ7+s1cWyPgrPiSYRe4rnsexc8= +golang.org/x/net v0.28.0 h1:a9JDOJc5GMUJ0+UDqmLT86WiEy7iWyIhz8gz8E4e5hE= +golang.org/x/net v0.28.0/go.mod h1:yqtgsTWOOnlGLG9GFRrK3++bGOUEkNBoHZc8MEDWPNg= +golang.org/x/oauth2 v0.21.0 h1:tsimM75w1tF/uws5rbeHzIWxEqElMehnc+iW793zsZs= +golang.org/x/oauth2 v0.21.0/go.mod h1:XYTD2NtWslqkgxebSiOHnXEap4TF09sJSc7H1sXbhtI= +golang.org/x/sync v0.0.0-20180314180146-1d60e4601c6f/go.mod h1:RxMgew5VJxzue5/jJTE5uejpjVlOe/izrB70Jof72aM= golang.org/x/sync v0.0.0-20190423024810-112230192c58/go.mod h1:RxMgew5VJxzue5/jJTE5uejpjVlOe/izrB70Jof72aM= golang.org/x/sync v0.0.0-20190911185100-cd5d95a43a6e/go.mod h1:RxMgew5VJxzue5/jJTE5uejpjVlOe/izrB70Jof72aM= golang.org/x/sync v0.0.0-20201020160332-67f06af15bc9/go.mod h1:RxMgew5VJxzue5/jJTE5uejpjVlOe/izrB70Jof72aM= golang.org/x/sync v0.0.0-20210220032951-036812b2e83c/go.mod h1:RxMgew5VJxzue5/jJTE5uejpjVlOe/izrB70Jof72aM= golang.org/x/sync v0.0.0-20220722155255-886fb9371eb4/go.mod h1:RxMgew5VJxzue5/jJTE5uejpjVlOe/izrB70Jof72aM= -golang.org/x/sync v0.7.0 h1:YsImfSBoP9QPYL0xyKJPq0gcaJdG3rInoqxTWbfQu9M= -golang.org/x/sync v0.7.0/go.mod h1:Czt+wKu1gCyEFDUtn0jG5QVvpJ6rzVqr5aXyt9drQfk= +golang.org/x/sync v0.8.0 h1:3NFvSEYkUoMifnESzZl15y791HH1qU2xm6eCJU5ZPXQ= +golang.org/x/sync v0.8.0/go.mod h1:Czt+wKu1gCyEFDUtn0jG5QVvpJ6rzVqr5aXyt9drQfk= golang.org/x/sys v0.0.0-20180905080454-ebe1bf3edb33/go.mod h1:STP8DvDyc/dI5b8T5hshtkjS+E42TnysNCUPdjciGhY= +golang.org/x/sys v0.0.0-20180909124046-d0be0721c37e/go.mod h1:STP8DvDyc/dI5b8T5hshtkjS+E42TnysNCUPdjciGhY= golang.org/x/sys v0.0.0-20190215142949-d0b11bdaac8a/go.mod h1:STP8DvDyc/dI5b8T5hshtkjS+E42TnysNCUPdjciGhY= golang.org/x/sys v0.0.0-20190222072716-a9d3bda3a223/go.mod h1:STP8DvDyc/dI5b8T5hshtkjS+E42TnysNCUPdjciGhY= golang.org/x/sys v0.0.0-20190403152447-81d4e9dc473e/go.mod h1:h1NjWce9XRLGQEsW7wpKNCjG9DtNlClVuFLEZdDNbEs= @@ -436,6 +464,7 @@ golang.org/x/sys v0.0.0-20190412213103-97732733099d/go.mod h1:h1NjWce9XRLGQEsW7w golang.org/x/sys v0.0.0-20190422165155-953cdadca894/go.mod h1:h1NjWce9XRLGQEsW7wpKNCjG9DtNlClVuFLEZdDNbEs= golang.org/x/sys v0.0.0-20190813064441-fde4db37ae7a/go.mod h1:h1NjWce9XRLGQEsW7wpKNCjG9DtNlClVuFLEZdDNbEs= golang.org/x/sys v0.0.0-20191026070338-33540a1f6037/go.mod h1:h1NjWce9XRLGQEsW7wpKNCjG9DtNlClVuFLEZdDNbEs= +golang.org/x/sys v0.0.0-20191120155948-bd437916bb0e/go.mod h1:h1NjWce9XRLGQEsW7wpKNCjG9DtNlClVuFLEZdDNbEs= golang.org/x/sys v0.0.0-20200116001909-b77594299b42/go.mod h1:h1NjWce9XRLGQEsW7wpKNCjG9DtNlClVuFLEZdDNbEs= golang.org/x/sys v0.0.0-20200223170610-d5e6a3e2c0ae/go.mod h1:h1NjWce9XRLGQEsW7wpKNCjG9DtNlClVuFLEZdDNbEs= golang.org/x/sys v0.0.0-20200930185726-fdedc70b468f/go.mod h1:h1NjWce9XRLGQEsW7wpKNCjG9DtNlClVuFLEZdDNbEs= @@ -449,14 +478,14 @@ golang.org/x/sys v0.0.0-20220715151400-c0bba94af5f8/go.mod h1:oPkhp1MJrh7nUepCBc golang.org/x/sys v0.0.0-20220722155257-8c9f86f7a55f/go.mod h1:oPkhp1MJrh7nUepCBck5+mAzfO9JrbApNNgaTdGDITg= golang.org/x/sys v0.2.0/go.mod h1:oPkhp1MJrh7nUepCBck5+mAzfO9JrbApNNgaTdGDITg= golang.org/x/sys v0.6.0/go.mod h1:oPkhp1MJrh7nUepCBck5+mAzfO9JrbApNNgaTdGDITg= -golang.org/x/sys v0.21.0 h1:rF+pYz3DAGSQAxAu1CbC7catZg4ebC4UIeIhKxBZvws= -golang.org/x/sys v0.21.0/go.mod h1:/VUhepiaJMQUp4+oa/7Zr1D23ma6VTLIYjOOTFZPUcA= +golang.org/x/sys v0.23.0 h1:YfKFowiIMvtgl1UERQoTPPToxltDeZfbj4H7dVUCwmM= +golang.org/x/sys v0.23.0/go.mod h1:/VUhepiaJMQUp4+oa/7Zr1D23ma6VTLIYjOOTFZPUcA= golang.org/x/term v0.0.0-20201117132131-f5c789dd3221/go.mod h1:Nr5EML6q2oocZ2LXRh80K7BxOlk5/8JxuGnuhpl+muw= golang.org/x/term v0.0.0-20201126162022-7de9c90e9dd1/go.mod h1:bj7SfCRtBDWHUb9snDiAeCFNEtKQo2Wmx5Cou7ajbmo= golang.org/x/term v0.0.0-20210927222741-03fcf44c2211/go.mod h1:jbD1KX2456YbFQfuXm/mYQcufACuNUgVhRMnK/tPxf8= golang.org/x/term v0.2.0/go.mod h1:TVmDHMZPmdnySmBfhjOoOdhjzdE1h4u1VwSiw2l1Nuc= -golang.org/x/term v0.21.0 h1:WVXCp+/EBEHOj53Rvu+7KiT/iElMrO8ACK16SMZ3jaA= -golang.org/x/term v0.21.0/go.mod h1:ooXLefLobQVslOqselCNF4SxFAaoS6KujMbsGzSDmX0= +golang.org/x/term v0.23.0 h1:F6D4vR+EHoL9/sWAWgAR1H2DcHr4PareCbAaCo1RpuU= +golang.org/x/term v0.23.0/go.mod h1:DgV24QBUrK6jhZXl+20l6UWznPlwAHm1Q1mGHtydmSk= golang.org/x/text v0.3.0/go.mod h1:NqM8EUOU14njkJ3fqMW+pc6Ldnwhi/IjpwHt7yyuwOQ= golang.org/x/text v0.3.2/go.mod h1:bEr9sfX3Q8Zfm5fL9x+3itogRgK3+ptLWKqgva+5dAk= golang.org/x/text v0.3.3/go.mod h1:5Zoc/QRtKVWzQhOtBMvqHzDpF6irO9z98xDceosuGiQ= @@ -465,8 +494,8 @@ golang.org/x/text v0.3.6/go.mod h1:5Zoc/QRtKVWzQhOtBMvqHzDpF6irO9z98xDceosuGiQ= golang.org/x/text v0.3.7/go.mod h1:u+2+/6zg+i71rQMx5EYifcz6MCKuco9NR6JIITiCfzQ= golang.org/x/text v0.3.8/go.mod h1:E6s5w1FMmriuDzIBO73fBruAKo1PCIq6d2Q6DHfQ8WQ= golang.org/x/text v0.4.0/go.mod h1:mrYo+phRRbMaCq/xk9113O4dZlRixOauAjOtrjsXDZ8= -golang.org/x/text v0.16.0 h1:a94ExnEXNtEwYLGJSIUxnWoxoRz/ZcCsV63ROupILh4= -golang.org/x/text v0.16.0/go.mod h1:GhwF1Be+LQoKShO3cGOHzqOgRrGaYc9AvblQOmPVHnI= +golang.org/x/text v0.17.0 h1:XtiM5bkSOt+ewxlOE/aE/AKEHibwj/6gvWMl9Rsh0Qc= +golang.org/x/text v0.17.0/go.mod h1:BuEKDfySbSR4drPmRPG/7iBdf8hvFMuRexcpahXilzY= golang.org/x/time v0.5.0 h1:o7cqy6amK/52YcAKIPlM3a+Fpj35zvRj2TP+e1xFSfk= golang.org/x/time v0.5.0/go.mod h1:3BpzKBy/shNhVucY/MWOyx10tF3SFh9QdLuxbVysPQM= golang.org/x/tools v0.0.0-20180917221912-90fa682c2a6e/go.mod h1:n7NCudcB/nEzxVGmLbDWY5pfWTLqBcC2KZ6jyYvM4mQ= @@ -504,21 +533,32 @@ google.golang.org/genproto/googleapis/rpc v0.0.0-20240116215550-a9fa1716bcac h1: google.golang.org/genproto/googleapis/rpc v0.0.0-20240116215550-a9fa1716bcac/go.mod h1:daQN87bsDqDoe316QbbvX60nMoJQa4r6Ds0ZuoAe5yA= google.golang.org/grpc v1.61.0 h1:TOvOcuXn30kRao+gfcvsebNEa5iZIiLkisYEkf7R7o0= google.golang.org/grpc v1.61.0/go.mod h1:VUbo7IFqmF1QtCAstipjG0GIoq49KvMe9+h1jFLBNJs= -google.golang.org/protobuf v1.34.0 h1:Qo/qEd2RZPCf2nKuorzksSknv0d3ERwp1vFG38gSmH4= -google.golang.org/protobuf v1.34.0/go.mod h1:c6P6GXX6sHbq/GpV6MGZEdwhWPcYBgnhAHhKbcUYpos= +google.golang.org/protobuf v1.34.2 h1:6xV6lTsCfpGD21XK49h7MhtcApnLqkfYgPcdHftf6hg= +google.golang.org/protobuf v1.34.2/go.mod h1:qYOHts0dSfpeUzUFpOMr/WGzszTmLH+DiWniOlNbLDw= +gopkg.in/airbrake/gobrake.v2 v2.0.9/go.mod h1:/h5ZAUhDkGaJfjzjKLSjv6zCL6O0LLBxU4K+aSYdM/U= +gopkg.in/cenkalti/backoff.v2 v2.2.1 h1:eJ9UAg01/HIHG987TwxvnzK2MgxXq97YY6rYDpY9aII= +gopkg.in/cenkalti/backoff.v2 v2.2.1/go.mod h1:S0QdOvT2AlerfSBkp0O+dk+bbIMaNbEmVk876gPCthU= gopkg.in/check.v1 v0.0.0-20161208181325-20d25e280405/go.mod h1:Co6ibVJAznAaIkqp8huTwlJQCZ016jof/cbN4VW5Yz0= gopkg.in/check.v1 v1.0.0-20180628173108-788fd7840127/go.mod h1:Co6ibVJAznAaIkqp8huTwlJQCZ016jof/cbN4VW5Yz0= +gopkg.in/check.v1 v1.0.0-20200227125254-8fa46927fb4f/go.mod h1:Co6ibVJAznAaIkqp8huTwlJQCZ016jof/cbN4VW5Yz0= gopkg.in/check.v1 v1.0.0-20201130134442-10cb98267c6c h1:Hei/4ADfdWqJk1ZMxUNpqntNwaWcugrBjAiHlqqRiVk= gopkg.in/check.v1 v1.0.0-20201130134442-10cb98267c6c/go.mod h1:JHkPIbrfpd72SG/EVd6muEfDQjcINNoR0C8j2r3qZ4Q= gopkg.in/errgo.v2 v2.1.0/go.mod h1:hNsd1EY+bozCKY1Ytp96fpM3vjJbqLJn88ws8XvfDNI= +gopkg.in/evanphx/json-patch.v4 v4.12.0 h1:n6jtcsulIzXPJaxegRbvFNNrZDjbij7ny3gmSPG+6V4= +gopkg.in/evanphx/json-patch.v4 v4.12.0/go.mod h1:p8EYWUEYMpynmqDbY58zCKCFZw8pRWMG4EsWvDvM72M= +gopkg.in/fsnotify.v1 v1.4.7/go.mod h1:Tz8NjZHkW78fSQdbUxIjBTcgA1z1m8ZHf0WmKUhAMys= +gopkg.in/gemnasium/logrus-airbrake-hook.v2 v2.1.2/go.mod h1:Xk6kEKp8OKb+X14hQBKWaSkCsqBpgog8nAV2xsGOxlo= gopkg.in/inconshreveable/log15.v2 v2.0.0-20180818164646-67afb5ed74ec/go.mod h1:aPpfJ7XW+gOuirDoZ8gHhLh3kZ1B08FtV2bbmy7Jv3s= gopkg.in/inf.v0 v0.9.1 h1:73M5CoZyi3ZLMOyDlQh031Cx6N9NDJ2Vvfl76EDAgDc= gopkg.in/inf.v0 v0.9.1/go.mod h1:cWUDdTG/fYaXco+Dcufb5Vnc6Gp2YChqWtbxRZE0mXw= gopkg.in/ini.v1 v1.67.0 h1:Dgnx+6+nfE+IfzjUEISNeydPJh9AXNNsWbGP9KzCsOA= gopkg.in/ini.v1 v1.67.0/go.mod h1:pNLf8WUiyNEtQjuu5G5vTm06TEv9tsIgeAvK8hOrP4k= +gopkg.in/rethinkdb/rethinkdb-go.v6 v6.2.2 h1:tczPZjdz6soV2thcuq1IFOuNLrBUGonFyUXBbIWXWis= +gopkg.in/rethinkdb/rethinkdb-go.v6 v6.2.2/go.mod h1:c7Wo0IjB7JL9B9Avv0UZKorYJCUhiergpj3u1WtGT1E= gopkg.in/tomb.v1 v1.0.0-20141024135613-dd632973f1e7 h1:uRGJdciOHaEIrze2W8Q3AKkepLTh2hOroT7a+7czfdQ= gopkg.in/tomb.v1 v1.0.0-20141024135613-dd632973f1e7/go.mod h1:dt/ZhP58zS4L8KSrWDmTeBkI65Dw0HsyUHuEVlX15mw= gopkg.in/yaml.v2 v2.2.2/go.mod h1:hI93XBmqTisBFMUTm0b8Fm+jr3Dg1NNxqwp+5A1VGuI= +gopkg.in/yaml.v2 v2.2.4/go.mod h1:hI93XBmqTisBFMUTm0b8Fm+jr3Dg1NNxqwp+5A1VGuI= gopkg.in/yaml.v2 v2.2.8/go.mod h1:hI93XBmqTisBFMUTm0b8Fm+jr3Dg1NNxqwp+5A1VGuI= gopkg.in/yaml.v2 v2.3.0/go.mod h1:hI93XBmqTisBFMUTm0b8Fm+jr3Dg1NNxqwp+5A1VGuI= gopkg.in/yaml.v2 v2.4.0 h1:D8xgwECY7CYvx+Y2n4sBz93Jn9JRvxdiyyo8CTfuKaY= @@ -529,18 +569,18 @@ gopkg.in/yaml.v3 v3.0.1/go.mod h1:K4uyk7z7BCEPqu6E+C64Yfv1cQ7kz7rIZviUmN+EgEM= gotest.tools/v3 v3.0.3 h1:4AuOwCGf4lLR9u3YOe2awrHygurzhO/HeQ6laiA6Sx0= gotest.tools/v3 v3.0.3/go.mod h1:Z7Lb0S5l+klDB31fvDQX8ss/FlKDxtlFlw3Oa8Ymbl8= honnef.co/go/tools v0.0.1-2019.2.3/go.mod h1:a3bituU0lyd329TUQxRnasdCoJDkEUEAqEt0JzvZhAg= -k8s.io/api v0.30.2 h1:+ZhRj+28QT4UOH+BKznu4CBgPWgkXO7XAvMcMl0qKvI= -k8s.io/api v0.30.2/go.mod h1:ULg5g9JvOev2dG0u2hig4Z7tQ2hHIuS+m8MNZ+X6EmI= -k8s.io/apimachinery v0.30.2 h1:fEMcnBj6qkzzPGSVsAZtQThU62SmQ4ZymlXRC5yFSCg= -k8s.io/apimachinery v0.30.2/go.mod h1:iexa2somDaxdnj7bha06bhb43Zpa6eWH8N8dbqVjTUc= -k8s.io/client-go v0.30.2 h1:sBIVJdojUNPDU/jObC+18tXWcTJVcwyqS9diGdWHk50= -k8s.io/client-go v0.30.2/go.mod h1:JglKSWULm9xlJLx4KCkfLLQ7XwtlbflV6uFFSHTMgVs= -k8s.io/klog/v2 v2.120.1 h1:QXU6cPEOIslTGvZaXvFWiP9VKyeet3sawzTOvdXb4Vw= -k8s.io/klog/v2 v2.120.1/go.mod h1:3Jpz1GvMt720eyJH1ckRHK1EDfpxISzJ7I9OYgaDtPE= +k8s.io/api v0.31.0 h1:b9LiSjR2ym/SzTOlfMHm1tr7/21aD7fSkqgD/CVJBCo= +k8s.io/api v0.31.0/go.mod h1:0YiFF+JfFxMM6+1hQei8FY8M7s1Mth+z/q7eF1aJkTE= +k8s.io/apimachinery v0.31.0 h1:m9jOiSr3FoSSL5WO9bjm1n6B9KROYYgNZOb4tyZ1lBc= +k8s.io/apimachinery v0.31.0/go.mod h1:rsPdaZJfTfLsNJSQzNHQvYoTmxhoOEofxtOsF3rtsMo= +k8s.io/client-go v0.31.0 h1:QqEJzNjbN2Yv1H79SsS+SWnXkBgVu4Pj3CJQgbx0gI8= +k8s.io/client-go v0.31.0/go.mod h1:Y9wvC76g4fLjmU0BA+rV+h2cncoadjvjjkkIGoTLcGU= +k8s.io/klog/v2 v2.130.1 h1:n9Xl7H1Xvksem4KFG4PYbdQCQxqc/tTUyrgXaOhHSzk= +k8s.io/klog/v2 v2.130.1/go.mod h1:3Jpz1GvMt720eyJH1ckRHK1EDfpxISzJ7I9OYgaDtPE= k8s.io/kube-openapi v0.0.0-20240228011516-70dd3763d340 h1:BZqlfIlq5YbRMFko6/PM7FjZpUb45WallggurYhKGag= k8s.io/kube-openapi v0.0.0-20240228011516-70dd3763d340/go.mod h1:yD4MZYeKMBwQKVht279WycxKyM84kkAx2DPrTXaeb98= -k8s.io/utils v0.0.0-20230726121419-3b25d923346b h1:sgn3ZU783SCgtaSJjpcVVlRqd6GSnlTLKgpAAttJvpI= -k8s.io/utils v0.0.0-20230726121419-3b25d923346b/go.mod h1:OLgZIPagt7ERELqWJFomSt595RzquPNLL48iOWgYOg0= +k8s.io/utils v0.0.0-20240711033017-18e509b52bc8 h1:pUdcCO1Lk/tbT5ztQWOBi5HBgbBP1J8+AsQnQCKsi8A= +k8s.io/utils v0.0.0-20240711033017-18e509b52bc8/go.mod h1:OLgZIPagt7ERELqWJFomSt595RzquPNLL48iOWgYOg0= layeh.com/radius v0.0.0-20190322222518-890bc1058917 h1:BDXFaFzUt5EIqe/4wrTc4AcYZWP6iC6Ult+jQWLh5eU= layeh.com/radius v0.0.0-20190322222518-890bc1058917/go.mod h1:fywZKyu//X7iRzaxLgPWsvc0L26IUpVvE/aeIL2JtIQ= sigs.k8s.io/json v0.0.0-20221116044647-bc3834ca7abd h1:EDPBXCAspyGV4jQlpZSudPeMmr1bNJefnuqLsRAsHZo= diff --git a/src/go/collectors/go.d.plugin/logger/default.go b/src/go/logger/default.go index c8bfb4d42..c8bfb4d42 100644 --- a/src/go/collectors/go.d.plugin/logger/default.go +++ b/src/go/logger/default.go diff --git a/src/go/collectors/go.d.plugin/logger/handler.go b/src/go/logger/handler.go index 40282ead6..40282ead6 100644 --- a/src/go/collectors/go.d.plugin/logger/handler.go +++ b/src/go/logger/handler.go diff --git a/src/go/logger/journal_linux.go b/src/go/logger/journal_linux.go new file mode 100644 index 000000000..00f335075 --- /dev/null +++ b/src/go/logger/journal_linux.go @@ -0,0 +1,33 @@ +// SPDX-License-Identifier: GPL-3.0-or-later + +//go:build linux + +package logger + +import ( + "os" + "strconv" + "strings" + "syscall" +) + +func isStderrConnectedToJournal() bool { + stream := os.Getenv("JOURNAL_STREAM") + if stream == "" { + return false + } + + idx := strings.IndexByte(stream, ':') + if idx <= 0 { + return false + } + + dev, ino := stream[:idx], stream[idx+1:] + + var stat syscall.Stat_t + if err := syscall.Fstat(int(os.Stderr.Fd()), &stat); err != nil { + return false + } + + return dev == strconv.Itoa(int(stat.Dev)) && ino == strconv.FormatUint(stat.Ino, 10) +} diff --git a/src/go/logger/journal_stub.go b/src/go/logger/journal_stub.go new file mode 100644 index 000000000..6726a02d8 --- /dev/null +++ b/src/go/logger/journal_stub.go @@ -0,0 +1,9 @@ +// SPDX-License-Identifier: GPL-3.0-or-later + +//go:build !linux + +package logger + +func isStderrConnectedToJournal() bool { + return false +} diff --git a/src/go/collectors/go.d.plugin/logger/level.go b/src/go/logger/level.go index 97dccb205..97dccb205 100644 --- a/src/go/collectors/go.d.plugin/logger/level.go +++ b/src/go/logger/level.go diff --git a/src/go/collectors/go.d.plugin/logger/logger.go b/src/go/logger/logger.go index bccf3f0d6..b32a00cc0 100644 --- a/src/go/collectors/go.d.plugin/logger/logger.go +++ b/src/go/logger/logger.go @@ -7,12 +7,9 @@ import ( "fmt" "log/slog" "os" - "strconv" - "strings" "sync/atomic" - "syscall" - "github.com/netdata/netdata/go/go.d.plugin/agent/executable" + "github.com/netdata/netdata/go/plugins/pkg/executable" "github.com/mattn/go-isatty" ) @@ -81,24 +78,3 @@ func (l *Logger) mute(v bool) { func (l *Logger) isNil() bool { return l == nil || l.sl == nil } var nilLogger = New() - -func isStderrConnectedToJournal() bool { - stream := os.Getenv("JOURNAL_STREAM") - if stream == "" { - return false - } - - idx := strings.IndexByte(stream, ':') - if idx <= 0 { - return false - } - - dev, ino := stream[:idx], stream[idx+1:] - - var stat syscall.Stat_t - if err := syscall.Fstat(int(os.Stderr.Fd()), &stat); err != nil { - return false - } - - return dev == strconv.Itoa(int(stat.Dev)) && ino == strconv.FormatUint(stat.Ino, 10) -} diff --git a/src/go/collectors/go.d.plugin/logger/logger_test.go b/src/go/logger/logger_test.go index df7049d0a..df7049d0a 100644 --- a/src/go/collectors/go.d.plugin/logger/logger_test.go +++ b/src/go/logger/logger_test.go diff --git a/src/go/collectors/go.d.plugin/pkg/buildinfo/version.go b/src/go/pkg/buildinfo/version.go index 55977a592..55977a592 100644 --- a/src/go/collectors/go.d.plugin/pkg/buildinfo/version.go +++ b/src/go/pkg/buildinfo/version.go diff --git a/src/go/collectors/go.d.plugin/agent/executable/executable.go b/src/go/pkg/executable/executable.go index cb09db1eb..3f4e9e0de 100644 --- a/src/go/collectors/go.d.plugin/agent/executable/executable.go +++ b/src/go/pkg/executable/executable.go @@ -16,7 +16,6 @@ var ( func init() { path, err := os.Executable() if err != nil || path == "" { - Name = "go.d" return } @@ -27,7 +26,6 @@ func init() { Name = "test" } - // FIXME: can't use logger because of circular import fi, err := os.Lstat(path) if err != nil { return diff --git a/src/go/plugin/go.d/README.md b/src/go/plugin/go.d/README.md new file mode 100644 index 000000000..28f046ab9 --- /dev/null +++ b/src/go/plugin/go.d/README.md @@ -0,0 +1,244 @@ +<!-- +title: go.d.plugin +description: "go.d.plugin is an external plugin for Netdata, responsible for running individual data collectors written in Go." +custom_edit_url: "/src/go/plugin/go.d/README.md" +sidebar_label: "go.d.plugin" +learn_status: "Published" +learn_topic_type: "Tasks" +learn_rel_path: "Developers/External plugins/go.d.plugin" +sidebar_position: 1 +--> + +# go.d.plugin + +`go.d.plugin` is a [Netdata](https://github.com/netdata/netdata) external plugin. It is an **orchestrator** for data +collection modules written in `go`. + +1. It runs as an independent process (`ps fax` shows it). +2. It is started and stopped automatically by Netdata. +3. It communicates with Netdata via a unidirectional pipe (sending data to the Netdata daemon). +4. Supports any number of data collection modules. +5. Allows each module to have any number of data collection jobs. + +## Bug reports, feature requests, and questions + +Are welcome! We are using [netdata/netdata](https://github.com/netdata/netdata/) repository for bugs, feature requests, +and questions. + +- [GitHub Issues](https://github.com/netdata/netdata/issues/new/choose): report bugs or open a new feature request. +- [GitHub Discussions](https://github.com/netdata/netdata/discussions): ask a question or suggest a new idea. + +## Install + +Go.d.plugin is shipped with Netdata. + +### Required Linux capabilities + +All capabilities are set automatically during Netdata installation using +the [official installation method](/packaging/installer/methods/kickstart.md). +No further action required. If you have used a different installation method and need to set the capabilities manually, +see the appropriate collector readme. + +| Capability | Required by | +|:--------------------|:-------------------------------------------------------------------------------------------------------:| +| CAP_NET_RAW | [Ping](https://github.com/netdata/netdata/tree/master/src/go/plugin/go.d/modules/ping#readme) | +| CAP_NET_ADMIN | [Wireguard](https://github.com/netdata/netdata/tree/master/src/go/plugin/go.d/modules/wireguard#readme) | +| CAP_DAC_READ_SEARCH | [Filecheck](https://github.com/netdata/netdata/tree/master/src/go/plugin/go.d/modules/filecheck#readme) | + +## Available modules + +| Name | Monitors | +|:-------------------------------------------------------------------------------------------------------------------|:-----------------------------:| +| [adaptec_raid](https://github.com/netdata/netdata/tree/master/src/go/plugin/go.d/modules/adaptecraid) | Adaptec Hardware RAID | +| [activemq](https://github.com/netdata/netdata/tree/master/src/go/plugin/go.d/modules/activemq) | ActiveMQ | +| [ap](https://github.com/netdata/netdata/tree/master/src/go/plugin/go.d/modules/ap) | Wireless AP | +| [apache](https://github.com/netdata/netdata/tree/master/src/go/plugin/go.d/modules/apache) | Apache | +| [beanstalk](https://github.com/netdata/netdata/tree/master/src/go/plugin/go.d/modules/beanstalk) | Beanstalk | +| [bind](https://github.com/netdata/netdata/tree/master/src/go/plugin/go.d/modules/bind) | ISC Bind | +| [cassandra](https://github.com/netdata/netdata/tree/master/src/go/plugin/go.d/modules/cassandra) | Cassandra | +| [chrony](https://github.com/netdata/netdata/tree/master/src/go/plugin/go.d/modules/chrony) | Chrony | +| [clickhouse](https://github.com/netdata/netdata/tree/master/src/go/plugin/go.d/modules/clickhouse) | ClickHouse | +| [cockroachdb](https://github.com/netdata/netdata/tree/master/src/go/plugin/go.d/modules/cockroachdb) | CockroachDB | +| [consul](https://github.com/netdata/netdata/tree/master/src/go/plugin/go.d/modules/consul) | Consul | +| [coredns](https://github.com/netdata/netdata/tree/master/src/go/plugin/go.d/modules/coredns) | CoreDNS | +| [couchbase](https://github.com/netdata/netdata/tree/master/src/go/plugin/go.d/modules/couchbase) | Couchbase | +| [couchdb](https://github.com/netdata/netdata/tree/master/src/go/plugin/go.d/modules/couchdb) | CouchDB | +| [dmcache](https://github.com/netdata/netdata/tree/master/src/go/plugin/go.d/modules/dmcache) | DMCache | +| [dnsdist](https://github.com/netdata/netdata/tree/master/src/go/plugin/go.d/modules/dnsdist) | Dnsdist | +| [dnsmasq](https://github.com/netdata/netdata/tree/master/src/go/plugin/go.d/modules/dnsmasq) | Dnsmasq DNS Forwarder | +| [dnsmasq_dhcp](https://github.com/netdata/netdata/tree/master/src/go/plugin/go.d/modules/dnsmasq_dhcp) | Dnsmasq DHCP | +| [dns_query](https://github.com/netdata/netdata/tree/master/src/go/plugin/go.d/modules/dnsquery) | DNS Query RTT | +| [docker](https://github.com/netdata/netdata/tree/master/src/go/plugin/go.d/modules/docker) | Docker Engine | +| [docker_engine](https://github.com/netdata/netdata/tree/master/src/go/plugin/go.d/modules/docker_engine) | Docker Engine | +| [dockerhub](https://github.com/netdata/netdata/tree/master/src/go/plugin/go.d/modules/dockerhub) | Docker Hub | +| [dovecot](https://github.com/netdata/netdata/tree/master/src/go/plugin/go.d/modules/dovecot) | Dovecot | +| [elasticsearch](https://github.com/netdata/netdata/tree/master/src/go/plugin/go.d/modules/elasticsearch) | Elasticsearch/OpenSearch | +| [envoy](https://github.com/netdata/netdata/tree/master/src/go/plugin/go.d/modules/envoy) | Envoy | +| [example](https://github.com/netdata/netdata/tree/master/src/go/plugin/go.d/modules/example) | - | +| [exim](https://github.com/netdata/netdata/tree/master/src/go/plugin/go.d/modules/exim) | Exim | +| [fail2ban](https://github.com/netdata/netdata/tree/master/src/go/plugin/go.d/modules/fail2ban) | Fail2Ban Jails | +| [filecheck](https://github.com/netdata/netdata/tree/master/src/go/plugin/go.d/modules/filecheck) | Files and Directories | +| [fluentd](https://github.com/netdata/netdata/tree/master/src/go/plugin/go.d/modules/fluentd) | Fluentd | +| [freeradius](https://github.com/netdata/netdata/tree/master/src/go/plugin/go.d/modules/freeradius) | FreeRADIUS | +| [gearman](https://github.com/netdata/netdata/tree/master/src/go/plugin/go.d/modules/gearman) | Gearman | +| [haproxy](https://github.com/netdata/netdata/tree/master/src/go/plugin/go.d/modules/haproxy) | HAProxy | +| [hddtemp](https://github.com/netdata/netdata/tree/master/src/go/plugin/go.d/modules/hddtemp) | Disks temperature | +| [hdfs](https://github.com/netdata/netdata/tree/master/src/go/plugin/go.d/modules/hdfs) | HDFS | +| [hpssa](https://github.com/netdata/netdata/tree/master/src/go/plugin/go.d/modules/hpssa) | HPE Smart Array | +| [httpcheck](https://github.com/netdata/netdata/tree/master/src/go/plugin/go.d/modules/httpcheck) | Any HTTP Endpoint | +| [icecast](https://github.com/netdata/netdata/tree/master/src/go/plugin/go.d/modules/icecast) | Icecast | +| [intelgpu](https://github.com/netdata/netdata/tree/master/src/go/plugin/go.d/modules/intelgpu) | Intel integrated GPU | +| [ipfs](https://github.com/netdata/netdata/tree/master/src/go/plugin/go.d/modules/ipfs) | IPFS | +| [isc_dhcpd](https://github.com/netdata/netdata/tree/master/src/go/plugin/go.d/modules/isc_dhcpd) | ISC DHCP | +| [k8s_kubelet](https://github.com/netdata/netdata/tree/master/src/go/plugin/go.d/modules/k8s_kubelet) | Kubelet | +| [k8s_kubeproxy](https://github.com/netdata/netdata/tree/master/src/go/plugin/go.d/modules/k8s_kubeproxy) | Kube-proxy | +| [k8s_state](https://github.com/netdata/netdata/tree/master/src/go/plugin/go.d/modules/k8s_state) | Kubernetes cluster state | +| [lighttpd](https://github.com/netdata/netdata/tree/master/src/go/plugin/go.d/modules/lighttpd) | Lighttpd | +| [litespeed](https://github.com/netdata/netdata/tree/master/src/go/plugin/go.d/modules/litespeed) | Litespeed | +| [logind](https://github.com/netdata/netdata/tree/master/src/go/plugin/go.d/modules/logind) | systemd-logind | +| [logstash](https://github.com/netdata/netdata/tree/master/src/go/plugin/go.d/modules/logstash) | Logstash | +| [lvm](https://github.com/netdata/netdata/tree/master/src/go/plugin/go.d/modules/lvm) | LVM logical volumes | +| [megacli](https://github.com/netdata/netdata/tree/master/src/go/plugin/go.d/modules/megacli) | MegaCli Hardware Raid | +| [memcached](https://github.com/netdata/netdata/tree/master/src/go/plugin/go.d/modules/memcached) | Memcached | +| [mongoDB](https://github.com/netdata/netdata/tree/master/src/go/plugin/go.d/modules/mongodb) | MongoDB | +| [monit](https://github.com/netdata/netdata/tree/master/src/go/plugin/go.d/modules/monit) | Monit | +| [mysql](https://github.com/netdata/netdata/tree/master/src/go/plugin/go.d/modules/mysql) | MySQL | +| [nginx](https://github.com/netdata/netdata/tree/master/src/go/plugin/go.d/modules/nginx) | NGINX | +| [nginxplus](https://github.com/netdata/netdata/tree/master/src/go/plugin/go.d/modules/nginxplus) | NGINX Plus | +| [nginxvts](https://github.com/netdata/netdata/tree/master/src/go/plugin/go.d/modules/nginxvts) | NGINX VTS | +| [nsd](https://github.com/netdata/netdata/tree/master/src/go/plugin/go.d/modules/nsd) | NSD (NLnet Labs) | +| [ntpd](https://github.com/netdata/netdata/tree/master/src/go/plugin/go.d/modules/ntpd) | NTP daemon | +| [nvme](https://github.com/netdata/netdata/tree/master/src/go/plugin/go.d/modules/nvme) | NVMe devices | +| [openvpn](https://github.com/netdata/netdata/tree/master/src/go/plugin/go.d/modules/openvpn) | OpenVPN | +| [openvpn_status_log](https://github.com/netdata/netdata/tree/master/src/go/plugin/go.d/modules/openvpn_status_log) | OpenVPN | +| [pgbouncer](https://github.com/netdata/netdata/tree/master/src/go/plugin/go.d/modules/pgbouncer) | PgBouncer | +| [phpdaemon](https://github.com/netdata/netdata/tree/master/src/go/plugin/go.d/modules/phpdaemon) | phpDaemon | +| [phpfpm](https://github.com/netdata/netdata/tree/master/src/go/plugin/go.d/modules/phpfpm) | PHP-FPM | +| [pihole](https://github.com/netdata/netdata/tree/master/src/go/plugin/go.d/modules/pihole) | Pi-hole | +| [pika](https://github.com/netdata/netdata/tree/master/src/go/plugin/go.d/modules/pika) | Pika | +| [ping](https://github.com/netdata/netdata/tree/master/src/go/plugin/go.d/modules/ping) | Any network host | +| [prometheus](https://github.com/netdata/netdata/tree/master/src/go/plugin/go.d/modules/prometheus) | Any Prometheus Endpoint | +| [portcheck](https://github.com/netdata/netdata/tree/master/src/go/plugin/go.d/modules/portcheck) | Any TCP Endpoint | +| [postgres](https://github.com/netdata/netdata/tree/master/src/go/plugin/go.d/modules/postgres) | PostgreSQL | +| [postfix](https://github.com/netdata/netdata/tree/master/src/go/plugin/go.d/modules/postfix) | Postfix | +| [powerdns](https://github.com/netdata/netdata/tree/master/src/go/plugin/go.d/modules/powerdns) | PowerDNS Authoritative Server | +| [powerdns_recursor](https://github.com/netdata/netdata/tree/master/src/go/plugin/go.d/modules/powerdns_recursor) | PowerDNS Recursor | +| [proxysql](https://github.com/netdata/netdata/tree/master/src/go/plugin/go.d/modules/proxysql) | ProxySQL | +| [pulsar](https://github.com/netdata/netdata/tree/master/src/go/plugin/go.d/modules/pulsar) | Apache Pulsar | +| [puppet](https://github.com/netdata/netdata/tree/master/src/go/plugin/go.d/modules/puppet) | Puppet | +| [rabbitmq](https://github.com/netdata/netdata/tree/master/src/go/plugin/go.d/modules/rabbitmq) | RabbitMQ | +| [redis](https://github.com/netdata/netdata/tree/master/src/go/plugin/go.d/modules/redis) | Redis | +| [rethinkdb](https://github.com/netdata/netdata/tree/master/src/go/plugin/go.d/modules/rethinkdb) | RethinkDB | +| [riakkv](https://github.com/netdata/netdata/tree/master/src/go/plugin/go.d/modules/riakkv) | Riak KV | +| [rspamd](https://github.com/netdata/netdata/tree/master/src/go/plugin/go.d/modules/rspamd) | Rspamd | +| [scaleio](https://github.com/netdata/netdata/tree/master/src/go/plugin/go.d/modules/scaleio) | Dell EMC ScaleIO | +| [sensors](https://github.com/netdata/netdata/tree/master/src/go/plugin/go.d/modules/sensors) | Hardware Sensors | +| [SNMP](https://github.com/netdata/netdata/blob/master/src/go/plugin/go.d/modules/snmp) | SNMP | +| [squid](https://github.com/netdata/netdata/tree/master/src/go/plugin/go.d/modules/squid) | Squid | +| [squidlog](https://github.com/netdata/netdata/tree/master/src/go/plugin/go.d/modules/squidlog) | Squid | +| [smartctl](https://github.com/netdata/netdata/tree/master/src/go/plugin/go.d/modules/smartctl) | S.M.A.R.T Storage Devices | +| [storcli](https://github.com/netdata/netdata/tree/master/src/go/plugin/go.d/modules/storcli) | Broadcom Hardware RAID | +| [supervisord](https://github.com/netdata/netdata/tree/master/src/go/plugin/go.d/modules/supervisord) | Supervisor | +| [systemdunits](https://github.com/netdata/netdata/tree/master/src/go/plugin/go.d/modules/systemdunits) | Systemd unit state | +| [tengine](https://github.com/netdata/netdata/tree/master/src/go/plugin/go.d/modules/tengine) | Tengine | +| [tomcat](https://github.com/netdata/netdata/tree/master/src/go/plugin/go.d/modules/tomcat) | Tomcat | +| [tor](https://github.com/netdata/netdata/tree/master/src/go/plugin/go.d/modules/tor) | Tor | +| [traefik](https://github.com/netdata/netdata/tree/master/src/go/plugin/go.d/modules/traefik) | Traefik | +| [upsd](https://github.com/netdata/netdata/tree/master/src/go/plugin/go.d/modules/upsd) | UPSd (Nut) | +| [unbound](https://github.com/netdata/netdata/tree/master/src/go/plugin/go.d/modules/unbound) | Unbound | +| [vcsa](https://github.com/netdata/netdata/tree/master/src/go/plugin/go.d/modules/vcsa) | vCenter Server Appliance | +| [vernemq](https://github.com/netdata/netdata/tree/master/src/go/plugin/go.d/modules/vernemq) | VerneMQ | +| [vsphere](https://github.com/netdata/netdata/tree/master/src/go/plugin/go.d/modules/vsphere) | VMware vCenter Server | +| [web_log](https://github.com/netdata/netdata/tree/master/src/go/plugin/go.d/modules/weblog) | Apache/NGINX | +| [wireguard](https://github.com/netdata/netdata/tree/master/src/go/plugin/go.d/modules/wireguard) | WireGuard | +| [whoisquery](https://github.com/netdata/netdata/tree/master/src/go/plugin/go.d/modules/whoisquery) | Domain Expiry | +| [windows](https://github.com/netdata/netdata/tree/master/src/go/plugin/go.d/modules/windows) | Windows | +| [x509check](https://github.com/netdata/netdata/tree/master/src/go/plugin/go.d/modules/x509check) | Digital Certificates | +| [zfspool](https://github.com/netdata/netdata/tree/master/src/go/plugin/go.d/modules/zfspool) | ZFS Pools | +| [zookeeper](https://github.com/netdata/netdata/tree/master/src/go/plugin/go.d/modules/zookeeper) | ZooKeeper | + +## Configuration + +Edit the `go.d.conf` configuration file using `edit-config` from the +Netdata [config directory](/docs/netdata-agent/configuration/README.md#the-netdata-config-directory), +which is typically at `/etc/netdata`. + +```bash +cd /etc/netdata # Replace this path with your Netdata config directory +sudo ./edit-config go.d.conf +``` + +Configurations are written in [YAML](http://yaml.org/). + +- [plugin configuration](https://github.com/netdata/netdata/blob/master/src/go/plugin/go.d/config/go.d.conf) +- [specific module configuration](https://github.com/netdata/netdata/tree/master/src/go/plugin/go.d/config/go.d) + +### Enable a collector + +To enable a collector you should edit `go.d.conf` to uncomment the collector in question and change it from `no` +to `yes`. + +For example, to enable the `example` plugin you would need to update `go.d.conf` from something like: + +```yaml +modules: +# example: no +``` + +to + +```yaml +modules: + example: yes +``` + +Then [restart netdata](/docs/netdata-agent/start-stop-restart.md) +for the change to take effect. + +## Contributing + +If you want to contribute to this project, we are humbled. Please take a look at +our [contributing guidelines](https://github.com/netdata/.github/blob/main/CONTRIBUTING.md) and don't hesitate to +contact us in our forums. + +### How to develop a collector + +Read [how to write a Netdata collector in Go](/src/go/plugin/go.d/docs/how-to-write-a-module.md). + +## Troubleshooting + +Plugin CLI: + +```sh +Usage: + orchestrator [OPTIONS] [update every] + +Application Options: + -m, --modules= module name to run (default: all) + -c, --config-dir= config dir to read + -w, --watch-path= config path to watch + -d, --debug debug mode + -v, --version display the version and exit + +Help Options: + -h, --help Show this help message +``` + +To debug specific module: + +```sh +# become user netdata +sudo su -s /bin/bash netdata + +# run plugin in debug mode +./go.d.plugin -d -m <module name> +``` + +Change `<module name>` to the [module name](#available-modules) you want to debug. + +## Netdata Community + +This repository follows the Netdata Code of Conduct and is part of the Netdata Community. + +- [Community Forums](https://community.netdata.cloud) +- [Netdata Code of Conduct](https://github.com/netdata/.github/blob/main/CODE_OF_CONDUCT.md) diff --git a/src/go/collectors/go.d.plugin/agent/README.md b/src/go/plugin/go.d/agent/README.md index ba44bfbd2..9e0654262 100644 --- a/src/go/collectors/go.d.plugin/agent/README.md +++ b/src/go/plugin/go.d/agent/README.md @@ -27,7 +27,7 @@ You are responsible only for __creating modules__. ## Custom plugin example -[Yep! So easy!](https://github.com/netdata/netdata/blob/master/src/go/collectors/go.d.plugin/examples/simple/main.go) +[Yep! So easy!](https://github.com/netdata/netdata/blob/master/src/go/plugin/go.d/examples/simple/main.go) ## How to write a Module @@ -71,7 +71,7 @@ func (b *Base) SetLogger(l *logger.Logger) { b.Logger = l } Since plugin is a set of modules all you need is: - write module(s) - - add module(s) to the plugins [registry](https://github.com/netdata/netdata/blob/master/src/go/collectors/go.d.plugin/plugin/module/registry.go) + - add module(s) to the plugins [registry](https://github.com/netdata/netdata/blob/master/src/go/plugin/go.d/plugin/module/registry.go) - start the plugin diff --git a/src/go/collectors/go.d.plugin/agent/agent.go b/src/go/plugin/go.d/agent/agent.go index caf260dc2..2423e84e0 100644 --- a/src/go/collectors/go.d.plugin/agent/agent.go +++ b/src/go/plugin/go.d/agent/agent.go @@ -12,18 +12,18 @@ import ( "syscall" "time" - "github.com/netdata/netdata/go/go.d.plugin/agent/confgroup" - "github.com/netdata/netdata/go/go.d.plugin/agent/discovery" - "github.com/netdata/netdata/go/go.d.plugin/agent/filelock" - "github.com/netdata/netdata/go/go.d.plugin/agent/filestatus" - "github.com/netdata/netdata/go/go.d.plugin/agent/functions" - "github.com/netdata/netdata/go/go.d.plugin/agent/jobmgr" - "github.com/netdata/netdata/go/go.d.plugin/agent/module" - "github.com/netdata/netdata/go/go.d.plugin/agent/netdataapi" - "github.com/netdata/netdata/go/go.d.plugin/agent/safewriter" - "github.com/netdata/netdata/go/go.d.plugin/agent/vnodes" - "github.com/netdata/netdata/go/go.d.plugin/logger" - "github.com/netdata/netdata/go/go.d.plugin/pkg/multipath" + "github.com/netdata/netdata/go/plugins/logger" + "github.com/netdata/netdata/go/plugins/plugin/go.d/agent/confgroup" + "github.com/netdata/netdata/go/plugins/plugin/go.d/agent/discovery" + "github.com/netdata/netdata/go/plugins/plugin/go.d/agent/filelock" + "github.com/netdata/netdata/go/plugins/plugin/go.d/agent/filestatus" + "github.com/netdata/netdata/go/plugins/plugin/go.d/agent/functions" + "github.com/netdata/netdata/go/plugins/plugin/go.d/agent/jobmgr" + "github.com/netdata/netdata/go/plugins/plugin/go.d/agent/module" + "github.com/netdata/netdata/go/plugins/plugin/go.d/agent/netdataapi" + "github.com/netdata/netdata/go/plugins/plugin/go.d/agent/safewriter" + "github.com/netdata/netdata/go/plugins/plugin/go.d/agent/vnodes" + "github.com/netdata/netdata/go/plugins/plugin/go.d/pkg/multipath" "github.com/mattn/go-isatty" ) diff --git a/src/go/collectors/go.d.plugin/agent/agent_test.go b/src/go/plugin/go.d/agent/agent_test.go index 749d45799..9096b9015 100644 --- a/src/go/collectors/go.d.plugin/agent/agent_test.go +++ b/src/go/plugin/go.d/agent/agent_test.go @@ -9,8 +9,8 @@ import ( "testing" "time" - "github.com/netdata/netdata/go/go.d.plugin/agent/module" - "github.com/netdata/netdata/go/go.d.plugin/agent/safewriter" + "github.com/netdata/netdata/go/plugins/plugin/go.d/agent/module" + "github.com/netdata/netdata/go/plugins/plugin/go.d/agent/safewriter" "github.com/stretchr/testify/assert" ) diff --git a/src/go/collectors/go.d.plugin/agent/confgroup/cache.go b/src/go/plugin/go.d/agent/confgroup/cache.go index 8b369e653..8b369e653 100644 --- a/src/go/collectors/go.d.plugin/agent/confgroup/cache.go +++ b/src/go/plugin/go.d/agent/confgroup/cache.go diff --git a/src/go/collectors/go.d.plugin/agent/confgroup/cache_test.go b/src/go/plugin/go.d/agent/confgroup/cache_test.go index a2bbd4919..a2bbd4919 100644 --- a/src/go/collectors/go.d.plugin/agent/confgroup/cache_test.go +++ b/src/go/plugin/go.d/agent/confgroup/cache_test.go diff --git a/src/go/collectors/go.d.plugin/agent/confgroup/config.go b/src/go/plugin/go.d/agent/confgroup/config.go index ee94b0da7..8f0523f1a 100644 --- a/src/go/collectors/go.d.plugin/agent/confgroup/config.go +++ b/src/go/plugin/go.d/agent/confgroup/config.go @@ -8,8 +8,8 @@ import ( "regexp" "strings" - "github.com/netdata/netdata/go/go.d.plugin/agent/hostinfo" - "github.com/netdata/netdata/go/go.d.plugin/agent/module" + "github.com/netdata/netdata/go/plugins/plugin/go.d/agent/hostinfo" + "github.com/netdata/netdata/go/plugins/plugin/go.d/agent/module" "github.com/ilyam8/hashstructure" "gopkg.in/yaml.v2" diff --git a/src/go/collectors/go.d.plugin/agent/confgroup/config_test.go b/src/go/plugin/go.d/agent/confgroup/config_test.go index 004202345..98c6c3e78 100644 --- a/src/go/collectors/go.d.plugin/agent/confgroup/config_test.go +++ b/src/go/plugin/go.d/agent/confgroup/config_test.go @@ -5,7 +5,7 @@ package confgroup import ( "testing" - "github.com/netdata/netdata/go/go.d.plugin/agent/module" + "github.com/netdata/netdata/go/plugins/plugin/go.d/agent/module" "github.com/stretchr/testify/assert" ) diff --git a/src/go/collectors/go.d.plugin/agent/confgroup/group.go b/src/go/plugin/go.d/agent/confgroup/group.go index b8e7bd775..b8e7bd775 100644 --- a/src/go/collectors/go.d.plugin/agent/confgroup/group.go +++ b/src/go/plugin/go.d/agent/confgroup/group.go diff --git a/src/go/collectors/go.d.plugin/agent/confgroup/registry.go b/src/go/plugin/go.d/agent/confgroup/registry.go index 295a75129..295a75129 100644 --- a/src/go/collectors/go.d.plugin/agent/confgroup/registry.go +++ b/src/go/plugin/go.d/agent/confgroup/registry.go diff --git a/src/go/collectors/go.d.plugin/agent/confgroup/registry_test.go b/src/go/plugin/go.d/agent/confgroup/registry_test.go index a63c0ceb1..a63c0ceb1 100644 --- a/src/go/collectors/go.d.plugin/agent/confgroup/registry_test.go +++ b/src/go/plugin/go.d/agent/confgroup/registry_test.go diff --git a/src/go/collectors/go.d.plugin/agent/config.go b/src/go/plugin/go.d/agent/config.go index fef68c7e0..fef68c7e0 100644 --- a/src/go/collectors/go.d.plugin/agent/config.go +++ b/src/go/plugin/go.d/agent/config.go diff --git a/src/go/collectors/go.d.plugin/agent/discovery/cache.go b/src/go/plugin/go.d/agent/discovery/cache.go index 31802aa91..032ccca38 100644 --- a/src/go/collectors/go.d.plugin/agent/discovery/cache.go +++ b/src/go/plugin/go.d/agent/discovery/cache.go @@ -3,7 +3,7 @@ package discovery import ( - "github.com/netdata/netdata/go/go.d.plugin/agent/confgroup" + "github.com/netdata/netdata/go/plugins/plugin/go.d/agent/confgroup" ) type cache map[string]*confgroup.Group // [Source] diff --git a/src/go/collectors/go.d.plugin/agent/discovery/config.go b/src/go/plugin/go.d/agent/discovery/config.go index 6cbd2db1e..258d1b830 100644 --- a/src/go/collectors/go.d.plugin/agent/discovery/config.go +++ b/src/go/plugin/go.d/agent/discovery/config.go @@ -5,10 +5,10 @@ package discovery import ( "errors" - "github.com/netdata/netdata/go/go.d.plugin/agent/confgroup" - "github.com/netdata/netdata/go/go.d.plugin/agent/discovery/dummy" - "github.com/netdata/netdata/go/go.d.plugin/agent/discovery/file" - "github.com/netdata/netdata/go/go.d.plugin/agent/discovery/sd" + "github.com/netdata/netdata/go/plugins/plugin/go.d/agent/confgroup" + "github.com/netdata/netdata/go/plugins/plugin/go.d/agent/discovery/dummy" + "github.com/netdata/netdata/go/plugins/plugin/go.d/agent/discovery/file" + "github.com/netdata/netdata/go/plugins/plugin/go.d/agent/discovery/sd" ) type Config struct { diff --git a/src/go/collectors/go.d.plugin/agent/discovery/dummy/config.go b/src/go/plugin/go.d/agent/discovery/dummy/config.go index 4da80a8dc..1e8e8f333 100644 --- a/src/go/collectors/go.d.plugin/agent/discovery/dummy/config.go +++ b/src/go/plugin/go.d/agent/discovery/dummy/config.go @@ -5,7 +5,7 @@ package dummy import ( "errors" - "github.com/netdata/netdata/go/go.d.plugin/agent/confgroup" + "github.com/netdata/netdata/go/plugins/plugin/go.d/agent/confgroup" ) type Config struct { diff --git a/src/go/collectors/go.d.plugin/agent/discovery/dummy/discovery.go b/src/go/plugin/go.d/agent/discovery/dummy/discovery.go index fed257b2f..6fad0f059 100644 --- a/src/go/collectors/go.d.plugin/agent/discovery/dummy/discovery.go +++ b/src/go/plugin/go.d/agent/discovery/dummy/discovery.go @@ -7,8 +7,8 @@ import ( "fmt" "log/slog" - "github.com/netdata/netdata/go/go.d.plugin/agent/confgroup" - "github.com/netdata/netdata/go/go.d.plugin/logger" + "github.com/netdata/netdata/go/plugins/logger" + "github.com/netdata/netdata/go/plugins/plugin/go.d/agent/confgroup" ) func NewDiscovery(cfg Config) (*Discovery, error) { diff --git a/src/go/collectors/go.d.plugin/agent/discovery/dummy/discovery_test.go b/src/go/plugin/go.d/agent/discovery/dummy/discovery_test.go index e42ee2041..2c908eb66 100644 --- a/src/go/collectors/go.d.plugin/agent/discovery/dummy/discovery_test.go +++ b/src/go/plugin/go.d/agent/discovery/dummy/discovery_test.go @@ -7,8 +7,8 @@ import ( "testing" "time" - "github.com/netdata/netdata/go/go.d.plugin/agent/confgroup" - "github.com/netdata/netdata/go/go.d.plugin/agent/module" + "github.com/netdata/netdata/go/plugins/plugin/go.d/agent/confgroup" + "github.com/netdata/netdata/go/plugins/plugin/go.d/agent/module" "github.com/stretchr/testify/assert" "github.com/stretchr/testify/require" diff --git a/src/go/collectors/go.d.plugin/agent/discovery/file/config.go b/src/go/plugin/go.d/agent/discovery/file/config.go index cc19ee445..3836d201a 100644 --- a/src/go/collectors/go.d.plugin/agent/discovery/file/config.go +++ b/src/go/plugin/go.d/agent/discovery/file/config.go @@ -5,7 +5,7 @@ package file import ( "errors" - "github.com/netdata/netdata/go/go.d.plugin/agent/confgroup" + "github.com/netdata/netdata/go/plugins/plugin/go.d/agent/confgroup" ) type Config struct { diff --git a/src/go/collectors/go.d.plugin/agent/discovery/file/discovery.go b/src/go/plugin/go.d/agent/discovery/file/discovery.go index 97b437fc3..527b1cbbc 100644 --- a/src/go/collectors/go.d.plugin/agent/discovery/file/discovery.go +++ b/src/go/plugin/go.d/agent/discovery/file/discovery.go @@ -9,8 +9,8 @@ import ( "log/slog" "sync" - "github.com/netdata/netdata/go/go.d.plugin/agent/confgroup" - "github.com/netdata/netdata/go/go.d.plugin/logger" + "github.com/netdata/netdata/go/plugins/logger" + "github.com/netdata/netdata/go/plugins/plugin/go.d/agent/confgroup" ) var log = logger.New().With( diff --git a/src/go/collectors/go.d.plugin/agent/discovery/file/discovery_test.go b/src/go/plugin/go.d/agent/discovery/file/discovery_test.go index 2bdb669eb..2bdb669eb 100644 --- a/src/go/collectors/go.d.plugin/agent/discovery/file/discovery_test.go +++ b/src/go/plugin/go.d/agent/discovery/file/discovery_test.go diff --git a/src/go/collectors/go.d.plugin/agent/discovery/file/parse.go b/src/go/plugin/go.d/agent/discovery/file/parse.go index 412d2b73e..5fd31f32a 100644 --- a/src/go/collectors/go.d.plugin/agent/discovery/file/parse.go +++ b/src/go/plugin/go.d/agent/discovery/file/parse.go @@ -7,7 +7,7 @@ import ( "os" "path/filepath" - "github.com/netdata/netdata/go/go.d.plugin/agent/confgroup" + "github.com/netdata/netdata/go/plugins/plugin/go.d/agent/confgroup" "gopkg.in/yaml.v2" ) diff --git a/src/go/collectors/go.d.plugin/agent/discovery/file/parse_test.go b/src/go/plugin/go.d/agent/discovery/file/parse_test.go index 8b20210ff..5790f5650 100644 --- a/src/go/collectors/go.d.plugin/agent/discovery/file/parse_test.go +++ b/src/go/plugin/go.d/agent/discovery/file/parse_test.go @@ -5,8 +5,8 @@ package file import ( "testing" - "github.com/netdata/netdata/go/go.d.plugin/agent/confgroup" - "github.com/netdata/netdata/go/go.d.plugin/agent/module" + "github.com/netdata/netdata/go/plugins/plugin/go.d/agent/confgroup" + "github.com/netdata/netdata/go/plugins/plugin/go.d/agent/module" "github.com/stretchr/testify/assert" "github.com/stretchr/testify/require" diff --git a/src/go/collectors/go.d.plugin/agent/discovery/file/read.go b/src/go/plugin/go.d/agent/discovery/file/read.go index 1b45b3767..3e7869ba7 100644 --- a/src/go/collectors/go.d.plugin/agent/discovery/file/read.go +++ b/src/go/plugin/go.d/agent/discovery/file/read.go @@ -9,8 +9,8 @@ import ( "path/filepath" "strings" - "github.com/netdata/netdata/go/go.d.plugin/agent/confgroup" - "github.com/netdata/netdata/go/go.d.plugin/logger" + "github.com/netdata/netdata/go/plugins/logger" + "github.com/netdata/netdata/go/plugins/plugin/go.d/agent/confgroup" ) type ( diff --git a/src/go/collectors/go.d.plugin/agent/discovery/file/read_test.go b/src/go/plugin/go.d/agent/discovery/file/read_test.go index d2404d54e..1bde06c5e 100644 --- a/src/go/collectors/go.d.plugin/agent/discovery/file/read_test.go +++ b/src/go/plugin/go.d/agent/discovery/file/read_test.go @@ -6,8 +6,8 @@ import ( "fmt" "testing" - "github.com/netdata/netdata/go/go.d.plugin/agent/confgroup" - "github.com/netdata/netdata/go/go.d.plugin/agent/module" + "github.com/netdata/netdata/go/plugins/plugin/go.d/agent/confgroup" + "github.com/netdata/netdata/go/plugins/plugin/go.d/agent/module" "github.com/stretchr/testify/assert" ) diff --git a/src/go/collectors/go.d.plugin/agent/discovery/file/sim_test.go b/src/go/plugin/go.d/agent/discovery/file/sim_test.go index cd9fa05ac..3219c6892 100644 --- a/src/go/collectors/go.d.plugin/agent/discovery/file/sim_test.go +++ b/src/go/plugin/go.d/agent/discovery/file/sim_test.go @@ -10,7 +10,7 @@ import ( "testing" "time" - "github.com/netdata/netdata/go/go.d.plugin/agent/confgroup" + "github.com/netdata/netdata/go/plugins/plugin/go.d/agent/confgroup" "github.com/stretchr/testify/assert" "github.com/stretchr/testify/require" diff --git a/src/go/collectors/go.d.plugin/agent/discovery/file/watch.go b/src/go/plugin/go.d/agent/discovery/file/watch.go index a723b706e..7adefd261 100644 --- a/src/go/collectors/go.d.plugin/agent/discovery/file/watch.go +++ b/src/go/plugin/go.d/agent/discovery/file/watch.go @@ -10,8 +10,8 @@ import ( "strings" "time" - "github.com/netdata/netdata/go/go.d.plugin/agent/confgroup" - "github.com/netdata/netdata/go/go.d.plugin/logger" + "github.com/netdata/netdata/go/plugins/logger" + "github.com/netdata/netdata/go/plugins/plugin/go.d/agent/confgroup" "github.com/fsnotify/fsnotify" ) diff --git a/src/go/collectors/go.d.plugin/agent/discovery/file/watch_test.go b/src/go/plugin/go.d/agent/discovery/file/watch_test.go index 20e21e65e..f29b5d579 100644 --- a/src/go/collectors/go.d.plugin/agent/discovery/file/watch_test.go +++ b/src/go/plugin/go.d/agent/discovery/file/watch_test.go @@ -7,8 +7,8 @@ import ( "testing" "time" - "github.com/netdata/netdata/go/go.d.plugin/agent/confgroup" - "github.com/netdata/netdata/go/go.d.plugin/agent/module" + "github.com/netdata/netdata/go/plugins/plugin/go.d/agent/confgroup" + "github.com/netdata/netdata/go/plugins/plugin/go.d/agent/module" "github.com/stretchr/testify/assert" ) diff --git a/src/go/collectors/go.d.plugin/agent/discovery/manager.go b/src/go/plugin/go.d/agent/discovery/manager.go index ac9ee2211..646616023 100644 --- a/src/go/collectors/go.d.plugin/agent/discovery/manager.go +++ b/src/go/plugin/go.d/agent/discovery/manager.go @@ -10,11 +10,11 @@ import ( "sync" "time" - "github.com/netdata/netdata/go/go.d.plugin/agent/confgroup" - "github.com/netdata/netdata/go/go.d.plugin/agent/discovery/dummy" - "github.com/netdata/netdata/go/go.d.plugin/agent/discovery/file" - "github.com/netdata/netdata/go/go.d.plugin/agent/discovery/sd" - "github.com/netdata/netdata/go/go.d.plugin/logger" + "github.com/netdata/netdata/go/plugins/logger" + "github.com/netdata/netdata/go/plugins/plugin/go.d/agent/confgroup" + "github.com/netdata/netdata/go/plugins/plugin/go.d/agent/discovery/dummy" + "github.com/netdata/netdata/go/plugins/plugin/go.d/agent/discovery/file" + "github.com/netdata/netdata/go/plugins/plugin/go.d/agent/discovery/sd" ) func NewManager(cfg Config) (*Manager, error) { diff --git a/src/go/collectors/go.d.plugin/agent/discovery/manager_test.go b/src/go/plugin/go.d/agent/discovery/manager_test.go index 665fe5611..5861b0902 100644 --- a/src/go/collectors/go.d.plugin/agent/discovery/manager_test.go +++ b/src/go/plugin/go.d/agent/discovery/manager_test.go @@ -9,8 +9,8 @@ import ( "testing" "time" - "github.com/netdata/netdata/go/go.d.plugin/agent/confgroup" - "github.com/netdata/netdata/go/go.d.plugin/agent/discovery/file" + "github.com/netdata/netdata/go/plugins/plugin/go.d/agent/confgroup" + "github.com/netdata/netdata/go/plugins/plugin/go.d/agent/discovery/file" "github.com/stretchr/testify/assert" "github.com/stretchr/testify/require" diff --git a/src/go/collectors/go.d.plugin/agent/discovery/sd/conffile.go b/src/go/plugin/go.d/agent/discovery/sd/conffile.go index 73aef1737..e08a4021b 100644 --- a/src/go/collectors/go.d.plugin/agent/discovery/sd/conffile.go +++ b/src/go/plugin/go.d/agent/discovery/sd/conffile.go @@ -6,8 +6,8 @@ import ( "context" "os" - "github.com/netdata/netdata/go/go.d.plugin/logger" - "github.com/netdata/netdata/go/go.d.plugin/pkg/multipath" + "github.com/netdata/netdata/go/plugins/logger" + "github.com/netdata/netdata/go/plugins/plugin/go.d/pkg/multipath" ) type confFile struct { diff --git a/src/go/collectors/go.d.plugin/agent/discovery/sd/discoverer/dockerd/docker.go b/src/go/plugin/go.d/agent/discovery/sd/discoverer/dockerd/docker.go index cca6b658e..1cea014a9 100644 --- a/src/go/collectors/go.d.plugin/agent/discovery/sd/discoverer/dockerd/docker.go +++ b/src/go/plugin/go.d/agent/discovery/sd/discoverer/dockerd/docker.go @@ -11,10 +11,10 @@ import ( "strings" "time" - "github.com/netdata/netdata/go/go.d.plugin/agent/discovery/sd/model" - "github.com/netdata/netdata/go/go.d.plugin/logger" - "github.com/netdata/netdata/go/go.d.plugin/pkg/dockerhost" - "github.com/netdata/netdata/go/go.d.plugin/pkg/web" + "github.com/netdata/netdata/go/plugins/logger" + "github.com/netdata/netdata/go/plugins/plugin/go.d/agent/discovery/sd/model" + "github.com/netdata/netdata/go/plugins/plugin/go.d/pkg/dockerhost" + "github.com/netdata/netdata/go/plugins/plugin/go.d/pkg/web" "github.com/docker/docker/api/types" typesContainer "github.com/docker/docker/api/types/container" diff --git a/src/go/collectors/go.d.plugin/agent/discovery/sd/discoverer/dockerd/dockerd_test.go b/src/go/plugin/go.d/agent/discovery/sd/discoverer/dockerd/dockerd_test.go index d325f99dd..630afb0f5 100644 --- a/src/go/collectors/go.d.plugin/agent/discovery/sd/discoverer/dockerd/dockerd_test.go +++ b/src/go/plugin/go.d/agent/discovery/sd/discoverer/dockerd/dockerd_test.go @@ -6,7 +6,7 @@ import ( "testing" "time" - "github.com/netdata/netdata/go/go.d.plugin/agent/discovery/sd/model" + "github.com/netdata/netdata/go/plugins/plugin/go.d/agent/discovery/sd/model" "github.com/docker/docker/api/types" typesNetwork "github.com/docker/docker/api/types/network" diff --git a/src/go/collectors/go.d.plugin/agent/discovery/sd/discoverer/dockerd/sim_test.go b/src/go/plugin/go.d/agent/discovery/sd/discoverer/dockerd/sim_test.go index 7b0b76aba..fcdbeb894 100644 --- a/src/go/collectors/go.d.plugin/agent/discovery/sd/discoverer/dockerd/sim_test.go +++ b/src/go/plugin/go.d/agent/discovery/sd/discoverer/dockerd/sim_test.go @@ -9,7 +9,7 @@ import ( "testing" "time" - "github.com/netdata/netdata/go/go.d.plugin/agent/discovery/sd/model" + "github.com/netdata/netdata/go/plugins/plugin/go.d/agent/discovery/sd/model" "github.com/docker/docker/api/types" typesContainer "github.com/docker/docker/api/types/container" diff --git a/src/go/collectors/go.d.plugin/agent/discovery/sd/discoverer/dockerd/target.go b/src/go/plugin/go.d/agent/discovery/sd/discoverer/dockerd/target.go index 2422bc98e..2cf0575b5 100644 --- a/src/go/collectors/go.d.plugin/agent/discovery/sd/discoverer/dockerd/target.go +++ b/src/go/plugin/go.d/agent/discovery/sd/discoverer/dockerd/target.go @@ -5,7 +5,7 @@ package dockerd import ( "fmt" - "github.com/netdata/netdata/go/go.d.plugin/agent/discovery/sd/model" + "github.com/netdata/netdata/go/plugins/plugin/go.d/agent/discovery/sd/model" ) type targetGroup struct { diff --git a/src/go/collectors/go.d.plugin/agent/discovery/sd/discoverer/kubernetes/config.go b/src/go/plugin/go.d/agent/discovery/sd/discoverer/kubernetes/config.go index 15a1e4745..15a1e4745 100644 --- a/src/go/collectors/go.d.plugin/agent/discovery/sd/discoverer/kubernetes/config.go +++ b/src/go/plugin/go.d/agent/discovery/sd/discoverer/kubernetes/config.go diff --git a/src/go/collectors/go.d.plugin/agent/discovery/sd/discoverer/kubernetes/kubernetes.go b/src/go/plugin/go.d/agent/discovery/sd/discoverer/kubernetes/kubernetes.go index aa153a34a..439e2b695 100644 --- a/src/go/collectors/go.d.plugin/agent/discovery/sd/discoverer/kubernetes/kubernetes.go +++ b/src/go/plugin/go.d/agent/discovery/sd/discoverer/kubernetes/kubernetes.go @@ -11,9 +11,9 @@ import ( "sync" "time" - "github.com/netdata/netdata/go/go.d.plugin/agent/discovery/sd/model" - "github.com/netdata/netdata/go/go.d.plugin/logger" - "github.com/netdata/netdata/go/go.d.plugin/pkg/k8sclient" + "github.com/netdata/netdata/go/plugins/logger" + "github.com/netdata/netdata/go/plugins/plugin/go.d/agent/discovery/sd/model" + "github.com/netdata/netdata/go/plugins/plugin/go.d/pkg/k8sclient" "github.com/ilyam8/hashstructure" corev1 "k8s.io/api/core/v1" diff --git a/src/go/collectors/go.d.plugin/agent/discovery/sd/discoverer/kubernetes/kubernetes_test.go b/src/go/plugin/go.d/agent/discovery/sd/discoverer/kubernetes/kubernetes_test.go index 9743a0af5..ba60a47b4 100644 --- a/src/go/collectors/go.d.plugin/agent/discovery/sd/discoverer/kubernetes/kubernetes_test.go +++ b/src/go/plugin/go.d/agent/discovery/sd/discoverer/kubernetes/kubernetes_test.go @@ -7,8 +7,8 @@ import ( "os" "testing" - "github.com/netdata/netdata/go/go.d.plugin/agent/discovery/sd/model" - "github.com/netdata/netdata/go/go.d.plugin/pkg/k8sclient" + "github.com/netdata/netdata/go/plugins/plugin/go.d/agent/discovery/sd/model" + "github.com/netdata/netdata/go/plugins/plugin/go.d/pkg/k8sclient" "github.com/stretchr/testify/assert" corev1 "k8s.io/api/core/v1" diff --git a/src/go/collectors/go.d.plugin/agent/discovery/sd/discoverer/kubernetes/pod.go b/src/go/plugin/go.d/agent/discovery/sd/discoverer/kubernetes/pod.go index a271e7285..617081742 100644 --- a/src/go/collectors/go.d.plugin/agent/discovery/sd/discoverer/kubernetes/pod.go +++ b/src/go/plugin/go.d/agent/discovery/sd/discoverer/kubernetes/pod.go @@ -9,8 +9,8 @@ import ( "strconv" "strings" - "github.com/netdata/netdata/go/go.d.plugin/agent/discovery/sd/model" - "github.com/netdata/netdata/go/go.d.plugin/logger" + "github.com/netdata/netdata/go/plugins/logger" + "github.com/netdata/netdata/go/plugins/plugin/go.d/agent/discovery/sd/model" corev1 "k8s.io/api/core/v1" "k8s.io/client-go/tools/cache" diff --git a/src/go/collectors/go.d.plugin/agent/discovery/sd/discoverer/kubernetes/pod_test.go b/src/go/plugin/go.d/agent/discovery/sd/discoverer/kubernetes/pod_test.go index ebe92d2f6..838c2413f 100644 --- a/src/go/collectors/go.d.plugin/agent/discovery/sd/discoverer/kubernetes/pod_test.go +++ b/src/go/plugin/go.d/agent/discovery/sd/discoverer/kubernetes/pod_test.go @@ -9,7 +9,7 @@ import ( "testing" "time" - "github.com/netdata/netdata/go/go.d.plugin/agent/discovery/sd/model" + "github.com/netdata/netdata/go/plugins/plugin/go.d/agent/discovery/sd/model" "github.com/stretchr/testify/assert" corev1 "k8s.io/api/core/v1" diff --git a/src/go/collectors/go.d.plugin/agent/discovery/sd/discoverer/kubernetes/service.go b/src/go/plugin/go.d/agent/discovery/sd/discoverer/kubernetes/service.go index 4cfdd62f1..1d5ae7cd5 100644 --- a/src/go/collectors/go.d.plugin/agent/discovery/sd/discoverer/kubernetes/service.go +++ b/src/go/plugin/go.d/agent/discovery/sd/discoverer/kubernetes/service.go @@ -9,8 +9,8 @@ import ( "strconv" "strings" - "github.com/netdata/netdata/go/go.d.plugin/agent/discovery/sd/model" - "github.com/netdata/netdata/go/go.d.plugin/logger" + "github.com/netdata/netdata/go/plugins/logger" + "github.com/netdata/netdata/go/plugins/plugin/go.d/agent/discovery/sd/model" corev1 "k8s.io/api/core/v1" "k8s.io/client-go/tools/cache" diff --git a/src/go/collectors/go.d.plugin/agent/discovery/sd/discoverer/kubernetes/service_test.go b/src/go/plugin/go.d/agent/discovery/sd/discoverer/kubernetes/service_test.go index d2e496015..c3e83e202 100644 --- a/src/go/collectors/go.d.plugin/agent/discovery/sd/discoverer/kubernetes/service_test.go +++ b/src/go/plugin/go.d/agent/discovery/sd/discoverer/kubernetes/service_test.go @@ -9,7 +9,7 @@ import ( "testing" "time" - "github.com/netdata/netdata/go/go.d.plugin/agent/discovery/sd/model" + "github.com/netdata/netdata/go/plugins/plugin/go.d/agent/discovery/sd/model" "github.com/stretchr/testify/assert" corev1 "k8s.io/api/core/v1" diff --git a/src/go/collectors/go.d.plugin/agent/discovery/sd/discoverer/kubernetes/sim_test.go b/src/go/plugin/go.d/agent/discovery/sd/discoverer/kubernetes/sim_test.go index db986b855..99bdfae54 100644 --- a/src/go/collectors/go.d.plugin/agent/discovery/sd/discoverer/kubernetes/sim_test.go +++ b/src/go/plugin/go.d/agent/discovery/sd/discoverer/kubernetes/sim_test.go @@ -8,7 +8,7 @@ import ( "testing" "time" - "github.com/netdata/netdata/go/go.d.plugin/agent/discovery/sd/model" + "github.com/netdata/netdata/go/plugins/plugin/go.d/agent/discovery/sd/model" "github.com/stretchr/testify/assert" "github.com/stretchr/testify/require" diff --git a/src/go/collectors/go.d.plugin/agent/discovery/sd/discoverer/netlisteners/netlisteners.go b/src/go/plugin/go.d/agent/discovery/sd/discoverer/netlisteners/netlisteners.go index bfd7a99b8..6f536c49e 100644 --- a/src/go/collectors/go.d.plugin/agent/discovery/sd/discoverer/netlisteners/netlisteners.go +++ b/src/go/plugin/go.d/agent/discovery/sd/discoverer/netlisteners/netlisteners.go @@ -18,9 +18,9 @@ import ( "strings" "time" - "github.com/netdata/netdata/go/go.d.plugin/agent/discovery/sd/model" - "github.com/netdata/netdata/go/go.d.plugin/agent/executable" - "github.com/netdata/netdata/go/go.d.plugin/logger" + "github.com/netdata/netdata/go/plugins/logger" + "github.com/netdata/netdata/go/plugins/pkg/executable" + "github.com/netdata/netdata/go/plugins/plugin/go.d/agent/discovery/sd/model" "github.com/ilyam8/hashstructure" ) diff --git a/src/go/collectors/go.d.plugin/agent/discovery/sd/discoverer/netlisteners/netlisteners_test.go b/src/go/plugin/go.d/agent/discovery/sd/discoverer/netlisteners/netlisteners_test.go index a94879f09..9b3cae801 100644 --- a/src/go/collectors/go.d.plugin/agent/discovery/sd/discoverer/netlisteners/netlisteners_test.go +++ b/src/go/plugin/go.d/agent/discovery/sd/discoverer/netlisteners/netlisteners_test.go @@ -6,7 +6,7 @@ import ( "testing" "time" - "github.com/netdata/netdata/go/go.d.plugin/agent/discovery/sd/model" + "github.com/netdata/netdata/go/plugins/plugin/go.d/agent/discovery/sd/model" ) func TestDiscoverer_Discover(t *testing.T) { diff --git a/src/go/collectors/go.d.plugin/agent/discovery/sd/discoverer/netlisteners/sim_test.go b/src/go/plugin/go.d/agent/discovery/sd/discoverer/netlisteners/sim_test.go index ad90f8278..4cb65832d 100644 --- a/src/go/collectors/go.d.plugin/agent/discovery/sd/discoverer/netlisteners/sim_test.go +++ b/src/go/plugin/go.d/agent/discovery/sd/discoverer/netlisteners/sim_test.go @@ -12,7 +12,7 @@ import ( "testing" "time" - "github.com/netdata/netdata/go/go.d.plugin/agent/discovery/sd/model" + "github.com/netdata/netdata/go/plugins/plugin/go.d/agent/discovery/sd/model" "github.com/stretchr/testify/assert" "github.com/stretchr/testify/require" diff --git a/src/go/collectors/go.d.plugin/agent/discovery/sd/discoverer/netlisteners/target.go b/src/go/plugin/go.d/agent/discovery/sd/discoverer/netlisteners/target.go index a36620f32..9d57d3cc7 100644 --- a/src/go/collectors/go.d.plugin/agent/discovery/sd/discoverer/netlisteners/target.go +++ b/src/go/plugin/go.d/agent/discovery/sd/discoverer/netlisteners/target.go @@ -6,7 +6,7 @@ import ( "fmt" "strings" - "github.com/netdata/netdata/go/go.d.plugin/agent/discovery/sd/model" + "github.com/netdata/netdata/go/plugins/plugin/go.d/agent/discovery/sd/model" ) type targetGroup struct { diff --git a/src/go/collectors/go.d.plugin/agent/discovery/sd/model/discoverer.go b/src/go/plugin/go.d/agent/discovery/sd/model/discoverer.go index 301322d32..301322d32 100644 --- a/src/go/collectors/go.d.plugin/agent/discovery/sd/model/discoverer.go +++ b/src/go/plugin/go.d/agent/discovery/sd/model/discoverer.go diff --git a/src/go/collectors/go.d.plugin/agent/discovery/sd/model/tags.go b/src/go/plugin/go.d/agent/discovery/sd/model/tags.go index 22517d77e..22517d77e 100644 --- a/src/go/collectors/go.d.plugin/agent/discovery/sd/model/tags.go +++ b/src/go/plugin/go.d/agent/discovery/sd/model/tags.go diff --git a/src/go/collectors/go.d.plugin/agent/discovery/sd/model/tags_test.go b/src/go/plugin/go.d/agent/discovery/sd/model/tags_test.go index 4f07bcbf6..4f07bcbf6 100644 --- a/src/go/collectors/go.d.plugin/agent/discovery/sd/model/tags_test.go +++ b/src/go/plugin/go.d/agent/discovery/sd/model/tags_test.go diff --git a/src/go/collectors/go.d.plugin/agent/discovery/sd/model/target.go b/src/go/plugin/go.d/agent/discovery/sd/model/target.go index eb2bd9d51..eb2bd9d51 100644 --- a/src/go/collectors/go.d.plugin/agent/discovery/sd/model/target.go +++ b/src/go/plugin/go.d/agent/discovery/sd/model/target.go diff --git a/src/go/collectors/go.d.plugin/agent/discovery/sd/pipeline/accumulator.go b/src/go/plugin/go.d/agent/discovery/sd/pipeline/accumulator.go index a84212734..60c901492 100644 --- a/src/go/collectors/go.d.plugin/agent/discovery/sd/pipeline/accumulator.go +++ b/src/go/plugin/go.d/agent/discovery/sd/pipeline/accumulator.go @@ -7,8 +7,8 @@ import ( "sync" "time" - "github.com/netdata/netdata/go/go.d.plugin/agent/discovery/sd/model" - "github.com/netdata/netdata/go/go.d.plugin/logger" + "github.com/netdata/netdata/go/plugins/logger" + "github.com/netdata/netdata/go/plugins/plugin/go.d/agent/discovery/sd/model" ) func newAccumulator() *accumulator { diff --git a/src/go/collectors/go.d.plugin/agent/discovery/sd/pipeline/classify.go b/src/go/plugin/go.d/agent/discovery/sd/pipeline/classify.go index bd686b306..a7490d2e0 100644 --- a/src/go/collectors/go.d.plugin/agent/discovery/sd/pipeline/classify.go +++ b/src/go/plugin/go.d/agent/discovery/sd/pipeline/classify.go @@ -8,8 +8,8 @@ import ( "strings" "text/template" - "github.com/netdata/netdata/go/go.d.plugin/agent/discovery/sd/model" - "github.com/netdata/netdata/go/go.d.plugin/logger" + "github.com/netdata/netdata/go/plugins/logger" + "github.com/netdata/netdata/go/plugins/plugin/go.d/agent/discovery/sd/model" ) func newTargetClassificator(cfg []ClassifyRuleConfig) (*targetClassificator, error) { diff --git a/src/go/collectors/go.d.plugin/agent/discovery/sd/pipeline/classify_test.go b/src/go/plugin/go.d/agent/discovery/sd/pipeline/classify_test.go index 214c96cf7..606e3411c 100644 --- a/src/go/collectors/go.d.plugin/agent/discovery/sd/pipeline/classify_test.go +++ b/src/go/plugin/go.d/agent/discovery/sd/pipeline/classify_test.go @@ -5,7 +5,7 @@ package pipeline import ( "testing" - "github.com/netdata/netdata/go/go.d.plugin/agent/discovery/sd/model" + "github.com/netdata/netdata/go/plugins/plugin/go.d/agent/discovery/sd/model" "github.com/stretchr/testify/assert" "github.com/stretchr/testify/require" diff --git a/src/go/collectors/go.d.plugin/agent/discovery/sd/pipeline/compose.go b/src/go/plugin/go.d/agent/discovery/sd/pipeline/compose.go index de2ed21b8..80830fd6d 100644 --- a/src/go/collectors/go.d.plugin/agent/discovery/sd/pipeline/compose.go +++ b/src/go/plugin/go.d/agent/discovery/sd/pipeline/compose.go @@ -8,9 +8,9 @@ import ( "fmt" "text/template" - "github.com/netdata/netdata/go/go.d.plugin/agent/confgroup" - "github.com/netdata/netdata/go/go.d.plugin/agent/discovery/sd/model" - "github.com/netdata/netdata/go/go.d.plugin/logger" + "github.com/netdata/netdata/go/plugins/logger" + "github.com/netdata/netdata/go/plugins/plugin/go.d/agent/confgroup" + "github.com/netdata/netdata/go/plugins/plugin/go.d/agent/discovery/sd/model" "gopkg.in/yaml.v2" ) diff --git a/src/go/collectors/go.d.plugin/agent/discovery/sd/pipeline/compose_test.go b/src/go/plugin/go.d/agent/discovery/sd/pipeline/compose_test.go index fa758bcd3..1c56bf086 100644 --- a/src/go/collectors/go.d.plugin/agent/discovery/sd/pipeline/compose_test.go +++ b/src/go/plugin/go.d/agent/discovery/sd/pipeline/compose_test.go @@ -5,8 +5,8 @@ package pipeline import ( "testing" - "github.com/netdata/netdata/go/go.d.plugin/agent/confgroup" - "github.com/netdata/netdata/go/go.d.plugin/agent/discovery/sd/model" + "github.com/netdata/netdata/go/plugins/plugin/go.d/agent/confgroup" + "github.com/netdata/netdata/go/plugins/plugin/go.d/agent/discovery/sd/model" "github.com/stretchr/testify/assert" "github.com/stretchr/testify/require" diff --git a/src/go/collectors/go.d.plugin/agent/discovery/sd/pipeline/config.go b/src/go/plugin/go.d/agent/discovery/sd/pipeline/config.go index 4dac63f0f..9df7ec59d 100644 --- a/src/go/collectors/go.d.plugin/agent/discovery/sd/pipeline/config.go +++ b/src/go/plugin/go.d/agent/discovery/sd/pipeline/config.go @@ -6,10 +6,10 @@ import ( "errors" "fmt" - "github.com/netdata/netdata/go/go.d.plugin/agent/confgroup" - "github.com/netdata/netdata/go/go.d.plugin/agent/discovery/sd/discoverer/dockerd" - "github.com/netdata/netdata/go/go.d.plugin/agent/discovery/sd/discoverer/kubernetes" - "github.com/netdata/netdata/go/go.d.plugin/agent/discovery/sd/discoverer/netlisteners" + "github.com/netdata/netdata/go/plugins/plugin/go.d/agent/confgroup" + "github.com/netdata/netdata/go/plugins/plugin/go.d/agent/discovery/sd/discoverer/dockerd" + "github.com/netdata/netdata/go/plugins/plugin/go.d/agent/discovery/sd/discoverer/kubernetes" + "github.com/netdata/netdata/go/plugins/plugin/go.d/agent/discovery/sd/discoverer/netlisteners" ) type Config struct { diff --git a/src/go/collectors/go.d.plugin/agent/discovery/sd/pipeline/funcmap.go b/src/go/plugin/go.d/agent/discovery/sd/pipeline/funcmap.go index 8a9698b65..5ed188a54 100644 --- a/src/go/collectors/go.d.plugin/agent/discovery/sd/pipeline/funcmap.go +++ b/src/go/plugin/go.d/agent/discovery/sd/pipeline/funcmap.go @@ -7,7 +7,7 @@ import ( "strconv" "text/template" - "github.com/netdata/netdata/go/go.d.plugin/pkg/matcher" + "github.com/netdata/netdata/go/plugins/plugin/go.d/pkg/matcher" "github.com/Masterminds/sprig/v3" "github.com/bmatcuk/doublestar/v4" diff --git a/src/go/collectors/go.d.plugin/agent/discovery/sd/pipeline/funcmap_test.go b/src/go/plugin/go.d/agent/discovery/sd/pipeline/funcmap_test.go index 3de71ef70..3de71ef70 100644 --- a/src/go/collectors/go.d.plugin/agent/discovery/sd/pipeline/funcmap_test.go +++ b/src/go/plugin/go.d/agent/discovery/sd/pipeline/funcmap_test.go diff --git a/src/go/collectors/go.d.plugin/agent/discovery/sd/pipeline/pipeline.go b/src/go/plugin/go.d/agent/discovery/sd/pipeline/pipeline.go index f69501c39..4d391d41e 100644 --- a/src/go/collectors/go.d.plugin/agent/discovery/sd/pipeline/pipeline.go +++ b/src/go/plugin/go.d/agent/discovery/sd/pipeline/pipeline.go @@ -9,13 +9,13 @@ import ( "log/slog" "time" - "github.com/netdata/netdata/go/go.d.plugin/agent/confgroup" - "github.com/netdata/netdata/go/go.d.plugin/agent/discovery/sd/discoverer/dockerd" - "github.com/netdata/netdata/go/go.d.plugin/agent/discovery/sd/discoverer/kubernetes" - "github.com/netdata/netdata/go/go.d.plugin/agent/discovery/sd/discoverer/netlisteners" - "github.com/netdata/netdata/go/go.d.plugin/agent/discovery/sd/model" - "github.com/netdata/netdata/go/go.d.plugin/agent/hostinfo" - "github.com/netdata/netdata/go/go.d.plugin/logger" + "github.com/netdata/netdata/go/plugins/logger" + "github.com/netdata/netdata/go/plugins/plugin/go.d/agent/confgroup" + "github.com/netdata/netdata/go/plugins/plugin/go.d/agent/discovery/sd/discoverer/dockerd" + "github.com/netdata/netdata/go/plugins/plugin/go.d/agent/discovery/sd/discoverer/kubernetes" + "github.com/netdata/netdata/go/plugins/plugin/go.d/agent/discovery/sd/discoverer/netlisteners" + "github.com/netdata/netdata/go/plugins/plugin/go.d/agent/discovery/sd/model" + "github.com/netdata/netdata/go/plugins/plugin/go.d/agent/hostinfo" ) func New(cfg Config) (*Pipeline, error) { diff --git a/src/go/collectors/go.d.plugin/agent/discovery/sd/pipeline/pipeline_test.go b/src/go/plugin/go.d/agent/discovery/sd/pipeline/pipeline_test.go index 2dd53cf10..e67b6d7ce 100644 --- a/src/go/collectors/go.d.plugin/agent/discovery/sd/pipeline/pipeline_test.go +++ b/src/go/plugin/go.d/agent/discovery/sd/pipeline/pipeline_test.go @@ -11,8 +11,8 @@ import ( "testing" "time" - "github.com/netdata/netdata/go/go.d.plugin/agent/confgroup" - "github.com/netdata/netdata/go/go.d.plugin/agent/discovery/sd/model" + "github.com/netdata/netdata/go/plugins/plugin/go.d/agent/confgroup" + "github.com/netdata/netdata/go/plugins/plugin/go.d/agent/discovery/sd/model" "github.com/ilyam8/hashstructure" "github.com/stretchr/testify/assert" diff --git a/src/go/collectors/go.d.plugin/agent/discovery/sd/pipeline/promport.go b/src/go/plugin/go.d/agent/discovery/sd/pipeline/promport.go index 646e1abb1..646e1abb1 100644 --- a/src/go/collectors/go.d.plugin/agent/discovery/sd/pipeline/promport.go +++ b/src/go/plugin/go.d/agent/discovery/sd/pipeline/promport.go diff --git a/src/go/collectors/go.d.plugin/agent/discovery/sd/pipeline/selector.go b/src/go/plugin/go.d/agent/discovery/sd/pipeline/selector.go index 8bb5fb061..cdd2cf000 100644 --- a/src/go/collectors/go.d.plugin/agent/discovery/sd/pipeline/selector.go +++ b/src/go/plugin/go.d/agent/discovery/sd/pipeline/selector.go @@ -7,7 +7,7 @@ import ( "fmt" "strings" - "github.com/netdata/netdata/go/go.d.plugin/agent/discovery/sd/model" + "github.com/netdata/netdata/go/plugins/plugin/go.d/agent/discovery/sd/model" ) type selector interface { diff --git a/src/go/collectors/go.d.plugin/agent/discovery/sd/pipeline/selector_test.go b/src/go/plugin/go.d/agent/discovery/sd/pipeline/selector_test.go index a4fcf3041..bed2150e2 100644 --- a/src/go/collectors/go.d.plugin/agent/discovery/sd/pipeline/selector_test.go +++ b/src/go/plugin/go.d/agent/discovery/sd/pipeline/selector_test.go @@ -6,7 +6,7 @@ import ( "regexp" "testing" - "github.com/netdata/netdata/go/go.d.plugin/agent/discovery/sd/model" + "github.com/netdata/netdata/go/plugins/plugin/go.d/agent/discovery/sd/model" "github.com/stretchr/testify/assert" ) diff --git a/src/go/collectors/go.d.plugin/agent/discovery/sd/pipeline/sim_test.go b/src/go/plugin/go.d/agent/discovery/sd/pipeline/sim_test.go index 23a120751..657009478 100644 --- a/src/go/collectors/go.d.plugin/agent/discovery/sd/pipeline/sim_test.go +++ b/src/go/plugin/go.d/agent/discovery/sd/pipeline/sim_test.go @@ -8,9 +8,9 @@ import ( "testing" "time" - "github.com/netdata/netdata/go/go.d.plugin/agent/confgroup" - "github.com/netdata/netdata/go/go.d.plugin/agent/discovery/sd/model" - "github.com/netdata/netdata/go/go.d.plugin/logger" + "github.com/netdata/netdata/go/plugins/logger" + "github.com/netdata/netdata/go/plugins/plugin/go.d/agent/confgroup" + "github.com/netdata/netdata/go/plugins/plugin/go.d/agent/discovery/sd/model" "github.com/stretchr/testify/assert" "github.com/stretchr/testify/require" diff --git a/src/go/collectors/go.d.plugin/agent/discovery/sd/sd.go b/src/go/plugin/go.d/agent/discovery/sd/sd.go index ab84c979e..687ebfba8 100644 --- a/src/go/collectors/go.d.plugin/agent/discovery/sd/sd.go +++ b/src/go/plugin/go.d/agent/discovery/sd/sd.go @@ -8,10 +8,10 @@ import ( "log/slog" "sync" - "github.com/netdata/netdata/go/go.d.plugin/agent/confgroup" - "github.com/netdata/netdata/go/go.d.plugin/agent/discovery/sd/pipeline" - "github.com/netdata/netdata/go/go.d.plugin/logger" - "github.com/netdata/netdata/go/go.d.plugin/pkg/multipath" + "github.com/netdata/netdata/go/plugins/logger" + "github.com/netdata/netdata/go/plugins/plugin/go.d/agent/confgroup" + "github.com/netdata/netdata/go/plugins/plugin/go.d/agent/discovery/sd/pipeline" + "github.com/netdata/netdata/go/plugins/plugin/go.d/pkg/multipath" "gopkg.in/yaml.v2" ) diff --git a/src/go/collectors/go.d.plugin/agent/discovery/sd/sd_test.go b/src/go/plugin/go.d/agent/discovery/sd/sd_test.go index 376c9f7e7..4269bfd3a 100644 --- a/src/go/collectors/go.d.plugin/agent/discovery/sd/sd_test.go +++ b/src/go/plugin/go.d/agent/discovery/sd/sd_test.go @@ -5,7 +5,7 @@ package sd import ( "testing" - "github.com/netdata/netdata/go/go.d.plugin/agent/discovery/sd/pipeline" + "github.com/netdata/netdata/go/plugins/plugin/go.d/agent/discovery/sd/pipeline" "gopkg.in/yaml.v2" ) diff --git a/src/go/collectors/go.d.plugin/agent/discovery/sd/sim_test.go b/src/go/plugin/go.d/agent/discovery/sd/sim_test.go index 7741221d1..930c40125 100644 --- a/src/go/collectors/go.d.plugin/agent/discovery/sd/sim_test.go +++ b/src/go/plugin/go.d/agent/discovery/sd/sim_test.go @@ -9,9 +9,9 @@ import ( "testing" "time" - "github.com/netdata/netdata/go/go.d.plugin/agent/confgroup" - "github.com/netdata/netdata/go/go.d.plugin/agent/discovery/sd/pipeline" - "github.com/netdata/netdata/go/go.d.plugin/logger" + "github.com/netdata/netdata/go/plugins/logger" + "github.com/netdata/netdata/go/plugins/plugin/go.d/agent/confgroup" + "github.com/netdata/netdata/go/plugins/plugin/go.d/agent/discovery/sd/pipeline" "github.com/stretchr/testify/assert" ) diff --git a/src/go/collectors/go.d.plugin/agent/discovery/sim_test.go b/src/go/plugin/go.d/agent/discovery/sim_test.go index 0b777f392..b20344c3c 100644 --- a/src/go/collectors/go.d.plugin/agent/discovery/sim_test.go +++ b/src/go/plugin/go.d/agent/discovery/sim_test.go @@ -8,7 +8,7 @@ import ( "testing" "time" - "github.com/netdata/netdata/go/go.d.plugin/agent/confgroup" + "github.com/netdata/netdata/go/plugins/plugin/go.d/agent/confgroup" "github.com/stretchr/testify/assert" "github.com/stretchr/testify/require" ) diff --git a/src/go/collectors/go.d.plugin/agent/filelock/filelock.go b/src/go/plugin/go.d/agent/filelock/filelock.go index f266e0102..f266e0102 100644 --- a/src/go/collectors/go.d.plugin/agent/filelock/filelock.go +++ b/src/go/plugin/go.d/agent/filelock/filelock.go diff --git a/src/go/collectors/go.d.plugin/agent/filelock/filelock_test.go b/src/go/plugin/go.d/agent/filelock/filelock_test.go index 6ffc794ec..6ffc794ec 100644 --- a/src/go/collectors/go.d.plugin/agent/filelock/filelock_test.go +++ b/src/go/plugin/go.d/agent/filelock/filelock_test.go diff --git a/src/go/collectors/go.d.plugin/agent/filestatus/manager.go b/src/go/plugin/go.d/agent/filestatus/manager.go index 4f4f03f85..03e0dd2fc 100644 --- a/src/go/collectors/go.d.plugin/agent/filestatus/manager.go +++ b/src/go/plugin/go.d/agent/filestatus/manager.go @@ -8,8 +8,8 @@ import ( "os" "time" - "github.com/netdata/netdata/go/go.d.plugin/agent/confgroup" - "github.com/netdata/netdata/go/go.d.plugin/logger" + "github.com/netdata/netdata/go/plugins/logger" + "github.com/netdata/netdata/go/plugins/plugin/go.d/agent/confgroup" ) func NewManager(path string) *Manager { diff --git a/src/go/collectors/go.d.plugin/agent/filestatus/manager_test.go b/src/go/plugin/go.d/agent/filestatus/manager_test.go index 7d45c64a2..1c7b32884 100644 --- a/src/go/collectors/go.d.plugin/agent/filestatus/manager_test.go +++ b/src/go/plugin/go.d/agent/filestatus/manager_test.go @@ -10,7 +10,7 @@ import ( "testing" "time" - "github.com/netdata/netdata/go/go.d.plugin/agent/confgroup" + "github.com/netdata/netdata/go/plugins/plugin/go.d/agent/confgroup" "github.com/stretchr/testify/assert" "github.com/stretchr/testify/require" diff --git a/src/go/collectors/go.d.plugin/agent/filestatus/store.go b/src/go/plugin/go.d/agent/filestatus/store.go index faeedff3e..3f500dec6 100644 --- a/src/go/collectors/go.d.plugin/agent/filestatus/store.go +++ b/src/go/plugin/go.d/agent/filestatus/store.go @@ -9,7 +9,7 @@ import ( "slices" "sync" - "github.com/netdata/netdata/go/go.d.plugin/agent/confgroup" + "github.com/netdata/netdata/go/plugins/plugin/go.d/agent/confgroup" ) func LoadStore(path string) (*Store, error) { diff --git a/src/go/collectors/go.d.plugin/agent/filestatus/store_test.go b/src/go/plugin/go.d/agent/filestatus/store_test.go index fbf7d339b..d8e18539e 100644 --- a/src/go/collectors/go.d.plugin/agent/filestatus/store_test.go +++ b/src/go/plugin/go.d/agent/filestatus/store_test.go @@ -5,7 +5,7 @@ package filestatus import ( "testing" - "github.com/netdata/netdata/go/go.d.plugin/agent/confgroup" + "github.com/netdata/netdata/go/plugins/plugin/go.d/agent/confgroup" "github.com/stretchr/testify/assert" ) diff --git a/src/go/collectors/go.d.plugin/agent/functions/ext.go b/src/go/plugin/go.d/agent/functions/ext.go index 28c717d88..28c717d88 100644 --- a/src/go/collectors/go.d.plugin/agent/functions/ext.go +++ b/src/go/plugin/go.d/agent/functions/ext.go diff --git a/src/go/collectors/go.d.plugin/agent/functions/function.go b/src/go/plugin/go.d/agent/functions/function.go index b2fd42932..b65d3d713 100644 --- a/src/go/collectors/go.d.plugin/agent/functions/function.go +++ b/src/go/plugin/go.d/agent/functions/function.go @@ -3,8 +3,8 @@ package functions import ( - "bufio" "bytes" + "context" "encoding/csv" "fmt" "strconv" @@ -67,22 +67,30 @@ func parseFunction(s string) (*Function, error) { return fn, nil } -func parseFunctionWithPayload(s string, sc *bufio.Scanner) (*Function, error) { +func parseFunctionWithPayload(ctx context.Context, s string, in input) (*Function, error) { fn, err := parseFunction(s) if err != nil { return nil, err } - var n int var buf bytes.Buffer - for sc.Scan() && sc.Text() != "FUNCTION_PAYLOAD_END" { - if n++; n > 1 { - buf.WriteString("\n") + + for { + select { + case <-ctx.Done(): + return nil, nil + case line, ok := <-in.lines(): + if !ok { + return nil, nil + } + if line == "FUNCTION_PAYLOAD_END" { + fn.Payload = append(fn.Payload, buf.Bytes()...) + return fn, nil + } + if buf.Len() > 0 { + buf.WriteString("\n") + } + buf.WriteString(line) } - buf.WriteString(sc.Text()) } - - fn.Payload = append(fn.Payload, buf.Bytes()...) - - return fn, nil } diff --git a/src/go/plugin/go.d/agent/functions/input.go b/src/go/plugin/go.d/agent/functions/input.go new file mode 100644 index 000000000..cb50c54d0 --- /dev/null +++ b/src/go/plugin/go.d/agent/functions/input.go @@ -0,0 +1,35 @@ +// SPDX-License-Identifier: GPL-3.0-or-later + +package functions + +import ( + "bufio" + "os" +) + +type input interface { + lines() chan string +} + +var stdinInput = func() input { + r := &stdinReader{chLines: make(chan string)} + go r.run() + return r +}() + +type stdinReader struct { + chLines chan string +} + +func (in *stdinReader) run() { + sc := bufio.NewScanner(bufio.NewReader(os.Stdin)) + + for sc.Scan() { + text := sc.Text() + in.chLines <- text + } +} + +func (in *stdinReader) lines() chan string { + return in.chLines +} diff --git a/src/go/plugin/go.d/agent/functions/manager.go b/src/go/plugin/go.d/agent/functions/manager.go new file mode 100644 index 000000000..b7cdecd6a --- /dev/null +++ b/src/go/plugin/go.d/agent/functions/manager.go @@ -0,0 +1,127 @@ +// SPDX-License-Identifier: GPL-3.0-or-later + +package functions + +import ( + "context" + "encoding/json" + "fmt" + "log/slog" + "strconv" + "strings" + "sync" + "time" + + "github.com/netdata/netdata/go/plugins/logger" + "github.com/netdata/netdata/go/plugins/plugin/go.d/agent/netdataapi" + "github.com/netdata/netdata/go/plugins/plugin/go.d/agent/safewriter" +) + +func NewManager() *Manager { + return &Manager{ + Logger: logger.New().With( + slog.String("component", "functions manager"), + ), + api: netdataapi.New(safewriter.Stdout), + input: stdinInput, + mux: &sync.Mutex{}, + FunctionRegistry: make(map[string]func(Function)), + } +} + +type Manager struct { + *logger.Logger + + api *netdataapi.API + + input input + + mux *sync.Mutex + FunctionRegistry map[string]func(Function) +} + +func (m *Manager) Run(ctx context.Context) { + m.Info("instance is started") + defer func() { m.Info("instance is stopped") }() + + var wg sync.WaitGroup + + wg.Add(1) + go func() { defer wg.Done(); m.run(ctx) }() + + wg.Wait() + + <-ctx.Done() +} + +func (m *Manager) run(ctx context.Context) { + for { + select { + case <-ctx.Done(): + return + case line, ok := <-m.input.lines(): + if !ok { + return + } + + var fn *Function + var err error + + // FIXME: if we are waiting for FUNCTION_PAYLOAD_END and a new FUNCTION* appears, + // we need to discard the current one and switch to the new one + switch { + case strings.HasPrefix(line, "FUNCTION "): + fn, err = parseFunction(line) + case strings.HasPrefix(line, "FUNCTION_PAYLOAD "): + fn, err = parseFunctionWithPayload(ctx, line, m.input) + case line == "": + continue + default: + m.Warningf("unexpected line: '%s'", line) + continue + } + + if err != nil { + m.Warningf("parse function: %v ('%s')", err, line) + continue + } + if fn == nil { + continue + } + + function, ok := m.lookupFunction(fn.Name) + if !ok { + m.Infof("skipping execution of '%s': unregistered function", fn.Name) + m.respf(fn, 501, "unregistered function: %s", fn.Name) + continue + } + if function == nil { + m.Warningf("skipping execution of '%s': nil function registered", fn.Name) + m.respf(fn, 501, "nil function: %s", fn.Name) + continue + } + + function(*fn) + } + } +} + +func (m *Manager) lookupFunction(name string) (func(Function), bool) { + m.mux.Lock() + defer m.mux.Unlock() + + f, ok := m.FunctionRegistry[name] + return f, ok +} + +func (m *Manager) respf(fn *Function, code int, msgf string, a ...any) { + bs, _ := json.Marshal(struct { + Status int `json:"status"` + Message string `json:"message"` + }{ + Status: code, + Message: fmt.Sprintf(msgf, a...), + }) + ts := strconv.FormatInt(time.Now().Unix(), 10) + m.api.FUNCRESULT(fn.UID, "application/json", string(bs), strconv.Itoa(code), ts) +} diff --git a/src/go/collectors/go.d.plugin/agent/functions/manager_test.go b/src/go/plugin/go.d/agent/functions/manager_test.go index 26a8cdd0c..c19519bc1 100644 --- a/src/go/collectors/go.d.plugin/agent/functions/manager_test.go +++ b/src/go/plugin/go.d/agent/functions/manager_test.go @@ -3,6 +3,7 @@ package functions import ( + "bufio" "context" "sort" "strings" @@ -15,7 +16,7 @@ import ( func TestNewManager(t *testing.T) { mgr := NewManager() - assert.NotNilf(t, mgr.Input, "Input") + assert.NotNilf(t, mgr.input, "Input") assert.NotNilf(t, mgr.FunctionRegistry, "FunctionRegistry") } @@ -261,7 +262,7 @@ FUNCTION_PAYLOAD_END t.Run(name, func(t *testing.T) { mgr := NewManager() - mgr.Input = strings.NewReader(test.input) + mgr.input = newMockInput(test.input) mock := &mockFunctionExecutor{} for _, v := range test.register { @@ -297,3 +298,23 @@ type mockFunctionExecutor struct { func (m *mockFunctionExecutor) execute(fn Function) { m.executed = append(m.executed, fn) } + +func newMockInput(data string) *mockInput { + m := &mockInput{chLines: make(chan string)} + sc := bufio.NewScanner(strings.NewReader(data)) + go func() { + for sc.Scan() { + m.chLines <- sc.Text() + } + close(m.chLines) + }() + return m +} + +type mockInput struct { + chLines chan string +} + +func (m *mockInput) lines() chan string { + return m.chLines +} diff --git a/src/go/collectors/go.d.plugin/agent/hostinfo/hostinfo.go b/src/go/plugin/go.d/agent/hostinfo/hostinfo.go index 48508a1c8..48508a1c8 100644 --- a/src/go/collectors/go.d.plugin/agent/hostinfo/hostinfo.go +++ b/src/go/plugin/go.d/agent/hostinfo/hostinfo.go diff --git a/src/go/collectors/go.d.plugin/agent/hostinfo/hostinfo_common.go b/src/go/plugin/go.d/agent/hostinfo/hostinfo_common.go index 69bbf5c78..69bbf5c78 100644 --- a/src/go/collectors/go.d.plugin/agent/hostinfo/hostinfo_common.go +++ b/src/go/plugin/go.d/agent/hostinfo/hostinfo_common.go diff --git a/src/go/collectors/go.d.plugin/agent/hostinfo/hostinfo_linux.go b/src/go/plugin/go.d/agent/hostinfo/hostinfo_linux.go index db2005f00..db2005f00 100644 --- a/src/go/collectors/go.d.plugin/agent/hostinfo/hostinfo_linux.go +++ b/src/go/plugin/go.d/agent/hostinfo/hostinfo_linux.go diff --git a/src/go/collectors/go.d.plugin/agent/jobmgr/cache.go b/src/go/plugin/go.d/agent/jobmgr/cache.go index 2cef1dc89..8ea16ce96 100644 --- a/src/go/collectors/go.d.plugin/agent/jobmgr/cache.go +++ b/src/go/plugin/go.d/agent/jobmgr/cache.go @@ -6,8 +6,8 @@ import ( "context" "sync" - "github.com/netdata/netdata/go/go.d.plugin/agent/confgroup" - "github.com/netdata/netdata/go/go.d.plugin/agent/module" + "github.com/netdata/netdata/go/plugins/plugin/go.d/agent/confgroup" + "github.com/netdata/netdata/go/plugins/plugin/go.d/agent/module" ) func newDiscoveredConfigsCache() *discoveredConfigs { diff --git a/src/go/collectors/go.d.plugin/agent/jobmgr/di.go b/src/go/plugin/go.d/agent/jobmgr/di.go index 844e10c11..466fcdf90 100644 --- a/src/go/collectors/go.d.plugin/agent/jobmgr/di.go +++ b/src/go/plugin/go.d/agent/jobmgr/di.go @@ -3,9 +3,9 @@ package jobmgr import ( - "github.com/netdata/netdata/go/go.d.plugin/agent/confgroup" - "github.com/netdata/netdata/go/go.d.plugin/agent/functions" - "github.com/netdata/netdata/go/go.d.plugin/agent/vnodes" + "github.com/netdata/netdata/go/plugins/plugin/go.d/agent/confgroup" + "github.com/netdata/netdata/go/plugins/plugin/go.d/agent/functions" + "github.com/netdata/netdata/go/plugins/plugin/go.d/agent/vnodes" ) type FileLocker interface { diff --git a/src/go/collectors/go.d.plugin/agent/jobmgr/dyncfg.go b/src/go/plugin/go.d/agent/jobmgr/dyncfg.go index 404f4bf3b..da6d67489 100644 --- a/src/go/collectors/go.d.plugin/agent/jobmgr/dyncfg.go +++ b/src/go/plugin/go.d/agent/jobmgr/dyncfg.go @@ -14,9 +14,9 @@ import ( "time" "unicode" - "github.com/netdata/netdata/go/go.d.plugin/agent/confgroup" - "github.com/netdata/netdata/go/go.d.plugin/agent/functions" - "github.com/netdata/netdata/go/go.d.plugin/logger" + "github.com/netdata/netdata/go/plugins/logger" + "github.com/netdata/netdata/go/plugins/plugin/go.d/agent/confgroup" + "github.com/netdata/netdata/go/plugins/plugin/go.d/agent/functions" "gopkg.in/yaml.v2" ) diff --git a/src/go/collectors/go.d.plugin/agent/jobmgr/manager.go b/src/go/plugin/go.d/agent/jobmgr/manager.go index f4d55fcf6..59947be77 100644 --- a/src/go/collectors/go.d.plugin/agent/jobmgr/manager.go +++ b/src/go/plugin/go.d/agent/jobmgr/manager.go @@ -11,13 +11,13 @@ import ( "sync" "time" - "github.com/netdata/netdata/go/go.d.plugin/agent/confgroup" - "github.com/netdata/netdata/go/go.d.plugin/agent/functions" - "github.com/netdata/netdata/go/go.d.plugin/agent/module" - "github.com/netdata/netdata/go/go.d.plugin/agent/netdataapi" - "github.com/netdata/netdata/go/go.d.plugin/agent/safewriter" - "github.com/netdata/netdata/go/go.d.plugin/agent/ticker" - "github.com/netdata/netdata/go/go.d.plugin/logger" + "github.com/netdata/netdata/go/plugins/logger" + "github.com/netdata/netdata/go/plugins/plugin/go.d/agent/confgroup" + "github.com/netdata/netdata/go/plugins/plugin/go.d/agent/functions" + "github.com/netdata/netdata/go/plugins/plugin/go.d/agent/module" + "github.com/netdata/netdata/go/plugins/plugin/go.d/agent/netdataapi" + "github.com/netdata/netdata/go/plugins/plugin/go.d/agent/safewriter" + "github.com/netdata/netdata/go/plugins/plugin/go.d/agent/ticker" "github.com/mattn/go-isatty" "gopkg.in/yaml.v2" diff --git a/src/go/collectors/go.d.plugin/agent/jobmgr/manager_test.go b/src/go/plugin/go.d/agent/jobmgr/manager_test.go index b41ea178f..1b55a8308 100644 --- a/src/go/collectors/go.d.plugin/agent/jobmgr/manager_test.go +++ b/src/go/plugin/go.d/agent/jobmgr/manager_test.go @@ -7,8 +7,8 @@ import ( "fmt" "testing" - "github.com/netdata/netdata/go/go.d.plugin/agent/confgroup" - "github.com/netdata/netdata/go/go.d.plugin/agent/functions" + "github.com/netdata/netdata/go/plugins/plugin/go.d/agent/confgroup" + "github.com/netdata/netdata/go/plugins/plugin/go.d/agent/functions" ) func TestManager_Run(t *testing.T) { diff --git a/src/go/collectors/go.d.plugin/agent/jobmgr/noop.go b/src/go/plugin/go.d/agent/jobmgr/noop.go index c64d07866..adeacf906 100644 --- a/src/go/collectors/go.d.plugin/agent/jobmgr/noop.go +++ b/src/go/plugin/go.d/agent/jobmgr/noop.go @@ -3,10 +3,10 @@ package jobmgr import ( - "github.com/netdata/netdata/go/go.d.plugin/agent/functions" + "github.com/netdata/netdata/go/plugins/plugin/go.d/agent/functions" - "github.com/netdata/netdata/go/go.d.plugin/agent/confgroup" - "github.com/netdata/netdata/go/go.d.plugin/agent/vnodes" + "github.com/netdata/netdata/go/plugins/plugin/go.d/agent/confgroup" + "github.com/netdata/netdata/go/plugins/plugin/go.d/agent/vnodes" ) type noop struct{} diff --git a/src/go/collectors/go.d.plugin/agent/jobmgr/sim_test.go b/src/go/plugin/go.d/agent/jobmgr/sim_test.go index fcdb9addd..9fe67175a 100644 --- a/src/go/collectors/go.d.plugin/agent/jobmgr/sim_test.go +++ b/src/go/plugin/go.d/agent/jobmgr/sim_test.go @@ -10,10 +10,10 @@ import ( "testing" "time" - "github.com/netdata/netdata/go/go.d.plugin/agent/confgroup" - "github.com/netdata/netdata/go/go.d.plugin/agent/module" - "github.com/netdata/netdata/go/go.d.plugin/agent/netdataapi" - "github.com/netdata/netdata/go/go.d.plugin/agent/safewriter" + "github.com/netdata/netdata/go/plugins/plugin/go.d/agent/confgroup" + "github.com/netdata/netdata/go/plugins/plugin/go.d/agent/module" + "github.com/netdata/netdata/go/plugins/plugin/go.d/agent/netdataapi" + "github.com/netdata/netdata/go/plugins/plugin/go.d/agent/safewriter" "github.com/stretchr/testify/assert" "github.com/stretchr/testify/require" ) diff --git a/src/go/collectors/go.d.plugin/agent/module/charts.go b/src/go/plugin/go.d/agent/module/charts.go index 2b9c35c3b..b60b3bac1 100644 --- a/src/go/collectors/go.d.plugin/agent/module/charts.go +++ b/src/go/plugin/go.d/agent/module/charts.go @@ -6,7 +6,10 @@ import ( "errors" "fmt" "strings" + "testing" "unicode" + + "github.com/stretchr/testify/assert" ) type ( @@ -436,7 +439,7 @@ func checkDim(d *Dim) error { if d.ID == "" { return errors.New("empty dim ID") } - if id := checkID(d.ID); id != -1 { + if id := checkID(d.ID); id != -1 && (d.Name == "" || checkID(d.Name) != -1) { return fmt.Errorf("unacceptable symbol in dim ID '%s' : '%c'", d.ID, id) } return nil @@ -460,3 +463,35 @@ func checkID(id string) int { } return -1 } + +func TestMetricsHasAllChartsDims(t *testing.T, charts *Charts, mx map[string]int64) { + for _, chart := range *charts { + if chart.Obsolete { + continue + } + for _, dim := range chart.Dims { + _, ok := mx[dim.ID] + assert.Truef(t, ok, "missing data for dimension '%s' in chart '%s'", dim.ID, chart.ID) + } + for _, v := range chart.Vars { + _, ok := mx[v.ID] + assert.Truef(t, ok, "missing data for variable '%s' in chart '%s'", v.ID, chart.ID) + } + } +} + +func TestMetricsHasAllChartsDimsSkip(t *testing.T, charts *Charts, mx map[string]int64, skip func(chart *Chart) bool) { + for _, chart := range *charts { + if chart.Obsolete || (skip != nil && skip(chart)) { + continue + } + for _, dim := range chart.Dims { + _, ok := mx[dim.ID] + assert.Truef(t, ok, "missing data for dimension '%s' in chart '%s'", dim.ID, chart.ID) + } + for _, v := range chart.Vars { + _, ok := mx[v.ID] + assert.Truef(t, ok, "missing data for variable '%s' in chart '%s'", v.ID, chart.ID) + } + } +} diff --git a/src/go/collectors/go.d.plugin/agent/module/charts_test.go b/src/go/plugin/go.d/agent/module/charts_test.go index 7c35bb33e..b0dcf806f 100644 --- a/src/go/collectors/go.d.plugin/agent/module/charts_test.go +++ b/src/go/plugin/go.d/agent/module/charts_test.go @@ -341,6 +341,9 @@ func TestDim_check(t *testing.T) { dim = &Dim{ID: "id"} dim.ID = "invalid id" assert.Error(t, checkDim(dim)) + + dim = &Dim{ID: "i d", Name: "id"} + assert.NoError(t, checkDim(dim)) } func TestVar_check(t *testing.T) { diff --git a/src/go/collectors/go.d.plugin/agent/module/job.go b/src/go/plugin/go.d/agent/module/job.go index cb15fdc2e..67fae8aa2 100644 --- a/src/go/collectors/go.d.plugin/agent/module/job.go +++ b/src/go/plugin/go.d/agent/module/job.go @@ -15,9 +15,9 @@ import ( "sync" "time" - "github.com/netdata/netdata/go/go.d.plugin/agent/netdataapi" - "github.com/netdata/netdata/go/go.d.plugin/agent/vnodes" - "github.com/netdata/netdata/go/go.d.plugin/logger" + "github.com/netdata/netdata/go/plugins/logger" + "github.com/netdata/netdata/go/plugins/plugin/go.d/agent/netdataapi" + "github.com/netdata/netdata/go/plugins/plugin/go.d/agent/vnodes" ) var obsoleteLock = &sync.Mutex{} @@ -40,7 +40,7 @@ var reSpace = regexp.MustCompile(`\s+`) var ndInternalMonitoringDisabled = os.Getenv("NETDATA_INTERNALS_MONITORING") == "NO" func newRuntimeChart(pluginName string) *Chart { - // this is needed to keep the same name as we had before https://github.com/netdata/netdata/go/go.d.plugin/issues/650 + // this is needed to keep the same name as we had before https://github.com/netdata/netdata/go/plugins/plugin/go.d/issues/650 ctxName := pluginName if ctxName == "go.d" { ctxName = "go" diff --git a/src/go/collectors/go.d.plugin/agent/module/job_test.go b/src/go/plugin/go.d/agent/module/job_test.go index c87f840d5..c87f840d5 100644 --- a/src/go/collectors/go.d.plugin/agent/module/job_test.go +++ b/src/go/plugin/go.d/agent/module/job_test.go diff --git a/src/go/collectors/go.d.plugin/agent/module/mock.go b/src/go/plugin/go.d/agent/module/mock.go index f83c7dbcc..f83c7dbcc 100644 --- a/src/go/collectors/go.d.plugin/agent/module/mock.go +++ b/src/go/plugin/go.d/agent/module/mock.go diff --git a/src/go/collectors/go.d.plugin/agent/module/mock_test.go b/src/go/plugin/go.d/agent/module/mock_test.go index d7521911f..d7521911f 100644 --- a/src/go/collectors/go.d.plugin/agent/module/mock_test.go +++ b/src/go/plugin/go.d/agent/module/mock_test.go diff --git a/src/go/collectors/go.d.plugin/agent/module/module.go b/src/go/plugin/go.d/agent/module/module.go index 2ed82b79f..13e20f2ae 100644 --- a/src/go/collectors/go.d.plugin/agent/module/module.go +++ b/src/go/plugin/go.d/agent/module/module.go @@ -6,7 +6,7 @@ import ( "encoding/json" "testing" - "github.com/netdata/netdata/go/go.d.plugin/logger" + "github.com/netdata/netdata/go/plugins/logger" "github.com/stretchr/testify/assert" "github.com/stretchr/testify/require" diff --git a/src/go/collectors/go.d.plugin/agent/module/registry.go b/src/go/plugin/go.d/agent/module/registry.go index 1d2aa9477..1d2aa9477 100644 --- a/src/go/collectors/go.d.plugin/agent/module/registry.go +++ b/src/go/plugin/go.d/agent/module/registry.go diff --git a/src/go/collectors/go.d.plugin/agent/module/registry_test.go b/src/go/plugin/go.d/agent/module/registry_test.go index c9f31105a..c9f31105a 100644 --- a/src/go/collectors/go.d.plugin/agent/module/registry_test.go +++ b/src/go/plugin/go.d/agent/module/registry_test.go diff --git a/src/go/collectors/go.d.plugin/agent/netdataapi/api.go b/src/go/plugin/go.d/agent/netdataapi/api.go index 4f2b7a9b5..4f2b7a9b5 100644 --- a/src/go/collectors/go.d.plugin/agent/netdataapi/api.go +++ b/src/go/plugin/go.d/agent/netdataapi/api.go diff --git a/src/go/collectors/go.d.plugin/agent/netdataapi/api_test.go b/src/go/plugin/go.d/agent/netdataapi/api_test.go index e5087839b..e5087839b 100644 --- a/src/go/collectors/go.d.plugin/agent/netdataapi/api_test.go +++ b/src/go/plugin/go.d/agent/netdataapi/api_test.go diff --git a/src/go/collectors/go.d.plugin/agent/safewriter/writer.go b/src/go/plugin/go.d/agent/safewriter/writer.go index 533c1055d..533c1055d 100644 --- a/src/go/collectors/go.d.plugin/agent/safewriter/writer.go +++ b/src/go/plugin/go.d/agent/safewriter/writer.go diff --git a/src/go/collectors/go.d.plugin/agent/setup.go b/src/go/plugin/go.d/agent/setup.go index d4f321e8b..12da59380 100644 --- a/src/go/collectors/go.d.plugin/agent/setup.go +++ b/src/go/plugin/go.d/agent/setup.go @@ -7,14 +7,14 @@ import ( "os" "strings" - "github.com/netdata/netdata/go/go.d.plugin/agent/confgroup" - "github.com/netdata/netdata/go/go.d.plugin/agent/discovery" - "github.com/netdata/netdata/go/go.d.plugin/agent/discovery/dummy" - "github.com/netdata/netdata/go/go.d.plugin/agent/discovery/file" - "github.com/netdata/netdata/go/go.d.plugin/agent/discovery/sd" - "github.com/netdata/netdata/go/go.d.plugin/agent/hostinfo" - "github.com/netdata/netdata/go/go.d.plugin/agent/module" - "github.com/netdata/netdata/go/go.d.plugin/agent/vnodes" + "github.com/netdata/netdata/go/plugins/plugin/go.d/agent/confgroup" + "github.com/netdata/netdata/go/plugins/plugin/go.d/agent/discovery" + "github.com/netdata/netdata/go/plugins/plugin/go.d/agent/discovery/dummy" + "github.com/netdata/netdata/go/plugins/plugin/go.d/agent/discovery/file" + "github.com/netdata/netdata/go/plugins/plugin/go.d/agent/discovery/sd" + "github.com/netdata/netdata/go/plugins/plugin/go.d/agent/hostinfo" + "github.com/netdata/netdata/go/plugins/plugin/go.d/agent/module" + "github.com/netdata/netdata/go/plugins/plugin/go.d/agent/vnodes" "gopkg.in/yaml.v2" ) diff --git a/src/go/collectors/go.d.plugin/agent/setup_test.go b/src/go/plugin/go.d/agent/setup_test.go index 36ec68273..148b822cf 100644 --- a/src/go/collectors/go.d.plugin/agent/setup_test.go +++ b/src/go/plugin/go.d/agent/setup_test.go @@ -5,7 +5,7 @@ package agent import ( "testing" - "github.com/netdata/netdata/go/go.d.plugin/agent/module" + "github.com/netdata/netdata/go/plugins/plugin/go.d/agent/module" "github.com/stretchr/testify/assert" "github.com/stretchr/testify/require" diff --git a/src/go/collectors/go.d.plugin/agent/testdata/agent-empty.conf b/src/go/plugin/go.d/agent/testdata/agent-empty.conf index e69de29bb..e69de29bb 100644 --- a/src/go/collectors/go.d.plugin/agent/testdata/agent-empty.conf +++ b/src/go/plugin/go.d/agent/testdata/agent-empty.conf diff --git a/src/go/collectors/go.d.plugin/agent/testdata/agent-invalid-syntax.conf b/src/go/plugin/go.d/agent/testdata/agent-invalid-syntax.conf index c4a0b914c..c4a0b914c 100644 --- a/src/go/collectors/go.d.plugin/agent/testdata/agent-invalid-syntax.conf +++ b/src/go/plugin/go.d/agent/testdata/agent-invalid-syntax.conf diff --git a/src/go/collectors/go.d.plugin/agent/testdata/agent-valid.conf b/src/go/plugin/go.d/agent/testdata/agent-valid.conf index ec5e1d06e..ec5e1d06e 100644 --- a/src/go/collectors/go.d.plugin/agent/testdata/agent-valid.conf +++ b/src/go/plugin/go.d/agent/testdata/agent-valid.conf diff --git a/src/go/collectors/go.d.plugin/agent/ticker/ticker.go b/src/go/plugin/go.d/agent/ticker/ticker.go index e4228fe4c..e4228fe4c 100644 --- a/src/go/collectors/go.d.plugin/agent/ticker/ticker.go +++ b/src/go/plugin/go.d/agent/ticker/ticker.go diff --git a/src/go/collectors/go.d.plugin/agent/ticker/ticket_test.go b/src/go/plugin/go.d/agent/ticker/ticket_test.go index 193085365..193085365 100644 --- a/src/go/collectors/go.d.plugin/agent/ticker/ticket_test.go +++ b/src/go/plugin/go.d/agent/ticker/ticket_test.go diff --git a/src/go/collectors/go.d.plugin/agent/vnodes/testdata/config.yaml b/src/go/plugin/go.d/agent/vnodes/testdata/config.yaml index db256d32f..db256d32f 100644 --- a/src/go/collectors/go.d.plugin/agent/vnodes/testdata/config.yaml +++ b/src/go/plugin/go.d/agent/vnodes/testdata/config.yaml diff --git a/src/go/collectors/go.d.plugin/agent/vnodes/vnodes.go b/src/go/plugin/go.d/agent/vnodes/vnodes.go index 2c59f2ad1..9272f1514 100644 --- a/src/go/collectors/go.d.plugin/agent/vnodes/vnodes.go +++ b/src/go/plugin/go.d/agent/vnodes/vnodes.go @@ -9,7 +9,7 @@ import ( "os" "path/filepath" - "github.com/netdata/netdata/go/go.d.plugin/logger" + "github.com/netdata/netdata/go/plugins/logger" "gopkg.in/yaml.v2" ) diff --git a/src/go/collectors/go.d.plugin/agent/vnodes/vnodes_test.go b/src/go/plugin/go.d/agent/vnodes/vnodes_test.go index fc2c2ef35..fc2c2ef35 100644 --- a/src/go/collectors/go.d.plugin/agent/vnodes/vnodes_test.go +++ b/src/go/plugin/go.d/agent/vnodes/vnodes_test.go diff --git a/src/go/collectors/go.d.plugin/cli/cli.go b/src/go/plugin/go.d/cli/cli.go index 646bdf121..646bdf121 100644 --- a/src/go/collectors/go.d.plugin/cli/cli.go +++ b/src/go/plugin/go.d/cli/cli.go diff --git a/src/go/collectors/go.d.plugin/config/go.d.conf b/src/go/plugin/go.d/config/go.d.conf index 8a5ac82ec..198bcd086 100644 --- a/src/go/collectors/go.d.plugin/config/go.d.conf +++ b/src/go/plugin/go.d/config/go.d.conf @@ -17,7 +17,9 @@ max_procs: 0 modules: # adaptec_raid: yes # activemq: yes +# ap: yes # apache: yes +# beanstalk: yes # bind: yes # chrony: yes # clickhouse: yes @@ -34,19 +36,24 @@ modules: # docker: yes # docker_engine: yes # dockerhub: yes +# dovecot: yes # elasticsearch: yes # envoy: yes # example: no +# exim: yes # fail2ban: yes # filecheck: yes # fluentd: yes # freeradius: yes +# gearman: yes # haproxy: yes # hddtemp: yes # hdfs: yes # hpssa: yes # httpcheck: yes +# icecast: yes # intelgpu: yes +# ipfs: yes # isc_dhcpd: yes # k8s_kubelet: yes # k8s_kubeproxy: yes @@ -56,11 +63,14 @@ modules: # logstash: yes # lvm: yes # megacli: yes +# memcached: yes # mongodb: yes +# monit: yes # mysql: yes # nginx: yes # nginxplus: yes # nginxvts: yes +# nsd: yes # ntpd: yes # nvme: yes # nvidia_smi: no @@ -74,25 +84,33 @@ modules: # pika: yes # portcheck: yes # postgres: yes +# postfix: yes # powerdns: yes # powerdns_recursor: yes # prometheus: yes # pulsar: yes +# puppet: yes # rabbitmq: yes # redis: yes +# rethinkdb: yes +# riakkv: yes # rspamd: yes # scaleio: yes # sensors: yes # snmp: yes +# squid: yes # squidlog: yes # smartctl: yes # storcli: yes # supervisord: yes # systemdunits: yes # tengine: yes +# tomcat: yes +# tor: yes # traefik: yes # upsd: yes # unbound: yes +# uwsgi: yes # vernemq: yes # vcsa: yes # vsphere: yes diff --git a/src/go/collectors/go.d.plugin/config/go.d/activemq.conf b/src/go/plugin/go.d/config/go.d/activemq.conf index 69d7ce143..9bae9cc56 100644 --- a/src/go/collectors/go.d.plugin/config/go.d/activemq.conf +++ b/src/go/plugin/go.d/config/go.d/activemq.conf @@ -1,5 +1,5 @@ ## All available configuration options, their descriptions and default values: -## https://github.com/netdata/netdata/tree/master/src/go/collectors/go.d.plugin/modules/activemq#readme +## https://github.com/netdata/netdata/tree/master/src/go/plugin/go.d/modules/activemq#readme #jobs: # - name: local diff --git a/src/go/collectors/go.d.plugin/config/go.d/adaptec_raid.conf b/src/go/plugin/go.d/config/go.d/adaptec_raid.conf index 21c548f2d..eafbd0303 100644 --- a/src/go/collectors/go.d.plugin/config/go.d/adaptec_raid.conf +++ b/src/go/plugin/go.d/config/go.d/adaptec_raid.conf @@ -1,5 +1,5 @@ ## All available configuration options, their descriptions and default values: -## https://github.com/netdata/netdata/tree/master/src/go/collectors/go.d.plugin/modules/adaptecraid#readme +## https://github.com/netdata/netdata/tree/master/src/go/plugin/go.d/modules/adaptecraid#readme jobs: - name: adaptec_raid diff --git a/src/go/plugin/go.d/config/go.d/ap.conf b/src/go/plugin/go.d/config/go.d/ap.conf new file mode 100644 index 000000000..ef8f2d9f8 --- /dev/null +++ b/src/go/plugin/go.d/config/go.d/ap.conf @@ -0,0 +1,6 @@ +## All available configuration options, their descriptions and default values: +## https://github.com/netdata/netdata/tree/master/src/go/plugin/go.d/modules/ap#readme + +jobs: + - name: local + binary_path: /usr/sbin/iw diff --git a/src/go/collectors/go.d.plugin/config/go.d/apache.conf b/src/go/plugin/go.d/config/go.d/apache.conf index d52c1f67b..86f4a75c4 100644 --- a/src/go/collectors/go.d.plugin/config/go.d/apache.conf +++ b/src/go/plugin/go.d/config/go.d/apache.conf @@ -1,5 +1,5 @@ ## All available configuration options, their descriptions and default values: -## https://github.com/netdata/netdata/tree/master/src/go/collectors/go.d.plugin/modules/apache#readme +## https://github.com/netdata/netdata/tree/master/src/go/plugin/go.d/modules/apache#readme #jobs: # - name: local diff --git a/src/go/plugin/go.d/config/go.d/beanstalk.conf b/src/go/plugin/go.d/config/go.d/beanstalk.conf new file mode 100644 index 000000000..45e2254b8 --- /dev/null +++ b/src/go/plugin/go.d/config/go.d/beanstalk.conf @@ -0,0 +1,6 @@ +## All available configuration options, their descriptions and default values: +## https://github.com/netdata/netdata/tree/master/src/go/plugin/go.d/modules/beanstalk#readme + +#jobs: +# - name: local +# address: 127.0.0.1:11300 diff --git a/src/go/collectors/go.d.plugin/config/go.d/bind.conf b/src/go/plugin/go.d/config/go.d/bind.conf index 4302013ce..9e970e60e 100644 --- a/src/go/collectors/go.d.plugin/config/go.d/bind.conf +++ b/src/go/plugin/go.d/config/go.d/bind.conf @@ -1,5 +1,5 @@ ## All available configuration options, their descriptions and default values: -## https://github.com/netdata/netdata/tree/master/src/go/collectors/go.d.plugin/modules/bind#readme +## https://github.com/netdata/netdata/tree/master/src/go/plugin/go.d/modules/bind#readme #jobs: # - name: local diff --git a/src/go/collectors/go.d.plugin/config/go.d/cassandra.conf b/src/go/plugin/go.d/config/go.d/cassandra.conf index 84de0b1c3..93283ee6c 100644 --- a/src/go/collectors/go.d.plugin/config/go.d/cassandra.conf +++ b/src/go/plugin/go.d/config/go.d/cassandra.conf @@ -1,5 +1,5 @@ ## All available configuration options, their descriptions and default values: -## https://github.com/netdata/netdata/tree/master/src/go/collectors/go.d.plugin/modules/cassandra#readme +## https://github.com/netdata/netdata/tree/master/src/go/plugin/go.d/modules/cassandra#readme #jobs: # - name: local diff --git a/src/go/collectors/go.d.plugin/config/go.d/chrony.conf b/src/go/plugin/go.d/config/go.d/chrony.conf index 69d9b1c33..099ba3583 100644 --- a/src/go/collectors/go.d.plugin/config/go.d/chrony.conf +++ b/src/go/plugin/go.d/config/go.d/chrony.conf @@ -1,5 +1,5 @@ ## All available configuration options, their descriptions and default values: -## https://github.com/netdata/netdata/tree/master/src/go/collectors/go.d.plugin/modules/chrony#readme +## https://github.com/netdata/netdata/tree/master/src/go/plugin/go.d/modules/chrony#readme #jobs: # - name: local diff --git a/src/go/collectors/go.d.plugin/config/go.d/clickhouse.conf b/src/go/plugin/go.d/config/go.d/clickhouse.conf index e8d6725ef..4f416138b 100644 --- a/src/go/collectors/go.d.plugin/config/go.d/clickhouse.conf +++ b/src/go/plugin/go.d/config/go.d/clickhouse.conf @@ -1,5 +1,5 @@ ## All available configuration options, their descriptions and default values: -## https://github.com/netdata/netdata/tree/master/src/go/collectors/go.d.plugin/modules/clickhouse#readme +## https://github.com/netdata/netdata/tree/master/src/go/plugin/go.d/modules/clickhouse#readme #jobs: # - name: local diff --git a/src/go/collectors/go.d.plugin/config/go.d/cockroachdb.conf b/src/go/plugin/go.d/config/go.d/cockroachdb.conf index 83cc91a92..8d04dbfe0 100644 --- a/src/go/collectors/go.d.plugin/config/go.d/cockroachdb.conf +++ b/src/go/plugin/go.d/config/go.d/cockroachdb.conf @@ -1,5 +1,5 @@ ## All available configuration options, their descriptions and default values: -## https://github.com/netdata/netdata/tree/master/src/go/collectors/go.d.plugin/modules/cockroachdb#readme +## https://github.com/netdata/netdata/tree/master/src/go/plugin/go.d/modules/cockroachdb#readme #jobs: # - name: local diff --git a/src/go/collectors/go.d.plugin/config/go.d/consul.conf b/src/go/plugin/go.d/config/go.d/consul.conf index 60aea1232..624b9a6d4 100644 --- a/src/go/collectors/go.d.plugin/config/go.d/consul.conf +++ b/src/go/plugin/go.d/config/go.d/consul.conf @@ -1,5 +1,5 @@ ## All available configuration options, their descriptions and default values: -## https://github.com/netdata/netdata/tree/master/src/go/collectors/go.d.plugin/modules/consul#readme +## https://github.com/netdata/netdata/tree/master/src/go/plugin/go.d/modules/consul#readme #jobs: # - name: local diff --git a/src/go/collectors/go.d.plugin/config/go.d/coredns.conf b/src/go/plugin/go.d/config/go.d/coredns.conf index 3037b9db9..9b9d6ef9a 100644 --- a/src/go/collectors/go.d.plugin/config/go.d/coredns.conf +++ b/src/go/plugin/go.d/config/go.d/coredns.conf @@ -1,5 +1,5 @@ ## All available configuration options, their descriptions and default values: -## https://github.com/netdata/netdata/tree/master/src/go/collectors/go.d.plugin/modules/coredns#readme +## https://github.com/netdata/netdata/tree/master/src/go/plugin/go.d/modules/coredns#readme #jobs: # - name: local diff --git a/src/go/collectors/go.d.plugin/config/go.d/couchbase.conf b/src/go/plugin/go.d/config/go.d/couchbase.conf index 77ecf3f10..aec5c342c 100644 --- a/src/go/collectors/go.d.plugin/config/go.d/couchbase.conf +++ b/src/go/plugin/go.d/config/go.d/couchbase.conf @@ -1,5 +1,5 @@ ## All available configuration options, their descriptions and default values: -## https://github.com/netdata/netdata/tree/master/src/go/collectors/go.d.plugin/modules/couchbase#readme +## https://github.com/netdata/netdata/tree/master/src/go/plugin/go.d/modules/couchbase#readme #jobs: # - name: local diff --git a/src/go/collectors/go.d.plugin/config/go.d/couchdb.conf b/src/go/plugin/go.d/config/go.d/couchdb.conf index 8527f6b8c..5b62ad191 100644 --- a/src/go/collectors/go.d.plugin/config/go.d/couchdb.conf +++ b/src/go/plugin/go.d/config/go.d/couchdb.conf @@ -1,5 +1,5 @@ ## All available configuration options, their descriptions and default values: -## https://github.com/netdata/netdata/tree/master/src/go/collectors/go.d.plugin/modules/couchdb#readme +## https://github.com/netdata/netdata/tree/master/src/go/plugin/go.d/modules/couchdb#readme #jobs: # - name: local diff --git a/src/go/collectors/go.d.plugin/config/go.d/dmcache.conf b/src/go/plugin/go.d/config/go.d/dmcache.conf index a17e6db79..8b39726cb 100644 --- a/src/go/collectors/go.d.plugin/config/go.d/dmcache.conf +++ b/src/go/plugin/go.d/config/go.d/dmcache.conf @@ -1,5 +1,5 @@ ## All available configuration options, their descriptions and default values: -## https://github.com/netdata/netdata/tree/master/src/go/collectors/go.d.plugin/modules/dmcache#readme +## https://github.com/netdata/netdata/tree/master/src/go/plugin/go.d/modules/dmcache#readme jobs: - name: dmcache diff --git a/src/go/collectors/go.d.plugin/config/go.d/dns_query.conf b/src/go/plugin/go.d/config/go.d/dns_query.conf index 4fd374a8e..ca24265bf 100644 --- a/src/go/collectors/go.d.plugin/config/go.d/dns_query.conf +++ b/src/go/plugin/go.d/config/go.d/dns_query.conf @@ -1,5 +1,5 @@ ## All available configuration options, their descriptions and default values: -## https://github.com/netdata/netdata/tree/master/src/go/collectors/go.d.plugin/modules/dnsquery#readme +## https://github.com/netdata/netdata/tree/master/src/go/plugin/go.d/modules/dnsquery#readme #jobs: # - name: example diff --git a/src/go/collectors/go.d.plugin/config/go.d/dnsdist.conf b/src/go/plugin/go.d/config/go.d/dnsdist.conf index 6da0539cd..cc991e018 100644 --- a/src/go/collectors/go.d.plugin/config/go.d/dnsdist.conf +++ b/src/go/plugin/go.d/config/go.d/dnsdist.conf @@ -1,5 +1,5 @@ ## All available configuration options, their descriptions and default values: -## https://github.com/netdata/netdata/tree/master/src/go/collectors/go.d.plugin/modules/dnsdist#readme +## https://github.com/netdata/netdata/tree/master/src/go/plugin/go.d/modules/dnsdist#readme #jobs: # - name: local diff --git a/src/go/collectors/go.d.plugin/config/go.d/dnsmasq.conf b/src/go/plugin/go.d/config/go.d/dnsmasq.conf index 47c94940d..3b9b3d326 100644 --- a/src/go/collectors/go.d.plugin/config/go.d/dnsmasq.conf +++ b/src/go/plugin/go.d/config/go.d/dnsmasq.conf @@ -1,5 +1,5 @@ ## All available configuration options, their descriptions and default values: -## https://github.com/netdata/netdata/tree/master/src/go/collectors/go.d.plugin/modules/dnsmasq#readme +## https://github.com/netdata/netdata/tree/master/src/go/plugin/go.d/modules/dnsmasq#readme #jobs: # - name: local diff --git a/src/go/collectors/go.d.plugin/config/go.d/dnsmasq_dhcp.conf b/src/go/plugin/go.d/config/go.d/dnsmasq_dhcp.conf index f3ca29fe7..1f51415dc 100644 --- a/src/go/collectors/go.d.plugin/config/go.d/dnsmasq_dhcp.conf +++ b/src/go/plugin/go.d/config/go.d/dnsmasq_dhcp.conf @@ -1,5 +1,5 @@ ## All available configuration options, their descriptions and default values: -## https://github.com/netdata/netdata/tree/master/src/go/collectors/go.d.plugin/modules/dnsmasq_dhcp#readme +## https://github.com/netdata/netdata/tree/master/src/go/plugin/go.d/modules/dnsmasq_dhcp#readme jobs: - name: dnsmasq_dhcp diff --git a/src/go/collectors/go.d.plugin/config/go.d/docker.conf b/src/go/plugin/go.d/config/go.d/docker.conf index 4701e2e8f..084373f74 100644 --- a/src/go/collectors/go.d.plugin/config/go.d/docker.conf +++ b/src/go/plugin/go.d/config/go.d/docker.conf @@ -1,5 +1,5 @@ ## All available configuration options, their descriptions and default values: -## https://github.com/netdata/netdata/tree/master/src/go/collectors/go.d.plugin/modules/docker#readme +## https://github.com/netdata/netdata/tree/master/src/go/plugin/go.d/modules/docker#readme jobs: - name: local diff --git a/src/go/collectors/go.d.plugin/config/go.d/docker_engine.conf b/src/go/plugin/go.d/config/go.d/docker_engine.conf index 1a5de15ee..ba7342a77 100644 --- a/src/go/collectors/go.d.plugin/config/go.d/docker_engine.conf +++ b/src/go/plugin/go.d/config/go.d/docker_engine.conf @@ -1,5 +1,5 @@ ## All available configuration options, their descriptions and default values: -## https://github.com/netdata/netdata/tree/master/src/go/collectors/go.d.plugin/modules/docker_engine#readme +## https://github.com/netdata/netdata/tree/master/src/go/plugin/go.d/modules/docker_engine#readme #jobs: # - name: local diff --git a/src/go/collectors/go.d.plugin/config/go.d/dockerhub.conf b/src/go/plugin/go.d/config/go.d/dockerhub.conf index 6d4ee5d6d..96b29e26b 100644 --- a/src/go/collectors/go.d.plugin/config/go.d/dockerhub.conf +++ b/src/go/plugin/go.d/config/go.d/dockerhub.conf @@ -1,5 +1,5 @@ ## All available configuration options, their descriptions and default values: -## https://github.com/netdata/netdata/tree/master/src/go/collectors/go.d.plugin/modules/dockerhub#readme +## https://github.com/netdata/netdata/tree/master/src/go/plugin/go.d/modules/dockerhub#readme #jobs: # - name: dockerhub diff --git a/src/go/plugin/go.d/config/go.d/dovecot.conf b/src/go/plugin/go.d/config/go.d/dovecot.conf new file mode 100644 index 000000000..5dd31bd7d --- /dev/null +++ b/src/go/plugin/go.d/config/go.d/dovecot.conf @@ -0,0 +1,6 @@ +## All available configuration options, their descriptions and default values: +## https://github.com/netdata/netdata/tree/master/src/go/plugin/go.d/modules/dovecot#readme + +jobs: + - name: local + address: unix:///var/run/dovecot/old-stats diff --git a/src/go/collectors/go.d.plugin/config/go.d/elasticsearch.conf b/src/go/plugin/go.d/config/go.d/elasticsearch.conf index b641d6c3f..26ff2c9cd 100644 --- a/src/go/collectors/go.d.plugin/config/go.d/elasticsearch.conf +++ b/src/go/plugin/go.d/config/go.d/elasticsearch.conf @@ -1,5 +1,5 @@ ## All available configuration options, their descriptions and default values: -## https://github.com/netdata/netdata/tree/master/src/go/collectors/go.d.plugin/modules/elasticsearch#readme +## https://github.com/netdata/netdata/tree/master/src/go/plugin/go.d/modules/elasticsearch#readme #jobs: # - name: local diff --git a/src/go/collectors/go.d.plugin/config/go.d/envoy.conf b/src/go/plugin/go.d/config/go.d/envoy.conf index b4a801cff..fc30a3502 100644 --- a/src/go/collectors/go.d.plugin/config/go.d/envoy.conf +++ b/src/go/plugin/go.d/config/go.d/envoy.conf @@ -1,5 +1,5 @@ ## All available configuration options, their descriptions and default values: -## https://github.com/netdata/netdata/tree/master/src/go/collectors/go.d.plugin/modules/envoy#readme +## https://github.com/netdata/netdata/tree/master/src/go/plugin/go.d/modules/envoy#readme #jobs: # - name: local diff --git a/src/go/collectors/go.d.plugin/config/go.d/example.conf b/src/go/plugin/go.d/config/go.d/example.conf index b99370922..f92669a68 100644 --- a/src/go/collectors/go.d.plugin/config/go.d/example.conf +++ b/src/go/plugin/go.d/config/go.d/example.conf @@ -1,5 +1,5 @@ ## All available configuration options, their descriptions and default values: -## https://github.com/netdata/netdata/tree/master/src/go/collectors/go.d.plugin/modules/example#readme +## https://github.com/netdata/netdata/tree/master/src/go/plugin/go.d/modules/example#readme jobs: - name: example diff --git a/src/go/plugin/go.d/config/go.d/exim.conf b/src/go/plugin/go.d/config/go.d/exim.conf new file mode 100644 index 000000000..db8813152 --- /dev/null +++ b/src/go/plugin/go.d/config/go.d/exim.conf @@ -0,0 +1,5 @@ +## All available configuration options, their descriptions and default values: +## https://github.com/netdata/netdata/tree/master/src/go/plugin/go.d/modules/exim#readme + +jobs: + - name: exim diff --git a/src/go/collectors/go.d.plugin/config/go.d/fail2ban.conf b/src/go/plugin/go.d/config/go.d/fail2ban.conf index 56f4a59e5..ac3d126b7 100644 --- a/src/go/collectors/go.d.plugin/config/go.d/fail2ban.conf +++ b/src/go/plugin/go.d/config/go.d/fail2ban.conf @@ -1,5 +1,5 @@ ## All available configuration options, their descriptions and default values: -## https://github.com/netdata/netdata/tree/master/src/go/collectors/go.d.plugin/modules/fail2ban#readme +## https://github.com/netdata/netdata/tree/master/src/go/plugin/go.d/modules/fail2ban#readme jobs: - name: fail2ban diff --git a/src/go/collectors/go.d.plugin/config/go.d/filecheck.conf b/src/go/plugin/go.d/config/go.d/filecheck.conf index 16b9c2281..ed33675ef 100644 --- a/src/go/collectors/go.d.plugin/config/go.d/filecheck.conf +++ b/src/go/plugin/go.d/config/go.d/filecheck.conf @@ -1,5 +1,5 @@ ## All available configuration options, their descriptions and default values: -## https://github.com/netdata/netdata/tree/master/src/go/collectors/go.d.plugin/modules/filecheck#readme +## https://github.com/netdata/netdata/tree/master/src/go/plugin/go.d/modules/filecheck#readme #jobs: # - name: files_example diff --git a/src/go/collectors/go.d.plugin/config/go.d/fluentd.conf b/src/go/plugin/go.d/config/go.d/fluentd.conf index 6a1507f17..a75dde619 100644 --- a/src/go/collectors/go.d.plugin/config/go.d/fluentd.conf +++ b/src/go/plugin/go.d/config/go.d/fluentd.conf @@ -1,5 +1,5 @@ ## All available configuration options, their descriptions and default values: -## https://github.com/netdata/netdata/tree/master/src/go/collectors/go.d.plugin/modules/fluentd#readme +## https://github.com/netdata/netdata/tree/master/src/go/plugin/go.d/modules/fluentd#readme #jobs: # - name: local diff --git a/src/go/collectors/go.d.plugin/config/go.d/freeradius.conf b/src/go/plugin/go.d/config/go.d/freeradius.conf index 67cda5cca..ba8b066d0 100644 --- a/src/go/collectors/go.d.plugin/config/go.d/freeradius.conf +++ b/src/go/plugin/go.d/config/go.d/freeradius.conf @@ -1,5 +1,5 @@ ## All available configuration options, their descriptions and default values: -## https://github.com/netdata/netdata/tree/master/src/go/collectors/go.d.plugin/modules/freeradius#readme +## https://github.com/netdata/netdata/tree/master/src/go/plugin/go.d/modules/freeradius#readme #jobs: # - name: local diff --git a/src/go/plugin/go.d/config/go.d/gearman.conf b/src/go/plugin/go.d/config/go.d/gearman.conf new file mode 100644 index 000000000..b816f27d1 --- /dev/null +++ b/src/go/plugin/go.d/config/go.d/gearman.conf @@ -0,0 +1,6 @@ +## All available configuration options, their descriptions and default values: +## https://github.com/netdata/netdata/tree/master/src/go/plugin/go.d/modules/gearman#readme + +#jobs: +# - name: local +# address: 127.0.0.1:4730 diff --git a/src/go/collectors/go.d.plugin/config/go.d/geth.conf b/src/go/plugin/go.d/config/go.d/geth.conf index 1b5647439..e09fc055e 100644 --- a/src/go/collectors/go.d.plugin/config/go.d/geth.conf +++ b/src/go/plugin/go.d/config/go.d/geth.conf @@ -1,5 +1,5 @@ ## All available configuration options, their descriptions and default values: -## https://github.com/netdata/netdata/tree/master/src/go/collectors/go.d.plugin/modules/geth#readme +## https://github.com/netdata/netdata/tree/master/src/go/plugin/go.d/modules/geth#readme #jobs: # - name: local diff --git a/src/go/collectors/go.d.plugin/config/go.d/haproxy.conf b/src/go/plugin/go.d/config/go.d/haproxy.conf index 0802a8f02..f2f8011e1 100644 --- a/src/go/collectors/go.d.plugin/config/go.d/haproxy.conf +++ b/src/go/plugin/go.d/config/go.d/haproxy.conf @@ -1,5 +1,5 @@ ## All available configuration options, their descriptions and default values: -## https://github.com/netdata/netdata/tree/master/src/go/collectors/go.d.plugin/modules/haproxy#readme +## https://github.com/netdata/netdata/tree/master/src/go/plugin/go.d/modules/haproxy#readme #jobs: # - name: local diff --git a/src/go/collectors/go.d.plugin/config/go.d/hddtemp.conf b/src/go/plugin/go.d/config/go.d/hddtemp.conf index a2ea8452d..6a9830a8d 100644 --- a/src/go/collectors/go.d.plugin/config/go.d/hddtemp.conf +++ b/src/go/plugin/go.d/config/go.d/hddtemp.conf @@ -1,5 +1,5 @@ ## All available configuration options, their descriptions and default values: -## https://github.com/netdata/netdata/tree/master/src/go/collectors/go.d.plugin/modules/hddtemp#readme +## https://github.com/netdata/netdata/tree/master/src/go/plugin/go.d/modules/hddtemp#readme #jobs: # - name: local diff --git a/src/go/collectors/go.d.plugin/config/go.d/hdfs.conf b/src/go/plugin/go.d/config/go.d/hdfs.conf index 2e3e24b6b..93a6d24b0 100644 --- a/src/go/collectors/go.d.plugin/config/go.d/hdfs.conf +++ b/src/go/plugin/go.d/config/go.d/hdfs.conf @@ -1,5 +1,5 @@ ## All available configuration options, their descriptions and default values: -## https://github.com/netdata/netdata/tree/master/src/go/collectors/go.d.plugin/modules/hdfs#readme +## https://github.com/netdata/netdata/tree/master/src/go/plugin/go.d/modules/hdfs#readme #jobs: # - name: namenode diff --git a/src/go/collectors/go.d.plugin/config/go.d/hpssa.conf b/src/go/plugin/go.d/config/go.d/hpssa.conf index c5abeb486..6638b6166 100644 --- a/src/go/collectors/go.d.plugin/config/go.d/hpssa.conf +++ b/src/go/plugin/go.d/config/go.d/hpssa.conf @@ -1,5 +1,5 @@ ## All available configuration options, their descriptions and default values: -## https://github.com/netdata/netdata/tree/master/src/go/collectors/go.d.plugin/modules/hpssa#readme +## https://github.com/netdata/netdata/tree/master/src/go/plugin/go.d/modules/hpssa#readme jobs: - name: hpssa diff --git a/src/go/collectors/go.d.plugin/config/go.d/httpcheck.conf b/src/go/plugin/go.d/config/go.d/httpcheck.conf index 908433e05..6aba8dca2 100644 --- a/src/go/collectors/go.d.plugin/config/go.d/httpcheck.conf +++ b/src/go/plugin/go.d/config/go.d/httpcheck.conf @@ -1,5 +1,5 @@ ## All available configuration options, their descriptions and default values: -## https://github.com/netdata/netdata/tree/master/src/go/collectors/go.d.plugin/modules/httpcheck#readme +## https://github.com/netdata/netdata/tree/master/src/go/plugin/go.d/modules/httpcheck#readme #jobs: # - name: jira diff --git a/src/go/plugin/go.d/config/go.d/icecast.conf b/src/go/plugin/go.d/config/go.d/icecast.conf new file mode 100644 index 000000000..aba3e1d2c --- /dev/null +++ b/src/go/plugin/go.d/config/go.d/icecast.conf @@ -0,0 +1,6 @@ +## All available configuration options, their descriptions and default values: +## https://github.com/netdata/netdata/tree/master/src/go/plugin/go.d/modules/icecast#readme + +#jobs: +# - name: local +# url: http://localhost:8000 diff --git a/src/go/collectors/go.d.plugin/config/go.d/intelgpu.conf b/src/go/plugin/go.d/config/go.d/intelgpu.conf index 3639076f1..a8b3144f2 100644 --- a/src/go/collectors/go.d.plugin/config/go.d/intelgpu.conf +++ b/src/go/plugin/go.d/config/go.d/intelgpu.conf @@ -1,5 +1,5 @@ ## All available configuration options, their descriptions and default values: -## https://github.com/netdata/netdata/tree/master/src/go/collectors/go.d.plugin/modules/intelgpu#readme +## https://github.com/netdata/netdata/tree/master/src/go/plugin/go.d/modules/intelgpu#readme jobs: - name: intelgpu diff --git a/src/go/plugin/go.d/config/go.d/ipfs.conf b/src/go/plugin/go.d/config/go.d/ipfs.conf new file mode 100644 index 000000000..127006de5 --- /dev/null +++ b/src/go/plugin/go.d/config/go.d/ipfs.conf @@ -0,0 +1,6 @@ +## All available configuration options, their descriptions and default values: +## https://github.com/netdata/netdata/tree/master/src/go/plugin/go.d/modules/ipfs#readme + +#jobs: +# - name: local +# url: http://localhost:5001 diff --git a/src/go/collectors/go.d.plugin/config/go.d/isc_dhcpd.conf b/src/go/plugin/go.d/config/go.d/isc_dhcpd.conf index aef144308..17a577bb4 100644 --- a/src/go/collectors/go.d.plugin/config/go.d/isc_dhcpd.conf +++ b/src/go/plugin/go.d/config/go.d/isc_dhcpd.conf @@ -1,5 +1,5 @@ ## All available configuration options, their descriptions and default values: -## https://github.com/netdata/netdata/tree/master/src/go/collectors/go.d.plugin/modules/isc_dhcpd#readme +## https://github.com/netdata/netdata/tree/master/src/go/plugin/go.d/modules/isc_dhcpd#readme #jobs: # - name: ipv4_example diff --git a/src/go/collectors/go.d.plugin/config/go.d/k8s_kubelet.conf b/src/go/plugin/go.d/config/go.d/k8s_kubelet.conf index 37a8ba6c0..1c0f8cd1f 100644 --- a/src/go/collectors/go.d.plugin/config/go.d/k8s_kubelet.conf +++ b/src/go/plugin/go.d/config/go.d/k8s_kubelet.conf @@ -1,5 +1,5 @@ ## All available configuration options, their descriptions and default values: -## https://github.com/netdata/netdata/tree/master/src/go/collectors/go.d.plugin/modules/k8s_kubelet#readme +## https://github.com/netdata/netdata/tree/master/src/go/plugin/go.d/modules/k8s_kubelet#readme #jobs: # - url: http://127.0.0.1:10255/metrics diff --git a/src/go/collectors/go.d.plugin/config/go.d/k8s_kubeproxy.conf b/src/go/plugin/go.d/config/go.d/k8s_kubeproxy.conf index 2563f7b6e..a0b9ee240 100644 --- a/src/go/collectors/go.d.plugin/config/go.d/k8s_kubeproxy.conf +++ b/src/go/plugin/go.d/config/go.d/k8s_kubeproxy.conf @@ -1,5 +1,5 @@ ## All available configuration options, their descriptions and default values: -## https://github.com/netdata/netdata/tree/master/src/go/collectors/go.d.plugin/modules/k8s_kubeproxy#readme +## https://github.com/netdata/netdata/tree/master/src/go/plugin/go.d/modules/k8s_kubeproxy#readme #jobs: # - url: http://127.0.0.1:10249/metrics diff --git a/src/go/collectors/go.d.plugin/config/go.d/k8s_state.conf b/src/go/plugin/go.d/config/go.d/k8s_state.conf index 3389d42bb..fd1c305e0 100644 --- a/src/go/collectors/go.d.plugin/config/go.d/k8s_state.conf +++ b/src/go/plugin/go.d/config/go.d/k8s_state.conf @@ -1,5 +1,5 @@ ## All available configuration options, their descriptions and default values: -## https://github.com/netdata/netdata/tree/master/src/go/collectors/go.d.plugin/modules/k8s_state#readme +## https://github.com/netdata/netdata/tree/master/src/go/plugin/go.d/modules/k8s_state#readme jobs: - name: k8s_state diff --git a/src/go/collectors/go.d.plugin/config/go.d/lighttpd.conf b/src/go/plugin/go.d/config/go.d/lighttpd.conf index 1a7c29bb1..51866bfb7 100644 --- a/src/go/collectors/go.d.plugin/config/go.d/lighttpd.conf +++ b/src/go/plugin/go.d/config/go.d/lighttpd.conf @@ -1,5 +1,5 @@ ## All available configuration options, their descriptions and default values: -## https://github.com/netdata/netdata/tree/master/src/go/collectors/go.d.plugin/modules/lighttpd#readme +## https://github.com/netdata/netdata/tree/master/src/go/plugin/go.d/modules/lighttpd#readme #jobs: # - name: local diff --git a/src/go/collectors/go.d.plugin/config/go.d/litespeed.conf b/src/go/plugin/go.d/config/go.d/litespeed.conf index aa321ad21..c525ff0ac 100644 --- a/src/go/collectors/go.d.plugin/config/go.d/litespeed.conf +++ b/src/go/plugin/go.d/config/go.d/litespeed.conf @@ -1,5 +1,5 @@ ## All available configuration options, their descriptions and default values: -## https://github.com/netdata/netdata/tree/master/src/go/collectors/go.d.plugin/modules/litespeed#readme +## https://github.com/netdata/netdata/tree/master/src/go/plugin/go.d/modules/litespeed#readme jobs: - name: local diff --git a/src/go/collectors/go.d.plugin/config/go.d/logind.conf b/src/go/plugin/go.d/config/go.d/logind.conf index 170c400b4..219b37ae2 100644 --- a/src/go/collectors/go.d.plugin/config/go.d/logind.conf +++ b/src/go/plugin/go.d/config/go.d/logind.conf @@ -1,5 +1,5 @@ ## All available configuration options, their descriptions and default values: -## https://github.com/netdata/netdata/tree/master/src/go/collectors/go.d.plugin/modules/logind#readme +## https://github.com/netdata/netdata/tree/master/src/go/plugin/go.d/modules/logind#readme jobs: - name: logind diff --git a/src/go/collectors/go.d.plugin/config/go.d/logstash.conf b/src/go/plugin/go.d/config/go.d/logstash.conf index f1586e6aa..c67819e13 100644 --- a/src/go/collectors/go.d.plugin/config/go.d/logstash.conf +++ b/src/go/plugin/go.d/config/go.d/logstash.conf @@ -1,5 +1,5 @@ ## All available configuration options, their descriptions and default values: -## https://github.com/netdata/netdata/tree/master/src/go/collectors/go.d.plugin/modules/logstash#readme +## https://github.com/netdata/netdata/tree/master/src/go/plugin/go.d/modules/logstash#readme #jobs: # - name: local diff --git a/src/go/collectors/go.d.plugin/config/go.d/lvm.conf b/src/go/plugin/go.d/config/go.d/lvm.conf index 883c37cfd..54da37b1a 100644 --- a/src/go/collectors/go.d.plugin/config/go.d/lvm.conf +++ b/src/go/plugin/go.d/config/go.d/lvm.conf @@ -1,5 +1,5 @@ ## All available configuration options, their descriptions and default values: -## https://github.com/netdata/netdata/tree/master/src/go/collectors/go.d.plugin/modules/lvm#readme +## https://github.com/netdata/netdata/tree/master/src/go/plugin/go.d/modules/lvm#readme jobs: - name: lvm diff --git a/src/go/collectors/go.d.plugin/config/go.d/megacli.conf b/src/go/plugin/go.d/config/go.d/megacli.conf index db0d43e47..8d26763b7 100644 --- a/src/go/collectors/go.d.plugin/config/go.d/megacli.conf +++ b/src/go/plugin/go.d/config/go.d/megacli.conf @@ -1,5 +1,5 @@ ## All available configuration options, their descriptions and default values: -## https://github.com/netdata/netdata/tree/master/src/go/collectors/go.d.plugin/modules/megacli#readme +## https://github.com/netdata/netdata/tree/master/src/go/plugin/go.d/modules/megacli#readme jobs: - name: megacli diff --git a/src/go/plugin/go.d/config/go.d/memcached.conf b/src/go/plugin/go.d/config/go.d/memcached.conf new file mode 100644 index 000000000..60603be28 --- /dev/null +++ b/src/go/plugin/go.d/config/go.d/memcached.conf @@ -0,0 +1,6 @@ +## All available configuration options, their descriptions and default values: +## https://github.com/netdata/netdata/tree/master/src/go/plugin/go.d/modules/memcached#readme + +#jobs: +# - name: local +# address: 127.0.0.1:11211 diff --git a/src/go/collectors/go.d.plugin/config/go.d/mongodb.conf b/src/go/plugin/go.d/config/go.d/mongodb.conf index 1e5c024ac..ae41e4c73 100644 --- a/src/go/collectors/go.d.plugin/config/go.d/mongodb.conf +++ b/src/go/plugin/go.d/config/go.d/mongodb.conf @@ -1,5 +1,5 @@ ## All available configuration options, their descriptions and default values: -## https://github.com/netdata/netdata/tree/master/src/go/collectors/go.d.plugin/modules/mongodb#readme +## https://github.com/netdata/netdata/tree/master/src/go/plugin/go.d/modules/mongodb#readme #jobs: # - name: local diff --git a/src/go/plugin/go.d/config/go.d/monit.conf b/src/go/plugin/go.d/config/go.d/monit.conf new file mode 100644 index 000000000..e7768d618 --- /dev/null +++ b/src/go/plugin/go.d/config/go.d/monit.conf @@ -0,0 +1,6 @@ +## All available configuration options, their descriptions and default values: +## https://github.com/netdata/netdata/tree/master/src/go/plugin/go.d/modules/monit#readme + +#jobs: +# - name: local +# url: http://127.0.0.1:2812 diff --git a/src/go/collectors/go.d.plugin/config/go.d/mysql.conf b/src/go/plugin/go.d/config/go.d/mysql.conf index 036d797e4..bdba6df76 100644 --- a/src/go/collectors/go.d.plugin/config/go.d/mysql.conf +++ b/src/go/plugin/go.d/config/go.d/mysql.conf @@ -1,5 +1,5 @@ ## All available configuration options, their descriptions and default values: -## https://github.com/netdata/netdata/tree/master/src/go/collectors/go.d.plugin/modules/mysql#readme +## https://github.com/netdata/netdata/tree/master/src/go/plugin/go.d/modules/mysql#readme #jobs: # - name: local diff --git a/src/go/collectors/go.d.plugin/config/go.d/nginx.conf b/src/go/plugin/go.d/config/go.d/nginx.conf index 2c9346b83..03b56d238 100644 --- a/src/go/collectors/go.d.plugin/config/go.d/nginx.conf +++ b/src/go/plugin/go.d/config/go.d/nginx.conf @@ -1,5 +1,5 @@ ## All available configuration options, their descriptions and default values: -## https://github.com/netdata/netdata/tree/master/src/go/collectors/go.d.plugin/modules/nginx#readme +## https://github.com/netdata/netdata/tree/master/src/go/plugin/go.d/modules/nginx#readme #jobs: # - name: local diff --git a/src/go/collectors/go.d.plugin/config/go.d/nginxplus.conf b/src/go/plugin/go.d/config/go.d/nginxplus.conf index d10141c84..f0c022853 100644 --- a/src/go/collectors/go.d.plugin/config/go.d/nginxplus.conf +++ b/src/go/plugin/go.d/config/go.d/nginxplus.conf @@ -1,5 +1,5 @@ ## All available configuration options, their descriptions and default values: -## https://github.com/netdata/netdata/tree/master/src/go/collectors/go.d.plugin/modules/nginxplus#readme +## https://github.com/netdata/netdata/tree/master/src/go/plugin/go.d/modules/nginxplus#readme #jobs: # - name: local diff --git a/src/go/collectors/go.d.plugin/config/go.d/nginxvts.conf b/src/go/plugin/go.d/config/go.d/nginxvts.conf index 9b8dcde0a..1b4ea7f1e 100644 --- a/src/go/collectors/go.d.plugin/config/go.d/nginxvts.conf +++ b/src/go/plugin/go.d/config/go.d/nginxvts.conf @@ -1,5 +1,5 @@ ## All available configuration options, their descriptions and default values: -## https://github.com/netdata/netdata/tree/master/src/go/collectors/go.d.plugin/modules/nginxvts#readme +## https://github.com/netdata/netdata/tree/master/src/go/plugin/go.d/modules/nginxvts#readme #jobs: # - name: local diff --git a/src/go/plugin/go.d/config/go.d/nsd.conf b/src/go/plugin/go.d/config/go.d/nsd.conf new file mode 100644 index 000000000..b3c0a7868 --- /dev/null +++ b/src/go/plugin/go.d/config/go.d/nsd.conf @@ -0,0 +1,5 @@ +## All available configuration options, their descriptions and default values: +## https://github.com/netdata/netdata/tree/master/src/go/plugin/go.d/modules/nsd#readme + +jobs: + - name: nsd diff --git a/src/go/collectors/go.d.plugin/config/go.d/ntpd.conf b/src/go/plugin/go.d/config/go.d/ntpd.conf index c999fa2f9..d607450a5 100644 --- a/src/go/collectors/go.d.plugin/config/go.d/ntpd.conf +++ b/src/go/plugin/go.d/config/go.d/ntpd.conf @@ -1,5 +1,5 @@ ## All available configuration options, their descriptions and default values: -## https://github.com/netdata/netdata/tree/master/src/go/collectors/go.d.plugin/modules/ntpd#readme +## https://github.com/netdata/netdata/tree/master/src/go/plugin/go.d/modules/ntpd#readme #jobs: # - name: local diff --git a/src/go/collectors/go.d.plugin/config/go.d/nvidia_smi.conf b/src/go/plugin/go.d/config/go.d/nvidia_smi.conf index e166d789a..4c1e01a40 100644 --- a/src/go/collectors/go.d.plugin/config/go.d/nvidia_smi.conf +++ b/src/go/plugin/go.d/config/go.d/nvidia_smi.conf @@ -1,5 +1,5 @@ ## All available configuration options, their descriptions and default values: -## https://github.com/netdata/netdata/tree/master/src/go/collectors/go.d.plugin/modules/nvidia_smi#readme +## https://github.com/netdata/netdata/tree/master/src/go/plugin/go.d/modules/nvidia_smi#readme jobs: - name: nvidia_smi diff --git a/src/go/collectors/go.d.plugin/config/go.d/nvme.conf b/src/go/plugin/go.d/config/go.d/nvme.conf index c419b6a0c..ef0146265 100644 --- a/src/go/collectors/go.d.plugin/config/go.d/nvme.conf +++ b/src/go/plugin/go.d/config/go.d/nvme.conf @@ -1,5 +1,5 @@ ## All available configuration options, their descriptions and default values: -## https://github.com/netdata/netdata/tree/master/src/go/collectors/go.d.plugin/modules/nvme#readme +## https://github.com/netdata/netdata/tree/master/src/go/plugin/go.d/modules/nvme#readme jobs: - name: nvme diff --git a/src/go/collectors/go.d.plugin/config/go.d/openvpn.conf b/src/go/plugin/go.d/config/go.d/openvpn.conf index 297244bfb..0bc65018e 100644 --- a/src/go/collectors/go.d.plugin/config/go.d/openvpn.conf +++ b/src/go/plugin/go.d/config/go.d/openvpn.conf @@ -1,5 +1,5 @@ ## All available configuration options, their descriptions and default values: -## https://github.com/netdata/netdata/tree/master/src/go/collectors/go.d.plugin/modules/openvpn#readme +## https://github.com/netdata/netdata/tree/master/src/go/plugin/go.d/modules/openvpn#readme #jobs: # - name: local diff --git a/src/go/collectors/go.d.plugin/config/go.d/openvpn_status_log.conf b/src/go/plugin/go.d/config/go.d/openvpn_status_log.conf index 47e723e0b..ae401780c 100644 --- a/src/go/collectors/go.d.plugin/config/go.d/openvpn_status_log.conf +++ b/src/go/plugin/go.d/config/go.d/openvpn_status_log.conf @@ -1,5 +1,5 @@ ## All available configuration options, their descriptions and default values: -## https://github.com/netdata/netdata/tree/master/src/go/collectors/go.d.plugin/modules/openvpn_status_log#readme +## https://github.com/netdata/netdata/tree/master/src/go/plugin/go.d/modules/openvpn_status_log#readme jobs: - name: local diff --git a/src/go/collectors/go.d.plugin/config/go.d/pgbouncer.conf b/src/go/plugin/go.d/config/go.d/pgbouncer.conf index de4f2dc94..fdc067d77 100644 --- a/src/go/collectors/go.d.plugin/config/go.d/pgbouncer.conf +++ b/src/go/plugin/go.d/config/go.d/pgbouncer.conf @@ -1,5 +1,5 @@ ## All available configuration options, their descriptions and default values: -## https://github.com/netdata/netdata/tree/master/src/go/collectors/go.d.plugin/modules/pgbouncer#readme +## https://github.com/netdata/netdata/tree/master/src/go/plugin/go.d/modules/pgbouncer#readme jobs: - name: local diff --git a/src/go/collectors/go.d.plugin/config/go.d/phpdaemon.conf b/src/go/plugin/go.d/config/go.d/phpdaemon.conf index 3663fc18a..2bd8c1398 100644 --- a/src/go/collectors/go.d.plugin/config/go.d/phpdaemon.conf +++ b/src/go/plugin/go.d/config/go.d/phpdaemon.conf @@ -1,5 +1,5 @@ ## All available configuration options, their descriptions and default values: -## https://github.com/netdata/netdata/tree/master/src/go/collectors/go.d.plugin/modules/phpdaemon#readme +## https://github.com/netdata/netdata/tree/master/src/go/plugin/go.d/modules/phpdaemon#readme #jobs: # - name: local diff --git a/src/go/collectors/go.d.plugin/config/go.d/phpfpm.conf b/src/go/plugin/go.d/config/go.d/phpfpm.conf index 476f9ab12..a159a5e40 100644 --- a/src/go/collectors/go.d.plugin/config/go.d/phpfpm.conf +++ b/src/go/plugin/go.d/config/go.d/phpfpm.conf @@ -1,5 +1,5 @@ ## All available configuration options, their descriptions and default values: -## https://github.com/netdata/netdata/tree/master/src/go/collectors/go.d.plugin/modules/phpfpm#readme +## https://github.com/netdata/netdata/tree/master/src/go/plugin/go.d/modules/phpfpm#readme #jobs: # - name: local diff --git a/src/go/collectors/go.d.plugin/config/go.d/pihole.conf b/src/go/plugin/go.d/config/go.d/pihole.conf index f92c39e87..3ff57d9ae 100644 --- a/src/go/collectors/go.d.plugin/config/go.d/pihole.conf +++ b/src/go/plugin/go.d/config/go.d/pihole.conf @@ -1,5 +1,5 @@ ## All available configuration options, their descriptions and default values: -## https://github.com/netdata/netdata/tree/master/src/go/collectors/go.d.plugin/modules/pihole#readme +## https://github.com/netdata/netdata/tree/master/src/go/plugin/go.d/modules/pihole#readme #jobs: # - name: pihole diff --git a/src/go/collectors/go.d.plugin/config/go.d/pika.conf b/src/go/plugin/go.d/config/go.d/pika.conf index 893b5520b..9f23d8609 100644 --- a/src/go/collectors/go.d.plugin/config/go.d/pika.conf +++ b/src/go/plugin/go.d/config/go.d/pika.conf @@ -1,5 +1,5 @@ ## All available configuration options, their descriptions and default values: -## https://github.com/netdata/netdata/tree/master/src/go/collectors/go.d.plugin/modules/pika#readme +## https://github.com/netdata/netdata/tree/master/src/go/plugin/go.d/modules/pika#readme #jobs: # - name: local diff --git a/src/go/collectors/go.d.plugin/config/go.d/ping.conf b/src/go/plugin/go.d/config/go.d/ping.conf index 4e84d34ed..b87719ced 100644 --- a/src/go/collectors/go.d.plugin/config/go.d/ping.conf +++ b/src/go/plugin/go.d/config/go.d/ping.conf @@ -1,5 +1,5 @@ ## All available configuration options, their descriptions and default values: -## https://github.com/netdata/netdata/tree/master/src/go/collectors/go.d.plugin/modules/ping#readme +## https://github.com/netdata/netdata/tree/master/src/go/plugin/go.d/modules/ping#readme #jobs: # - name: example diff --git a/src/go/collectors/go.d.plugin/config/go.d/portcheck.conf b/src/go/plugin/go.d/config/go.d/portcheck.conf index ffa794ffc..0800c9eeb 100644 --- a/src/go/collectors/go.d.plugin/config/go.d/portcheck.conf +++ b/src/go/plugin/go.d/config/go.d/portcheck.conf @@ -1,5 +1,5 @@ ## All available configuration options, their descriptions and default values: -## https://github.com/netdata/netdata/tree/master/src/go/collectors/go.d.plugin/modules/portcheck#readme +## https://github.com/netdata/netdata/tree/master/src/go/plugin/go.d/modules/portcheck#readme #jobs: # - name: job1 diff --git a/src/go/plugin/go.d/config/go.d/postfix.conf b/src/go/plugin/go.d/config/go.d/postfix.conf new file mode 100644 index 000000000..5eda59658 --- /dev/null +++ b/src/go/plugin/go.d/config/go.d/postfix.conf @@ -0,0 +1,12 @@ +## All available configuration options, their descriptions and default values: +## https://github.com/netdata/netdata/tree/master/src/go/plugin/go.d/modules/postfix#readme + +jobs: + - name: local + binary_path: /usr/sbin/postqueue + + - name: local + binary_path: /usr/local/sbin/postqueue # FreeBSD + + - name: local + binary_path: postqueue diff --git a/src/go/collectors/go.d.plugin/config/go.d/postgres.conf b/src/go/plugin/go.d/config/go.d/postgres.conf index b684b70e8..8911d82b7 100644 --- a/src/go/collectors/go.d.plugin/config/go.d/postgres.conf +++ b/src/go/plugin/go.d/config/go.d/postgres.conf @@ -1,5 +1,5 @@ ## All available configuration options, their descriptions and default values: -## https://github.com/netdata/netdata/tree/master/src/go/collectors/go.d.plugin/modules/postgres#readme +## https://github.com/netdata/netdata/tree/master/src/go/plugin/go.d/modules/postgres#readme #jobs: # - name: local diff --git a/src/go/collectors/go.d.plugin/config/go.d/powerdns.conf b/src/go/plugin/go.d/config/go.d/powerdns.conf index ad449f8fa..dd543c8a8 100644 --- a/src/go/collectors/go.d.plugin/config/go.d/powerdns.conf +++ b/src/go/plugin/go.d/config/go.d/powerdns.conf @@ -1,5 +1,5 @@ ## All available configuration options, their descriptions and default values: -## https://github.com/netdata/netdata/tree/master/src/go/collectors/go.d.plugin/modules/powerdns#readme +## https://github.com/netdata/netdata/tree/master/src/go/plugin/go.d/modules/powerdns#readme #jobs: # - name: local diff --git a/src/go/collectors/go.d.plugin/config/go.d/powerdns_recursor.conf b/src/go/plugin/go.d/config/go.d/powerdns_recursor.conf index 73592fb4d..19f044c6c 100644 --- a/src/go/collectors/go.d.plugin/config/go.d/powerdns_recursor.conf +++ b/src/go/plugin/go.d/config/go.d/powerdns_recursor.conf @@ -1,5 +1,5 @@ ## All available configuration options, their descriptions and default values: -## https://github.com/netdata/netdata/tree/master/src/go/collectors/go.d.plugin/modules/powerdns_recursor#readme +## https://github.com/netdata/netdata/tree/master/src/go/plugin/go.d/modules/powerdns_recursor#readme #jobs: # - name: local diff --git a/src/go/collectors/go.d.plugin/config/go.d/prometheus.conf b/src/go/plugin/go.d/config/go.d/prometheus.conf index 4934e2f69..ef051dff6 100644 --- a/src/go/collectors/go.d.plugin/config/go.d/prometheus.conf +++ b/src/go/plugin/go.d/config/go.d/prometheus.conf @@ -1,5 +1,5 @@ ## All available configuration options, their descriptions and default values: -## https://github.com/netdata/netdata/tree/master/src/go/collectors/go.d.plugin/modules/prometheus#readme +## https://github.com/netdata/netdata/tree/master/src/go/plugin/go.d/modules/prometheus#readme #jobs: # - name: node_exporter_local diff --git a/src/go/collectors/go.d.plugin/config/go.d/proxysql.conf b/src/go/plugin/go.d/config/go.d/proxysql.conf index 36687b243..d97bf3285 100644 --- a/src/go/collectors/go.d.plugin/config/go.d/proxysql.conf +++ b/src/go/plugin/go.d/config/go.d/proxysql.conf @@ -1,5 +1,5 @@ ## All available configuration options, their descriptions and default values: -## https://github.com/netdata/netdata/tree/master/src/go/collectors/go.d.plugin/modules/proxysql#readme +## https://github.com/netdata/netdata/tree/master/src/go/plugin/go.d/modules/proxysql#readme #jobs: # - name: local diff --git a/src/go/collectors/go.d.plugin/config/go.d/pulsar.conf b/src/go/plugin/go.d/config/go.d/pulsar.conf index 607c966c3..5dea6ade3 100644 --- a/src/go/collectors/go.d.plugin/config/go.d/pulsar.conf +++ b/src/go/plugin/go.d/config/go.d/pulsar.conf @@ -1,5 +1,5 @@ ## All available configuration options, their descriptions and default values: -## https://github.com/netdata/netdata/tree/master/src/go/collectors/go.d.plugin/modules/pulsar#readme +## https://github.com/netdata/netdata/tree/master/src/go/plugin/go.d/modules/pulsar#readme #jobs: # - name: local diff --git a/src/go/plugin/go.d/config/go.d/puppet.conf b/src/go/plugin/go.d/config/go.d/puppet.conf new file mode 100644 index 000000000..09e64b7d0 --- /dev/null +++ b/src/go/plugin/go.d/config/go.d/puppet.conf @@ -0,0 +1,7 @@ +## All available configuration options, their descriptions and default values: +## https://github.com/netdata/netdata/tree/master/src/go/plugin/go.d/modules/puppet#readme + +#jobs: +# - name: local +# url: https://127.0.0.1:8140 +# tls_skip_verify: yes
\ No newline at end of file diff --git a/src/go/collectors/go.d.plugin/config/go.d/rabbitmq.conf b/src/go/plugin/go.d/config/go.d/rabbitmq.conf index 44c5db882..e64a75662 100644 --- a/src/go/collectors/go.d.plugin/config/go.d/rabbitmq.conf +++ b/src/go/plugin/go.d/config/go.d/rabbitmq.conf @@ -1,5 +1,5 @@ ## All available configuration options, their descriptions and default values: -## https://github.com/netdata/netdata/tree/master/src/go/collectors/go.d.plugin/modules/rabbitmq#readme +## https://github.com/netdata/netdata/tree/master/src/go/plugin/go.d/modules/rabbitmq#readme #jobs: # - name: local diff --git a/src/go/collectors/go.d.plugin/config/go.d/redis.conf b/src/go/plugin/go.d/config/go.d/redis.conf index f06742d6d..8910b1547 100644 --- a/src/go/collectors/go.d.plugin/config/go.d/redis.conf +++ b/src/go/plugin/go.d/config/go.d/redis.conf @@ -1,5 +1,5 @@ ## All available configuration options, their descriptions and default values: -## https://github.com/netdata/netdata/tree/master/src/go/collectors/go.d.plugin/modules/redis#readme +## https://github.com/netdata/netdata/tree/master/src/go/plugin/go.d/modules/redis#readme jobs: - name: local diff --git a/src/go/plugin/go.d/config/go.d/rethinkdb.conf b/src/go/plugin/go.d/config/go.d/rethinkdb.conf new file mode 100644 index 000000000..7d0502aca --- /dev/null +++ b/src/go/plugin/go.d/config/go.d/rethinkdb.conf @@ -0,0 +1,6 @@ +## All available configuration options, their descriptions and default values: +## https://github.com/netdata/netdata/tree/master/src/go/plugin/go.d/modules/rethinkdb#readme + +#jobs: +# - name: local +# address: 127.0.0.1:28015 diff --git a/src/go/plugin/go.d/config/go.d/riakkv.conf b/src/go/plugin/go.d/config/go.d/riakkv.conf new file mode 100644 index 000000000..35f3b468f --- /dev/null +++ b/src/go/plugin/go.d/config/go.d/riakkv.conf @@ -0,0 +1,6 @@ +## All available configuration options, their descriptions and default values: +## https://github.com/netdata/netdata/tree/master/src/go/plugin/go.d/modules/riakkv#readme + +#jobs: +# - name: local +# url: http://127.0.0.1:8098/stats diff --git a/src/go/collectors/go.d.plugin/config/go.d/rspamd.conf b/src/go/plugin/go.d/config/go.d/rspamd.conf index fe4424768..f4db129ca 100644 --- a/src/go/collectors/go.d.plugin/config/go.d/rspamd.conf +++ b/src/go/plugin/go.d/config/go.d/rspamd.conf @@ -1,5 +1,5 @@ ## All available configuration options, their descriptions and default values: -## https://github.com/netdata/netdata/tree/master/src/go/collectors/go.d.plugin/modules/rspamd#readme +## https://github.com/netdata/netdata/tree/master/src/go/plugin/go.d/modules/rspamd#readme #jobs: # - name: local diff --git a/src/go/collectors/go.d.plugin/config/go.d/scaleio.conf b/src/go/plugin/go.d/config/go.d/scaleio.conf index d2f4d838b..9db85cc4d 100644 --- a/src/go/collectors/go.d.plugin/config/go.d/scaleio.conf +++ b/src/go/plugin/go.d/config/go.d/scaleio.conf @@ -1,5 +1,5 @@ ## All available configuration options, their descriptions and default values: -## https://github.com/netdata/netdata/tree/master/src/go/collectors/go.d.plugin/modules/scaleio#readme +## https://github.com/netdata/netdata/tree/master/src/go/plugin/go.d/modules/scaleio#readme #jobs: # - name : local diff --git a/src/go/collectors/go.d.plugin/config/go.d/sd/docker.conf b/src/go/plugin/go.d/config/go.d/sd/docker.conf index b0f1a3aa9..c93fbef87 100644 --- a/src/go/collectors/go.d.plugin/config/go.d/sd/docker.conf +++ b/src/go/plugin/go.d/config/go.d/sd/docker.conf @@ -26,6 +26,8 @@ classify: match: - tags: "apache" expr: '{{ match "sp" .Image "httpd httpd:* */apache */apache:* */apache2 */apache2:*" }}' + - tags: "beanstalk" + expr: '{{ match "sp" .Image "*/beanstalkd */beanstalkd:*" }}' - tags: "cockroachdb" expr: '{{ match "sp" .Image "cockroachdb/cockroach cockroachdb/cockroach:*" }}' - tags: "consul" @@ -36,10 +38,18 @@ classify: expr: '{{ or (eq .PrivatePort "8091") (match "sp" .Image "couchbase couchbase:*") }}' - tags: "couchdb" expr: '{{ or (eq .PrivatePort "5984") (match "sp" .Image "couchdb couchdb:*") }}' + - tags: "dovecot" + expr: '{{ or (eq .PrivatePort "24242") (match "sp" .Image "*/dovecot */dovecot:*") }}' - tags: "elasticsearch" expr: '{{ or (eq .PrivatePort "9200") (match "sp" .Image "elasticsearch elasticsearch:* */elasticsearch */elasticsearch:* */opensearch */opensearch:*") }}' + - tags: "gearman" + expr: '{{ and (eq .PrivatePort "4730") (match "sp" .Image "*/gearmand */gearmand:*") }}' + - tags: "ipfs" + expr: '{{ and (eq .PrivatePort "5001") (match "sp" .Image "ipfs/kubo ipfs/kubo:*") }}' - tags: "lighttpd" expr: '{{ match "sp" .Image "*/lighttpd */lighttpd:*" }}' + - tags: "memcached" + expr: '{{ or (eq .PrivatePort "11211") (match "sp" .Image "memcached memcached:* */memcached */memcached:*") }}' - tags: "mongodb" expr: '{{ or (eq .PrivatePort "27017") (match "sp" .Image "mongo mongo:* */mongodb */mongodb:* */mongodb-community-server */mongodb-community-server:*") }}' - tags: "mysql" @@ -54,12 +64,22 @@ classify: expr: '{{ or (eq .PrivatePort "5432") (match "sp" .Image "postgres postgres:* */postgres */postgres:* */postgresql */postgresql:*") }}' - tags: "proxysql" expr: '{{ or (eq .PrivatePort "6032") (match "sp" .Image "*/proxysql */proxysql:*") }}' + - tags: "puppet" + expr: '{{ or (eq .PrivatePort "8140") (match "sp" .Image "puppet/puppetserver puppet/puppetserver:*") }}' - tags: "rabbitmq" expr: '{{ or (eq .PrivatePort "15672") (match "sp" .Image "rabbitmq rabbitmq:* */rabbitmq */rabbitmq:*") }}' - tags: "redis" expr: '{{ or (eq .PrivatePort "6379") (match "sp" .Image "redis redis:* */redis */redis:*") }}' + - tags: "rethinkdb" + expr: '{{ and (eq .PrivatePort "28015") (match "sp" .Image "rethinkdb rethinkdb:* */rethinkdb */rethinkdb:*") }}' + - tags: "squid" + expr: '{{ match "sp" .Image "*/squid */squid:*" }}' - tags: "tengine" expr: '{{ match "sp" .Image "*/tengine */tengine:*" }}' + - tags: "tor" + expr: '{{ and (eq .PrivatePort "9051") (match "sp" .Image "*/tor */tor:*") }}' + - tags: "tomcat" + expr: '{{ match "sp" .Image "tomcat tomcat:* */tomcat */tomcat:*" }}' - tags: "vernemq" expr: '{{ match "sp" .Image "*/vernemq */vernemq:*" }}' - tags: "zookeeper" @@ -73,6 +93,11 @@ compose: module: apache name: docker_{{.Name}} url: http://{{.Address}}/server-status?auto + - selector: "beanstalk" + template: | + module: beanstalk + name: docker_{{.Name}} + address: {{.Address}} - selector: "cockroachdb" template: | module: cockroachdb @@ -103,6 +128,11 @@ compose: module: couchdb name: docker_{{.Name}} url: http://{{.Address}} + - selector: "dovecot" + template: | + module: dovecot + name: docker_{{.Name}} + address: {{.Address}} - selector: "elasticsearch" template: | module: elasticsearch @@ -115,11 +145,26 @@ compose: username: admin password: admin {{ end -}} + - selector: "gearman" + template: | + module: gearman + name: docker_{{.Name}} + address: {{.Address}} + - selector: "ipfs" + template: | + module: ipfs + name: docker_{{.Name}} + url: http://{{.Address}} - selector: "lighttpd" template: | module: lighttpd name: docker_{{.Name}} url: http://{{.Address}}/server-status?auto + - selector: "memcached" + template: | + module: memcached + name: docker_{{.Name}} + address: {{.Address}} - selector: "mongodb" template: | module: mongodb @@ -154,6 +199,11 @@ compose: module: pika name: docker_{{.Name}} address: redis://@{{.Address}} + - selector: "rethinkdb" + template: | + module: rethinkdb + name: docker_{{.Name}} + address: {{.Address}} - selector: "postgres" template: | module: postgres @@ -164,6 +214,12 @@ compose: module: proxysql name: docker_{{.Name}} dsn: stats:stats@tcp({{.Address}})/ + - selector: "puppet" + template: | + module: puppet + name: docker_{{.Name}} + url: https://{{.Address}} + tls_skip_verify: yes - selector: "rabbitmq" template: | module: rabbitmq @@ -174,11 +230,26 @@ compose: module: redis name: docker_{{.Name}} address: redis://@{{.Address}} + - selector: "squid" + template: | + module: squid + name: docker_{{.Name}} + url: http://{{.Address}} - selector: "tengine" template: | module: tengine name: docker_{{.Name}} url: http://{{.Address}}/us + - selector: "tomcat" + template: | + module: tomcat + name: docker_{{.Name}} + url: http://{{.Address}} + - selector: "tor" + template: | + module: tor + name: docker_{{.Name}} + address: {{.Address}} - selector: "vernemq" template: | module: vernemq @@ -186,6 +257,6 @@ compose: url: http://{{.Address}}/metrics - selector: "zookeeper" template: | - module: vernemq + module: zookeeper name: docker_{{.Name}} address: {{.Address}} diff --git a/src/go/collectors/go.d.plugin/config/go.d/sd/net_listeners.conf b/src/go/plugin/go.d/config/go.d/sd/net_listeners.conf index 8d59c0dcb..4462fc112 100644 --- a/src/go/collectors/go.d.plugin/config/go.d/sd/net_listeners.conf +++ b/src/go/plugin/go.d/config/go.d/sd/net_listeners.conf @@ -16,6 +16,8 @@ classify: expr: '{{ and (eq .Port "8161") (eq .Comm "activemq") }}' - tags: "apache" expr: '{{ and (eq .Port "80" "8080") (eq .Comm "apache" "apache2" "httpd") }}' + - tags: "beanstalk" + expr: '{{ or (eq .Port "11300") (eq .Comm "beanstalkd") }}' - tags: "bind" expr: '{{ and (eq .Port "8653") (eq .Comm "bind" "named") }}' - tags: "cassandra" @@ -40,6 +42,8 @@ classify: expr: '{{ and (eq .Protocol "UDP") (eq .Port "53") (eq .Comm "dnsmasq") }}' - tags: "docker_engine" expr: '{{ and (eq .Port "9323") (eq .Comm "dockerd") }}' + - tags: "dovecot" + expr: '{{ and (eq .Port "24242") (eq .Comm "dovecot") }}' - tags: "elasticsearch" expr: '{{ or (eq .Port "9200") (glob .Cmdline "*elasticsearch*" "*opensearch*") }}' - tags: "envoy" @@ -48,6 +52,8 @@ classify: expr: '{{ and (eq .Port "24220") (glob .Cmdline "*fluentd*") }}' - tags: "freeradius" expr: '{{ and (eq .Port "18121") (eq .Comm "freeradius") }}' + - tags: "gearman" + expr: '{{ or (eq .Port "4730") (eq .Comm "gearmand") }}' - tags: "geth" expr: '{{ and (eq .Port "6060") (eq .Comm "geth") }}' - tags: "haproxy" @@ -58,6 +64,10 @@ classify: expr: '{{ and (eq .Port "9870") (eq .Comm "hadoop") }}' - tags: "hdfs_datanode" expr: '{{ and (eq .Port "9864") (eq .Comm "hadoop") }}' + - tags: "icecast" + expr: '{{ and (eq .Port "8000") (eq .Comm "icecast") }}' + - tags: "ipfs" + expr: '{{ and (eq .Port "5001") (eq .Comm "ipfs") }}' - tags: "kubelet" expr: '{{ and (eq .Port "10250" "10255") (eq .Comm "kubelet") }}' - tags: "kubeproxy" @@ -66,8 +76,12 @@ classify: expr: '{{ and (eq .Port "80" "8080") (eq .Comm "lighttpd") }}' - tags: "logstash" expr: '{{ and (eq .Port "9600") (glob .Cmdline "*logstash*") }}' + - tags: "memcached" + expr: '{{ or (eq .Port "11211") (eq .Comm "memcached") }}' - tags: "mongodb" expr: '{{ or (eq .Port "27017") (eq .Comm "mongod") }}' + - tags: "monit" + expr: '{{ or (eq .Port "2812") (eq .Comm "monit") }}' - tags: "mysql" expr: '{{ or (eq .Port "3306") (eq .Comm "mysqld" "mariadbd") }}' - tags: "nginx" @@ -90,20 +104,34 @@ classify: expr: '{{ and (eq .Port "8081") (eq .Comm "pdns_recursor") }}' - tags: "proxysql" expr: '{{ or (eq .Port "6032") (eq .Comm "proxysql") }}' + - tags: "puppet" + expr: '{{ or (eq .Port "8140") (glob .Cmdline "*puppet-server*") }}' - tags: "rabbitmq" expr: '{{ or (eq .Port "15672") (glob .Cmdline "*rabbitmq*") }}' - tags: "redis" expr: '{{ or (eq .Port "6379") (eq .Comm "redis-server") }}' + - tags: "rethinkdb" + expr: '{{ and (eq .Port "28015") (eq .Comm "rethinkdb") }}' + - tags: "riak" + expr: '{{ and (eq .Port "8098") (glob .Cmdline "*riak*") }}' - tags: "rspamd" expr: '{{ and (eq .Port "11334") (eq .Comm "rspamd") }}' + - tags: "squid" + expr: '{{ and (eq .Port "3128") (eq .Comm "squid") }}' - tags: "supervisord" expr: '{{ and (eq .Port "9001") (eq .Comm "supervisord") }}' + - tags: "tomcat" + expr: '{{ and (eq .Port "8080") (glob .Cmdline "*tomcat*") }}' + - tags: "tor" + expr: '{{ and (eq .Port "9051") (eq .Comm "tor") }}' - tags: "traefik" expr: '{{ and (eq .Port "80" "8080") (eq .Comm "traefik") }}' - tags: "unbound" expr: '{{ and (eq .Port "8953") (eq .Comm "unbound") }}' - tags: "upsd" expr: '{{ or (eq .Port "3493") (eq .Comm "upsd") }}' + - tags: "uwsgi" + expr: '{{ and (eq .Port "1717") (eq .Comm "uwsgi") }}' - tags: "vernemq" expr: '{{ and (eq .Port "8888") (glob .Cmdline "*vernemq*") }}' - tags: "zookeeper" @@ -129,6 +157,11 @@ compose: module: apache name: local url: http://{{.Address}}/server-status?auto + - selector: "beanstalk" + template: | + module: beanstalk + name: local + address: {{.Address}} - selector: "bind" template: | module: bind @@ -193,6 +226,11 @@ compose: module: docker_engine name: local url: http://{{.Address}}/metrics + - selector: "dovecot" + template: | + module: dovecot + name: local + address: {{.Address}} - selector: "elasticsearch" template: | module: elasticsearch @@ -227,6 +265,11 @@ compose: address: {{.IPAddress}} port: {{.Port}} secret: adminsecret + - selector: "gearman" + template: | + module: gearman + name: local + address: {{.Address}} - selector: "geth" template: | module: geth @@ -252,6 +295,16 @@ compose: module: hdfs name: datanode_local url: http://{{.Address}}/jmx + - selector: "icecast" + template: | + module: icecast + name: local + url: http://{{.Address}} + - selector: "ipfs" + template: | + module: ipfs + name: local + url: http://{{.Address}} - selector: "kubelet" template: | module: k8s_kubelet @@ -277,11 +330,23 @@ compose: module: logstash name: local url: http://{{.Address}} + - selector: "memcached" + template: | + module: memcached + name: local + address: {{.Address}} - selector: "mongodb" template: | module: mongodb name: local uri: mongodb://{{.Address}} + - selector: "monit" + template: | + module: monit + name: local + url: http://{{.Address}} + username: admin + password: monit - selector: "mysql" template: | - module: mysql @@ -330,6 +395,16 @@ compose: module: pika name: local address: redis://@{{.IPAddress}}:{{.Port}} + - selector: "rethinkdb" + template: | + module: rethinkdb + name: local + address: {{.Address}} + - selector: "riak" + template: | + module: riakkv + name: local + url: http://{{.Address}}/stats - selector: "rspamd" template: | module: rspamd @@ -365,6 +440,12 @@ compose: module: proxysql name: local dsn: stats:stats@tcp({{.Address}})/ + - selector: "puppet" + template: | + module: puppet + name: local + url: https://{{.Address}} + tls_skip_verify: yes - selector: "rabbitmq" template: | module: rabbitmq @@ -378,6 +459,11 @@ compose: module: redis name: local address: redis://@{{.Address}} + - selector: "squid" + template: | + module: squid + name: local + url: http://{{.Address}} - selector: "supervisord" template: | module: supervisord @@ -388,11 +474,16 @@ compose: module: traefik name: local url: http://{{.Address}}/metrics - - selector: "traefik" + - selector: "tomcat" template: | - module: traefik + module: tomcat name: local - url: http://{{.Address}}/metrics + url: http://{{.Address}} + - selector: "tor" + template: | + module: tor + name: local + address: {{.Address}} - selector: "unbound" template: | module: unbound @@ -403,6 +494,11 @@ compose: module: upsd name: local address: {{.Address}} + - selector: "uwsgi" + template: | + module: uwsgi + name: local + address: {{.Address}} - selector: "vernemq" template: | module: vernemq diff --git a/src/go/collectors/go.d.plugin/config/go.d/sensors.conf b/src/go/plugin/go.d/config/go.d/sensors.conf index 3b8febde8..d1b4c4f14 100644 --- a/src/go/collectors/go.d.plugin/config/go.d/sensors.conf +++ b/src/go/plugin/go.d/config/go.d/sensors.conf @@ -1,5 +1,5 @@ ## All available configuration options, their descriptions and default values: -## https://github.com/netdata/netdata/tree/master/src/go/collectors/go.d.plugin/modules/sensors#readme +## https://github.com/netdata/netdata/tree/master/src/go/plugin/go.d/modules/sensors#readme jobs: - name: sensors diff --git a/src/go/collectors/go.d.plugin/config/go.d/smartctl.conf b/src/go/plugin/go.d/config/go.d/smartctl.conf index dea5116be..7f8ca5ada 100644 --- a/src/go/collectors/go.d.plugin/config/go.d/smartctl.conf +++ b/src/go/plugin/go.d/config/go.d/smartctl.conf @@ -1,5 +1,5 @@ ## All available configuration options, their descriptions and default values: -## https://github.com/netdata/netdata/tree/master/src/go/collectors/go.d.plugin/modules/smartctl#readme +## https://github.com/netdata/netdata/tree/master/src/go/plugin/go.d/modules/smartctl#readme jobs: - name: smartctl diff --git a/src/go/plugin/go.d/config/go.d/snmp.conf b/src/go/plugin/go.d/config/go.d/snmp.conf new file mode 100644 index 000000000..395fb0f01 --- /dev/null +++ b/src/go/plugin/go.d/config/go.d/snmp.conf @@ -0,0 +1,10 @@ +## All available configuration options, their descriptions and default values: +## https://github.com/netdata/netdata/tree/master/src/go/plugin/go.d/modules/snmp#readme + +#jobs: +# - name: switch +# update_every: 10 +# hostname: "192.0.2.1" +# community: public +# options: +# version: 2 diff --git a/src/go/plugin/go.d/config/go.d/squid.conf b/src/go/plugin/go.d/config/go.d/squid.conf new file mode 100644 index 000000000..21c711d38 --- /dev/null +++ b/src/go/plugin/go.d/config/go.d/squid.conf @@ -0,0 +1,6 @@ +## All available configuration options, their descriptions and default values: +## https://github.com/netdata/netdata/tree/master/src/go/plugin/go.d/modules/squid#readme + +#jobs: +# - name: local +# url: http://localhost:3128 diff --git a/src/go/collectors/go.d.plugin/config/go.d/squidlog.conf b/src/go/plugin/go.d/config/go.d/squidlog.conf index a008feabf..4c85e3849 100644 --- a/src/go/collectors/go.d.plugin/config/go.d/squidlog.conf +++ b/src/go/plugin/go.d/config/go.d/squidlog.conf @@ -1,5 +1,5 @@ ## All available configuration options, their descriptions and default values: -## https://github.com/netdata/netdata/tree/master/src/go/collectors/go.d.plugin/modules/squidlog#readme +## https://github.com/netdata/netdata/tree/master/src/go/plugin/go.d/modules/squidlog#readme jobs: - name: squidlog diff --git a/src/go/collectors/go.d.plugin/config/go.d/storcli.conf b/src/go/plugin/go.d/config/go.d/storcli.conf index a4a9e3e0a..704f7579d 100644 --- a/src/go/collectors/go.d.plugin/config/go.d/storcli.conf +++ b/src/go/plugin/go.d/config/go.d/storcli.conf @@ -1,5 +1,5 @@ ## All available configuration options, their descriptions and default values: -## https://github.com/netdata/netdata/tree/master/src/go/collectors/go.d.plugin/modules/storcli#readme +## https://github.com/netdata/netdata/tree/master/src/go/plugin/go.d/modules/storcli#readme jobs: - name: storcli diff --git a/src/go/collectors/go.d.plugin/config/go.d/supervisord.conf b/src/go/plugin/go.d/config/go.d/supervisord.conf index 3031e5059..5d3969b7d 100644 --- a/src/go/collectors/go.d.plugin/config/go.d/supervisord.conf +++ b/src/go/plugin/go.d/config/go.d/supervisord.conf @@ -1,5 +1,5 @@ ## All available configuration options, their descriptions and default values: -## https://github.com/netdata/netdata/tree/master/src/go/collectors/go.d.plugin/modules/supervisord#readme +## https://github.com/netdata/netdata/tree/master/src/go/plugin/go.d/modules/supervisord#readme #jobs: # - name: local diff --git a/src/go/collectors/go.d.plugin/config/go.d/systemdunits.conf b/src/go/plugin/go.d/config/go.d/systemdunits.conf index 5c94fc00f..7aefd37ea 100644 --- a/src/go/collectors/go.d.plugin/config/go.d/systemdunits.conf +++ b/src/go/plugin/go.d/config/go.d/systemdunits.conf @@ -1,5 +1,5 @@ ## All available configuration options, their descriptions and default values: -## https://github.com/netdata/netdata/tree/master/src/go/collectors/go.d.plugin/modules/systemdunits#readme +## https://github.com/netdata/netdata/tree/master/src/go/plugin/go.d/modules/systemdunits#readme jobs: - name: service-units diff --git a/src/go/collectors/go.d.plugin/config/go.d/tengine.conf b/src/go/plugin/go.d/config/go.d/tengine.conf index 186d55c6c..aefaf2ac7 100644 --- a/src/go/collectors/go.d.plugin/config/go.d/tengine.conf +++ b/src/go/plugin/go.d/config/go.d/tengine.conf @@ -1,5 +1,5 @@ ## All available configuration options, their descriptions and default values: -## https://github.com/netdata/netdata/tree/master/src/go/collectors/go.d.plugin/modules/tengine#readme +## https://github.com/netdata/netdata/tree/master/src/go/plugin/go.d/modules/tengine#readme #jobs: # - name: local diff --git a/src/go/plugin/go.d/config/go.d/tomcat.conf b/src/go/plugin/go.d/config/go.d/tomcat.conf new file mode 100644 index 000000000..cae77e862 --- /dev/null +++ b/src/go/plugin/go.d/config/go.d/tomcat.conf @@ -0,0 +1,6 @@ +## All available configuration options, their descriptions and default values: +## https://github.com/netdata/netdata/tree/master/src/go/plugin/go.d/modules/tomcat#readme + +#jobs: +# - name: local +# url: http://127.0.0.1:8080 diff --git a/src/go/plugin/go.d/config/go.d/tor.conf b/src/go/plugin/go.d/config/go.d/tor.conf new file mode 100644 index 000000000..7aa949d96 --- /dev/null +++ b/src/go/plugin/go.d/config/go.d/tor.conf @@ -0,0 +1,6 @@ +## All available configuration options, their descriptions and default values: +## https://github.com/netdata/netdata/tree/master/src/go/plugin/go.d/modules/tor#readme + +#jobs: +# - name: local +# address: 127.0.0.1:9051 diff --git a/src/go/collectors/go.d.plugin/config/go.d/traefik.conf b/src/go/plugin/go.d/config/go.d/traefik.conf index 69f5bb53e..8c005db01 100644 --- a/src/go/collectors/go.d.plugin/config/go.d/traefik.conf +++ b/src/go/plugin/go.d/config/go.d/traefik.conf @@ -1,5 +1,5 @@ ## All available configuration options, their descriptions and default values: -## https://github.com/netdata/netdata/tree/master/src/go/collectors/go.d.plugin/modules/traefik#readme +## https://github.com/netdata/netdata/tree/master/src/go/plugin/go.d/modules/traefik#readme #jobs: # - name: local diff --git a/src/go/collectors/go.d.plugin/config/go.d/unbound.conf b/src/go/plugin/go.d/config/go.d/unbound.conf index e6497c23c..06552bfd9 100644 --- a/src/go/collectors/go.d.plugin/config/go.d/unbound.conf +++ b/src/go/plugin/go.d/config/go.d/unbound.conf @@ -1,5 +1,5 @@ ## All available configuration options, their descriptions and default values: -## https://github.com/netdata/netdata/tree/master/src/go/collectors/go.d.plugin/modules/unbound#readme +## https://github.com/netdata/netdata/tree/master/src/go/plugin/go.d/modules/unbound#readme #jobs: # - name: local diff --git a/src/go/collectors/go.d.plugin/config/go.d/upsd.conf b/src/go/plugin/go.d/config/go.d/upsd.conf index 5abc3f405..6f7b31090 100644 --- a/src/go/collectors/go.d.plugin/config/go.d/upsd.conf +++ b/src/go/plugin/go.d/config/go.d/upsd.conf @@ -1,5 +1,5 @@ ## All available configuration options, their descriptions and default values: -## https://github.com/netdata/netdata/tree/master/src/go/collectors/go.d.plugin/modules/upsd#readme +## https://github.com/netdata/netdata/tree/master/src/go/plugin/go.d/modules/upsd#readme #jobs: # - name: upsd diff --git a/src/go/plugin/go.d/config/go.d/uwsgi.conf b/src/go/plugin/go.d/config/go.d/uwsgi.conf new file mode 100644 index 000000000..f31891804 --- /dev/null +++ b/src/go/plugin/go.d/config/go.d/uwsgi.conf @@ -0,0 +1,6 @@ +## All available configuration options, their descriptions and default values: +## https://github.com/netdata/netdata/tree/master/src/go/plugin/go.d/modules/uwsgi#readme + +#jobs: +# - name: local +# address: 127.0.0.1:1717 diff --git a/src/go/collectors/go.d.plugin/config/go.d/vcsa.conf b/src/go/plugin/go.d/config/go.d/vcsa.conf index 84749fbd5..39ee86d91 100644 --- a/src/go/collectors/go.d.plugin/config/go.d/vcsa.conf +++ b/src/go/plugin/go.d/config/go.d/vcsa.conf @@ -1,5 +1,5 @@ ## All available configuration options, their descriptions and default values: -## https://github.com/netdata/netdata/tree/master/src/go/collectors/go.d.plugin/modules/vcsa#readme +## https://github.com/netdata/netdata/tree/master/src/go/plugin/go.d/modules/vcsa#readme #jobs: # - name : vcsa1 diff --git a/src/go/collectors/go.d.plugin/config/go.d/vernemq.conf b/src/go/plugin/go.d/config/go.d/vernemq.conf index 24717a828..c954074f8 100644 --- a/src/go/collectors/go.d.plugin/config/go.d/vernemq.conf +++ b/src/go/plugin/go.d/config/go.d/vernemq.conf @@ -1,5 +1,5 @@ ## All available configuration options, their descriptions and default values: -## https://github.com/netdata/netdata/tree/master/src/go/collectors/go.d.plugin/modules/vernemq#readme +## https://github.com/netdata/netdata/tree/master/src/go/plugin/go.d/modules/vernemq#readme #jobs: # - name: local diff --git a/src/go/collectors/go.d.plugin/config/go.d/vsphere.conf b/src/go/plugin/go.d/config/go.d/vsphere.conf index a83c27833..cbc58a354 100644 --- a/src/go/collectors/go.d.plugin/config/go.d/vsphere.conf +++ b/src/go/plugin/go.d/config/go.d/vsphere.conf @@ -1,5 +1,5 @@ ## All available configuration options, their descriptions and default values: -## https://github.com/netdata/netdata/tree/master/src/go/collectors/go.d.plugin/modules/vsphere#readme +## https://github.com/netdata/netdata/tree/master/src/go/plugin/go.d/modules/vsphere#readme #jobs: # - name : vcenter1 diff --git a/src/go/collectors/go.d.plugin/config/go.d/web_log.conf b/src/go/plugin/go.d/config/go.d/web_log.conf index 496878851..502fece49 100644 --- a/src/go/collectors/go.d.plugin/config/go.d/web_log.conf +++ b/src/go/plugin/go.d/config/go.d/web_log.conf @@ -1,5 +1,5 @@ ## All available configuration options, their descriptions and default values: -## https://github.com/netdata/netdata/tree/master/src/go/collectors/go.d.plugin/modules/web_log#readme +## https://github.com/netdata/netdata/tree/master/src/go/plugin/go.d/modules/web_log#readme jobs: # NGINX diff --git a/src/go/collectors/go.d.plugin/config/go.d/whoisquery.conf b/src/go/plugin/go.d/config/go.d/whoisquery.conf index 57c031bc0..41f7232da 100644 --- a/src/go/collectors/go.d.plugin/config/go.d/whoisquery.conf +++ b/src/go/plugin/go.d/config/go.d/whoisquery.conf @@ -1,5 +1,5 @@ ## All available configuration options, their descriptions and default values: -## https://github.com/netdata/netdata/tree/master/src/go/collectors/go.d.plugin/modules/whoisquery#readme +## https://github.com/netdata/netdata/tree/master/src/go/plugin/go.d/modules/whoisquery#readme #jobs: # - name: example diff --git a/src/go/collectors/go.d.plugin/config/go.d/windows.conf b/src/go/plugin/go.d/config/go.d/windows.conf index 73d4b062c..4671c20bc 100644 --- a/src/go/collectors/go.d.plugin/config/go.d/windows.conf +++ b/src/go/plugin/go.d/config/go.d/windows.conf @@ -1,5 +1,5 @@ ## All available configuration options, their descriptions and default values: -## https://github.com/netdata/netdata/tree/master/src/go/collectors/go.d.plugin/modules/windows#readme +## https://github.com/netdata/netdata/tree/master/src/go/plugin/go.d/modules/windows#readme #jobs: # - name: win_server1 diff --git a/src/go/collectors/go.d.plugin/config/go.d/wireguard.conf b/src/go/plugin/go.d/config/go.d/wireguard.conf index 225de4d6c..07ed61d06 100644 --- a/src/go/collectors/go.d.plugin/config/go.d/wireguard.conf +++ b/src/go/plugin/go.d/config/go.d/wireguard.conf @@ -1,5 +1,5 @@ ## All available configuration options, their descriptions and default values: -## https://github.com/netdata/netdata/tree/master/src/go/collectors/go.d.plugin/modules/wireguard#readme +## https://github.com/netdata/netdata/tree/master/src/go/plugin/go.d/modules/wireguard#readme jobs: - name: wireguard diff --git a/src/go/collectors/go.d.plugin/config/go.d/x509check.conf b/src/go/plugin/go.d/config/go.d/x509check.conf index d01417478..5231b1052 100644 --- a/src/go/collectors/go.d.plugin/config/go.d/x509check.conf +++ b/src/go/plugin/go.d/config/go.d/x509check.conf @@ -1,5 +1,5 @@ ## All available configuration options, their descriptions and default values: -## https://github.com/netdata/netdata/tree/master/src/go/collectors/go.d.plugin/modules/x509check#readme +## https://github.com/netdata/netdata/tree/master/src/go/plugin/go.d/modules/x509check#readme #jobs: # - name: my_site_cert diff --git a/src/go/collectors/go.d.plugin/config/go.d/zfspool.conf b/src/go/plugin/go.d/config/go.d/zfspool.conf index f18ff54e1..e961d1971 100644 --- a/src/go/collectors/go.d.plugin/config/go.d/zfspool.conf +++ b/src/go/plugin/go.d/config/go.d/zfspool.conf @@ -1,5 +1,5 @@ ## All available configuration options, their descriptions and default values: -## https://github.com/netdata/netdata/tree/master/src/go/collectors/go.d.plugin/modules/zfspool#readme +## https://github.com/netdata/netdata/tree/master/src/go/plugin/go.d/modules/zfspool#readme jobs: - name: zfspool diff --git a/src/go/collectors/go.d.plugin/config/go.d/zookeeper.conf b/src/go/plugin/go.d/config/go.d/zookeeper.conf index e6ed50525..f200c7893 100644 --- a/src/go/collectors/go.d.plugin/config/go.d/zookeeper.conf +++ b/src/go/plugin/go.d/config/go.d/zookeeper.conf @@ -1,5 +1,5 @@ ## All available configuration options, their descriptions and default values: -## https://github.com/netdata/netdata/tree/master/src/go/collectors/go.d.plugin/modules/zookeeper#readme +## https://github.com/netdata/netdata/tree/master/src/go/plugin/go.d/modules/zookeeper#readme #jobs: # - name: local diff --git a/src/go/collectors/go.d.plugin/docs/how-to-write-a-module.md b/src/go/plugin/go.d/docs/how-to-write-a-module.md index b54161496..bf7d3bc6d 100644 --- a/src/go/collectors/go.d.plugin/docs/how-to-write-a-module.md +++ b/src/go/plugin/go.d/docs/how-to-write-a-module.md @@ -1,7 +1,7 @@ <!-- title: "How to write a Netdata collector in Go" description: "This guide will walk you through the technical implementation of writing a new Netdata collector in Golang, with tips on interfaces, structure, configuration files, and more." -custom_edit_url: "/src/go/collectors/go.d.plugin/docs/how-to-write-a-module.md" +custom_edit_url: "/src/go/plugin/go.d/docs/how-to-write-a-module.md" sidebar_label: "How to write a Netdata collector in Go" learn_status: "Published" learn_topic_type: "Tasks" @@ -23,7 +23,7 @@ sidebar_position: 20 ## Write and test a simple collector > :exclamation: You can skip most of these steps if you first experiment directy with the existing -> [example module](https://github.com/netdata/netdata/tree/master/src/go/collectors/go.d.plugin/modules/example), which +> [example module](https://github.com/netdata/netdata/tree/master/src/go/plugin/go.d/modules/example), which > will > give you an idea of how things work. @@ -32,18 +32,18 @@ Let's assume you want to write a collector named `example2`. The steps are: - Add the source code - to [`modules/example2/`](https://github.com/netdata/netdata/tree/master/src/go/collectors/go.d.plugin/modules). + to [`modules/example2/`](https://github.com/netdata/netdata/tree/master/src/go/plugin/go.d/modules). - [module interface](#module-interface). - [suggested module layout](#module-layout). - [helper packages](#helper-packages). - Add the configuration - to [`config/go.d/example2.conf`](https://github.com/netdata/netdata/tree/master/src/go/collectors/go.d.plugin/config/go.d). + to [`config/go.d/example2.conf`](https://github.com/netdata/netdata/tree/master/src/go/plugin/go.d/config/go.d). - Add the module - to [`config/go.d.conf`](https://github.com/netdata/netdata/blob/master/src/go/collectors/go.d.plugin/config/go.d.conf). + to [`config/go.d.conf`](https://github.com/netdata/netdata/blob/master/src/go/plugin/go.d/config/go.d.conf). - Import the module - in [`modules/init.go`](https://github.com/netdata/netdata/blob/master/src/go/collectors/go.d.plugin/modules/init.go). + in [`modules/init.go`](https://github.com/netdata/netdata/blob/master/src/go/plugin/go.d/modules/init.go). - Update - the [`available modules list`](https://github.com/netdata/netdata/tree/master/src/go/collectors/go.d.plugin#available-modules). + the [`available modules list`](https://github.com/netdata/netdata/tree/master/src/go/plugin/go.d#available-modules). - To build it, run `make` from the plugin root dir. This will create a new `go.d.plugin` binary that includes your newly developed collector. It will be placed into the `bin` directory (e.g `go.d.plugin/bin`) - Run it in the debug mode `bin/godplugin -d -m <MODULE_NAME>`. This will output the `STDOUT` of the collector, the same @@ -51,10 +51,7 @@ The steps are: our [documentation](/src/collectors/plugins.d/README.md#external-plugins-api). - If you want to test the collector with the actual Netdata Agent, you need to replace the `go.d.plugin` binary that exists in the Netdata Agent installation directory with the one you just compiled. Once - you [restart](/packaging/installer/README.md#maintaining-a-netdata-agent-installation) - the Netdata Agent, it will detect and run - it, creating all the charts. It is advised not to remove the default `go.d.plugin` binary, but simply rename it - to `go.d.plugin.old` so that the Agent doesn't run it, but you can easily rename it back once you are done. + you restart the Netdata Agent, it will detect and run it, creating all the charts. It is advised not to remove the default `go.d.plugin` binary, but simply rename it to `go.d.plugin.old` so that the Agent doesn't run it, but you can easily rename it back once you are done. - Run `make clean` when you are done with testing. ## Module Interface @@ -125,7 +122,7 @@ func (e *Example) Check() bool { produces [`charts`](/src/collectors/plugins.d/README.md#chart), not raw metrics. -Use [`agent/module`](https://github.com/netdata/netdata/blob/master/src/go/collectors/go.d.plugin/agent/module/charts.go) +Use [`agent/module`](https://github.com/netdata/netdata/blob/master/src/go/plugin/go.d/agent/module/charts.go) package to create them, it contains charts and dimensions structs. @@ -205,7 +202,7 @@ Suggested minimal layout: ### File `module_name.go` > :exclamation: See the -> example [`example.go`](https://github.com/netdata/netdata/blob/master/src/go/collectors/go.d.plugin/modules/example/example.go). +> example [`example.go`](https://github.com/netdata/netdata/blob/master/src/go/plugin/go.d/modules/example/example.go). Don't overload this file with the implementation details. @@ -218,14 +215,14 @@ Usually it contains only: ### File `charts.go` > :exclamation: See the -> example: [`charts.go`](https://github.com/netdata/netdata/blob/master/src/go/collectors/go.d.plugin/modules/example/charts.go). +> example: [`charts.go`](https://github.com/netdata/netdata/blob/master/src/go/plugin/go.d/modules/example/charts.go). Put charts, charts templates and charts constructor functions in this file. ### File `init.go` > :exclamation: See the -> example: [`init.go`](https://github.com/netdata/netdata/blob/master/src/go/collectors/go.d.plugin/modules/example/init.go). +> example: [`init.go`](https://github.com/netdata/netdata/blob/master/src/go/plugin/go.d/modules/example/init.go). All the module initialization details should go in this file. @@ -252,7 +249,7 @@ func (e *Example) initSomeValue() error { ### File `collect.go` > :exclamation: See the -> example: [`collect.go`](https://github.com/netdata/netdata/blob/master/src/go/collectors/go.d.plugin/modules/example/collect.go). +> example: [`collect.go`](https://github.com/netdata/netdata/blob/master/src/go/plugin/go.d/modules/example/collect.go). This file is the entry point for the metrics collection. @@ -275,7 +272,7 @@ func (e *Example) collect() (map[string]int64, error) { ### File `module_name_test.go` > :exclamation: See the -> example: [`example_test.go`](https://github.com/netdata/netdata/blob/master/src/go/collectors/go.d.plugin/modules/example/example_test.go). +> example: [`example_test.go`](https://github.com/netdata/netdata/blob/master/src/go/plugin/go.d/modules/example/example_test.go). > if you have no experience in testing we recommend starting > with [testing package documentation](https://golang.org/pkg/testing/). @@ -300,6 +297,6 @@ be [`testdata`](https://golang.org/cmd/go/#hdr-Package_lists_and_patterns). ## Helper packages -There are [some helper packages](https://github.com/netdata/netdata/tree/master/src/go/collectors/go.d.plugin/pkg) for +There are [some helper packages](https://github.com/netdata/netdata/tree/master/src/go/plugin/go.d/pkg) for writing a module. diff --git a/src/go/collectors/go.d.plugin/examples/simple/main.go b/src/go/plugin/go.d/examples/simple/main.go index 4fa93d690..215e91f14 100644 --- a/src/go/collectors/go.d.plugin/examples/simple/main.go +++ b/src/go/plugin/go.d/examples/simple/main.go @@ -10,11 +10,11 @@ import ( "os" "path" - "github.com/netdata/netdata/go/go.d.plugin/agent" - "github.com/netdata/netdata/go/go.d.plugin/agent/module" - "github.com/netdata/netdata/go/go.d.plugin/cli" - "github.com/netdata/netdata/go/go.d.plugin/logger" - "github.com/netdata/netdata/go/go.d.plugin/pkg/multipath" + "github.com/netdata/netdata/go/plugins/logger" + "github.com/netdata/netdata/go/plugins/plugin/go.d/agent" + "github.com/netdata/netdata/go/plugins/plugin/go.d/agent/module" + "github.com/netdata/netdata/go/plugins/plugin/go.d/cli" + "github.com/netdata/netdata/go/plugins/plugin/go.d/pkg/multipath" "github.com/jessevdk/go-flags" ) diff --git a/src/go/collectors/go.d.plugin/hack/go-build.sh b/src/go/plugin/go.d/hack/go-build.sh index c211cff4d..0b451f9c5 100755 --- a/src/go/collectors/go.d.plugin/hack/go-build.sh +++ b/src/go/plugin/go.d/hack/go-build.sh @@ -36,11 +36,11 @@ WHICH="$1" VERSION="${TRAVIS_TAG:-$(git describe --tags --always --dirty)}" GOLDFLAGS=${GLDFLAGS:-} -GOLDFLAGS="$GOLDFLAGS -w -s -X github.com/netdata/netdata/go/go.d.plugin/pkg/buildinfo.Version=$VERSION" +GOLDFLAGS="$GOLDFLAGS -w -s -X github.com/netdata/netdata/go/plugins/pkg/buildinfo.Version=$VERSION" build() { echo "Building ${GOOS}/${GOARCH}" - CGO_ENABLED=0 GOOS="$1" GOARCH="$2" go build -ldflags "${GOLDFLAGS}" -o "$3" "github.com/netdata/netdata/go/go.d.plugin/cmd/godplugin" + CGO_ENABLED=0 GOOS="$1" GOARCH="$2" go build -ldflags "${GOLDFLAGS}" -o "$3" "github.com/netdata/netdata/go/plugins/cmd/godplugin" } create_config_archives() { diff --git a/src/go/collectors/go.d.plugin/hack/go-fmt.sh b/src/go/plugin/go.d/hack/go-fmt.sh index fcc9e2d57..fcc9e2d57 100755 --- a/src/go/collectors/go.d.plugin/hack/go-fmt.sh +++ b/src/go/plugin/go.d/hack/go-fmt.sh diff --git a/src/go/collectors/go.d.plugin/modules/activemq/README.md b/src/go/plugin/go.d/modules/activemq/README.md index de893d1d0..de893d1d0 120000 --- a/src/go/collectors/go.d.plugin/modules/activemq/README.md +++ b/src/go/plugin/go.d/modules/activemq/README.md diff --git a/src/go/collectors/go.d.plugin/modules/activemq/activemq.go b/src/go/plugin/go.d/modules/activemq/activemq.go index 46953bb90..bf47be72a 100644 --- a/src/go/collectors/go.d.plugin/modules/activemq/activemq.go +++ b/src/go/plugin/go.d/modules/activemq/activemq.go @@ -7,9 +7,9 @@ import ( "errors" "time" - "github.com/netdata/netdata/go/go.d.plugin/agent/module" - "github.com/netdata/netdata/go/go.d.plugin/pkg/matcher" - "github.com/netdata/netdata/go/go.d.plugin/pkg/web" + "github.com/netdata/netdata/go/plugins/plugin/go.d/agent/module" + "github.com/netdata/netdata/go/plugins/plugin/go.d/pkg/matcher" + "github.com/netdata/netdata/go/plugins/plugin/go.d/pkg/web" ) //go:embed "config_schema.json" diff --git a/src/go/collectors/go.d.plugin/modules/activemq/activemq_test.go b/src/go/plugin/go.d/modules/activemq/activemq_test.go index 19f28fee4..e2640f440 100644 --- a/src/go/collectors/go.d.plugin/modules/activemq/activemq_test.go +++ b/src/go/plugin/go.d/modules/activemq/activemq_test.go @@ -8,8 +8,8 @@ import ( "os" "testing" - "github.com/netdata/netdata/go/go.d.plugin/agent/module" - "github.com/netdata/netdata/go/go.d.plugin/pkg/web" + "github.com/netdata/netdata/go/plugins/plugin/go.d/agent/module" + "github.com/netdata/netdata/go/plugins/plugin/go.d/pkg/web" "github.com/stretchr/testify/assert" "github.com/stretchr/testify/require" diff --git a/src/go/collectors/go.d.plugin/modules/activemq/apiclient.go b/src/go/plugin/go.d/modules/activemq/apiclient.go index b721f617f..7f99c9bad 100644 --- a/src/go/collectors/go.d.plugin/modules/activemq/apiclient.go +++ b/src/go/plugin/go.d/modules/activemq/apiclient.go @@ -10,7 +10,7 @@ import ( "net/url" "path" - "github.com/netdata/netdata/go/go.d.plugin/pkg/web" + "github.com/netdata/netdata/go/plugins/plugin/go.d/pkg/web" ) type topics struct { diff --git a/src/go/collectors/go.d.plugin/modules/activemq/charts.go b/src/go/plugin/go.d/modules/activemq/charts.go index fd715970f..a169da01a 100644 --- a/src/go/collectors/go.d.plugin/modules/activemq/charts.go +++ b/src/go/plugin/go.d/modules/activemq/charts.go @@ -2,7 +2,7 @@ package activemq -import "github.com/netdata/netdata/go/go.d.plugin/agent/module" +import "github.com/netdata/netdata/go/plugins/plugin/go.d/agent/module" type ( // Charts is an alias for module.Charts diff --git a/src/go/collectors/go.d.plugin/modules/activemq/collect.go b/src/go/plugin/go.d/modules/activemq/collect.go index 0dbaf5544..0dbaf5544 100644 --- a/src/go/collectors/go.d.plugin/modules/activemq/collect.go +++ b/src/go/plugin/go.d/modules/activemq/collect.go diff --git a/src/go/collectors/go.d.plugin/modules/activemq/config_schema.json b/src/go/plugin/go.d/modules/activemq/config_schema.json index 421354cae..df71bcadf 100644 --- a/src/go/collectors/go.d.plugin/modules/activemq/config_schema.json +++ b/src/go/plugin/go.d/modules/activemq/config_schema.json @@ -218,6 +218,12 @@ "topics_filter": { "ui:help": "Use `*` to collect all topics. To exclude all topics from collection, use `!*`." }, + "username": { + "ui:widget": "password" + }, + "proxy_username": { + "ui:widget": "password" + }, "password": { "ui:widget": "password" }, diff --git a/src/go/collectors/go.d.plugin/modules/activemq/init.go b/src/go/plugin/go.d/modules/activemq/init.go index 43cdb2e95..e48dacad5 100644 --- a/src/go/collectors/go.d.plugin/modules/activemq/init.go +++ b/src/go/plugin/go.d/modules/activemq/init.go @@ -4,7 +4,7 @@ package activemq import ( "errors" - "github.com/netdata/netdata/go/go.d.plugin/pkg/matcher" + "github.com/netdata/netdata/go/plugins/plugin/go.d/pkg/matcher" ) func (a *ActiveMQ) validateConfig() error { diff --git a/src/go/collectors/go.d.plugin/modules/activemq/integrations/activemq.md b/src/go/plugin/go.d/modules/activemq/integrations/activemq.md index 648028754..fc215bfb9 100644 --- a/src/go/collectors/go.d.plugin/modules/activemq/integrations/activemq.md +++ b/src/go/plugin/go.d/modules/activemq/integrations/activemq.md @@ -1,6 +1,6 @@ <!--startmeta -custom_edit_url: "https://github.com/netdata/netdata/edit/master/src/go/collectors/go.d.plugin/modules/activemq/README.md" -meta_yaml: "https://github.com/netdata/netdata/edit/master/src/go/collectors/go.d.plugin/modules/activemq/metadata.yaml" +custom_edit_url: "https://github.com/netdata/netdata/edit/master/src/go/plugin/go.d/modules/activemq/README.md" +meta_yaml: "https://github.com/netdata/netdata/edit/master/src/go/plugin/go.d/modules/activemq/metadata.yaml" sidebar_label: "ActiveMQ" learn_status: "Published" learn_rel_path: "Collecting Metrics/Message Brokers" @@ -208,6 +208,8 @@ jobs: ### Debug Mode +**Important**: Debug mode is not supported for data collection jobs created via the UI using the Dyncfg feature. + To troubleshoot issues with the `activemq` collector, run the `go.d.plugin` with the debug option enabled. The output should give you clues as to why the collector isn't working. @@ -230,4 +232,37 @@ should give you clues as to why the collector isn't working. ./go.d.plugin -d -m activemq ``` +### Getting Logs + +If you're encountering problems with the `activemq` collector, follow these steps to retrieve logs and identify potential issues: + +- **Run the command** specific to your system (systemd, non-systemd, or Docker container). +- **Examine the output** for any warnings or error messages that might indicate issues. These messages should provide clues about the root cause of the problem. + +#### System with systemd + +Use the following command to view logs generated since the last Netdata service restart: + +```bash +journalctl _SYSTEMD_INVOCATION_ID="$(systemctl show --value --property=InvocationID netdata)" --namespace=netdata --grep activemq +``` + +#### System without systemd + +Locate the collector log file, typically at `/var/log/netdata/collector.log`, and use `grep` to filter for collector's name: + +```bash +grep activemq /var/log/netdata/collector.log +``` + +**Note**: This method shows logs from all restarts. Focus on the **latest entries** for troubleshooting current issues. + +#### Docker Container + +If your Netdata runs in a Docker container named "netdata" (replace if different), use this command: + +```bash +docker logs netdata 2>&1 | grep activemq +``` + diff --git a/src/go/collectors/go.d.plugin/modules/activemq/metadata.yaml b/src/go/plugin/go.d/modules/activemq/metadata.yaml index 5bbb0e5a2..5bbb0e5a2 100644 --- a/src/go/collectors/go.d.plugin/modules/activemq/metadata.yaml +++ b/src/go/plugin/go.d/modules/activemq/metadata.yaml diff --git a/src/go/collectors/go.d.plugin/modules/activemq/testdata/config.json b/src/go/plugin/go.d/modules/activemq/testdata/config.json index 13327dd3f..13327dd3f 100644 --- a/src/go/collectors/go.d.plugin/modules/activemq/testdata/config.json +++ b/src/go/plugin/go.d/modules/activemq/testdata/config.json diff --git a/src/go/collectors/go.d.plugin/modules/activemq/testdata/config.yaml b/src/go/plugin/go.d/modules/activemq/testdata/config.yaml index dbb4232e9..dbb4232e9 100644 --- a/src/go/collectors/go.d.plugin/modules/activemq/testdata/config.yaml +++ b/src/go/plugin/go.d/modules/activemq/testdata/config.yaml diff --git a/src/go/collectors/go.d.plugin/modules/adaptecraid/README.md b/src/go/plugin/go.d/modules/adaptecraid/README.md index 0a1566188..0a1566188 120000 --- a/src/go/collectors/go.d.plugin/modules/adaptecraid/README.md +++ b/src/go/plugin/go.d/modules/adaptecraid/README.md diff --git a/src/go/collectors/go.d.plugin/modules/adaptecraid/adaptec.go b/src/go/plugin/go.d/modules/adaptecraid/adaptec.go index a1c1f23e2..264390e10 100644 --- a/src/go/collectors/go.d.plugin/modules/adaptecraid/adaptec.go +++ b/src/go/plugin/go.d/modules/adaptecraid/adaptec.go @@ -7,8 +7,8 @@ import ( "errors" "time" - "github.com/netdata/netdata/go/go.d.plugin/agent/module" - "github.com/netdata/netdata/go/go.d.plugin/pkg/web" + "github.com/netdata/netdata/go/plugins/plugin/go.d/agent/module" + "github.com/netdata/netdata/go/plugins/plugin/go.d/pkg/web" ) //go:embed "config_schema.json" diff --git a/src/go/collectors/go.d.plugin/modules/adaptecraid/adaptec_test.go b/src/go/plugin/go.d/modules/adaptecraid/adaptec_test.go index b93ec51af..9abe5c984 100644 --- a/src/go/collectors/go.d.plugin/modules/adaptecraid/adaptec_test.go +++ b/src/go/plugin/go.d/modules/adaptecraid/adaptec_test.go @@ -7,7 +7,7 @@ import ( "os" "testing" - "github.com/netdata/netdata/go/go.d.plugin/agent/module" + "github.com/netdata/netdata/go/plugins/plugin/go.d/agent/module" "github.com/stretchr/testify/assert" "github.com/stretchr/testify/require" diff --git a/src/go/collectors/go.d.plugin/modules/adaptecraid/charts.go b/src/go/plugin/go.d/modules/adaptecraid/charts.go index 2a6c99330..65be20199 100644 --- a/src/go/collectors/go.d.plugin/modules/adaptecraid/charts.go +++ b/src/go/plugin/go.d/modules/adaptecraid/charts.go @@ -6,7 +6,7 @@ import ( "fmt" "strconv" - "github.com/netdata/netdata/go/go.d.plugin/agent/module" + "github.com/netdata/netdata/go/plugins/plugin/go.d/agent/module" ) const ( diff --git a/src/go/collectors/go.d.plugin/modules/adaptecraid/collect.go b/src/go/plugin/go.d/modules/adaptecraid/collect.go index b4439ba8e..b4439ba8e 100644 --- a/src/go/collectors/go.d.plugin/modules/adaptecraid/collect.go +++ b/src/go/plugin/go.d/modules/adaptecraid/collect.go diff --git a/src/go/collectors/go.d.plugin/modules/adaptecraid/collect_ld.go b/src/go/plugin/go.d/modules/adaptecraid/collect_ld.go index 180f97490..180f97490 100644 --- a/src/go/collectors/go.d.plugin/modules/adaptecraid/collect_ld.go +++ b/src/go/plugin/go.d/modules/adaptecraid/collect_ld.go diff --git a/src/go/collectors/go.d.plugin/modules/adaptecraid/collect_pd.go b/src/go/plugin/go.d/modules/adaptecraid/collect_pd.go index 272266b47..272266b47 100644 --- a/src/go/collectors/go.d.plugin/modules/adaptecraid/collect_pd.go +++ b/src/go/plugin/go.d/modules/adaptecraid/collect_pd.go diff --git a/src/go/collectors/go.d.plugin/modules/adaptecraid/config_schema.json b/src/go/plugin/go.d/modules/adaptecraid/config_schema.json index ad54f1585..ad54f1585 100644 --- a/src/go/collectors/go.d.plugin/modules/adaptecraid/config_schema.json +++ b/src/go/plugin/go.d/modules/adaptecraid/config_schema.json diff --git a/src/go/collectors/go.d.plugin/modules/adaptecraid/exec.go b/src/go/plugin/go.d/modules/adaptecraid/exec.go index 3a34840cf..0577e6234 100644 --- a/src/go/collectors/go.d.plugin/modules/adaptecraid/exec.go +++ b/src/go/plugin/go.d/modules/adaptecraid/exec.go @@ -8,7 +8,7 @@ import ( "os/exec" "time" - "github.com/netdata/netdata/go/go.d.plugin/logger" + "github.com/netdata/netdata/go/plugins/logger" ) func newArcconfCliExec(ndsudoPath string, timeout time.Duration, log *logger.Logger) *arcconfCliExec { diff --git a/src/go/collectors/go.d.plugin/modules/adaptecraid/init.go b/src/go/plugin/go.d/modules/adaptecraid/init.go index fe26f7bff..de8acc273 100644 --- a/src/go/collectors/go.d.plugin/modules/adaptecraid/init.go +++ b/src/go/plugin/go.d/modules/adaptecraid/init.go @@ -7,7 +7,7 @@ import ( "os" "path/filepath" - "github.com/netdata/netdata/go/go.d.plugin/agent/executable" + "github.com/netdata/netdata/go/plugins/pkg/executable" ) func (a *AdaptecRaid) initArcconfCliExec() (arcconfCli, error) { diff --git a/src/go/collectors/go.d.plugin/modules/adaptecraid/integrations/adaptec_raid.md b/src/go/plugin/go.d/modules/adaptecraid/integrations/adaptec_raid.md index d97203fcf..a38207ffb 100644 --- a/src/go/collectors/go.d.plugin/modules/adaptecraid/integrations/adaptec_raid.md +++ b/src/go/plugin/go.d/modules/adaptecraid/integrations/adaptec_raid.md @@ -1,6 +1,6 @@ <!--startmeta -custom_edit_url: "https://github.com/netdata/netdata/edit/master/src/go/collectors/go.d.plugin/modules/adaptecraid/README.md" -meta_yaml: "https://github.com/netdata/netdata/edit/master/src/go/collectors/go.d.plugin/modules/adaptecraid/metadata.yaml" +custom_edit_url: "https://github.com/netdata/netdata/edit/master/src/go/plugin/go.d/modules/adaptecraid/README.md" +meta_yaml: "https://github.com/netdata/netdata/edit/master/src/go/plugin/go.d/modules/adaptecraid/metadata.yaml" sidebar_label: "Adaptec RAID" learn_status: "Published" learn_rel_path: "Collecting Metrics/Storage, Mount Points and Filesystems" @@ -169,6 +169,8 @@ jobs: ### Debug Mode +**Important**: Debug mode is not supported for data collection jobs created via the UI using the Dyncfg feature. + To troubleshoot issues with the `adaptec_raid` collector, run the `go.d.plugin` with the debug option enabled. The output should give you clues as to why the collector isn't working. @@ -191,4 +193,37 @@ should give you clues as to why the collector isn't working. ./go.d.plugin -d -m adaptec_raid ``` +### Getting Logs + +If you're encountering problems with the `adaptec_raid` collector, follow these steps to retrieve logs and identify potential issues: + +- **Run the command** specific to your system (systemd, non-systemd, or Docker container). +- **Examine the output** for any warnings or error messages that might indicate issues. These messages should provide clues about the root cause of the problem. + +#### System with systemd + +Use the following command to view logs generated since the last Netdata service restart: + +```bash +journalctl _SYSTEMD_INVOCATION_ID="$(systemctl show --value --property=InvocationID netdata)" --namespace=netdata --grep adaptec_raid +``` + +#### System without systemd + +Locate the collector log file, typically at `/var/log/netdata/collector.log`, and use `grep` to filter for collector's name: + +```bash +grep adaptec_raid /var/log/netdata/collector.log +``` + +**Note**: This method shows logs from all restarts. Focus on the **latest entries** for troubleshooting current issues. + +#### Docker Container + +If your Netdata runs in a Docker container named "netdata" (replace if different), use this command: + +```bash +docker logs netdata 2>&1 | grep adaptec_raid +``` + diff --git a/src/go/collectors/go.d.plugin/modules/adaptecraid/metadata.yaml b/src/go/plugin/go.d/modules/adaptecraid/metadata.yaml index e573994f5..e573994f5 100644 --- a/src/go/collectors/go.d.plugin/modules/adaptecraid/metadata.yaml +++ b/src/go/plugin/go.d/modules/adaptecraid/metadata.yaml diff --git a/src/go/collectors/go.d.plugin/modules/adaptecraid/testdata/config.json b/src/go/plugin/go.d/modules/adaptecraid/testdata/config.json index 291ecee3d..291ecee3d 100644 --- a/src/go/collectors/go.d.plugin/modules/adaptecraid/testdata/config.json +++ b/src/go/plugin/go.d/modules/adaptecraid/testdata/config.json diff --git a/src/go/collectors/go.d.plugin/modules/adaptecraid/testdata/config.yaml b/src/go/plugin/go.d/modules/adaptecraid/testdata/config.yaml index 25b0b4c78..25b0b4c78 100644 --- a/src/go/collectors/go.d.plugin/modules/adaptecraid/testdata/config.yaml +++ b/src/go/plugin/go.d/modules/adaptecraid/testdata/config.yaml diff --git a/src/go/collectors/go.d.plugin/modules/adaptecraid/testdata/getconfig-ld-current.txt b/src/go/plugin/go.d/modules/adaptecraid/testdata/getconfig-ld-current.txt index b5a14b665..b5a14b665 100644 --- a/src/go/collectors/go.d.plugin/modules/adaptecraid/testdata/getconfig-ld-current.txt +++ b/src/go/plugin/go.d/modules/adaptecraid/testdata/getconfig-ld-current.txt diff --git a/src/go/collectors/go.d.plugin/modules/adaptecraid/testdata/getconfig-ld-old.txt b/src/go/plugin/go.d/modules/adaptecraid/testdata/getconfig-ld-old.txt index 0c3b46917..0c3b46917 100644 --- a/src/go/collectors/go.d.plugin/modules/adaptecraid/testdata/getconfig-ld-old.txt +++ b/src/go/plugin/go.d/modules/adaptecraid/testdata/getconfig-ld-old.txt diff --git a/src/go/collectors/go.d.plugin/modules/adaptecraid/testdata/getconfig-pd-current.txt b/src/go/plugin/go.d/modules/adaptecraid/testdata/getconfig-pd-current.txt index 62beff83c..62beff83c 100644 --- a/src/go/collectors/go.d.plugin/modules/adaptecraid/testdata/getconfig-pd-current.txt +++ b/src/go/plugin/go.d/modules/adaptecraid/testdata/getconfig-pd-current.txt diff --git a/src/go/collectors/go.d.plugin/modules/adaptecraid/testdata/getconfig-pd-old.txt b/src/go/plugin/go.d/modules/adaptecraid/testdata/getconfig-pd-old.txt index 2114df6be..2114df6be 100644 --- a/src/go/collectors/go.d.plugin/modules/adaptecraid/testdata/getconfig-pd-old.txt +++ b/src/go/plugin/go.d/modules/adaptecraid/testdata/getconfig-pd-old.txt diff --git a/src/collectors/charts.d.plugin/ap/README.md b/src/go/plugin/go.d/modules/ap/README.md index 5b6e75130..5b6e75130 120000 --- a/src/collectors/charts.d.plugin/ap/README.md +++ b/src/go/plugin/go.d/modules/ap/README.md diff --git a/src/go/plugin/go.d/modules/ap/ap.go b/src/go/plugin/go.d/modules/ap/ap.go new file mode 100644 index 000000000..93dd06d08 --- /dev/null +++ b/src/go/plugin/go.d/modules/ap/ap.go @@ -0,0 +1,113 @@ +// SPDX-License-Identifier: GPL-3.0-or-later + +package ap + +import ( + _ "embed" + "errors" + "time" + + "github.com/netdata/netdata/go/plugins/plugin/go.d/agent/module" + "github.com/netdata/netdata/go/plugins/plugin/go.d/pkg/web" +) + +//go:embed "config_schema.json" +var configSchema string + +func init() { + module.Register("ap", module.Creator{ + JobConfigSchema: configSchema, + Defaults: module.Defaults{ + UpdateEvery: 10, + }, + Create: func() module.Module { return New() }, + Config: func() any { return &Config{} }, + }) +} + +func New() *AP { + return &AP{ + Config: Config{ + BinaryPath: "/usr/sbin/iw", + Timeout: web.Duration(time.Second * 2), + }, + charts: &module.Charts{}, + seenIfaces: make(map[string]*iwInterface), + } +} + +type Config struct { + UpdateEvery int `yaml:"update_every,omitempty" json:"update_every"` + Timeout web.Duration `yaml:"timeout,omitempty" json:"timeout"` + BinaryPath string `yaml:"binary_path,omitempty" json:"binary_path"` +} + +type ( + AP struct { + module.Base + Config `yaml:",inline" json:""` + + charts *module.Charts + + exec iwBinary + + seenIfaces map[string]*iwInterface + } + iwBinary interface { + devices() ([]byte, error) + stationStatistics(ifaceName string) ([]byte, error) + } +) + +func (a *AP) Configuration() any { + return a.Config +} + +func (a *AP) Init() error { + if err := a.validateConfig(); err != nil { + a.Errorf("config validation: %s", err) + return err + } + + iw, err := a.initIwExec() + if err != nil { + a.Errorf("iw dev exec initialization: %v", err) + return err + } + a.exec = iw + + return nil +} + +func (a *AP) Check() error { + mx, err := a.collect() + if err != nil { + a.Error(err) + return err + } + + if len(mx) == 0 { + return errors.New("no metrics collected") + } + + return nil +} + +func (a *AP) Charts() *module.Charts { + return a.charts +} + +func (a *AP) Collect() map[string]int64 { + mx, err := a.collect() + if err != nil { + a.Error(err) + } + + if len(mx) == 0 { + return nil + } + + return mx +} + +func (a *AP) Cleanup() {} diff --git a/src/go/plugin/go.d/modules/ap/ap_test.go b/src/go/plugin/go.d/modules/ap/ap_test.go new file mode 100644 index 000000000..237e00e9e --- /dev/null +++ b/src/go/plugin/go.d/modules/ap/ap_test.go @@ -0,0 +1,292 @@ +// SPDX-License-Identifier: GPL-3.0-or-later + +package ap + +import ( + "errors" + "os" + "testing" + + "github.com/netdata/netdata/go/plugins/plugin/go.d/agent/module" + + "github.com/stretchr/testify/assert" + "github.com/stretchr/testify/require" +) + +var ( + dataConfigJSON, _ = os.ReadFile("testdata/config.json") + dataConfigYAML, _ = os.ReadFile("testdata/config.yaml") + + dataIwDevManaged, _ = os.ReadFile("testdata/iw_dev_managed.txt") + + dataIwDevAP, _ = os.ReadFile("testdata/iw_dev_ap.txt") + dataIwStationDump, _ = os.ReadFile("testdata/station_dump.txt") +) + +func Test_testDataIsValid(t *testing.T) { + for name, data := range map[string][]byte{ + "dataConfigJSON": dataConfigJSON, + "dataConfigYAML": dataConfigYAML, + "dataIwDevManaged": dataIwDevManaged, + "dataIwDevAP": dataIwDevAP, + "dataIwStationDump": dataIwStationDump, + } { + require.NotNil(t, data, name) + } +} + +func TestAP_Configuration(t *testing.T) { + module.TestConfigurationSerialize(t, &AP{}, dataConfigJSON, dataConfigYAML) +} + +func TestAP_Init(t *testing.T) { + tests := map[string]struct { + config Config + wantFail bool + }{ + "fails if 'binary_path' is not set": { + wantFail: true, + config: Config{ + BinaryPath: "", + }, + }, + "fails if failed to find binary": { + wantFail: true, + config: Config{ + BinaryPath: "iw!!!", + }, + }, + } + + for name, test := range tests { + t.Run(name, func(t *testing.T) { + pf := New() + pf.Config = test.config + + if test.wantFail { + assert.Error(t, pf.Init()) + } else { + assert.NoError(t, pf.Init()) + } + }) + } +} + +func TestAP_Cleanup(t *testing.T) { + tests := map[string]struct { + prepare func() *AP + }{ + "not initialized exec": { + prepare: func() *AP { + return New() + }, + }, + "after check": { + prepare: func() *AP { + ap := New() + ap.exec = prepareMockOk() + _ = ap.Check() + return ap + }, + }, + "after collect": { + prepare: func() *AP { + ap := New() + ap.exec = prepareMockOk() + _ = ap.Collect() + return ap + }, + }, + } + + for name, test := range tests { + t.Run(name, func(t *testing.T) { + pf := test.prepare() + + assert.NotPanics(t, pf.Cleanup) + }) + } +} + +func TestAP_Charts(t *testing.T) { + assert.NotNil(t, New().Charts()) +} + +func TestAP_Check(t *testing.T) { + tests := map[string]struct { + prepareMock func() *mockIwExec + wantFail bool + }{ + "success case": { + wantFail: false, + prepareMock: prepareMockOk, + }, + "no ap devices": { + wantFail: true, + prepareMock: prepareMockNoAPDevices, + }, + "error on devices call": { + wantFail: true, + prepareMock: prepareMockErrOnDevices, + }, + "error on station stats call": { + wantFail: true, + prepareMock: prepareMockErrOnStationStats, + }, + "unexpected response": { + wantFail: true, + prepareMock: prepareMockUnexpectedResponse, + }, + } + + for name, test := range tests { + t.Run(name, func(t *testing.T) { + ap := New() + ap.exec = test.prepareMock() + + if test.wantFail { + assert.Error(t, ap.Check()) + } else { + assert.NoError(t, ap.Check()) + } + }) + } +} + +func TestAP_Collect(t *testing.T) { + tests := map[string]struct { + prepareMock func() *mockIwExec + wantMetrics map[string]int64 + wantCharts int + }{ + "success case": { + prepareMock: prepareMockOk, + wantCharts: len(apChartsTmpl) * 2, + wantMetrics: map[string]int64{ + "ap_wlp1s0_testing_average_signal": -34000, + "ap_wlp1s0_testing_bitrate_receive": 65500, + "ap_wlp1s0_testing_bitrate_transmit": 65000, + "ap_wlp1s0_testing_bw_received": 95117, + "ap_wlp1s0_testing_bw_sent": 8270, + "ap_wlp1s0_testing_clients": 2, + "ap_wlp1s0_testing_issues_failures": 1, + "ap_wlp1s0_testing_issues_retries": 1, + "ap_wlp1s0_testing_packets_received": 2531, + "ap_wlp1s0_testing_packets_sent": 38, + "ap_wlp1s1_testing_average_signal": -34000, + "ap_wlp1s1_testing_bitrate_receive": 65500, + "ap_wlp1s1_testing_bitrate_transmit": 65000, + "ap_wlp1s1_testing_bw_received": 95117, + "ap_wlp1s1_testing_bw_sent": 8270, + "ap_wlp1s1_testing_clients": 2, + "ap_wlp1s1_testing_issues_failures": 1, + "ap_wlp1s1_testing_issues_retries": 1, + "ap_wlp1s1_testing_packets_received": 2531, + "ap_wlp1s1_testing_packets_sent": 38, + }, + }, + "no ap devices": { + prepareMock: prepareMockNoAPDevices, + wantMetrics: nil, + }, + "error on devices call": { + prepareMock: prepareMockErrOnDevices, + wantMetrics: nil, + }, + "error on statis stats call": { + prepareMock: prepareMockErrOnStationStats, + wantMetrics: nil, + }, + "unexpected response": { + prepareMock: prepareMockUnexpectedResponse, + wantMetrics: nil, + }, + } + + for name, test := range tests { + t.Run(name, func(t *testing.T) { + ap := New() + ap.exec = test.prepareMock() + + mx := ap.Collect() + + assert.Equal(t, test.wantMetrics, mx) + assert.Equal(t, test.wantCharts, len(*ap.Charts()), "Charts") + testMetricsHasAllChartsDims(t, ap, mx) + }) + } +} + +func testMetricsHasAllChartsDims(t *testing.T, ap *AP, mx map[string]int64) { + for _, chart := range *ap.Charts() { + if chart.Obsolete { + continue + } + for _, dim := range chart.Dims { + _, ok := mx[dim.ID] + assert.Truef(t, ok, "collected metrics has no data for dim '%s' chart '%s'", dim.ID, chart.ID) + } + for _, v := range chart.Vars { + _, ok := mx[v.ID] + assert.Truef(t, ok, "collected metrics has no data for var '%s' chart '%s'", v.ID, chart.ID) + } + } +} + +func prepareMockOk() *mockIwExec { + return &mockIwExec{ + devicesData: dataIwDevAP, + stationStatsData: dataIwStationDump, + } +} + +func prepareMockNoAPDevices() *mockIwExec { + return &mockIwExec{ + devicesData: dataIwDevManaged, + } +} + +func prepareMockErrOnDevices() *mockIwExec { + return &mockIwExec{ + errOnDevices: true, + } +} + +func prepareMockErrOnStationStats() *mockIwExec { + return &mockIwExec{ + devicesData: dataIwDevAP, + errOnStationStats: true, + } +} + +func prepareMockUnexpectedResponse() *mockIwExec { + return &mockIwExec{ + devicesData: []byte(` +Lorem ipsum dolor sit amet, consectetur adipiscing elit. +Nulla malesuada erat id magna mattis, eu viverra tellus rhoncus. +Fusce et felis pulvinar, posuere sem non, porttitor eros. +`), + } +} + +type mockIwExec struct { + errOnDevices bool + errOnStationStats bool + devicesData []byte + stationStatsData []byte +} + +func (m *mockIwExec) devices() ([]byte, error) { + if m.errOnDevices { + return nil, errors.New("mock.devices() error") + } + + return m.devicesData, nil +} + +func (m *mockIwExec) stationStatistics(_ string) ([]byte, error) { + if m.errOnStationStats { + return nil, errors.New("mock.stationStatistics() error") + } + return m.stationStatsData, nil +} diff --git a/src/go/plugin/go.d/modules/ap/charts.go b/src/go/plugin/go.d/modules/ap/charts.go new file mode 100644 index 000000000..b8c51c433 --- /dev/null +++ b/src/go/plugin/go.d/modules/ap/charts.go @@ -0,0 +1,147 @@ +// SPDX-License-Identifier: GPL-3.0-or-later + +package ap + +import ( + "fmt" + "strings" + + "github.com/netdata/netdata/go/plugins/plugin/go.d/agent/module" +) + +const ( + prioClients = module.Priority + iota + prioBandwidth + prioPackets + prioIssues + prioSignal + prioBitrate +) + +var apChartsTmpl = module.Charts{ + apClientsChartTmpl.Copy(), + apBandwidthChartTmpl.Copy(), + apPacketsChartTmpl.Copy(), + apIssuesChartTmpl.Copy(), + apSignalChartTmpl.Copy(), + apBitrateChartTmpl.Copy(), +} + +var ( + apClientsChartTmpl = module.Chart{ + ID: "ap_%s_%s_clients", + Title: "Connected clients", + Fam: "clients", + Units: "clients", + Ctx: "ap.clients", + Type: module.Line, + Priority: prioClients, + Dims: module.Dims{ + {ID: "ap_%s_%s_clients", Name: "clients"}, + }, + } + + apBandwidthChartTmpl = module.Chart{ + ID: "ap_%s_%s_bandwidth", + Title: "Bandwidth", + Units: "kilobits/s", + Fam: "traffic", + Ctx: "ap.net", + Type: module.Area, + Priority: prioBandwidth, + Dims: module.Dims{ + {ID: "ap_%s_%s_bw_received", Name: "received", Algo: module.Incremental, Mul: 8, Div: 1000}, + {ID: "ap_%s_%s_bw_sent", Name: "sent", Algo: module.Incremental, Mul: -8, Div: 1000}, + }, + } + + apPacketsChartTmpl = module.Chart{ + ID: "ap_%s_%s_packets", + Title: "Packets", + Fam: "packets", + Units: "packets/s", + Ctx: "ap.packets", + Type: module.Line, + Priority: prioPackets, + Dims: module.Dims{ + {ID: "ap_%s_%s_packets_received", Name: "received", Algo: module.Incremental}, + {ID: "ap_%s_%s_packets_sent", Name: "sent", Algo: module.Incremental, Mul: -1}, + }, + } + + apIssuesChartTmpl = module.Chart{ + ID: "ap_%s_%s_issues", + Title: "Transmit issues", + Fam: "issues", + Units: "issues/s", + Ctx: "ap.issues", + Type: module.Line, + Priority: prioIssues, + Dims: module.Dims{ + {ID: "ap_%s_%s_issues_retries", Name: "tx retries", Algo: module.Incremental}, + {ID: "ap_%s_%s_issues_failures", Name: "tx failures", Algo: module.Incremental, Mul: -1}, + }, + } + + apSignalChartTmpl = module.Chart{ + ID: "ap_%s_%s_signal", + Title: "Average Signal", + Units: "dBm", + Fam: "signal", + Ctx: "ap.signal", + Type: module.Line, + Priority: prioSignal, + Dims: module.Dims{ + {ID: "ap_%s_%s_average_signal", Name: "average signal", Div: precision}, + }, + } + + apBitrateChartTmpl = module.Chart{ + ID: "ap_%s_%s_bitrate", + Title: "Bitrate", + Units: "Mbps", + Fam: "bitrate", + Ctx: "ap.bitrate", + Type: module.Line, + Priority: prioBitrate, + Dims: module.Dims{ + {ID: "ap_%s_%s_bitrate_receive", Name: "receive", Div: precision}, + {ID: "ap_%s_%s_bitrate_transmit", Name: "transmit", Mul: -1, Div: precision}, + }, + } +) + +func (a *AP) addInterfaceCharts(dev *iwInterface) { + charts := apChartsTmpl.Copy() + + for _, chart := range *charts { + chart.ID = fmt.Sprintf(chart.ID, dev.name, cleanSSID(dev.ssid)) + chart.Labels = []module.Label{ + {Key: "device", Value: dev.name}, + {Key: "ssid", Value: dev.ssid}, + } + for _, dim := range chart.Dims { + dim.ID = fmt.Sprintf(dim.ID, dev.name, dev.ssid) + } + } + + if err := a.Charts().Add(*charts...); err != nil { + a.Warning(err) + } + +} + +func (a *AP) removeInterfaceCharts(dev *iwInterface) { + px := fmt.Sprintf("ap_%s_%s_", dev.name, cleanSSID(dev.ssid)) + for _, chart := range *a.Charts() { + if strings.HasPrefix(chart.ID, px) { + chart.MarkRemove() + chart.MarkNotCreated() + } + } +} + +func cleanSSID(ssid string) string { + r := strings.NewReplacer(" ", "_", ".", "_") + return r.Replace(ssid) +} diff --git a/src/go/plugin/go.d/modules/ap/collect.go b/src/go/plugin/go.d/modules/ap/collect.go new file mode 100644 index 000000000..ba32f3ef7 --- /dev/null +++ b/src/go/plugin/go.d/modules/ap/collect.go @@ -0,0 +1,221 @@ +// SPDX-License-Identifier: GPL-3.0-or-later + +package ap + +import ( + "bufio" + "bytes" + "errors" + "fmt" + "strconv" + "strings" +) + +const precision = 1000 + +type iwInterface struct { + name string + ssid string + typ string +} + +type stationStats struct { + clients int64 + rxBytes int64 + rxPackets int64 + txBytes int64 + txPackets int64 + txRetries int64 + txFailed int64 + signalAvg int64 + txBitrate float64 + rxBitrate float64 +} + +func (a *AP) collect() (map[string]int64, error) { + bs, err := a.exec.devices() + if err != nil { + return nil, err + } + + // TODO: call this periodically, not on every data collection + apInterfaces, err := parseIwDevices(bs) + if err != nil { + return nil, fmt.Errorf("parsing AP interfaces: %v", err) + } + + if len(apInterfaces) == 0 { + return nil, errors.New("no type AP interfaces found") + } + + mx := make(map[string]int64) + seen := make(map[string]bool) + + for _, iface := range apInterfaces { + bs, err = a.exec.stationStatistics(iface.name) + if err != nil { + return nil, fmt.Errorf("getting station statistics for %s: %v", iface, err) + } + + stats, err := parseIwStationStatistics(bs) + if err != nil { + return nil, fmt.Errorf("parsing station statistics for %s: %v", iface, err) + } + + key := fmt.Sprintf("%s-%s", iface.name, iface.ssid) + + seen[key] = true + + if _, ok := a.seenIfaces[key]; !ok { + a.seenIfaces[key] = iface + a.addInterfaceCharts(iface) + } + + px := fmt.Sprintf("ap_%s_%s_", iface.name, iface.ssid) + + mx[px+"clients"] = stats.clients + mx[px+"bw_received"] = stats.rxBytes + mx[px+"bw_sent"] = stats.txBytes + mx[px+"packets_received"] = stats.rxPackets + mx[px+"packets_sent"] = stats.txPackets + mx[px+"issues_retries"] = stats.txRetries + mx[px+"issues_failures"] = stats.txFailed + mx[px+"average_signal"], mx[px+"bitrate_receive"], mx[px+"bitrate_transmit"] = 0, 0, 0 + if clients := float64(stats.clients); clients > 0 { + mx[px+"average_signal"] = int64(float64(stats.signalAvg) / clients * precision) + mx[px+"bitrate_receive"] = int64(stats.rxBitrate / clients * precision) + mx[px+"bitrate_transmit"] = int64(stats.txBitrate / clients * precision) + } + } + + for key, iface := range a.seenIfaces { + if !seen[key] { + delete(a.seenIfaces, key) + a.removeInterfaceCharts(iface) + } + } + + return mx, nil +} + +func parseIwDevices(resp []byte) ([]*iwInterface, error) { + ifaces := make(map[string]*iwInterface) + var iface *iwInterface + + sc := bufio.NewScanner(bytes.NewReader(resp)) + + for sc.Scan() { + line := strings.TrimSpace(sc.Text()) + + switch { + case strings.HasPrefix(line, "Interface"): + parts := strings.Fields(line) + if len(parts) != 2 { + return nil, fmt.Errorf("invalid interface line: '%s'", line) + } + name := parts[1] + if _, ok := ifaces[name]; !ok { + iface = &iwInterface{name: name} + ifaces[name] = iface + } + case strings.HasPrefix(line, "ssid") && iface != nil: + parts := strings.Fields(line) + if len(parts) != 2 { + return nil, fmt.Errorf("invalid ssid line: '%s'", line) + } + iface.ssid = parts[1] + case strings.HasPrefix(line, "type") && iface != nil: + parts := strings.Fields(line) + if len(parts) != 2 { + return nil, fmt.Errorf("invalid type line: '%s'", line) + } + iface.typ = parts[1] + } + } + + var apIfaces []*iwInterface + + for _, iface := range ifaces { + if strings.ToLower(iface.typ) == "ap" { + apIfaces = append(apIfaces, iface) + } + } + + return apIfaces, nil +} + +func parseIwStationStatistics(resp []byte) (*stationStats, error) { + var stats stationStats + + sc := bufio.NewScanner(bytes.NewReader(resp)) + + for sc.Scan() { + line := strings.TrimSpace(sc.Text()) + + var v float64 + var err error + + switch { + case strings.HasPrefix(line, "Station"): + stats.clients++ + case strings.HasPrefix(line, "rx bytes:"): + if v, err = get3rdValue(line); err == nil { + stats.rxBytes += int64(v) + } + case strings.HasPrefix(line, "rx packets:"): + if v, err = get3rdValue(line); err == nil { + stats.rxPackets += int64(v) + } + case strings.HasPrefix(line, "tx bytes:"): + if v, err = get3rdValue(line); err == nil { + stats.txBytes += int64(v) + } + case strings.HasPrefix(line, "tx packets:"): + if v, err = get3rdValue(line); err == nil { + stats.txPackets += int64(v) + } + case strings.HasPrefix(line, "tx retries:"): + if v, err = get3rdValue(line); err == nil { + stats.txRetries += int64(v) + } + case strings.HasPrefix(line, "tx failed:"): + if v, err = get3rdValue(line); err == nil { + stats.txFailed += int64(v) + } + case strings.HasPrefix(line, "signal avg:"): + if v, err = get3rdValue(line); err == nil { + stats.signalAvg += int64(v) + } + case strings.HasPrefix(line, "tx bitrate:"): + if v, err = get3rdValue(line); err == nil { + stats.txBitrate += v + } + case strings.HasPrefix(line, "rx bitrate:"): + if v, err = get3rdValue(line); err == nil { + stats.rxBitrate += v + } + default: + continue + } + + if err != nil { + return nil, fmt.Errorf("parsing line '%s': %v", line, err) + } + } + + return &stats, nil +} + +func get3rdValue(line string) (float64, error) { + parts := strings.Fields(line) + if len(parts) < 3 { + return 0.0, errors.New("invalid format") + } + + v := parts[2] + + if v == "-" { + return 0.0, nil + } + return strconv.ParseFloat(v, 64) +} diff --git a/src/go/collectors/go.d.plugin/modules/nvidia_smi/config_schema.json b/src/go/plugin/go.d/modules/ap/config_schema.json index 0f4bb5a69..4566247f1 100644 --- a/src/go/collectors/go.d.plugin/modules/nvidia_smi/config_schema.json +++ b/src/go/plugin/go.d/modules/ap/config_schema.json @@ -1,7 +1,7 @@ { "jsonSchema": { "$schema": "http://json-schema.org/draft-07/schema#", - "title": "NVIDIA SMI collector configuration.", + "title": "Access Point collector configuration.", "type": "object", "properties": { "update_every": { @@ -13,22 +13,16 @@ }, "binary_path": { "title": "Binary path", - "description": "Path to the `nvidia-smi` binary.", + "description": "Path to the `iw` binary.", "type": "string", - "default": "nvidia-smi" + "default": "/usr/sbin/iw" }, "timeout": { "title": "Timeout", "description": "Timeout for executing the binary, specified in seconds.", "type": "number", "minimum": 0.5, - "default": 10 - }, - "use_csv_format": { - "title": "Use CSV format", - "description": "Determines the format used for requesting GPU information. If set, CSV format is used, otherwise XML.", - "type": "boolean", - "default": false + "default": 2 } }, "required": [ @@ -50,4 +44,4 @@ "ui:help": "Accepts decimals for precise control (e.g., type 1.5 for 1.5 seconds)." } } -} +}
\ No newline at end of file diff --git a/src/go/plugin/go.d/modules/ap/exec.go b/src/go/plugin/go.d/modules/ap/exec.go new file mode 100644 index 000000000..8c25f6777 --- /dev/null +++ b/src/go/plugin/go.d/modules/ap/exec.go @@ -0,0 +1,56 @@ +// SPDX-License-Identifier: GPL-3.0-or-later + +package ap + +import ( + "context" + "fmt" + "os/exec" + "time" + + "github.com/netdata/netdata/go/plugins/logger" +) + +func newIwExec(binPath string, timeout time.Duration) *iwCliExec { + return &iwCliExec{ + binPath: binPath, + timeout: timeout, + } +} + +type iwCliExec struct { + *logger.Logger + + binPath string + timeout time.Duration +} + +func (e *iwCliExec) devices() ([]byte, error) { + ctx, cancel := context.WithTimeout(context.Background(), e.timeout) + defer cancel() + + cmd := exec.CommandContext(ctx, e.binPath, "dev") + e.Debugf("executing '%s'", cmd) + + bs, err := cmd.Output() + if err != nil { + return nil, fmt.Errorf("error on '%s': %v", cmd, err) + } + + return bs, nil +} + +func (e *iwCliExec) stationStatistics(ifaceName string) ([]byte, error) { + ctx, cancel := context.WithTimeout(context.Background(), e.timeout) + defer cancel() + + cmd := exec.CommandContext(ctx, e.binPath, ifaceName, "station", "dump") + e.Debugf("executing '%s'", cmd) + + bs, err := cmd.Output() + if err != nil { + return nil, fmt.Errorf("error on '%s': %v", cmd, err) + } + + return bs, nil +} diff --git a/src/go/plugin/go.d/modules/ap/init.go b/src/go/plugin/go.d/modules/ap/init.go new file mode 100644 index 000000000..6031f6caa --- /dev/null +++ b/src/go/plugin/go.d/modules/ap/init.go @@ -0,0 +1,37 @@ +// SPDX-License-Identifier: GPL-3.0-or-later + +package ap + +import ( + "errors" + "os" + "os/exec" + "strings" +) + +func (a *AP) validateConfig() error { + if a.BinaryPath == "" { + return errors.New("no iw binary path specified") + } + return nil +} + +func (a *AP) initIwExec() (iwBinary, error) { + binPath := a.BinaryPath + + if !strings.HasPrefix(binPath, "/") { + path, err := exec.LookPath(binPath) + if err != nil { + return nil, err + } + binPath = path + } + + if _, err := os.Stat(binPath); err != nil { + return nil, err + } + + iw := newIwExec(binPath, a.Timeout.Duration()) + + return iw, nil +} diff --git a/src/go/plugin/go.d/modules/ap/integrations/access_points.md b/src/go/plugin/go.d/modules/ap/integrations/access_points.md new file mode 100644 index 000000000..fa2134ed1 --- /dev/null +++ b/src/go/plugin/go.d/modules/ap/integrations/access_points.md @@ -0,0 +1,202 @@ +<!--startmeta +custom_edit_url: "https://github.com/netdata/netdata/edit/master/src/go/plugin/go.d/modules/ap/README.md" +meta_yaml: "https://github.com/netdata/netdata/edit/master/src/go/plugin/go.d/modules/ap/metadata.yaml" +sidebar_label: "Access Points" +learn_status: "Published" +learn_rel_path: "Collecting Metrics/Linux Systems/Network" +most_popular: False +message: "DO NOT EDIT THIS FILE DIRECTLY, IT IS GENERATED BY THE COLLECTOR'S metadata.yaml FILE" +endmeta--> + +# Access Points + + +<img src="https://netdata.cloud/img/network-wired.svg" width="150"/> + + +Plugin: go.d.plugin +Module: ap + +<img src="https://img.shields.io/badge/maintained%20by-Netdata-%2300ab44" /> + +## Overview + +This collector monitors various wireless access point metrics like connected clients, bandwidth, packets, transmit issues, signal strength, and bitrate for each device and its associated SSID. + + +This tool uses the `iw` command-line utility to discover nearby access points. It starts by running `iw dev`, which provides information about all wireless interfaces. Then, for each interface identified as an access point (type AP), the `iw INTERFACE station dump` command is executed to gather relevant metrics. + + +This collector is only supported on the following platforms: + +- Linux + +This collector only supports collecting metrics from a single instance of this integration. + + +### Default Behavior + +#### Auto-Detection + +The plugin is able to auto-detect any access points on your Linux machine. + +#### Limits + +The default configuration for this integration does not impose any limits on data collection. + +#### Performance Impact + +The default configuration for this integration is not expected to impose a significant performance impact on the system. + + +## Metrics + +Metrics grouped by *scope*. + +The scope defines the instance that the metric belongs to. An instance is uniquely identified by a set of labels. + + + +### Per wireless device + +These metrics refer to the entire monitored application. + +Labels: + +| Label | Description | +|:-----------|:----------------| +| device | Wireless interface name | +| ssid | SSID | + +Metrics: + +| Metric | Dimensions | Unit | +|:------|:----------|:----| +| ap.clients | clients | clients | +| ap.net | received, sent | kilobits/s | +| ap.packets | received, sent | packets/s | +| ap.issues | retries, failures | issues/s | +| ap.signal | average signal | dBm | +| ap.bitrate | receive, transmit | Mbps | + + + +## Alerts + +There are no alerts configured by default for this integration. + + +## Setup + +### Prerequisites + +#### `iw` utility. + +Make sure the `iw` utility is installed. + + +### Configuration + +#### File + +The configuration file name for this integration is `go.d/ap.conf`. + + +You can edit the configuration file using the `edit-config` script from the +Netdata [config directory](/docs/netdata-agent/configuration/README.md#the-netdata-config-directory). + +```bash +cd /etc/netdata 2>/dev/null || cd /opt/netdata/etc/netdata +sudo ./edit-config go.d/ap.conf +``` +#### Options + +The following options can be defined globally: update_every. + + +<details open><summary>Config options</summary> + +| Name | Description | Default | Required | +|:----|:-----------|:-------|:--------:| +| update_every | Data collection frequency. | 10 | no | +| binary_path | Path to the `iw` binary. If an absolute path is provided, the collector will use it directly; otherwise, it will search for the binary in directories specified in the PATH environment variable. | /usr/sbin/iw | yes | +| timeout | Timeout for executing the binary, specified in seconds. | 2 | no | + +</details> + +#### Examples + +##### Custom binary path + +The executable is not in the directories specified in the PATH environment variable. + +```yaml +jobs: + - name: custom_iw + binary_path: /usr/local/sbin/iw + +``` + + +## Troubleshooting + +### Debug Mode + +**Important**: Debug mode is not supported for data collection jobs created via the UI using the Dyncfg feature. + +To troubleshoot issues with the `ap` collector, run the `go.d.plugin` with the debug option enabled. The output +should give you clues as to why the collector isn't working. + +- Navigate to the `plugins.d` directory, usually at `/usr/libexec/netdata/plugins.d/`. If that's not the case on + your system, open `netdata.conf` and look for the `plugins` setting under `[directories]`. + + ```bash + cd /usr/libexec/netdata/plugins.d/ + ``` + +- Switch to the `netdata` user. + + ```bash + sudo -u netdata -s + ``` + +- Run the `go.d.plugin` to debug the collector: + + ```bash + ./go.d.plugin -d -m ap + ``` + +### Getting Logs + +If you're encountering problems with the `ap` collector, follow these steps to retrieve logs and identify potential issues: + +- **Run the command** specific to your system (systemd, non-systemd, or Docker container). +- **Examine the output** for any warnings or error messages that might indicate issues. These messages should provide clues about the root cause of the problem. + +#### System with systemd + +Use the following command to view logs generated since the last Netdata service restart: + +```bash +journalctl _SYSTEMD_INVOCATION_ID="$(systemctl show --value --property=InvocationID netdata)" --namespace=netdata --grep ap +``` + +#### System without systemd + +Locate the collector log file, typically at `/var/log/netdata/collector.log`, and use `grep` to filter for collector's name: + +```bash +grep ap /var/log/netdata/collector.log +``` + +**Note**: This method shows logs from all restarts. Focus on the **latest entries** for troubleshooting current issues. + +#### Docker Container + +If your Netdata runs in a Docker container named "netdata" (replace if different), use this command: + +```bash +docker logs netdata 2>&1 | grep ap +``` + + diff --git a/src/collectors/charts.d.plugin/ap/metadata.yaml b/src/go/plugin/go.d/modules/ap/metadata.yaml index 6556b42ec..848684d30 100644 --- a/src/collectors/charts.d.plugin/ap/metadata.yaml +++ b/src/go/plugin/go.d/modules/ap/metadata.yaml @@ -1,7 +1,7 @@ -plugin_name: charts.d.plugin +plugin_name: go.d.plugin modules: - meta: - plugin_name: charts.d.plugin + plugin_name: go.d.plugin module_name: ap monitored_instance: name: Access Points @@ -23,8 +23,12 @@ modules: most_popular: false overview: data_collection: - metrics_description: "The ap collector visualizes data related to wireless access points." - method_description: "It uses the `iw` command line utility to detect access points. For each interface that is of `type AP`, it then runs `iw INTERFACE station dump` and collects statistics." + metrics_description: | + This collector monitors various wireless access point metrics like connected clients, bandwidth, packets, transmit issues, signal strength, and bitrate for each device and its associated SSID. + method_description: > + This tool uses the `iw` command-line utility to discover nearby access points. + It starts by running `iw dev`, which provides information about all wireless interfaces. + Then, for each interface identified as an access point (type AP), the `iw INTERFACE station dump` command is executed to gather relevant metrics. supported_platforms: include: [Linux] exclude: [] @@ -33,7 +37,7 @@ modules: description: "" default_behavior: auto_detection: - description: "The plugin is able to auto-detect if you are running access points on your linux box." + description: "The plugin is able to auto-detect any access points on your Linux machine." limits: description: "" performance_impact: @@ -41,53 +45,41 @@ modules: setup: prerequisites: list: - - title: "Install charts.d plugin" - description: | - If [using our official native DEB/RPM packages](/packaging/installer/UPDATE.md#determine-which-installation-method-you-used), make sure `netdata-plugin-chartsd` is installed. - title: "`iw` utility." description: "Make sure the `iw` utility is installed." configuration: file: - name: charts.d/ap.conf + name: go.d/ap.conf options: description: | - The config file is sourced by the charts.d plugin. It's a standard bash file. - - The following collapsed table contains all the options that can be configured for the ap collector. + The following options can be defined globally: update_every. folding: - title: "Config options" + title: Config options enabled: true list: - - name: ap_update_every - description: The data collection frequency. If unset, will inherit the netdata update frequency. - default_value: 1 - required: false - - name: ap_priority - description: Controls the order of charts at the netdata dashboard. - default_value: 6900 - required: false - - name: ap_retries - description: The number of retries to do in case of failure before disabling the collector. + - name: update_every + description: Data collection frequency. default_value: 10 required: false + - name: binary_path + description: Path to the `iw` binary. If an absolute path is provided, the collector will use it directly; otherwise, it will search for the binary in directories specified in the PATH environment variable. + default_value: /usr/sbin/iw + required: true + - name: timeout + description: Timeout for executing the binary, specified in seconds. + default_value: 2 + required: false examples: folding: + title: "" enabled: false - title: "Config" list: - - name: Change the collection frequency - description: Specify a custom collection frequence (update_every) for this collector + - name: Custom binary path + description: The executable is not in the directories specified in the PATH environment variable. config: | - # the data collection frequency - # if unset, will inherit the netdata update frequency - ap_update_every=10 - - # the charts priority on the dashboard - #ap_priority=6900 - - # the number of retries to do in case of failure - # before disabling the module - #ap_retries=10 + jobs: + - name: custom_iw + binary_path: /usr/local/sbin/iw troubleshooting: problems: list: [] @@ -101,46 +93,49 @@ modules: scopes: - name: wireless device description: "These metrics refer to the entire monitored application." - labels: [] + labels: + - name: device + description: Wireless interface name + - name: ssid + description: SSID metrics: - name: ap.clients - description: Connected clients to ${ssid} on ${dev} + description: Connected clients unit: "clients" chart_type: line dimensions: - name: clients - name: ap.net - description: Bandwidth for ${ssid} on ${dev} + description: Bandwidth unit: "kilobits/s" chart_type: area dimensions: - name: received - name: sent - name: ap.packets - description: Packets for ${ssid} on ${dev} + description: Packets unit: "packets/s" chart_type: line dimensions: - name: received - name: sent - name: ap.issues - description: Transmit Issues for ${ssid} on ${dev} + description: Transmit Issues unit: "issues/s" chart_type: line dimensions: - name: retries - name: failures - name: ap.signal - description: Average Signal for ${ssid} on ${dev} + description: Average Signal unit: "dBm" chart_type: line dimensions: - name: average signal - name: ap.bitrate - description: Bitrate for ${ssid} on ${dev} + description: Bitrate unit: "Mbps" chart_type: line dimensions: - name: receive - name: transmit - - name: expected diff --git a/src/go/collectors/go.d.plugin/modules/sensors/testdata/config.json b/src/go/plugin/go.d/modules/ap/testdata/config.json index 095713193..095713193 100644 --- a/src/go/collectors/go.d.plugin/modules/sensors/testdata/config.json +++ b/src/go/plugin/go.d/modules/ap/testdata/config.json diff --git a/src/go/collectors/go.d.plugin/modules/sensors/testdata/config.yaml b/src/go/plugin/go.d/modules/ap/testdata/config.yaml index baf3bcd0b..baf3bcd0b 100644 --- a/src/go/collectors/go.d.plugin/modules/sensors/testdata/config.yaml +++ b/src/go/plugin/go.d/modules/ap/testdata/config.yaml diff --git a/src/go/plugin/go.d/modules/ap/testdata/iw_dev_ap.txt b/src/go/plugin/go.d/modules/ap/testdata/iw_dev_ap.txt new file mode 100644 index 000000000..0b1e40779 --- /dev/null +++ b/src/go/plugin/go.d/modules/ap/testdata/iw_dev_ap.txt @@ -0,0 +1,25 @@ +phy#0 + Interface wlp1s0 + ifindex 2 + wdev 0x1 + addr 28:cd:c4:b8:63:cb + ssid testing + type AP + channel 1 (2412 MHz), width: 20 MHz, center1: 2412 MHz + txpower 20.00 dBm + multicast TXQ: + qsz-byt qsz-pkt flows drops marks overlmt hashcol tx-bytes tx-packets + 0 0 2 0 0 0 0 16447 226 + +phy#1 + Interface wlp1s1 + ifindex 3 + wdev 0x1 + addr 28:cd:c4:b8:63:cc + ssid testing + type AP + channel 1 (2412 MHz), width: 20 MHz, center1: 2412 MHz + txpower 20.00 dBm + multicast TXQ: + qsz-byt qsz-pkt flows drops marks overlmt hashcol tx-bytes tx-packets + 0 0 2 0 0 0 0 16447 226 diff --git a/src/go/plugin/go.d/modules/ap/testdata/iw_dev_managed.txt b/src/go/plugin/go.d/modules/ap/testdata/iw_dev_managed.txt new file mode 100644 index 000000000..5bb09a85f --- /dev/null +++ b/src/go/plugin/go.d/modules/ap/testdata/iw_dev_managed.txt @@ -0,0 +1,11 @@ +phy#0 + Interface wlp1s0 + ifindex 2 + wdev 0x1 + addr 28:cd:c4:b8:63:cb + type managed + channel 4 (2427 MHz), width: 20 MHz, center1: 2427 MHz + txpower 20.00 dBm + multicast TXQ: + qsz-byt qsz-pkt flows drops marks overlmt hashcol tx-bytes tx-packets + 0 0 0 0 0 0 0 0 0 diff --git a/src/go/plugin/go.d/modules/ap/testdata/station_dump.txt b/src/go/plugin/go.d/modules/ap/testdata/station_dump.txt new file mode 100644 index 000000000..683a6818d --- /dev/null +++ b/src/go/plugin/go.d/modules/ap/testdata/station_dump.txt @@ -0,0 +1,58 @@ +Station 7e:0d:a5:a6:91:2b (on wlp1s0) + inactive time: 58264 ms + rx bytes: 89675 + rx packets: 2446 + tx bytes: 6918 + tx packets: 30 + tx retries: 1 + tx failed: 1 + rx drop misc: 0 + signal: -44 [-51, -44] dBm + signal avg: -38 [-39, -39] dBm + tx bitrate: 65.0 MBit/s MCS 7 + tx duration: 0 us + rx bitrate: 130.0 MBit/s MCS 15 + rx duration: 0 us + authorized: yes + authenticated: yes + associated: yes + preamble: short + WMM/WME: yes + MFP: no + TDLS peer: no + DTIM period: 2 + beacon interval:100 + short slot time:yes + connected time: 796 seconds + associated at [boottime]: 12650.576s + associated at: 1720705279930 ms + current time: 1720706075344 ms +Station fa:50:db:c1:1c:18 (on wlp1s0) + inactive time: 93 ms + rx bytes: 5442 + rx packets: 85 + tx bytes: 1352 + tx packets: 8 + tx retries: 0 + tx failed: 0 + rx drop misc: 0 + signal: -31 [-31, -39] dBm + signal avg: -30 [-30, -38] dBm + tx bitrate: 65.0 MBit/s MCS 7 + tx duration: 0 us + rx bitrate: 1.0 MBit/s + rx duration: 0 us + authorized: yes + authenticated: yes + associated: yes + preamble: short + WMM/WME: yes + MFP: no + TDLS peer: no + DTIM period: 2 + beacon interval:100 + short slot time:yes + connected time: 6 seconds + associated at [boottime]: 13440.167s + associated at: 1720706069520 ms + current time: 1720706075344 ms diff --git a/src/go/collectors/go.d.plugin/modules/apache/README.md b/src/go/plugin/go.d/modules/apache/README.md index 066ee4162..066ee4162 120000 --- a/src/go/collectors/go.d.plugin/modules/apache/README.md +++ b/src/go/plugin/go.d/modules/apache/README.md diff --git a/src/go/collectors/go.d.plugin/modules/apache/apache.go b/src/go/plugin/go.d/modules/apache/apache.go index 2c958ecf5..d0869353d 100644 --- a/src/go/collectors/go.d.plugin/modules/apache/apache.go +++ b/src/go/plugin/go.d/modules/apache/apache.go @@ -9,8 +9,8 @@ import ( "sync" "time" - "github.com/netdata/netdata/go/go.d.plugin/agent/module" - "github.com/netdata/netdata/go/go.d.plugin/pkg/web" + "github.com/netdata/netdata/go/plugins/plugin/go.d/agent/module" + "github.com/netdata/netdata/go/plugins/plugin/go.d/pkg/web" ) //go:embed "config_schema.json" diff --git a/src/go/collectors/go.d.plugin/modules/apache/apache_test.go b/src/go/plugin/go.d/modules/apache/apache_test.go index 02e97ff1b..64fa6ed96 100644 --- a/src/go/collectors/go.d.plugin/modules/apache/apache_test.go +++ b/src/go/plugin/go.d/modules/apache/apache_test.go @@ -8,8 +8,8 @@ import ( "os" "testing" - "github.com/netdata/netdata/go/go.d.plugin/agent/module" - "github.com/netdata/netdata/go/go.d.plugin/pkg/web" + "github.com/netdata/netdata/go/plugins/plugin/go.d/agent/module" + "github.com/netdata/netdata/go/plugins/plugin/go.d/pkg/web" "github.com/stretchr/testify/assert" "github.com/stretchr/testify/require" diff --git a/src/go/collectors/go.d.plugin/modules/apache/charts.go b/src/go/plugin/go.d/modules/apache/charts.go index 5470aecad..ad83112d2 100644 --- a/src/go/collectors/go.d.plugin/modules/apache/charts.go +++ b/src/go/plugin/go.d/modules/apache/charts.go @@ -2,7 +2,7 @@ package apache -import "github.com/netdata/netdata/go/go.d.plugin/agent/module" +import "github.com/netdata/netdata/go/plugins/plugin/go.d/agent/module" const ( prioRequests = module.Priority + iota diff --git a/src/go/collectors/go.d.plugin/modules/apache/collect.go b/src/go/plugin/go.d/modules/apache/collect.go index 52bad9fda..79de7722a 100644 --- a/src/go/collectors/go.d.plugin/modules/apache/collect.go +++ b/src/go/plugin/go.d/modules/apache/collect.go @@ -10,8 +10,8 @@ import ( "strconv" "strings" - "github.com/netdata/netdata/go/go.d.plugin/pkg/stm" - "github.com/netdata/netdata/go/go.d.plugin/pkg/web" + "github.com/netdata/netdata/go/plugins/plugin/go.d/pkg/stm" + "github.com/netdata/netdata/go/plugins/plugin/go.d/pkg/web" ) func (a *Apache) collect() (map[string]int64, error) { diff --git a/src/go/collectors/go.d.plugin/modules/apache/config_schema.json b/src/go/plugin/go.d/modules/apache/config_schema.json index 94e30202f..b92363e93 100644 --- a/src/go/collectors/go.d.plugin/modules/apache/config_schema.json +++ b/src/go/plugin/go.d/modules/apache/config_schema.json @@ -123,6 +123,12 @@ "timeout": { "ui:help": "Accepts decimals for precise control (e.g., type 1.5 for 1.5 seconds)." }, + "username": { + "ui:widget": "password" + }, + "proxy_username": { + "ui:widget": "password" + }, "password": { "ui:widget": "password" }, diff --git a/src/go/collectors/go.d.plugin/modules/apache/init.go b/src/go/plugin/go.d/modules/apache/init.go index 00fc9d7e6..e13186f01 100644 --- a/src/go/collectors/go.d.plugin/modules/apache/init.go +++ b/src/go/plugin/go.d/modules/apache/init.go @@ -7,7 +7,7 @@ import ( "net/http" "strings" - "github.com/netdata/netdata/go/go.d.plugin/pkg/web" + "github.com/netdata/netdata/go/plugins/plugin/go.d/pkg/web" ) func (a *Apache) validateConfig() error { diff --git a/src/go/collectors/go.d.plugin/modules/apache/integrations/apache.md b/src/go/plugin/go.d/modules/apache/integrations/apache.md index 6b46ffbeb..ec9f88883 100644 --- a/src/go/collectors/go.d.plugin/modules/apache/integrations/apache.md +++ b/src/go/plugin/go.d/modules/apache/integrations/apache.md @@ -1,6 +1,6 @@ <!--startmeta -custom_edit_url: "https://github.com/netdata/netdata/edit/master/src/go/collectors/go.d.plugin/modules/apache/integrations/apache.md" -meta_yaml: "https://github.com/netdata/netdata/edit/master/src/go/collectors/go.d.plugin/modules/apache/metadata.yaml" +custom_edit_url: "https://github.com/netdata/netdata/edit/master/src/go/plugin/go.d/modules/apache/integrations/apache.md" +meta_yaml: "https://github.com/netdata/netdata/edit/master/src/go/plugin/go.d/modules/apache/metadata.yaml" sidebar_label: "Apache" learn_status: "Published" learn_rel_path: "Collecting Metrics/Web Servers and Web Proxies" @@ -213,6 +213,8 @@ jobs: ### Debug Mode +**Important**: Debug mode is not supported for data collection jobs created via the UI using the Dyncfg feature. + To troubleshoot issues with the `apache` collector, run the `go.d.plugin` with the debug option enabled. The output should give you clues as to why the collector isn't working. @@ -235,4 +237,37 @@ should give you clues as to why the collector isn't working. ./go.d.plugin -d -m apache ``` +### Getting Logs + +If you're encountering problems with the `apache` collector, follow these steps to retrieve logs and identify potential issues: + +- **Run the command** specific to your system (systemd, non-systemd, or Docker container). +- **Examine the output** for any warnings or error messages that might indicate issues. These messages should provide clues about the root cause of the problem. + +#### System with systemd + +Use the following command to view logs generated since the last Netdata service restart: + +```bash +journalctl _SYSTEMD_INVOCATION_ID="$(systemctl show --value --property=InvocationID netdata)" --namespace=netdata --grep apache +``` + +#### System without systemd + +Locate the collector log file, typically at `/var/log/netdata/collector.log`, and use `grep` to filter for collector's name: + +```bash +grep apache /var/log/netdata/collector.log +``` + +**Note**: This method shows logs from all restarts. Focus on the **latest entries** for troubleshooting current issues. + +#### Docker Container + +If your Netdata runs in a Docker container named "netdata" (replace if different), use this command: + +```bash +docker logs netdata 2>&1 | grep apache +``` + diff --git a/src/go/collectors/go.d.plugin/modules/apache/integrations/httpd.md b/src/go/plugin/go.d/modules/apache/integrations/httpd.md index 000d9b604..258365180 100644 --- a/src/go/collectors/go.d.plugin/modules/apache/integrations/httpd.md +++ b/src/go/plugin/go.d/modules/apache/integrations/httpd.md @@ -1,6 +1,6 @@ <!--startmeta -custom_edit_url: "https://github.com/netdata/netdata/edit/master/src/go/collectors/go.d.plugin/modules/apache/integrations/httpd.md" -meta_yaml: "https://github.com/netdata/netdata/edit/master/src/go/collectors/go.d.plugin/modules/apache/metadata.yaml" +custom_edit_url: "https://github.com/netdata/netdata/edit/master/src/go/plugin/go.d/modules/apache/integrations/httpd.md" +meta_yaml: "https://github.com/netdata/netdata/edit/master/src/go/plugin/go.d/modules/apache/metadata.yaml" sidebar_label: "HTTPD" learn_status: "Published" learn_rel_path: "Collecting Metrics/Web Servers and Web Proxies" @@ -213,6 +213,8 @@ jobs: ### Debug Mode +**Important**: Debug mode is not supported for data collection jobs created via the UI using the Dyncfg feature. + To troubleshoot issues with the `apache` collector, run the `go.d.plugin` with the debug option enabled. The output should give you clues as to why the collector isn't working. @@ -235,4 +237,37 @@ should give you clues as to why the collector isn't working. ./go.d.plugin -d -m apache ``` +### Getting Logs + +If you're encountering problems with the `apache` collector, follow these steps to retrieve logs and identify potential issues: + +- **Run the command** specific to your system (systemd, non-systemd, or Docker container). +- **Examine the output** for any warnings or error messages that might indicate issues. These messages should provide clues about the root cause of the problem. + +#### System with systemd + +Use the following command to view logs generated since the last Netdata service restart: + +```bash +journalctl _SYSTEMD_INVOCATION_ID="$(systemctl show --value --property=InvocationID netdata)" --namespace=netdata --grep apache +``` + +#### System without systemd + +Locate the collector log file, typically at `/var/log/netdata/collector.log`, and use `grep` to filter for collector's name: + +```bash +grep apache /var/log/netdata/collector.log +``` + +**Note**: This method shows logs from all restarts. Focus on the **latest entries** for troubleshooting current issues. + +#### Docker Container + +If your Netdata runs in a Docker container named "netdata" (replace if different), use this command: + +```bash +docker logs netdata 2>&1 | grep apache +``` + diff --git a/src/go/collectors/go.d.plugin/modules/apache/metadata.yaml b/src/go/plugin/go.d/modules/apache/metadata.yaml index bfab73fcf..bfab73fcf 100644 --- a/src/go/collectors/go.d.plugin/modules/apache/metadata.yaml +++ b/src/go/plugin/go.d/modules/apache/metadata.yaml diff --git a/src/go/collectors/go.d.plugin/modules/apache/metrics.go b/src/go/plugin/go.d/modules/apache/metrics.go index 953bd42c3..953bd42c3 100644 --- a/src/go/collectors/go.d.plugin/modules/apache/metrics.go +++ b/src/go/plugin/go.d/modules/apache/metrics.go diff --git a/src/go/collectors/go.d.plugin/modules/apache/testdata/config.json b/src/go/plugin/go.d/modules/apache/testdata/config.json index 984c3ed6e..984c3ed6e 100644 --- a/src/go/collectors/go.d.plugin/modules/apache/testdata/config.json +++ b/src/go/plugin/go.d/modules/apache/testdata/config.json diff --git a/src/go/collectors/go.d.plugin/modules/apache/testdata/config.yaml b/src/go/plugin/go.d/modules/apache/testdata/config.yaml index 8558b61cc..8558b61cc 100644 --- a/src/go/collectors/go.d.plugin/modules/apache/testdata/config.yaml +++ b/src/go/plugin/go.d/modules/apache/testdata/config.yaml diff --git a/src/go/collectors/go.d.plugin/modules/apache/testdata/extended-status-mpm-event.txt b/src/go/plugin/go.d/modules/apache/testdata/extended-status-mpm-event.txt index 136b69363..136b69363 100644 --- a/src/go/collectors/go.d.plugin/modules/apache/testdata/extended-status-mpm-event.txt +++ b/src/go/plugin/go.d/modules/apache/testdata/extended-status-mpm-event.txt diff --git a/src/go/collectors/go.d.plugin/modules/apache/testdata/extended-status-mpm-prefork.txt b/src/go/plugin/go.d/modules/apache/testdata/extended-status-mpm-prefork.txt index eeafb4983..eeafb4983 100644 --- a/src/go/collectors/go.d.plugin/modules/apache/testdata/extended-status-mpm-prefork.txt +++ b/src/go/plugin/go.d/modules/apache/testdata/extended-status-mpm-prefork.txt diff --git a/src/go/collectors/go.d.plugin/modules/apache/testdata/lighttpd-status.txt b/src/go/plugin/go.d/modules/apache/testdata/lighttpd-status.txt index 07d8e06e8..07d8e06e8 100644 --- a/src/go/collectors/go.d.plugin/modules/apache/testdata/lighttpd-status.txt +++ b/src/go/plugin/go.d/modules/apache/testdata/lighttpd-status.txt diff --git a/src/go/collectors/go.d.plugin/modules/apache/testdata/simple-status-mpm-event.txt b/src/go/plugin/go.d/modules/apache/testdata/simple-status-mpm-event.txt index 8093eacf9..8093eacf9 100644 --- a/src/go/collectors/go.d.plugin/modules/apache/testdata/simple-status-mpm-event.txt +++ b/src/go/plugin/go.d/modules/apache/testdata/simple-status-mpm-event.txt diff --git a/src/collectors/python.d.plugin/beanstalk/README.md b/src/go/plugin/go.d/modules/beanstalk/README.md index 4efe13889..4efe13889 120000 --- a/src/collectors/python.d.plugin/beanstalk/README.md +++ b/src/go/plugin/go.d/modules/beanstalk/README.md diff --git a/src/go/plugin/go.d/modules/beanstalk/beanstalk.go b/src/go/plugin/go.d/modules/beanstalk/beanstalk.go new file mode 100644 index 000000000..f37cbeda4 --- /dev/null +++ b/src/go/plugin/go.d/modules/beanstalk/beanstalk.go @@ -0,0 +1,123 @@ +// SPDX-License-Identifier: GPL-3.0-or-later + +package beanstalk + +import ( + _ "embed" + "errors" + "fmt" + "time" + + "github.com/netdata/netdata/go/plugins/logger" + "github.com/netdata/netdata/go/plugins/plugin/go.d/agent/module" + "github.com/netdata/netdata/go/plugins/plugin/go.d/pkg/matcher" + "github.com/netdata/netdata/go/plugins/plugin/go.d/pkg/web" +) + +//go:embed "config_schema.json" +var configSchema string + +func init() { + module.Register("beanstalk", module.Creator{ + JobConfigSchema: configSchema, + Create: func() module.Module { return New() }, + Config: func() any { return &Config{} }, + }) +} + +func New() *Beanstalk { + return &Beanstalk{ + Config: Config{ + Address: "127.0.0.1:11300", + Timeout: web.Duration(time.Second * 1), + TubeSelector: "*", + }, + + charts: statsCharts.Copy(), + newConn: newBeanstalkConn, + discoverTubesEvery: time.Minute * 1, + tubeSr: matcher.TRUE(), + seenTubes: make(map[string]bool), + } +} + +type Config struct { + UpdateEvery int `yaml:"update_every,omitempty" json:"update_every"` + Address string `yaml:"address" json:"address"` + Timeout web.Duration `yaml:"timeout,omitempty" json:"timeout"` + TubeSelector string `yaml:"tube_selector,omitempty" json:"tube_selector"` +} + +type Beanstalk struct { + module.Base + Config `yaml:",inline" json:""` + + charts *module.Charts + + newConn func(Config, *logger.Logger) beanstalkConn + conn beanstalkConn + + discoverTubesEvery time.Duration + lastDiscoverTubesTime time.Time + discoveredTubes []string + tubeSr matcher.Matcher + seenTubes map[string]bool +} + +func (b *Beanstalk) Configuration() any { + return b.Config +} + +func (b *Beanstalk) Init() error { + if err := b.validateConfig(); err != nil { + return fmt.Errorf("config validation: %v", err) + } + + sr, err := b.initTubeSelector() + if err != nil { + return fmt.Errorf("failed to init tube selector: %v", err) + } + b.tubeSr = sr + + return nil +} + +func (b *Beanstalk) Check() error { + mx, err := b.collect() + if err != nil { + b.Error(err) + return err + } + + if len(mx) == 0 { + return errors.New("no metrics collected") + } + + return nil +} + +func (b *Beanstalk) Charts() *module.Charts { + return b.charts +} + +func (b *Beanstalk) Collect() map[string]int64 { + mx, err := b.collect() + if err != nil { + b.Error(err) + } + + if len(mx) == 0 { + return nil + } + + return mx +} + +func (b *Beanstalk) Cleanup() { + if b.conn != nil { + if err := b.conn.disconnect(); err != nil { + b.Warningf("error on disconnect: %s", err) + } + b.conn = nil + } +} diff --git a/src/go/plugin/go.d/modules/beanstalk/beanstalk_test.go b/src/go/plugin/go.d/modules/beanstalk/beanstalk_test.go new file mode 100644 index 000000000..da1fcaf08 --- /dev/null +++ b/src/go/plugin/go.d/modules/beanstalk/beanstalk_test.go @@ -0,0 +1,384 @@ +// SPDX-License-Identifier: GPL-3.0-or-later + +package beanstalk + +import ( + "bufio" + "errors" + "fmt" + "net" + "os" + "strings" + "testing" + "time" + + "github.com/netdata/netdata/go/plugins/plugin/go.d/agent/module" + + "github.com/stretchr/testify/assert" + "github.com/stretchr/testify/require" +) + +var ( + dataConfigJSON, _ = os.ReadFile("testdata/config.json") + dataConfigYAML, _ = os.ReadFile("testdata/config.yaml") + + dataStats, _ = os.ReadFile("testdata/stats.txt") + dataListTubes, _ = os.ReadFile("testdata/list-tubes.txt") + dataStatsTubeDefault, _ = os.ReadFile("testdata/stats-tube-default.txt") +) + +func Test_testDataIsValid(t *testing.T) { + for name, data := range map[string][]byte{ + "dataConfigJSON": dataConfigJSON, + "dataConfigYAML": dataConfigYAML, + "dataStats": dataStats, + "dataListTubes": dataListTubes, + "dataStatsTubeDefault": dataStatsTubeDefault, + } { + require.NotNil(t, data, name) + } +} + +func TestBeanstalk_ConfigurationSerialize(t *testing.T) { + module.TestConfigurationSerialize(t, &Beanstalk{}, dataConfigJSON, dataConfigYAML) +} + +func TestBeanstalk_Init(t *testing.T) { + tests := map[string]struct { + config Config + wantFail bool + }{ + "success with default config": { + wantFail: false, + config: New().Config, + }, + "fails if address not set": { + wantFail: true, + config: func() Config { + conf := New().Config + conf.Address = "" + return conf + }(), + }, + } + + for name, test := range tests { + t.Run(name, func(t *testing.T) { + beans := New() + beans.Config = test.config + + if test.wantFail { + assert.Error(t, beans.Init()) + } else { + assert.NoError(t, beans.Init()) + } + }) + } +} + +func TestBeanstalk_Charts(t *testing.T) { + assert.NotNil(t, New().Charts()) +} + +func TestBeanstalk_Check(t *testing.T) { + tests := map[string]struct { + prepare func() (*Beanstalk, *mockBeanstalkDaemon) + wantFail bool + }{ + "success on valid response": { + wantFail: false, + prepare: prepareCaseOk, + }, + "fails on unexpected response": { + wantFail: true, + prepare: prepareCaseUnexpectedResponse, + }, + "fails on connection refused": { + wantFail: true, + prepare: prepareCaseConnectionRefused, + }, + } + for name, test := range tests { + t.Run(name, func(t *testing.T) { + beanstalk, daemon := test.prepare() + + defer func() { + assert.NoError(t, daemon.Close(), "daemon.Close()") + }() + go func() { + assert.NoError(t, daemon.Run(), "daemon.Run()") + }() + + select { + case <-daemon.started: + case <-time.After(time.Second * 3): + t.Errorf("mock beanstalk daemon start timed out") + } + + require.NoError(t, beanstalk.Init()) + + if test.wantFail { + assert.Error(t, beanstalk.Check()) + } else { + assert.NoError(t, beanstalk.Check()) + } + + beanstalk.Cleanup() + + select { + case <-daemon.stopped: + case <-time.After(time.Second * 3): + t.Errorf("mock beanstalk daemon stop timed out") + } + }) + } +} + +func TestBeanstalk_Collect(t *testing.T) { + tests := map[string]struct { + prepare func() (*Beanstalk, *mockBeanstalkDaemon) + wantMetrics map[string]int64 + wantCharts int + }{ + "success on valid response": { + prepare: prepareCaseOk, + wantMetrics: map[string]int64{ + "binlog-records-migrated": 0, + "binlog-records-written": 0, + "cmd-bury": 0, + "cmd-delete": 0, + "cmd-ignore": 0, + "cmd-kick": 0, + "cmd-list-tube-used": 0, + "cmd-list-tubes": 317, + "cmd-list-tubes-watched": 0, + "cmd-pause-tube": 0, + "cmd-peek": 0, + "cmd-peek-buried": 0, + "cmd-peek-delayed": 0, + "cmd-peek-ready": 0, + "cmd-put": 0, + "cmd-release": 0, + "cmd-reserve": 0, + "cmd-reserve-with-timeout": 0, + "cmd-stats": 23619, + "cmd-stats-job": 0, + "cmd-stats-tube": 18964, + "cmd-touch": 0, + "cmd-use": 0, + "cmd-watch": 0, + "current-connections": 2, + "current-jobs-buried": 0, + "current-jobs-delayed": 0, + "current-jobs-ready": 0, + "current-jobs-reserved": 0, + "current-jobs-urgent": 0, + "current-producers": 0, + "current-tubes": 1, + "current-waiting": 0, + "current-workers": 0, + "job-timeouts": 0, + "rusage-stime": 3922, + "rusage-utime": 1602, + "total-connections": 72, + "total-jobs": 0, + "tube_default_cmd-delete": 0, + "tube_default_cmd-pause-tube": 0, + "tube_default_current-jobs-buried": 0, + "tube_default_current-jobs-delayed": 0, + "tube_default_current-jobs-ready": 0, + "tube_default_current-jobs-reserved": 0, + "tube_default_current-jobs-urgent": 0, + "tube_default_current-using": 2, + "tube_default_current-waiting": 0, + "tube_default_current-watching": 2, + "tube_default_pause": 0, + "tube_default_pause-time-left": 0, + "tube_default_total-jobs": 0, + "uptime": 105881, + }, + wantCharts: len(statsCharts) + len(tubeChartsTmpl)*1, + }, + "fails on unexpected response": { + prepare: prepareCaseUnexpectedResponse, + wantCharts: len(statsCharts), + }, + "fails on connection refused": { + prepare: prepareCaseConnectionRefused, + wantCharts: len(statsCharts), + }, + } + + for name, test := range tests { + t.Run(name, func(t *testing.T) { + beanstalk, daemon := test.prepare() + + defer func() { + assert.NoError(t, daemon.Close(), "daemon.Close()") + }() + go func() { + assert.NoError(t, daemon.Run(), "daemon.Run()") + }() + + select { + case <-daemon.started: + case <-time.After(time.Second * 3): + t.Errorf("mock beanstalk daemon start timed out") + } + + require.NoError(t, beanstalk.Init()) + + mx := beanstalk.Collect() + + require.Equal(t, test.wantMetrics, mx) + + assert.Equal(t, test.wantCharts, len(*beanstalk.Charts()), "want charts") + + if len(test.wantMetrics) > 0 { + module.TestMetricsHasAllChartsDims(t, beanstalk.Charts(), mx) + } + + beanstalk.Cleanup() + + select { + case <-daemon.stopped: + case <-time.After(time.Second * 3): + t.Errorf("mock beanstalk daemon stop timed out") + } + }) + } +} + +func prepareCaseOk() (*Beanstalk, *mockBeanstalkDaemon) { + daemon := &mockBeanstalkDaemon{ + addr: "127.0.0.1:65001", + started: make(chan struct{}), + stopped: make(chan struct{}), + dataStats: dataStats, + dataListTubes: dataListTubes, + dataStatsTube: dataStatsTubeDefault, + } + + beanstalk := New() + beanstalk.Address = daemon.addr + + return beanstalk, daemon +} + +func prepareCaseUnexpectedResponse() (*Beanstalk, *mockBeanstalkDaemon) { + daemon := &mockBeanstalkDaemon{ + addr: "127.0.0.1:65001", + started: make(chan struct{}), + stopped: make(chan struct{}), + dataStats: []byte("INTERNAL_ERROR\n"), + dataListTubes: []byte("INTERNAL_ERROR\n"), + dataStatsTube: []byte("INTERNAL_ERROR\n"), + } + + beanstalk := New() + beanstalk.Address = daemon.addr + + return beanstalk, daemon +} + +func prepareCaseConnectionRefused() (*Beanstalk, *mockBeanstalkDaemon) { + ch := make(chan struct{}) + close(ch) + daemon := &mockBeanstalkDaemon{ + addr: "127.0.0.1:65001", + dontStart: true, + started: ch, + stopped: ch, + } + + beanstalk := New() + beanstalk.Address = daemon.addr + + return beanstalk, daemon +} + +type mockBeanstalkDaemon struct { + addr string + srv net.Listener + started chan struct{} + stopped chan struct{} + dontStart bool + + dataStats []byte + dataListTubes []byte + dataStatsTube []byte +} + +func (m *mockBeanstalkDaemon) Run() error { + if m.dontStart { + return nil + } + + srv, err := net.Listen("tcp", m.addr) + if err != nil { + return err + } + + m.srv = srv + + close(m.started) + defer close(m.stopped) + + return m.handleConnections() +} + +func (m *mockBeanstalkDaemon) Close() error { + if m.srv != nil { + err := m.srv.Close() + m.srv = nil + return err + } + return nil +} + +func (m *mockBeanstalkDaemon) handleConnections() error { + conn, err := m.srv.Accept() + if err != nil || conn == nil { + return errors.New("could not accept connection") + } + return m.handleConnection(conn) +} + +func (m *mockBeanstalkDaemon) handleConnection(conn net.Conn) error { + defer func() { _ = conn.Close() }() + + rw := bufio.NewReadWriter(bufio.NewReader(conn), bufio.NewWriter(conn)) + var line string + var err error + + for { + if line, err = rw.ReadString('\n'); err != nil { + return fmt.Errorf("error reading from connection: %v", err) + } + + line = strings.TrimSpace(line) + + cmd, param, _ := strings.Cut(line, " ") + + switch cmd { + case cmdQuit: + return nil + case cmdStats: + _, err = rw.Write(m.dataStats) + case cmdListTubes: + _, err = rw.Write(m.dataListTubes) + case cmdStatsTube: + if param == "default" { + _, err = rw.Write(m.dataStatsTube) + } else { + _, err = rw.WriteString("NOT_FOUND\n") + } + default: + return fmt.Errorf("unexpected command: %s", line) + } + _ = rw.Flush() + if err != nil { + return err + } + } +} diff --git a/src/go/plugin/go.d/modules/beanstalk/charts.go b/src/go/plugin/go.d/modules/beanstalk/charts.go new file mode 100644 index 000000000..fb2f22628 --- /dev/null +++ b/src/go/plugin/go.d/modules/beanstalk/charts.go @@ -0,0 +1,333 @@ +// SPDX-License-Identifier: GPL-3.0-or-later + +package beanstalk + +import ( + "fmt" + "strings" + + "github.com/netdata/netdata/go/plugins/plugin/go.d/agent/module" +) + +const ( + prioCurrentJobs = module.Priority + iota + prioJobsRate + prioJobsTimeouts + + prioCurrentTubes + + prioCommandsRate + + prioCurrentConnections + prioConnectionsRate + + prioBinlogRecords + + prioCpuUsage + + prioUptime + + prioTubeCurrentJobs + prioTubeJobsRate + + prioTubeCommands + + prioTubeCurrentConnections + + prioTubePauseTime +) + +var ( + statsCharts = module.Charts{ + currentJobs.Copy(), + jobsRateChart.Copy(), + jobsTimeoutsChart.Copy(), + + currentTubesChart.Copy(), + + commandsRateChart.Copy(), + + currentConnectionsChart.Copy(), + connectionsRateChart.Copy(), + + binlogRecordsChart.Copy(), + + cpuUsageChart.Copy(), + + uptimeChart.Copy(), + } + + currentJobs = module.Chart{ + ID: "current_jobs", + Title: "Current Jobs", + Units: "jobs", + Fam: "jobs", + Ctx: "beanstalk.current_jobs", + Type: module.Stacked, + Priority: prioCurrentJobs, + Dims: module.Dims{ + {ID: "current-jobs-ready", Name: "ready"}, + {ID: "current-jobs-buried", Name: "buried"}, + {ID: "current-jobs-urgent", Name: "urgent"}, + {ID: "current-jobs-delayed", Name: "delayed"}, + {ID: "current-jobs-reserved", Name: "reserved"}, + }, + } + jobsRateChart = module.Chart{ + ID: "jobs_rate", + Title: "Jobs Rate", + Units: "jobs/s", + Fam: "jobs", + Ctx: "beanstalk.jobs_rate", + Type: module.Line, + Priority: prioJobsRate, + Dims: module.Dims{ + {ID: "total-jobs", Name: "created", Algo: module.Incremental}, + }, + } + jobsTimeoutsChart = module.Chart{ + ID: "jobs_timeouts", + Title: "Timed Out Jobs", + Units: "jobs/s", + Fam: "jobs", + Ctx: "beanstalk.jobs_timeouts", + Type: module.Line, + Priority: prioJobsTimeouts, + Dims: module.Dims{ + {ID: "job-timeouts", Name: "timeouts", Algo: module.Incremental}, + }, + } + + currentTubesChart = module.Chart{ + ID: "current_tubes", + Title: "Current Tubes", + Units: "tubes", + Fam: "tubes", + Ctx: "beanstalk.current_tubes", + Type: module.Line, + Priority: prioCurrentTubes, + Dims: module.Dims{ + {ID: "current-tubes", Name: "tubes"}, + }, + } + + commandsRateChart = module.Chart{ + ID: "commands_rate", + Title: "Commands Rate", + Units: "commands/s", + Fam: "commands", + Ctx: "beanstalk.commands_rate", + Type: module.Stacked, + Priority: prioCommandsRate, + Dims: module.Dims{ + {ID: "cmd-put", Name: "put", Algo: module.Incremental}, + {ID: "cmd-peek", Name: "peek", Algo: module.Incremental}, + {ID: "cmd-peek-ready", Name: "peek-ready", Algo: module.Incremental}, + {ID: "cmd-peek-delayed", Name: "peek-delayed", Algo: module.Incremental}, + {ID: "cmd-peek-buried", Name: "peek-buried", Algo: module.Incremental}, + {ID: "cmd-reserve", Name: "reserve", Algo: module.Incremental}, + {ID: "cmd-reserve-with-timeout", Name: "reserve-with-timeout", Algo: module.Incremental}, + {ID: "cmd-touch", Name: "touch", Algo: module.Incremental}, + {ID: "cmd-use", Name: "use", Algo: module.Incremental}, + {ID: "cmd-watch", Name: "watch", Algo: module.Incremental}, + {ID: "cmd-ignore", Name: "ignore", Algo: module.Incremental}, + {ID: "cmd-delete", Name: "delete", Algo: module.Incremental}, + {ID: "cmd-release", Name: "release", Algo: module.Incremental}, + {ID: "cmd-bury", Name: "bury", Algo: module.Incremental}, + {ID: "cmd-kick", Name: "kick", Algo: module.Incremental}, + {ID: "cmd-stats", Name: "stats", Algo: module.Incremental}, + {ID: "cmd-stats-job", Name: "stats-job", Algo: module.Incremental}, + {ID: "cmd-stats-tube", Name: "stats-tube", Algo: module.Incremental}, + {ID: "cmd-list-tubes", Name: "list-tubes", Algo: module.Incremental}, + {ID: "cmd-list-tube-used", Name: "list-tube-used", Algo: module.Incremental}, + {ID: "cmd-list-tubes-watched", Name: "list-tubes-watched", Algo: module.Incremental}, + {ID: "cmd-pause-tube", Name: "pause-tube", Algo: module.Incremental}, + }, + } + + currentConnectionsChart = module.Chart{ + ID: "current_connections", + Title: "Current Connections", + Units: "connections", + Fam: "connections", + Ctx: "beanstalk.current_connections", + Type: module.Line, + Priority: prioCurrentConnections, + Dims: module.Dims{ + {ID: "current-connections", Name: "open"}, + {ID: "current-producers", Name: "producers"}, + {ID: "current-workers", Name: "workers"}, + {ID: "current-waiting", Name: "waiting"}, + }, + } + connectionsRateChart = module.Chart{ + ID: "connections_rate", + Title: "Connections Rate", + Units: "connections/s", + Fam: "connections", + Ctx: "beanstalk.connections_rate", + Type: module.Line, + Priority: prioConnectionsRate, + Dims: module.Dims{ + {ID: "total-connections", Name: "created", Algo: module.Incremental}, + }, + } + + binlogRecordsChart = module.Chart{ + ID: "binlog_records", + Title: "Binlog Records", + Units: "records/s", + Fam: "binlog", + Ctx: "beanstalk.binlog_records", + Type: module.Line, + Priority: prioBinlogRecords, + Dims: module.Dims{ + {ID: "binlog-records-written", Name: "written", Algo: module.Incremental}, + {ID: "binlog-records-migrated", Name: "migrated", Algo: module.Incremental}, + }, + } + + cpuUsageChart = module.Chart{ + ID: "cpu_usage", + Title: "CPU Usage", + Units: "percent", + Fam: "cpu usage", + Ctx: "beanstalk.cpu_usage", + Type: module.Stacked, + Priority: prioCpuUsage, + Dims: module.Dims{ + {ID: "rusage-utime", Name: "user", Algo: module.Incremental, Mul: 100, Div: 1000}, + {ID: "rusage-stime", Name: "system", Algo: module.Incremental, Mul: 100, Div: 1000}, + }, + } + + uptimeChart = module.Chart{ + ID: "uptime", + Title: "Uptime", + Units: "seconds", + Fam: "uptime", + Ctx: "beanstalk.uptime", + Type: module.Line, + Priority: prioUptime, + Dims: module.Dims{ + {ID: "uptime"}, + }, + } +) + +var ( + tubeChartsTmpl = module.Charts{ + tubeCurrentJobsChartTmpl.Copy(), + tubeJobsRateChartTmpl.Copy(), + + tubeCommandsRateChartTmpl.Copy(), + + tubeCurrentConnectionsChartTmpl.Copy(), + + tubePauseTimeChartTmpl.Copy(), + } + + tubeCurrentJobsChartTmpl = module.Chart{ + ID: "tube_%s_current_jobs", + Title: "Tube Current Jobs", + Units: "jobs", + Fam: "tube jobs", + Ctx: "beanstalk.tube_current_jobs", + Type: module.Stacked, + Priority: prioTubeCurrentJobs, + Dims: module.Dims{ + {ID: "tube_%s_current-jobs-ready", Name: "ready"}, + {ID: "tube_%s_current-jobs-buried", Name: "buried"}, + {ID: "tube_%s_current-jobs-urgent", Name: "urgent"}, + {ID: "tube_%s_current-jobs-delayed", Name: "delayed"}, + {ID: "tube_%s_current-jobs-reserved", Name: "reserved"}, + }, + } + tubeJobsRateChartTmpl = module.Chart{ + ID: "tube_%s_jobs_rate", + Title: "Tube Jobs Rate", + Units: "jobs/s", + Fam: "tube jobs", + Ctx: "beanstalk.tube_jobs_rate", + Type: module.Line, + Priority: prioTubeJobsRate, + Dims: module.Dims{ + {ID: "tube_%s_total-jobs", Name: "created", Algo: module.Incremental}, + }, + } + tubeCommandsRateChartTmpl = module.Chart{ + ID: "tube_%s_commands_rate", + Title: "Tube Commands", + Units: "commands/s", + Fam: "tube commands", + Ctx: "beanstalk.tube_commands_rate", + Type: module.Stacked, + Priority: prioTubeCommands, + Dims: module.Dims{ + {ID: "tube_%s_cmd-delete", Name: "delete", Algo: module.Incremental}, + {ID: "tube_%s_cmd-pause-tube", Name: "pause-tube", Algo: module.Incremental}, + }, + } + tubeCurrentConnectionsChartTmpl = module.Chart{ + ID: "tube_%s_current_connections", + Title: "Tube Current Connections", + Units: "connections", + Fam: "tube connections", + Ctx: "beanstalk.tube_current_connections", + Type: module.Stacked, + Priority: prioTubeCurrentConnections, + Dims: module.Dims{ + {ID: "tube_%s_current-using", Name: "using"}, + {ID: "tube_%s_current-waiting", Name: "waiting"}, + {ID: "tube_%s_current-watching", Name: "watching"}, + }, + } + tubePauseTimeChartTmpl = module.Chart{ + ID: "tube_%s_pause_time", + Title: "Tube Pause Time", + Units: "seconds", + Fam: "tube pause", + Ctx: "beanstalk.tube_pause", + Type: module.Line, + Priority: prioTubePauseTime, + Dims: module.Dims{ + {ID: "tube_%s_pause", Name: "since"}, + {ID: "tube_%s_pause-time-left", Name: "left"}, + }, + } +) + +func (b *Beanstalk) addTubeCharts(name string) { + charts := tubeChartsTmpl.Copy() + + for _, chart := range *charts { + chart.ID = fmt.Sprintf(chart.ID, cleanTubeName(name)) + chart.Labels = []module.Label{ + {Key: "tube_name", Value: name}, + } + + for _, dim := range chart.Dims { + dim.ID = fmt.Sprintf(dim.ID, name) + } + } + + if err := b.Charts().Add(*charts...); err != nil { + b.Warning(err) + } +} + +func (b *Beanstalk) removeTubeCharts(name string) { + px := fmt.Sprintf("tube_%s_", cleanTubeName(name)) + + for _, chart := range *b.Charts() { + if strings.HasPrefix(chart.ID, px) { + chart.MarkRemove() + chart.MarkNotCreated() + } + } +} + +func cleanTubeName(name string) string { + r := strings.NewReplacer(" ", "_", ".", "_", ",", "_") + return r.Replace(name) +} diff --git a/src/go/plugin/go.d/modules/beanstalk/client.go b/src/go/plugin/go.d/modules/beanstalk/client.go new file mode 100644 index 000000000..66a8b1cef --- /dev/null +++ b/src/go/plugin/go.d/modules/beanstalk/client.go @@ -0,0 +1,249 @@ +// SPDX-License-Identifier: GPL-3.0-or-later + +package beanstalk + +import ( + "errors" + "fmt" + "strconv" + "strings" + + "github.com/netdata/netdata/go/plugins/logger" + "github.com/netdata/netdata/go/plugins/plugin/go.d/pkg/socket" + + "gopkg.in/yaml.v2" +) + +type beanstalkConn interface { + connect() error + disconnect() error + queryStats() (*beanstalkdStats, error) + queryListTubes() ([]string, error) + queryStatsTube(string) (*tubeStats, error) +} + +// https://github.com/beanstalkd/beanstalkd/blob/91c54fc05dc759ef27459ce4383934e1a4f2fb4b/doc/protocol.txt#L553 +type beanstalkdStats struct { + CurrentJobsUrgent int64 `yaml:"current-jobs-urgent" stm:"current-jobs-urgent"` + CurrentJobsReady int64 `yaml:"current-jobs-ready" stm:"current-jobs-ready"` + CurrentJobsReserved int64 `yaml:"current-jobs-reserved" stm:"current-jobs-reserved"` + CurrentJobsDelayed int64 `yaml:"current-jobs-delayed" stm:"current-jobs-delayed"` + CurrentJobsBuried int64 `yaml:"current-jobs-buried" stm:"current-jobs-buried"` + CmdPut int64 `yaml:"cmd-put" stm:"cmd-put"` + CmdPeek int64 `yaml:"cmd-peek" stm:"cmd-peek"` + CmdPeekReady int64 `yaml:"cmd-peek-ready" stm:"cmd-peek-ready"` + CmdPeekDelayed int64 `yaml:"cmd-peek-delayed" stm:"cmd-peek-delayed"` + CmdPeekBuried int64 `yaml:"cmd-peek-buried" stm:"cmd-peek-buried"` + CmdReserve int64 `yaml:"cmd-reserve" stm:"cmd-reserve"` + CmdReserveWithTimeout int64 `yaml:"cmd-reserve-with-timeout" stm:"cmd-reserve-with-timeout"` + CmdTouch int64 `yaml:"cmd-touch" stm:"cmd-touch"` + CmdUse int64 `yaml:"cmd-use" stm:"cmd-use"` + CmdWatch int64 `yaml:"cmd-watch" stm:"cmd-watch"` + CmdIgnore int64 `yaml:"cmd-ignore" stm:"cmd-ignore"` + CmdDelete int64 `yaml:"cmd-delete" stm:"cmd-delete"` + CmdRelease int64 `yaml:"cmd-release" stm:"cmd-release"` + CmdBury int64 `yaml:"cmd-bury" stm:"cmd-bury"` + CmdKick int64 `yaml:"cmd-kick" stm:"cmd-kick"` + CmdStats int64 `yaml:"cmd-stats" stm:"cmd-stats"` + CmdStatsJob int64 `yaml:"cmd-stats-job" stm:"cmd-stats-job"` + CmdStatsTube int64 `yaml:"cmd-stats-tube" stm:"cmd-stats-tube"` + CmdListTubes int64 `yaml:"cmd-list-tubes" stm:"cmd-list-tubes"` + CmdListTubeUsed int64 `yaml:"cmd-list-tube-used" stm:"cmd-list-tube-used"` + CmdListTubesWatched int64 `yaml:"cmd-list-tubes-watched" stm:"cmd-list-tubes-watched"` + CmdPauseTube int64 `yaml:"cmd-pause-tube" stm:"cmd-pause-tube"` + JobTimeouts int64 `yaml:"job-timeouts" stm:"job-timeouts"` + TotalJobs int64 `yaml:"total-jobs" stm:"total-jobs"` + CurrentTubes int64 `yaml:"current-tubes" stm:"current-tubes"` + CurrentConnections int64 `yaml:"current-connections" stm:"current-connections"` + CurrentProducers int64 `yaml:"current-producers" stm:"current-producers"` + CurrentWorkers int64 `yaml:"current-workers" stm:"current-workers"` + CurrentWaiting int64 `yaml:"current-waiting" stm:"current-waiting"` + TotalConnections int64 `yaml:"total-connections" stm:"total-connections"` + RusageUtime float64 `yaml:"rusage-utime" stm:"rusage-utime,1000,1"` + RusageStime float64 `yaml:"rusage-stime" stm:"rusage-stime,1000,1"` + Uptime int64 `yaml:"uptime" stm:"uptime"` + BinlogRecordsWritten int64 `yaml:"binlog-records-written" stm:"binlog-records-written"` + BinlogRecordsMigrated int64 `yaml:"binlog-records-migrated" stm:"binlog-records-migrated"` +} + +// https://github.com/beanstalkd/beanstalkd/blob/91c54fc05dc759ef27459ce4383934e1a4f2fb4b/doc/protocol.txt#L497 +type tubeStats struct { + Name string `yaml:"name"` + CurrentJobsUrgent int64 `yaml:"current-jobs-urgent" stm:"current-jobs-urgent"` + CurrentJobsReady int64 `yaml:"current-jobs-ready" stm:"current-jobs-ready"` + CurrentJobsReserved int64 `yaml:"current-jobs-reserved" stm:"current-jobs-reserved"` + CurrentJobsDelayed int64 `yaml:"current-jobs-delayed" stm:"current-jobs-delayed"` + CurrentJobsBuried int64 `yaml:"current-jobs-buried" stm:"current-jobs-buried"` + TotalJobs int64 `yaml:"total-jobs" stm:"total-jobs"` + CurrentUsing int64 `yaml:"current-using" stm:"current-using"` + CurrentWaiting int64 `yaml:"current-waiting" stm:"current-waiting"` + CurrentWatching int64 `yaml:"current-watching" stm:"current-watching"` + Pause float64 `yaml:"pause" stm:"pause"` + CmdDelete int64 `yaml:"cmd-delete" stm:"cmd-delete"` + CmdPauseTube int64 `yaml:"cmd-pause-tube" stm:"cmd-pause-tube"` + PauseTimeLeft float64 `yaml:"pause-time-left" stm:"pause-time-left"` +} + +func newBeanstalkConn(conf Config, log *logger.Logger) beanstalkConn { + return &beanstalkClient{ + Logger: log, + client: socket.New(socket.Config{ + Address: conf.Address, + ConnectTimeout: conf.Timeout.Duration(), + ReadTimeout: conf.Timeout.Duration(), + WriteTimeout: conf.Timeout.Duration(), + TLSConf: nil, + }), + } +} + +const ( + cmdQuit = "quit" + cmdStats = "stats" + cmdListTubes = "list-tubes" + cmdStatsTube = "stats-tube" +) + +type beanstalkClient struct { + *logger.Logger + + client socket.Client +} + +func (c *beanstalkClient) connect() error { + return c.client.Connect() +} + +func (c *beanstalkClient) disconnect() error { + _, _, _ = c.query(cmdQuit) + return c.client.Disconnect() +} + +func (c *beanstalkClient) queryStats() (*beanstalkdStats, error) { + cmd := cmdStats + + resp, data, err := c.query(cmd) + if err != nil { + return nil, err + } + if resp != "OK" { + return nil, fmt.Errorf("command '%s' bad response: %s", cmd, resp) + } + + var stats beanstalkdStats + + if err := yaml.Unmarshal(data, &stats); err != nil { + return nil, err + } + + return &stats, nil +} + +func (c *beanstalkClient) queryListTubes() ([]string, error) { + cmd := cmdListTubes + + resp, data, err := c.query(cmd) + if err != nil { + return nil, err + } + if resp != "OK" { + return nil, fmt.Errorf("command '%s' bad response: %s", cmd, resp) + } + + var tubes []string + + if err := yaml.Unmarshal(data, &tubes); err != nil { + return nil, err + } + + return tubes, nil +} + +func (c *beanstalkClient) queryStatsTube(tubeName string) (*tubeStats, error) { + cmd := fmt.Sprintf("%s %s", cmdStatsTube, tubeName) + + resp, data, err := c.query(cmd) + if err != nil { + return nil, err + } + if resp == "NOT_FOUND" { + return nil, nil + } + if resp != "OK" { + return nil, fmt.Errorf("command '%s' bad response: %s", cmd, resp) + } + + var stats tubeStats + if err := yaml.Unmarshal(data, &stats); err != nil { + return nil, err + } + + return &stats, nil +} + +func (c *beanstalkClient) query(command string) (string, []byte, error) { + var resp string + var length int + var body []byte + var err error + + c.Debugf("executing command: %s", command) + + const limitReadLines = 1000 + var num int + + clientErr := c.client.Command(command+"\r\n", func(line []byte) bool { + if resp == "" { + s := string(line) + c.Debugf("command '%s' response: '%s'", command, s) + + resp, length, err = parseResponseLine(s) + if err != nil { + err = fmt.Errorf("command '%s' line '%s': %v", command, s, err) + } + return err == nil && resp == "OK" + } + + if num++; num >= limitReadLines { + err = fmt.Errorf("command '%s': read line limit exceeded (%d)", command, limitReadLines) + return false + } + + body = append(body, line...) + body = append(body, '\n') + + return len(body) < length + }) + if clientErr != nil { + return "", nil, fmt.Errorf("command '%s' client error: %v", command, clientErr) + } + if err != nil { + return "", nil, err + } + + return resp, body, nil +} + +func parseResponseLine(line string) (string, int, error) { + parts := strings.Fields(line) + if len(parts) == 0 { + return "", 0, errors.New("empty response") + } + + resp := parts[0] + + if resp != "OK" { + return resp, 0, nil + } + + if len(parts) < 2 { + return "", 0, errors.New("missing bytes count") + } + + length, err := strconv.Atoi(parts[1]) + if err != nil { + return "", 0, errors.New("invalid bytes count") + } + + return resp, length, nil +} diff --git a/src/go/plugin/go.d/modules/beanstalk/collect.go b/src/go/plugin/go.d/modules/beanstalk/collect.go new file mode 100644 index 000000000..f85b24028 --- /dev/null +++ b/src/go/plugin/go.d/modules/beanstalk/collect.go @@ -0,0 +1,118 @@ +// SPDX-License-Identifier: GPL-3.0-or-later + +package beanstalk + +import ( + "fmt" + "slices" + "time" + + "github.com/netdata/netdata/go/plugins/plugin/go.d/pkg/stm" +) + +func (b *Beanstalk) collect() (map[string]int64, error) { + if b.conn == nil { + conn, err := b.establishConn() + if err != nil { + return nil, err + } + b.conn = conn + } + + mx := make(map[string]int64) + + if err := b.collectStats(mx); err != nil { + b.Cleanup() + return nil, err + } + if err := b.collectTubesStats(mx); err != nil { + return mx, err + } + + return mx, nil +} + +func (b *Beanstalk) collectStats(mx map[string]int64) error { + stats, err := b.conn.queryStats() + if err != nil { + return err + } + for k, v := range stm.ToMap(stats) { + mx[k] = v + } + return nil +} + +func (b *Beanstalk) collectTubesStats(mx map[string]int64) error { + now := time.Now() + + if now.Sub(b.lastDiscoverTubesTime) > b.discoverTubesEvery { + tubes, err := b.conn.queryListTubes() + if err != nil { + return err + } + + b.Debugf("discovered tubes (%d): %v", len(tubes), tubes) + v := slices.DeleteFunc(tubes, func(s string) bool { return !b.tubeSr.MatchString(s) }) + if len(tubes) != len(v) { + b.Debugf("discovered tubes after filtering (%d): %v", len(v), v) + } + + b.discoveredTubes = v + b.lastDiscoverTubesTime = now + } + + seen := make(map[string]bool) + + for i, tube := range b.discoveredTubes { + if tube == "" { + continue + } + + stats, err := b.conn.queryStatsTube(tube) + if err != nil { + return err + } + + if stats == nil { + b.Infof("tube '%s' stats object not found (tube does not exist)", tube) + b.discoveredTubes[i] = "" + continue + } + if stats.Name == "" { + b.Debugf("tube '%s' stats object has an empty name, ignoring it", tube) + b.discoveredTubes[i] = "" + continue + } + + seen[stats.Name] = true + if !b.seenTubes[stats.Name] { + b.seenTubes[stats.Name] = true + b.addTubeCharts(stats.Name) + } + + px := fmt.Sprintf("tube_%s_", stats.Name) + for k, v := range stm.ToMap(stats) { + mx[px+k] = v + } + } + + for tube := range b.seenTubes { + if !seen[tube] { + delete(b.seenTubes, tube) + b.removeTubeCharts(tube) + } + } + + return nil +} + +func (b *Beanstalk) establishConn() (beanstalkConn, error) { + conn := b.newConn(b.Config, b.Logger) + + if err := conn.connect(); err != nil { + return nil, err + } + + return conn, nil +} diff --git a/src/go/plugin/go.d/modules/beanstalk/config_schema.json b/src/go/plugin/go.d/modules/beanstalk/config_schema.json new file mode 100644 index 000000000..aa600ac03 --- /dev/null +++ b/src/go/plugin/go.d/modules/beanstalk/config_schema.json @@ -0,0 +1,54 @@ +{ + "jsonSchema": { + "$schema": "http://json-schema.org/draft-07/schema#", + "title": "Beanstalk collector configuration.", + "type": "object", + "properties": { + "update_every": { + "title": "Update every", + "description": "Data collection interval, measured in seconds.", + "type": "integer", + "minimum": 1, + "default": 1 + }, + "address": { + "title": "Address", + "description": "The IP address and port where the Beanstalk service listens for connections.", + "type": "string", + "default": "127.0.0.1:11300" + }, + "timeout": { + "title": "Timeout", + "description": "Timeout for establishing a connection and communication (reading and writing) in seconds.", + "type": "number", + "minimum": 0.5, + "default": 1 + }, + "tube_selector": { + "title": "Tube selector", + "description": "Specifies a [pattern](https://github.com/netdata/netdata/tree/master/src/libnetdata/simple_pattern#readme) for which Beanstalk tubes Netdata will collect statistics. Only tubes whose names match the provided pattern will be included.", + "type": "string", + "minimum": 1, + "default": "*" + } + }, + "required": [ + "address" + ], + "additionalProperties": false, + "patternProperties": { + "^name$": {} + } + }, + "uiSchema": { + "uiOptions": { + "fullPage": true + }, + "timeout": { + "ui:help": "Accepts decimals for precise control (e.g., type 1.5 for 1.5 seconds)." + }, + "tube_selector": { + "ui:help": "Leave blank or use `*` to collect data for all tubes." + } + } +} diff --git a/src/go/plugin/go.d/modules/beanstalk/init.go b/src/go/plugin/go.d/modules/beanstalk/init.go new file mode 100644 index 000000000..50916b3a7 --- /dev/null +++ b/src/go/plugin/go.d/modules/beanstalk/init.go @@ -0,0 +1,29 @@ +// SPDX-License-Identifier: GPL-3.0-or-later + +package beanstalk + +import ( + "errors" + + "github.com/netdata/netdata/go/plugins/plugin/go.d/pkg/matcher" +) + +func (b *Beanstalk) validateConfig() error { + if b.Address == "" { + return errors.New("beanstalk address is required") + } + return nil +} + +func (b *Beanstalk) initTubeSelector() (matcher.Matcher, error) { + if b.TubeSelector == "" { + return matcher.TRUE(), nil + } + + m, err := matcher.NewSimplePatternsMatcher(b.TubeSelector) + if err != nil { + return nil, err + } + + return m, nil +} diff --git a/src/go/plugin/go.d/modules/beanstalk/integrations/beanstalk.md b/src/go/plugin/go.d/modules/beanstalk/integrations/beanstalk.md new file mode 100644 index 000000000..c8efd988a --- /dev/null +++ b/src/go/plugin/go.d/modules/beanstalk/integrations/beanstalk.md @@ -0,0 +1,253 @@ +<!--startmeta +custom_edit_url: "https://github.com/netdata/netdata/edit/master/src/go/plugin/go.d/modules/beanstalk/README.md" +meta_yaml: "https://github.com/netdata/netdata/edit/master/src/go/plugin/go.d/modules/beanstalk/metadata.yaml" +sidebar_label: "Beanstalk" +learn_status: "Published" +learn_rel_path: "Collecting Metrics/Message Brokers" +most_popular: False +message: "DO NOT EDIT THIS FILE DIRECTLY, IT IS GENERATED BY THE COLLECTOR'S metadata.yaml FILE" +endmeta--> + +# Beanstalk + + +<img src="https://netdata.cloud/img/beanstalk.svg" width="150"/> + + +Plugin: go.d.plugin +Module: beanstalk + +<img src="https://img.shields.io/badge/maintained%20by-Netdata-%2300ab44" /> + +## Overview + +This collector monitors Beanstalk server performance and provides detailed statistics for each tube. + + +Using the [beanstalkd protocol](https://github.com/beanstalkd/beanstalkd/blob/master/doc/protocol.txt), it communicates with the Beanstalk daemon to gather essential metrics that help understand the server's performance and activity. +Executed commands: + +- [stats](https://github.com/beanstalkd/beanstalkd/blob/91c54fc05dc759ef27459ce4383934e1a4f2fb4b/doc/protocol.txt#L553). +- [list-tubes](https://github.com/beanstalkd/beanstalkd/blob/91c54fc05dc759ef27459ce4383934e1a4f2fb4b/doc/protocol.txt#L688). +- [stats-tube](https://github.com/beanstalkd/beanstalkd/blob/91c54fc05dc759ef27459ce4383934e1a4f2fb4b/doc/protocol.txt#L497). + + +This collector is supported on all platforms. + +This collector supports collecting metrics from multiple instances of this integration, including remote instances. + + +### Default Behavior + +#### Auto-Detection + +By default, it detects Beanstalk instances running on localhost that are listening on port 11300. + + +#### Limits + +The default configuration for this integration does not impose any limits on data collection. + +#### Performance Impact + +The default configuration for this integration is not expected to impose a significant performance impact on the system. + + +## Metrics + +Metrics grouped by *scope*. + +The scope defines the instance that the metric belongs to. An instance is uniquely identified by a set of labels. + + + +### Per Beanstalk instance + +These metrics refer to the entire monitored application. + +This scope has no labels. + +Metrics: + +| Metric | Dimensions | Unit | +|:------|:----------|:----| +| beanstalk.current_jobs | ready, buried, urgent, delayed, reserved | jobs | +| beanstalk.jobs_rate | created | jobs/s | +| beanstalk.jobs_timeouts | timeouts | jobs/s | +| beanstalk.current_tubes | tubes | tubes | +| beanstalk.commands_rate | put, peek, peek-ready, peek-delayed, peek-buried, reserve, reserve-with-timeout, touch, use, watch, ignore, delete, bury, kick, stats, stats-job, stats-tube, list-tubes, list-tube-used, list-tubes-watched, pause-tube | commands/s | +| beanstalk.current_connections | open, producers, workers, waiting | connections | +| beanstalk.connections_rate | created | connections/s | +| beanstalk.binlog_records | written, migrated | records/s | +| beanstalk.cpu_usage | user, system | percent | +| beanstalk.uptime | uptime | seconds | + +### Per tube + +Metrics related to Beanstalk tubes. This set of metrics is provided for each tube. + +Labels: + +| Label | Description | +|:-----------|:----------------| +| tube_name | Tube name. | + +Metrics: + +| Metric | Dimensions | Unit | +|:------|:----------|:----| +| beanstalk.tube_current_jobs | ready, buried, urgent, delayed, reserved | jobs | +| beanstalk.tube_jobs_rate | created | jobs/s | +| beanstalk.tube_commands_rate | delete, pause-tube | commands/s | +| beanstalk.tube_current_connections | using, waiting, watching | connections | +| beanstalk.tube_pause_time | since, left | seconds | + + + +## Alerts + + +The following alerts are available: + +| Alert name | On metric | Description | +|:------------|:----------|:------------| +| [ beanstalk_server_buried_jobs ](https://github.com/netdata/netdata/blob/master/src/health/health.d/beanstalkd.conf) | beanstalk.current_jobs | number of buried jobs across all tubes. You need to manually kick them so they can be processed. Presence of buried jobs in a tube does not affect new jobs. | + + +## Setup + +### Prerequisites + +No action required. + +### Configuration + +#### File + +The configuration file name for this integration is `go.d/beanstalk.conf`. + + +You can edit the configuration file using the `edit-config` script from the +Netdata [config directory](/docs/netdata-agent/configuration/README.md#the-netdata-config-directory). + +```bash +cd /etc/netdata 2>/dev/null || cd /opt/netdata/etc/netdata +sudo ./edit-config go.d/beanstalk.conf +``` +#### Options + +The following options can be defined globally: update_every, autodetection_retry. + + +<details open><summary>Config options</summary> + +| Name | Description | Default | Required | +|:----|:-----------|:-------|:--------:| +| update_every | Data collection frequency. | 1 | no | +| autodetection_retry | Recheck interval in seconds. Zero means no recheck will be scheduled. | 0 | no | +| address | The IP address and port where the Beanstalk service listens for connections. | 127.0.0.1:11300 | yes | +| timeout | Connection, read, and write timeout duration in seconds. The timeout includes name resolution. | 1 | no | +| tube_selector | Specifies a [pattern](https://github.com/netdata/netdata/tree/master/src/libnetdata/simple_pattern#readme) for which Beanstalk tubes Netdata will collect statistics. | * | no | + +</details> + +#### Examples + +##### Basic + +A basic example configuration. + +<details open><summary>Config</summary> + +```yaml +jobs: + - name: local + address: 127.0.0.1:11300 + +``` +</details> + +##### Multi-instance + +> **Note**: When you define multiple jobs, their names must be unique. + +Collecting metrics from local and remote instances. + + +<details open><summary>Config</summary> + +```yaml +jobs: + - name: local + address: 127.0.0.1:11300 + + - name: remote + address: 203.0.113.0:11300 + +``` +</details> + + + +## Troubleshooting + +### Debug Mode + +**Important**: Debug mode is not supported for data collection jobs created via the UI using the Dyncfg feature. + +To troubleshoot issues with the `beanstalk` collector, run the `go.d.plugin` with the debug option enabled. The output +should give you clues as to why the collector isn't working. + +- Navigate to the `plugins.d` directory, usually at `/usr/libexec/netdata/plugins.d/`. If that's not the case on + your system, open `netdata.conf` and look for the `plugins` setting under `[directories]`. + + ```bash + cd /usr/libexec/netdata/plugins.d/ + ``` + +- Switch to the `netdata` user. + + ```bash + sudo -u netdata -s + ``` + +- Run the `go.d.plugin` to debug the collector: + + ```bash + ./go.d.plugin -d -m beanstalk + ``` + +### Getting Logs + +If you're encountering problems with the `beanstalk` collector, follow these steps to retrieve logs and identify potential issues: + +- **Run the command** specific to your system (systemd, non-systemd, or Docker container). +- **Examine the output** for any warnings or error messages that might indicate issues. These messages should provide clues about the root cause of the problem. + +#### System with systemd + +Use the following command to view logs generated since the last Netdata service restart: + +```bash +journalctl _SYSTEMD_INVOCATION_ID="$(systemctl show --value --property=InvocationID netdata)" --namespace=netdata --grep beanstalk +``` + +#### System without systemd + +Locate the collector log file, typically at `/var/log/netdata/collector.log`, and use `grep` to filter for collector's name: + +```bash +grep beanstalk /var/log/netdata/collector.log +``` + +**Note**: This method shows logs from all restarts. Focus on the **latest entries** for troubleshooting current issues. + +#### Docker Container + +If your Netdata runs in a Docker container named "netdata" (replace if different), use this command: + +```bash +docker logs netdata 2>&1 | grep beanstalk +``` + + diff --git a/src/collectors/python.d.plugin/beanstalk/metadata.yaml b/src/go/plugin/go.d/modules/beanstalk/metadata.yaml index 5e370f0a0..60aaf77e5 100644 --- a/src/collectors/python.d.plugin/beanstalk/metadata.yaml +++ b/src/go/plugin/go.d/modules/beanstalk/metadata.yaml @@ -1,14 +1,14 @@ -plugin_name: python.d.plugin +plugin_name: go.d.plugin modules: - meta: - plugin_name: python.d.plugin + id: collector-go.d.plugin-beanstalk + plugin_name: go.d.plugin module_name: beanstalk monitored_instance: name: Beanstalk - link: "https://beanstalkd.github.io/" + link: https://beanstalkd.github.io/ categories: - data-collection.message-brokers - #- data-collection.task-queues icon_filename: "beanstalk.svg" related_resources: integrations: @@ -22,8 +22,15 @@ modules: most_popular: false overview: data_collection: - metrics_description: "Monitor Beanstalk metrics to enhance job queueing and processing efficiency. Track job rates, processing times, and queue lengths for better task management." - method_description: "The collector uses the `beanstalkc` python module to connect to a `beanstalkd` service and gather metrics." + metrics_description: | + This collector monitors Beanstalk server performance and provides detailed statistics for each tube. + method_description: | + Using the [beanstalkd protocol](https://github.com/beanstalkd/beanstalkd/blob/master/doc/protocol.txt), it communicates with the Beanstalk daemon to gather essential metrics that help understand the server's performance and activity. + Executed commands: + + - [stats](https://github.com/beanstalkd/beanstalkd/blob/91c54fc05dc759ef27459ce4383934e1a4f2fb4b/doc/protocol.txt#L553). + - [list-tubes](https://github.com/beanstalkd/beanstalkd/blob/91c54fc05dc759ef27459ce4383934e1a4f2fb4b/doc/protocol.txt#L688). + - [stats-tube](https://github.com/beanstalkd/beanstalkd/blob/91c54fc05dc759ef27459ce4383934e1a4f2fb4b/doc/protocol.txt#L497). supported_platforms: include: [] exclude: [] @@ -32,92 +39,68 @@ modules: description: "" default_behavior: auto_detection: - description: "If no configuration is given, module will attempt to connect to beanstalkd on 127.0.0.1:11300 address." + description: | + By default, it detects Beanstalk instances running on localhost that are listening on port 11300. limits: description: "" performance_impact: description: "" setup: prerequisites: - list: - - title: "beanstalkc python module" - description: The collector requires the `beanstalkc` python module to be installed. + list: [] configuration: file: - name: python.d/beanstalk.conf + name: go.d/beanstalk.conf options: description: | - There are 2 sections: - - * Global variables - * One or more JOBS that can define multiple different instances to monitor. - - The following options can be defined globally: priority, penalty, autodetection_retry, update_every, but can also be defined per JOB to override the global values. - - Additionally, the following collapsed table contains all the options that can be configured inside a JOB definition. - - Every configuration JOB starts with a `job_name` value which will appear in the dashboard, unless a `name` parameter is specified. + The following options can be defined globally: update_every, autodetection_retry. folding: - title: "Config options" + title: Config options enabled: true list: - name: update_every - description: Sets the default data collection frequency. - default_value: 5 - required: false - - name: priority - description: Controls the order of charts at the netdata dashboard. - default_value: 60000 + description: Data collection frequency. + default_value: 1 required: false - name: autodetection_retry - description: Sets the job re-check interval in seconds. + description: Recheck interval in seconds. Zero means no recheck will be scheduled. default_value: 0 required: false - - name: penalty - description: Indicates whether to apply penalty to update_every in case of failures. - default_value: yes + - name: address + description: The IP address and port where the Beanstalk service listens for connections. + default_value: 127.0.0.1:11300 + required: true + - name: timeout + description: Connection, read, and write timeout duration in seconds. The timeout includes name resolution. + default_value: 1 required: false - - name: name - description: Job name. This value will overwrite the `job_name` value. JOBS with the same name are mutually exclusive. Only one of them will be allowed running at any time. This allows autodetection to try several alternatives and pick the one that works. - default_value: "" - required: false - - name: host - description: IP or URL to a beanstalk service. - default_value: "127.0.0.1" - required: false - - name: port - description: Port to the IP or URL to a beanstalk service. - default_value: "11300" + - name: tube_selector + description: "Specifies a [pattern](https://github.com/netdata/netdata/tree/master/src/libnetdata/simple_pattern#readme) for which Beanstalk tubes Netdata will collect statistics." + default_value: "*" required: false examples: folding: enabled: true - title: "Config" + title: Config list: - - name: Remote beanstalk server - description: A basic remote beanstalk server - folding: - enabled: false + - name: Basic + description: A basic example configuration. config: | - remote: - name: 'beanstalk' - host: '1.2.3.4' - port: 11300 + jobs: + - name: local + address: 127.0.0.1:11300 - name: Multi-instance description: | > **Note**: When you define multiple jobs, their names must be unique. - + Collecting metrics from local and remote instances. config: | - localhost: - name: 'local_beanstalk' - host: '127.0.0.1' - port: 11300 - - remote_job: - name: 'remote_beanstalk' - host: '192.0.2.1' - port: 113000 + jobs: + - name: local + address: 127.0.0.1:11300 + + - name: remote + address: 203.0.113.0:11300 troubleshooting: problems: list: [] @@ -137,26 +120,34 @@ modules: description: "These metrics refer to the entire monitored application." labels: [] metrics: - - name: beanstalk.cpu_usage - description: Cpu Usage - unit: "cpu time" - chart_type: area + - name: beanstalk.current_jobs + description: Current Jobs + unit: "jobs" + chart_type: stacked dimensions: - - name: user - - name: system + - name: ready + - name: buried + - name: urgent + - name: delayed + - name: reserved - name: beanstalk.jobs_rate description: Jobs Rate unit: "jobs/s" chart_type: line dimensions: - - name: total + - name: created + - name: beanstalk.jobs_timeouts + description: Timed Out Jobs + unit: "jobs/s" + chart_type: line + dimensions: - name: timeouts - - name: beanstalk.connections_rate - description: Connections Rate - unit: "connections/s" - chart_type: area + - name: beanstalk.current_tubes + description: Current Tubes + unit: "tubes" + chart_type: line dimensions: - - name: connections + - name: tubes - name: beanstalk.commands_rate description: Commands Rate unit: "commands/s" @@ -168,6 +159,8 @@ modules: - name: peek-delayed - name: peek-buried - name: reserve + - name: reserve-with-timeout + - name: touch - name: use - name: watch - name: ignore @@ -181,38 +174,35 @@ modules: - name: list-tube-used - name: list-tubes-watched - name: pause-tube - - name: beanstalk.current_tubes - description: Current Tubes - unit: "tubes" - chart_type: area - dimensions: - - name: tubes - - name: beanstalk.current_jobs - description: Current Jobs - unit: "jobs" - chart_type: stacked - dimensions: - - name: urgent - - name: ready - - name: reserved - - name: delayed - - name: buried - name: beanstalk.current_connections description: Current Connections unit: "connections" chart_type: line dimensions: - - name: written + - name: open - name: producers - name: workers - name: waiting - - name: beanstalk.binlog - description: Binlog + - name: beanstalk.connections_rate + description: Connections Rate + unit: "connections/s" + chart_type: area + dimensions: + - name: created + - name: beanstalk.binlog_records + description: Binlog Records unit: "records/s" chart_type: line dimensions: - name: written - name: migrated + - name: beanstalk.cpu_usage + description: Cpu Usage + unit: "percent" + chart_type: stacked + dimensions: + - name: user + - name: system - name: beanstalk.uptime description: seconds unit: "seconds" @@ -220,44 +210,46 @@ modules: dimensions: - name: uptime - name: tube - description: "Metrics related to Beanstalk tubes. Each tube produces its own set of the following metrics." - labels: [] + description: "Metrics related to Beanstalk tubes. This set of metrics is provided for each tube." + labels: + - name: tube_name + description: Tube name. metrics: - - name: beanstalk.jobs_rate - description: Jobs Rate - unit: "jobs/s" - chart_type: area - dimensions: - - name: jobs - - name: beanstalk.jobs - description: Jobs + - name: beanstalk.tube_current_jobs + description: Tube Current Jobs unit: "jobs" chart_type: stacked dimensions: - - name: urgent - name: ready - - name: reserved - - name: delayed - name: buried - - name: beanstalk.connections - description: Connections + - name: urgent + - name: delayed + - name: reserved + - name: beanstalk.tube_jobs_rate + description: Tube Jobs Rate + unit: "jobs/s" + chart_type: line + dimensions: + - name: created + - name: beanstalk.tube_commands_rate + description: Tube Commands + unit: "commands/s" + chart_type: stacked + dimensions: + - name: delete + - name: pause-tube + - name: beanstalk.tube_current_connections + description: Tube Current Connections unit: "connections" chart_type: stacked dimensions: - name: using - name: waiting - name: watching - - name: beanstalk.commands - description: Commands - unit: "commands/s" - chart_type: stacked - dimensions: - - name: deletes - - name: pauses - - name: beanstalk.pause - description: Pause + - name: beanstalk.tube_pause_time + description: Tube Pause Time unit: "seconds" - chart_type: stacked + chart_type: line dimensions: - name: since - name: left diff --git a/src/go/plugin/go.d/modules/beanstalk/testdata/config.json b/src/go/plugin/go.d/modules/beanstalk/testdata/config.json new file mode 100644 index 000000000..c8da279a8 --- /dev/null +++ b/src/go/plugin/go.d/modules/beanstalk/testdata/config.json @@ -0,0 +1,6 @@ +{ + "update_every": 123, + "address": "ok", + "timeout": 123.123, + "tube_selector": "ok" +} diff --git a/src/go/plugin/go.d/modules/beanstalk/testdata/config.yaml b/src/go/plugin/go.d/modules/beanstalk/testdata/config.yaml new file mode 100644 index 000000000..7fe212a96 --- /dev/null +++ b/src/go/plugin/go.d/modules/beanstalk/testdata/config.yaml @@ -0,0 +1,4 @@ +update_every: 123 +address: "ok" +timeout: 123.123 +tube_selector: "ok" diff --git a/src/go/plugin/go.d/modules/beanstalk/testdata/list-tubes.txt b/src/go/plugin/go.d/modules/beanstalk/testdata/list-tubes.txt new file mode 100644 index 000000000..4fec61ef1 --- /dev/null +++ b/src/go/plugin/go.d/modules/beanstalk/testdata/list-tubes.txt @@ -0,0 +1,3 @@ +OK 14 +--- +- default diff --git a/src/go/plugin/go.d/modules/beanstalk/testdata/stats-tube-default.txt b/src/go/plugin/go.d/modules/beanstalk/testdata/stats-tube-default.txt new file mode 100644 index 000000000..888ff3da4 --- /dev/null +++ b/src/go/plugin/go.d/modules/beanstalk/testdata/stats-tube-default.txt @@ -0,0 +1,16 @@ +OK 265 +--- +name: default +current-jobs-urgent: 0 +current-jobs-ready: 0 +current-jobs-reserved: 0 +current-jobs-delayed: 0 +current-jobs-buried: 0 +total-jobs: 0 +current-using: 2 +current-watching: 2 +current-waiting: 0 +cmd-delete: 0 +cmd-pause-tube: 0 +pause: 0 +pause-time-left: 0 diff --git a/src/go/plugin/go.d/modules/beanstalk/testdata/stats.txt b/src/go/plugin/go.d/modules/beanstalk/testdata/stats.txt new file mode 100644 index 000000000..69b06e4c5 --- /dev/null +++ b/src/go/plugin/go.d/modules/beanstalk/testdata/stats.txt @@ -0,0 +1,50 @@ +OK 913 +--- +current-jobs-urgent: 0 +current-jobs-ready: 0 +current-jobs-reserved: 0 +current-jobs-delayed: 0 +current-jobs-buried: 0 +cmd-put: 0 +cmd-peek: 0 +cmd-peek-ready: 0 +cmd-peek-delayed: 0 +cmd-peek-buried: 0 +cmd-reserve: 0 +cmd-reserve-with-timeout: 0 +cmd-delete: 0 +cmd-release: 0 +cmd-use: 0 +cmd-watch: 0 +cmd-ignore: 0 +cmd-bury: 0 +cmd-kick: 0 +cmd-touch: 0 +cmd-stats: 23619 +cmd-stats-job: 0 +cmd-stats-tube: 18964 +cmd-list-tubes: 317 +cmd-list-tube-used: 0 +cmd-list-tubes-watched: 0 +cmd-pause-tube: 0 +job-timeouts: 0 +total-jobs: 0 +max-job-size: 65535 +current-tubes: 1 +current-connections: 2 +current-producers: 0 +current-workers: 0 +current-waiting: 0 +total-connections: 72 +pid: 1 +version: 1.10 +rusage-utime: 1.602079 +rusage-stime: 3.922748 +uptime: 105881 +binlog-oldest-index: 0 +binlog-current-index: 0 +binlog-records-migrated: 0 +binlog-records-written: 0 +binlog-max-size: 10485760 +id: 5a0667a881cd05e0 +hostname: c6796814b94b diff --git a/src/go/collectors/go.d.plugin/modules/bind/README.md b/src/go/plugin/go.d/modules/bind/README.md index 6de0078ec..90906ac21 100644 --- a/src/go/collectors/go.d.plugin/modules/bind/README.md +++ b/src/go/plugin/go.d/modules/bind/README.md @@ -88,7 +88,7 @@ jobs: View filter syntax: [simple patterns](https://docs.netdata.cloud/libnetdata/simple_pattern/). For all available options please see -module [configuration file](https://github.com/netdata/netdata/blob/master/src/go/collectors/go.d.plugin/config/go.d/bind.conf). +module [configuration file](https://github.com/netdata/netdata/blob/master/src/go/plugin/go.d/config/go.d/bind.conf). ## Troubleshooting diff --git a/src/go/collectors/go.d.plugin/modules/bind/bind.go b/src/go/plugin/go.d/modules/bind/bind.go index 1bdf986cb..6087f6f74 100644 --- a/src/go/collectors/go.d.plugin/modules/bind/bind.go +++ b/src/go/plugin/go.d/modules/bind/bind.go @@ -8,10 +8,10 @@ import ( "net/http" "time" - "github.com/netdata/netdata/go/go.d.plugin/pkg/matcher" - "github.com/netdata/netdata/go/go.d.plugin/pkg/web" + "github.com/netdata/netdata/go/plugins/plugin/go.d/pkg/matcher" + "github.com/netdata/netdata/go/plugins/plugin/go.d/pkg/web" - "github.com/netdata/netdata/go/go.d.plugin/agent/module" + "github.com/netdata/netdata/go/plugins/plugin/go.d/agent/module" ) //go:embed "config_schema.json" diff --git a/src/go/collectors/go.d.plugin/modules/bind/bind_test.go b/src/go/plugin/go.d/modules/bind/bind_test.go index f5f492181..d1ce5c2b6 100644 --- a/src/go/collectors/go.d.plugin/modules/bind/bind_test.go +++ b/src/go/plugin/go.d/modules/bind/bind_test.go @@ -8,7 +8,7 @@ import ( "os" "testing" - "github.com/netdata/netdata/go/go.d.plugin/agent/module" + "github.com/netdata/netdata/go/plugins/plugin/go.d/agent/module" "github.com/stretchr/testify/assert" "github.com/stretchr/testify/require" diff --git a/src/go/collectors/go.d.plugin/modules/bind/charts.go b/src/go/plugin/go.d/modules/bind/charts.go index db1833ab4..2fa868daf 100644 --- a/src/go/collectors/go.d.plugin/modules/bind/charts.go +++ b/src/go/plugin/go.d/modules/bind/charts.go @@ -3,7 +3,7 @@ package bind import ( - "github.com/netdata/netdata/go/go.d.plugin/agent/module" + "github.com/netdata/netdata/go/plugins/plugin/go.d/agent/module" ) type ( diff --git a/src/go/collectors/go.d.plugin/modules/bind/collect.go b/src/go/plugin/go.d/modules/bind/collect.go index faf5c07ca..4f38f3909 100644 --- a/src/go/collectors/go.d.plugin/modules/bind/collect.go +++ b/src/go/plugin/go.d/modules/bind/collect.go @@ -6,7 +6,7 @@ import ( "fmt" "strings" - "github.com/netdata/netdata/go/go.d.plugin/agent/module" + "github.com/netdata/netdata/go/plugins/plugin/go.d/agent/module" ) func (b *Bind) collect() (map[string]int64, error) { diff --git a/src/go/collectors/go.d.plugin/modules/bind/config_schema.json b/src/go/plugin/go.d/modules/bind/config_schema.json index 55aa502a6..29bb739ea 100644 --- a/src/go/collectors/go.d.plugin/modules/bind/config_schema.json +++ b/src/go/plugin/go.d/modules/bind/config_schema.json @@ -167,6 +167,12 @@ "timeout": { "ui:help": "Accepts decimals for precise control (e.g., type 1.5 for 1.5 seconds)." }, + "username": { + "ui:widget": "password" + }, + "proxy_username": { + "ui:widget": "password" + }, "password": { "ui:widget": "password" }, diff --git a/src/go/collectors/go.d.plugin/modules/bind/init.go b/src/go/plugin/go.d/modules/bind/init.go index a4b40d0a4..fe533b974 100644 --- a/src/go/collectors/go.d.plugin/modules/bind/init.go +++ b/src/go/plugin/go.d/modules/bind/init.go @@ -8,7 +8,7 @@ import ( "net/http" "strings" - "github.com/netdata/netdata/go/go.d.plugin/pkg/matcher" + "github.com/netdata/netdata/go/plugins/plugin/go.d/pkg/matcher" ) func (b *Bind) validateConfig() error { diff --git a/src/go/collectors/go.d.plugin/modules/bind/json_client.go b/src/go/plugin/go.d/modules/bind/json_client.go index 46a98de3a..04eecdb04 100644 --- a/src/go/collectors/go.d.plugin/modules/bind/json_client.go +++ b/src/go/plugin/go.d/modules/bind/json_client.go @@ -10,7 +10,7 @@ import ( "net/url" "path" - "github.com/netdata/netdata/go/go.d.plugin/pkg/web" + "github.com/netdata/netdata/go/plugins/plugin/go.d/pkg/web" ) type serverStats = jsonServerStats diff --git a/src/go/collectors/go.d.plugin/modules/bind/testdata/config.json b/src/go/plugin/go.d/modules/bind/testdata/config.json index 145df9ff4..145df9ff4 100644 --- a/src/go/collectors/go.d.plugin/modules/bind/testdata/config.json +++ b/src/go/plugin/go.d/modules/bind/testdata/config.json diff --git a/src/go/collectors/go.d.plugin/modules/bind/testdata/config.yaml b/src/go/plugin/go.d/modules/bind/testdata/config.yaml index cc0a33b74..cc0a33b74 100644 --- a/src/go/collectors/go.d.plugin/modules/bind/testdata/config.yaml +++ b/src/go/plugin/go.d/modules/bind/testdata/config.yaml diff --git a/src/go/collectors/go.d.plugin/modules/bind/testdata/query-server.json b/src/go/plugin/go.d/modules/bind/testdata/query-server.json index 885a4e28e..885a4e28e 100644 --- a/src/go/collectors/go.d.plugin/modules/bind/testdata/query-server.json +++ b/src/go/plugin/go.d/modules/bind/testdata/query-server.json diff --git a/src/go/collectors/go.d.plugin/modules/bind/testdata/query-server.xml b/src/go/plugin/go.d/modules/bind/testdata/query-server.xml index 515cdeaba..515cdeaba 100644 --- a/src/go/collectors/go.d.plugin/modules/bind/testdata/query-server.xml +++ b/src/go/plugin/go.d/modules/bind/testdata/query-server.xml diff --git a/src/go/collectors/go.d.plugin/modules/bind/xml3_client.go b/src/go/plugin/go.d/modules/bind/xml3_client.go index 8ba804ecf..c48d1af31 100644 --- a/src/go/collectors/go.d.plugin/modules/bind/xml3_client.go +++ b/src/go/plugin/go.d/modules/bind/xml3_client.go @@ -9,7 +9,7 @@ import ( "net/url" "path" - "github.com/netdata/netdata/go/go.d.plugin/pkg/web" + "github.com/netdata/netdata/go/plugins/plugin/go.d/pkg/web" ) type xml3Stats struct { diff --git a/src/go/collectors/go.d.plugin/modules/cassandra/README.md b/src/go/plugin/go.d/modules/cassandra/README.md index 99b5b9da5..99b5b9da5 120000 --- a/src/go/collectors/go.d.plugin/modules/cassandra/README.md +++ b/src/go/plugin/go.d/modules/cassandra/README.md diff --git a/src/go/collectors/go.d.plugin/modules/cassandra/cassandra.go b/src/go/plugin/go.d/modules/cassandra/cassandra.go index ee39246d5..5352703df 100644 --- a/src/go/collectors/go.d.plugin/modules/cassandra/cassandra.go +++ b/src/go/plugin/go.d/modules/cassandra/cassandra.go @@ -7,9 +7,9 @@ import ( "errors" "time" - "github.com/netdata/netdata/go/go.d.plugin/agent/module" - "github.com/netdata/netdata/go/go.d.plugin/pkg/prometheus" - "github.com/netdata/netdata/go/go.d.plugin/pkg/web" + "github.com/netdata/netdata/go/plugins/plugin/go.d/agent/module" + "github.com/netdata/netdata/go/plugins/plugin/go.d/pkg/prometheus" + "github.com/netdata/netdata/go/plugins/plugin/go.d/pkg/web" ) //go:embed "config_schema.json" diff --git a/src/go/collectors/go.d.plugin/modules/cassandra/cassandra_test.go b/src/go/plugin/go.d/modules/cassandra/cassandra_test.go index 650f79cd8..0b6af9362 100644 --- a/src/go/collectors/go.d.plugin/modules/cassandra/cassandra_test.go +++ b/src/go/plugin/go.d/modules/cassandra/cassandra_test.go @@ -8,8 +8,8 @@ import ( "os" "testing" - "github.com/netdata/netdata/go/go.d.plugin/agent/module" - "github.com/netdata/netdata/go/go.d.plugin/pkg/web" + "github.com/netdata/netdata/go/plugins/plugin/go.d/agent/module" + "github.com/netdata/netdata/go/plugins/plugin/go.d/pkg/web" "github.com/stretchr/testify/assert" "github.com/stretchr/testify/require" diff --git a/src/go/collectors/go.d.plugin/modules/cassandra/charts.go b/src/go/plugin/go.d/modules/cassandra/charts.go index 8c3fc239a..a909c7ba0 100644 --- a/src/go/collectors/go.d.plugin/modules/cassandra/charts.go +++ b/src/go/plugin/go.d/modules/cassandra/charts.go @@ -5,7 +5,7 @@ package cassandra import ( "fmt" - "github.com/netdata/netdata/go/go.d.plugin/agent/module" + "github.com/netdata/netdata/go/plugins/plugin/go.d/agent/module" ) const ( diff --git a/src/go/collectors/go.d.plugin/modules/cassandra/collect.go b/src/go/plugin/go.d/modules/cassandra/collect.go index 511aac642..08cdfbe94 100644 --- a/src/go/collectors/go.d.plugin/modules/cassandra/collect.go +++ b/src/go/plugin/go.d/modules/cassandra/collect.go @@ -4,7 +4,7 @@ package cassandra import ( "errors" - "github.com/netdata/netdata/go/go.d.plugin/pkg/prometheus" + "github.com/netdata/netdata/go/plugins/plugin/go.d/pkg/prometheus" "strings" ) diff --git a/src/go/collectors/go.d.plugin/modules/cassandra/config_schema.json b/src/go/plugin/go.d/modules/cassandra/config_schema.json index d6309d739..c4ca5f4f9 100644 --- a/src/go/collectors/go.d.plugin/modules/cassandra/config_schema.json +++ b/src/go/plugin/go.d/modules/cassandra/config_schema.json @@ -167,6 +167,12 @@ "timeout": { "ui:help": "Accepts decimals for precise control (e.g., type 1.5 for 1.5 seconds)." }, + "username": { + "ui:widget": "password" + }, + "proxy_username": { + "ui:widget": "password" + }, "password": { "ui:widget": "password" }, diff --git a/src/go/collectors/go.d.plugin/modules/cassandra/init.go b/src/go/plugin/go.d/modules/cassandra/init.go index 7248681d8..1a74fdf9b 100644 --- a/src/go/collectors/go.d.plugin/modules/cassandra/init.go +++ b/src/go/plugin/go.d/modules/cassandra/init.go @@ -5,8 +5,8 @@ package cassandra import ( "errors" - "github.com/netdata/netdata/go/go.d.plugin/pkg/prometheus" - "github.com/netdata/netdata/go/go.d.plugin/pkg/web" + "github.com/netdata/netdata/go/plugins/plugin/go.d/pkg/prometheus" + "github.com/netdata/netdata/go/plugins/plugin/go.d/pkg/web" ) func (c *Cassandra) validateConfig() error { diff --git a/src/go/collectors/go.d.plugin/modules/cassandra/integrations/cassandra.md b/src/go/plugin/go.d/modules/cassandra/integrations/cassandra.md index 76b623012..61c4d1439 100644 --- a/src/go/collectors/go.d.plugin/modules/cassandra/integrations/cassandra.md +++ b/src/go/plugin/go.d/modules/cassandra/integrations/cassandra.md @@ -1,6 +1,6 @@ <!--startmeta -custom_edit_url: "https://github.com/netdata/netdata/edit/master/src/go/collectors/go.d.plugin/modules/cassandra/README.md" -meta_yaml: "https://github.com/netdata/netdata/edit/master/src/go/collectors/go.d.plugin/modules/cassandra/metadata.yaml" +custom_edit_url: "https://github.com/netdata/netdata/edit/master/src/go/plugin/go.d/modules/cassandra/README.md" +meta_yaml: "https://github.com/netdata/netdata/edit/master/src/go/plugin/go.d/modules/cassandra/metadata.yaml" sidebar_label: "Cassandra" learn_status: "Published" learn_rel_path: "Collecting Metrics/Databases" @@ -253,6 +253,8 @@ jobs: ### Debug Mode +**Important**: Debug mode is not supported for data collection jobs created via the UI using the Dyncfg feature. + To troubleshoot issues with the `cassandra` collector, run the `go.d.plugin` with the debug option enabled. The output should give you clues as to why the collector isn't working. @@ -275,4 +277,37 @@ should give you clues as to why the collector isn't working. ./go.d.plugin -d -m cassandra ``` +### Getting Logs + +If you're encountering problems with the `cassandra` collector, follow these steps to retrieve logs and identify potential issues: + +- **Run the command** specific to your system (systemd, non-systemd, or Docker container). +- **Examine the output** for any warnings or error messages that might indicate issues. These messages should provide clues about the root cause of the problem. + +#### System with systemd + +Use the following command to view logs generated since the last Netdata service restart: + +```bash +journalctl _SYSTEMD_INVOCATION_ID="$(systemctl show --value --property=InvocationID netdata)" --namespace=netdata --grep cassandra +``` + +#### System without systemd + +Locate the collector log file, typically at `/var/log/netdata/collector.log`, and use `grep` to filter for collector's name: + +```bash +grep cassandra /var/log/netdata/collector.log +``` + +**Note**: This method shows logs from all restarts. Focus on the **latest entries** for troubleshooting current issues. + +#### Docker Container + +If your Netdata runs in a Docker container named "netdata" (replace if different), use this command: + +```bash +docker logs netdata 2>&1 | grep cassandra +``` + diff --git a/src/go/collectors/go.d.plugin/modules/cassandra/jmx_exporter.yaml b/src/go/plugin/go.d/modules/cassandra/jmx_exporter.yaml index 983f6f9b2..983f6f9b2 100644 --- a/src/go/collectors/go.d.plugin/modules/cassandra/jmx_exporter.yaml +++ b/src/go/plugin/go.d/modules/cassandra/jmx_exporter.yaml diff --git a/src/go/collectors/go.d.plugin/modules/cassandra/metadata.yaml b/src/go/plugin/go.d/modules/cassandra/metadata.yaml index ef9458c03..ef9458c03 100644 --- a/src/go/collectors/go.d.plugin/modules/cassandra/metadata.yaml +++ b/src/go/plugin/go.d/modules/cassandra/metadata.yaml diff --git a/src/go/collectors/go.d.plugin/modules/cassandra/metrics.go b/src/go/plugin/go.d/modules/cassandra/metrics.go index 6533c694c..6533c694c 100644 --- a/src/go/collectors/go.d.plugin/modules/cassandra/metrics.go +++ b/src/go/plugin/go.d/modules/cassandra/metrics.go diff --git a/src/go/collectors/go.d.plugin/modules/cassandra/testdata/config.json b/src/go/plugin/go.d/modules/cassandra/testdata/config.json index 984c3ed6e..984c3ed6e 100644 --- a/src/go/collectors/go.d.plugin/modules/cassandra/testdata/config.json +++ b/src/go/plugin/go.d/modules/cassandra/testdata/config.json diff --git a/src/go/collectors/go.d.plugin/modules/cassandra/testdata/config.yaml b/src/go/plugin/go.d/modules/cassandra/testdata/config.yaml index 8558b61cc..8558b61cc 100644 --- a/src/go/collectors/go.d.plugin/modules/cassandra/testdata/config.yaml +++ b/src/go/plugin/go.d/modules/cassandra/testdata/config.yaml diff --git a/src/go/collectors/go.d.plugin/modules/cassandra/testdata/metrics.txt b/src/go/plugin/go.d/modules/cassandra/testdata/metrics.txt index 663a68080..663a68080 100644 --- a/src/go/collectors/go.d.plugin/modules/cassandra/testdata/metrics.txt +++ b/src/go/plugin/go.d/modules/cassandra/testdata/metrics.txt diff --git a/src/go/collectors/go.d.plugin/modules/chrony/README.md b/src/go/plugin/go.d/modules/chrony/README.md index 4a58f3733..4a58f3733 120000 --- a/src/go/collectors/go.d.plugin/modules/chrony/README.md +++ b/src/go/plugin/go.d/modules/chrony/README.md diff --git a/src/go/plugin/go.d/modules/chrony/charts.go b/src/go/plugin/go.d/modules/chrony/charts.go new file mode 100644 index 000000000..37a6fa3e6 --- /dev/null +++ b/src/go/plugin/go.d/modules/chrony/charts.go @@ -0,0 +1,320 @@ +// SPDX-License-Identifier: GPL-3.0-or-later + +package chrony + +import ( + "github.com/netdata/netdata/go/plugins/plugin/go.d/agent/module" +) + +const ( + prioStratum = module.Priority + iota + prioCurrentCorrection + prioRootDelay + prioRootDispersion + prioLastOffset + prioRmsOffset + prioFrequency + prioResidualFrequency + prioSkew + prioUpdateInterval + prioRefMeasurementTime + prioLeapStatus + prioActivity + //prioNTPPackets + //prioCommandPackets + //prioNKEConnections + //prioClientLogRecords +) + +var charts = module.Charts{ + stratumChart.Copy(), + + currentCorrectionChart.Copy(), + + rootDelayChart.Copy(), + rootDispersionChart.Copy(), + + lastOffsetChart.Copy(), + rmsOffsetChart.Copy(), + + frequencyChart.Copy(), + residualFrequencyChart.Copy(), + + skewChart.Copy(), + + updateIntervalChart.Copy(), + refMeasurementTimeChart.Copy(), + + leapStatusChart.Copy(), + + activityChart.Copy(), +} + +// Tracking charts +var ( + stratumChart = module.Chart{ + ID: "stratum", + Title: "Distance to the reference clock", + Units: "level", + Fam: "stratum", + Ctx: "chrony.stratum", + Priority: prioStratum, + Dims: module.Dims{ + {ID: "stratum", Name: "stratum"}, + }, + } + + currentCorrectionChart = module.Chart{ + ID: "current_correction", + Title: "Current correction", + Units: "seconds", + Fam: "correction", + Ctx: "chrony.current_correction", + Priority: prioCurrentCorrection, + Dims: module.Dims{ + {ID: "current_correction", Div: scaleFactor}, + }, + } + + rootDelayChart = module.Chart{ + ID: "root_delay", + Title: "Network path delay to stratum-1", + Units: "seconds", + Fam: "root", + Ctx: "chrony.root_delay", + Priority: prioRootDelay, + Dims: module.Dims{ + {ID: "root_delay", Div: scaleFactor}, + }, + } + rootDispersionChart = module.Chart{ + ID: "root_dispersion", + Title: "Dispersion accumulated back to stratum-1", + Units: "seconds", + Fam: "root", + Ctx: "chrony.root_dispersion", + Priority: prioRootDispersion, + Dims: module.Dims{ + {ID: "root_dispersion", Div: scaleFactor}, + }, + } + + lastOffsetChart = module.Chart{ + ID: "last_offset", + Title: "Offset on the last clock update", + Units: "seconds", + Fam: "offset", + Ctx: "chrony.last_offset", + Priority: prioLastOffset, + Dims: module.Dims{ + {ID: "last_offset", Name: "offset", Div: scaleFactor}, + }, + } + rmsOffsetChart = module.Chart{ + ID: "rms_offset", + Title: "Long-term average of the offset value", + Units: "seconds", + Fam: "offset", + Ctx: "chrony.rms_offset", + Priority: prioRmsOffset, + Dims: module.Dims{ + {ID: "rms_offset", Name: "offset", Div: scaleFactor}, + }, + } + + frequencyChart = module.Chart{ + ID: "frequency", + Title: "Frequency", + Units: "ppm", + Fam: "frequency", + Ctx: "chrony.frequency", + Priority: prioFrequency, + Dims: module.Dims{ + {ID: "frequency", Div: scaleFactor}, + }, + } + residualFrequencyChart = module.Chart{ + ID: "residual_frequency", + Title: "Residual frequency", + Units: "ppm", + Fam: "frequency", + Ctx: "chrony.residual_frequency", + Priority: prioResidualFrequency, + Dims: module.Dims{ + {ID: "residual_frequency", Div: scaleFactor}, + }, + } + + skewChart = module.Chart{ + ID: "skew", + Title: "Skew", + Units: "ppm", + Fam: "frequency", + Ctx: "chrony.skew", + Priority: prioSkew, + Dims: module.Dims{ + {ID: "skew", Div: scaleFactor}, + }, + } + + updateIntervalChart = module.Chart{ + ID: "update_interval", + Title: "Interval between the last two clock updates", + Units: "seconds", + Fam: "updates", + Ctx: "chrony.update_interval", + Priority: prioUpdateInterval, + Dims: module.Dims{ + {ID: "update_interval", Div: scaleFactor}, + }, + } + refMeasurementTimeChart = module.Chart{ + ID: "ref_measurement_time", + Title: "Time since the last measurement", + Units: "seconds", + Fam: "updates", + Ctx: "chrony.ref_measurement_time", + Priority: prioRefMeasurementTime, + Dims: module.Dims{ + {ID: "ref_measurement_time"}, + }, + } + + leapStatusChart = module.Chart{ + ID: "leap_status", + Title: "Leap status", + Units: "status", + Fam: "leap status", + Ctx: "chrony.leap_status", + Priority: prioLeapStatus, + Dims: module.Dims{ + {ID: "leap_status_normal", Name: "normal"}, + {ID: "leap_status_insert_second", Name: "insert_second"}, + {ID: "leap_status_delete_second", Name: "delete_second"}, + {ID: "leap_status_unsynchronised", Name: "unsynchronised"}, + }, + } +) + +// Activity charts +var ( + activityChart = module.Chart{ + ID: "activity", + Title: "Peers activity", + Units: "sources", + Fam: "activity", + Ctx: "chrony.activity", + Type: module.Stacked, + Priority: prioActivity, + Dims: module.Dims{ + {ID: "online_sources", Name: "online"}, + {ID: "offline_sources", Name: "offline"}, + {ID: "burst_online_sources", Name: "burst_online"}, + {ID: "burst_offline_sources", Name: "burst_offline"}, + {ID: "unresolved_sources", Name: "unresolved"}, + }, + } +) + +//var serverStatsVer1Charts = module.Charts{ +// ntpPacketsChart.Copy(), +// commandPacketsChart.Copy(), +// clientLogRecordsChart.Copy(), +//} +// +//var serverStatsVer2Charts = module.Charts{ +// ntpPacketsChart.Copy(), +// commandPacketsChart.Copy(), +// clientLogRecordsChart.Copy(), +// nkeConnectionChart.Copy(), +//} +// +//var serverStatsVer3Charts = module.Charts{ +// ntpPacketsChart.Copy(), +// commandPacketsChart.Copy(), +// clientLogRecordsChart.Copy(), +// nkeConnectionChart.Copy(), +//} +// +//var serverStatsVer4Charts = module.Charts{ +// ntpPacketsChart.Copy(), +// commandPacketsChart.Copy(), +// clientLogRecordsChart.Copy(), +// nkeConnectionChart.Copy(), +//} + +// ServerStats charts +//var ( +// ntpPacketsChart = module.Chart{ +// ID: "ntp_packets", +// Title: "NTP packets", +// Units: "packets/s", +// Fam: "client requests", +// Ctx: "chrony.ntp_packets", +// Type: module.Stacked, +// Priority: prioNTPPackets, +// Dims: module.Dims{ +// {ID: "ntp_packets_received", Name: "received", Algo: module.Incremental}, +// {ID: "ntp_packets_dropped", Name: "dropped", Algo: module.Incremental}, +// }, +// } +// commandPacketsChart = module.Chart{ +// ID: "command_packets", +// Title: "Command packets", +// Units: "packets/s", +// Fam: "client requests", +// Ctx: "chrony.command_packets", +// Type: module.Stacked, +// Priority: prioCommandPackets, +// Dims: module.Dims{ +// {ID: "command_packets_received", Name: "received", Algo: module.Incremental}, +// {ID: "command_packets_dropped", Name: "dropped", Algo: module.Incremental}, +// }, +// } +// nkeConnectionChart = module.Chart{ +// ID: "nke_connections", +// Title: "NTS-KE connections", +// Units: "connections/s", +// Fam: "client requests", +// Ctx: "chrony.nke_connections", +// Type: module.Stacked, +// Priority: prioNKEConnections, +// Dims: module.Dims{ +// {ID: "nke_connections_accepted", Name: "accepted", Algo: module.Incremental}, +// {ID: "nke_connections_dropped", Name: "dropped", Algo: module.Incremental}, +// }, +// } +// clientLogRecordsChart = module.Chart{ +// ID: "client_log_records", +// Title: "Client log records", +// Units: "records/s", +// Fam: "client requests", +// Ctx: "chrony.client_log_records", +// Type: module.Stacked, +// Priority: prioClientLogRecords, +// Dims: module.Dims{ +// {ID: "client_log_records_dropped", Name: "dropped", Algo: module.Incremental}, +// }, +// } +//) + +//func (c *Chrony) addServerStatsCharts(stats *serverStats) { +// var err error +// +// switch { +// case stats.v1 != nil: +// err = c.Charts().Add(*serverStatsVer1Charts.Copy()...) +// case stats.v2 != nil: +// err = c.Charts().Add(*serverStatsVer2Charts.Copy()...) +// case stats.v3 != nil: +// err = c.Charts().Add(*serverStatsVer3Charts.Copy()...) +// case stats.v4 != nil: +// err = c.Charts().Add(*serverStatsVer4Charts.Copy()...) +// default: +// err = errors.New("unknown stats chart") +// } +// +// if err != nil { +// c.Warning(err) +// } +//} diff --git a/src/go/collectors/go.d.plugin/modules/chrony/chrony.go b/src/go/plugin/go.d/modules/chrony/chrony.go index eb51c4105..0bdd3183c 100644 --- a/src/go/collectors/go.d.plugin/modules/chrony/chrony.go +++ b/src/go/plugin/go.d/modules/chrony/chrony.go @@ -5,11 +5,13 @@ package chrony import ( _ "embed" "errors" + "sync" "time" + "github.com/netdata/netdata/go/plugins/plugin/go.d/agent/module" + "github.com/netdata/netdata/go/plugins/plugin/go.d/pkg/web" + "github.com/facebook/time/ntp/chrony" - "github.com/netdata/netdata/go/go.d.plugin/agent/module" - "github.com/netdata/netdata/go/go.d.plugin/pkg/web" ) //go:embed "config_schema.json" @@ -29,8 +31,9 @@ func New() *Chrony { Address: "127.0.0.1:323", Timeout: web.Duration(time.Second), }, - charts: charts.Copy(), - newClient: newChronyClient, + charts: charts.Copy(), + addStatsChartsOnce: &sync.Once{}, + newClient: newChronyClient, } } @@ -45,7 +48,8 @@ type ( module.Base Config `yaml:",inline" json:""` - charts *module.Charts + charts *module.Charts + addStatsChartsOnce *sync.Once client chronyClient newClient func(c Config) (chronyClient, error) @@ -53,6 +57,7 @@ type ( chronyClient interface { Tracking() (*chrony.ReplyTracking, error) Activity() (*chrony.ReplyActivity, error) + ServerStats() (*serverStats, error) Close() } ) diff --git a/src/go/collectors/go.d.plugin/modules/chrony/chrony_test.go b/src/go/plugin/go.d/modules/chrony/chrony_test.go index 03e7dd52e..407724e75 100644 --- a/src/go/collectors/go.d.plugin/modules/chrony/chrony_test.go +++ b/src/go/plugin/go.d/modules/chrony/chrony_test.go @@ -9,7 +9,7 @@ import ( "testing" "time" - "github.com/netdata/netdata/go/go.d.plugin/agent/module" + "github.com/netdata/netdata/go/plugins/plugin/go.d/agent/module" "github.com/facebook/time/ntp/chrony" "github.com/stretchr/testify/assert" @@ -240,9 +240,10 @@ func prepareChronyWithMock(m *mockClient) *Chrony { } type mockClient struct { - errOnTracking bool - errOnActivity bool - closeCalled bool + errOnTracking bool + errOnActivity bool + errOnServerStats bool + closeCalled bool } func (m *mockClient) Tracking() (*chrony.ReplyTracking, error) { @@ -286,6 +287,30 @@ func (m *mockClient) Activity() (*chrony.ReplyActivity, error) { return &reply, nil } +func (m *mockClient) ServerStats() (*serverStats, error) { + if m.errOnServerStats { + return nil, errors.New("mockClient.ServerStats call error") + } + + reply := serverStats{ + v3: &chrony.ServerStats3{ + NTPHits: 10, + NKEHits: 10, + CMDHits: 10, + NTPDrops: 1, + NKEDrops: 1, + CMDDrops: 1, + LogDrops: 1, + NTPAuthHits: 10, + NTPInterleavedHits: 10, + NTPTimestamps: 0, + NTPSpanSeconds: 0, + }, + } + + return &reply, nil +} + func (m *mockClient) Close() { m.closeCalled = true } diff --git a/src/go/plugin/go.d/modules/chrony/client.go b/src/go/plugin/go.d/modules/chrony/client.go new file mode 100644 index 000000000..233e78f19 --- /dev/null +++ b/src/go/plugin/go.d/modules/chrony/client.go @@ -0,0 +1,171 @@ +// SPDX-License-Identifier: GPL-3.0-or-later + +package chrony + +import ( + "fmt" + "net" + "time" + + "github.com/facebook/time/ntp/chrony" +) + +func newChronyClient(c Config) (chronyClient, error) { + conn, err := net.DialTimeout("udp", c.Address, c.Timeout.Duration()) + if err != nil { + return nil, err + } + + client := &simpleClient{ + conn: conn, + client: &chrony.Client{Connection: &connWithTimeout{ + Conn: conn, + timeout: c.Timeout.Duration(), + }}, + } + + return client, nil +} + +type connWithTimeout struct { + net.Conn + timeout time.Duration +} + +func (c *connWithTimeout) Read(p []byte) (n int, err error) { + if err := c.Conn.SetReadDeadline(c.deadline()); err != nil { + return 0, err + } + return c.Conn.Read(p) +} + +func (c *connWithTimeout) Write(p []byte) (n int, err error) { + if err := c.Conn.SetWriteDeadline(c.deadline()); err != nil { + return 0, err + } + return c.Conn.Write(p) +} + +func (c *connWithTimeout) deadline() time.Time { + return time.Now().Add(c.timeout) +} + +type simpleClient struct { + conn net.Conn + client *chrony.Client +} + +func (sc *simpleClient) Tracking() (*chrony.ReplyTracking, error) { + req := chrony.NewTrackingPacket() + + reply, err := sc.client.Communicate(req) + if err != nil { + return nil, err + } + + tracking, ok := reply.(*chrony.ReplyTracking) + if !ok { + return nil, fmt.Errorf("unexpected reply type, want=%T, got=%T", &chrony.ReplyTracking{}, reply) + } + return tracking, nil +} + +func (sc *simpleClient) Activity() (*chrony.ReplyActivity, error) { + req := chrony.NewActivityPacket() + + reply, err := sc.client.Communicate(req) + if err != nil { + return nil, err + } + + activity, ok := reply.(*chrony.ReplyActivity) + if !ok { + return nil, fmt.Errorf("unexpected reply type, want=%T, got=%T", &chrony.ReplyActivity{}, reply) + } + return activity, nil +} + +type serverStats struct { + v1 *chrony.ServerStats + v2 *chrony.ServerStats2 + v3 *chrony.ServerStats3 + v4 *chrony.ServerStats4 +} + +func (sc *simpleClient) ServerStats() (*serverStats, error) { + req := chrony.NewServerStatsPacket() + + reply, err := sc.client.Communicate(req) + if err != nil { + return nil, err + } + + var stats serverStats + + switch v := reply.(type) { + case *chrony.ReplyServerStats: + stats.v1 = &chrony.ServerStats{ + NTPHits: v.NTPHits, + CMDHits: v.CMDHits, + NTPDrops: v.NTPDrops, + CMDDrops: v.CMDDrops, + LogDrops: v.LogDrops, + } + case *chrony.ReplyServerStats2: + stats.v2 = &chrony.ServerStats2{ + NTPHits: v.NTPHits, + NKEHits: v.NKEHits, + CMDHits: v.CMDHits, + NTPDrops: v.NTPDrops, + NKEDrops: v.NKEDrops, + CMDDrops: v.CMDDrops, + LogDrops: v.LogDrops, + NTPAuthHits: v.NTPAuthHits, + } + case *chrony.ReplyServerStats3: + stats.v3 = &chrony.ServerStats3{ + NTPHits: v.NTPHits, + NKEHits: v.NKEHits, + CMDHits: v.CMDHits, + NTPDrops: v.NTPDrops, + NKEDrops: v.NKEDrops, + CMDDrops: v.CMDDrops, + LogDrops: v.LogDrops, + NTPAuthHits: v.NTPAuthHits, + NTPInterleavedHits: v.NTPInterleavedHits, + NTPTimestamps: v.NTPTimestamps, + NTPSpanSeconds: v.NTPSpanSeconds, + } + case *chrony.ReplyServerStats4: + stats.v4 = &chrony.ServerStats4{ + NTPHits: v.NTPHits, + NKEHits: v.NKEHits, + CMDHits: v.CMDHits, + NTPDrops: v.NTPDrops, + NKEDrops: v.NKEDrops, + CMDDrops: v.CMDDrops, + LogDrops: v.LogDrops, + NTPAuthHits: v.NTPAuthHits, + NTPInterleavedHits: v.NTPInterleavedHits, + NTPTimestamps: v.NTPTimestamps, + NTPSpanSeconds: v.NTPSpanSeconds, + NTPDaemonRxtimestamps: v.NTPDaemonRxtimestamps, + NTPDaemonTxtimestamps: v.NTPDaemonTxtimestamps, + NTPKernelRxtimestamps: v.NTPKernelRxtimestamps, + NTPKernelTxtimestamps: v.NTPKernelTxtimestamps, + NTPHwRxTimestamps: v.NTPHwRxTimestamps, + NTPHwTxTimestamps: v.NTPHwTxTimestamps, + } + default: + return nil, fmt.Errorf("unexpected reply type, want=ReplyServerStats, got=%T", reply) + } + + return &stats, nil +} + +func (sc *simpleClient) Close() { + if sc.conn != nil { + _ = sc.conn.Close() + sc.conn = nil + } +} diff --git a/src/go/plugin/go.d/modules/chrony/collect.go b/src/go/plugin/go.d/modules/chrony/collect.go new file mode 100644 index 000000000..1a3a286fc --- /dev/null +++ b/src/go/plugin/go.d/modules/chrony/collect.go @@ -0,0 +1,156 @@ +// SPDX-License-Identifier: GPL-3.0-or-later + +package chrony + +import ( + "fmt" + "time" +) + +const scaleFactor = 1000000000 + +func (c *Chrony) collect() (map[string]int64, error) { + if c.client == nil { + client, err := c.newClient(c.Config) + if err != nil { + return nil, err + } + c.client = client + } + + mx := make(map[string]int64) + + if err := c.collectTracking(mx); err != nil { + return nil, err + } + if err := c.collectActivity(mx); err != nil { + return mx, err + } + //if strings.HasPrefix(c.Address, "/") { + // TODO: Allowed only through the Unix domain socket (requires "_chrony" group membership). + // See https://github.com/facebook/time/blob/18207c5d8ddc7242e8d4192985898b6dbe66932c/cmd/ntpcheck/checker/chrony.go#L38 + // ^^ For some reason doesn't work, Chrony doesn't respond. Additional configuration needed? + //if err := c.collectServerStats(mx); err != nil { + // return mx, err + //} + //} + + return mx, nil +} + +const ( + // https://github.com/mlichvar/chrony/blob/7daf34675a5a2487895c74d1578241ca91a4eb70/ntp.h#L70-L75 + leapStatusNormal = 0 + leapStatusInsertSecond = 1 + leapStatusDeleteSecond = 2 + leapStatusUnsynchronised = 3 +) + +func (c *Chrony) collectTracking(mx map[string]int64) error { + reply, err := c.client.Tracking() + if err != nil { + return fmt.Errorf("error on collecting tracking: %v", err) + } + + mx["stratum"] = int64(reply.Stratum) + mx["leap_status_normal"] = boolToInt(reply.LeapStatus == leapStatusNormal) + mx["leap_status_insert_second"] = boolToInt(reply.LeapStatus == leapStatusInsertSecond) + mx["leap_status_delete_second"] = boolToInt(reply.LeapStatus == leapStatusDeleteSecond) + mx["leap_status_unsynchronised"] = boolToInt(reply.LeapStatus == leapStatusUnsynchronised) + mx["root_delay"] = int64(reply.RootDelay * scaleFactor) + mx["root_dispersion"] = int64(reply.RootDispersion * scaleFactor) + mx["skew"] = int64(reply.SkewPPM * scaleFactor) + mx["last_offset"] = int64(reply.LastOffset * scaleFactor) + mx["rms_offset"] = int64(reply.RMSOffset * scaleFactor) + mx["update_interval"] = int64(reply.LastUpdateInterval * scaleFactor) + // handle chrony restarts + if reply.RefTime.Year() != 1970 { + mx["ref_measurement_time"] = time.Now().Unix() - reply.RefTime.Unix() + } + mx["residual_frequency"] = int64(reply.ResidFreqPPM * scaleFactor) + // https://github.com/mlichvar/chrony/blob/5b04f3ca902e5d10aa5948fb7587d30b43941049/client.c#L1706 + mx["current_correction"] = abs(int64(reply.CurrentCorrection * scaleFactor)) + mx["frequency"] = abs(int64(reply.FreqPPM * scaleFactor)) + + return nil +} + +func (c *Chrony) collectActivity(mx map[string]int64) error { + reply, err := c.client.Activity() + if err != nil { + return fmt.Errorf("error on collecting activity: %v", err) + } + + mx["online_sources"] = int64(reply.Online) + mx["offline_sources"] = int64(reply.Offline) + mx["burst_online_sources"] = int64(reply.BurstOnline) + mx["burst_offline_sources"] = int64(reply.BurstOffline) + mx["unresolved_sources"] = int64(reply.Unresolved) + + return nil +} + +//func (c *Chrony) collectServerStats(mx map[string]int64) error { +// stats, err := c.client.ServerStats() +// if err != nil { +// return fmt.Errorf("error on collecting server stats: %v", err) +// } +// +// switch { +// case stats.v4 != nil: +// mx["ntp_packets_received"] = int64(stats.v4.NTPHits) +// mx["ntp_packets_dropped"] = int64(stats.v4.NTPDrops) +// mx["command_packets_received"] = int64(stats.v4.CMDHits) +// mx["command_packets_dropped"] = int64(stats.v4.CMDDrops) +// mx["client_log_records_dropped"] = int64(stats.v4.LogDrops) +// mx["nke_connections_accepted"] = int64(stats.v4.NKEHits) +// mx["nke_connections_dropped"] = int64(stats.v4.NKEDrops) +// mx["authenticated_ntp_packets"] = int64(stats.v4.NTPAuthHits) +// mx["interleaved_ntp_packets"] = int64(stats.v4.NTPInterleavedHits) +// case stats.v3 != nil: +// mx["ntp_packets_received"] = int64(stats.v3.NTPHits) +// mx["ntp_packets_dropped"] = int64(stats.v3.NTPDrops) +// mx["command_packets_received"] = int64(stats.v3.CMDHits) +// mx["command_packets_dropped"] = int64(stats.v3.CMDDrops) +// mx["client_log_records_dropped"] = int64(stats.v3.LogDrops) +// mx["nke_connections_accepted"] = int64(stats.v3.NKEHits) +// mx["nke_connections_dropped"] = int64(stats.v3.NKEDrops) +// mx["authenticated_ntp_packets"] = int64(stats.v3.NTPAuthHits) +// mx["interleaved_ntp_packets"] = int64(stats.v3.NTPInterleavedHits) +// case stats.v2 != nil: +// mx["ntp_packets_received"] = int64(stats.v2.NTPHits) +// mx["ntp_packets_dropped"] = int64(stats.v2.NTPDrops) +// mx["command_packets_received"] = int64(stats.v2.CMDHits) +// mx["command_packets_dropped"] = int64(stats.v2.CMDDrops) +// mx["client_log_records_dropped"] = int64(stats.v2.LogDrops) +// mx["nke_connections_accepted"] = int64(stats.v2.NKEHits) +// mx["nke_connections_dropped"] = int64(stats.v2.NKEDrops) +// mx["authenticated_ntp_packets"] = int64(stats.v2.NTPAuthHits) +// case stats.v1 != nil: +// mx["ntp_packets_received"] = int64(stats.v1.NTPHits) +// mx["ntp_packets_dropped"] = int64(stats.v1.NTPDrops) +// mx["command_packets_received"] = int64(stats.v1.CMDHits) +// mx["command_packets_dropped"] = int64(stats.v1.CMDDrops) +// mx["client_log_records_dropped"] = int64(stats.v1.LogDrops) +// default: +// return errors.New("invalid server stats reply") +// } +// +// //c.addStatsChartsOnce.Do(func() { c.addServerStatsCharts(stats) }) +// +// return nil +//} + +func boolToInt(v bool) int64 { + if v { + return 1 + } + return 0 +} + +func abs(v int64) int64 { + if v < 0 { + return -v + } + return v +} diff --git a/src/go/collectors/go.d.plugin/modules/chrony/config_schema.json b/src/go/plugin/go.d/modules/chrony/config_schema.json index 5de10a822..5de10a822 100644 --- a/src/go/collectors/go.d.plugin/modules/chrony/config_schema.json +++ b/src/go/plugin/go.d/modules/chrony/config_schema.json diff --git a/src/go/collectors/go.d.plugin/modules/chrony/init.go b/src/go/plugin/go.d/modules/chrony/init.go index 828112c9d..828112c9d 100644 --- a/src/go/collectors/go.d.plugin/modules/chrony/init.go +++ b/src/go/plugin/go.d/modules/chrony/init.go diff --git a/src/go/collectors/go.d.plugin/modules/chrony/integrations/chrony.md b/src/go/plugin/go.d/modules/chrony/integrations/chrony.md index f6c80549f..e9b9454d9 100644 --- a/src/go/collectors/go.d.plugin/modules/chrony/integrations/chrony.md +++ b/src/go/plugin/go.d/modules/chrony/integrations/chrony.md @@ -1,6 +1,6 @@ <!--startmeta -custom_edit_url: "https://github.com/netdata/netdata/edit/master/src/go/collectors/go.d.plugin/modules/chrony/README.md" -meta_yaml: "https://github.com/netdata/netdata/edit/master/src/go/collectors/go.d.plugin/modules/chrony/metadata.yaml" +custom_edit_url: "https://github.com/netdata/netdata/edit/master/src/go/plugin/go.d/modules/chrony/README.md" +meta_yaml: "https://github.com/netdata/netdata/edit/master/src/go/plugin/go.d/modules/chrony/metadata.yaml" sidebar_label: "Chrony" learn_status: "Published" learn_rel_path: "Collecting Metrics/System Clock and NTP" @@ -162,6 +162,8 @@ jobs: ### Debug Mode +**Important**: Debug mode is not supported for data collection jobs created via the UI using the Dyncfg feature. + To troubleshoot issues with the `chrony` collector, run the `go.d.plugin` with the debug option enabled. The output should give you clues as to why the collector isn't working. @@ -184,4 +186,37 @@ should give you clues as to why the collector isn't working. ./go.d.plugin -d -m chrony ``` +### Getting Logs + +If you're encountering problems with the `chrony` collector, follow these steps to retrieve logs and identify potential issues: + +- **Run the command** specific to your system (systemd, non-systemd, or Docker container). +- **Examine the output** for any warnings or error messages that might indicate issues. These messages should provide clues about the root cause of the problem. + +#### System with systemd + +Use the following command to view logs generated since the last Netdata service restart: + +```bash +journalctl _SYSTEMD_INVOCATION_ID="$(systemctl show --value --property=InvocationID netdata)" --namespace=netdata --grep chrony +``` + +#### System without systemd + +Locate the collector log file, typically at `/var/log/netdata/collector.log`, and use `grep` to filter for collector's name: + +```bash +grep chrony /var/log/netdata/collector.log +``` + +**Note**: This method shows logs from all restarts. Focus on the **latest entries** for troubleshooting current issues. + +#### Docker Container + +If your Netdata runs in a Docker container named "netdata" (replace if different), use this command: + +```bash +docker logs netdata 2>&1 | grep chrony +``` + diff --git a/src/go/collectors/go.d.plugin/modules/chrony/metadata.yaml b/src/go/plugin/go.d/modules/chrony/metadata.yaml index 18f9152e6..18f9152e6 100644 --- a/src/go/collectors/go.d.plugin/modules/chrony/metadata.yaml +++ b/src/go/plugin/go.d/modules/chrony/metadata.yaml diff --git a/src/go/collectors/go.d.plugin/modules/chrony/testdata/config.json b/src/go/plugin/go.d/modules/chrony/testdata/config.json index e86834720..e86834720 100644 --- a/src/go/collectors/go.d.plugin/modules/chrony/testdata/config.json +++ b/src/go/plugin/go.d/modules/chrony/testdata/config.json diff --git a/src/go/collectors/go.d.plugin/modules/chrony/testdata/config.yaml b/src/go/plugin/go.d/modules/chrony/testdata/config.yaml index 1b81d09eb..1b81d09eb 100644 --- a/src/go/collectors/go.d.plugin/modules/chrony/testdata/config.yaml +++ b/src/go/plugin/go.d/modules/chrony/testdata/config.yaml diff --git a/src/go/collectors/go.d.plugin/modules/clickhouse/README.md b/src/go/plugin/go.d/modules/clickhouse/README.md index 078a1eee2..078a1eee2 120000 --- a/src/go/collectors/go.d.plugin/modules/clickhouse/README.md +++ b/src/go/plugin/go.d/modules/clickhouse/README.md diff --git a/src/go/collectors/go.d.plugin/modules/clickhouse/charts.go b/src/go/plugin/go.d/modules/clickhouse/charts.go index cefcca1e2..dcae16008 100644 --- a/src/go/collectors/go.d.plugin/modules/clickhouse/charts.go +++ b/src/go/plugin/go.d/modules/clickhouse/charts.go @@ -6,7 +6,7 @@ import ( "fmt" "strings" - "github.com/netdata/netdata/go/go.d.plugin/agent/module" + "github.com/netdata/netdata/go/plugins/plugin/go.d/agent/module" ) const ( diff --git a/src/go/collectors/go.d.plugin/modules/clickhouse/clickhouse.go b/src/go/plugin/go.d/modules/clickhouse/clickhouse.go index 21b7f1d3f..3e34f7261 100644 --- a/src/go/collectors/go.d.plugin/modules/clickhouse/clickhouse.go +++ b/src/go/plugin/go.d/modules/clickhouse/clickhouse.go @@ -8,8 +8,8 @@ import ( "net/http" "time" - "github.com/netdata/netdata/go/go.d.plugin/agent/module" - "github.com/netdata/netdata/go/go.d.plugin/pkg/web" + "github.com/netdata/netdata/go/plugins/plugin/go.d/agent/module" + "github.com/netdata/netdata/go/plugins/plugin/go.d/pkg/web" ) //go:embed "config_schema.json" diff --git a/src/go/collectors/go.d.plugin/modules/clickhouse/clickhouse_test.go b/src/go/plugin/go.d/modules/clickhouse/clickhouse_test.go index de78bed43..c3defbda7 100644 --- a/src/go/collectors/go.d.plugin/modules/clickhouse/clickhouse_test.go +++ b/src/go/plugin/go.d/modules/clickhouse/clickhouse_test.go @@ -8,8 +8,8 @@ import ( "os" "testing" - "github.com/netdata/netdata/go/go.d.plugin/agent/module" - "github.com/netdata/netdata/go/go.d.plugin/pkg/web" + "github.com/netdata/netdata/go/plugins/plugin/go.d/agent/module" + "github.com/netdata/netdata/go/plugins/plugin/go.d/pkg/web" "github.com/stretchr/testify/assert" "github.com/stretchr/testify/require" diff --git a/src/go/collectors/go.d.plugin/modules/clickhouse/collect.go b/src/go/plugin/go.d/modules/clickhouse/collect.go index 8bb756528..8bb756528 100644 --- a/src/go/collectors/go.d.plugin/modules/clickhouse/collect.go +++ b/src/go/plugin/go.d/modules/clickhouse/collect.go diff --git a/src/go/collectors/go.d.plugin/modules/clickhouse/collect_system_async_metrics.go b/src/go/plugin/go.d/modules/clickhouse/collect_system_async_metrics.go index 46b8fed49..79b7e0ffd 100644 --- a/src/go/collectors/go.d.plugin/modules/clickhouse/collect_system_async_metrics.go +++ b/src/go/plugin/go.d/modules/clickhouse/collect_system_async_metrics.go @@ -6,7 +6,7 @@ import ( "errors" "strconv" - "github.com/netdata/netdata/go/go.d.plugin/pkg/web" + "github.com/netdata/netdata/go/plugins/plugin/go.d/pkg/web" ) const querySystemAsyncMetrics = ` diff --git a/src/go/collectors/go.d.plugin/modules/clickhouse/collect_system_disks.go b/src/go/plugin/go.d/modules/clickhouse/collect_system_disks.go index 7e1dbb8d0..4b9829bf6 100644 --- a/src/go/collectors/go.d.plugin/modules/clickhouse/collect_system_disks.go +++ b/src/go/plugin/go.d/modules/clickhouse/collect_system_disks.go @@ -5,7 +5,7 @@ package clickhouse import ( "strconv" - "github.com/netdata/netdata/go/go.d.plugin/pkg/web" + "github.com/netdata/netdata/go/plugins/plugin/go.d/pkg/web" ) const querySystemDisks = ` diff --git a/src/go/collectors/go.d.plugin/modules/clickhouse/collect_system_events.go b/src/go/plugin/go.d/modules/clickhouse/collect_system_events.go index 94d996162..de3c33a1e 100644 --- a/src/go/collectors/go.d.plugin/modules/clickhouse/collect_system_events.go +++ b/src/go/plugin/go.d/modules/clickhouse/collect_system_events.go @@ -6,7 +6,7 @@ import ( "errors" "strconv" - "github.com/netdata/netdata/go/go.d.plugin/pkg/web" + "github.com/netdata/netdata/go/plugins/plugin/go.d/pkg/web" ) const querySystemEvents = ` diff --git a/src/go/collectors/go.d.plugin/modules/clickhouse/collect_system_metrics.go b/src/go/plugin/go.d/modules/clickhouse/collect_system_metrics.go index f7c3981c8..26891f808 100644 --- a/src/go/collectors/go.d.plugin/modules/clickhouse/collect_system_metrics.go +++ b/src/go/plugin/go.d/modules/clickhouse/collect_system_metrics.go @@ -6,7 +6,7 @@ import ( "errors" "strconv" - "github.com/netdata/netdata/go/go.d.plugin/pkg/web" + "github.com/netdata/netdata/go/plugins/plugin/go.d/pkg/web" ) const querySystemMetrics = ` diff --git a/src/go/collectors/go.d.plugin/modules/clickhouse/collect_system_parts.go b/src/go/plugin/go.d/modules/clickhouse/collect_system_parts.go index 08ffd602e..3e9dc6ac2 100644 --- a/src/go/collectors/go.d.plugin/modules/clickhouse/collect_system_parts.go +++ b/src/go/plugin/go.d/modules/clickhouse/collect_system_parts.go @@ -6,7 +6,7 @@ import ( "fmt" "strconv" - "github.com/netdata/netdata/go/go.d.plugin/pkg/web" + "github.com/netdata/netdata/go/plugins/plugin/go.d/pkg/web" ) const querySystemParts = ` diff --git a/src/go/collectors/go.d.plugin/modules/clickhouse/collect_system_processes.go b/src/go/plugin/go.d/modules/clickhouse/collect_system_processes.go index d31103a8f..53698ea6c 100644 --- a/src/go/collectors/go.d.plugin/modules/clickhouse/collect_system_processes.go +++ b/src/go/plugin/go.d/modules/clickhouse/collect_system_processes.go @@ -5,7 +5,7 @@ package clickhouse import ( "strconv" - "github.com/netdata/netdata/go/go.d.plugin/pkg/web" + "github.com/netdata/netdata/go/plugins/plugin/go.d/pkg/web" ) const queryLongestQueryTime = ` diff --git a/src/go/collectors/go.d.plugin/modules/clickhouse/config_schema.json b/src/go/plugin/go.d/modules/clickhouse/config_schema.json index e8b0ed2be..8b0129ece 100644 --- a/src/go/collectors/go.d.plugin/modules/clickhouse/config_schema.json +++ b/src/go/plugin/go.d/modules/clickhouse/config_schema.json @@ -123,6 +123,12 @@ "timeout": { "ui:help": "Accepts decimals for precise control (e.g., type 1.5 for 1.5 seconds)." }, + "username": { + "ui:widget": "password" + }, + "proxy_username": { + "ui:widget": "password" + }, "password": { "ui:widget": "password" }, diff --git a/src/go/collectors/go.d.plugin/modules/clickhouse/init.go b/src/go/plugin/go.d/modules/clickhouse/init.go index c8db54e40..4b8ce3e4f 100644 --- a/src/go/collectors/go.d.plugin/modules/clickhouse/init.go +++ b/src/go/plugin/go.d/modules/clickhouse/init.go @@ -6,7 +6,7 @@ import ( "errors" "net/http" - "github.com/netdata/netdata/go/go.d.plugin/pkg/web" + "github.com/netdata/netdata/go/plugins/plugin/go.d/pkg/web" ) func (c *ClickHouse) validateConfig() error { diff --git a/src/go/collectors/go.d.plugin/modules/clickhouse/integrations/clickhouse.md b/src/go/plugin/go.d/modules/clickhouse/integrations/clickhouse.md index 27c0396d2..c4f1384c0 100644 --- a/src/go/collectors/go.d.plugin/modules/clickhouse/integrations/clickhouse.md +++ b/src/go/plugin/go.d/modules/clickhouse/integrations/clickhouse.md @@ -1,6 +1,6 @@ <!--startmeta -custom_edit_url: "https://github.com/netdata/netdata/edit/master/src/go/collectors/go.d.plugin/modules/clickhouse/README.md" -meta_yaml: "https://github.com/netdata/netdata/edit/master/src/go/collectors/go.d.plugin/modules/clickhouse/metadata.yaml" +custom_edit_url: "https://github.com/netdata/netdata/edit/master/src/go/plugin/go.d/modules/clickhouse/README.md" +meta_yaml: "https://github.com/netdata/netdata/edit/master/src/go/plugin/go.d/modules/clickhouse/metadata.yaml" sidebar_label: "ClickHouse" learn_status: "Published" learn_rel_path: "Collecting Metrics/Databases" @@ -308,6 +308,8 @@ jobs: ### Debug Mode +**Important**: Debug mode is not supported for data collection jobs created via the UI using the Dyncfg feature. + To troubleshoot issues with the `clickhouse` collector, run the `go.d.plugin` with the debug option enabled. The output should give you clues as to why the collector isn't working. @@ -330,4 +332,37 @@ should give you clues as to why the collector isn't working. ./go.d.plugin -d -m clickhouse ``` +### Getting Logs + +If you're encountering problems with the `clickhouse` collector, follow these steps to retrieve logs and identify potential issues: + +- **Run the command** specific to your system (systemd, non-systemd, or Docker container). +- **Examine the output** for any warnings or error messages that might indicate issues. These messages should provide clues about the root cause of the problem. + +#### System with systemd + +Use the following command to view logs generated since the last Netdata service restart: + +```bash +journalctl _SYSTEMD_INVOCATION_ID="$(systemctl show --value --property=InvocationID netdata)" --namespace=netdata --grep clickhouse +``` + +#### System without systemd + +Locate the collector log file, typically at `/var/log/netdata/collector.log`, and use `grep` to filter for collector's name: + +```bash +grep clickhouse /var/log/netdata/collector.log +``` + +**Note**: This method shows logs from all restarts. Focus on the **latest entries** for troubleshooting current issues. + +#### Docker Container + +If your Netdata runs in a Docker container named "netdata" (replace if different), use this command: + +```bash +docker logs netdata 2>&1 | grep clickhouse +``` + diff --git a/src/go/collectors/go.d.plugin/modules/clickhouse/metadata.yaml b/src/go/plugin/go.d/modules/clickhouse/metadata.yaml index e9a6b9152..e9a6b9152 100644 --- a/src/go/collectors/go.d.plugin/modules/clickhouse/metadata.yaml +++ b/src/go/plugin/go.d/modules/clickhouse/metadata.yaml diff --git a/src/go/collectors/go.d.plugin/modules/clickhouse/testdata/config.json b/src/go/plugin/go.d/modules/clickhouse/testdata/config.json index 984c3ed6e..984c3ed6e 100644 --- a/src/go/collectors/go.d.plugin/modules/clickhouse/testdata/config.json +++ b/src/go/plugin/go.d/modules/clickhouse/testdata/config.json diff --git a/src/go/collectors/go.d.plugin/modules/clickhouse/testdata/config.yaml b/src/go/plugin/go.d/modules/clickhouse/testdata/config.yaml index 8558b61cc..8558b61cc 100644 --- a/src/go/collectors/go.d.plugin/modules/clickhouse/testdata/config.yaml +++ b/src/go/plugin/go.d/modules/clickhouse/testdata/config.yaml diff --git a/src/go/collectors/go.d.plugin/modules/clickhouse/testdata/resp_longest_query_time.csv b/src/go/plugin/go.d/modules/clickhouse/testdata/resp_longest_query_time.csv index 85119aa6f..85119aa6f 100644 --- a/src/go/collectors/go.d.plugin/modules/clickhouse/testdata/resp_longest_query_time.csv +++ b/src/go/plugin/go.d/modules/clickhouse/testdata/resp_longest_query_time.csv diff --git a/src/go/collectors/go.d.plugin/modules/clickhouse/testdata/resp_system_async_metrics.csv b/src/go/plugin/go.d/modules/clickhouse/testdata/resp_system_async_metrics.csv index 7c9da4f46..7c9da4f46 100644 --- a/src/go/collectors/go.d.plugin/modules/clickhouse/testdata/resp_system_async_metrics.csv +++ b/src/go/plugin/go.d/modules/clickhouse/testdata/resp_system_async_metrics.csv diff --git a/src/go/collectors/go.d.plugin/modules/clickhouse/testdata/resp_system_disks.csv b/src/go/plugin/go.d/modules/clickhouse/testdata/resp_system_disks.csv index 42751e54e..42751e54e 100644 --- a/src/go/collectors/go.d.plugin/modules/clickhouse/testdata/resp_system_disks.csv +++ b/src/go/plugin/go.d/modules/clickhouse/testdata/resp_system_disks.csv diff --git a/src/go/collectors/go.d.plugin/modules/clickhouse/testdata/resp_system_events.csv b/src/go/plugin/go.d/modules/clickhouse/testdata/resp_system_events.csv index 546e7e7e0..546e7e7e0 100644 --- a/src/go/collectors/go.d.plugin/modules/clickhouse/testdata/resp_system_events.csv +++ b/src/go/plugin/go.d/modules/clickhouse/testdata/resp_system_events.csv diff --git a/src/go/collectors/go.d.plugin/modules/clickhouse/testdata/resp_system_metrics.csv b/src/go/plugin/go.d/modules/clickhouse/testdata/resp_system_metrics.csv index d5ecc29a7..d5ecc29a7 100644 --- a/src/go/collectors/go.d.plugin/modules/clickhouse/testdata/resp_system_metrics.csv +++ b/src/go/plugin/go.d/modules/clickhouse/testdata/resp_system_metrics.csv diff --git a/src/go/collectors/go.d.plugin/modules/clickhouse/testdata/resp_system_parts.csv b/src/go/plugin/go.d/modules/clickhouse/testdata/resp_system_parts.csv index 6ade3324a..6ade3324a 100644 --- a/src/go/collectors/go.d.plugin/modules/clickhouse/testdata/resp_system_parts.csv +++ b/src/go/plugin/go.d/modules/clickhouse/testdata/resp_system_parts.csv diff --git a/src/go/collectors/go.d.plugin/modules/cockroachdb/README.md b/src/go/plugin/go.d/modules/cockroachdb/README.md index a8130f262..a8130f262 120000 --- a/src/go/collectors/go.d.plugin/modules/cockroachdb/README.md +++ b/src/go/plugin/go.d/modules/cockroachdb/README.md diff --git a/src/go/collectors/go.d.plugin/modules/cockroachdb/charts.go b/src/go/plugin/go.d/modules/cockroachdb/charts.go index d615ef23c..2adfc5f9d 100644 --- a/src/go/collectors/go.d.plugin/modules/cockroachdb/charts.go +++ b/src/go/plugin/go.d/modules/cockroachdb/charts.go @@ -2,7 +2,7 @@ package cockroachdb -import "github.com/netdata/netdata/go/go.d.plugin/agent/module" +import "github.com/netdata/netdata/go/plugins/plugin/go.d/agent/module" type ( Charts = module.Charts diff --git a/src/go/collectors/go.d.plugin/modules/cockroachdb/cockroachdb.go b/src/go/plugin/go.d/modules/cockroachdb/cockroachdb.go index c07f22ef1..32d13fa78 100644 --- a/src/go/collectors/go.d.plugin/modules/cockroachdb/cockroachdb.go +++ b/src/go/plugin/go.d/modules/cockroachdb/cockroachdb.go @@ -7,9 +7,9 @@ import ( "errors" "time" - "github.com/netdata/netdata/go/go.d.plugin/agent/module" - "github.com/netdata/netdata/go/go.d.plugin/pkg/prometheus" - "github.com/netdata/netdata/go/go.d.plugin/pkg/web" + "github.com/netdata/netdata/go/plugins/plugin/go.d/agent/module" + "github.com/netdata/netdata/go/plugins/plugin/go.d/pkg/prometheus" + "github.com/netdata/netdata/go/plugins/plugin/go.d/pkg/web" ) //go:embed "config_schema.json" diff --git a/src/go/collectors/go.d.plugin/modules/cockroachdb/cockroachdb_test.go b/src/go/plugin/go.d/modules/cockroachdb/cockroachdb_test.go index b8abc1a4a..886b65fab 100644 --- a/src/go/collectors/go.d.plugin/modules/cockroachdb/cockroachdb_test.go +++ b/src/go/plugin/go.d/modules/cockroachdb/cockroachdb_test.go @@ -8,7 +8,7 @@ import ( "os" "testing" - "github.com/netdata/netdata/go/go.d.plugin/agent/module" + "github.com/netdata/netdata/go/plugins/plugin/go.d/agent/module" "github.com/stretchr/testify/assert" "github.com/stretchr/testify/require" diff --git a/src/go/collectors/go.d.plugin/modules/cockroachdb/collect.go b/src/go/plugin/go.d/modules/cockroachdb/collect.go index 1636a14d6..9ba255132 100644 --- a/src/go/collectors/go.d.plugin/modules/cockroachdb/collect.go +++ b/src/go/plugin/go.d/modules/cockroachdb/collect.go @@ -5,8 +5,8 @@ package cockroachdb import ( "errors" - "github.com/netdata/netdata/go/go.d.plugin/pkg/prometheus" - "github.com/netdata/netdata/go/go.d.plugin/pkg/stm" + "github.com/netdata/netdata/go/plugins/plugin/go.d/pkg/prometheus" + "github.com/netdata/netdata/go/plugins/plugin/go.d/pkg/stm" ) func validCockroachDBMetrics(scraped prometheus.Series) bool { diff --git a/src/go/collectors/go.d.plugin/modules/cockroachdb/config_schema.json b/src/go/plugin/go.d/modules/cockroachdb/config_schema.json index e045b5916..51b94f6a6 100644 --- a/src/go/collectors/go.d.plugin/modules/cockroachdb/config_schema.json +++ b/src/go/plugin/go.d/modules/cockroachdb/config_schema.json @@ -167,6 +167,12 @@ "timeout": { "ui:help": "Accepts decimals for precise control (e.g., type 1.5 for 1.5 seconds)." }, + "username": { + "ui:widget": "password" + }, + "proxy_username": { + "ui:widget": "password" + }, "password": { "ui:widget": "password" }, diff --git a/src/go/collectors/go.d.plugin/modules/cockroachdb/init.go b/src/go/plugin/go.d/modules/cockroachdb/init.go index fbe635a83..7558e9952 100644 --- a/src/go/collectors/go.d.plugin/modules/cockroachdb/init.go +++ b/src/go/plugin/go.d/modules/cockroachdb/init.go @@ -4,9 +4,9 @@ package cockroachdb import ( "errors" - "github.com/netdata/netdata/go/go.d.plugin/pkg/web" + "github.com/netdata/netdata/go/plugins/plugin/go.d/pkg/web" - "github.com/netdata/netdata/go/go.d.plugin/pkg/prometheus" + "github.com/netdata/netdata/go/plugins/plugin/go.d/pkg/prometheus" ) func (c *CockroachDB) validateConfig() error { diff --git a/src/go/collectors/go.d.plugin/modules/cockroachdb/integrations/cockroachdb.md b/src/go/plugin/go.d/modules/cockroachdb/integrations/cockroachdb.md index e9dc1a28e..52e27a87e 100644 --- a/src/go/collectors/go.d.plugin/modules/cockroachdb/integrations/cockroachdb.md +++ b/src/go/plugin/go.d/modules/cockroachdb/integrations/cockroachdb.md @@ -1,6 +1,6 @@ <!--startmeta -custom_edit_url: "https://github.com/netdata/netdata/edit/master/src/go/collectors/go.d.plugin/modules/cockroachdb/README.md" -meta_yaml: "https://github.com/netdata/netdata/edit/master/src/go/collectors/go.d.plugin/modules/cockroachdb/metadata.yaml" +custom_edit_url: "https://github.com/netdata/netdata/edit/master/src/go/plugin/go.d/modules/cockroachdb/README.md" +meta_yaml: "https://github.com/netdata/netdata/edit/master/src/go/plugin/go.d/modules/cockroachdb/metadata.yaml" sidebar_label: "CockroachDB" learn_status: "Published" learn_rel_path: "Collecting Metrics/Databases" @@ -263,6 +263,8 @@ jobs: ### Debug Mode +**Important**: Debug mode is not supported for data collection jobs created via the UI using the Dyncfg feature. + To troubleshoot issues with the `cockroachdb` collector, run the `go.d.plugin` with the debug option enabled. The output should give you clues as to why the collector isn't working. @@ -285,4 +287,37 @@ should give you clues as to why the collector isn't working. ./go.d.plugin -d -m cockroachdb ``` +### Getting Logs + +If you're encountering problems with the `cockroachdb` collector, follow these steps to retrieve logs and identify potential issues: + +- **Run the command** specific to your system (systemd, non-systemd, or Docker container). +- **Examine the output** for any warnings or error messages that might indicate issues. These messages should provide clues about the root cause of the problem. + +#### System with systemd + +Use the following command to view logs generated since the last Netdata service restart: + +```bash +journalctl _SYSTEMD_INVOCATION_ID="$(systemctl show --value --property=InvocationID netdata)" --namespace=netdata --grep cockroachdb +``` + +#### System without systemd + +Locate the collector log file, typically at `/var/log/netdata/collector.log`, and use `grep` to filter for collector's name: + +```bash +grep cockroachdb /var/log/netdata/collector.log +``` + +**Note**: This method shows logs from all restarts. Focus on the **latest entries** for troubleshooting current issues. + +#### Docker Container + +If your Netdata runs in a Docker container named "netdata" (replace if different), use this command: + +```bash +docker logs netdata 2>&1 | grep cockroachdb +``` + diff --git a/src/go/collectors/go.d.plugin/modules/cockroachdb/metadata.yaml b/src/go/plugin/go.d/modules/cockroachdb/metadata.yaml index 522f200ac..522f200ac 100644 --- a/src/go/collectors/go.d.plugin/modules/cockroachdb/metadata.yaml +++ b/src/go/plugin/go.d/modules/cockroachdb/metadata.yaml diff --git a/src/go/collectors/go.d.plugin/modules/cockroachdb/metrics.go b/src/go/plugin/go.d/modules/cockroachdb/metrics.go index fabd25499..fabd25499 100644 --- a/src/go/collectors/go.d.plugin/modules/cockroachdb/metrics.go +++ b/src/go/plugin/go.d/modules/cockroachdb/metrics.go diff --git a/src/go/collectors/go.d.plugin/modules/cockroachdb/testdata/config.json b/src/go/plugin/go.d/modules/cockroachdb/testdata/config.json index 984c3ed6e..984c3ed6e 100644 --- a/src/go/collectors/go.d.plugin/modules/cockroachdb/testdata/config.json +++ b/src/go/plugin/go.d/modules/cockroachdb/testdata/config.json diff --git a/src/go/collectors/go.d.plugin/modules/cockroachdb/testdata/config.yaml b/src/go/plugin/go.d/modules/cockroachdb/testdata/config.yaml index 8558b61cc..8558b61cc 100644 --- a/src/go/collectors/go.d.plugin/modules/cockroachdb/testdata/config.yaml +++ b/src/go/plugin/go.d/modules/cockroachdb/testdata/config.yaml diff --git a/src/go/collectors/go.d.plugin/modules/cockroachdb/testdata/metrics.txt b/src/go/plugin/go.d/modules/cockroachdb/testdata/metrics.txt index ca537e101..ca537e101 100644 --- a/src/go/collectors/go.d.plugin/modules/cockroachdb/testdata/metrics.txt +++ b/src/go/plugin/go.d/modules/cockroachdb/testdata/metrics.txt diff --git a/src/go/collectors/go.d.plugin/modules/cockroachdb/testdata/non_cockroachdb.txt b/src/go/plugin/go.d/modules/cockroachdb/testdata/non_cockroachdb.txt index f5f0ae082..f5f0ae082 100644 --- a/src/go/collectors/go.d.plugin/modules/cockroachdb/testdata/non_cockroachdb.txt +++ b/src/go/plugin/go.d/modules/cockroachdb/testdata/non_cockroachdb.txt diff --git a/src/go/collectors/go.d.plugin/modules/consul/README.md b/src/go/plugin/go.d/modules/consul/README.md index 5e57e46dc..5e57e46dc 120000 --- a/src/go/collectors/go.d.plugin/modules/consul/README.md +++ b/src/go/plugin/go.d/modules/consul/README.md diff --git a/src/go/collectors/go.d.plugin/modules/consul/charts.go b/src/go/plugin/go.d/modules/consul/charts.go index 3e6c50cfd..697a0c36a 100644 --- a/src/go/collectors/go.d.plugin/modules/consul/charts.go +++ b/src/go/plugin/go.d/modules/consul/charts.go @@ -7,7 +7,7 @@ import ( "github.com/blang/semver/v4" - "github.com/netdata/netdata/go/go.d.plugin/agent/module" + "github.com/netdata/netdata/go/plugins/plugin/go.d/agent/module" ) const ( diff --git a/src/go/collectors/go.d.plugin/modules/consul/collect.go b/src/go/plugin/go.d/modules/consul/collect.go index 3b5ebfd30..3033e046e 100644 --- a/src/go/collectors/go.d.plugin/modules/consul/collect.go +++ b/src/go/plugin/go.d/modules/consul/collect.go @@ -8,7 +8,7 @@ import ( "io" "net/http" - "github.com/netdata/netdata/go/go.d.plugin/pkg/web" + "github.com/netdata/netdata/go/plugins/plugin/go.d/pkg/web" ) const ( @@ -69,12 +69,11 @@ func (c *Consul) isServer() bool { } func (c *Consul) doOKDecode(urlPath string, in interface{}, statusCodes ...int) error { - req, err := web.NewHTTPRequest(c.Request.Copy()) + req, err := web.NewHTTPRequestWithPath(c.Request, urlPath) if err != nil { return fmt.Errorf("error on creating request: %v", err) } - req.URL.Path = urlPath if c.ACLToken != "" { req.Header.Set("X-Consul-Token", c.ACLToken) } diff --git a/src/go/collectors/go.d.plugin/modules/consul/collect_autopilot.go b/src/go/plugin/go.d/modules/consul/collect_autopilot.go index e73ce9b25..e73ce9b25 100644 --- a/src/go/collectors/go.d.plugin/modules/consul/collect_autopilot.go +++ b/src/go/plugin/go.d/modules/consul/collect_autopilot.go diff --git a/src/go/collectors/go.d.plugin/modules/consul/collect_checks.go b/src/go/plugin/go.d/modules/consul/collect_checks.go index 88ea4612b..88ea4612b 100644 --- a/src/go/collectors/go.d.plugin/modules/consul/collect_checks.go +++ b/src/go/plugin/go.d/modules/consul/collect_checks.go diff --git a/src/go/collectors/go.d.plugin/modules/consul/collect_config.go b/src/go/plugin/go.d/modules/consul/collect_config.go index 14c77067f..14c77067f 100644 --- a/src/go/collectors/go.d.plugin/modules/consul/collect_config.go +++ b/src/go/plugin/go.d/modules/consul/collect_config.go diff --git a/src/go/collectors/go.d.plugin/modules/consul/collect_metrics.go b/src/go/plugin/go.d/modules/consul/collect_metrics.go index 8dcfe1838..557ecf64c 100644 --- a/src/go/collectors/go.d.plugin/modules/consul/collect_metrics.go +++ b/src/go/plugin/go.d/modules/consul/collect_metrics.go @@ -8,7 +8,7 @@ import ( "strconv" "strings" - "github.com/netdata/netdata/go/go.d.plugin/pkg/prometheus" + "github.com/netdata/netdata/go/plugins/plugin/go.d/pkg/prometheus" ) func (c *Consul) collectMetricsPrometheus(mx map[string]int64) error { diff --git a/src/go/collectors/go.d.plugin/modules/consul/collect_net_rtt.go b/src/go/plugin/go.d/modules/consul/collect_net_rtt.go index 1b1853719..80330d23c 100644 --- a/src/go/collectors/go.d.plugin/modules/consul/collect_net_rtt.go +++ b/src/go/plugin/go.d/modules/consul/collect_net_rtt.go @@ -4,7 +4,7 @@ import ( "math" "time" - "github.com/netdata/netdata/go/go.d.plugin/pkg/metrics" + "github.com/netdata/netdata/go/plugins/plugin/go.d/pkg/metrics" ) const ( diff --git a/src/go/collectors/go.d.plugin/modules/consul/config_schema.json b/src/go/plugin/go.d/modules/consul/config_schema.json index 18679ad09..a716e15e4 100644 --- a/src/go/collectors/go.d.plugin/modules/consul/config_schema.json +++ b/src/go/plugin/go.d/modules/consul/config_schema.json @@ -174,6 +174,15 @@ "timeout": { "ui:help": "Accepts decimals for precise control (e.g., type 1.5 for 1.5 seconds)." }, + "acl_token": { + "ui:widget": "password" + }, + "username": { + "ui:widget": "password" + }, + "proxy_username": { + "ui:widget": "password" + }, "password": { "ui:widget": "password" }, diff --git a/src/go/collectors/go.d.plugin/modules/consul/consul.go b/src/go/plugin/go.d/modules/consul/consul.go index 2e2793fa7..6389d0650 100644 --- a/src/go/collectors/go.d.plugin/modules/consul/consul.go +++ b/src/go/plugin/go.d/modules/consul/consul.go @@ -9,9 +9,9 @@ import ( "sync" "time" - "github.com/netdata/netdata/go/go.d.plugin/agent/module" - "github.com/netdata/netdata/go/go.d.plugin/pkg/prometheus" - "github.com/netdata/netdata/go/go.d.plugin/pkg/web" + "github.com/netdata/netdata/go/plugins/plugin/go.d/agent/module" + "github.com/netdata/netdata/go/plugins/plugin/go.d/pkg/prometheus" + "github.com/netdata/netdata/go/plugins/plugin/go.d/pkg/web" "github.com/blang/semver/v4" ) diff --git a/src/go/collectors/go.d.plugin/modules/consul/consul_test.go b/src/go/plugin/go.d/modules/consul/consul_test.go index 9d53b6cb9..ccc9f99be 100644 --- a/src/go/collectors/go.d.plugin/modules/consul/consul_test.go +++ b/src/go/plugin/go.d/modules/consul/consul_test.go @@ -8,8 +8,8 @@ import ( "os" "testing" - "github.com/netdata/netdata/go/go.d.plugin/agent/module" - "github.com/netdata/netdata/go/go.d.plugin/pkg/web" + "github.com/netdata/netdata/go/plugins/plugin/go.d/agent/module" + "github.com/netdata/netdata/go/plugins/plugin/go.d/pkg/web" "github.com/stretchr/testify/assert" "github.com/stretchr/testify/require" diff --git a/src/go/collectors/go.d.plugin/modules/consul/init.go b/src/go/plugin/go.d/modules/consul/init.go index 944609a16..4ba5b86ea 100644 --- a/src/go/collectors/go.d.plugin/modules/consul/init.go +++ b/src/go/plugin/go.d/modules/consul/init.go @@ -7,8 +7,8 @@ import ( "net/http" "net/url" - "github.com/netdata/netdata/go/go.d.plugin/pkg/prometheus" - "github.com/netdata/netdata/go/go.d.plugin/pkg/web" + "github.com/netdata/netdata/go/plugins/plugin/go.d/pkg/prometheus" + "github.com/netdata/netdata/go/plugins/plugin/go.d/pkg/web" ) func (c *Consul) validateConfig() error { diff --git a/src/go/collectors/go.d.plugin/modules/consul/integrations/consul.md b/src/go/plugin/go.d/modules/consul/integrations/consul.md index c8d014d05..3a364bfd4 100644 --- a/src/go/collectors/go.d.plugin/modules/consul/integrations/consul.md +++ b/src/go/plugin/go.d/modules/consul/integrations/consul.md @@ -1,6 +1,6 @@ <!--startmeta -custom_edit_url: "https://github.com/netdata/netdata/edit/master/src/go/collectors/go.d.plugin/modules/consul/README.md" -meta_yaml: "https://github.com/netdata/netdata/edit/master/src/go/collectors/go.d.plugin/modules/consul/metadata.yaml" +custom_edit_url: "https://github.com/netdata/netdata/edit/master/src/go/plugin/go.d/modules/consul/README.md" +meta_yaml: "https://github.com/netdata/netdata/edit/master/src/go/plugin/go.d/modules/consul/metadata.yaml" sidebar_label: "Consul" learn_status: "Published" learn_rel_path: "Collecting Metrics/Service Discovery / Registry" @@ -299,6 +299,8 @@ jobs: ### Debug Mode +**Important**: Debug mode is not supported for data collection jobs created via the UI using the Dyncfg feature. + To troubleshoot issues with the `consul` collector, run the `go.d.plugin` with the debug option enabled. The output should give you clues as to why the collector isn't working. @@ -321,4 +323,37 @@ should give you clues as to why the collector isn't working. ./go.d.plugin -d -m consul ``` +### Getting Logs + +If you're encountering problems with the `consul` collector, follow these steps to retrieve logs and identify potential issues: + +- **Run the command** specific to your system (systemd, non-systemd, or Docker container). +- **Examine the output** for any warnings or error messages that might indicate issues. These messages should provide clues about the root cause of the problem. + +#### System with systemd + +Use the following command to view logs generated since the last Netdata service restart: + +```bash +journalctl _SYSTEMD_INVOCATION_ID="$(systemctl show --value --property=InvocationID netdata)" --namespace=netdata --grep consul +``` + +#### System without systemd + +Locate the collector log file, typically at `/var/log/netdata/collector.log`, and use `grep` to filter for collector's name: + +```bash +grep consul /var/log/netdata/collector.log +``` + +**Note**: This method shows logs from all restarts. Focus on the **latest entries** for troubleshooting current issues. + +#### Docker Container + +If your Netdata runs in a Docker container named "netdata" (replace if different), use this command: + +```bash +docker logs netdata 2>&1 | grep consul +``` + diff --git a/src/go/collectors/go.d.plugin/modules/consul/metadata.yaml b/src/go/plugin/go.d/modules/consul/metadata.yaml index 34445cd7e..34445cd7e 100644 --- a/src/go/collectors/go.d.plugin/modules/consul/metadata.yaml +++ b/src/go/plugin/go.d/modules/consul/metadata.yaml diff --git a/src/go/collectors/go.d.plugin/modules/consul/testdata/config.json b/src/go/plugin/go.d/modules/consul/testdata/config.json index bcd07a41b..bcd07a41b 100644 --- a/src/go/collectors/go.d.plugin/modules/consul/testdata/config.json +++ b/src/go/plugin/go.d/modules/consul/testdata/config.json diff --git a/src/go/collectors/go.d.plugin/modules/consul/testdata/config.yaml b/src/go/plugin/go.d/modules/consul/testdata/config.yaml index def554c7e..def554c7e 100644 --- a/src/go/collectors/go.d.plugin/modules/consul/testdata/config.yaml +++ b/src/go/plugin/go.d/modules/consul/testdata/config.yaml diff --git a/src/go/collectors/go.d.plugin/modules/consul/testdata/v1.13.2/client_v1-agent-metrics.txt b/src/go/plugin/go.d/modules/consul/testdata/v1.13.2/client_v1-agent-metrics.txt index e93e677d8..e93e677d8 100644 --- a/src/go/collectors/go.d.plugin/modules/consul/testdata/v1.13.2/client_v1-agent-metrics.txt +++ b/src/go/plugin/go.d/modules/consul/testdata/v1.13.2/client_v1-agent-metrics.txt diff --git a/src/go/collectors/go.d.plugin/modules/consul/testdata/v1.13.2/client_v1-agent-self.json b/src/go/plugin/go.d/modules/consul/testdata/v1.13.2/client_v1-agent-self.json index e5f75dc24..e5f75dc24 100644 --- a/src/go/collectors/go.d.plugin/modules/consul/testdata/v1.13.2/client_v1-agent-self.json +++ b/src/go/plugin/go.d/modules/consul/testdata/v1.13.2/client_v1-agent-self.json diff --git a/src/go/collectors/go.d.plugin/modules/consul/testdata/v1.13.2/server_v1-agent-metrics.txt b/src/go/plugin/go.d/modules/consul/testdata/v1.13.2/server_v1-agent-metrics.txt index 63dbaddfc..63dbaddfc 100644 --- a/src/go/collectors/go.d.plugin/modules/consul/testdata/v1.13.2/server_v1-agent-metrics.txt +++ b/src/go/plugin/go.d/modules/consul/testdata/v1.13.2/server_v1-agent-metrics.txt diff --git a/src/go/collectors/go.d.plugin/modules/consul/testdata/v1.13.2/server_v1-agent-metrics_with_hostname.txt b/src/go/plugin/go.d/modules/consul/testdata/v1.13.2/server_v1-agent-metrics_with_hostname.txt index a5df1d586..a5df1d586 100644 --- a/src/go/collectors/go.d.plugin/modules/consul/testdata/v1.13.2/server_v1-agent-metrics_with_hostname.txt +++ b/src/go/plugin/go.d/modules/consul/testdata/v1.13.2/server_v1-agent-metrics_with_hostname.txt diff --git a/src/go/collectors/go.d.plugin/modules/consul/testdata/v1.13.2/server_v1-agent-self.json b/src/go/plugin/go.d/modules/consul/testdata/v1.13.2/server_v1-agent-self.json index 0b11cda53..0b11cda53 100644 --- a/src/go/collectors/go.d.plugin/modules/consul/testdata/v1.13.2/server_v1-agent-self.json +++ b/src/go/plugin/go.d/modules/consul/testdata/v1.13.2/server_v1-agent-self.json diff --git a/src/go/collectors/go.d.plugin/modules/consul/testdata/v1.13.2/server_v1-agent-self_cloud-managed.json b/src/go/plugin/go.d/modules/consul/testdata/v1.13.2/server_v1-agent-self_cloud-managed.json index 0b11cda53..0b11cda53 100644 --- a/src/go/collectors/go.d.plugin/modules/consul/testdata/v1.13.2/server_v1-agent-self_cloud-managed.json +++ b/src/go/plugin/go.d/modules/consul/testdata/v1.13.2/server_v1-agent-self_cloud-managed.json diff --git a/src/go/collectors/go.d.plugin/modules/consul/testdata/v1.13.2/server_v1-agent-self_disabled_prom.json b/src/go/plugin/go.d/modules/consul/testdata/v1.13.2/server_v1-agent-self_disabled_prom.json index c964d10fe..c964d10fe 100644 --- a/src/go/collectors/go.d.plugin/modules/consul/testdata/v1.13.2/server_v1-agent-self_disabled_prom.json +++ b/src/go/plugin/go.d/modules/consul/testdata/v1.13.2/server_v1-agent-self_disabled_prom.json diff --git a/src/go/collectors/go.d.plugin/modules/consul/testdata/v1.13.2/server_v1-agent-self_with_hostname.json b/src/go/plugin/go.d/modules/consul/testdata/v1.13.2/server_v1-agent-self_with_hostname.json index dfe37bcc0..dfe37bcc0 100644 --- a/src/go/collectors/go.d.plugin/modules/consul/testdata/v1.13.2/server_v1-agent-self_with_hostname.json +++ b/src/go/plugin/go.d/modules/consul/testdata/v1.13.2/server_v1-agent-self_with_hostname.json diff --git a/src/go/collectors/go.d.plugin/modules/consul/testdata/v1.13.2/server_v1-coordinate-nodes.json b/src/go/plugin/go.d/modules/consul/testdata/v1.13.2/server_v1-coordinate-nodes.json index 8f3f63839..8f3f63839 100644 --- a/src/go/collectors/go.d.plugin/modules/consul/testdata/v1.13.2/server_v1-coordinate-nodes.json +++ b/src/go/plugin/go.d/modules/consul/testdata/v1.13.2/server_v1-coordinate-nodes.json diff --git a/src/go/collectors/go.d.plugin/modules/consul/testdata/v1.13.2/server_v1-operator-autopilot-health.json b/src/go/plugin/go.d/modules/consul/testdata/v1.13.2/server_v1-operator-autopilot-health.json index 4acee01ec..4acee01ec 100644 --- a/src/go/collectors/go.d.plugin/modules/consul/testdata/v1.13.2/server_v1-operator-autopilot-health.json +++ b/src/go/plugin/go.d/modules/consul/testdata/v1.13.2/server_v1-operator-autopilot-health.json diff --git a/src/go/collectors/go.d.plugin/modules/consul/testdata/v1.13.2/v1-agent-checks.json b/src/go/plugin/go.d/modules/consul/testdata/v1.13.2/v1-agent-checks.json index b8967cb74..b8967cb74 100644 --- a/src/go/collectors/go.d.plugin/modules/consul/testdata/v1.13.2/v1-agent-checks.json +++ b/src/go/plugin/go.d/modules/consul/testdata/v1.13.2/v1-agent-checks.json diff --git a/src/go/collectors/go.d.plugin/modules/consul/testdata/v1.14.3-cloud/server_v1-agent-metrics.txt b/src/go/plugin/go.d/modules/consul/testdata/v1.14.3-cloud/server_v1-agent-metrics.txt index 094f03508..094f03508 100644 --- a/src/go/collectors/go.d.plugin/modules/consul/testdata/v1.14.3-cloud/server_v1-agent-metrics.txt +++ b/src/go/plugin/go.d/modules/consul/testdata/v1.14.3-cloud/server_v1-agent-metrics.txt diff --git a/src/go/collectors/go.d.plugin/modules/consul/testdata/v1.14.3-cloud/server_v1-agent-self.json b/src/go/plugin/go.d/modules/consul/testdata/v1.14.3-cloud/server_v1-agent-self.json index 8a11b7d0e..8a11b7d0e 100644 --- a/src/go/collectors/go.d.plugin/modules/consul/testdata/v1.14.3-cloud/server_v1-agent-self.json +++ b/src/go/plugin/go.d/modules/consul/testdata/v1.14.3-cloud/server_v1-agent-self.json diff --git a/src/go/collectors/go.d.plugin/modules/consul/testdata/v1.14.3-cloud/server_v1-coordinate-nodes.json b/src/go/plugin/go.d/modules/consul/testdata/v1.14.3-cloud/server_v1-coordinate-nodes.json index bfe44c7fc..bfe44c7fc 100644 --- a/src/go/collectors/go.d.plugin/modules/consul/testdata/v1.14.3-cloud/server_v1-coordinate-nodes.json +++ b/src/go/plugin/go.d/modules/consul/testdata/v1.14.3-cloud/server_v1-coordinate-nodes.json diff --git a/src/go/collectors/go.d.plugin/modules/consul/testdata/v1.14.3-cloud/v1-agent-checks.json b/src/go/plugin/go.d/modules/consul/testdata/v1.14.3-cloud/v1-agent-checks.json index 0daa492c0..0daa492c0 100644 --- a/src/go/collectors/go.d.plugin/modules/consul/testdata/v1.14.3-cloud/v1-agent-checks.json +++ b/src/go/plugin/go.d/modules/consul/testdata/v1.14.3-cloud/v1-agent-checks.json diff --git a/src/go/collectors/go.d.plugin/modules/coredns/README.md b/src/go/plugin/go.d/modules/coredns/README.md index fcd7e5544..fcd7e5544 120000 --- a/src/go/collectors/go.d.plugin/modules/coredns/README.md +++ b/src/go/plugin/go.d/modules/coredns/README.md diff --git a/src/go/collectors/go.d.plugin/modules/coredns/charts.go b/src/go/plugin/go.d/modules/coredns/charts.go index fecc1736e..fd93efad3 100644 --- a/src/go/collectors/go.d.plugin/modules/coredns/charts.go +++ b/src/go/plugin/go.d/modules/coredns/charts.go @@ -2,7 +2,7 @@ package coredns -import "github.com/netdata/netdata/go/go.d.plugin/agent/module" +import "github.com/netdata/netdata/go/plugins/plugin/go.d/agent/module" type ( // Charts is an alias for module.Charts diff --git a/src/go/collectors/go.d.plugin/modules/coredns/collect.go b/src/go/plugin/go.d/modules/coredns/collect.go index b77f9a29c..d6137b181 100644 --- a/src/go/collectors/go.d.plugin/modules/coredns/collect.go +++ b/src/go/plugin/go.d/modules/coredns/collect.go @@ -8,8 +8,8 @@ import ( "strings" "github.com/blang/semver/v4" - "github.com/netdata/netdata/go/go.d.plugin/pkg/prometheus" - "github.com/netdata/netdata/go/go.d.plugin/pkg/stm" + "github.com/netdata/netdata/go/plugins/plugin/go.d/pkg/prometheus" + "github.com/netdata/netdata/go/plugins/plugin/go.d/pkg/stm" ) const ( diff --git a/src/go/collectors/go.d.plugin/modules/coredns/config_schema.json b/src/go/plugin/go.d/modules/coredns/config_schema.json index 77134298b..d5f87912b 100644 --- a/src/go/collectors/go.d.plugin/modules/coredns/config_schema.json +++ b/src/go/plugin/go.d/modules/coredns/config_schema.json @@ -40,7 +40,7 @@ "properties": { "includes": { "title": "Include", - "description": "Include servers whose names match any of the specified inclusion [patterns](https://github.com/netdata/netdata/tree/master/src/go/collectors/go.d.plugin/pkg/matcher#readme).", + "description": "Include servers whose names match any of the specified inclusion [patterns](https://github.com/netdata/netdata/tree/master/src/go/plugin/go.d/pkg/matcher#readme).", "type": [ "array", "null" @@ -53,7 +53,7 @@ }, "excludes": { "title": "Exclude", - "description": "Exclude servers whose names match any of the specified exclusion [patterns](https://github.com/netdata/netdata/tree/master/src/go/collectors/go.d.plugin/pkg/matcher#readme).", + "description": "Exclude servers whose names match any of the specified exclusion [patterns](https://github.com/netdata/netdata/tree/master/src/go/plugin/go.d/pkg/matcher#readme).", "type": [ "array", "null" @@ -76,7 +76,7 @@ "properties": { "includes": { "title": "Include", - "description": "Include zones whose names match any of the specified inclusion [patterns](https://github.com/netdata/netdata/tree/master/src/go/collectors/go.d.plugin/pkg/matcher#readme).", + "description": "Include zones whose names match any of the specified inclusion [patterns](https://github.com/netdata/netdata/tree/master/src/go/plugin/go.d/pkg/matcher#readme).", "type": [ "array", "null" @@ -89,7 +89,7 @@ }, "excludes": { "title": "Exclude", - "description": "Exclude zones whose names match any of the specified exclusion [patterns](https://github.com/netdata/netdata/tree/master/src/go/collectors/go.d.plugin/pkg/matcher#readme).", + "description": "Exclude zones whose names match any of the specified exclusion [patterns](https://github.com/netdata/netdata/tree/master/src/go/plugin/go.d/pkg/matcher#readme).", "type": [ "array", "null" @@ -254,6 +254,12 @@ "ui:help": "The logic for inclusion and exclusion is as follows: `(include1 OR include2) AND !(exclude1 OR exclude2)`.", "ui:collapsible": true }, + "username": { + "ui:widget": "password" + }, + "proxy_username": { + "ui:widget": "password" + }, "password": { "ui:widget": "password" }, diff --git a/src/go/collectors/go.d.plugin/modules/coredns/coredns.go b/src/go/plugin/go.d/modules/coredns/coredns.go index 669373975..c91af7d15 100644 --- a/src/go/collectors/go.d.plugin/modules/coredns/coredns.go +++ b/src/go/plugin/go.d/modules/coredns/coredns.go @@ -7,10 +7,10 @@ import ( "errors" "time" - "github.com/netdata/netdata/go/go.d.plugin/agent/module" - "github.com/netdata/netdata/go/go.d.plugin/pkg/matcher" - "github.com/netdata/netdata/go/go.d.plugin/pkg/prometheus" - "github.com/netdata/netdata/go/go.d.plugin/pkg/web" + "github.com/netdata/netdata/go/plugins/plugin/go.d/agent/module" + "github.com/netdata/netdata/go/plugins/plugin/go.d/pkg/matcher" + "github.com/netdata/netdata/go/plugins/plugin/go.d/pkg/prometheus" + "github.com/netdata/netdata/go/plugins/plugin/go.d/pkg/web" "github.com/blang/semver/v4" ) diff --git a/src/go/collectors/go.d.plugin/modules/coredns/coredns_test.go b/src/go/plugin/go.d/modules/coredns/coredns_test.go index df5dc1501..5d67b417f 100644 --- a/src/go/collectors/go.d.plugin/modules/coredns/coredns_test.go +++ b/src/go/plugin/go.d/modules/coredns/coredns_test.go @@ -8,7 +8,7 @@ import ( "os" "testing" - "github.com/netdata/netdata/go/go.d.plugin/agent/module" + "github.com/netdata/netdata/go/plugins/plugin/go.d/agent/module" "github.com/stretchr/testify/assert" "github.com/stretchr/testify/require" diff --git a/src/go/collectors/go.d.plugin/modules/coredns/init.go b/src/go/plugin/go.d/modules/coredns/init.go index 1e3a7be5c..e2b888bb6 100644 --- a/src/go/collectors/go.d.plugin/modules/coredns/init.go +++ b/src/go/plugin/go.d/modules/coredns/init.go @@ -5,9 +5,9 @@ package coredns import ( "errors" - "github.com/netdata/netdata/go/go.d.plugin/pkg/matcher" - "github.com/netdata/netdata/go/go.d.plugin/pkg/prometheus" - "github.com/netdata/netdata/go/go.d.plugin/pkg/web" + "github.com/netdata/netdata/go/plugins/plugin/go.d/pkg/matcher" + "github.com/netdata/netdata/go/plugins/plugin/go.d/pkg/prometheus" + "github.com/netdata/netdata/go/plugins/plugin/go.d/pkg/web" ) func (cd *CoreDNS) validateConfig() error { diff --git a/src/go/collectors/go.d.plugin/modules/coredns/integrations/coredns.md b/src/go/plugin/go.d/modules/coredns/integrations/coredns.md index ef942222f..549e2d8d9 100644 --- a/src/go/collectors/go.d.plugin/modules/coredns/integrations/coredns.md +++ b/src/go/plugin/go.d/modules/coredns/integrations/coredns.md @@ -1,6 +1,6 @@ <!--startmeta -custom_edit_url: "https://github.com/netdata/netdata/edit/master/src/go/collectors/go.d.plugin/modules/coredns/README.md" -meta_yaml: "https://github.com/netdata/netdata/edit/master/src/go/collectors/go.d.plugin/modules/coredns/metadata.yaml" +custom_edit_url: "https://github.com/netdata/netdata/edit/master/src/go/plugin/go.d/modules/coredns/README.md" +meta_yaml: "https://github.com/netdata/netdata/edit/master/src/go/plugin/go.d/modules/coredns/metadata.yaml" sidebar_label: "CoreDNS" learn_status: "Published" learn_rel_path: "Collecting Metrics/DNS and DHCP Servers" @@ -177,7 +177,7 @@ The following options can be defined globally: update_every, autodetection_retry Metrics of servers matching the selector will be collected. - Logic: (pattern1 OR pattern2) AND !(pattern3 or pattern4) -- Pattern syntax: [matcher](https://github.com/netdata/netdata/tree/master/src/go/collectors/go.d.plugin/pkg/matcher#supported-format). +- Pattern syntax: [matcher](https://github.com/netdata/netdata/tree/master/src/go/plugin/go.d/pkg/matcher#supported-format). - Syntax: ```yaml @@ -195,7 +195,7 @@ per_server_stats: Metrics of zones matching the selector will be collected. - Logic: (pattern1 OR pattern2) AND !(pattern3 or pattern4) -- Pattern syntax: [matcher](https://github.com/netdata/netdata/tree/master/src/go/collectors/go.d.plugin/pkg/matcher#supported-format). +- Pattern syntax: [matcher](https://github.com/netdata/netdata/tree/master/src/go/plugin/go.d/pkg/matcher#supported-format). - Syntax: ```yaml @@ -269,6 +269,8 @@ jobs: ### Debug Mode +**Important**: Debug mode is not supported for data collection jobs created via the UI using the Dyncfg feature. + To troubleshoot issues with the `coredns` collector, run the `go.d.plugin` with the debug option enabled. The output should give you clues as to why the collector isn't working. @@ -291,4 +293,37 @@ should give you clues as to why the collector isn't working. ./go.d.plugin -d -m coredns ``` +### Getting Logs + +If you're encountering problems with the `coredns` collector, follow these steps to retrieve logs and identify potential issues: + +- **Run the command** specific to your system (systemd, non-systemd, or Docker container). +- **Examine the output** for any warnings or error messages that might indicate issues. These messages should provide clues about the root cause of the problem. + +#### System with systemd + +Use the following command to view logs generated since the last Netdata service restart: + +```bash +journalctl _SYSTEMD_INVOCATION_ID="$(systemctl show --value --property=InvocationID netdata)" --namespace=netdata --grep coredns +``` + +#### System without systemd + +Locate the collector log file, typically at `/var/log/netdata/collector.log`, and use `grep` to filter for collector's name: + +```bash +grep coredns /var/log/netdata/collector.log +``` + +**Note**: This method shows logs from all restarts. Focus on the **latest entries** for troubleshooting current issues. + +#### Docker Container + +If your Netdata runs in a Docker container named "netdata" (replace if different), use this command: + +```bash +docker logs netdata 2>&1 | grep coredns +``` + diff --git a/src/go/collectors/go.d.plugin/modules/coredns/metadata.yaml b/src/go/plugin/go.d/modules/coredns/metadata.yaml index 27f70fdc5..e128ab546 100644 --- a/src/go/collectors/go.d.plugin/modules/coredns/metadata.yaml +++ b/src/go/plugin/go.d/modules/coredns/metadata.yaml @@ -70,7 +70,7 @@ modules: detailed_description: | Metrics of servers matching the selector will be collected. - Logic: (pattern1 OR pattern2) AND !(pattern3 or pattern4) - - Pattern syntax: [matcher](https://github.com/netdata/netdata/tree/master/src/go/collectors/go.d.plugin/pkg/matcher#supported-format). + - Pattern syntax: [matcher](https://github.com/netdata/netdata/tree/master/src/go/plugin/go.d/pkg/matcher#supported-format). - Syntax: ```yaml @@ -89,7 +89,7 @@ modules: detailed_description: | Metrics of zones matching the selector will be collected. - Logic: (pattern1 OR pattern2) AND !(pattern3 or pattern4) - - Pattern syntax: [matcher](https://github.com/netdata/netdata/tree/master/src/go/collectors/go.d.plugin/pkg/matcher#supported-format). + - Pattern syntax: [matcher](https://github.com/netdata/netdata/tree/master/src/go/plugin/go.d/pkg/matcher#supported-format). - Syntax: ```yaml diff --git a/src/go/collectors/go.d.plugin/modules/coredns/metrics.go b/src/go/plugin/go.d/modules/coredns/metrics.go index 1c72041bf..5929fdbf6 100644 --- a/src/go/collectors/go.d.plugin/modules/coredns/metrics.go +++ b/src/go/plugin/go.d/modules/coredns/metrics.go @@ -3,7 +3,7 @@ package coredns import ( - mtx "github.com/netdata/netdata/go/go.d.plugin/pkg/metrics" + mtx "github.com/netdata/netdata/go/plugins/plugin/go.d/pkg/metrics" ) func newMetrics() *metrics { diff --git a/src/go/collectors/go.d.plugin/modules/coredns/testdata/config.json b/src/go/plugin/go.d/modules/coredns/testdata/config.json index 2dc54a1a2..2dc54a1a2 100644 --- a/src/go/collectors/go.d.plugin/modules/coredns/testdata/config.json +++ b/src/go/plugin/go.d/modules/coredns/testdata/config.json diff --git a/src/go/collectors/go.d.plugin/modules/coredns/testdata/config.yaml b/src/go/plugin/go.d/modules/coredns/testdata/config.yaml index be474167f..be474167f 100644 --- a/src/go/collectors/go.d.plugin/modules/coredns/testdata/config.yaml +++ b/src/go/plugin/go.d/modules/coredns/testdata/config.yaml diff --git a/src/go/collectors/go.d.plugin/modules/coredns/testdata/no_version/no_load.txt b/src/go/plugin/go.d/modules/coredns/testdata/no_version/no_load.txt index f0de841f0..f0de841f0 100644 --- a/src/go/collectors/go.d.plugin/modules/coredns/testdata/no_version/no_load.txt +++ b/src/go/plugin/go.d/modules/coredns/testdata/no_version/no_load.txt diff --git a/src/go/collectors/go.d.plugin/modules/coredns/testdata/version169/no_load.txt b/src/go/plugin/go.d/modules/coredns/testdata/version169/no_load.txt index 8fee1a73c..8fee1a73c 100644 --- a/src/go/collectors/go.d.plugin/modules/coredns/testdata/version169/no_load.txt +++ b/src/go/plugin/go.d/modules/coredns/testdata/version169/no_load.txt diff --git a/src/go/collectors/go.d.plugin/modules/coredns/testdata/version169/some_load.txt b/src/go/plugin/go.d/modules/coredns/testdata/version169/some_load.txt index 15c4a57ec..15c4a57ec 100644 --- a/src/go/collectors/go.d.plugin/modules/coredns/testdata/version169/some_load.txt +++ b/src/go/plugin/go.d/modules/coredns/testdata/version169/some_load.txt diff --git a/src/go/collectors/go.d.plugin/modules/coredns/testdata/version170/no_load.txt b/src/go/plugin/go.d/modules/coredns/testdata/version170/no_load.txt index ba343ab57..ba343ab57 100644 --- a/src/go/collectors/go.d.plugin/modules/coredns/testdata/version170/no_load.txt +++ b/src/go/plugin/go.d/modules/coredns/testdata/version170/no_load.txt diff --git a/src/go/collectors/go.d.plugin/modules/coredns/testdata/version170/some_load.txt b/src/go/plugin/go.d/modules/coredns/testdata/version170/some_load.txt index 34f0a9a22..34f0a9a22 100644 --- a/src/go/collectors/go.d.plugin/modules/coredns/testdata/version170/some_load.txt +++ b/src/go/plugin/go.d/modules/coredns/testdata/version170/some_load.txt diff --git a/src/go/collectors/go.d.plugin/modules/couchbase/README.md b/src/go/plugin/go.d/modules/couchbase/README.md index fa8d05e1c..fa8d05e1c 120000 --- a/src/go/collectors/go.d.plugin/modules/couchbase/README.md +++ b/src/go/plugin/go.d/modules/couchbase/README.md diff --git a/src/go/collectors/go.d.plugin/modules/couchbase/charts.go b/src/go/plugin/go.d/modules/couchbase/charts.go index 792718095..277b814ad 100644 --- a/src/go/collectors/go.d.plugin/modules/couchbase/charts.go +++ b/src/go/plugin/go.d/modules/couchbase/charts.go @@ -3,7 +3,7 @@ package couchbase import ( - "github.com/netdata/netdata/go/go.d.plugin/agent/module" + "github.com/netdata/netdata/go/plugins/plugin/go.d/agent/module" ) type ( diff --git a/src/go/collectors/go.d.plugin/modules/couchbase/collect.go b/src/go/plugin/go.d/modules/couchbase/collect.go index 2d4d3626d..6027ac918 100644 --- a/src/go/collectors/go.d.plugin/modules/couchbase/collect.go +++ b/src/go/plugin/go.d/modules/couchbase/collect.go @@ -9,8 +9,8 @@ import ( "net/http" "net/url" - "github.com/netdata/netdata/go/go.d.plugin/agent/module" - "github.com/netdata/netdata/go/go.d.plugin/pkg/web" + "github.com/netdata/netdata/go/plugins/plugin/go.d/agent/module" + "github.com/netdata/netdata/go/plugins/plugin/go.d/pkg/web" ) const ( @@ -112,11 +112,13 @@ func (cb *Couchbase) addDimToChart(chartID string, dim *module.Dim) { } func (cb *Couchbase) scrapeCouchbase() (*cbMetrics, error) { - ms := &cbMetrics{} - req, _ := web.NewHTTPRequest(cb.Request) - req.URL.Path = urlPathBucketsStats + req, err := web.NewHTTPRequestWithPath(cb.Request, urlPathBucketsStats) + if err != nil { + return nil, err + } req.URL.RawQuery = url.Values{"skipMap": []string{"true"}}.Encode() + ms := &cbMetrics{} if err := cb.doOKDecode(req, &ms.BucketsBasicStats); err != nil { return nil, err } diff --git a/src/go/collectors/go.d.plugin/modules/couchbase/config_schema.json b/src/go/plugin/go.d/modules/couchbase/config_schema.json index 7a69e9947..6ef455a97 100644 --- a/src/go/collectors/go.d.plugin/modules/couchbase/config_schema.json +++ b/src/go/plugin/go.d/modules/couchbase/config_schema.json @@ -167,6 +167,12 @@ "timeout": { "ui:help": "Accepts decimals for precise control (e.g., type 1.5 for 1.5 seconds)." }, + "username": { + "ui:widget": "password" + }, + "proxy_username": { + "ui:widget": "password" + }, "password": { "ui:widget": "password" }, diff --git a/src/go/collectors/go.d.plugin/modules/couchbase/couchbase.go b/src/go/plugin/go.d/modules/couchbase/couchbase.go index 92a82f2f0..8ef880c2c 100644 --- a/src/go/collectors/go.d.plugin/modules/couchbase/couchbase.go +++ b/src/go/plugin/go.d/modules/couchbase/couchbase.go @@ -8,8 +8,8 @@ import ( "net/http" "time" - "github.com/netdata/netdata/go/go.d.plugin/agent/module" - "github.com/netdata/netdata/go/go.d.plugin/pkg/web" + "github.com/netdata/netdata/go/plugins/plugin/go.d/agent/module" + "github.com/netdata/netdata/go/plugins/plugin/go.d/pkg/web" ) //go:embed "config_schema.json" diff --git a/src/go/collectors/go.d.plugin/modules/couchbase/couchbase_test.go b/src/go/plugin/go.d/modules/couchbase/couchbase_test.go index 9c792b7db..b28c8e8fe 100644 --- a/src/go/collectors/go.d.plugin/modules/couchbase/couchbase_test.go +++ b/src/go/plugin/go.d/modules/couchbase/couchbase_test.go @@ -8,8 +8,8 @@ import ( "os" "testing" - "github.com/netdata/netdata/go/go.d.plugin/agent/module" - "github.com/netdata/netdata/go/go.d.plugin/pkg/web" + "github.com/netdata/netdata/go/plugins/plugin/go.d/agent/module" + "github.com/netdata/netdata/go/plugins/plugin/go.d/pkg/web" "github.com/stretchr/testify/assert" "github.com/stretchr/testify/require" diff --git a/src/go/collectors/go.d.plugin/modules/couchbase/init.go b/src/go/plugin/go.d/modules/couchbase/init.go index 255e03540..196e6998c 100644 --- a/src/go/collectors/go.d.plugin/modules/couchbase/init.go +++ b/src/go/plugin/go.d/modules/couchbase/init.go @@ -6,8 +6,8 @@ import ( "errors" "net/http" - "github.com/netdata/netdata/go/go.d.plugin/agent/module" - "github.com/netdata/netdata/go/go.d.plugin/pkg/web" + "github.com/netdata/netdata/go/plugins/plugin/go.d/agent/module" + "github.com/netdata/netdata/go/plugins/plugin/go.d/pkg/web" ) func (cb *Couchbase) initCharts() (*Charts, error) { diff --git a/src/go/collectors/go.d.plugin/modules/couchbase/integrations/couchbase.md b/src/go/plugin/go.d/modules/couchbase/integrations/couchbase.md index 209d851f0..b53dc940c 100644 --- a/src/go/collectors/go.d.plugin/modules/couchbase/integrations/couchbase.md +++ b/src/go/plugin/go.d/modules/couchbase/integrations/couchbase.md @@ -1,6 +1,6 @@ <!--startmeta -custom_edit_url: "https://github.com/netdata/netdata/edit/master/src/go/collectors/go.d.plugin/modules/couchbase/README.md" -meta_yaml: "https://github.com/netdata/netdata/edit/master/src/go/collectors/go.d.plugin/modules/couchbase/metadata.yaml" +custom_edit_url: "https://github.com/netdata/netdata/edit/master/src/go/plugin/go.d/modules/couchbase/README.md" +meta_yaml: "https://github.com/netdata/netdata/edit/master/src/go/plugin/go.d/modules/couchbase/metadata.yaml" sidebar_label: "Couchbase" learn_status: "Published" learn_rel_path: "Collecting Metrics/Databases" @@ -187,6 +187,8 @@ jobs: ### Debug Mode +**Important**: Debug mode is not supported for data collection jobs created via the UI using the Dyncfg feature. + To troubleshoot issues with the `couchbase` collector, run the `go.d.plugin` with the debug option enabled. The output should give you clues as to why the collector isn't working. @@ -209,4 +211,37 @@ should give you clues as to why the collector isn't working. ./go.d.plugin -d -m couchbase ``` +### Getting Logs + +If you're encountering problems with the `couchbase` collector, follow these steps to retrieve logs and identify potential issues: + +- **Run the command** specific to your system (systemd, non-systemd, or Docker container). +- **Examine the output** for any warnings or error messages that might indicate issues. These messages should provide clues about the root cause of the problem. + +#### System with systemd + +Use the following command to view logs generated since the last Netdata service restart: + +```bash +journalctl _SYSTEMD_INVOCATION_ID="$(systemctl show --value --property=InvocationID netdata)" --namespace=netdata --grep couchbase +``` + +#### System without systemd + +Locate the collector log file, typically at `/var/log/netdata/collector.log`, and use `grep` to filter for collector's name: + +```bash +grep couchbase /var/log/netdata/collector.log +``` + +**Note**: This method shows logs from all restarts. Focus on the **latest entries** for troubleshooting current issues. + +#### Docker Container + +If your Netdata runs in a Docker container named "netdata" (replace if different), use this command: + +```bash +docker logs netdata 2>&1 | grep couchbase +``` + diff --git a/src/go/collectors/go.d.plugin/modules/couchbase/metadata.yaml b/src/go/plugin/go.d/modules/couchbase/metadata.yaml index de21e924d..de21e924d 100644 --- a/src/go/collectors/go.d.plugin/modules/couchbase/metadata.yaml +++ b/src/go/plugin/go.d/modules/couchbase/metadata.yaml diff --git a/src/go/collectors/go.d.plugin/modules/couchbase/metrics.go b/src/go/plugin/go.d/modules/couchbase/metrics.go index c4f23304b..c4f23304b 100644 --- a/src/go/collectors/go.d.plugin/modules/couchbase/metrics.go +++ b/src/go/plugin/go.d/modules/couchbase/metrics.go diff --git a/src/go/collectors/go.d.plugin/modules/couchbase/testdata/6.6.0/buckets_basic_stats.json b/src/go/plugin/go.d/modules/couchbase/testdata/6.6.0/buckets_basic_stats.json index 3749add79..3749add79 100644 --- a/src/go/collectors/go.d.plugin/modules/couchbase/testdata/6.6.0/buckets_basic_stats.json +++ b/src/go/plugin/go.d/modules/couchbase/testdata/6.6.0/buckets_basic_stats.json diff --git a/src/go/collectors/go.d.plugin/modules/couchbase/testdata/config.json b/src/go/plugin/go.d/modules/couchbase/testdata/config.json index 984c3ed6e..984c3ed6e 100644 --- a/src/go/collectors/go.d.plugin/modules/couchbase/testdata/config.json +++ b/src/go/plugin/go.d/modules/couchbase/testdata/config.json diff --git a/src/go/collectors/go.d.plugin/modules/couchbase/testdata/config.yaml b/src/go/plugin/go.d/modules/couchbase/testdata/config.yaml index 8558b61cc..8558b61cc 100644 --- a/src/go/collectors/go.d.plugin/modules/couchbase/testdata/config.yaml +++ b/src/go/plugin/go.d/modules/couchbase/testdata/config.yaml diff --git a/src/go/collectors/go.d.plugin/modules/couchdb/README.md b/src/go/plugin/go.d/modules/couchdb/README.md index 14cff4d36..14cff4d36 120000 --- a/src/go/collectors/go.d.plugin/modules/couchdb/README.md +++ b/src/go/plugin/go.d/modules/couchdb/README.md diff --git a/src/go/collectors/go.d.plugin/modules/couchdb/charts.go b/src/go/plugin/go.d/modules/couchdb/charts.go index 3dedec7db..3d84471d2 100644 --- a/src/go/collectors/go.d.plugin/modules/couchdb/charts.go +++ b/src/go/plugin/go.d/modules/couchdb/charts.go @@ -3,7 +3,7 @@ package couchdb import ( - "github.com/netdata/netdata/go/go.d.plugin/agent/module" + "github.com/netdata/netdata/go/plugins/plugin/go.d/agent/module" ) type ( diff --git a/src/go/collectors/go.d.plugin/modules/couchdb/collect.go b/src/go/plugin/go.d/modules/couchdb/collect.go index 5c722fd0c..21b38fb3a 100644 --- a/src/go/collectors/go.d.plugin/modules/couchdb/collect.go +++ b/src/go/plugin/go.d/modules/couchdb/collect.go @@ -13,8 +13,8 @@ import ( "strings" "sync" - "github.com/netdata/netdata/go/go.d.plugin/pkg/stm" - "github.com/netdata/netdata/go/go.d.plugin/pkg/web" + "github.com/netdata/netdata/go/plugins/plugin/go.d/pkg/stm" + "github.com/netdata/netdata/go/plugins/plugin/go.d/pkg/web" ) const ( @@ -120,8 +120,7 @@ func (cdb *CouchDB) scrapeCouchDB() *cdbMetrics { } func (cdb *CouchDB) scrapeNodeStats(ms *cdbMetrics) { - req, _ := web.NewHTTPRequest(cdb.Request) - req.URL.Path = fmt.Sprintf(urlPathOverviewStats, cdb.Config.Node) + req, _ := web.NewHTTPRequestWithPath(cdb.Request, fmt.Sprintf(urlPathOverviewStats, cdb.Config.Node)) var stats cdbNodeStats if err := cdb.doOKDecode(req, &stats); err != nil { @@ -132,8 +131,7 @@ func (cdb *CouchDB) scrapeNodeStats(ms *cdbMetrics) { } func (cdb *CouchDB) scrapeSystemStats(ms *cdbMetrics) { - req, _ := web.NewHTTPRequest(cdb.Request) - req.URL.Path = fmt.Sprintf(urlPathSystemStats, cdb.Config.Node) + req, _ := web.NewHTTPRequestWithPath(cdb.Request, fmt.Sprintf(urlPathSystemStats, cdb.Config.Node)) var stats cdbNodeSystem if err := cdb.doOKDecode(req, &stats); err != nil { @@ -144,8 +142,7 @@ func (cdb *CouchDB) scrapeSystemStats(ms *cdbMetrics) { } func (cdb *CouchDB) scrapeActiveTasks(ms *cdbMetrics) { - req, _ := web.NewHTTPRequest(cdb.Request) - req.URL.Path = urlPathActiveTasks + req, _ := web.NewHTTPRequestWithPath(cdb.Request, urlPathActiveTasks) var stats []cdbActiveTask if err := cdb.doOKDecode(req, &stats); err != nil { @@ -156,8 +153,7 @@ func (cdb *CouchDB) scrapeActiveTasks(ms *cdbMetrics) { } func (cdb *CouchDB) scrapeDBStats(ms *cdbMetrics) { - req, _ := web.NewHTTPRequest(cdb.Request) - req.URL.Path = urlPathDatabases + req, _ := web.NewHTTPRequestWithPath(cdb.Request, urlPathDatabases) req.Method = http.MethodPost req.Header.Add("Accept", "application/json") req.Header.Add("Content-Type", "application/json") @@ -182,18 +178,18 @@ func (cdb *CouchDB) scrapeDBStats(ms *cdbMetrics) { } func findMaxMQSize(MessageQueues map[string]interface{}) int64 { - var max float64 + var maxSize float64 for _, mq := range MessageQueues { switch mqSize := mq.(type) { case float64: - max = math.Max(max, mqSize) + maxSize = math.Max(maxSize, mqSize) case map[string]interface{}: if v, ok := mqSize["count"].(float64); ok { - max = math.Max(max, v) + maxSize = math.Max(maxSize, v) } } } - return int64(max) + return int64(maxSize) } func (cdb *CouchDB) pingCouchDB() error { diff --git a/src/go/collectors/go.d.plugin/modules/couchdb/config_schema.json b/src/go/plugin/go.d/modules/couchdb/config_schema.json index 2f9df722a..0df439b07 100644 --- a/src/go/collectors/go.d.plugin/modules/couchdb/config_schema.json +++ b/src/go/plugin/go.d/modules/couchdb/config_schema.json @@ -181,6 +181,12 @@ "timeout": { "ui:help": "Accepts decimals for precise control (e.g., type 1.5 for 1.5 seconds)." }, + "username": { + "ui:widget": "password" + }, + "proxy_username": { + "ui:widget": "password" + }, "password": { "ui:widget": "password" }, diff --git a/src/go/collectors/go.d.plugin/modules/couchdb/couchdb.go b/src/go/plugin/go.d/modules/couchdb/couchdb.go index 459251e9d..56563ec7b 100644 --- a/src/go/collectors/go.d.plugin/modules/couchdb/couchdb.go +++ b/src/go/plugin/go.d/modules/couchdb/couchdb.go @@ -9,8 +9,8 @@ import ( "strings" "time" - "github.com/netdata/netdata/go/go.d.plugin/agent/module" - "github.com/netdata/netdata/go/go.d.plugin/pkg/web" + "github.com/netdata/netdata/go/plugins/plugin/go.d/agent/module" + "github.com/netdata/netdata/go/plugins/plugin/go.d/pkg/web" ) //go:embed "config_schema.json" diff --git a/src/go/collectors/go.d.plugin/modules/couchdb/couchdb_test.go b/src/go/plugin/go.d/modules/couchdb/couchdb_test.go index 15e7aa0a1..99b7825fd 100644 --- a/src/go/collectors/go.d.plugin/modules/couchdb/couchdb_test.go +++ b/src/go/plugin/go.d/modules/couchdb/couchdb_test.go @@ -8,9 +8,9 @@ import ( "os" "testing" - "github.com/netdata/netdata/go/go.d.plugin/agent/module" - "github.com/netdata/netdata/go/go.d.plugin/pkg/tlscfg" - "github.com/netdata/netdata/go/go.d.plugin/pkg/web" + "github.com/netdata/netdata/go/plugins/plugin/go.d/agent/module" + "github.com/netdata/netdata/go/plugins/plugin/go.d/pkg/tlscfg" + "github.com/netdata/netdata/go/plugins/plugin/go.d/pkg/web" "github.com/stretchr/testify/assert" "github.com/stretchr/testify/require" diff --git a/src/go/collectors/go.d.plugin/modules/couchdb/init.go b/src/go/plugin/go.d/modules/couchdb/init.go index 028848152..65e555749 100644 --- a/src/go/collectors/go.d.plugin/modules/couchdb/init.go +++ b/src/go/plugin/go.d/modules/couchdb/init.go @@ -6,8 +6,8 @@ import ( "errors" "net/http" - "github.com/netdata/netdata/go/go.d.plugin/agent/module" - "github.com/netdata/netdata/go/go.d.plugin/pkg/web" + "github.com/netdata/netdata/go/plugins/plugin/go.d/agent/module" + "github.com/netdata/netdata/go/plugins/plugin/go.d/pkg/web" ) func (cdb *CouchDB) validateConfig() error { diff --git a/src/go/collectors/go.d.plugin/modules/couchdb/integrations/couchdb.md b/src/go/plugin/go.d/modules/couchdb/integrations/couchdb.md index 8a59d181e..5e7f578cc 100644 --- a/src/go/collectors/go.d.plugin/modules/couchdb/integrations/couchdb.md +++ b/src/go/plugin/go.d/modules/couchdb/integrations/couchdb.md @@ -1,6 +1,6 @@ <!--startmeta -custom_edit_url: "https://github.com/netdata/netdata/edit/master/src/go/collectors/go.d.plugin/modules/couchdb/README.md" -meta_yaml: "https://github.com/netdata/netdata/edit/master/src/go/collectors/go.d.plugin/modules/couchdb/metadata.yaml" +custom_edit_url: "https://github.com/netdata/netdata/edit/master/src/go/plugin/go.d/modules/couchdb/README.md" +meta_yaml: "https://github.com/netdata/netdata/edit/master/src/go/plugin/go.d/modules/couchdb/metadata.yaml" sidebar_label: "CouchDB" learn_status: "Published" learn_rel_path: "Collecting Metrics/Databases" @@ -200,6 +200,8 @@ jobs: ### Debug Mode +**Important**: Debug mode is not supported for data collection jobs created via the UI using the Dyncfg feature. + To troubleshoot issues with the `couchdb` collector, run the `go.d.plugin` with the debug option enabled. The output should give you clues as to why the collector isn't working. @@ -222,4 +224,37 @@ should give you clues as to why the collector isn't working. ./go.d.plugin -d -m couchdb ``` +### Getting Logs + +If you're encountering problems with the `couchdb` collector, follow these steps to retrieve logs and identify potential issues: + +- **Run the command** specific to your system (systemd, non-systemd, or Docker container). +- **Examine the output** for any warnings or error messages that might indicate issues. These messages should provide clues about the root cause of the problem. + +#### System with systemd + +Use the following command to view logs generated since the last Netdata service restart: + +```bash +journalctl _SYSTEMD_INVOCATION_ID="$(systemctl show --value --property=InvocationID netdata)" --namespace=netdata --grep couchdb +``` + +#### System without systemd + +Locate the collector log file, typically at `/var/log/netdata/collector.log`, and use `grep` to filter for collector's name: + +```bash +grep couchdb /var/log/netdata/collector.log +``` + +**Note**: This method shows logs from all restarts. Focus on the **latest entries** for troubleshooting current issues. + +#### Docker Container + +If your Netdata runs in a Docker container named "netdata" (replace if different), use this command: + +```bash +docker logs netdata 2>&1 | grep couchdb +``` + diff --git a/src/go/collectors/go.d.plugin/modules/couchdb/metadata.yaml b/src/go/plugin/go.d/modules/couchdb/metadata.yaml index 2f0036db2..2f0036db2 100644 --- a/src/go/collectors/go.d.plugin/modules/couchdb/metadata.yaml +++ b/src/go/plugin/go.d/modules/couchdb/metadata.yaml diff --git a/src/go/collectors/go.d.plugin/modules/couchdb/metrics.go b/src/go/plugin/go.d/modules/couchdb/metrics.go index 4d2f02679..4d2f02679 100644 --- a/src/go/collectors/go.d.plugin/modules/couchdb/metrics.go +++ b/src/go/plugin/go.d/modules/couchdb/metrics.go diff --git a/src/go/collectors/go.d.plugin/modules/couchdb/testdata/config.json b/src/go/plugin/go.d/modules/couchdb/testdata/config.json index 0fa716e5d..0fa716e5d 100644 --- a/src/go/collectors/go.d.plugin/modules/couchdb/testdata/config.json +++ b/src/go/plugin/go.d/modules/couchdb/testdata/config.json diff --git a/src/go/collectors/go.d.plugin/modules/couchdb/testdata/config.yaml b/src/go/plugin/go.d/modules/couchdb/testdata/config.yaml index 4968ed263..4968ed263 100644 --- a/src/go/collectors/go.d.plugin/modules/couchdb/testdata/config.yaml +++ b/src/go/plugin/go.d/modules/couchdb/testdata/config.yaml diff --git a/src/go/collectors/go.d.plugin/modules/couchdb/testdata/v3.1.1/active_tasks.json b/src/go/plugin/go.d/modules/couchdb/testdata/v3.1.1/active_tasks.json index 788fe5642..788fe5642 100644 --- a/src/go/collectors/go.d.plugin/modules/couchdb/testdata/v3.1.1/active_tasks.json +++ b/src/go/plugin/go.d/modules/couchdb/testdata/v3.1.1/active_tasks.json diff --git a/src/go/collectors/go.d.plugin/modules/couchdb/testdata/v3.1.1/dbs_info.json b/src/go/plugin/go.d/modules/couchdb/testdata/v3.1.1/dbs_info.json index 9ca43a53c..9ca43a53c 100644 --- a/src/go/collectors/go.d.plugin/modules/couchdb/testdata/v3.1.1/dbs_info.json +++ b/src/go/plugin/go.d/modules/couchdb/testdata/v3.1.1/dbs_info.json diff --git a/src/go/collectors/go.d.plugin/modules/couchdb/testdata/v3.1.1/node_stats.json b/src/go/plugin/go.d/modules/couchdb/testdata/v3.1.1/node_stats.json index ae31366af..ae31366af 100644 --- a/src/go/collectors/go.d.plugin/modules/couchdb/testdata/v3.1.1/node_stats.json +++ b/src/go/plugin/go.d/modules/couchdb/testdata/v3.1.1/node_stats.json diff --git a/src/go/collectors/go.d.plugin/modules/couchdb/testdata/v3.1.1/node_system.json b/src/go/plugin/go.d/modules/couchdb/testdata/v3.1.1/node_system.json index 7084645a4..7084645a4 100644 --- a/src/go/collectors/go.d.plugin/modules/couchdb/testdata/v3.1.1/node_system.json +++ b/src/go/plugin/go.d/modules/couchdb/testdata/v3.1.1/node_system.json diff --git a/src/go/collectors/go.d.plugin/modules/couchdb/testdata/v3.1.1/root.json b/src/go/plugin/go.d/modules/couchdb/testdata/v3.1.1/root.json index e7feb41c7..e7feb41c7 100644 --- a/src/go/collectors/go.d.plugin/modules/couchdb/testdata/v3.1.1/root.json +++ b/src/go/plugin/go.d/modules/couchdb/testdata/v3.1.1/root.json diff --git a/src/go/collectors/go.d.plugin/modules/dmcache/README.md b/src/go/plugin/go.d/modules/dmcache/README.md index 9609ec869..9609ec869 120000 --- a/src/go/collectors/go.d.plugin/modules/dmcache/README.md +++ b/src/go/plugin/go.d/modules/dmcache/README.md diff --git a/src/go/collectors/go.d.plugin/modules/dmcache/charts.go b/src/go/plugin/go.d/modules/dmcache/charts.go index 0f57d40a5..c77f3d878 100644 --- a/src/go/collectors/go.d.plugin/modules/dmcache/charts.go +++ b/src/go/plugin/go.d/modules/dmcache/charts.go @@ -6,7 +6,7 @@ import ( "fmt" "strings" - "github.com/netdata/netdata/go/go.d.plugin/agent/module" + "github.com/netdata/netdata/go/plugins/plugin/go.d/agent/module" ) const ( diff --git a/src/go/collectors/go.d.plugin/modules/dmcache/collect.go b/src/go/plugin/go.d/modules/dmcache/collect.go index eae961b73..eae961b73 100644 --- a/src/go/collectors/go.d.plugin/modules/dmcache/collect.go +++ b/src/go/plugin/go.d/modules/dmcache/collect.go diff --git a/src/go/collectors/go.d.plugin/modules/dmcache/config_schema.json b/src/go/plugin/go.d/modules/dmcache/config_schema.json index 4428b4d1b..4428b4d1b 100644 --- a/src/go/collectors/go.d.plugin/modules/dmcache/config_schema.json +++ b/src/go/plugin/go.d/modules/dmcache/config_schema.json diff --git a/src/go/collectors/go.d.plugin/modules/dmcache/dmcache.go b/src/go/plugin/go.d/modules/dmcache/dmcache.go index c7eb5ea1d..9f3844b15 100644 --- a/src/go/collectors/go.d.plugin/modules/dmcache/dmcache.go +++ b/src/go/plugin/go.d/modules/dmcache/dmcache.go @@ -7,8 +7,8 @@ import ( "errors" "time" - "github.com/netdata/netdata/go/go.d.plugin/agent/module" - "github.com/netdata/netdata/go/go.d.plugin/pkg/web" + "github.com/netdata/netdata/go/plugins/plugin/go.d/agent/module" + "github.com/netdata/netdata/go/plugins/plugin/go.d/pkg/web" ) //go:embed "config_schema.json" diff --git a/src/go/collectors/go.d.plugin/modules/dmcache/dmcache_test.go b/src/go/plugin/go.d/modules/dmcache/dmcache_test.go index ef2de991a..218ae044c 100644 --- a/src/go/collectors/go.d.plugin/modules/dmcache/dmcache_test.go +++ b/src/go/plugin/go.d/modules/dmcache/dmcache_test.go @@ -7,7 +7,7 @@ import ( "os" "testing" - "github.com/netdata/netdata/go/go.d.plugin/agent/module" + "github.com/netdata/netdata/go/plugins/plugin/go.d/agent/module" "github.com/stretchr/testify/assert" "github.com/stretchr/testify/require" diff --git a/src/go/collectors/go.d.plugin/modules/dmcache/exec.go b/src/go/plugin/go.d/modules/dmcache/exec.go index 9d860ffb8..1cd11be31 100644 --- a/src/go/collectors/go.d.plugin/modules/dmcache/exec.go +++ b/src/go/plugin/go.d/modules/dmcache/exec.go @@ -8,7 +8,7 @@ import ( "os/exec" "time" - "github.com/netdata/netdata/go/go.d.plugin/logger" + "github.com/netdata/netdata/go/plugins/logger" ) func newDmsetupExec(ndsudoPath string, timeout time.Duration, log *logger.Logger) *dmsetupExec { diff --git a/src/go/collectors/go.d.plugin/modules/dmcache/init.go b/src/go/plugin/go.d/modules/dmcache/init.go index 888e278a4..229972da7 100644 --- a/src/go/collectors/go.d.plugin/modules/dmcache/init.go +++ b/src/go/plugin/go.d/modules/dmcache/init.go @@ -7,7 +7,7 @@ import ( "os" "path/filepath" - "github.com/netdata/netdata/go/go.d.plugin/agent/executable" + "github.com/netdata/netdata/go/plugins/pkg/executable" ) func (c *DmCache) initDmsetupCLI() (dmsetupCLI, error) { diff --git a/src/go/collectors/go.d.plugin/modules/dmcache/integrations/dmcache_devices.md b/src/go/plugin/go.d/modules/dmcache/integrations/dmcache_devices.md index 7dfa898fb..ac61311b9 100644 --- a/src/go/collectors/go.d.plugin/modules/dmcache/integrations/dmcache_devices.md +++ b/src/go/plugin/go.d/modules/dmcache/integrations/dmcache_devices.md @@ -1,6 +1,6 @@ <!--startmeta -custom_edit_url: "https://github.com/netdata/netdata/edit/master/src/go/collectors/go.d.plugin/modules/dmcache/README.md" -meta_yaml: "https://github.com/netdata/netdata/edit/master/src/go/collectors/go.d.plugin/modules/dmcache/metadata.yaml" +custom_edit_url: "https://github.com/netdata/netdata/edit/master/src/go/plugin/go.d/modules/dmcache/README.md" +meta_yaml: "https://github.com/netdata/netdata/edit/master/src/go/plugin/go.d/modules/dmcache/metadata.yaml" sidebar_label: "DMCache devices" learn_status: "Published" learn_rel_path: "Collecting Metrics/Storage, Mount Points and Filesystems" @@ -138,6 +138,8 @@ jobs: ### Debug Mode +**Important**: Debug mode is not supported for data collection jobs created via the UI using the Dyncfg feature. + To troubleshoot issues with the `dmcache` collector, run the `go.d.plugin` with the debug option enabled. The output should give you clues as to why the collector isn't working. @@ -160,4 +162,37 @@ should give you clues as to why the collector isn't working. ./go.d.plugin -d -m dmcache ``` +### Getting Logs + +If you're encountering problems with the `dmcache` collector, follow these steps to retrieve logs and identify potential issues: + +- **Run the command** specific to your system (systemd, non-systemd, or Docker container). +- **Examine the output** for any warnings or error messages that might indicate issues. These messages should provide clues about the root cause of the problem. + +#### System with systemd + +Use the following command to view logs generated since the last Netdata service restart: + +```bash +journalctl _SYSTEMD_INVOCATION_ID="$(systemctl show --value --property=InvocationID netdata)" --namespace=netdata --grep dmcache +``` + +#### System without systemd + +Locate the collector log file, typically at `/var/log/netdata/collector.log`, and use `grep` to filter for collector's name: + +```bash +grep dmcache /var/log/netdata/collector.log +``` + +**Note**: This method shows logs from all restarts. Focus on the **latest entries** for troubleshooting current issues. + +#### Docker Container + +If your Netdata runs in a Docker container named "netdata" (replace if different), use this command: + +```bash +docker logs netdata 2>&1 | grep dmcache +``` + diff --git a/src/go/collectors/go.d.plugin/modules/dmcache/metadata.yaml b/src/go/plugin/go.d/modules/dmcache/metadata.yaml index 58d9e4621..58d9e4621 100644 --- a/src/go/collectors/go.d.plugin/modules/dmcache/metadata.yaml +++ b/src/go/plugin/go.d/modules/dmcache/metadata.yaml diff --git a/src/go/collectors/go.d.plugin/modules/dmcache/testdata/config.json b/src/go/plugin/go.d/modules/dmcache/testdata/config.json index 291ecee3d..291ecee3d 100644 --- a/src/go/collectors/go.d.plugin/modules/dmcache/testdata/config.json +++ b/src/go/plugin/go.d/modules/dmcache/testdata/config.json diff --git a/src/go/collectors/go.d.plugin/modules/dmcache/testdata/config.yaml b/src/go/plugin/go.d/modules/dmcache/testdata/config.yaml index 25b0b4c78..25b0b4c78 100644 --- a/src/go/collectors/go.d.plugin/modules/dmcache/testdata/config.yaml +++ b/src/go/plugin/go.d/modules/dmcache/testdata/config.yaml diff --git a/src/go/collectors/go.d.plugin/modules/dnsdist/README.md b/src/go/plugin/go.d/modules/dnsdist/README.md index c5fd71aa5..c5fd71aa5 120000 --- a/src/go/collectors/go.d.plugin/modules/dnsdist/README.md +++ b/src/go/plugin/go.d/modules/dnsdist/README.md diff --git a/src/go/collectors/go.d.plugin/modules/dnsdist/charts.go b/src/go/plugin/go.d/modules/dnsdist/charts.go index 8a9914ca8..24e1a8c89 100644 --- a/src/go/collectors/go.d.plugin/modules/dnsdist/charts.go +++ b/src/go/plugin/go.d/modules/dnsdist/charts.go @@ -2,7 +2,7 @@ package dnsdist -import "github.com/netdata/netdata/go/go.d.plugin/agent/module" +import "github.com/netdata/netdata/go/plugins/plugin/go.d/agent/module" var charts = module.Charts{ { diff --git a/src/go/collectors/go.d.plugin/modules/dnsdist/collect.go b/src/go/plugin/go.d/modules/dnsdist/collect.go index 650757479..9b860abf4 100644 --- a/src/go/collectors/go.d.plugin/modules/dnsdist/collect.go +++ b/src/go/plugin/go.d/modules/dnsdist/collect.go @@ -9,8 +9,8 @@ import ( "net/http" "net/url" - "github.com/netdata/netdata/go/go.d.plugin/pkg/stm" - "github.com/netdata/netdata/go/go.d.plugin/pkg/web" + "github.com/netdata/netdata/go/plugins/plugin/go.d/pkg/stm" + "github.com/netdata/netdata/go/plugins/plugin/go.d/pkg/web" ) const ( @@ -36,8 +36,10 @@ func (d *DNSdist) collectStatistic(collected map[string]int64, statistics *stati } func (d *DNSdist) scrapeStatistics() (*statisticMetrics, error) { - req, _ := web.NewHTTPRequest(d.Request) - req.URL.Path = urlPathJSONStat + req, err := web.NewHTTPRequestWithPath(d.Request, urlPathJSONStat) + if err != nil { + return nil, err + } req.URL.RawQuery = url.Values{"command": []string{"stats"}}.Encode() var statistics statisticMetrics diff --git a/src/go/collectors/go.d.plugin/modules/dnsdist/config_schema.json b/src/go/plugin/go.d/modules/dnsdist/config_schema.json index d635ab1a2..a71faaa04 100644 --- a/src/go/collectors/go.d.plugin/modules/dnsdist/config_schema.json +++ b/src/go/plugin/go.d/modules/dnsdist/config_schema.json @@ -167,6 +167,12 @@ "timeout": { "ui:help": "Accepts decimals for precise control (e.g., type 1.5 for 1.5 seconds)." }, + "username": { + "ui:widget": "password" + }, + "proxy_username": { + "ui:widget": "password" + }, "password": { "ui:widget": "password" }, diff --git a/src/go/collectors/go.d.plugin/modules/dnsdist/dnsdist.go b/src/go/plugin/go.d/modules/dnsdist/dnsdist.go index 97f3eb2a6..fd0d8a381 100644 --- a/src/go/collectors/go.d.plugin/modules/dnsdist/dnsdist.go +++ b/src/go/plugin/go.d/modules/dnsdist/dnsdist.go @@ -8,8 +8,8 @@ import ( "net/http" "time" - "github.com/netdata/netdata/go/go.d.plugin/agent/module" - "github.com/netdata/netdata/go/go.d.plugin/pkg/web" + "github.com/netdata/netdata/go/plugins/plugin/go.d/agent/module" + "github.com/netdata/netdata/go/plugins/plugin/go.d/pkg/web" ) //go:embed "config_schema.json" diff --git a/src/go/collectors/go.d.plugin/modules/dnsdist/dnsdist_test.go b/src/go/plugin/go.d/modules/dnsdist/dnsdist_test.go index 06d88103e..18212c79d 100644 --- a/src/go/collectors/go.d.plugin/modules/dnsdist/dnsdist_test.go +++ b/src/go/plugin/go.d/modules/dnsdist/dnsdist_test.go @@ -3,14 +3,14 @@ package dnsdist import ( - "github.com/netdata/netdata/go/go.d.plugin/agent/module" + "github.com/netdata/netdata/go/plugins/plugin/go.d/agent/module" "net/http" "net/http/httptest" "os" "testing" - "github.com/netdata/netdata/go/go.d.plugin/pkg/tlscfg" - "github.com/netdata/netdata/go/go.d.plugin/pkg/web" + "github.com/netdata/netdata/go/plugins/plugin/go.d/pkg/tlscfg" + "github.com/netdata/netdata/go/plugins/plugin/go.d/pkg/web" "github.com/stretchr/testify/assert" "github.com/stretchr/testify/require" diff --git a/src/go/collectors/go.d.plugin/modules/dnsdist/init.go b/src/go/plugin/go.d/modules/dnsdist/init.go index d88310883..d331da928 100644 --- a/src/go/collectors/go.d.plugin/modules/dnsdist/init.go +++ b/src/go/plugin/go.d/modules/dnsdist/init.go @@ -6,8 +6,8 @@ import ( "errors" "net/http" - "github.com/netdata/netdata/go/go.d.plugin/agent/module" - "github.com/netdata/netdata/go/go.d.plugin/pkg/web" + "github.com/netdata/netdata/go/plugins/plugin/go.d/agent/module" + "github.com/netdata/netdata/go/plugins/plugin/go.d/pkg/web" ) func (d *DNSdist) validateConfig() error { diff --git a/src/go/collectors/go.d.plugin/modules/dnsdist/integrations/dnsdist.md b/src/go/plugin/go.d/modules/dnsdist/integrations/dnsdist.md index c1acaf53e..934245a57 100644 --- a/src/go/collectors/go.d.plugin/modules/dnsdist/integrations/dnsdist.md +++ b/src/go/plugin/go.d/modules/dnsdist/integrations/dnsdist.md @@ -1,6 +1,6 @@ <!--startmeta -custom_edit_url: "https://github.com/netdata/netdata/edit/master/src/go/collectors/go.d.plugin/modules/dnsdist/README.md" -meta_yaml: "https://github.com/netdata/netdata/edit/master/src/go/collectors/go.d.plugin/modules/dnsdist/metadata.yaml" +custom_edit_url: "https://github.com/netdata/netdata/edit/master/src/go/plugin/go.d/modules/dnsdist/README.md" +meta_yaml: "https://github.com/netdata/netdata/edit/master/src/go/plugin/go.d/modules/dnsdist/metadata.yaml" sidebar_label: "DNSdist" learn_status: "Published" learn_rel_path: "Collecting Metrics/DNS and DHCP Servers" @@ -185,6 +185,8 @@ jobs: ### Debug Mode +**Important**: Debug mode is not supported for data collection jobs created via the UI using the Dyncfg feature. + To troubleshoot issues with the `dnsdist` collector, run the `go.d.plugin` with the debug option enabled. The output should give you clues as to why the collector isn't working. @@ -207,4 +209,37 @@ should give you clues as to why the collector isn't working. ./go.d.plugin -d -m dnsdist ``` +### Getting Logs + +If you're encountering problems with the `dnsdist` collector, follow these steps to retrieve logs and identify potential issues: + +- **Run the command** specific to your system (systemd, non-systemd, or Docker container). +- **Examine the output** for any warnings or error messages that might indicate issues. These messages should provide clues about the root cause of the problem. + +#### System with systemd + +Use the following command to view logs generated since the last Netdata service restart: + +```bash +journalctl _SYSTEMD_INVOCATION_ID="$(systemctl show --value --property=InvocationID netdata)" --namespace=netdata --grep dnsdist +``` + +#### System without systemd + +Locate the collector log file, typically at `/var/log/netdata/collector.log`, and use `grep` to filter for collector's name: + +```bash +grep dnsdist /var/log/netdata/collector.log +``` + +**Note**: This method shows logs from all restarts. Focus on the **latest entries** for troubleshooting current issues. + +#### Docker Container + +If your Netdata runs in a Docker container named "netdata" (replace if different), use this command: + +```bash +docker logs netdata 2>&1 | grep dnsdist +``` + diff --git a/src/go/collectors/go.d.plugin/modules/dnsdist/metadata.yaml b/src/go/plugin/go.d/modules/dnsdist/metadata.yaml index 4e7a45d39..4e7a45d39 100644 --- a/src/go/collectors/go.d.plugin/modules/dnsdist/metadata.yaml +++ b/src/go/plugin/go.d/modules/dnsdist/metadata.yaml diff --git a/src/go/collectors/go.d.plugin/modules/dnsdist/metrics.go b/src/go/plugin/go.d/modules/dnsdist/metrics.go index 1de04319d..1de04319d 100644 --- a/src/go/collectors/go.d.plugin/modules/dnsdist/metrics.go +++ b/src/go/plugin/go.d/modules/dnsdist/metrics.go diff --git a/src/go/collectors/go.d.plugin/modules/dnsdist/testdata/config.json b/src/go/plugin/go.d/modules/dnsdist/testdata/config.json index 984c3ed6e..984c3ed6e 100644 --- a/src/go/collectors/go.d.plugin/modules/dnsdist/testdata/config.json +++ b/src/go/plugin/go.d/modules/dnsdist/testdata/config.json diff --git a/src/go/collectors/go.d.plugin/modules/dnsdist/testdata/config.yaml b/src/go/plugin/go.d/modules/dnsdist/testdata/config.yaml index 8558b61cc..8558b61cc 100644 --- a/src/go/collectors/go.d.plugin/modules/dnsdist/testdata/config.yaml +++ b/src/go/plugin/go.d/modules/dnsdist/testdata/config.yaml diff --git a/src/go/collectors/go.d.plugin/modules/dnsdist/testdata/v1.5.1/jsonstat.json b/src/go/plugin/go.d/modules/dnsdist/testdata/v1.5.1/jsonstat.json index 37b791e47..37b791e47 100644 --- a/src/go/collectors/go.d.plugin/modules/dnsdist/testdata/v1.5.1/jsonstat.json +++ b/src/go/plugin/go.d/modules/dnsdist/testdata/v1.5.1/jsonstat.json diff --git a/src/go/collectors/go.d.plugin/modules/dnsmasq/README.md b/src/go/plugin/go.d/modules/dnsmasq/README.md index a424dd9c6..a424dd9c6 120000 --- a/src/go/collectors/go.d.plugin/modules/dnsmasq/README.md +++ b/src/go/plugin/go.d/modules/dnsmasq/README.md diff --git a/src/go/collectors/go.d.plugin/modules/dnsmasq/charts.go b/src/go/plugin/go.d/modules/dnsmasq/charts.go index 70a3e6990..403e7862c 100644 --- a/src/go/collectors/go.d.plugin/modules/dnsmasq/charts.go +++ b/src/go/plugin/go.d/modules/dnsmasq/charts.go @@ -2,7 +2,7 @@ package dnsmasq -import "github.com/netdata/netdata/go/go.d.plugin/agent/module" +import "github.com/netdata/netdata/go/plugins/plugin/go.d/agent/module" var cacheCharts = module.Charts{ { diff --git a/src/go/plugin/go.d/modules/dnsmasq/collect.go b/src/go/plugin/go.d/modules/dnsmasq/collect.go new file mode 100644 index 000000000..9f3f963f0 --- /dev/null +++ b/src/go/plugin/go.d/modules/dnsmasq/collect.go @@ -0,0 +1,139 @@ +// SPDX-License-Identifier: GPL-3.0-or-later + +package dnsmasq + +import ( + "fmt" + "strconv" + "strings" + + "github.com/miekg/dns" +) + +func (d *Dnsmasq) collect() (map[string]int64, error) { + mx := make(map[string]int64) + + if err := d.collectCacheStatistics(mx); err != nil { + return nil, err + } + + return mx, nil +} + +func (d *Dnsmasq) collectCacheStatistics(mx map[string]int64) error { + /* + ;; flags: qr aa rd ra; QUERY: 7, ANSWER: 7, AUTHORITY: 0, ADDITIONAL: 0 + + ;; QUESTION SECTION: + ;cachesize.bind. CH TXT + ;insertions.bind. CH TXT + ;evictions.bind. CH TXT + ;hits.bind. CH TXT + ;misses.bind. CH TXT + ;auth.bind. CH TXT + ;servers.bind. CH TXT + + ;; ANSWER SECTION: + cachesize.bind. 0 CH TXT "150" + insertions.bind. 0 CH TXT "1" + evictions.bind. 0 CH TXT "0" + hits.bind. 0 CH TXT "176" + misses.bind. 0 CH TXT "4" + auth.bind. 0 CH TXT "0" + servers.bind. 0 CH TXT "10.0.0.1#53 0 0" "1.1.1.1#53 4 3" "1.0.0.1#53 3 0" + */ + + questions := []string{ + "servers.bind.", + "cachesize.bind.", + "insertions.bind.", + "evictions.bind.", + "hits.bind.", + "misses.bind.", + // auth.bind query is only supported if dnsmasq has been built to support running as an authoritative name server + // See https://github.com/netdata/netdata/issues/13766 + //"auth.bind.", + } + + for _, q := range questions { + resp, err := d.query(q) + if err != nil { + return err + } + + for _, a := range resp.Answer { + txt, ok := a.(*dns.TXT) + if !ok { + continue + } + + idx := strings.IndexByte(txt.Hdr.Name, '.') + if idx == -1 { + continue + } + + name := txt.Hdr.Name[:idx] + + switch name { + case "servers": + for _, entry := range txt.Txt { + parts := strings.Fields(entry) + if len(parts) != 3 { + return fmt.Errorf("parse %s (%s): unexpected format", txt.Hdr.Name, entry) + } + queries, err := strconv.ParseFloat(parts[1], 64) + if err != nil { + return fmt.Errorf("parse '%s' (%s): %v", txt.Hdr.Name, entry, err) + } + failedQueries, err := strconv.ParseFloat(parts[2], 64) + if err != nil { + return fmt.Errorf("parse '%s' (%s): %v", txt.Hdr.Name, entry, err) + } + + mx["queries"] += int64(queries) + mx["failed_queries"] += int64(failedQueries) + } + case "cachesize", "insertions", "evictions", "hits", "misses", "auth": + if len(txt.Txt) != 1 { + return fmt.Errorf("parse '%s' (%v): unexpected format", txt.Hdr.Name, txt.Txt) + } + v, err := strconv.ParseFloat(txt.Txt[0], 64) + if err != nil { + return fmt.Errorf("parse '%s' (%s): %v", txt.Hdr.Name, txt.Txt[0], err) + } + + mx[name] = int64(v) + } + } + } + + return nil +} + +func (d *Dnsmasq) query(question string) (*dns.Msg, error) { + msg := &dns.Msg{ + MsgHdr: dns.MsgHdr{ + Id: dns.Id(), + RecursionDesired: true, + }, + Question: []dns.Question{ + {Name: question, Qtype: dns.TypeTXT, Qclass: dns.ClassCHAOS}, + }, + } + + r, _, err := d.dnsClient.Exchange(msg, d.Address) + if err != nil { + return nil, err + } + + if r == nil { + return nil, fmt.Errorf("'%s' question '%s', returned an empty response", d.Address, question) + } + + if r.Rcode != dns.RcodeSuccess { + s := dns.RcodeToString[r.Rcode] + return nil, fmt.Errorf("'%s' question '%s' returned '%s' (%d) response code", d.Address, question, s, r.Rcode) + } + + return r, nil +} diff --git a/src/go/collectors/go.d.plugin/modules/dnsmasq/config_schema.json b/src/go/plugin/go.d/modules/dnsmasq/config_schema.json index 79396b364..79396b364 100644 --- a/src/go/collectors/go.d.plugin/modules/dnsmasq/config_schema.json +++ b/src/go/plugin/go.d/modules/dnsmasq/config_schema.json diff --git a/src/go/collectors/go.d.plugin/modules/dnsmasq/dnsmasq.go b/src/go/plugin/go.d/modules/dnsmasq/dnsmasq.go index 095047e8f..2d2112c05 100644 --- a/src/go/collectors/go.d.plugin/modules/dnsmasq/dnsmasq.go +++ b/src/go/plugin/go.d/modules/dnsmasq/dnsmasq.go @@ -7,8 +7,8 @@ import ( "errors" "time" - "github.com/netdata/netdata/go/go.d.plugin/agent/module" - "github.com/netdata/netdata/go/go.d.plugin/pkg/web" + "github.com/netdata/netdata/go/plugins/plugin/go.d/agent/module" + "github.com/netdata/netdata/go/plugins/plugin/go.d/pkg/web" "github.com/miekg/dns" ) diff --git a/src/go/collectors/go.d.plugin/modules/dnsmasq/dnsmasq_test.go b/src/go/plugin/go.d/modules/dnsmasq/dnsmasq_test.go index 7b6185cda..b3d54ac9c 100644 --- a/src/go/collectors/go.d.plugin/modules/dnsmasq/dnsmasq_test.go +++ b/src/go/plugin/go.d/modules/dnsmasq/dnsmasq_test.go @@ -9,7 +9,7 @@ import ( "testing" "time" - "github.com/netdata/netdata/go/go.d.plugin/agent/module" + "github.com/netdata/netdata/go/plugins/plugin/go.d/agent/module" "github.com/miekg/dns" "github.com/stretchr/testify/assert" diff --git a/src/go/collectors/go.d.plugin/modules/dnsmasq/init.go b/src/go/plugin/go.d/modules/dnsmasq/init.go index be21758ad..a660ac774 100644 --- a/src/go/collectors/go.d.plugin/modules/dnsmasq/init.go +++ b/src/go/plugin/go.d/modules/dnsmasq/init.go @@ -6,7 +6,7 @@ import ( "errors" "fmt" - "github.com/netdata/netdata/go/go.d.plugin/agent/module" + "github.com/netdata/netdata/go/plugins/plugin/go.d/agent/module" ) func (d *Dnsmasq) validateConfig() error { diff --git a/src/go/collectors/go.d.plugin/modules/dnsmasq/integrations/dnsmasq.md b/src/go/plugin/go.d/modules/dnsmasq/integrations/dnsmasq.md index f75912e79..d5c358a29 100644 --- a/src/go/collectors/go.d.plugin/modules/dnsmasq/integrations/dnsmasq.md +++ b/src/go/plugin/go.d/modules/dnsmasq/integrations/dnsmasq.md @@ -1,6 +1,6 @@ <!--startmeta -custom_edit_url: "https://github.com/netdata/netdata/edit/master/src/go/collectors/go.d.plugin/modules/dnsmasq/README.md" -meta_yaml: "https://github.com/netdata/netdata/edit/master/src/go/collectors/go.d.plugin/modules/dnsmasq/metadata.yaml" +custom_edit_url: "https://github.com/netdata/netdata/edit/master/src/go/plugin/go.d/modules/dnsmasq/README.md" +meta_yaml: "https://github.com/netdata/netdata/edit/master/src/go/plugin/go.d/modules/dnsmasq/metadata.yaml" sidebar_label: "Dnsmasq" learn_status: "Published" learn_rel_path: "Collecting Metrics/DNS and DHCP Servers" @@ -170,6 +170,8 @@ jobs: ### Debug Mode +**Important**: Debug mode is not supported for data collection jobs created via the UI using the Dyncfg feature. + To troubleshoot issues with the `dnsmasq` collector, run the `go.d.plugin` with the debug option enabled. The output should give you clues as to why the collector isn't working. @@ -192,4 +194,37 @@ should give you clues as to why the collector isn't working. ./go.d.plugin -d -m dnsmasq ``` +### Getting Logs + +If you're encountering problems with the `dnsmasq` collector, follow these steps to retrieve logs and identify potential issues: + +- **Run the command** specific to your system (systemd, non-systemd, or Docker container). +- **Examine the output** for any warnings or error messages that might indicate issues. These messages should provide clues about the root cause of the problem. + +#### System with systemd + +Use the following command to view logs generated since the last Netdata service restart: + +```bash +journalctl _SYSTEMD_INVOCATION_ID="$(systemctl show --value --property=InvocationID netdata)" --namespace=netdata --grep dnsmasq +``` + +#### System without systemd + +Locate the collector log file, typically at `/var/log/netdata/collector.log`, and use `grep` to filter for collector's name: + +```bash +grep dnsmasq /var/log/netdata/collector.log +``` + +**Note**: This method shows logs from all restarts. Focus on the **latest entries** for troubleshooting current issues. + +#### Docker Container + +If your Netdata runs in a Docker container named "netdata" (replace if different), use this command: + +```bash +docker logs netdata 2>&1 | grep dnsmasq +``` + diff --git a/src/go/collectors/go.d.plugin/modules/dnsmasq/metadata.yaml b/src/go/plugin/go.d/modules/dnsmasq/metadata.yaml index 6911a323a..6911a323a 100644 --- a/src/go/collectors/go.d.plugin/modules/dnsmasq/metadata.yaml +++ b/src/go/plugin/go.d/modules/dnsmasq/metadata.yaml diff --git a/src/go/collectors/go.d.plugin/modules/dnsmasq/testdata/config.json b/src/go/plugin/go.d/modules/dnsmasq/testdata/config.json index 4fff563b8..4fff563b8 100644 --- a/src/go/collectors/go.d.plugin/modules/dnsmasq/testdata/config.json +++ b/src/go/plugin/go.d/modules/dnsmasq/testdata/config.json diff --git a/src/go/collectors/go.d.plugin/modules/dnsmasq/testdata/config.yaml b/src/go/plugin/go.d/modules/dnsmasq/testdata/config.yaml index 1a79b8773..1a79b8773 100644 --- a/src/go/collectors/go.d.plugin/modules/dnsmasq/testdata/config.yaml +++ b/src/go/plugin/go.d/modules/dnsmasq/testdata/config.yaml diff --git a/src/go/collectors/go.d.plugin/modules/dnsmasq_dhcp/README.md b/src/go/plugin/go.d/modules/dnsmasq_dhcp/README.md index ad22eb4ee..ad22eb4ee 120000 --- a/src/go/collectors/go.d.plugin/modules/dnsmasq_dhcp/README.md +++ b/src/go/plugin/go.d/modules/dnsmasq_dhcp/README.md diff --git a/src/go/collectors/go.d.plugin/modules/dnsmasq_dhcp/charts.go b/src/go/plugin/go.d/modules/dnsmasq_dhcp/charts.go index 39ac0024f..bcef8aa3f 100644 --- a/src/go/collectors/go.d.plugin/modules/dnsmasq_dhcp/charts.go +++ b/src/go/plugin/go.d/modules/dnsmasq_dhcp/charts.go @@ -6,7 +6,7 @@ import ( "fmt" "strings" - "github.com/netdata/netdata/go/go.d.plugin/agent/module" + "github.com/netdata/netdata/go/plugins/plugin/go.d/agent/module" ) const ( diff --git a/src/go/collectors/go.d.plugin/modules/dnsmasq_dhcp/collect.go b/src/go/plugin/go.d/modules/dnsmasq_dhcp/collect.go index 4d3e3ac5e..6de2fa215 100644 --- a/src/go/collectors/go.d.plugin/modules/dnsmasq_dhcp/collect.go +++ b/src/go/plugin/go.d/modules/dnsmasq_dhcp/collect.go @@ -12,7 +12,7 @@ import ( "strings" "time" - "github.com/netdata/netdata/go/go.d.plugin/pkg/iprange" + "github.com/netdata/netdata/go/plugins/plugin/go.d/pkg/iprange" ) func (d *DnsmasqDHCP) collect() (map[string]int64, error) { diff --git a/src/go/collectors/go.d.plugin/modules/dnsmasq_dhcp/config_schema.json b/src/go/plugin/go.d/modules/dnsmasq_dhcp/config_schema.json index f51a3b2a2..f51a3b2a2 100644 --- a/src/go/collectors/go.d.plugin/modules/dnsmasq_dhcp/config_schema.json +++ b/src/go/plugin/go.d/modules/dnsmasq_dhcp/config_schema.json diff --git a/src/go/collectors/go.d.plugin/modules/dnsmasq_dhcp/dhcp.go b/src/go/plugin/go.d/modules/dnsmasq_dhcp/dhcp.go index 45ddacf46..de56723f7 100644 --- a/src/go/collectors/go.d.plugin/modules/dnsmasq_dhcp/dhcp.go +++ b/src/go/plugin/go.d/modules/dnsmasq_dhcp/dhcp.go @@ -8,8 +8,8 @@ import ( "net" "time" - "github.com/netdata/netdata/go/go.d.plugin/agent/module" - "github.com/netdata/netdata/go/go.d.plugin/pkg/iprange" + "github.com/netdata/netdata/go/plugins/plugin/go.d/agent/module" + "github.com/netdata/netdata/go/plugins/plugin/go.d/pkg/iprange" ) //go:embed "config_schema.json" diff --git a/src/go/collectors/go.d.plugin/modules/dnsmasq_dhcp/dhcp_test.go b/src/go/plugin/go.d/modules/dnsmasq_dhcp/dhcp_test.go index b83b6a3f5..16e0f17d0 100644 --- a/src/go/collectors/go.d.plugin/modules/dnsmasq_dhcp/dhcp_test.go +++ b/src/go/plugin/go.d/modules/dnsmasq_dhcp/dhcp_test.go @@ -6,7 +6,7 @@ import ( "os" "testing" - "github.com/netdata/netdata/go/go.d.plugin/agent/module" + "github.com/netdata/netdata/go/plugins/plugin/go.d/agent/module" "github.com/stretchr/testify/assert" "github.com/stretchr/testify/require" @@ -147,3 +147,63 @@ func TestDnsmasqDHCP_CollectFailedToOpenLeasesPath(t *testing.T) { job.LeasesPath = "" assert.Nil(t, job.Collect()) } + +func TestDnsmasqDHCP_parseDHCPRangeValue(t *testing.T) { + tests := map[string]struct { + input string + wantFail bool + }{ + "ipv4": { + input: "192.168.0.50,192.168.0.150,12h", + }, + "ipv4 with netmask": { + input: "192.168.0.50,192.168.0.150,255.255.255.0,12h", + }, + "ipv4 with netmask and tag": { + input: "set:red,1.1.1.50,1.1.2.150, 255.255.252.0", + }, + "ipv4 with iface": { + input: "enp3s0, 172.16.1.2, 172.16.1.254, 1h", + }, + "ipv4 with iface 2": { + input: "enp2s0.100, 192.168.100.2, 192.168.100.254, 1h", + }, + "ipv4 static": { + wantFail: true, + input: "192.168.0.0,static", + }, + "ipv6": { + input: "1234::2,1234::500", + }, + "ipv6 slacc": { + input: "1234::2,1234::500, slaac", + }, + "ipv6 with with prefix length and lease time": { + input: "1234::2,1234::500, 64, 12h", + }, + "ipv6 ra-only": { + wantFail: true, + input: "1234::,ra-only", + }, + "ipv6 ra-names": { + wantFail: true, + input: "1234::,ra-names", + }, + "ipv6 ra-stateless": { + wantFail: true, + input: "1234::,ra-stateless", + }, + } + + for name, test := range tests { + t.Run(name, func(t *testing.T) { + v := parseDHCPRangeValue(test.input) + + if test.wantFail { + assert.Emptyf(t, v, "parsing '%s' must fail", test.input) + } else { + assert.NotEmptyf(t, v, "parsing '%s' must not fail", test.input) + } + }) + } +} diff --git a/src/go/collectors/go.d.plugin/modules/dnsmasq_dhcp/init.go b/src/go/plugin/go.d/modules/dnsmasq_dhcp/init.go index 6c74674a3..6c74674a3 100644 --- a/src/go/collectors/go.d.plugin/modules/dnsmasq_dhcp/init.go +++ b/src/go/plugin/go.d/modules/dnsmasq_dhcp/init.go diff --git a/src/go/collectors/go.d.plugin/modules/dnsmasq_dhcp/integrations/dnsmasq_dhcp.md b/src/go/plugin/go.d/modules/dnsmasq_dhcp/integrations/dnsmasq_dhcp.md index 23eb07388..751ebf089 100644 --- a/src/go/collectors/go.d.plugin/modules/dnsmasq_dhcp/integrations/dnsmasq_dhcp.md +++ b/src/go/plugin/go.d/modules/dnsmasq_dhcp/integrations/dnsmasq_dhcp.md @@ -1,6 +1,6 @@ <!--startmeta -custom_edit_url: "https://github.com/netdata/netdata/edit/master/src/go/collectors/go.d.plugin/modules/dnsmasq_dhcp/README.md" -meta_yaml: "https://github.com/netdata/netdata/edit/master/src/go/collectors/go.d.plugin/modules/dnsmasq_dhcp/metadata.yaml" +custom_edit_url: "https://github.com/netdata/netdata/edit/master/src/go/plugin/go.d/modules/dnsmasq_dhcp/README.md" +meta_yaml: "https://github.com/netdata/netdata/edit/master/src/go/plugin/go.d/modules/dnsmasq_dhcp/metadata.yaml" sidebar_label: "Dnsmasq DHCP" learn_status: "Published" learn_rel_path: "Collecting Metrics/DNS and DHCP Servers" @@ -180,6 +180,8 @@ jobs: ### Debug Mode +**Important**: Debug mode is not supported for data collection jobs created via the UI using the Dyncfg feature. + To troubleshoot issues with the `dnsmasq_dhcp` collector, run the `go.d.plugin` with the debug option enabled. The output should give you clues as to why the collector isn't working. @@ -202,4 +204,37 @@ should give you clues as to why the collector isn't working. ./go.d.plugin -d -m dnsmasq_dhcp ``` +### Getting Logs + +If you're encountering problems with the `dnsmasq_dhcp` collector, follow these steps to retrieve logs and identify potential issues: + +- **Run the command** specific to your system (systemd, non-systemd, or Docker container). +- **Examine the output** for any warnings or error messages that might indicate issues. These messages should provide clues about the root cause of the problem. + +#### System with systemd + +Use the following command to view logs generated since the last Netdata service restart: + +```bash +journalctl _SYSTEMD_INVOCATION_ID="$(systemctl show --value --property=InvocationID netdata)" --namespace=netdata --grep dnsmasq_dhcp +``` + +#### System without systemd + +Locate the collector log file, typically at `/var/log/netdata/collector.log`, and use `grep` to filter for collector's name: + +```bash +grep dnsmasq_dhcp /var/log/netdata/collector.log +``` + +**Note**: This method shows logs from all restarts. Focus on the **latest entries** for troubleshooting current issues. + +#### Docker Container + +If your Netdata runs in a Docker container named "netdata" (replace if different), use this command: + +```bash +docker logs netdata 2>&1 | grep dnsmasq_dhcp +``` + diff --git a/src/go/collectors/go.d.plugin/modules/dnsmasq_dhcp/metadata.yaml b/src/go/plugin/go.d/modules/dnsmasq_dhcp/metadata.yaml index 13b73336c..13b73336c 100644 --- a/src/go/collectors/go.d.plugin/modules/dnsmasq_dhcp/metadata.yaml +++ b/src/go/plugin/go.d/modules/dnsmasq_dhcp/metadata.yaml diff --git a/src/go/collectors/go.d.plugin/modules/dnsmasq_dhcp/parse_configuration.go b/src/go/plugin/go.d/modules/dnsmasq_dhcp/parse_configuration.go index 24a20bb59..558ce7c65 100644 --- a/src/go/collectors/go.d.plugin/modules/dnsmasq_dhcp/parse_configuration.go +++ b/src/go/plugin/go.d/modules/dnsmasq_dhcp/parse_configuration.go @@ -12,7 +12,7 @@ import ( "sort" "strings" - "github.com/netdata/netdata/go/go.d.plugin/pkg/iprange" + "github.com/netdata/netdata/go/plugins/plugin/go.d/pkg/iprange" ) func (d *DnsmasqDHCP) parseDnsmasqDHCPConfiguration() ([]iprange.Range, []net.IP) { @@ -97,24 +97,31 @@ Examples: - 1234::,ra-names - 1234::,ra-stateless */ -var reDHCPRange = regexp.MustCompile(`([0-9a-f.:]+),([0-9a-f.:]+)`) func parseDHCPRangeValue(s string) (r string) { if strings.Contains(s, "ra-stateless") { - return + return "" } - match := reDHCPRange.FindStringSubmatch(s) - if match == nil { - return - } + s = strings.ReplaceAll(s, " ", "") + + var start, end net.IP + parts := strings.Split(s, ",") - start, end := net.ParseIP(match[1]), net.ParseIP(match[2]) - if start == nil || end == nil { - return + for i, v := range parts { + if start = net.ParseIP(strings.TrimSpace(v)); start == nil { + continue + } + if len(parts) < i+1 { + return "" + } + if end = net.ParseIP(parts[i+1]); end == nil || iprange.New(start, end) == nil { + return "" + } + return fmt.Sprintf("%s-%s", start, end) } - return fmt.Sprintf("%s-%s", start, end) + return "" } /* @@ -134,6 +141,8 @@ var ( ) func parseDHCPHostValue(s string) (r string) { + s = strings.ReplaceAll(s, " ", "") + if strings.Contains(s, "[") { return strings.Trim(reDHCPHostV6.FindString(s), "[]") } diff --git a/src/go/collectors/go.d.plugin/modules/dnsmasq_dhcp/testdata/config.json b/src/go/plugin/go.d/modules/dnsmasq_dhcp/testdata/config.json index 6df6faec6..6df6faec6 100644 --- a/src/go/collectors/go.d.plugin/modules/dnsmasq_dhcp/testdata/config.json +++ b/src/go/plugin/go.d/modules/dnsmasq_dhcp/testdata/config.json diff --git a/src/go/collectors/go.d.plugin/modules/dnsmasq_dhcp/testdata/config.yaml b/src/go/plugin/go.d/modules/dnsmasq_dhcp/testdata/config.yaml index 4a03e6db8..4a03e6db8 100644 --- a/src/go/collectors/go.d.plugin/modules/dnsmasq_dhcp/testdata/config.yaml +++ b/src/go/plugin/go.d/modules/dnsmasq_dhcp/testdata/config.yaml diff --git a/src/go/collectors/go.d.plugin/modules/dnsmasq_dhcp/testdata/dnsmasq.conf b/src/go/plugin/go.d/modules/dnsmasq_dhcp/testdata/dnsmasq.conf index 4cf77478e..4cf77478e 100644 --- a/src/go/collectors/go.d.plugin/modules/dnsmasq_dhcp/testdata/dnsmasq.conf +++ b/src/go/plugin/go.d/modules/dnsmasq_dhcp/testdata/dnsmasq.conf diff --git a/src/go/collectors/go.d.plugin/modules/dnsmasq_dhcp/testdata/dnsmasq.d/.dnsmasq.conf b/src/go/plugin/go.d/modules/dnsmasq_dhcp/testdata/dnsmasq.d/.dnsmasq.conf index b9ca78218..b9ca78218 100644 --- a/src/go/collectors/go.d.plugin/modules/dnsmasq_dhcp/testdata/dnsmasq.d/.dnsmasq.conf +++ b/src/go/plugin/go.d/modules/dnsmasq_dhcp/testdata/dnsmasq.d/.dnsmasq.conf diff --git a/src/go/collectors/go.d.plugin/modules/dnsmasq_dhcp/testdata/dnsmasq.d/dnsmasqv4.any b/src/go/plugin/go.d/modules/dnsmasq_dhcp/testdata/dnsmasq.d/dnsmasqv4.any index 300faa28e..300faa28e 100644 --- a/src/go/collectors/go.d.plugin/modules/dnsmasq_dhcp/testdata/dnsmasq.d/dnsmasqv4.any +++ b/src/go/plugin/go.d/modules/dnsmasq_dhcp/testdata/dnsmasq.d/dnsmasqv4.any diff --git a/src/go/collectors/go.d.plugin/modules/dnsmasq_dhcp/testdata/dnsmasq.d/dnsmasqv6.any b/src/go/plugin/go.d/modules/dnsmasq_dhcp/testdata/dnsmasq.d/dnsmasqv6.any index 414d6819f..414d6819f 100644 --- a/src/go/collectors/go.d.plugin/modules/dnsmasq_dhcp/testdata/dnsmasq.d/dnsmasqv6.any +++ b/src/go/plugin/go.d/modules/dnsmasq_dhcp/testdata/dnsmasq.d/dnsmasqv6.any diff --git a/src/go/collectors/go.d.plugin/modules/dnsmasq_dhcp/testdata/dnsmasq.d2/dnsmasqv4.any b/src/go/plugin/go.d/modules/dnsmasq_dhcp/testdata/dnsmasq.d2/dnsmasqv4.any index 24a742797..24a742797 100644 --- a/src/go/collectors/go.d.plugin/modules/dnsmasq_dhcp/testdata/dnsmasq.d2/dnsmasqv4.any +++ b/src/go/plugin/go.d/modules/dnsmasq_dhcp/testdata/dnsmasq.d2/dnsmasqv4.any diff --git a/src/go/collectors/go.d.plugin/modules/dnsmasq_dhcp/testdata/dnsmasq.d2/dnsmasqv6.any b/src/go/plugin/go.d/modules/dnsmasq_dhcp/testdata/dnsmasq.d2/dnsmasqv6.any index 4ae70f0b2..4ae70f0b2 100644 --- a/src/go/collectors/go.d.plugin/modules/dnsmasq_dhcp/testdata/dnsmasq.d2/dnsmasqv6.any +++ b/src/go/plugin/go.d/modules/dnsmasq_dhcp/testdata/dnsmasq.d2/dnsmasqv6.any diff --git a/src/go/collectors/go.d.plugin/modules/dnsmasq_dhcp/testdata/dnsmasq.d2/~dnsmasq.conf b/src/go/plugin/go.d/modules/dnsmasq_dhcp/testdata/dnsmasq.d2/~dnsmasq.conf index dc58bf9d8..dc58bf9d8 100644 --- a/src/go/collectors/go.d.plugin/modules/dnsmasq_dhcp/testdata/dnsmasq.d2/~dnsmasq.conf +++ b/src/go/plugin/go.d/modules/dnsmasq_dhcp/testdata/dnsmasq.d2/~dnsmasq.conf diff --git a/src/go/collectors/go.d.plugin/modules/dnsmasq_dhcp/testdata/dnsmasq.d3/dnsmasq.bak b/src/go/plugin/go.d/modules/dnsmasq_dhcp/testdata/dnsmasq.d3/dnsmasq.bak index c3897671a..c3897671a 100644 --- a/src/go/collectors/go.d.plugin/modules/dnsmasq_dhcp/testdata/dnsmasq.d3/dnsmasq.bak +++ b/src/go/plugin/go.d/modules/dnsmasq_dhcp/testdata/dnsmasq.d3/dnsmasq.bak diff --git a/src/go/collectors/go.d.plugin/modules/dnsmasq_dhcp/testdata/dnsmasq.d3/dnsmasqv4.any b/src/go/plugin/go.d/modules/dnsmasq_dhcp/testdata/dnsmasq.d3/dnsmasqv4.any index a55ac969a..a55ac969a 100644 --- a/src/go/collectors/go.d.plugin/modules/dnsmasq_dhcp/testdata/dnsmasq.d3/dnsmasqv4.any +++ b/src/go/plugin/go.d/modules/dnsmasq_dhcp/testdata/dnsmasq.d3/dnsmasqv4.any diff --git a/src/go/collectors/go.d.plugin/modules/dnsmasq_dhcp/testdata/dnsmasq.d3/dnsmasqv6.any b/src/go/plugin/go.d/modules/dnsmasq_dhcp/testdata/dnsmasq.d3/dnsmasqv6.any index 4bc6cf10f..4bc6cf10f 100644 --- a/src/go/collectors/go.d.plugin/modules/dnsmasq_dhcp/testdata/dnsmasq.d3/dnsmasqv6.any +++ b/src/go/plugin/go.d/modules/dnsmasq_dhcp/testdata/dnsmasq.d3/dnsmasqv6.any diff --git a/src/go/collectors/go.d.plugin/modules/dnsmasq_dhcp/testdata/dnsmasq.d4/dnsmasq.other b/src/go/plugin/go.d/modules/dnsmasq_dhcp/testdata/dnsmasq.d4/dnsmasq.other index 18fe1ac53..18fe1ac53 100644 --- a/src/go/collectors/go.d.plugin/modules/dnsmasq_dhcp/testdata/dnsmasq.d4/dnsmasq.other +++ b/src/go/plugin/go.d/modules/dnsmasq_dhcp/testdata/dnsmasq.d4/dnsmasq.other diff --git a/src/go/collectors/go.d.plugin/modules/dnsmasq_dhcp/testdata/dnsmasq.d4/dnsmasqv4.conf b/src/go/plugin/go.d/modules/dnsmasq_dhcp/testdata/dnsmasq.d4/dnsmasqv4.conf index 1493b8009..1493b8009 100644 --- a/src/go/collectors/go.d.plugin/modules/dnsmasq_dhcp/testdata/dnsmasq.d4/dnsmasqv4.conf +++ b/src/go/plugin/go.d/modules/dnsmasq_dhcp/testdata/dnsmasq.d4/dnsmasqv4.conf diff --git a/src/go/collectors/go.d.plugin/modules/dnsmasq_dhcp/testdata/dnsmasq.d4/dnsmasqv6.conf b/src/go/plugin/go.d/modules/dnsmasq_dhcp/testdata/dnsmasq.d4/dnsmasqv6.conf index 389c2c95b..389c2c95b 100644 --- a/src/go/collectors/go.d.plugin/modules/dnsmasq_dhcp/testdata/dnsmasq.d4/dnsmasqv6.conf +++ b/src/go/plugin/go.d/modules/dnsmasq_dhcp/testdata/dnsmasq.d4/dnsmasqv6.conf diff --git a/src/go/collectors/go.d.plugin/modules/dnsmasq_dhcp/testdata/dnsmasq.leases b/src/go/plugin/go.d/modules/dnsmasq_dhcp/testdata/dnsmasq.leases index 606e74fba..606e74fba 100644 --- a/src/go/collectors/go.d.plugin/modules/dnsmasq_dhcp/testdata/dnsmasq.leases +++ b/src/go/plugin/go.d/modules/dnsmasq_dhcp/testdata/dnsmasq.leases diff --git a/src/go/collectors/go.d.plugin/modules/dnsmasq_dhcp/testdata/dnsmasq2.conf b/src/go/plugin/go.d/modules/dnsmasq_dhcp/testdata/dnsmasq2.conf index bd1766adb..bd1766adb 100644 --- a/src/go/collectors/go.d.plugin/modules/dnsmasq_dhcp/testdata/dnsmasq2.conf +++ b/src/go/plugin/go.d/modules/dnsmasq_dhcp/testdata/dnsmasq2.conf diff --git a/src/go/collectors/go.d.plugin/modules/dnsmasq_dhcp/testdata/dnsmasq3.conf b/src/go/plugin/go.d/modules/dnsmasq_dhcp/testdata/dnsmasq3.conf index 3475544b5..3475544b5 100644 --- a/src/go/collectors/go.d.plugin/modules/dnsmasq_dhcp/testdata/dnsmasq3.conf +++ b/src/go/plugin/go.d/modules/dnsmasq_dhcp/testdata/dnsmasq3.conf diff --git a/src/go/collectors/go.d.plugin/modules/dnsquery/README.md b/src/go/plugin/go.d/modules/dnsquery/README.md index c5baa8254..c5baa8254 120000 --- a/src/go/collectors/go.d.plugin/modules/dnsquery/README.md +++ b/src/go/plugin/go.d/modules/dnsquery/README.md diff --git a/src/go/collectors/go.d.plugin/modules/dnsquery/charts.go b/src/go/plugin/go.d/modules/dnsquery/charts.go index b229d89eb..66c2ea6c9 100644 --- a/src/go/collectors/go.d.plugin/modules/dnsquery/charts.go +++ b/src/go/plugin/go.d/modules/dnsquery/charts.go @@ -6,7 +6,7 @@ import ( "fmt" "strings" - "github.com/netdata/netdata/go/go.d.plugin/agent/module" + "github.com/netdata/netdata/go/plugins/plugin/go.d/agent/module" ) const ( diff --git a/src/go/collectors/go.d.plugin/modules/dnsquery/collect.go b/src/go/plugin/go.d/modules/dnsquery/collect.go index a98e37cad..a98e37cad 100644 --- a/src/go/collectors/go.d.plugin/modules/dnsquery/collect.go +++ b/src/go/plugin/go.d/modules/dnsquery/collect.go diff --git a/src/go/collectors/go.d.plugin/modules/dnsquery/config_schema.json b/src/go/plugin/go.d/modules/dnsquery/config_schema.json index cfa6f3a14..cfa6f3a14 100644 --- a/src/go/collectors/go.d.plugin/modules/dnsquery/config_schema.json +++ b/src/go/plugin/go.d/modules/dnsquery/config_schema.json diff --git a/src/go/collectors/go.d.plugin/modules/dnsquery/dnsquery.go b/src/go/plugin/go.d/modules/dnsquery/dnsquery.go index 5a0df7adc..408b08ee8 100644 --- a/src/go/collectors/go.d.plugin/modules/dnsquery/dnsquery.go +++ b/src/go/plugin/go.d/modules/dnsquery/dnsquery.go @@ -6,8 +6,8 @@ import ( _ "embed" "time" - "github.com/netdata/netdata/go/go.d.plugin/agent/module" - "github.com/netdata/netdata/go/go.d.plugin/pkg/web" + "github.com/netdata/netdata/go/plugins/plugin/go.d/agent/module" + "github.com/netdata/netdata/go/plugins/plugin/go.d/pkg/web" "github.com/miekg/dns" ) diff --git a/src/go/collectors/go.d.plugin/modules/dnsquery/dnsquery_test.go b/src/go/plugin/go.d/modules/dnsquery/dnsquery_test.go index 9842e54fd..a9f55d6e4 100644 --- a/src/go/collectors/go.d.plugin/modules/dnsquery/dnsquery_test.go +++ b/src/go/plugin/go.d/modules/dnsquery/dnsquery_test.go @@ -8,8 +8,8 @@ import ( "testing" "time" - "github.com/netdata/netdata/go/go.d.plugin/agent/module" - "github.com/netdata/netdata/go/go.d.plugin/pkg/web" + "github.com/netdata/netdata/go/plugins/plugin/go.d/agent/module" + "github.com/netdata/netdata/go/plugins/plugin/go.d/pkg/web" "github.com/miekg/dns" "github.com/stretchr/testify/assert" diff --git a/src/go/collectors/go.d.plugin/modules/dnsquery/init.go b/src/go/plugin/go.d/modules/dnsquery/init.go index 65af0ea2e..5899a27b2 100644 --- a/src/go/collectors/go.d.plugin/modules/dnsquery/init.go +++ b/src/go/plugin/go.d/modules/dnsquery/init.go @@ -5,7 +5,7 @@ package dnsquery import ( "errors" "fmt" - "github.com/netdata/netdata/go/go.d.plugin/agent/module" + "github.com/netdata/netdata/go/plugins/plugin/go.d/agent/module" "github.com/miekg/dns" ) diff --git a/src/go/collectors/go.d.plugin/modules/dnsquery/integrations/dns_query.md b/src/go/plugin/go.d/modules/dnsquery/integrations/dns_query.md index fccac8b59..b081a7bbc 100644 --- a/src/go/collectors/go.d.plugin/modules/dnsquery/integrations/dns_query.md +++ b/src/go/plugin/go.d/modules/dnsquery/integrations/dns_query.md @@ -1,6 +1,6 @@ <!--startmeta -custom_edit_url: "https://github.com/netdata/netdata/edit/master/src/go/collectors/go.d.plugin/modules/dnsquery/README.md" -meta_yaml: "https://github.com/netdata/netdata/edit/master/src/go/collectors/go.d.plugin/modules/dnsquery/metadata.yaml" +custom_edit_url: "https://github.com/netdata/netdata/edit/master/src/go/plugin/go.d/modules/dnsquery/README.md" +meta_yaml: "https://github.com/netdata/netdata/edit/master/src/go/plugin/go.d/modules/dnsquery/metadata.yaml" sidebar_label: "DNS query" learn_status: "Published" learn_rel_path: "Collecting Metrics/DNS and DHCP Servers" @@ -156,6 +156,8 @@ jobs: ### Debug Mode +**Important**: Debug mode is not supported for data collection jobs created via the UI using the Dyncfg feature. + To troubleshoot issues with the `dns_query` collector, run the `go.d.plugin` with the debug option enabled. The output should give you clues as to why the collector isn't working. @@ -178,4 +180,37 @@ should give you clues as to why the collector isn't working. ./go.d.plugin -d -m dns_query ``` +### Getting Logs + +If you're encountering problems with the `dns_query` collector, follow these steps to retrieve logs and identify potential issues: + +- **Run the command** specific to your system (systemd, non-systemd, or Docker container). +- **Examine the output** for any warnings or error messages that might indicate issues. These messages should provide clues about the root cause of the problem. + +#### System with systemd + +Use the following command to view logs generated since the last Netdata service restart: + +```bash +journalctl _SYSTEMD_INVOCATION_ID="$(systemctl show --value --property=InvocationID netdata)" --namespace=netdata --grep dns_query +``` + +#### System without systemd + +Locate the collector log file, typically at `/var/log/netdata/collector.log`, and use `grep` to filter for collector's name: + +```bash +grep dns_query /var/log/netdata/collector.log +``` + +**Note**: This method shows logs from all restarts. Focus on the **latest entries** for troubleshooting current issues. + +#### Docker Container + +If your Netdata runs in a Docker container named "netdata" (replace if different), use this command: + +```bash +docker logs netdata 2>&1 | grep dns_query +``` + diff --git a/src/go/collectors/go.d.plugin/modules/dnsquery/metadata.yaml b/src/go/plugin/go.d/modules/dnsquery/metadata.yaml index 8c199550f..8c199550f 100644 --- a/src/go/collectors/go.d.plugin/modules/dnsquery/metadata.yaml +++ b/src/go/plugin/go.d/modules/dnsquery/metadata.yaml diff --git a/src/go/collectors/go.d.plugin/modules/dnsquery/testdata/config.json b/src/go/plugin/go.d/modules/dnsquery/testdata/config.json index b16ed18c6..b16ed18c6 100644 --- a/src/go/collectors/go.d.plugin/modules/dnsquery/testdata/config.json +++ b/src/go/plugin/go.d/modules/dnsquery/testdata/config.json diff --git a/src/go/collectors/go.d.plugin/modules/dnsquery/testdata/config.yaml b/src/go/plugin/go.d/modules/dnsquery/testdata/config.yaml index 6c6b014b6..6c6b014b6 100644 --- a/src/go/collectors/go.d.plugin/modules/dnsquery/testdata/config.yaml +++ b/src/go/plugin/go.d/modules/dnsquery/testdata/config.yaml diff --git a/src/go/collectors/go.d.plugin/modules/docker/README.md b/src/go/plugin/go.d/modules/docker/README.md index b4804ee06..b4804ee06 120000 --- a/src/go/collectors/go.d.plugin/modules/docker/README.md +++ b/src/go/plugin/go.d/modules/docker/README.md diff --git a/src/go/collectors/go.d.plugin/modules/docker/charts.go b/src/go/plugin/go.d/modules/docker/charts.go index 2dd26c0e3..6660dc1e4 100644 --- a/src/go/collectors/go.d.plugin/modules/docker/charts.go +++ b/src/go/plugin/go.d/modules/docker/charts.go @@ -6,7 +6,7 @@ import ( "fmt" "strings" - "github.com/netdata/netdata/go/go.d.plugin/agent/module" + "github.com/netdata/netdata/go/plugins/plugin/go.d/agent/module" ) const ( diff --git a/src/go/collectors/go.d.plugin/modules/docker/collect.go b/src/go/plugin/go.d/modules/docker/collect.go index f23c58f22..f23c58f22 100644 --- a/src/go/collectors/go.d.plugin/modules/docker/collect.go +++ b/src/go/plugin/go.d/modules/docker/collect.go diff --git a/src/go/collectors/go.d.plugin/modules/docker/config_schema.json b/src/go/plugin/go.d/modules/docker/config_schema.json index bd48c9126..bd48c9126 100644 --- a/src/go/collectors/go.d.plugin/modules/docker/config_schema.json +++ b/src/go/plugin/go.d/modules/docker/config_schema.json diff --git a/src/go/collectors/go.d.plugin/modules/docker/docker.go b/src/go/plugin/go.d/modules/docker/docker.go index 68662fd4c..88890b9fe 100644 --- a/src/go/collectors/go.d.plugin/modules/docker/docker.go +++ b/src/go/plugin/go.d/modules/docker/docker.go @@ -8,9 +8,9 @@ import ( "errors" "time" - "github.com/netdata/netdata/go/go.d.plugin/agent/module" - "github.com/netdata/netdata/go/go.d.plugin/pkg/dockerhost" - "github.com/netdata/netdata/go/go.d.plugin/pkg/web" + "github.com/netdata/netdata/go/plugins/plugin/go.d/agent/module" + "github.com/netdata/netdata/go/plugins/plugin/go.d/pkg/dockerhost" + "github.com/netdata/netdata/go/plugins/plugin/go.d/pkg/web" "github.com/docker/docker/api/types" typesContainer "github.com/docker/docker/api/types/container" diff --git a/src/go/collectors/go.d.plugin/modules/docker/docker_test.go b/src/go/plugin/go.d/modules/docker/docker_test.go index 8125cd3c1..0ab894420 100644 --- a/src/go/collectors/go.d.plugin/modules/docker/docker_test.go +++ b/src/go/plugin/go.d/modules/docker/docker_test.go @@ -8,7 +8,7 @@ import ( "os" "testing" - "github.com/netdata/netdata/go/go.d.plugin/agent/module" + "github.com/netdata/netdata/go/plugins/plugin/go.d/agent/module" "github.com/docker/docker/api/types" typesContainer "github.com/docker/docker/api/types/container" diff --git a/src/go/collectors/go.d.plugin/modules/docker/integrations/docker.md b/src/go/plugin/go.d/modules/docker/integrations/docker.md index 10f00c2d0..cb5452530 100644 --- a/src/go/collectors/go.d.plugin/modules/docker/integrations/docker.md +++ b/src/go/plugin/go.d/modules/docker/integrations/docker.md @@ -1,6 +1,6 @@ <!--startmeta -custom_edit_url: "https://github.com/netdata/netdata/edit/master/src/go/collectors/go.d.plugin/modules/docker/README.md" -meta_yaml: "https://github.com/netdata/netdata/edit/master/src/go/collectors/go.d.plugin/modules/docker/metadata.yaml" +custom_edit_url: "https://github.com/netdata/netdata/edit/master/src/go/plugin/go.d/modules/docker/README.md" +meta_yaml: "https://github.com/netdata/netdata/edit/master/src/go/plugin/go.d/modules/docker/metadata.yaml" sidebar_label: "Docker" learn_status: "Published" learn_rel_path: "Collecting Metrics/Containers and VMs" @@ -183,6 +183,8 @@ jobs: ### Debug Mode +**Important**: Debug mode is not supported for data collection jobs created via the UI using the Dyncfg feature. + To troubleshoot issues with the `docker` collector, run the `go.d.plugin` with the debug option enabled. The output should give you clues as to why the collector isn't working. @@ -205,4 +207,37 @@ should give you clues as to why the collector isn't working. ./go.d.plugin -d -m docker ``` +### Getting Logs + +If you're encountering problems with the `docker` collector, follow these steps to retrieve logs and identify potential issues: + +- **Run the command** specific to your system (systemd, non-systemd, or Docker container). +- **Examine the output** for any warnings or error messages that might indicate issues. These messages should provide clues about the root cause of the problem. + +#### System with systemd + +Use the following command to view logs generated since the last Netdata service restart: + +```bash +journalctl _SYSTEMD_INVOCATION_ID="$(systemctl show --value --property=InvocationID netdata)" --namespace=netdata --grep docker +``` + +#### System without systemd + +Locate the collector log file, typically at `/var/log/netdata/collector.log`, and use `grep` to filter for collector's name: + +```bash +grep docker /var/log/netdata/collector.log +``` + +**Note**: This method shows logs from all restarts. Focus on the **latest entries** for troubleshooting current issues. + +#### Docker Container + +If your Netdata runs in a Docker container named "netdata" (replace if different), use this command: + +```bash +docker logs netdata 2>&1 | grep docker +``` + diff --git a/src/go/collectors/go.d.plugin/modules/docker/metadata.yaml b/src/go/plugin/go.d/modules/docker/metadata.yaml index 8fc6853a9..8fc6853a9 100644 --- a/src/go/collectors/go.d.plugin/modules/docker/metadata.yaml +++ b/src/go/plugin/go.d/modules/docker/metadata.yaml diff --git a/src/go/collectors/go.d.plugin/modules/docker/testdata/config.json b/src/go/plugin/go.d/modules/docker/testdata/config.json index 5e687448c..5e687448c 100644 --- a/src/go/collectors/go.d.plugin/modules/docker/testdata/config.json +++ b/src/go/plugin/go.d/modules/docker/testdata/config.json diff --git a/src/go/collectors/go.d.plugin/modules/docker/testdata/config.yaml b/src/go/plugin/go.d/modules/docker/testdata/config.yaml index 2b0f32225..2b0f32225 100644 --- a/src/go/collectors/go.d.plugin/modules/docker/testdata/config.yaml +++ b/src/go/plugin/go.d/modules/docker/testdata/config.yaml diff --git a/src/go/collectors/go.d.plugin/modules/docker_engine/README.md b/src/go/plugin/go.d/modules/docker_engine/README.md index f00a4cd97..f00a4cd97 120000 --- a/src/go/collectors/go.d.plugin/modules/docker_engine/README.md +++ b/src/go/plugin/go.d/modules/docker_engine/README.md diff --git a/src/go/collectors/go.d.plugin/modules/docker_engine/charts.go b/src/go/plugin/go.d/modules/docker_engine/charts.go index d23f6e780..8a37545ce 100644 --- a/src/go/collectors/go.d.plugin/modules/docker_engine/charts.go +++ b/src/go/plugin/go.d/modules/docker_engine/charts.go @@ -2,7 +2,7 @@ package docker_engine -import "github.com/netdata/netdata/go/go.d.plugin/agent/module" +import "github.com/netdata/netdata/go/plugins/plugin/go.d/agent/module" type ( Charts = module.Charts diff --git a/src/go/collectors/go.d.plugin/modules/docker_engine/collect.go b/src/go/plugin/go.d/modules/docker_engine/collect.go index 171d58b55..90cd49985 100644 --- a/src/go/collectors/go.d.plugin/modules/docker_engine/collect.go +++ b/src/go/plugin/go.d/modules/docker_engine/collect.go @@ -5,8 +5,8 @@ package docker_engine import ( "fmt" - "github.com/netdata/netdata/go/go.d.plugin/pkg/prometheus" - "github.com/netdata/netdata/go/go.d.plugin/pkg/stm" + "github.com/netdata/netdata/go/plugins/plugin/go.d/pkg/prometheus" + "github.com/netdata/netdata/go/plugins/plugin/go.d/pkg/stm" ) func isDockerEngineMetrics(pms prometheus.Series) bool { diff --git a/src/go/collectors/go.d.plugin/modules/docker_engine/config_schema.json b/src/go/plugin/go.d/modules/docker_engine/config_schema.json index a18a8fe86..1e40bb585 100644 --- a/src/go/collectors/go.d.plugin/modules/docker_engine/config_schema.json +++ b/src/go/plugin/go.d/modules/docker_engine/config_schema.json @@ -167,6 +167,12 @@ "timeout": { "ui:help": "Accepts decimals for precise control (e.g., type 1.5 for 1.5 seconds)." }, + "username": { + "ui:widget": "password" + }, + "proxy_username": { + "ui:widget": "password" + }, "password": { "ui:widget": "password" }, diff --git a/src/go/collectors/go.d.plugin/modules/docker_engine/docker_engine.go b/src/go/plugin/go.d/modules/docker_engine/docker_engine.go index ea8551236..4f50ecb43 100644 --- a/src/go/collectors/go.d.plugin/modules/docker_engine/docker_engine.go +++ b/src/go/plugin/go.d/modules/docker_engine/docker_engine.go @@ -7,9 +7,9 @@ import ( "errors" "time" - "github.com/netdata/netdata/go/go.d.plugin/agent/module" - "github.com/netdata/netdata/go/go.d.plugin/pkg/prometheus" - "github.com/netdata/netdata/go/go.d.plugin/pkg/web" + "github.com/netdata/netdata/go/plugins/plugin/go.d/agent/module" + "github.com/netdata/netdata/go/plugins/plugin/go.d/pkg/prometheus" + "github.com/netdata/netdata/go/plugins/plugin/go.d/pkg/web" ) //go:embed "config_schema.json" diff --git a/src/go/collectors/go.d.plugin/modules/docker_engine/docker_engine_test.go b/src/go/plugin/go.d/modules/docker_engine/docker_engine_test.go index 193214274..1734f1829 100644 --- a/src/go/collectors/go.d.plugin/modules/docker_engine/docker_engine_test.go +++ b/src/go/plugin/go.d/modules/docker_engine/docker_engine_test.go @@ -8,9 +8,9 @@ import ( "os" "testing" - "github.com/netdata/netdata/go/go.d.plugin/agent/module" - "github.com/netdata/netdata/go/go.d.plugin/pkg/tlscfg" - "github.com/netdata/netdata/go/go.d.plugin/pkg/web" + "github.com/netdata/netdata/go/plugins/plugin/go.d/agent/module" + "github.com/netdata/netdata/go/plugins/plugin/go.d/pkg/tlscfg" + "github.com/netdata/netdata/go/plugins/plugin/go.d/pkg/web" "github.com/stretchr/testify/assert" "github.com/stretchr/testify/require" diff --git a/src/go/collectors/go.d.plugin/modules/docker_engine/init.go b/src/go/plugin/go.d/modules/docker_engine/init.go index 5e06f545e..5610af9a9 100644 --- a/src/go/collectors/go.d.plugin/modules/docker_engine/init.go +++ b/src/go/plugin/go.d/modules/docker_engine/init.go @@ -4,9 +4,9 @@ package docker_engine import ( "errors" - "github.com/netdata/netdata/go/go.d.plugin/pkg/web" + "github.com/netdata/netdata/go/plugins/plugin/go.d/pkg/web" - "github.com/netdata/netdata/go/go.d.plugin/pkg/prometheus" + "github.com/netdata/netdata/go/plugins/plugin/go.d/pkg/prometheus" ) func (de *DockerEngine) validateConfig() error { diff --git a/src/go/collectors/go.d.plugin/modules/docker_engine/integrations/docker_engine.md b/src/go/plugin/go.d/modules/docker_engine/integrations/docker_engine.md index bf1d91129..eaba917e7 100644 --- a/src/go/collectors/go.d.plugin/modules/docker_engine/integrations/docker_engine.md +++ b/src/go/plugin/go.d/modules/docker_engine/integrations/docker_engine.md @@ -1,6 +1,6 @@ <!--startmeta -custom_edit_url: "https://github.com/netdata/netdata/edit/master/src/go/collectors/go.d.plugin/modules/docker_engine/README.md" -meta_yaml: "https://github.com/netdata/netdata/edit/master/src/go/collectors/go.d.plugin/modules/docker_engine/metadata.yaml" +custom_edit_url: "https://github.com/netdata/netdata/edit/master/src/go/plugin/go.d/modules/docker_engine/README.md" +meta_yaml: "https://github.com/netdata/netdata/edit/master/src/go/plugin/go.d/modules/docker_engine/metadata.yaml" sidebar_label: "Docker Engine" learn_status: "Published" learn_rel_path: "Collecting Metrics/Containers and VMs" @@ -204,6 +204,8 @@ jobs: ### Debug Mode +**Important**: Debug mode is not supported for data collection jobs created via the UI using the Dyncfg feature. + To troubleshoot issues with the `docker_engine` collector, run the `go.d.plugin` with the debug option enabled. The output should give you clues as to why the collector isn't working. @@ -226,4 +228,37 @@ should give you clues as to why the collector isn't working. ./go.d.plugin -d -m docker_engine ``` +### Getting Logs + +If you're encountering problems with the `docker_engine` collector, follow these steps to retrieve logs and identify potential issues: + +- **Run the command** specific to your system (systemd, non-systemd, or Docker container). +- **Examine the output** for any warnings or error messages that might indicate issues. These messages should provide clues about the root cause of the problem. + +#### System with systemd + +Use the following command to view logs generated since the last Netdata service restart: + +```bash +journalctl _SYSTEMD_INVOCATION_ID="$(systemctl show --value --property=InvocationID netdata)" --namespace=netdata --grep docker_engine +``` + +#### System without systemd + +Locate the collector log file, typically at `/var/log/netdata/collector.log`, and use `grep` to filter for collector's name: + +```bash +grep docker_engine /var/log/netdata/collector.log +``` + +**Note**: This method shows logs from all restarts. Focus on the **latest entries** for troubleshooting current issues. + +#### Docker Container + +If your Netdata runs in a Docker container named "netdata" (replace if different), use this command: + +```bash +docker logs netdata 2>&1 | grep docker_engine +``` + diff --git a/src/go/collectors/go.d.plugin/modules/docker_engine/metadata.yaml b/src/go/plugin/go.d/modules/docker_engine/metadata.yaml index 8f81d4e35..8f81d4e35 100644 --- a/src/go/collectors/go.d.plugin/modules/docker_engine/metadata.yaml +++ b/src/go/plugin/go.d/modules/docker_engine/metadata.yaml diff --git a/src/go/collectors/go.d.plugin/modules/docker_engine/metrics.go b/src/go/plugin/go.d/modules/docker_engine/metrics.go index 4c84e8398..4c84e8398 100644 --- a/src/go/collectors/go.d.plugin/modules/docker_engine/metrics.go +++ b/src/go/plugin/go.d/modules/docker_engine/metrics.go diff --git a/src/go/collectors/go.d.plugin/modules/docker_engine/testdata/config.json b/src/go/plugin/go.d/modules/docker_engine/testdata/config.json index 984c3ed6e..984c3ed6e 100644 --- a/src/go/collectors/go.d.plugin/modules/docker_engine/testdata/config.json +++ b/src/go/plugin/go.d/modules/docker_engine/testdata/config.json diff --git a/src/go/collectors/go.d.plugin/modules/docker_engine/testdata/config.yaml b/src/go/plugin/go.d/modules/docker_engine/testdata/config.yaml index 8558b61cc..8558b61cc 100644 --- a/src/go/collectors/go.d.plugin/modules/docker_engine/testdata/config.yaml +++ b/src/go/plugin/go.d/modules/docker_engine/testdata/config.yaml diff --git a/src/go/collectors/go.d.plugin/modules/docker_engine/testdata/non-docker-engine.txt b/src/go/plugin/go.d/modules/docker_engine/testdata/non-docker-engine.txt index e69de29bb..e69de29bb 100644 --- a/src/go/collectors/go.d.plugin/modules/docker_engine/testdata/non-docker-engine.txt +++ b/src/go/plugin/go.d/modules/docker_engine/testdata/non-docker-engine.txt diff --git a/src/go/collectors/go.d.plugin/modules/docker_engine/testdata/v17.05.0-ce.txt b/src/go/plugin/go.d/modules/docker_engine/testdata/v17.05.0-ce.txt index 8d175a8e9..8d175a8e9 100644 --- a/src/go/collectors/go.d.plugin/modules/docker_engine/testdata/v17.05.0-ce.txt +++ b/src/go/plugin/go.d/modules/docker_engine/testdata/v17.05.0-ce.txt diff --git a/src/go/collectors/go.d.plugin/modules/docker_engine/testdata/v18.09.3-ce-swarm.txt b/src/go/plugin/go.d/modules/docker_engine/testdata/v18.09.3-ce-swarm.txt index edd69abee..edd69abee 100644 --- a/src/go/collectors/go.d.plugin/modules/docker_engine/testdata/v18.09.3-ce-swarm.txt +++ b/src/go/plugin/go.d/modules/docker_engine/testdata/v18.09.3-ce-swarm.txt diff --git a/src/go/collectors/go.d.plugin/modules/docker_engine/testdata/v18.09.3-ce.txt b/src/go/plugin/go.d/modules/docker_engine/testdata/v18.09.3-ce.txt index b54589210..b54589210 100644 --- a/src/go/collectors/go.d.plugin/modules/docker_engine/testdata/v18.09.3-ce.txt +++ b/src/go/plugin/go.d/modules/docker_engine/testdata/v18.09.3-ce.txt diff --git a/src/go/collectors/go.d.plugin/modules/dockerhub/README.md b/src/go/plugin/go.d/modules/dockerhub/README.md index 703add4ed..703add4ed 120000 --- a/src/go/collectors/go.d.plugin/modules/dockerhub/README.md +++ b/src/go/plugin/go.d/modules/dockerhub/README.md diff --git a/src/go/collectors/go.d.plugin/modules/dockerhub/apiclient.go b/src/go/plugin/go.d/modules/dockerhub/apiclient.go index fa6e1c805..f0da897f8 100644 --- a/src/go/collectors/go.d.plugin/modules/dockerhub/apiclient.go +++ b/src/go/plugin/go.d/modules/dockerhub/apiclient.go @@ -10,7 +10,7 @@ import ( "net/url" "path" - "github.com/netdata/netdata/go/go.d.plugin/pkg/web" + "github.com/netdata/netdata/go/plugins/plugin/go.d/pkg/web" ) type repository struct { diff --git a/src/go/collectors/go.d.plugin/modules/dockerhub/charts.go b/src/go/plugin/go.d/modules/dockerhub/charts.go index 07ba8e18b..78b51eac4 100644 --- a/src/go/collectors/go.d.plugin/modules/dockerhub/charts.go +++ b/src/go/plugin/go.d/modules/dockerhub/charts.go @@ -5,7 +5,7 @@ package dockerhub import ( "strings" - "github.com/netdata/netdata/go/go.d.plugin/agent/module" + "github.com/netdata/netdata/go/plugins/plugin/go.d/agent/module" ) type ( diff --git a/src/go/collectors/go.d.plugin/modules/dockerhub/collect.go b/src/go/plugin/go.d/modules/dockerhub/collect.go index 211c1ea7c..211c1ea7c 100644 --- a/src/go/collectors/go.d.plugin/modules/dockerhub/collect.go +++ b/src/go/plugin/go.d/modules/dockerhub/collect.go diff --git a/src/go/collectors/go.d.plugin/modules/dockerhub/config_schema.json b/src/go/plugin/go.d/modules/dockerhub/config_schema.json index 47842fd9b..7998516f4 100644 --- a/src/go/collectors/go.d.plugin/modules/dockerhub/config_schema.json +++ b/src/go/plugin/go.d/modules/dockerhub/config_schema.json @@ -187,6 +187,12 @@ "repositories": { "ui:listFlavour": "list" }, + "username": { + "ui:widget": "password" + }, + "proxy_username": { + "ui:widget": "password" + }, "password": { "ui:widget": "password" }, diff --git a/src/go/collectors/go.d.plugin/modules/dockerhub/dockerhub.go b/src/go/plugin/go.d/modules/dockerhub/dockerhub.go index 54fcf7dce..37cf64960 100644 --- a/src/go/collectors/go.d.plugin/modules/dockerhub/dockerhub.go +++ b/src/go/plugin/go.d/modules/dockerhub/dockerhub.go @@ -7,8 +7,8 @@ import ( "errors" "time" - "github.com/netdata/netdata/go/go.d.plugin/agent/module" - "github.com/netdata/netdata/go/go.d.plugin/pkg/web" + "github.com/netdata/netdata/go/plugins/plugin/go.d/agent/module" + "github.com/netdata/netdata/go/plugins/plugin/go.d/pkg/web" ) //go:embed "config_schema.json" diff --git a/src/go/collectors/go.d.plugin/modules/dockerhub/dockerhub_test.go b/src/go/plugin/go.d/modules/dockerhub/dockerhub_test.go index 7036ff7a7..5d8df4cf3 100644 --- a/src/go/collectors/go.d.plugin/modules/dockerhub/dockerhub_test.go +++ b/src/go/plugin/go.d/modules/dockerhub/dockerhub_test.go @@ -9,7 +9,7 @@ import ( "strings" "testing" - "github.com/netdata/netdata/go/go.d.plugin/agent/module" + "github.com/netdata/netdata/go/plugins/plugin/go.d/agent/module" "github.com/stretchr/testify/assert" "github.com/stretchr/testify/require" diff --git a/src/go/collectors/go.d.plugin/modules/dockerhub/init.go b/src/go/plugin/go.d/modules/dockerhub/init.go index 245bee1cb..7e502a5a7 100644 --- a/src/go/collectors/go.d.plugin/modules/dockerhub/init.go +++ b/src/go/plugin/go.d/modules/dockerhub/init.go @@ -4,7 +4,7 @@ package dockerhub import ( "errors" - "github.com/netdata/netdata/go/go.d.plugin/pkg/web" + "github.com/netdata/netdata/go/plugins/plugin/go.d/pkg/web" ) func (dh *DockerHub) validateConfig() error { diff --git a/src/go/collectors/go.d.plugin/modules/dockerhub/integrations/docker_hub_repository.md b/src/go/plugin/go.d/modules/dockerhub/integrations/docker_hub_repository.md index 2d833d3c0..72c171d6a 100644 --- a/src/go/collectors/go.d.plugin/modules/dockerhub/integrations/docker_hub_repository.md +++ b/src/go/plugin/go.d/modules/dockerhub/integrations/docker_hub_repository.md @@ -1,6 +1,6 @@ <!--startmeta -custom_edit_url: "https://github.com/netdata/netdata/edit/master/src/go/collectors/go.d.plugin/modules/dockerhub/README.md" -meta_yaml: "https://github.com/netdata/netdata/edit/master/src/go/collectors/go.d.plugin/modules/dockerhub/metadata.yaml" +custom_edit_url: "https://github.com/netdata/netdata/edit/master/src/go/plugin/go.d/modules/dockerhub/README.md" +meta_yaml: "https://github.com/netdata/netdata/edit/master/src/go/plugin/go.d/modules/dockerhub/metadata.yaml" sidebar_label: "Docker Hub repository" learn_status: "Published" learn_rel_path: "Collecting Metrics/Containers and VMs" @@ -149,6 +149,8 @@ jobs: ### Debug Mode +**Important**: Debug mode is not supported for data collection jobs created via the UI using the Dyncfg feature. + To troubleshoot issues with the `dockerhub` collector, run the `go.d.plugin` with the debug option enabled. The output should give you clues as to why the collector isn't working. @@ -171,4 +173,37 @@ should give you clues as to why the collector isn't working. ./go.d.plugin -d -m dockerhub ``` +### Getting Logs + +If you're encountering problems with the `dockerhub` collector, follow these steps to retrieve logs and identify potential issues: + +- **Run the command** specific to your system (systemd, non-systemd, or Docker container). +- **Examine the output** for any warnings or error messages that might indicate issues. These messages should provide clues about the root cause of the problem. + +#### System with systemd + +Use the following command to view logs generated since the last Netdata service restart: + +```bash +journalctl _SYSTEMD_INVOCATION_ID="$(systemctl show --value --property=InvocationID netdata)" --namespace=netdata --grep dockerhub +``` + +#### System without systemd + +Locate the collector log file, typically at `/var/log/netdata/collector.log`, and use `grep` to filter for collector's name: + +```bash +grep dockerhub /var/log/netdata/collector.log +``` + +**Note**: This method shows logs from all restarts. Focus on the **latest entries** for troubleshooting current issues. + +#### Docker Container + +If your Netdata runs in a Docker container named "netdata" (replace if different), use this command: + +```bash +docker logs netdata 2>&1 | grep dockerhub +``` + diff --git a/src/go/collectors/go.d.plugin/modules/dockerhub/metadata.yaml b/src/go/plugin/go.d/modules/dockerhub/metadata.yaml index 605d6c1cb..605d6c1cb 100644 --- a/src/go/collectors/go.d.plugin/modules/dockerhub/metadata.yaml +++ b/src/go/plugin/go.d/modules/dockerhub/metadata.yaml diff --git a/src/go/collectors/go.d.plugin/modules/dockerhub/testdata/config.json b/src/go/plugin/go.d/modules/dockerhub/testdata/config.json index 3496e747c..3496e747c 100644 --- a/src/go/collectors/go.d.plugin/modules/dockerhub/testdata/config.json +++ b/src/go/plugin/go.d/modules/dockerhub/testdata/config.json diff --git a/src/go/collectors/go.d.plugin/modules/dockerhub/testdata/config.yaml b/src/go/plugin/go.d/modules/dockerhub/testdata/config.yaml index 20c4ba61b..20c4ba61b 100644 --- a/src/go/collectors/go.d.plugin/modules/dockerhub/testdata/config.yaml +++ b/src/go/plugin/go.d/modules/dockerhub/testdata/config.yaml diff --git a/src/go/collectors/go.d.plugin/modules/dockerhub/testdata/repo1.txt b/src/go/plugin/go.d/modules/dockerhub/testdata/repo1.txt index b67e2f382..b67e2f382 100644 --- a/src/go/collectors/go.d.plugin/modules/dockerhub/testdata/repo1.txt +++ b/src/go/plugin/go.d/modules/dockerhub/testdata/repo1.txt diff --git a/src/go/collectors/go.d.plugin/modules/dockerhub/testdata/repo2.txt b/src/go/plugin/go.d/modules/dockerhub/testdata/repo2.txt index e84ba989b..e84ba989b 100644 --- a/src/go/collectors/go.d.plugin/modules/dockerhub/testdata/repo2.txt +++ b/src/go/plugin/go.d/modules/dockerhub/testdata/repo2.txt diff --git a/src/go/collectors/go.d.plugin/modules/dockerhub/testdata/repo3.txt b/src/go/plugin/go.d/modules/dockerhub/testdata/repo3.txt index 1fc64a9c3..1fc64a9c3 100644 --- a/src/go/collectors/go.d.plugin/modules/dockerhub/testdata/repo3.txt +++ b/src/go/plugin/go.d/modules/dockerhub/testdata/repo3.txt diff --git a/src/collectors/python.d.plugin/dovecot/README.md b/src/go/plugin/go.d/modules/dovecot/README.md index c4749cedc..c4749cedc 120000 --- a/src/collectors/python.d.plugin/dovecot/README.md +++ b/src/go/plugin/go.d/modules/dovecot/README.md diff --git a/src/go/plugin/go.d/modules/dovecot/charts.go b/src/go/plugin/go.d/modules/dovecot/charts.go new file mode 100644 index 000000000..3a8bb1a8c --- /dev/null +++ b/src/go/plugin/go.d/modules/dovecot/charts.go @@ -0,0 +1,185 @@ +// SPDX-License-Identifier: GPL-3.0-or-later + +package dovecot + +import ( + "github.com/netdata/netdata/go/plugins/plugin/go.d/agent/module" +) + +const ( + prioSessions = module.Priority + iota + prioLogins + prioAuthenticationAttempts + prioCommands + prioPageFaults + prioContextSwitches + prioDiskIO + prioNetTraffic + prioSysCalls + prioLookups + prioCachePerformance + prioAuthCachePerformance +) + +var charts = module.Charts{ + sessionsChart.Copy(), + loginsChart.Copy(), + authAttemptsChart.Copy(), + commandsChart.Copy(), + pageFaultsChart.Copy(), + contextSwitchesChart.Copy(), + diskIOChart.Copy(), + netTrafficChart.Copy(), + sysCallsChart.Copy(), + lookupsChart.Copy(), + cacheChart.Copy(), + authCacheChart.Copy(), +} + +var ( + sessionsChart = module.Chart{ + ID: "sessions", + Title: "Dovecot Active Sessions", + Units: "sessions", + Fam: "sessions", + Ctx: "dovecot.sessions", + Priority: prioSessions, + Dims: module.Dims{ + {ID: "num_connected_sessions", Name: "active"}, + }, + } + loginsChart = module.Chart{ + ID: "logins", + Title: "Dovecot Logins", + Units: "logins", + Fam: "logins", + Ctx: "dovecot.logins", + Priority: prioLogins, + Dims: module.Dims{ + {ID: "num_logins", Name: "logins"}, + }, + } + authAttemptsChart = module.Chart{ + ID: "auth", + Title: "Dovecot Authentications", + Units: "attempts/s", + Fam: "logins", + Ctx: "dovecot.auth", + Priority: prioAuthenticationAttempts, + Type: module.Stacked, + Dims: module.Dims{ + {ID: "auth_successes", Name: "ok", Algo: module.Incremental}, + {ID: "auth_failures", Name: "failed", Algo: module.Incremental}, + }, + } + commandsChart = module.Chart{ + ID: "commands", + Title: "Dovecot Commands", + Units: "commands", + Fam: "commands", + Ctx: "dovecot.commands", + Priority: prioCommands, + Dims: module.Dims{ + {ID: "num_cmds", Name: "commands"}, + }, + } + pageFaultsChart = module.Chart{ + ID: "faults", + Title: "Dovecot Page Faults", + Units: "faults/s", + Fam: "page faults", + Ctx: "dovecot.faults", + Priority: prioPageFaults, + Dims: module.Dims{ + {ID: "min_faults", Name: "minor", Algo: module.Incremental}, + {ID: "maj_faults", Name: "major", Algo: module.Incremental}, + }, + } + contextSwitchesChart = module.Chart{ + ID: "context_switches", + Title: "Dovecot Context Switches", + Units: "switches/s", + Fam: "context switches", + Ctx: "dovecot.context_switches", + Priority: prioContextSwitches, + Dims: module.Dims{ + {ID: "vol_cs", Name: "voluntary", Algo: module.Incremental}, + {ID: "invol_cs", Name: "involuntary", Algo: module.Incremental}, + }, + } + diskIOChart = module.Chart{ + ID: "io", + Title: "Dovecot Disk I/O", + Units: "KiB/s", + Fam: "disk", + Ctx: "dovecot.io", + Priority: prioDiskIO, + Type: module.Area, + Dims: module.Dims{ + {ID: "disk_input", Name: "read", Div: 1024, Algo: module.Incremental}, + {ID: "disk_output", Name: "write", Mul: -1, Div: 1024, Algo: module.Incremental}, + }, + } + netTrafficChart = module.Chart{ + ID: "net", + Title: "Dovecot Network Bandwidth", + Units: "kilobits/s", + Fam: "network", + Ctx: "dovecot.net", + Priority: prioNetTraffic, + Type: module.Area, + Dims: module.Dims{ + {ID: "read_bytes", Name: "read", Mul: 8, Div: 1000, Algo: module.Incremental}, + {ID: "write_bytes", Name: "write", Mul: -8, Div: 1000, Algo: module.Incremental}, + }, + } + sysCallsChart = module.Chart{ + ID: "syscalls", + Title: "Dovecot Number of SysCalls", + Units: "syscalls/s", + Fam: "system", + Ctx: "dovecot.syscalls", + Priority: prioSysCalls, + Dims: module.Dims{ + {ID: "read_count", Name: "read", Algo: module.Incremental}, + {ID: "write_count", Name: "write", Algo: module.Incremental}, + }, + } + lookupsChart = module.Chart{ + ID: "lookup", + Title: "Dovecot Lookups", + Units: "lookups/s", + Fam: "lookups", + Ctx: "dovecot.lookup", + Priority: prioLookups, + Type: module.Stacked, + Dims: module.Dims{ + {ID: "mail_lookup_path", Name: "path", Algo: module.Incremental}, + {ID: "mail_lookup_attr", Name: "attr", Algo: module.Incremental}, + }, + } + cacheChart = module.Chart{ + ID: "cache", + Title: "Dovecot Cache Hits", + Units: "hits/s", + Fam: "cache", + Ctx: "dovecot.cache", + Priority: prioCachePerformance, + Dims: module.Dims{ + {ID: "mail_cache_hits", Name: "hits", Algo: module.Incremental}, + }, + } + authCacheChart = module.Chart{ + ID: "auth_cache", + Title: "Dovecot Authentication Cache", + Units: "requests/s", + Fam: "cache", + Ctx: "dovecot.auth_cache", + Priority: prioAuthCachePerformance, + Type: module.Stacked, + Dims: module.Dims{ + {ID: "auth_cache_hits", Name: "hits", Algo: module.Incremental}, + {ID: "auth_cache_misses", Name: "misses", Algo: module.Incremental}, + }, + } +) diff --git a/src/go/plugin/go.d/modules/dovecot/client.go b/src/go/plugin/go.d/modules/dovecot/client.go new file mode 100644 index 000000000..245d1743f --- /dev/null +++ b/src/go/plugin/go.d/modules/dovecot/client.go @@ -0,0 +1,54 @@ +// SPDX-License-Identifier: GPL-3.0-or-later + +package dovecot + +import ( + "bytes" + + "github.com/netdata/netdata/go/plugins/plugin/go.d/pkg/socket" +) + +type dovecotConn interface { + connect() error + disconnect() + queryExportGlobal() ([]byte, error) +} + +func newDovecotConn(conf Config) dovecotConn { + return &dovecotClient{conn: socket.New(socket.Config{ + Address: conf.Address, + ConnectTimeout: conf.Timeout.Duration(), + ReadTimeout: conf.Timeout.Duration(), + WriteTimeout: conf.Timeout.Duration(), + })} +} + +type dovecotClient struct { + conn socket.Client +} + +func (c *dovecotClient) connect() error { + return c.conn.Connect() +} + +func (c *dovecotClient) disconnect() { + _ = c.conn.Disconnect() +} + +func (c *dovecotClient) queryExportGlobal() ([]byte, error) { + var b bytes.Buffer + var n int + + err := c.conn.Command("EXPORT\tglobal\n", func(bs []byte) bool { + b.Write(bs) + b.WriteByte('\n') + + n++ + return n < 2 + }) + if err != nil { + return nil, err + } + + return b.Bytes(), nil +} diff --git a/src/go/plugin/go.d/modules/dovecot/collect.go b/src/go/plugin/go.d/modules/dovecot/collect.go new file mode 100644 index 000000000..a93bfc811 --- /dev/null +++ b/src/go/plugin/go.d/modules/dovecot/collect.go @@ -0,0 +1,89 @@ +// SPDX-License-Identifier: GPL-3.0-or-later + +package dovecot + +import ( + "bufio" + "bytes" + "errors" + "fmt" + "strconv" + "strings" +) + +// FIXME: drop using "old_stats" in favour of "stats" (https://doc.dovecot.org/configuration_manual/stats/openmetrics/). + +func (d *Dovecot) collect() (map[string]int64, error) { + if d.conn == nil { + conn, err := d.establishConn() + if err != nil { + return nil, err + } + d.conn = conn + } + + stats, err := d.conn.queryExportGlobal() + if err != nil { + d.conn.disconnect() + d.conn = nil + return nil, err + } + + mx := make(map[string]int64) + + // https://doc.dovecot.org/configuration_manual/stats/old_statistics/#statistics-gathered + if err := d.collectExportGlobal(mx, stats); err != nil { + return nil, err + } + + return mx, nil +} + +func (d *Dovecot) collectExportGlobal(mx map[string]int64, resp []byte) error { + sc := bufio.NewScanner(bytes.NewReader(resp)) + + if !sc.Scan() { + return errors.New("failed to read fields line from export global response") + } + fieldsLine := strings.TrimSpace(sc.Text()) + + if !sc.Scan() { + return errors.New("failed to read values line from export global response") + } + valuesLine := strings.TrimSpace(sc.Text()) + + if fieldsLine == "" || valuesLine == "" { + return errors.New("empty fields line or values line from export global response") + } + + fields := strings.Fields(fieldsLine) + values := strings.Fields(valuesLine) + + if len(fields) != len(values) { + return fmt.Errorf("mismatched fields and values count: fields=%d, values=%d", len(fields), len(values)) + } + + for i, name := range fields { + val := values[i] + + v, err := strconv.ParseInt(val, 10, 64) + if err != nil { + d.Debugf("failed to parse export value %s %s: %v", name, val, err) + continue + } + + mx[name] = v + } + + return nil +} + +func (d *Dovecot) establishConn() (dovecotConn, error) { + conn := d.newConn(d.Config) + + if err := conn.connect(); err != nil { + return nil, err + } + + return conn, nil +} diff --git a/src/go/plugin/go.d/modules/dovecot/config_schema.json b/src/go/plugin/go.d/modules/dovecot/config_schema.json new file mode 100644 index 000000000..cf99b6939 --- /dev/null +++ b/src/go/plugin/go.d/modules/dovecot/config_schema.json @@ -0,0 +1,47 @@ +{ + "jsonSchema": { + "$schema": "http://json-schema.org/draft-07/schema#", + "title": "Dovecot collector configuration.", + "type": "object", + "properties": { + "update_every": { + "title": "Update every", + "description": "Data collection interval, measured in seconds.", + "type": "integer", + "minimum": 1, + "default": 1 + }, + "address": { + "title": "Address", + "description": "The Unix or TCP socket address where the Dovecot [old_stats](https://doc.dovecot.org/configuration_manual/stats/old_statistics/#old-statistics) plugin listens for connections.", + "type": "string", + "default": "127.0.0.1:24242" + }, + "timeout": { + "title": "Timeout", + "description": "Timeout for establishing a connection and communication (reading and writing) in seconds.", + "type": "number", + "minimum": 0.5, + "default": 1 + } + }, + "required": [ + "address" + ], + "additionalProperties": false, + "patternProperties": { + "^name$": {} + } + }, + "uiSchema": { + "uiOptions": { + "fullPage": true + }, + "address": { + "ui:help": "Use `unix://{path_to_socket}` for Unix socket or `{ip}:{port}` for TCP socket." + }, + "timeout": { + "ui:help": "Accepts decimals for precise control (e.g., type 1.5 for 1.5 seconds)." + } + } +} diff --git a/src/go/plugin/go.d/modules/dovecot/dovecot.go b/src/go/plugin/go.d/modules/dovecot/dovecot.go new file mode 100644 index 000000000..ee3d62399 --- /dev/null +++ b/src/go/plugin/go.d/modules/dovecot/dovecot.go @@ -0,0 +1,101 @@ +// SPDX-License-Identifier: GPL-3.0-or-later + +package dovecot + +import ( + _ "embed" + "errors" + "time" + + "github.com/netdata/netdata/go/plugins/plugin/go.d/agent/module" + "github.com/netdata/netdata/go/plugins/plugin/go.d/pkg/web" +) + +//go:embed "config_schema.json" +var configSchema string + +func init() { + module.Register("dovecot", module.Creator{ + JobConfigSchema: configSchema, + Create: func() module.Module { return New() }, + Config: func() any { return &Config{} }, + }) +} + +func New() *Dovecot { + return &Dovecot{ + Config: Config{ + Address: "127.0.0.1:24242", + Timeout: web.Duration(time.Second * 1), + }, + newConn: newDovecotConn, + charts: charts.Copy(), + } +} + +type Config struct { + UpdateEvery int `yaml:"update_every,omitempty" json:"update_every"` + Address string `yaml:"address" json:"address"` + Timeout web.Duration `yaml:"timeout" json:"timeout"` +} + +type Dovecot struct { + module.Base + Config `yaml:",inline" json:""` + + charts *module.Charts + + newConn func(Config) dovecotConn + conn dovecotConn +} + +func (d *Dovecot) Configuration() any { + return d.Config +} + +func (d *Dovecot) Init() error { + if d.Address == "" { + d.Error("config: 'address' not set") + return errors.New("address not set") + } + + return nil +} + +func (d *Dovecot) Check() error { + mx, err := d.collect() + if err != nil { + d.Error(err) + return err + } + + if len(mx) == 0 { + return errors.New("no metrics collected") + } + + return nil +} + +func (d *Dovecot) Charts() *module.Charts { + return d.charts +} + +func (d *Dovecot) Collect() map[string]int64 { + mx, err := d.collect() + if err != nil { + d.Error(err) + } + + if len(mx) == 0 { + return nil + } + + return mx +} + +func (d *Dovecot) Cleanup() { + if d.conn != nil { + d.conn.disconnect() + d.conn = nil + } +} diff --git a/src/go/plugin/go.d/modules/dovecot/dovecot_test.go b/src/go/plugin/go.d/modules/dovecot/dovecot_test.go new file mode 100644 index 000000000..ba60adeb6 --- /dev/null +++ b/src/go/plugin/go.d/modules/dovecot/dovecot_test.go @@ -0,0 +1,281 @@ +// SPDX-License-Identifier: GPL-3.0-or-later + +package dovecot + +import ( + "errors" + "os" + "testing" + + "github.com/netdata/netdata/go/plugins/plugin/go.d/agent/module" + + "github.com/stretchr/testify/assert" + "github.com/stretchr/testify/require" +) + +var ( + dataConfigJSON, _ = os.ReadFile("testdata/config.json") + dataConfigYAML, _ = os.ReadFile("testdata/config.yaml") + + dataExportGlobal, _ = os.ReadFile("testdata/export_global.txt") +) + +func Test_testDataIsValid(t *testing.T) { + for name, data := range map[string][]byte{ + "dataConfigJSON": dataConfigJSON, + "dataConfigYAML": dataConfigYAML, + "dataExportGlobal": dataExportGlobal, + } { + require.NotNil(t, data, name) + } +} + +func TestDovecot_ConfigurationSerialize(t *testing.T) { + module.TestConfigurationSerialize(t, &Dovecot{}, dataConfigJSON, dataConfigYAML) +} + +func TestDovecot_Init(t *testing.T) { + tests := map[string]struct { + config Config + wantFail bool + }{ + "success with default config": { + wantFail: false, + config: New().Config, + }, + "fails if address not set": { + wantFail: true, + config: func() Config { + conf := New().Config + conf.Address = "" + return conf + }(), + }, + } + + for name, test := range tests { + t.Run(name, func(t *testing.T) { + dovecot := New() + dovecot.Config = test.config + + if test.wantFail { + assert.Error(t, dovecot.Init()) + } else { + assert.NoError(t, dovecot.Init()) + } + }) + } +} + +func TestDovecot_Cleanup(t *testing.T) { + tests := map[string]struct { + prepare func() *Dovecot + }{ + "not initialized": { + prepare: func() *Dovecot { + return New() + }, + }, + "after check": { + prepare: func() *Dovecot { + dovecot := New() + dovecot.newConn = func(config Config) dovecotConn { return prepareMockOk() } + _ = dovecot.Check() + return dovecot + }, + }, + "after collect": { + prepare: func() *Dovecot { + dovecot := New() + dovecot.newConn = func(config Config) dovecotConn { return prepareMockOk() } + _ = dovecot.Collect() + return dovecot + }, + }, + } + + for name, test := range tests { + t.Run(name, func(t *testing.T) { + dovecot := test.prepare() + + assert.NotPanics(t, dovecot.Cleanup) + }) + } +} + +func TestDovecot_Charts(t *testing.T) { + assert.NotNil(t, New().Charts()) +} + +func TestDovecot_Check(t *testing.T) { + tests := map[string]struct { + prepareMock func() *mockDovecotConn + wantFail bool + }{ + "success case": { + wantFail: false, + prepareMock: prepareMockOk, + }, + "err on connect": { + wantFail: true, + prepareMock: prepareMockErrOnConnect, + }, + "unexpected response": { + wantFail: true, + prepareMock: prepareMockUnexpectedResponse, + }, + "empty response": { + wantFail: true, + prepareMock: prepareMockEmptyResponse, + }, + } + + for name, test := range tests { + t.Run(name, func(t *testing.T) { + dovecot := New() + mock := test.prepareMock() + dovecot.newConn = func(config Config) dovecotConn { return mock } + + if test.wantFail { + assert.Error(t, dovecot.Check()) + } else { + assert.NoError(t, dovecot.Check()) + } + }) + } +} + +func TestDovecot_Collect(t *testing.T) { + tests := map[string]struct { + prepareMock func() *mockDovecotConn + wantMetrics map[string]int64 + disconnectBeforeCleanup bool + disconnectAfterCleanup bool + }{ + "success case": { + prepareMock: prepareMockOk, + disconnectBeforeCleanup: false, + disconnectAfterCleanup: true, + wantMetrics: map[string]int64{ + "auth_cache_hits": 1, + "auth_cache_misses": 1, + "auth_db_tempfails": 1, + "auth_failures": 1, + "auth_master_successes": 1, + "auth_successes": 1, + "disk_input": 1, + "disk_output": 1, + "invol_cs": 1, + "mail_cache_hits": 1, + "mail_lookup_attr": 1, + "mail_lookup_path": 1, + "mail_read_bytes": 1, + "mail_read_count": 1, + "maj_faults": 1, + "min_faults": 1, + "num_cmds": 1, + "num_connected_sessions": 1, + "num_logins": 1, + "read_bytes": 1, + "read_count": 1, + "reset_timestamp": 1723481629, + "vol_cs": 1, + "write_bytes": 1, + "write_count": 1, + }, + }, + "unexpected response": { + prepareMock: prepareMockUnexpectedResponse, + disconnectBeforeCleanup: false, + disconnectAfterCleanup: true, + }, + "empty response": { + prepareMock: prepareMockEmptyResponse, + disconnectBeforeCleanup: false, + disconnectAfterCleanup: true, + }, + "err on connect": { + prepareMock: prepareMockErrOnConnect, + disconnectBeforeCleanup: false, + disconnectAfterCleanup: false, + }, + "err on query stats": { + prepareMock: prepareMockErrOnQueryExportGlobal, + disconnectBeforeCleanup: true, + disconnectAfterCleanup: true, + }, + } + + for name, test := range tests { + t.Run(name, func(t *testing.T) { + dovecot := New() + mock := test.prepareMock() + dovecot.newConn = func(config Config) dovecotConn { return mock } + + mx := dovecot.Collect() + + require.Equal(t, test.wantMetrics, mx) + + if len(test.wantMetrics) > 0 { + module.TestMetricsHasAllChartsDims(t, dovecot.Charts(), mx) + } + + assert.Equal(t, test.disconnectBeforeCleanup, mock.disconnectCalled, "disconnect before cleanup") + dovecot.Cleanup() + assert.Equal(t, test.disconnectAfterCleanup, mock.disconnectCalled, "disconnect after cleanup") + }) + } +} + +func prepareMockOk() *mockDovecotConn { + return &mockDovecotConn{ + exportGlobalResponse: dataExportGlobal, + } +} + +func prepareMockErrOnConnect() *mockDovecotConn { + return &mockDovecotConn{ + errOnConnect: true, + } +} + +func prepareMockErrOnQueryExportGlobal() *mockDovecotConn { + return &mockDovecotConn{ + errOnQueryExportGlobal: true, + } +} + +func prepareMockUnexpectedResponse() *mockDovecotConn { + return &mockDovecotConn{ + exportGlobalResponse: []byte("Lorem ipsum dolor sit amet, consectetur adipiscing elit."), + } +} + +func prepareMockEmptyResponse() *mockDovecotConn { + return &mockDovecotConn{} +} + +type mockDovecotConn struct { + errOnConnect bool + errOnQueryExportGlobal bool + exportGlobalResponse []byte + disconnectCalled bool +} + +func (m *mockDovecotConn) connect() error { + if m.errOnConnect { + return errors.New("mock.connect() error") + } + return nil +} + +func (m *mockDovecotConn) disconnect() { + m.disconnectCalled = true +} + +func (m *mockDovecotConn) queryExportGlobal() ([]byte, error) { + if m.errOnQueryExportGlobal { + return nil, errors.New("mock.queryExportGlobal() error") + } + return m.exportGlobalResponse, nil +} diff --git a/src/go/plugin/go.d/modules/dovecot/integrations/dovecot.md b/src/go/plugin/go.d/modules/dovecot/integrations/dovecot.md new file mode 100644 index 000000000..8b45e2de0 --- /dev/null +++ b/src/go/plugin/go.d/modules/dovecot/integrations/dovecot.md @@ -0,0 +1,244 @@ +<!--startmeta +custom_edit_url: "https://github.com/netdata/netdata/edit/master/src/go/plugin/go.d/modules/dovecot/README.md" +meta_yaml: "https://github.com/netdata/netdata/edit/master/src/go/plugin/go.d/modules/dovecot/metadata.yaml" +sidebar_label: "Dovecot" +learn_status: "Published" +learn_rel_path: "Collecting Metrics/Mail Servers" +most_popular: False +message: "DO NOT EDIT THIS FILE DIRECTLY, IT IS GENERATED BY THE COLLECTOR'S metadata.yaml FILE" +endmeta--> + +# Dovecot + + +<img src="https://netdata.cloud/img/dovecot.svg" width="150"/> + + +Plugin: go.d.plugin +Module: dovecot + +<img src="https://img.shields.io/badge/maintained%20by-Netdata-%2300ab44" /> + +## Overview + +This collector monitors Dovecot metrics about sessions, logins, commands, page faults and more. + + +It reads the server's response to the `EXPORT\tglobal\n` command. + + +This collector is supported on all platforms. + +This collector supports collecting metrics from multiple instances of this integration, including remote instances. + + +### Default Behavior + +#### Auto-Detection + +Automatically discovers and collects Dovecot statistics from the following default locations: + +- localhost:24242 +- unix:///var/run/dovecot/old-stats + + +#### Limits + +The default configuration for this integration does not impose any limits on data collection. + +#### Performance Impact + +The default configuration for this integration is not expected to impose a significant performance impact on the system. + + +## Metrics + +Metrics grouped by *scope*. + +The scope defines the instance that the metric belongs to. An instance is uniquely identified by a set of labels. + + + +### Per Dovecot instance + +These metrics refer to the entire monitored application. + +This scope has no labels. + +Metrics: + +| Metric | Dimensions | Unit | +|:------|:----------|:----| +| dovecot.session | active | sessions | +| dovecot.logins | logins | logins | +| dovecot.auth | ok, failed | attempts/s | +| dovecot.commands | commands | commands | +| dovecot.context_switches | voluntary, voluntary | switches/s | +| dovecot.io | read, write | KiB/s | +| dovecot.net | read, write | kilobits/s | +| dovecot.syscalls | read, write | syscalls/s | +| dovecot.lookup | path, attr | lookups/s | +| dovecot.cache | hits | hits/s | +| dovecot.auth_cache | hits, misses | requests/s | + + + +## Alerts + +There are no alerts configured by default for this integration. + + +## Setup + +### Prerequisites + +#### Enable old_stats plugin + +To enable `old_stats` plugin, see [Old Statistics](https://doc.dovecot.org/configuration_manual/stats/old_statistics/#old-statistics). + + + +### Configuration + +#### File + +The configuration file name for this integration is `go.d/dovecot.conf`. + + +You can edit the configuration file using the `edit-config` script from the +Netdata [config directory](/docs/netdata-agent/configuration/README.md#the-netdata-config-directory). + +```bash +cd /etc/netdata 2>/dev/null || cd /opt/netdata/etc/netdata +sudo ./edit-config go.d/dovecot.conf +``` +#### Options + +The following options can be defined globally: update_every, autodetection_retry. + + +<details open><summary>Config options</summary> + +| Name | Description | Default | Required | +|:----|:-----------|:-------|:--------:| +| update_every | Data collection frequency. | 1 | no | +| autodetection_retry | Recheck interval in seconds. Zero means no recheck will be scheduled. | 0 | no | +| address | The Unix or TCP socket address where the Dovecot [old_stats](https://doc.dovecot.org/configuration_manual/stats/old_statistics/#old-statistics) plugin listens for connections. | 127.0.0.1:24242 | yes | +| timeout | Connection, read, and write timeout duration in seconds. The timeout includes name resolution. | 1 | no | + +</details> + +#### Examples + +##### Basic (TCP) + +A basic example configuration. + +<details open><summary>Config</summary> + +```yaml +jobs: + - name: local + address: 127.0.0.1:24242 + +``` +</details> + +##### Basic (UNIX) + +A basic example configuration using a UNIX socket. + +<details open><summary>Config</summary> + +```yaml +jobs: + - name: local + address: unix:///var/run/dovecot/old-stats + +``` +</details> + +##### Multi-instance + +> **Note**: When you define multiple jobs, their names must be unique. + +Collecting metrics from local and remote instances. + + +<details open><summary>Config</summary> + +```yaml +jobs: + - name: local + address: 127.0.0.1:24242 + + - name: remote + address: 203.0.113.0:24242 + +``` +</details> + + + +## Troubleshooting + +### Debug Mode + +**Important**: Debug mode is not supported for data collection jobs created via the UI using the Dyncfg feature. + +To troubleshoot issues with the `dovecot` collector, run the `go.d.plugin` with the debug option enabled. The output +should give you clues as to why the collector isn't working. + +- Navigate to the `plugins.d` directory, usually at `/usr/libexec/netdata/plugins.d/`. If that's not the case on + your system, open `netdata.conf` and look for the `plugins` setting under `[directories]`. + + ```bash + cd /usr/libexec/netdata/plugins.d/ + ``` + +- Switch to the `netdata` user. + + ```bash + sudo -u netdata -s + ``` + +- Run the `go.d.plugin` to debug the collector: + + ```bash + ./go.d.plugin -d -m dovecot + ``` + +### Getting Logs + +If you're encountering problems with the `dovecot` collector, follow these steps to retrieve logs and identify potential issues: + +- **Run the command** specific to your system (systemd, non-systemd, or Docker container). +- **Examine the output** for any warnings or error messages that might indicate issues. These messages should provide clues about the root cause of the problem. + +#### System with systemd + +Use the following command to view logs generated since the last Netdata service restart: + +```bash +journalctl _SYSTEMD_INVOCATION_ID="$(systemctl show --value --property=InvocationID netdata)" --namespace=netdata --grep dovecot +``` + +#### System without systemd + +Locate the collector log file, typically at `/var/log/netdata/collector.log`, and use `grep` to filter for collector's name: + +```bash +grep dovecot /var/log/netdata/collector.log +``` + +**Note**: This method shows logs from all restarts. Focus on the **latest entries** for troubleshooting current issues. + +#### Docker Container + +If your Netdata runs in a Docker container named "netdata" (replace if different), use this command: + +```bash +docker logs netdata 2>&1 | grep dovecot +``` + + diff --git a/src/go/plugin/go.d/modules/dovecot/metadata.yaml b/src/go/plugin/go.d/modules/dovecot/metadata.yaml new file mode 100644 index 000000000..948990bca --- /dev/null +++ b/src/go/plugin/go.d/modules/dovecot/metadata.yaml @@ -0,0 +1,194 @@ +plugin_name: go.d.plugin +modules: + - meta: + id: collector-go.d.plugin-dovecot + plugin_name: go.d.plugin + module_name: dovecot + monitored_instance: + name: Dovecot + link: 'https://www.dovecot.org/' + categories: + - data-collection.mail-servers + icon_filename: "dovecot.svg" + related_resources: + integrations: + list: [] + info_provided_to_referring_integrations: + description: "" + keywords: + - dovecot + - imap + - mail + most_popular: false + overview: + data_collection: + metrics_description: | + This collector monitors Dovecot metrics about sessions, logins, commands, page faults and more. + method_description: | + It reads the server's response to the `EXPORT\tglobal\n` command. + supported_platforms: + include: [] + exclude: [] + multi_instance: true + additional_permissions: + description: "" + default_behavior: + auto_detection: + description: | + Automatically discovers and collects Dovecot statistics from the following default locations: + + - localhost:24242 + - unix:///var/run/dovecot/old-stats + limits: + description: "" + performance_impact: + description: "" + setup: + prerequisites: + list: + - title: Enable old_stats plugin + description: | + To enable `old_stats` plugin, see [Old Statistics](https://doc.dovecot.org/configuration_manual/stats/old_statistics/#old-statistics). + configuration: + file: + name: go.d/dovecot.conf + options: + description: | + The following options can be defined globally: update_every, autodetection_retry. + folding: + title: Config options + enabled: true + list: + - name: update_every + description: Data collection frequency. + default_value: 1 + required: false + - name: autodetection_retry + description: Recheck interval in seconds. Zero means no recheck will be scheduled. + default_value: 0 + required: false + - name: address + description: "The Unix or TCP socket address where the Dovecot [old_stats](https://doc.dovecot.org/configuration_manual/stats/old_statistics/#old-statistics) plugin listens for connections." + default_value: 127.0.0.1:24242 + required: true + - name: timeout + description: Connection, read, and write timeout duration in seconds. The timeout includes name resolution. + default_value: 1 + required: false + examples: + folding: + title: Config + enabled: true + list: + - name: Basic (TCP) + description: A basic example configuration. + config: | + jobs: + - name: local + address: 127.0.0.1:24242 + - name: Basic (UNIX) + description: A basic example configuration using a UNIX socket. + config: | + jobs: + - name: local + address: unix:///var/run/dovecot/old-stats + - name: Multi-instance + description: | + > **Note**: When you define multiple jobs, their names must be unique. + + Collecting metrics from local and remote instances. + config: | + jobs: + - name: local + address: 127.0.0.1:24242 + + - name: remote + address: 203.0.113.0:24242 + troubleshooting: + problems: + list: [] + alerts: [] + metrics: + folding: + title: Metrics + enabled: false + description: "" + availability: [] + scopes: + - name: global + description: "These metrics refer to the entire monitored application." + labels: [] + metrics: + - name: dovecot.session + description: Dovecot Active Sessions + unit: "sessions" + chart_type: line + dimensions: + - name: active + - name: dovecot.logins + description: Dovecot Logins + unit: "logins" + chart_type: line + dimensions: + - name: logins + - name: dovecot.auth + description: Dovecot Authentications + unit: "attempts/s" + chart_type: stacked + dimensions: + - name: ok + - name: failed + - name: dovecot.commands + description: Dovecot Commands + unit: "commands" + chart_type: line + dimensions: + - name: commands + - name: dovecot.context_switches + description: Dovecot Context Switches + unit: "switches/s" + chart_type: line + dimensions: + - name: voluntary + - name: voluntary + - name: dovecot.io + description: Dovecot Disk I/O + unit: "KiB/s" + chart_type: area + dimensions: + - name: read + - name: write + - name: dovecot.net + description: Dovecot Network Bandwidth + unit: "kilobits/s" + chart_type: area + dimensions: + - name: read + - name: write + - name: dovecot.syscalls + description: Dovecot Number of SysCalls + unit: "syscalls/s" + chart_type: line + dimensions: + - name: read + - name: write + - name: dovecot.lookup + description: Dovecot Lookups + unit: "lookups/s" + chart_type: stacked + dimensions: + - name: path + - name: attr + - name: dovecot.cache + description: Dovecot Cache Hits + unit: "hits/s" + chart_type: line + dimensions: + - name: hits + - name: dovecot.auth_cache + description: Dovecot Authentication Cache + unit: "requests/s" + chart_type: stacked + dimensions: + - name: hits + - name: misses diff --git a/src/go/collectors/go.d.plugin/modules/hddtemp/testdata/config.json b/src/go/plugin/go.d/modules/dovecot/testdata/config.json index e86834720..e86834720 100644 --- a/src/go/collectors/go.d.plugin/modules/hddtemp/testdata/config.json +++ b/src/go/plugin/go.d/modules/dovecot/testdata/config.json diff --git a/src/go/collectors/go.d.plugin/modules/hddtemp/testdata/config.yaml b/src/go/plugin/go.d/modules/dovecot/testdata/config.yaml index 1b81d09eb..1b81d09eb 100644 --- a/src/go/collectors/go.d.plugin/modules/hddtemp/testdata/config.yaml +++ b/src/go/plugin/go.d/modules/dovecot/testdata/config.yaml diff --git a/src/go/plugin/go.d/modules/dovecot/testdata/export_global.txt b/src/go/plugin/go.d/modules/dovecot/testdata/export_global.txt new file mode 100644 index 000000000..00d28914a --- /dev/null +++ b/src/go/plugin/go.d/modules/dovecot/testdata/export_global.txt @@ -0,0 +1,2 @@ +reset_timestamp last_update num_logins num_cmds num_connected_sessions user_cpu sys_cpu clock_time min_faults maj_faults vol_cs invol_cs disk_input disk_output read_count read_bytes write_count write_bytes mail_lookup_path mail_lookup_attr mail_read_count mail_read_bytes mail_cache_hits auth_successes auth_master_successes auth_failures auth_db_tempfails auth_cache_hits auth_cache_misses +1723481629 1.111111 1 1 1 1.1 1.1 1.1 1 1 1 1 1 1 1 1 1 1 1 1 1 1 1 1 1 1 1 1 1 diff --git a/src/go/collectors/go.d.plugin/modules/elasticsearch/README.md b/src/go/plugin/go.d/modules/elasticsearch/README.md index 8951ff7b2..8951ff7b2 120000 --- a/src/go/collectors/go.d.plugin/modules/elasticsearch/README.md +++ b/src/go/plugin/go.d/modules/elasticsearch/README.md diff --git a/src/go/collectors/go.d.plugin/modules/elasticsearch/charts.go b/src/go/plugin/go.d/modules/elasticsearch/charts.go index 1087ef65f..049061235 100644 --- a/src/go/collectors/go.d.plugin/modules/elasticsearch/charts.go +++ b/src/go/plugin/go.d/modules/elasticsearch/charts.go @@ -6,7 +6,7 @@ import ( "fmt" "strings" - "github.com/netdata/netdata/go/go.d.plugin/agent/module" + "github.com/netdata/netdata/go/plugins/plugin/go.d/agent/module" ) const ( diff --git a/src/go/collectors/go.d.plugin/modules/elasticsearch/collect.go b/src/go/plugin/go.d/modules/elasticsearch/collect.go index eb3ffb351..4f46f1088 100644 --- a/src/go/collectors/go.d.plugin/modules/elasticsearch/collect.go +++ b/src/go/plugin/go.d/modules/elasticsearch/collect.go @@ -13,8 +13,8 @@ import ( "strings" "sync" - "github.com/netdata/netdata/go/go.d.plugin/pkg/stm" - "github.com/netdata/netdata/go/go.d.plugin/pkg/web" + "github.com/netdata/netdata/go/plugins/plugin/go.d/pkg/stm" + "github.com/netdata/netdata/go/plugins/plugin/go.d/pkg/web" ) const ( @@ -158,13 +158,15 @@ func (es *Elasticsearch) scrapeElasticsearch() *esMetrics { } func (es *Elasticsearch) scrapeNodesStats(ms *esMetrics) { - req, _ := web.NewHTTPRequest(es.Request) + var p string if es.ClusterMode { - req.URL.Path = urlPathNodesStats + p = urlPathNodesStats } else { - req.URL.Path = urlPathLocalNodeStats + p = urlPathLocalNodeStats } + req, _ := web.NewHTTPRequestWithPath(es.Request, p) + var stats esNodesStats if err := es.doOKDecode(req, &stats); err != nil { es.Warning(err) @@ -175,8 +177,7 @@ func (es *Elasticsearch) scrapeNodesStats(ms *esMetrics) { } func (es *Elasticsearch) scrapeClusterHealth(ms *esMetrics) { - req, _ := web.NewHTTPRequest(es.Request) - req.URL.Path = urlPathClusterHealth + req, _ := web.NewHTTPRequestWithPath(es.Request, urlPathClusterHealth) var health esClusterHealth if err := es.doOKDecode(req, &health); err != nil { @@ -188,8 +189,7 @@ func (es *Elasticsearch) scrapeClusterHealth(ms *esMetrics) { } func (es *Elasticsearch) scrapeClusterStats(ms *esMetrics) { - req, _ := web.NewHTTPRequest(es.Request) - req.URL.Path = urlPathClusterStats + req, _ := web.NewHTTPRequestWithPath(es.Request, urlPathClusterStats) var stats esClusterStats if err := es.doOKDecode(req, &stats); err != nil { @@ -201,8 +201,7 @@ func (es *Elasticsearch) scrapeClusterStats(ms *esMetrics) { } func (es *Elasticsearch) scrapeLocalIndicesStats(ms *esMetrics) { - req, _ := web.NewHTTPRequest(es.Request) - req.URL.Path = urlPathIndicesStats + req, _ := web.NewHTTPRequestWithPath(es.Request, urlPathIndicesStats) req.URL.RawQuery = "local=true&format=json" var stats []esIndexStats diff --git a/src/go/collectors/go.d.plugin/modules/elasticsearch/config_schema.json b/src/go/plugin/go.d/modules/elasticsearch/config_schema.json index f1c39b023..230993b05 100644 --- a/src/go/collectors/go.d.plugin/modules/elasticsearch/config_schema.json +++ b/src/go/plugin/go.d/modules/elasticsearch/config_schema.json @@ -202,6 +202,12 @@ "timeout": { "ui:help": "Accepts decimals for precise control (e.g., type 1.5 for 1.5 seconds)." }, + "username": { + "ui:widget": "password" + }, + "proxy_username": { + "ui:widget": "password" + }, "password": { "ui:widget": "password" }, diff --git a/src/go/collectors/go.d.plugin/modules/elasticsearch/elasticsearch.go b/src/go/plugin/go.d/modules/elasticsearch/elasticsearch.go index 5a1c1b982..22280f2dd 100644 --- a/src/go/collectors/go.d.plugin/modules/elasticsearch/elasticsearch.go +++ b/src/go/plugin/go.d/modules/elasticsearch/elasticsearch.go @@ -9,8 +9,8 @@ import ( "sync" "time" - "github.com/netdata/netdata/go/go.d.plugin/agent/module" - "github.com/netdata/netdata/go/go.d.plugin/pkg/web" + "github.com/netdata/netdata/go/plugins/plugin/go.d/agent/module" + "github.com/netdata/netdata/go/plugins/plugin/go.d/pkg/web" ) //go:embed "config_schema.json" diff --git a/src/go/collectors/go.d.plugin/modules/elasticsearch/elasticsearch_test.go b/src/go/plugin/go.d/modules/elasticsearch/elasticsearch_test.go index dc4817336..ca3aa526a 100644 --- a/src/go/collectors/go.d.plugin/modules/elasticsearch/elasticsearch_test.go +++ b/src/go/plugin/go.d/modules/elasticsearch/elasticsearch_test.go @@ -3,14 +3,14 @@ package elasticsearch import ( - "github.com/netdata/netdata/go/go.d.plugin/agent/module" + "github.com/netdata/netdata/go/plugins/plugin/go.d/agent/module" "net/http" "net/http/httptest" "os" "testing" - "github.com/netdata/netdata/go/go.d.plugin/pkg/tlscfg" - "github.com/netdata/netdata/go/go.d.plugin/pkg/web" + "github.com/netdata/netdata/go/plugins/plugin/go.d/pkg/tlscfg" + "github.com/netdata/netdata/go/plugins/plugin/go.d/pkg/web" "github.com/stretchr/testify/assert" "github.com/stretchr/testify/require" diff --git a/src/go/collectors/go.d.plugin/modules/elasticsearch/init.go b/src/go/plugin/go.d/modules/elasticsearch/init.go index 955d9c3a2..f87b594f8 100644 --- a/src/go/collectors/go.d.plugin/modules/elasticsearch/init.go +++ b/src/go/plugin/go.d/modules/elasticsearch/init.go @@ -6,7 +6,7 @@ import ( "errors" "net/http" - "github.com/netdata/netdata/go/go.d.plugin/pkg/web" + "github.com/netdata/netdata/go/plugins/plugin/go.d/pkg/web" ) func (es *Elasticsearch) validateConfig() error { diff --git a/src/go/collectors/go.d.plugin/modules/elasticsearch/integrations/elasticsearch.md b/src/go/plugin/go.d/modules/elasticsearch/integrations/elasticsearch.md index 2ae4e6704..ab6f7d00d 100644 --- a/src/go/collectors/go.d.plugin/modules/elasticsearch/integrations/elasticsearch.md +++ b/src/go/plugin/go.d/modules/elasticsearch/integrations/elasticsearch.md @@ -1,6 +1,6 @@ <!--startmeta -custom_edit_url: "https://github.com/netdata/netdata/edit/master/src/go/collectors/go.d.plugin/modules/elasticsearch/integrations/elasticsearch.md" -meta_yaml: "https://github.com/netdata/netdata/edit/master/src/go/collectors/go.d.plugin/modules/elasticsearch/metadata.yaml" +custom_edit_url: "https://github.com/netdata/netdata/edit/master/src/go/plugin/go.d/modules/elasticsearch/integrations/elasticsearch.md" +meta_yaml: "https://github.com/netdata/netdata/edit/master/src/go/plugin/go.d/modules/elasticsearch/metadata.yaml" sidebar_label: "Elasticsearch" learn_status: "Published" learn_rel_path: "Collecting Metrics/Search Engines" @@ -318,6 +318,8 @@ jobs: ### Debug Mode +**Important**: Debug mode is not supported for data collection jobs created via the UI using the Dyncfg feature. + To troubleshoot issues with the `elasticsearch` collector, run the `go.d.plugin` with the debug option enabled. The output should give you clues as to why the collector isn't working. @@ -340,4 +342,37 @@ should give you clues as to why the collector isn't working. ./go.d.plugin -d -m elasticsearch ``` +### Getting Logs + +If you're encountering problems with the `elasticsearch` collector, follow these steps to retrieve logs and identify potential issues: + +- **Run the command** specific to your system (systemd, non-systemd, or Docker container). +- **Examine the output** for any warnings or error messages that might indicate issues. These messages should provide clues about the root cause of the problem. + +#### System with systemd + +Use the following command to view logs generated since the last Netdata service restart: + +```bash +journalctl _SYSTEMD_INVOCATION_ID="$(systemctl show --value --property=InvocationID netdata)" --namespace=netdata --grep elasticsearch +``` + +#### System without systemd + +Locate the collector log file, typically at `/var/log/netdata/collector.log`, and use `grep` to filter for collector's name: + +```bash +grep elasticsearch /var/log/netdata/collector.log +``` + +**Note**: This method shows logs from all restarts. Focus on the **latest entries** for troubleshooting current issues. + +#### Docker Container + +If your Netdata runs in a Docker container named "netdata" (replace if different), use this command: + +```bash +docker logs netdata 2>&1 | grep elasticsearch +``` + diff --git a/src/go/collectors/go.d.plugin/modules/elasticsearch/integrations/opensearch.md b/src/go/plugin/go.d/modules/elasticsearch/integrations/opensearch.md index 58c0e7c57..9426ada75 100644 --- a/src/go/collectors/go.d.plugin/modules/elasticsearch/integrations/opensearch.md +++ b/src/go/plugin/go.d/modules/elasticsearch/integrations/opensearch.md @@ -1,6 +1,6 @@ <!--startmeta -custom_edit_url: "https://github.com/netdata/netdata/edit/master/src/go/collectors/go.d.plugin/modules/elasticsearch/integrations/opensearch.md" -meta_yaml: "https://github.com/netdata/netdata/edit/master/src/go/collectors/go.d.plugin/modules/elasticsearch/metadata.yaml" +custom_edit_url: "https://github.com/netdata/netdata/edit/master/src/go/plugin/go.d/modules/elasticsearch/integrations/opensearch.md" +meta_yaml: "https://github.com/netdata/netdata/edit/master/src/go/plugin/go.d/modules/elasticsearch/metadata.yaml" sidebar_label: "OpenSearch" learn_status: "Published" learn_rel_path: "Collecting Metrics/Search Engines" @@ -318,6 +318,8 @@ jobs: ### Debug Mode +**Important**: Debug mode is not supported for data collection jobs created via the UI using the Dyncfg feature. + To troubleshoot issues with the `elasticsearch` collector, run the `go.d.plugin` with the debug option enabled. The output should give you clues as to why the collector isn't working. @@ -340,4 +342,37 @@ should give you clues as to why the collector isn't working. ./go.d.plugin -d -m elasticsearch ``` +### Getting Logs + +If you're encountering problems with the `elasticsearch` collector, follow these steps to retrieve logs and identify potential issues: + +- **Run the command** specific to your system (systemd, non-systemd, or Docker container). +- **Examine the output** for any warnings or error messages that might indicate issues. These messages should provide clues about the root cause of the problem. + +#### System with systemd + +Use the following command to view logs generated since the last Netdata service restart: + +```bash +journalctl _SYSTEMD_INVOCATION_ID="$(systemctl show --value --property=InvocationID netdata)" --namespace=netdata --grep elasticsearch +``` + +#### System without systemd + +Locate the collector log file, typically at `/var/log/netdata/collector.log`, and use `grep` to filter for collector's name: + +```bash +grep elasticsearch /var/log/netdata/collector.log +``` + +**Note**: This method shows logs from all restarts. Focus on the **latest entries** for troubleshooting current issues. + +#### Docker Container + +If your Netdata runs in a Docker container named "netdata" (replace if different), use this command: + +```bash +docker logs netdata 2>&1 | grep elasticsearch +``` + diff --git a/src/go/collectors/go.d.plugin/modules/elasticsearch/metadata.yaml b/src/go/plugin/go.d/modules/elasticsearch/metadata.yaml index 9ee892948..9ee892948 100644 --- a/src/go/collectors/go.d.plugin/modules/elasticsearch/metadata.yaml +++ b/src/go/plugin/go.d/modules/elasticsearch/metadata.yaml diff --git a/src/go/collectors/go.d.plugin/modules/elasticsearch/metrics.go b/src/go/plugin/go.d/modules/elasticsearch/metrics.go index e838dc643..e838dc643 100644 --- a/src/go/collectors/go.d.plugin/modules/elasticsearch/metrics.go +++ b/src/go/plugin/go.d/modules/elasticsearch/metrics.go diff --git a/src/go/collectors/go.d.plugin/modules/elasticsearch/testdata/config.json b/src/go/plugin/go.d/modules/elasticsearch/testdata/config.json index a456d1d56..a456d1d56 100644 --- a/src/go/collectors/go.d.plugin/modules/elasticsearch/testdata/config.json +++ b/src/go/plugin/go.d/modules/elasticsearch/testdata/config.json diff --git a/src/go/collectors/go.d.plugin/modules/elasticsearch/testdata/config.yaml b/src/go/plugin/go.d/modules/elasticsearch/testdata/config.yaml index af1b4a136..af1b4a136 100644 --- a/src/go/collectors/go.d.plugin/modules/elasticsearch/testdata/config.yaml +++ b/src/go/plugin/go.d/modules/elasticsearch/testdata/config.yaml diff --git a/src/go/collectors/go.d.plugin/modules/elasticsearch/testdata/v8.4.2/cat_indices_stats.json b/src/go/plugin/go.d/modules/elasticsearch/testdata/v8.4.2/cat_indices_stats.json index f46794cc4..f46794cc4 100644 --- a/src/go/collectors/go.d.plugin/modules/elasticsearch/testdata/v8.4.2/cat_indices_stats.json +++ b/src/go/plugin/go.d/modules/elasticsearch/testdata/v8.4.2/cat_indices_stats.json diff --git a/src/go/collectors/go.d.plugin/modules/elasticsearch/testdata/v8.4.2/cluster_health.json b/src/go/plugin/go.d/modules/elasticsearch/testdata/v8.4.2/cluster_health.json index 0fdc0de49..0fdc0de49 100644 --- a/src/go/collectors/go.d.plugin/modules/elasticsearch/testdata/v8.4.2/cluster_health.json +++ b/src/go/plugin/go.d/modules/elasticsearch/testdata/v8.4.2/cluster_health.json diff --git a/src/go/collectors/go.d.plugin/modules/elasticsearch/testdata/v8.4.2/cluster_stats.json b/src/go/plugin/go.d/modules/elasticsearch/testdata/v8.4.2/cluster_stats.json index 53bea1b34..53bea1b34 100644 --- a/src/go/collectors/go.d.plugin/modules/elasticsearch/testdata/v8.4.2/cluster_stats.json +++ b/src/go/plugin/go.d/modules/elasticsearch/testdata/v8.4.2/cluster_stats.json diff --git a/src/go/collectors/go.d.plugin/modules/elasticsearch/testdata/v8.4.2/info.json b/src/go/plugin/go.d/modules/elasticsearch/testdata/v8.4.2/info.json index 23e3f1596..23e3f1596 100644 --- a/src/go/collectors/go.d.plugin/modules/elasticsearch/testdata/v8.4.2/info.json +++ b/src/go/plugin/go.d/modules/elasticsearch/testdata/v8.4.2/info.json diff --git a/src/go/collectors/go.d.plugin/modules/elasticsearch/testdata/v8.4.2/nodes_local_stats.json b/src/go/plugin/go.d/modules/elasticsearch/testdata/v8.4.2/nodes_local_stats.json index 77e0ad0ba..77e0ad0ba 100644 --- a/src/go/collectors/go.d.plugin/modules/elasticsearch/testdata/v8.4.2/nodes_local_stats.json +++ b/src/go/plugin/go.d/modules/elasticsearch/testdata/v8.4.2/nodes_local_stats.json diff --git a/src/go/collectors/go.d.plugin/modules/elasticsearch/testdata/v8.4.2/nodes_stats.json b/src/go/plugin/go.d/modules/elasticsearch/testdata/v8.4.2/nodes_stats.json index 6e6b21b91..6e6b21b91 100644 --- a/src/go/collectors/go.d.plugin/modules/elasticsearch/testdata/v8.4.2/nodes_stats.json +++ b/src/go/plugin/go.d/modules/elasticsearch/testdata/v8.4.2/nodes_stats.json diff --git a/src/go/collectors/go.d.plugin/modules/envoy/README.md b/src/go/plugin/go.d/modules/envoy/README.md index a0d3a2a2c..a0d3a2a2c 120000 --- a/src/go/collectors/go.d.plugin/modules/envoy/README.md +++ b/src/go/plugin/go.d/modules/envoy/README.md diff --git a/src/go/collectors/go.d.plugin/modules/envoy/charts.go b/src/go/plugin/go.d/modules/envoy/charts.go index 0f6d71655..3abe10e42 100644 --- a/src/go/collectors/go.d.plugin/modules/envoy/charts.go +++ b/src/go/plugin/go.d/modules/envoy/charts.go @@ -6,7 +6,7 @@ import ( "fmt" "strings" - "github.com/netdata/netdata/go/go.d.plugin/agent/module" + "github.com/netdata/netdata/go/plugins/plugin/go.d/agent/module" "github.com/prometheus/prometheus/model/labels" ) diff --git a/src/go/collectors/go.d.plugin/modules/envoy/collect.go b/src/go/plugin/go.d/modules/envoy/collect.go index a7c74379d..922e466d3 100644 --- a/src/go/collectors/go.d.plugin/modules/envoy/collect.go +++ b/src/go/plugin/go.d/modules/envoy/collect.go @@ -6,7 +6,7 @@ import ( "strconv" "strings" - "github.com/netdata/netdata/go/go.d.plugin/pkg/prometheus" + "github.com/netdata/netdata/go/plugins/plugin/go.d/pkg/prometheus" "github.com/prometheus/prometheus/model/labels" ) diff --git a/src/go/collectors/go.d.plugin/modules/envoy/config_schema.json b/src/go/plugin/go.d/modules/envoy/config_schema.json index edcb67994..7073337dd 100644 --- a/src/go/collectors/go.d.plugin/modules/envoy/config_schema.json +++ b/src/go/plugin/go.d/modules/envoy/config_schema.json @@ -167,6 +167,12 @@ "timeout": { "ui:help": "Accepts decimals for precise control (e.g., type 1.5 for 1.5 seconds)." }, + "username": { + "ui:widget": "password" + }, + "proxy_username": { + "ui:widget": "password" + }, "password": { "ui:widget": "password" }, diff --git a/src/go/collectors/go.d.plugin/modules/envoy/envoy.go b/src/go/plugin/go.d/modules/envoy/envoy.go index 5bdfa3b00..194acf17f 100644 --- a/src/go/collectors/go.d.plugin/modules/envoy/envoy.go +++ b/src/go/plugin/go.d/modules/envoy/envoy.go @@ -7,9 +7,9 @@ import ( "errors" "time" - "github.com/netdata/netdata/go/go.d.plugin/agent/module" - "github.com/netdata/netdata/go/go.d.plugin/pkg/prometheus" - "github.com/netdata/netdata/go/go.d.plugin/pkg/web" + "github.com/netdata/netdata/go/plugins/plugin/go.d/agent/module" + "github.com/netdata/netdata/go/plugins/plugin/go.d/pkg/prometheus" + "github.com/netdata/netdata/go/plugins/plugin/go.d/pkg/web" ) //go:embed "config_schema.json" diff --git a/src/go/collectors/go.d.plugin/modules/envoy/envoy_test.go b/src/go/plugin/go.d/modules/envoy/envoy_test.go index 9a705009e..cbda31f9a 100644 --- a/src/go/collectors/go.d.plugin/modules/envoy/envoy_test.go +++ b/src/go/plugin/go.d/modules/envoy/envoy_test.go @@ -3,13 +3,13 @@ package envoy import ( - "github.com/netdata/netdata/go/go.d.plugin/agent/module" + "github.com/netdata/netdata/go/plugins/plugin/go.d/agent/module" "net/http" "net/http/httptest" "os" "testing" - "github.com/netdata/netdata/go/go.d.plugin/pkg/web" + "github.com/netdata/netdata/go/plugins/plugin/go.d/pkg/web" "github.com/stretchr/testify/assert" "github.com/stretchr/testify/require" diff --git a/src/go/collectors/go.d.plugin/modules/envoy/init.go b/src/go/plugin/go.d/modules/envoy/init.go index 0ce89c8bc..8eba65d95 100644 --- a/src/go/collectors/go.d.plugin/modules/envoy/init.go +++ b/src/go/plugin/go.d/modules/envoy/init.go @@ -5,8 +5,8 @@ package envoy import ( "errors" - "github.com/netdata/netdata/go/go.d.plugin/pkg/prometheus" - "github.com/netdata/netdata/go/go.d.plugin/pkg/web" + "github.com/netdata/netdata/go/plugins/plugin/go.d/pkg/prometheus" + "github.com/netdata/netdata/go/plugins/plugin/go.d/pkg/web" ) func (e *Envoy) validateConfig() error { diff --git a/src/go/collectors/go.d.plugin/modules/envoy/integrations/envoy.md b/src/go/plugin/go.d/modules/envoy/integrations/envoy.md index 943c1afb7..3865ca529 100644 --- a/src/go/collectors/go.d.plugin/modules/envoy/integrations/envoy.md +++ b/src/go/plugin/go.d/modules/envoy/integrations/envoy.md @@ -1,6 +1,6 @@ <!--startmeta -custom_edit_url: "https://github.com/netdata/netdata/edit/master/src/go/collectors/go.d.plugin/modules/envoy/README.md" -meta_yaml: "https://github.com/netdata/netdata/edit/master/src/go/collectors/go.d.plugin/modules/envoy/metadata.yaml" +custom_edit_url: "https://github.com/netdata/netdata/edit/master/src/go/plugin/go.d/modules/envoy/README.md" +meta_yaml: "https://github.com/netdata/netdata/edit/master/src/go/plugin/go.d/modules/envoy/metadata.yaml" sidebar_label: "Envoy" learn_status: "Published" learn_rel_path: "Collecting Metrics/Web Servers and Web Proxies" @@ -246,6 +246,8 @@ jobs: ### Debug Mode +**Important**: Debug mode is not supported for data collection jobs created via the UI using the Dyncfg feature. + To troubleshoot issues with the `envoy` collector, run the `go.d.plugin` with the debug option enabled. The output should give you clues as to why the collector isn't working. @@ -268,4 +270,37 @@ should give you clues as to why the collector isn't working. ./go.d.plugin -d -m envoy ``` +### Getting Logs + +If you're encountering problems with the `envoy` collector, follow these steps to retrieve logs and identify potential issues: + +- **Run the command** specific to your system (systemd, non-systemd, or Docker container). +- **Examine the output** for any warnings or error messages that might indicate issues. These messages should provide clues about the root cause of the problem. + +#### System with systemd + +Use the following command to view logs generated since the last Netdata service restart: + +```bash +journalctl _SYSTEMD_INVOCATION_ID="$(systemctl show --value --property=InvocationID netdata)" --namespace=netdata --grep envoy +``` + +#### System without systemd + +Locate the collector log file, typically at `/var/log/netdata/collector.log`, and use `grep` to filter for collector's name: + +```bash +grep envoy /var/log/netdata/collector.log +``` + +**Note**: This method shows logs from all restarts. Focus on the **latest entries** for troubleshooting current issues. + +#### Docker Container + +If your Netdata runs in a Docker container named "netdata" (replace if different), use this command: + +```bash +docker logs netdata 2>&1 | grep envoy +``` + diff --git a/src/go/collectors/go.d.plugin/modules/envoy/metadata.yaml b/src/go/plugin/go.d/modules/envoy/metadata.yaml index def9e726a..def9e726a 100644 --- a/src/go/collectors/go.d.plugin/modules/envoy/metadata.yaml +++ b/src/go/plugin/go.d/modules/envoy/metadata.yaml diff --git a/src/go/collectors/go.d.plugin/modules/envoy/testdata/config.json b/src/go/plugin/go.d/modules/envoy/testdata/config.json index 984c3ed6e..984c3ed6e 100644 --- a/src/go/collectors/go.d.plugin/modules/envoy/testdata/config.json +++ b/src/go/plugin/go.d/modules/envoy/testdata/config.json diff --git a/src/go/collectors/go.d.plugin/modules/envoy/testdata/config.yaml b/src/go/plugin/go.d/modules/envoy/testdata/config.yaml index 8558b61cc..8558b61cc 100644 --- a/src/go/collectors/go.d.plugin/modules/envoy/testdata/config.yaml +++ b/src/go/plugin/go.d/modules/envoy/testdata/config.yaml diff --git a/src/go/collectors/go.d.plugin/modules/envoy/testdata/consul-dataplane.txt b/src/go/plugin/go.d/modules/envoy/testdata/consul-dataplane.txt index 2dbb91856..2dbb91856 100644 --- a/src/go/collectors/go.d.plugin/modules/envoy/testdata/consul-dataplane.txt +++ b/src/go/plugin/go.d/modules/envoy/testdata/consul-dataplane.txt diff --git a/src/go/collectors/go.d.plugin/modules/envoy/testdata/envoy.txt b/src/go/plugin/go.d/modules/envoy/testdata/envoy.txt index 1102c4c0d..1102c4c0d 100644 --- a/src/go/collectors/go.d.plugin/modules/envoy/testdata/envoy.txt +++ b/src/go/plugin/go.d/modules/envoy/testdata/envoy.txt diff --git a/src/go/collectors/go.d.plugin/modules/example/README.md b/src/go/plugin/go.d/modules/example/README.md index 01eb34eb5..934dfd108 100644 --- a/src/go/collectors/go.d.plugin/modules/example/README.md +++ b/src/go/plugin/go.d/modules/example/README.md @@ -27,7 +27,7 @@ sudo ./edit-config go.d/example.conf ``` Disabled by default. Should be explicitly enabled -in [go.d.conf](https://github.com/netdata/netdata/blob/master/src/go/collectors/go.d.plugin/config/go.d.conf). +in [go.d.conf](https://github.com/netdata/netdata/blob/master/src/go/plugin/go.d/config/go.d.conf). ```yaml # go.d.conf @@ -53,7 +53,7 @@ jobs: --- For all available options, see the Example -collector's [configuration file](https://github.com/netdata/netdata/blob/master/src/go/collectors/go.d.plugin/config/go.d/example.conf). +collector's [configuration file](https://github.com/netdata/netdata/blob/master/src/go/plugin/go.d/config/go.d/example.conf). ## Troubleshooting diff --git a/src/go/collectors/go.d.plugin/modules/example/charts.go b/src/go/plugin/go.d/modules/example/charts.go index d3973a99d..71ecafdb4 100644 --- a/src/go/collectors/go.d.plugin/modules/example/charts.go +++ b/src/go/plugin/go.d/modules/example/charts.go @@ -4,7 +4,7 @@ package example import ( "fmt" - "github.com/netdata/netdata/go/go.d.plugin/agent/module" + "github.com/netdata/netdata/go/plugins/plugin/go.d/agent/module" ) var chartTemplate = module.Chart{ diff --git a/src/go/collectors/go.d.plugin/modules/example/collect.go b/src/go/plugin/go.d/modules/example/collect.go index 588d605df..b72d3c252 100644 --- a/src/go/collectors/go.d.plugin/modules/example/collect.go +++ b/src/go/plugin/go.d/modules/example/collect.go @@ -5,7 +5,7 @@ package example import ( "fmt" - "github.com/netdata/netdata/go/go.d.plugin/agent/module" + "github.com/netdata/netdata/go/plugins/plugin/go.d/agent/module" ) func (e *Example) collect() (map[string]int64, error) { diff --git a/src/go/collectors/go.d.plugin/modules/example/config_schema.json b/src/go/plugin/go.d/modules/example/config_schema.json index 328773f6d..328773f6d 100644 --- a/src/go/collectors/go.d.plugin/modules/example/config_schema.json +++ b/src/go/plugin/go.d/modules/example/config_schema.json diff --git a/src/go/collectors/go.d.plugin/modules/example/example.go b/src/go/plugin/go.d/modules/example/example.go index 433bf1ff6..2ca0ad976 100644 --- a/src/go/collectors/go.d.plugin/modules/example/example.go +++ b/src/go/plugin/go.d/modules/example/example.go @@ -6,7 +6,7 @@ import ( _ "embed" "math/rand" - "github.com/netdata/netdata/go/go.d.plugin/agent/module" + "github.com/netdata/netdata/go/plugins/plugin/go.d/agent/module" ) //go:embed "config_schema.json" diff --git a/src/go/collectors/go.d.plugin/modules/example/example_test.go b/src/go/plugin/go.d/modules/example/example_test.go index 6fde9b649..26b3ec9c8 100644 --- a/src/go/collectors/go.d.plugin/modules/example/example_test.go +++ b/src/go/plugin/go.d/modules/example/example_test.go @@ -6,7 +6,7 @@ import ( "os" "testing" - "github.com/netdata/netdata/go/go.d.plugin/agent/module" + "github.com/netdata/netdata/go/plugins/plugin/go.d/agent/module" "github.com/stretchr/testify/assert" "github.com/stretchr/testify/require" diff --git a/src/go/collectors/go.d.plugin/modules/example/init.go b/src/go/plugin/go.d/modules/example/init.go index 6ee39ef4f..f159c4b53 100644 --- a/src/go/collectors/go.d.plugin/modules/example/init.go +++ b/src/go/plugin/go.d/modules/example/init.go @@ -4,7 +4,7 @@ package example import ( "errors" - "github.com/netdata/netdata/go/go.d.plugin/agent/module" + "github.com/netdata/netdata/go/plugins/plugin/go.d/agent/module" ) func (e *Example) validateConfig() error { diff --git a/src/go/collectors/go.d.plugin/modules/example/testdata/config.json b/src/go/plugin/go.d/modules/example/testdata/config.json index af06e85ac..af06e85ac 100644 --- a/src/go/collectors/go.d.plugin/modules/example/testdata/config.json +++ b/src/go/plugin/go.d/modules/example/testdata/config.json diff --git a/src/go/collectors/go.d.plugin/modules/example/testdata/config.yaml b/src/go/plugin/go.d/modules/example/testdata/config.yaml index a5f6556fd..a5f6556fd 100644 --- a/src/go/collectors/go.d.plugin/modules/example/testdata/config.yaml +++ b/src/go/plugin/go.d/modules/example/testdata/config.yaml diff --git a/src/collectors/python.d.plugin/exim/README.md b/src/go/plugin/go.d/modules/exim/README.md index f1f2ef9f9..f1f2ef9f9 120000 --- a/src/collectors/python.d.plugin/exim/README.md +++ b/src/go/plugin/go.d/modules/exim/README.md diff --git a/src/go/plugin/go.d/modules/exim/charts.go b/src/go/plugin/go.d/modules/exim/charts.go new file mode 100644 index 000000000..f09faf1d0 --- /dev/null +++ b/src/go/plugin/go.d/modules/exim/charts.go @@ -0,0 +1,27 @@ +// SPDX-License-Identifier: GPL-3.0-or-later + +package exim + +import ( + "github.com/netdata/netdata/go/plugins/plugin/go.d/agent/module" +) + +const ( + prioQueueEmailsCount = module.Priority + iota +) + +var charts = module.Charts{ + queueEmailsCountChart.Copy(), +} + +var queueEmailsCountChart = module.Chart{ + ID: "qemails", + Title: "Exim Queue Emails", + Units: "emails", + Fam: "queue", + Ctx: "exim.qemails", + Priority: prioQueueEmailsCount, + Dims: module.Dims{ + {ID: "emails"}, + }, +} diff --git a/src/go/plugin/go.d/modules/exim/collect.go b/src/go/plugin/go.d/modules/exim/collect.go new file mode 100644 index 000000000..ce1a34729 --- /dev/null +++ b/src/go/plugin/go.d/modules/exim/collect.go @@ -0,0 +1,43 @@ +// SPDX-License-Identifier: GPL-3.0-or-later + +package exim + +import ( + "bufio" + "bytes" + "fmt" + "strconv" + "strings" +) + +func (e *Exim) collect() (map[string]int64, error) { + resp, err := e.exec.countMessagesInQueue() + if err != nil { + return nil, err + } + + emails, err := parseResponse(resp) + if err != nil { + return nil, err + } + + mx := map[string]int64{ + "emails": emails, + } + + return mx, nil +} + +func parseResponse(resp []byte) (int64, error) { + sc := bufio.NewScanner(bytes.NewReader(resp)) + sc.Scan() + + line := strings.TrimSpace(sc.Text()) + + emails, err := strconv.ParseInt(line, 10, 64) + if err != nil { + return 0, fmt.Errorf("invalid response '%s': %v", line, err) + } + + return emails, nil +} diff --git a/src/go/plugin/go.d/modules/exim/config_schema.json b/src/go/plugin/go.d/modules/exim/config_schema.json new file mode 100644 index 000000000..6561ea34f --- /dev/null +++ b/src/go/plugin/go.d/modules/exim/config_schema.json @@ -0,0 +1,35 @@ +{ + "jsonSchema": { + "$schema": "http://json-schema.org/draft-07/schema#", + "title": "Exim collector configuration.", + "type": "object", + "properties": { + "update_every": { + "title": "Update every", + "description": "Data collection interval, measured in seconds.", + "type": "integer", + "minimum": 1, + "default": 10 + }, + "timeout": { + "title": "Timeout", + "description": "Timeout for executing the binary, specified in seconds.", + "type": "number", + "minimum": 0.5, + "default": 2 + } + }, + "additionalProperties": false, + "patternProperties": { + "^name$": {} + } + }, + "uiSchema": { + "uiOptions": { + "fullPage": true + }, + "timeout": { + "ui:help": "Accepts decimals for precise control (e.g., type 1.5 for 1.5 seconds)." + } + } +} diff --git a/src/go/plugin/go.d/modules/exim/exec.go b/src/go/plugin/go.d/modules/exim/exec.go new file mode 100644 index 000000000..241c72aca --- /dev/null +++ b/src/go/plugin/go.d/modules/exim/exec.go @@ -0,0 +1,47 @@ +// SPDX-License-Identifier: GPL-3.0-or-later + +package exim + +import ( + "context" + "fmt" + "os/exec" + "time" + + "github.com/netdata/netdata/go/plugins/logger" +) + +type eximBinary interface { + countMessagesInQueue() ([]byte, error) +} + +func newEximExec(ndsudoPath string, timeout time.Duration, log *logger.Logger) *eximExec { + return &eximExec{ + Logger: log, + ndsudoPath: ndsudoPath, + timeout: timeout, + } +} + +type eximExec struct { + *logger.Logger + + ndsudoPath string + timeout time.Duration +} + +func (e *eximExec) countMessagesInQueue() ([]byte, error) { + ctx, cancel := context.WithTimeout(context.Background(), e.timeout) + defer cancel() + + cmd := exec.CommandContext(ctx, e.ndsudoPath, "exim-bpc") + + e.Debugf("executing '%s'", cmd) + + bs, err := cmd.Output() + if err != nil { + return nil, fmt.Errorf("error on '%s': %v", cmd, err) + } + + return bs, nil +} diff --git a/src/go/plugin/go.d/modules/exim/exim.go b/src/go/plugin/go.d/modules/exim/exim.go new file mode 100644 index 000000000..f3c3e6e78 --- /dev/null +++ b/src/go/plugin/go.d/modules/exim/exim.go @@ -0,0 +1,97 @@ +// SPDX-License-Identifier: GPL-3.0-or-later + +package exim + +import ( + _ "embed" + "errors" + "time" + + "github.com/netdata/netdata/go/plugins/plugin/go.d/agent/module" + "github.com/netdata/netdata/go/plugins/plugin/go.d/pkg/web" +) + +//go:embed "config_schema.json" +var configSchema string + +func init() { + module.Register("exim", module.Creator{ + JobConfigSchema: configSchema, + Defaults: module.Defaults{ + UpdateEvery: 10, + }, + Create: func() module.Module { return New() }, + Config: func() any { return &Config{} }, + }) +} + +func New() *Exim { + return &Exim{ + Config: Config{ + Timeout: web.Duration(time.Second * 2), + }, + charts: charts.Copy(), + } +} + +type Config struct { + UpdateEvery int `yaml:"update_every,omitempty" json:"update_every"` + Timeout web.Duration `yaml:"timeout,omitempty" json:"timeout"` +} + +type Exim struct { + module.Base + Config `yaml:",inline" json:""` + + charts *module.Charts + + exec eximBinary +} + +func (e *Exim) Configuration() any { + return e.Config +} + +func (e *Exim) Init() error { + exim, err := e.initEximExec() + if err != nil { + e.Errorf("exim exec initialization: %v", err) + return err + } + e.exec = exim + + return nil +} + +func (e *Exim) Check() error { + mx, err := e.collect() + if err != nil { + e.Error(err) + return err + } + + if len(mx) == 0 { + return errors.New("no metrics collected") + } + + return nil +} + +func (e *Exim) Charts() *module.Charts { + return e.charts +} + +func (e *Exim) Collect() map[string]int64 { + mx, err := e.collect() + if err != nil { + e.Error(err) + } + + if len(mx) == 0 { + return nil + } + + return mx +} + +func (e *Exim) Cleanup() {} diff --git a/src/go/plugin/go.d/modules/exim/exim_test.go b/src/go/plugin/go.d/modules/exim/exim_test.go new file mode 100644 index 000000000..16eb025e1 --- /dev/null +++ b/src/go/plugin/go.d/modules/exim/exim_test.go @@ -0,0 +1,217 @@ +// SPDX-License-Identifier: GPL-3.0-or-later + +package exim + +import ( + "errors" + "os" + "testing" + + "github.com/netdata/netdata/go/plugins/plugin/go.d/agent/module" + + "github.com/stretchr/testify/assert" + "github.com/stretchr/testify/require" +) + +var ( + dataConfigJSON, _ = os.ReadFile("testdata/config.json") + dataConfigYAML, _ = os.ReadFile("testdata/config.yaml") +) + +func Test_testDataIsValid(t *testing.T) { + for name, data := range map[string][]byte{ + "dataConfigJSON": dataConfigJSON, + "dataConfigYAML": dataConfigYAML, + } { + require.NotNil(t, data, name) + + } +} + +func TestExim_Configuration(t *testing.T) { + module.TestConfigurationSerialize(t, &Exim{}, dataConfigJSON, dataConfigYAML) +} + +func TestExim_Init(t *testing.T) { + tests := map[string]struct { + config Config + wantFail bool + }{ + "fails if failed to locate ndsudo": { + wantFail: true, + config: New().Config, + }, + } + + for name, test := range tests { + t.Run(name, func(t *testing.T) { + exim := New() + exim.Config = test.config + + if test.wantFail { + assert.Error(t, exim.Init()) + } else { + assert.NoError(t, exim.Init()) + } + }) + } +} + +func TestExim_Cleanup(t *testing.T) { + tests := map[string]struct { + prepare func() *Exim + }{ + "not initialized exec": { + prepare: func() *Exim { + return New() + }, + }, + "after check": { + prepare: func() *Exim { + exim := New() + exim.exec = prepareMockOK() + _ = exim.Check() + return exim + }, + }, + "after collect": { + prepare: func() *Exim { + exim := New() + exim.exec = prepareMockOK() + _ = exim.Collect() + return exim + }, + }, + } + + for name, test := range tests { + t.Run(name, func(t *testing.T) { + exim := test.prepare() + + assert.NotPanics(t, exim.Cleanup) + }) + } +} + +func TestEximCharts(t *testing.T) { + assert.NotNil(t, New().Charts()) +} + +func TestExim_Check(t *testing.T) { + tests := map[string]struct { + prepareMock func() *mockEximExec + wantFail bool + }{ + "success case": { + prepareMock: prepareMockOK, + wantFail: false, + }, + "error on exec": { + prepareMock: prepareMockErr, + wantFail: true, + }, + "empty response": { + prepareMock: prepareMockEmptyResponse, + wantFail: true, + }, + "unexpected response": { + prepareMock: prepareMockUnexpectedResponse, + wantFail: true, + }, + } + + for name, test := range tests { + t.Run(name, func(t *testing.T) { + exim := New() + mock := test.prepareMock() + exim.exec = mock + + if test.wantFail { + assert.Error(t, exim.Check()) + } else { + assert.NoError(t, exim.Check()) + } + }) + } +} + +func TestExim_Collect(t *testing.T) { + tests := map[string]struct { + prepareMock func() *mockEximExec + wantMetrics map[string]int64 + }{ + "success case": { + prepareMock: prepareMockOK, + wantMetrics: map[string]int64{ + "emails": 99, + }, + }, + "error on exec": { + prepareMock: prepareMockErr, + wantMetrics: nil, + }, + "empty response": { + prepareMock: prepareMockEmptyResponse, + wantMetrics: nil, + }, + "unexpected response": { + prepareMock: prepareMockUnexpectedResponse, + wantMetrics: nil, + }, + } + + for name, test := range tests { + t.Run(name, func(t *testing.T) { + exim := New() + mock := test.prepareMock() + exim.exec = mock + + mx := exim.Collect() + + assert.Equal(t, test.wantMetrics, mx) + + if len(test.wantMetrics) > 0 { + assert.Len(t, *exim.Charts(), len(charts)) + module.TestMetricsHasAllChartsDims(t, exim.Charts(), mx) + } + }) + } +} + +func prepareMockOK() *mockEximExec { + return &mockEximExec{ + data: []byte("99"), + } +} + +func prepareMockErr() *mockEximExec { + return &mockEximExec{ + err: true, + } +} + +func prepareMockEmptyResponse() *mockEximExec { + return &mockEximExec{} +} + +func prepareMockUnexpectedResponse() *mockEximExec { + return &mockEximExec{ + data: []byte(` +Lorem ipsum dolor sit amet, consectetur adipiscing elit. +Nulla malesuada erat id magna mattis, eu viverra tellus rhoncus. +Fusce et felis pulvinar, posuere sem non, porttitor eros. +`), + } +} + +type mockEximExec struct { + err bool + data []byte +} + +func (m *mockEximExec) countMessagesInQueue() ([]byte, error) { + if m.err { + return nil, errors.New("mock.countMessagesInQueue() error") + } + return m.data, nil +} diff --git a/src/go/plugin/go.d/modules/exim/init.go b/src/go/plugin/go.d/modules/exim/init.go new file mode 100644 index 000000000..d1d5c0793 --- /dev/null +++ b/src/go/plugin/go.d/modules/exim/init.go @@ -0,0 +1,23 @@ +// SPDX-License-Identifier: GPL-3.0-or-later + +package exim + +import ( + "fmt" + "os" + "path/filepath" + + "github.com/netdata/netdata/go/plugins/pkg/executable" +) + +func (e *Exim) initEximExec() (eximBinary, error) { + ndsudoPath := filepath.Join(executable.Directory, "ndsudo") + if _, err := os.Stat(ndsudoPath); err != nil { + return nil, fmt.Errorf("ndsudo executable not found: %v", err) + + } + + exim := newEximExec(ndsudoPath, e.Timeout.Duration(), e.Logger) + + return exim, nil +} diff --git a/src/go/plugin/go.d/modules/exim/integrations/exim.md b/src/go/plugin/go.d/modules/exim/integrations/exim.md new file mode 100644 index 000000000..78f45683c --- /dev/null +++ b/src/go/plugin/go.d/modules/exim/integrations/exim.md @@ -0,0 +1,191 @@ +<!--startmeta +custom_edit_url: "https://github.com/netdata/netdata/edit/master/src/go/plugin/go.d/modules/exim/README.md" +meta_yaml: "https://github.com/netdata/netdata/edit/master/src/go/plugin/go.d/modules/exim/metadata.yaml" +sidebar_label: "Exim" +learn_status: "Published" +learn_rel_path: "Collecting Metrics/Mail Servers" +most_popular: False +message: "DO NOT EDIT THIS FILE DIRECTLY, IT IS GENERATED BY THE COLLECTOR'S metadata.yaml FILE" +endmeta--> + +# Exim + + +<img src="https://netdata.cloud/img/exim.jpg" width="150"/> + + +Plugin: go.d.plugin +Module: exim + +<img src="https://img.shields.io/badge/maintained%20by-Netdata-%2300ab44" /> + +## Overview + +This collector monitors Exim mail queue. It relies on the [`exim`](https://www.exim.org/exim-html-3.20/doc/html/spec_5.html) CLI tool but avoids directly executing the binary. Instead, it utilizes `ndsudo`, a Netdata helper specifically designed to run privileged commands securely within the Netdata environment. This approach eliminates the need to use `sudo`, improving security and potentially simplifying permission management. +Executed commands: +- `exim -bpc` + + + + +This collector is supported on all platforms. + +This collector only supports collecting metrics from a single instance of this integration. + + +### Default Behavior + +#### Auto-Detection + +This integration doesn't support auto-detection. + +#### Limits + +The default configuration for this integration does not impose any limits on data collection. + +#### Performance Impact + +The default configuration for this integration is not expected to impose a significant performance impact on the system. + + +## Metrics + +Metrics grouped by *scope*. + +The scope defines the instance that the metric belongs to. An instance is uniquely identified by a set of labels. + + + +### Per Exim instance + +These metrics refer to the the entire monitored application. + +This scope has no labels. + +Metrics: + +| Metric | Dimensions | Unit | +|:------|:----------|:----| +| exim.qemails | emails | emails | + + + +## Alerts + +There are no alerts configured by default for this integration. + + +## Setup + +### Prerequisites + +No action required. + +### Configuration + +#### File + +The configuration file name for this integration is `go.d/exim.conf`. + + +You can edit the configuration file using the `edit-config` script from the +Netdata [config directory](/docs/netdata-agent/configuration/README.md#the-netdata-config-directory). + +```bash +cd /etc/netdata 2>/dev/null || cd /opt/netdata/etc/netdata +sudo ./edit-config go.d/exim.conf +``` +#### Options + +The following options can be defined globally: update_every. + + +<details open><summary>Config options</summary> + +| Name | Description | Default | Required | +|:----|:-----------|:-------|:--------:| +| update_every | Data collection frequency. | 10 | no | +| timeout | exim binary execution timeout. | 2 | no | + +</details> + +#### Examples + +##### Custom update_every + +Allows you to override the default data collection interval. + +<details open><summary>Config</summary> + +```yaml +jobs: + - name: exim + update_every: 5 # Collect logical volume statistics every 5 seconds + +``` +</details> + + + +## Troubleshooting + +### Debug Mode + +**Important**: Debug mode is not supported for data collection jobs created via the UI using the Dyncfg feature. + +To troubleshoot issues with the `exim` collector, run the `go.d.plugin` with the debug option enabled. The output +should give you clues as to why the collector isn't working. + +- Navigate to the `plugins.d` directory, usually at `/usr/libexec/netdata/plugins.d/`. If that's not the case on + your system, open `netdata.conf` and look for the `plugins` setting under `[directories]`. + + ```bash + cd /usr/libexec/netdata/plugins.d/ + ``` + +- Switch to the `netdata` user. + + ```bash + sudo -u netdata -s + ``` + +- Run the `go.d.plugin` to debug the collector: + + ```bash + ./go.d.plugin -d -m exim + ``` + +### Getting Logs + +If you're encountering problems with the `exim` collector, follow these steps to retrieve logs and identify potential issues: + +- **Run the command** specific to your system (systemd, non-systemd, or Docker container). +- **Examine the output** for any warnings or error messages that might indicate issues. These messages should provide clues about the root cause of the problem. + +#### System with systemd + +Use the following command to view logs generated since the last Netdata service restart: + +```bash +journalctl _SYSTEMD_INVOCATION_ID="$(systemctl show --value --property=InvocationID netdata)" --namespace=netdata --grep exim +``` + +#### System without systemd + +Locate the collector log file, typically at `/var/log/netdata/collector.log`, and use `grep` to filter for collector's name: + +```bash +grep exim /var/log/netdata/collector.log +``` + +**Note**: This method shows logs from all restarts. Focus on the **latest entries** for troubleshooting current issues. + +#### Docker Container + +If your Netdata runs in a Docker container named "netdata" (replace if different), use this command: + +```bash +docker logs netdata 2>&1 | grep exim +``` + + diff --git a/src/go/plugin/go.d/modules/exim/metadata.yaml b/src/go/plugin/go.d/modules/exim/metadata.yaml new file mode 100644 index 000000000..c7f4a7a98 --- /dev/null +++ b/src/go/plugin/go.d/modules/exim/metadata.yaml @@ -0,0 +1,100 @@ +plugin_name: go.d.plugin +modules: + - meta: + id: collector-go.d.plugin-exim + plugin_name: go.d.plugin + module_name: exim + monitored_instance: + name: Exim + link: "https://www.exim.org/" + icon_filename: 'exim.jpg' + categories: + - data-collection.mail-servers + keywords: + - exim + - mail + - email + related_resources: + integrations: + list: [] + info_provided_to_referring_integrations: + description: "" + most_popular: false + overview: + data_collection: + metrics_description: > + This collector monitors Exim mail queue. + It relies on the [`exim`](https://www.exim.org/exim-html-3.20/doc/html/spec_5.html) CLI tool but avoids directly executing the binary. + Instead, it utilizes `ndsudo`, a Netdata helper specifically designed to run privileged commands securely within the Netdata environment. + This approach eliminates the need to use `sudo`, improving security and potentially simplifying permission management. + + Executed commands: + + - `exim -bpc` + method_description: "" + supported_platforms: + include: [] + exclude: [] + multi_instance: false + additional_permissions: + description: "" + default_behavior: + auto_detection: + description: "" + limits: + description: "" + performance_impact: + description: "" + setup: + prerequisites: + list: [] + configuration: + file: + name: go.d/exim.conf + options: + description: | + The following options can be defined globally: update_every. + folding: + title: Config options + enabled: true + list: + - name: update_every + description: Data collection frequency. + default_value: 10 + required: false + - name: timeout + description: exim binary execution timeout. + default_value: 2 + required: false + examples: + folding: + title: Config + enabled: true + list: + - name: Custom update_every + description: Allows you to override the default data collection interval. + config: | + jobs: + - name: exim + update_every: 5 # Collect logical volume statistics every 5 seconds + troubleshooting: + problems: + list: [] + alerts: [] + metrics: + folding: + title: Metrics + enabled: false + description: "" + availability: [] + scopes: + - name: global + description: These metrics refer to the the entire monitored application. + labels: [] + metrics: + - name: exim.qemails + description: Exim Queue Emails + unit: 'emails' + chart_type: line + dimensions: + - name: emails diff --git a/src/go/collectors/go.d.plugin/modules/fail2ban/testdata/config.json b/src/go/plugin/go.d/modules/exim/testdata/config.json index 291ecee3d..291ecee3d 100644 --- a/src/go/collectors/go.d.plugin/modules/fail2ban/testdata/config.json +++ b/src/go/plugin/go.d/modules/exim/testdata/config.json diff --git a/src/go/collectors/go.d.plugin/modules/fail2ban/testdata/config.yaml b/src/go/plugin/go.d/modules/exim/testdata/config.yaml index 25b0b4c78..25b0b4c78 100644 --- a/src/go/collectors/go.d.plugin/modules/fail2ban/testdata/config.yaml +++ b/src/go/plugin/go.d/modules/exim/testdata/config.yaml diff --git a/src/go/collectors/go.d.plugin/modules/fail2ban/README.md b/src/go/plugin/go.d/modules/fail2ban/README.md index 642a8bcf5..642a8bcf5 120000 --- a/src/go/collectors/go.d.plugin/modules/fail2ban/README.md +++ b/src/go/plugin/go.d/modules/fail2ban/README.md diff --git a/src/go/collectors/go.d.plugin/modules/fail2ban/charts.go b/src/go/plugin/go.d/modules/fail2ban/charts.go index d203e7864..3015c7388 100644 --- a/src/go/collectors/go.d.plugin/modules/fail2ban/charts.go +++ b/src/go/plugin/go.d/modules/fail2ban/charts.go @@ -6,7 +6,7 @@ import ( "fmt" "strings" - "github.com/netdata/netdata/go/go.d.plugin/agent/module" + "github.com/netdata/netdata/go/plugins/plugin/go.d/agent/module" ) const ( diff --git a/src/go/collectors/go.d.plugin/modules/fail2ban/collect.go b/src/go/plugin/go.d/modules/fail2ban/collect.go index 8ca413c3b..8ca413c3b 100644 --- a/src/go/collectors/go.d.plugin/modules/fail2ban/collect.go +++ b/src/go/plugin/go.d/modules/fail2ban/collect.go diff --git a/src/go/collectors/go.d.plugin/modules/fail2ban/config_schema.json b/src/go/plugin/go.d/modules/fail2ban/config_schema.json index 7fd0d91af..7fd0d91af 100644 --- a/src/go/collectors/go.d.plugin/modules/fail2ban/config_schema.json +++ b/src/go/plugin/go.d/modules/fail2ban/config_schema.json diff --git a/src/go/collectors/go.d.plugin/modules/fail2ban/exec.go b/src/go/plugin/go.d/modules/fail2ban/exec.go index 06b5841e7..b3037a6cf 100644 --- a/src/go/collectors/go.d.plugin/modules/fail2ban/exec.go +++ b/src/go/plugin/go.d/modules/fail2ban/exec.go @@ -6,36 +6,56 @@ import ( "context" "errors" "fmt" + "os" "os/exec" "strings" "time" - "github.com/netdata/netdata/go/go.d.plugin/logger" + "github.com/netdata/netdata/go/plugins/logger" ) var errJailNotExist = errors.New("jail not exist") +const socketPathInDocker = "/host/var/run/fail2ban/fail2ban.sock" + func newFail2BanClientCliExec(ndsudoPath string, timeout time.Duration, log *logger.Logger) *fail2banClientCliExec { + _, err := os.Stat("/host/var/run") + return &fail2banClientCliExec{ - Logger: log, - ndsudoPath: ndsudoPath, - timeout: timeout, + Logger: log, + ndsudoPath: ndsudoPath, + timeout: timeout, + isInsideDocker: err == nil, } } type fail2banClientCliExec struct { *logger.Logger - ndsudoPath string - timeout time.Duration + ndsudoPath string + timeout time.Duration + isInsideDocker bool } func (e *fail2banClientCliExec) status() ([]byte, error) { + if e.isInsideDocker { + return e.execute("fail2ban-client-status-socket", + "--socket_path", socketPathInDocker, + ) + } return e.execute("fail2ban-client-status") } func (e *fail2banClientCliExec) jailStatus(jail string) ([]byte, error) { - return e.execute("fail2ban-client-status-jail", "--jail", jail) + if e.isInsideDocker { + return e.execute("fail2ban-client-status-jail-socket", + "--jail", jail, + "--socket_path", socketPathInDocker, + ) + } + return e.execute("fail2ban-client-status-jail", + "--jail", jail, + ) } func (e *fail2banClientCliExec) execute(args ...string) ([]byte, error) { diff --git a/src/go/collectors/go.d.plugin/modules/fail2ban/fail2ban.go b/src/go/plugin/go.d/modules/fail2ban/fail2ban.go index a97636338..45dcb6e2e 100644 --- a/src/go/collectors/go.d.plugin/modules/fail2ban/fail2ban.go +++ b/src/go/plugin/go.d/modules/fail2ban/fail2ban.go @@ -7,8 +7,8 @@ import ( "errors" "time" - "github.com/netdata/netdata/go/go.d.plugin/agent/module" - "github.com/netdata/netdata/go/go.d.plugin/pkg/web" + "github.com/netdata/netdata/go/plugins/plugin/go.d/agent/module" + "github.com/netdata/netdata/go/plugins/plugin/go.d/pkg/web" ) //go:embed "config_schema.json" diff --git a/src/go/collectors/go.d.plugin/modules/fail2ban/fail2ban_test.go b/src/go/plugin/go.d/modules/fail2ban/fail2ban_test.go index 7d1988bd2..ae84959bd 100644 --- a/src/go/collectors/go.d.plugin/modules/fail2ban/fail2ban_test.go +++ b/src/go/plugin/go.d/modules/fail2ban/fail2ban_test.go @@ -7,7 +7,7 @@ import ( "os" "testing" - "github.com/netdata/netdata/go/go.d.plugin/agent/module" + "github.com/netdata/netdata/go/plugins/plugin/go.d/agent/module" "github.com/stretchr/testify/assert" "github.com/stretchr/testify/require" diff --git a/src/go/collectors/go.d.plugin/modules/fail2ban/init.go b/src/go/plugin/go.d/modules/fail2ban/init.go index 938c9697a..ab963616c 100644 --- a/src/go/collectors/go.d.plugin/modules/fail2ban/init.go +++ b/src/go/plugin/go.d/modules/fail2ban/init.go @@ -7,7 +7,7 @@ import ( "os" "path/filepath" - "github.com/netdata/netdata/go/go.d.plugin/agent/executable" + "github.com/netdata/netdata/go/plugins/pkg/executable" ) func (f *Fail2Ban) initFail2banClientCliExec() (fail2banClientCli, error) { diff --git a/src/go/collectors/go.d.plugin/modules/fail2ban/integrations/fail2ban.md b/src/go/plugin/go.d/modules/fail2ban/integrations/fail2ban.md index 9162b3b42..0b9679256 100644 --- a/src/go/collectors/go.d.plugin/modules/fail2ban/integrations/fail2ban.md +++ b/src/go/plugin/go.d/modules/fail2ban/integrations/fail2ban.md @@ -1,6 +1,6 @@ <!--startmeta -custom_edit_url: "https://github.com/netdata/netdata/edit/master/src/go/collectors/go.d.plugin/modules/fail2ban/README.md" -meta_yaml: "https://github.com/netdata/netdata/edit/master/src/go/collectors/go.d.plugin/modules/fail2ban/metadata.yaml" +custom_edit_url: "https://github.com/netdata/netdata/edit/master/src/go/plugin/go.d/modules/fail2ban/README.md" +meta_yaml: "https://github.com/netdata/netdata/edit/master/src/go/plugin/go.d/modules/fail2ban/metadata.yaml" sidebar_label: "Fail2ban" learn_status: "Published" learn_rel_path: "Collecting Metrics/Authentication and Authorization" @@ -82,7 +82,17 @@ There are no alerts configured by default for this integration. ### Prerequisites -No action required. +#### For Netdata running in a Docker container + +1. **Install Fail2ban client**. + + Ensure `fail2ban-client` is available in the container by setting the environment variable `NETDATA_EXTRA_DEB_PACKAGES=fail2ban` when starting the container. + +2. **Mount host's `/var/run` directory**. + + Mount the host machine's `/var/run` directory to `/host/var/run` inside your Netdata container. This grants Netdata access to the Fail2ban socket file, typically located at `/var/run/fail2ban/fail2ban.sock`. + + ### Configuration @@ -134,6 +144,8 @@ jobs: ### Debug Mode +**Important**: Debug mode is not supported for data collection jobs created via the UI using the Dyncfg feature. + To troubleshoot issues with the `fail2ban` collector, run the `go.d.plugin` with the debug option enabled. The output should give you clues as to why the collector isn't working. @@ -156,4 +168,37 @@ should give you clues as to why the collector isn't working. ./go.d.plugin -d -m fail2ban ``` +### Getting Logs + +If you're encountering problems with the `fail2ban` collector, follow these steps to retrieve logs and identify potential issues: + +- **Run the command** specific to your system (systemd, non-systemd, or Docker container). +- **Examine the output** for any warnings or error messages that might indicate issues. These messages should provide clues about the root cause of the problem. + +#### System with systemd + +Use the following command to view logs generated since the last Netdata service restart: + +```bash +journalctl _SYSTEMD_INVOCATION_ID="$(systemctl show --value --property=InvocationID netdata)" --namespace=netdata --grep fail2ban +``` + +#### System without systemd + +Locate the collector log file, typically at `/var/log/netdata/collector.log`, and use `grep` to filter for collector's name: + +```bash +grep fail2ban /var/log/netdata/collector.log +``` + +**Note**: This method shows logs from all restarts. Focus on the **latest entries** for troubleshooting current issues. + +#### Docker Container + +If your Netdata runs in a Docker container named "netdata" (replace if different), use this command: + +```bash +docker logs netdata 2>&1 | grep fail2ban +``` + diff --git a/src/go/collectors/go.d.plugin/modules/fail2ban/metadata.yaml b/src/go/plugin/go.d/modules/fail2ban/metadata.yaml index 87a5732a1..922b4e5ad 100644 --- a/src/go/collectors/go.d.plugin/modules/fail2ban/metadata.yaml +++ b/src/go/plugin/go.d/modules/fail2ban/metadata.yaml @@ -44,7 +44,16 @@ modules: description: "" setup: prerequisites: - list: [] + list: + - title: For Netdata running in a Docker container + description: | + 1. **Install Fail2ban client**. + + Ensure `fail2ban-client` is available in the container by setting the environment variable `NETDATA_EXTRA_DEB_PACKAGES=fail2ban` when starting the container. + + 2. **Mount host's `/var/run` directory**. + + Mount the host machine's `/var/run` directory to `/host/var/run` inside your Netdata container. This grants Netdata access to the Fail2ban socket file, typically located at `/var/run/fail2ban/fail2ban.sock`. configuration: file: name: go.d/fail2ban.conf diff --git a/src/go/collectors/go.d.plugin/modules/hpssa/testdata/config.json b/src/go/plugin/go.d/modules/fail2ban/testdata/config.json index 291ecee3d..291ecee3d 100644 --- a/src/go/collectors/go.d.plugin/modules/hpssa/testdata/config.json +++ b/src/go/plugin/go.d/modules/fail2ban/testdata/config.json diff --git a/src/go/collectors/go.d.plugin/modules/hpssa/testdata/config.yaml b/src/go/plugin/go.d/modules/fail2ban/testdata/config.yaml index 25b0b4c78..25b0b4c78 100644 --- a/src/go/collectors/go.d.plugin/modules/hpssa/testdata/config.yaml +++ b/src/go/plugin/go.d/modules/fail2ban/testdata/config.yaml diff --git a/src/go/collectors/go.d.plugin/modules/fail2ban/testdata/fail2ban-jail-status.txt b/src/go/plugin/go.d/modules/fail2ban/testdata/fail2ban-jail-status.txt index 17a3f53c1..17a3f53c1 100644 --- a/src/go/collectors/go.d.plugin/modules/fail2ban/testdata/fail2ban-jail-status.txt +++ b/src/go/plugin/go.d/modules/fail2ban/testdata/fail2ban-jail-status.txt diff --git a/src/go/collectors/go.d.plugin/modules/fail2ban/testdata/fail2ban-status.txt b/src/go/plugin/go.d/modules/fail2ban/testdata/fail2ban-status.txt index 1e65a78cf..1e65a78cf 100644 --- a/src/go/collectors/go.d.plugin/modules/fail2ban/testdata/fail2ban-status.txt +++ b/src/go/plugin/go.d/modules/fail2ban/testdata/fail2ban-status.txt diff --git a/src/go/collectors/go.d.plugin/modules/filecheck/README.md b/src/go/plugin/go.d/modules/filecheck/README.md index 24dc78d8d..24dc78d8d 120000 --- a/src/go/collectors/go.d.plugin/modules/filecheck/README.md +++ b/src/go/plugin/go.d/modules/filecheck/README.md diff --git a/src/go/collectors/go.d.plugin/modules/filecheck/cache.go b/src/go/plugin/go.d/modules/filecheck/cache.go index 1acd6f821..1acd6f821 100644 --- a/src/go/collectors/go.d.plugin/modules/filecheck/cache.go +++ b/src/go/plugin/go.d/modules/filecheck/cache.go diff --git a/src/go/collectors/go.d.plugin/modules/filecheck/charts.go b/src/go/plugin/go.d/modules/filecheck/charts.go index 2be3c9467..6d00463a6 100644 --- a/src/go/collectors/go.d.plugin/modules/filecheck/charts.go +++ b/src/go/plugin/go.d/modules/filecheck/charts.go @@ -6,7 +6,7 @@ import ( "fmt" "strings" - "github.com/netdata/netdata/go/go.d.plugin/agent/module" + "github.com/netdata/netdata/go/plugins/plugin/go.d/agent/module" ) const ( diff --git a/src/go/collectors/go.d.plugin/modules/filecheck/collect.go b/src/go/plugin/go.d/modules/filecheck/collect.go index 077ad86c6..077ad86c6 100644 --- a/src/go/collectors/go.d.plugin/modules/filecheck/collect.go +++ b/src/go/plugin/go.d/modules/filecheck/collect.go diff --git a/src/go/collectors/go.d.plugin/modules/filecheck/collect_dirs.go b/src/go/plugin/go.d/modules/filecheck/collect_dirs.go index 143915d4d..143915d4d 100644 --- a/src/go/collectors/go.d.plugin/modules/filecheck/collect_dirs.go +++ b/src/go/plugin/go.d/modules/filecheck/collect_dirs.go diff --git a/src/go/collectors/go.d.plugin/modules/filecheck/collect_files.go b/src/go/plugin/go.d/modules/filecheck/collect_files.go index 4c465c111..4c465c111 100644 --- a/src/go/collectors/go.d.plugin/modules/filecheck/collect_files.go +++ b/src/go/plugin/go.d/modules/filecheck/collect_files.go diff --git a/src/go/collectors/go.d.plugin/modules/filecheck/config_schema.json b/src/go/plugin/go.d/modules/filecheck/config_schema.json index c64bb941f..c64bb941f 100644 --- a/src/go/collectors/go.d.plugin/modules/filecheck/config_schema.json +++ b/src/go/plugin/go.d/modules/filecheck/config_schema.json diff --git a/src/go/collectors/go.d.plugin/modules/filecheck/discover.go b/src/go/plugin/go.d/modules/filecheck/discover.go index 29ae552c5..29ae552c5 100644 --- a/src/go/collectors/go.d.plugin/modules/filecheck/discover.go +++ b/src/go/plugin/go.d/modules/filecheck/discover.go diff --git a/src/go/collectors/go.d.plugin/modules/filecheck/filecheck.go b/src/go/plugin/go.d/modules/filecheck/filecheck.go index 90541ee7b..8d19c7c64 100644 --- a/src/go/collectors/go.d.plugin/modules/filecheck/filecheck.go +++ b/src/go/plugin/go.d/modules/filecheck/filecheck.go @@ -6,9 +6,9 @@ import ( _ "embed" "time" - "github.com/netdata/netdata/go/go.d.plugin/agent/module" - "github.com/netdata/netdata/go/go.d.plugin/pkg/matcher" - "github.com/netdata/netdata/go/go.d.plugin/pkg/web" + "github.com/netdata/netdata/go/plugins/plugin/go.d/agent/module" + "github.com/netdata/netdata/go/plugins/plugin/go.d/pkg/matcher" + "github.com/netdata/netdata/go/plugins/plugin/go.d/pkg/web" ) //go:embed "config_schema.json" diff --git a/src/go/collectors/go.d.plugin/modules/filecheck/filecheck_test.go b/src/go/plugin/go.d/modules/filecheck/filecheck_test.go index 7cbbcd89a..43024b0bc 100644 --- a/src/go/collectors/go.d.plugin/modules/filecheck/filecheck_test.go +++ b/src/go/plugin/go.d/modules/filecheck/filecheck_test.go @@ -7,7 +7,7 @@ import ( "strings" "testing" - "github.com/netdata/netdata/go/go.d.plugin/agent/module" + "github.com/netdata/netdata/go/plugins/plugin/go.d/agent/module" "github.com/stretchr/testify/assert" "github.com/stretchr/testify/require" diff --git a/src/go/collectors/go.d.plugin/modules/filecheck/init.go b/src/go/plugin/go.d/modules/filecheck/init.go index 464f81735..20b30964f 100644 --- a/src/go/collectors/go.d.plugin/modules/filecheck/init.go +++ b/src/go/plugin/go.d/modules/filecheck/init.go @@ -5,7 +5,7 @@ package filecheck import ( "errors" - "github.com/netdata/netdata/go/go.d.plugin/pkg/matcher" + "github.com/netdata/netdata/go/plugins/plugin/go.d/pkg/matcher" ) func (f *Filecheck) validateConfig() error { diff --git a/src/go/collectors/go.d.plugin/modules/filecheck/integrations/files_and_directories.md b/src/go/plugin/go.d/modules/filecheck/integrations/files_and_directories.md index f7f0b0334..ed131a125 100644 --- a/src/go/collectors/go.d.plugin/modules/filecheck/integrations/files_and_directories.md +++ b/src/go/plugin/go.d/modules/filecheck/integrations/files_and_directories.md @@ -1,6 +1,6 @@ <!--startmeta -custom_edit_url: "https://github.com/netdata/netdata/edit/master/src/go/collectors/go.d.plugin/modules/filecheck/README.md" -meta_yaml: "https://github.com/netdata/netdata/edit/master/src/go/collectors/go.d.plugin/modules/filecheck/metadata.yaml" +custom_edit_url: "https://github.com/netdata/netdata/edit/master/src/go/plugin/go.d/modules/filecheck/README.md" +meta_yaml: "https://github.com/netdata/netdata/edit/master/src/go/plugin/go.d/modules/filecheck/metadata.yaml" sidebar_label: "Files and directories" learn_status: "Published" learn_rel_path: "Collecting Metrics/Other" @@ -220,6 +220,8 @@ jobs: ### Debug Mode +**Important**: Debug mode is not supported for data collection jobs created via the UI using the Dyncfg feature. + To troubleshoot issues with the `filecheck` collector, run the `go.d.plugin` with the debug option enabled. The output should give you clues as to why the collector isn't working. @@ -242,4 +244,37 @@ should give you clues as to why the collector isn't working. ./go.d.plugin -d -m filecheck ``` +### Getting Logs + +If you're encountering problems with the `filecheck` collector, follow these steps to retrieve logs and identify potential issues: + +- **Run the command** specific to your system (systemd, non-systemd, or Docker container). +- **Examine the output** for any warnings or error messages that might indicate issues. These messages should provide clues about the root cause of the problem. + +#### System with systemd + +Use the following command to view logs generated since the last Netdata service restart: + +```bash +journalctl _SYSTEMD_INVOCATION_ID="$(systemctl show --value --property=InvocationID netdata)" --namespace=netdata --grep filecheck +``` + +#### System without systemd + +Locate the collector log file, typically at `/var/log/netdata/collector.log`, and use `grep` to filter for collector's name: + +```bash +grep filecheck /var/log/netdata/collector.log +``` + +**Note**: This method shows logs from all restarts. Focus on the **latest entries** for troubleshooting current issues. + +#### Docker Container + +If your Netdata runs in a Docker container named "netdata" (replace if different), use this command: + +```bash +docker logs netdata 2>&1 | grep filecheck +``` + diff --git a/src/go/collectors/go.d.plugin/modules/filecheck/metadata.yaml b/src/go/plugin/go.d/modules/filecheck/metadata.yaml index 446226f22..446226f22 100644 --- a/src/go/collectors/go.d.plugin/modules/filecheck/metadata.yaml +++ b/src/go/plugin/go.d/modules/filecheck/metadata.yaml diff --git a/src/go/collectors/go.d.plugin/modules/filecheck/testdata/config.json b/src/go/plugin/go.d/modules/filecheck/testdata/config.json index 93d286f84..93d286f84 100644 --- a/src/go/collectors/go.d.plugin/modules/filecheck/testdata/config.json +++ b/src/go/plugin/go.d/modules/filecheck/testdata/config.json diff --git a/src/go/collectors/go.d.plugin/modules/filecheck/testdata/config.yaml b/src/go/plugin/go.d/modules/filecheck/testdata/config.yaml index 494a21855..494a21855 100644 --- a/src/go/collectors/go.d.plugin/modules/filecheck/testdata/config.yaml +++ b/src/go/plugin/go.d/modules/filecheck/testdata/config.yaml diff --git a/src/go/collectors/go.d.plugin/modules/filecheck/testdata/dir/empty_file.log b/src/go/plugin/go.d/modules/filecheck/testdata/dir/empty_file.log index e69de29bb..e69de29bb 100644 --- a/src/go/collectors/go.d.plugin/modules/filecheck/testdata/dir/empty_file.log +++ b/src/go/plugin/go.d/modules/filecheck/testdata/dir/empty_file.log diff --git a/src/go/collectors/go.d.plugin/modules/filecheck/testdata/dir/file.log b/src/go/plugin/go.d/modules/filecheck/testdata/dir/file.log index c1c152a81..c1c152a81 100644 --- a/src/go/collectors/go.d.plugin/modules/filecheck/testdata/dir/file.log +++ b/src/go/plugin/go.d/modules/filecheck/testdata/dir/file.log diff --git a/src/go/collectors/go.d.plugin/modules/filecheck/testdata/dir/subdir/empty_file.log b/src/go/plugin/go.d/modules/filecheck/testdata/dir/subdir/empty_file.log index e69de29bb..e69de29bb 100644 --- a/src/go/collectors/go.d.plugin/modules/filecheck/testdata/dir/subdir/empty_file.log +++ b/src/go/plugin/go.d/modules/filecheck/testdata/dir/subdir/empty_file.log diff --git a/src/go/collectors/go.d.plugin/modules/filecheck/testdata/empty_file.log b/src/go/plugin/go.d/modules/filecheck/testdata/empty_file.log index e69de29bb..e69de29bb 100644 --- a/src/go/collectors/go.d.plugin/modules/filecheck/testdata/empty_file.log +++ b/src/go/plugin/go.d/modules/filecheck/testdata/empty_file.log diff --git a/src/go/collectors/go.d.plugin/modules/filecheck/testdata/file.log b/src/go/plugin/go.d/modules/filecheck/testdata/file.log index e0db68517..e0db68517 100644 --- a/src/go/collectors/go.d.plugin/modules/filecheck/testdata/file.log +++ b/src/go/plugin/go.d/modules/filecheck/testdata/file.log diff --git a/src/go/collectors/go.d.plugin/modules/fluentd/README.md b/src/go/plugin/go.d/modules/fluentd/README.md index 96241702f..96241702f 120000 --- a/src/go/collectors/go.d.plugin/modules/fluentd/README.md +++ b/src/go/plugin/go.d/modules/fluentd/README.md diff --git a/src/go/collectors/go.d.plugin/modules/fluentd/apiclient.go b/src/go/plugin/go.d/modules/fluentd/apiclient.go index 1bee8148e..1c6bf85a9 100644 --- a/src/go/collectors/go.d.plugin/modules/fluentd/apiclient.go +++ b/src/go/plugin/go.d/modules/fluentd/apiclient.go @@ -10,7 +10,7 @@ import ( "net/url" "path" - "github.com/netdata/netdata/go/go.d.plugin/pkg/web" + "github.com/netdata/netdata/go/plugins/plugin/go.d/pkg/web" ) const pluginsPath = "/api/plugins.json" diff --git a/src/go/collectors/go.d.plugin/modules/fluentd/charts.go b/src/go/plugin/go.d/modules/fluentd/charts.go index 3b7d0d595..b0034c026 100644 --- a/src/go/collectors/go.d.plugin/modules/fluentd/charts.go +++ b/src/go/plugin/go.d/modules/fluentd/charts.go @@ -2,7 +2,7 @@ package fluentd -import "github.com/netdata/netdata/go/go.d.plugin/agent/module" +import "github.com/netdata/netdata/go/plugins/plugin/go.d/agent/module" type ( // Charts is an alias for module.Charts diff --git a/src/go/collectors/go.d.plugin/modules/fluentd/collect.go b/src/go/plugin/go.d/modules/fluentd/collect.go index 14ee6df68..14ee6df68 100644 --- a/src/go/collectors/go.d.plugin/modules/fluentd/collect.go +++ b/src/go/plugin/go.d/modules/fluentd/collect.go diff --git a/src/go/collectors/go.d.plugin/modules/fluentd/config_schema.json b/src/go/plugin/go.d/modules/fluentd/config_schema.json index ff2adc739..037420f74 100644 --- a/src/go/collectors/go.d.plugin/modules/fluentd/config_schema.json +++ b/src/go/plugin/go.d/modules/fluentd/config_schema.json @@ -167,6 +167,12 @@ "timeout": { "ui:help": "Accepts decimals for precise control (e.g., type 1.5 for 1.5 seconds)." }, + "username": { + "ui:widget": "password" + }, + "proxy_username": { + "ui:widget": "password" + }, "password": { "ui:widget": "password" }, diff --git a/src/go/collectors/go.d.plugin/modules/fluentd/fluentd.go b/src/go/plugin/go.d/modules/fluentd/fluentd.go index 5b9753d98..467edaac8 100644 --- a/src/go/collectors/go.d.plugin/modules/fluentd/fluentd.go +++ b/src/go/plugin/go.d/modules/fluentd/fluentd.go @@ -7,9 +7,9 @@ import ( "errors" "time" - "github.com/netdata/netdata/go/go.d.plugin/agent/module" - "github.com/netdata/netdata/go/go.d.plugin/pkg/matcher" - "github.com/netdata/netdata/go/go.d.plugin/pkg/web" + "github.com/netdata/netdata/go/plugins/plugin/go.d/agent/module" + "github.com/netdata/netdata/go/plugins/plugin/go.d/pkg/matcher" + "github.com/netdata/netdata/go/plugins/plugin/go.d/pkg/web" ) //go:embed "config_schema.json" diff --git a/src/go/collectors/go.d.plugin/modules/fluentd/fluentd_test.go b/src/go/plugin/go.d/modules/fluentd/fluentd_test.go index 01c4f9636..e21b58fc5 100644 --- a/src/go/collectors/go.d.plugin/modules/fluentd/fluentd_test.go +++ b/src/go/plugin/go.d/modules/fluentd/fluentd_test.go @@ -8,7 +8,7 @@ import ( "os" "testing" - "github.com/netdata/netdata/go/go.d.plugin/agent/module" + "github.com/netdata/netdata/go/plugins/plugin/go.d/agent/module" "github.com/stretchr/testify/assert" "github.com/stretchr/testify/require" diff --git a/src/go/collectors/go.d.plugin/modules/fluentd/init.go b/src/go/plugin/go.d/modules/fluentd/init.go index d8df8b3ab..6ee71c0a6 100644 --- a/src/go/collectors/go.d.plugin/modules/fluentd/init.go +++ b/src/go/plugin/go.d/modules/fluentd/init.go @@ -5,8 +5,8 @@ package fluentd import ( "errors" - "github.com/netdata/netdata/go/go.d.plugin/pkg/matcher" - "github.com/netdata/netdata/go/go.d.plugin/pkg/web" + "github.com/netdata/netdata/go/plugins/plugin/go.d/pkg/matcher" + "github.com/netdata/netdata/go/plugins/plugin/go.d/pkg/web" ) func (f *Fluentd) validateConfig() error { diff --git a/src/go/collectors/go.d.plugin/modules/fluentd/integrations/fluentd.md b/src/go/plugin/go.d/modules/fluentd/integrations/fluentd.md index b00facd3a..b4740a77a 100644 --- a/src/go/collectors/go.d.plugin/modules/fluentd/integrations/fluentd.md +++ b/src/go/plugin/go.d/modules/fluentd/integrations/fluentd.md @@ -1,6 +1,6 @@ <!--startmeta -custom_edit_url: "https://github.com/netdata/netdata/edit/master/src/go/collectors/go.d.plugin/modules/fluentd/README.md" -meta_yaml: "https://github.com/netdata/netdata/edit/master/src/go/collectors/go.d.plugin/modules/fluentd/metadata.yaml" +custom_edit_url: "https://github.com/netdata/netdata/edit/master/src/go/plugin/go.d/modules/fluentd/README.md" +meta_yaml: "https://github.com/netdata/netdata/edit/master/src/go/plugin/go.d/modules/fluentd/metadata.yaml" sidebar_label: "Fluentd" learn_status: "Published" learn_rel_path: "Collecting Metrics/Logs Servers" @@ -196,6 +196,8 @@ jobs: ### Debug Mode +**Important**: Debug mode is not supported for data collection jobs created via the UI using the Dyncfg feature. + To troubleshoot issues with the `fluentd` collector, run the `go.d.plugin` with the debug option enabled. The output should give you clues as to why the collector isn't working. @@ -218,4 +220,37 @@ should give you clues as to why the collector isn't working. ./go.d.plugin -d -m fluentd ``` +### Getting Logs + +If you're encountering problems with the `fluentd` collector, follow these steps to retrieve logs and identify potential issues: + +- **Run the command** specific to your system (systemd, non-systemd, or Docker container). +- **Examine the output** for any warnings or error messages that might indicate issues. These messages should provide clues about the root cause of the problem. + +#### System with systemd + +Use the following command to view logs generated since the last Netdata service restart: + +```bash +journalctl _SYSTEMD_INVOCATION_ID="$(systemctl show --value --property=InvocationID netdata)" --namespace=netdata --grep fluentd +``` + +#### System without systemd + +Locate the collector log file, typically at `/var/log/netdata/collector.log`, and use `grep` to filter for collector's name: + +```bash +grep fluentd /var/log/netdata/collector.log +``` + +**Note**: This method shows logs from all restarts. Focus on the **latest entries** for troubleshooting current issues. + +#### Docker Container + +If your Netdata runs in a Docker container named "netdata" (replace if different), use this command: + +```bash +docker logs netdata 2>&1 | grep fluentd +``` + diff --git a/src/go/collectors/go.d.plugin/modules/fluentd/metadata.yaml b/src/go/plugin/go.d/modules/fluentd/metadata.yaml index 0a6a66058..0a6a66058 100644 --- a/src/go/collectors/go.d.plugin/modules/fluentd/metadata.yaml +++ b/src/go/plugin/go.d/modules/fluentd/metadata.yaml diff --git a/src/go/collectors/go.d.plugin/modules/fluentd/testdata/config.json b/src/go/plugin/go.d/modules/fluentd/testdata/config.json index 6477bd57d..6477bd57d 100644 --- a/src/go/collectors/go.d.plugin/modules/fluentd/testdata/config.json +++ b/src/go/plugin/go.d/modules/fluentd/testdata/config.json diff --git a/src/go/collectors/go.d.plugin/modules/fluentd/testdata/config.yaml b/src/go/plugin/go.d/modules/fluentd/testdata/config.yaml index 0afd42e67..0afd42e67 100644 --- a/src/go/collectors/go.d.plugin/modules/fluentd/testdata/config.yaml +++ b/src/go/plugin/go.d/modules/fluentd/testdata/config.yaml diff --git a/src/go/collectors/go.d.plugin/modules/fluentd/testdata/plugins.json b/src/go/plugin/go.d/modules/fluentd/testdata/plugins.json index 1fd921f7c..1fd921f7c 100644 --- a/src/go/collectors/go.d.plugin/modules/fluentd/testdata/plugins.json +++ b/src/go/plugin/go.d/modules/fluentd/testdata/plugins.json diff --git a/src/go/collectors/go.d.plugin/modules/freeradius/README.md b/src/go/plugin/go.d/modules/freeradius/README.md index 66deefdb7..66deefdb7 120000 --- a/src/go/collectors/go.d.plugin/modules/freeradius/README.md +++ b/src/go/plugin/go.d/modules/freeradius/README.md diff --git a/src/go/collectors/go.d.plugin/modules/freeradius/api/client.go b/src/go/plugin/go.d/modules/freeradius/api/client.go index 01f784c17..01f784c17 100644 --- a/src/go/collectors/go.d.plugin/modules/freeradius/api/client.go +++ b/src/go/plugin/go.d/modules/freeradius/api/client.go diff --git a/src/go/collectors/go.d.plugin/modules/freeradius/api/client_test.go b/src/go/plugin/go.d/modules/freeradius/api/client_test.go index 9323aa992..9323aa992 100644 --- a/src/go/collectors/go.d.plugin/modules/freeradius/api/client_test.go +++ b/src/go/plugin/go.d/modules/freeradius/api/client_test.go diff --git a/src/go/collectors/go.d.plugin/modules/freeradius/api/dictionary.go b/src/go/plugin/go.d/modules/freeradius/api/dictionary.go index 0ed348ae3..0ed348ae3 100644 --- a/src/go/collectors/go.d.plugin/modules/freeradius/api/dictionary.go +++ b/src/go/plugin/go.d/modules/freeradius/api/dictionary.go diff --git a/src/go/collectors/go.d.plugin/modules/freeradius/charts.go b/src/go/plugin/go.d/modules/freeradius/charts.go index 18732c944..a9df720fc 100644 --- a/src/go/collectors/go.d.plugin/modules/freeradius/charts.go +++ b/src/go/plugin/go.d/modules/freeradius/charts.go @@ -2,7 +2,7 @@ package freeradius -import "github.com/netdata/netdata/go/go.d.plugin/agent/module" +import "github.com/netdata/netdata/go/plugins/plugin/go.d/agent/module" type ( // Charts is an alias for module.Charts diff --git a/src/go/collectors/go.d.plugin/modules/freeradius/collect.go b/src/go/plugin/go.d/modules/freeradius/collect.go index 8ec4bf46b..05fd82322 100644 --- a/src/go/collectors/go.d.plugin/modules/freeradius/collect.go +++ b/src/go/plugin/go.d/modules/freeradius/collect.go @@ -3,7 +3,7 @@ package freeradius import ( - "github.com/netdata/netdata/go/go.d.plugin/pkg/stm" + "github.com/netdata/netdata/go/plugins/plugin/go.d/pkg/stm" ) func (f *FreeRADIUS) collect() (map[string]int64, error) { diff --git a/src/go/collectors/go.d.plugin/modules/freeradius/config_schema.json b/src/go/plugin/go.d/modules/freeradius/config_schema.json index 7e1a3a4e9..7e1a3a4e9 100644 --- a/src/go/collectors/go.d.plugin/modules/freeradius/config_schema.json +++ b/src/go/plugin/go.d/modules/freeradius/config_schema.json diff --git a/src/go/collectors/go.d.plugin/modules/freeradius/freeradius.go b/src/go/plugin/go.d/modules/freeradius/freeradius.go index c9ce35143..e3c995b5e 100644 --- a/src/go/collectors/go.d.plugin/modules/freeradius/freeradius.go +++ b/src/go/plugin/go.d/modules/freeradius/freeradius.go @@ -7,9 +7,9 @@ import ( "errors" "time" - "github.com/netdata/netdata/go/go.d.plugin/agent/module" - "github.com/netdata/netdata/go/go.d.plugin/modules/freeradius/api" - "github.com/netdata/netdata/go/go.d.plugin/pkg/web" + "github.com/netdata/netdata/go/plugins/plugin/go.d/agent/module" + "github.com/netdata/netdata/go/plugins/plugin/go.d/modules/freeradius/api" + "github.com/netdata/netdata/go/plugins/plugin/go.d/pkg/web" ) //go:embed "config_schema.json" diff --git a/src/go/collectors/go.d.plugin/modules/freeradius/freeradius_test.go b/src/go/plugin/go.d/modules/freeradius/freeradius_test.go index bf061e01e..58e2dce59 100644 --- a/src/go/collectors/go.d.plugin/modules/freeradius/freeradius_test.go +++ b/src/go/plugin/go.d/modules/freeradius/freeradius_test.go @@ -7,8 +7,8 @@ import ( "os" "testing" - "github.com/netdata/netdata/go/go.d.plugin/agent/module" - "github.com/netdata/netdata/go/go.d.plugin/modules/freeradius/api" + "github.com/netdata/netdata/go/plugins/plugin/go.d/agent/module" + "github.com/netdata/netdata/go/plugins/plugin/go.d/modules/freeradius/api" "github.com/stretchr/testify/assert" "github.com/stretchr/testify/require" diff --git a/src/go/collectors/go.d.plugin/modules/freeradius/init.go b/src/go/plugin/go.d/modules/freeradius/init.go index 9c14da0ea..9c14da0ea 100644 --- a/src/go/collectors/go.d.plugin/modules/freeradius/init.go +++ b/src/go/plugin/go.d/modules/freeradius/init.go diff --git a/src/go/collectors/go.d.plugin/modules/freeradius/integrations/freeradius.md b/src/go/plugin/go.d/modules/freeradius/integrations/freeradius.md index 9f23792f3..59b124f7e 100644 --- a/src/go/collectors/go.d.plugin/modules/freeradius/integrations/freeradius.md +++ b/src/go/plugin/go.d/modules/freeradius/integrations/freeradius.md @@ -1,6 +1,6 @@ <!--startmeta -custom_edit_url: "https://github.com/netdata/netdata/edit/master/src/go/collectors/go.d.plugin/modules/freeradius/README.md" -meta_yaml: "https://github.com/netdata/netdata/edit/master/src/go/collectors/go.d.plugin/modules/freeradius/metadata.yaml" +custom_edit_url: "https://github.com/netdata/netdata/edit/master/src/go/plugin/go.d/modules/freeradius/README.md" +meta_yaml: "https://github.com/netdata/netdata/edit/master/src/go/plugin/go.d/modules/freeradius/metadata.yaml" sidebar_label: "FreeRADIUS" learn_status: "Published" learn_rel_path: "Collecting Metrics/Authentication and Authorization" @@ -174,6 +174,8 @@ jobs: ### Debug Mode +**Important**: Debug mode is not supported for data collection jobs created via the UI using the Dyncfg feature. + To troubleshoot issues with the `freeradius` collector, run the `go.d.plugin` with the debug option enabled. The output should give you clues as to why the collector isn't working. @@ -196,4 +198,37 @@ should give you clues as to why the collector isn't working. ./go.d.plugin -d -m freeradius ``` +### Getting Logs + +If you're encountering problems with the `freeradius` collector, follow these steps to retrieve logs and identify potential issues: + +- **Run the command** specific to your system (systemd, non-systemd, or Docker container). +- **Examine the output** for any warnings or error messages that might indicate issues. These messages should provide clues about the root cause of the problem. + +#### System with systemd + +Use the following command to view logs generated since the last Netdata service restart: + +```bash +journalctl _SYSTEMD_INVOCATION_ID="$(systemctl show --value --property=InvocationID netdata)" --namespace=netdata --grep freeradius +``` + +#### System without systemd + +Locate the collector log file, typically at `/var/log/netdata/collector.log`, and use `grep` to filter for collector's name: + +```bash +grep freeradius /var/log/netdata/collector.log +``` + +**Note**: This method shows logs from all restarts. Focus on the **latest entries** for troubleshooting current issues. + +#### Docker Container + +If your Netdata runs in a Docker container named "netdata" (replace if different), use this command: + +```bash +docker logs netdata 2>&1 | grep freeradius +``` + diff --git a/src/go/collectors/go.d.plugin/modules/freeradius/metadata.yaml b/src/go/plugin/go.d/modules/freeradius/metadata.yaml index 5ecdcf417..5ecdcf417 100644 --- a/src/go/collectors/go.d.plugin/modules/freeradius/metadata.yaml +++ b/src/go/plugin/go.d/modules/freeradius/metadata.yaml diff --git a/src/go/collectors/go.d.plugin/modules/freeradius/testdata/config.json b/src/go/plugin/go.d/modules/freeradius/testdata/config.json index 5a1939b60..5a1939b60 100644 --- a/src/go/collectors/go.d.plugin/modules/freeradius/testdata/config.json +++ b/src/go/plugin/go.d/modules/freeradius/testdata/config.json diff --git a/src/go/collectors/go.d.plugin/modules/freeradius/testdata/config.yaml b/src/go/plugin/go.d/modules/freeradius/testdata/config.yaml index 4a3d1f8cd..4a3d1f8cd 100644 --- a/src/go/collectors/go.d.plugin/modules/freeradius/testdata/config.yaml +++ b/src/go/plugin/go.d/modules/freeradius/testdata/config.yaml diff --git a/src/collectors/python.d.plugin/gearman/README.md b/src/go/plugin/go.d/modules/gearman/README.md index 70189d698..70189d698 120000 --- a/src/collectors/python.d.plugin/gearman/README.md +++ b/src/go/plugin/go.d/modules/gearman/README.md diff --git a/src/go/plugin/go.d/modules/gearman/charts.go b/src/go/plugin/go.d/modules/gearman/charts.go new file mode 100644 index 000000000..425c00fd4 --- /dev/null +++ b/src/go/plugin/go.d/modules/gearman/charts.go @@ -0,0 +1,158 @@ +// SPDX-License-Identifier: GPL-3.0-or-later + +package gearman + +import ( + "fmt" + "strings" + + "github.com/netdata/netdata/go/plugins/plugin/go.d/agent/module" +) + +const ( + prioQueuedJobsByActivity = module.Priority + iota + prioQueuedJobsByPriority + + prioFunctionQueuedJobsByActivity + prioFunctionQueuedJobsByPriority + prioFunctionAvailableWorkers +) + +var summaryCharts = module.Charts{ + chartQueuedJobsActivity.Copy(), + chartQueuedJobsPriority.Copy(), +} + +var ( + chartQueuedJobsActivity = module.Chart{ + ID: "queued_jobs_by_activity", + Title: "Jobs Activity", + Units: "jobs", + Fam: "jobs", + Ctx: "gearman.queued_jobs_activity", + Priority: prioQueuedJobsByActivity, + Type: module.Stacked, + Dims: module.Dims{ + {ID: "total_jobs_running", Name: "running"}, + {ID: "total_jobs_waiting", Name: "waiting"}, + }, + } + chartQueuedJobsPriority = module.Chart{ + ID: "queued_jobs_by_priority", + Title: "Jobs Priority", + Units: "jobs", + Fam: "jobs", + Ctx: "gearman.queued_jobs_priority", + Priority: prioQueuedJobsByPriority, + Type: module.Stacked, + Dims: module.Dims{ + {ID: "total_high_priority_jobs", Name: "high"}, + {ID: "total_normal_priority_jobs", Name: "normal"}, + {ID: "total_low_priority_jobs", Name: "low"}, + }, + } +) + +var functionStatusChartsTmpl = module.Charts{ + functionQueuedJobsActivityChartTmpl.Copy(), + functionWorkersChartTmpl.Copy(), +} + +var ( + functionQueuedJobsActivityChartTmpl = module.Chart{ + ID: "function_%s_queued_jobs_by_activity", + Title: "Function Jobs Activity", + Units: "jobs", + Fam: "fn jobs", + Ctx: "gearman.function_queued_jobs_activity", + Priority: prioFunctionQueuedJobsByActivity, + Type: module.Stacked, + Dims: module.Dims{ + {ID: "function_%s_jobs_running", Name: "running"}, + {ID: "function_%s_jobs_waiting", Name: "waiting"}, + }, + } + functionWorkersChartTmpl = module.Chart{ + ID: "function_%s_workers", + Title: "Function Workers", + Units: "workers", + Fam: "fn workers", + Ctx: "gearman.function_workers", + Priority: prioFunctionAvailableWorkers, + Type: module.Line, + Dims: module.Dims{ + {ID: "function_%s_workers_available", Name: "available"}, + }, + } +) + +var functionPriorityStatusChartsTmpl = module.Charts{ + functionQueuedJobsByPriorityChartTmpl.Copy(), +} + +var ( + functionQueuedJobsByPriorityChartTmpl = module.Chart{ + ID: "prio_function_%s_queued_jobs_by_priority", + Title: "Function Jobs Priority", + Units: "jobs", + Fam: "fn jobs", + Ctx: "gearman.function_queued_jobs_priority", + Priority: prioFunctionQueuedJobsByPriority, + Type: module.Stacked, + Dims: module.Dims{ + {ID: "function_%s_high_priority_jobs", Name: "high"}, + {ID: "function_%s_normal_priority_jobs", Name: "normal"}, + {ID: "function_%s_low_priority_jobs", Name: "low"}, + }, + } +) + +func (g *Gearman) addFunctionStatusCharts(name string) { + g.addFunctionCharts(name, functionStatusChartsTmpl.Copy()) +} + +func (g *Gearman) removeFunctionStatusCharts(name string) { + px := fmt.Sprintf("function_%s_", cleanFunctionName(name)) + g.removeCharts(px) +} + +func (g *Gearman) addFunctionPriorityStatusCharts(name string) { + g.addFunctionCharts(name, functionPriorityStatusChartsTmpl.Copy()) +} + +func (g *Gearman) removeFunctionPriorityStatusCharts(name string) { + px := fmt.Sprintf("prio_function_%s_", cleanFunctionName(name)) + g.removeCharts(px) +} + +func (g *Gearman) addFunctionCharts(name string, charts *module.Charts) { + charts = charts.Copy() + + for _, chart := range *charts { + chart.ID = fmt.Sprintf(chart.ID, cleanFunctionName(name)) + chart.Labels = []module.Label{ + {Key: "function_name", Value: name}, + } + for _, dim := range chart.Dims { + dim.ID = fmt.Sprintf(dim.ID, name) + } + } + + if err := g.Charts().Add(*charts...); err != nil { + g.Warning(err) + } +} + +func (g *Gearman) removeCharts(px string) { + for _, chart := range *g.Charts() { + if strings.HasPrefix(chart.ID, px) { + chart.MarkRemove() + chart.MarkNotCreated() + } + } +} + +func cleanFunctionName(name string) string { + r := strings.NewReplacer(".", "_", ",", "_", " ", "_") + return r.Replace(name) +} diff --git a/src/go/plugin/go.d/modules/gearman/client.go b/src/go/plugin/go.d/modules/gearman/client.go new file mode 100644 index 000000000..dff9a1be4 --- /dev/null +++ b/src/go/plugin/go.d/modules/gearman/client.go @@ -0,0 +1,80 @@ +// SPDX-License-Identifier: GPL-3.0-or-later + +package gearman + +import ( + "bytes" + "fmt" + "strings" + + "github.com/netdata/netdata/go/plugins/plugin/go.d/pkg/socket" +) + +type gearmanConn interface { + connect() error + disconnect() + queryStatus() ([]byte, error) + queryPriorityStatus() ([]byte, error) +} + +func newGearmanConn(conf Config) gearmanConn { + return &gearmanClient{conn: socket.New(socket.Config{ + Address: conf.Address, + ConnectTimeout: conf.Timeout.Duration(), + ReadTimeout: conf.Timeout.Duration(), + WriteTimeout: conf.Timeout.Duration(), + })} +} + +type gearmanClient struct { + conn socket.Client +} + +func (c *gearmanClient) connect() error { + return c.conn.Connect() +} + +func (c *gearmanClient) disconnect() { + _ = c.conn.Disconnect() +} + +func (c *gearmanClient) queryStatus() ([]byte, error) { + return c.query("status") +} + +func (c *gearmanClient) queryPriorityStatus() ([]byte, error) { + return c.query("prioritystatus") +} + +func (c *gearmanClient) query(cmd string) ([]byte, error) { + const limitReadLines = 10000 + var num int + var err error + var b bytes.Buffer + + clientErr := c.conn.Command(cmd+"\n", func(bs []byte) bool { + s := string(bs) + + if strings.HasPrefix(s, "ERR") { + err = fmt.Errorf("command '%s': %s", cmd, s) + return false + } + + b.WriteString(s) + b.WriteByte('\n') + + if num++; num >= limitReadLines { + err = fmt.Errorf("command '%s': read line limit exceeded (%d)", cmd, limitReadLines) + return false + } + return !strings.HasPrefix(s, ".") + }) + if clientErr != nil { + return nil, fmt.Errorf("command '%s' client error: %v", cmd, clientErr) + } + if err != nil { + return nil, err + } + + return b.Bytes(), nil +} diff --git a/src/go/plugin/go.d/modules/gearman/collect.go b/src/go/plugin/go.d/modules/gearman/collect.go new file mode 100644 index 000000000..ddfd8c96b --- /dev/null +++ b/src/go/plugin/go.d/modules/gearman/collect.go @@ -0,0 +1,221 @@ +// SPDX-License-Identifier: GPL-3.0-or-later + +package gearman + +import ( + "bufio" + "bytes" + "errors" + "fmt" + "strconv" + "strings" +) + +func (g *Gearman) collect() (map[string]int64, error) { + if g.conn == nil { + conn, err := g.establishConn() + if err != nil { + return nil, err + } + g.conn = conn + } + + status, err := g.conn.queryStatus() + if err != nil { + g.Cleanup() + return nil, fmt.Errorf("couldn't query status: %v", err) + } + + prioStatus, err := g.conn.queryPriorityStatus() + if err != nil { + g.Cleanup() + return nil, fmt.Errorf("couldn't query priority status: %v", err) + } + + mx := make(map[string]int64) + + if err := g.collectStatus(mx, status); err != nil { + return nil, fmt.Errorf("couldn't collect status: %v", err) + } + if err := g.collectPriorityStatus(mx, prioStatus); err != nil { + return nil, fmt.Errorf("couldn't collect priority status: %v", err) + } + + return mx, nil + +} + +func (g *Gearman) collectStatus(mx map[string]int64, statusData []byte) error { + /* + Same output as the "gearadmin --status" command: + + FUNCTION\tTOTAL\tRUNNING\tAVAILABLE_WORKERS + + E.g.: + + prefix generic_worker4 78 78 500 + generic_worker2 78 78 500 + generic_worker3 0 0 760 + generic_worker1 0 0 500 + */ + + seen := make(map[string]bool) + var foundEnd bool + sc := bufio.NewScanner(bytes.NewReader(statusData)) + + mx["total_jobs_queued"] = 0 + mx["total_jobs_running"] = 0 + mx["total_jobs_waiting"] = 0 + mx["total_workers_avail"] = 0 + + for sc.Scan() { + line := strings.TrimSpace(sc.Text()) + + if foundEnd = line == "."; foundEnd { + break + } + + parts := strings.Fields(line) + + // Gearman does not remove old tasks. We are only interested in tasks that have stats. + if len(parts) < 4 { + continue + } + + name := strings.Join(parts[:len(parts)-3], "_") + metrics := parts[len(parts)-3:] + + var queued, running, availWorkers int64 + var err error + + if queued, err = strconv.ParseInt(metrics[0], 10, 64); err != nil { + return fmt.Errorf("couldn't parse queued count: %v", err) + } + if running, err = strconv.ParseInt(metrics[1], 10, 64); err != nil { + return fmt.Errorf("couldn't parse running count: %v", err) + } + if availWorkers, err = strconv.ParseInt(metrics[2], 10, 64); err != nil { + return fmt.Errorf("couldn't parse available count: %v", err) + } + + px := fmt.Sprintf("function_%s_", name) + + waiting := queued - running + + mx[px+"jobs_queued"] = queued + mx[px+"jobs_running"] = running + mx[px+"jobs_waiting"] = waiting + mx[px+"workers_available"] = availWorkers + + mx["total_jobs_queued"] += queued + mx["total_jobs_running"] += running + mx["total_jobs_waiting"] += waiting + mx["total_workers_available"] += availWorkers + + seen[name] = true + } + + if !foundEnd { + return errors.New("unexpected status response") + } + + for name := range seen { + if !g.seenTasks[name] { + g.seenTasks[name] = true + g.addFunctionStatusCharts(name) + } + } + for name := range g.seenTasks { + if !seen[name] { + delete(g.seenTasks, name) + g.removeFunctionStatusCharts(name) + } + } + + return nil +} + +func (g *Gearman) collectPriorityStatus(mx map[string]int64, prioStatusData []byte) error { + /* + Same output as the "gearadmin --priority-status" command: + + FUNCTION\tHIGH\tNORMAL\tLOW\tAVAILABLE_WORKERS + */ + + seen := make(map[string]bool) + var foundEnd bool + sc := bufio.NewScanner(bytes.NewReader(prioStatusData)) + + mx["total_high_priority_jobs"] = 0 + mx["total_normal_priority_jobs"] = 0 + mx["total_low_priority_jobs"] = 0 + + for sc.Scan() { + line := strings.TrimSpace(sc.Text()) + + if foundEnd = line == "."; foundEnd { + break + } + + parts := strings.Fields(line) + if len(parts) < 5 { + continue + } + + name := strings.Join(parts[:len(parts)-4], "_") + metrics := parts[len(parts)-4:] + + var high, normal, low int64 + var err error + + if high, err = strconv.ParseInt(metrics[0], 10, 64); err != nil { + return fmt.Errorf("couldn't parse high count: %v", err) + } + if normal, err = strconv.ParseInt(metrics[1], 10, 64); err != nil { + return fmt.Errorf("couldn't parse normal count: %v", err) + } + if low, err = strconv.ParseInt(metrics[2], 10, 64); err != nil { + return fmt.Errorf("couldn't parse low count: %v", err) + } + + px := fmt.Sprintf("function_%s_", name) + + mx[px+"high_priority_jobs"] = high + mx[px+"normal_priority_jobs"] = normal + mx[px+"low_priority_jobs"] = low + mx["total_high_priority_jobs"] += high + mx["total_normal_priority_jobs"] += normal + mx["total_low_priority_jobs"] += low + + seen[name] = true + } + + if !foundEnd { + return errors.New("unexpected priority status response") + } + + for name := range seen { + if !g.seenPriorityTasks[name] { + g.seenPriorityTasks[name] = true + g.addFunctionPriorityStatusCharts(name) + } + } + for name := range g.seenPriorityTasks { + if !seen[name] { + delete(g.seenPriorityTasks, name) + g.removeFunctionPriorityStatusCharts(name) + } + } + + return nil +} + +func (g *Gearman) establishConn() (gearmanConn, error) { + conn := g.newConn(g.Config) + + if err := conn.connect(); err != nil { + return nil, err + } + + return conn, nil +} diff --git a/src/go/plugin/go.d/modules/gearman/config_schema.json b/src/go/plugin/go.d/modules/gearman/config_schema.json new file mode 100644 index 000000000..dd5d3a0b8 --- /dev/null +++ b/src/go/plugin/go.d/modules/gearman/config_schema.json @@ -0,0 +1,44 @@ +{ + "jsonSchema": { + "$schema": "http://json-schema.org/draft-07/schema#", + "title": "Gearman collector configuration.", + "type": "object", + "properties": { + "update_every": { + "title": "Update every", + "description": "Data collection interval, measured in seconds.", + "type": "integer", + "minimum": 1, + "default": 1 + }, + "address": { + "title": "Address", + "description": "The IP address and port where the Gearman service listens for connections.", + "type": "string", + "default": "127.0.0.1:4730" + }, + "timeout": { + "title": "Timeout", + "description": "Timeout for establishing a connection and communication (reading and writing) in seconds.", + "type": "number", + "minimum": 0.5, + "default": 1 + } + }, + "required": [ + "address" + ], + "additionalProperties": false, + "patternProperties": { + "^name$": {} + } + }, + "uiSchema": { + "uiOptions": { + "fullPage": true + }, + "timeout": { + "ui:help": "Accepts decimals for precise control (e.g., type 1.5 for 1.5 seconds)." + } + } +} diff --git a/src/go/plugin/go.d/modules/gearman/gearman.go b/src/go/plugin/go.d/modules/gearman/gearman.go new file mode 100644 index 000000000..e1780a95c --- /dev/null +++ b/src/go/plugin/go.d/modules/gearman/gearman.go @@ -0,0 +1,106 @@ +// SPDX-License-Identifier: GPL-3.0-or-later + +package gearman + +import ( + _ "embed" + "errors" + "time" + + "github.com/netdata/netdata/go/plugins/plugin/go.d/agent/module" + "github.com/netdata/netdata/go/plugins/plugin/go.d/pkg/web" +) + +//go:embed "config_schema.json" +var configSchema string + +func init() { + module.Register("gearman", module.Creator{ + JobConfigSchema: configSchema, + Create: func() module.Module { return New() }, + Config: func() any { return &Config{} }, + }) +} + +func New() *Gearman { + return &Gearman{ + Config: Config{ + Address: "127.0.0.1:4730", + Timeout: web.Duration(time.Second * 1), + }, + newConn: newGearmanConn, + charts: summaryCharts.Copy(), + seenTasks: make(map[string]bool), + seenPriorityTasks: make(map[string]bool), + } +} + +type Config struct { + UpdateEvery int `yaml:"update_every,omitempty" json:"update_every"` + Address string `yaml:"address" json:"address"` + Timeout web.Duration `yaml:"timeout" json:"timeout"` +} + +type Gearman struct { + module.Base + Config `yaml:",inline" json:""` + + charts *module.Charts + + newConn func(Config) gearmanConn + conn gearmanConn + + seenTasks map[string]bool + seenPriorityTasks map[string]bool +} + +func (g *Gearman) Configuration() any { + return g.Config +} + +func (g *Gearman) Init() error { + if g.Address == "" { + g.Error("config: 'address' not set") + return errors.New("address not set") + } + + return nil +} + +func (g *Gearman) Check() error { + mx, err := g.collect() + if err != nil { + g.Error(err) + return err + } + + if len(mx) == 0 { + return errors.New("no metrics collected") + } + + return nil +} + +func (g *Gearman) Charts() *module.Charts { + return g.charts +} + +func (g *Gearman) Collect() map[string]int64 { + mx, err := g.collect() + if err != nil { + g.Error(err) + } + + if len(mx) == 0 { + return nil + } + + return mx +} + +func (g *Gearman) Cleanup() { + if g.conn != nil { + g.conn.disconnect() + g.conn = nil + } +} diff --git a/src/go/plugin/go.d/modules/gearman/gearman_test.go b/src/go/plugin/go.d/modules/gearman/gearman_test.go new file mode 100644 index 000000000..43069abce --- /dev/null +++ b/src/go/plugin/go.d/modules/gearman/gearman_test.go @@ -0,0 +1,326 @@ +// SPDX-License-Identifier: GPL-3.0-or-later + +package gearman + +import ( + "errors" + "os" + "testing" + + "github.com/netdata/netdata/go/plugins/plugin/go.d/agent/module" + + "github.com/stretchr/testify/assert" + "github.com/stretchr/testify/require" +) + +var ( + dataConfigJSON, _ = os.ReadFile("testdata/config.json") + dataConfigYAML, _ = os.ReadFile("testdata/config.yaml") + + dataStatus, _ = os.ReadFile("testdata/status.txt") + dataPriorityStatus, _ = os.ReadFile("testdata/priority-status.txt") +) + +func Test_testDataIsValid(t *testing.T) { + for name, data := range map[string][]byte{ + "dataConfigJSON": dataConfigJSON, + "dataConfigYAML": dataConfigYAML, + + "dataStatus": dataStatus, + "dataPriorityStatus": dataPriorityStatus, + } { + require.NotNil(t, data, name) + } +} + +func TestGearman_ConfigurationSerialize(t *testing.T) { + module.TestConfigurationSerialize(t, &Gearman{}, dataConfigJSON, dataConfigYAML) +} + +func TestGearman_Init(t *testing.T) { + tests := map[string]struct { + config Config + wantFail bool + }{ + "success with default config": { + wantFail: false, + config: New().Config, + }, + "fails if address not set": { + wantFail: true, + config: func() Config { + conf := New().Config + conf.Address = "" + return conf + }(), + }, + } + + for name, test := range tests { + t.Run(name, func(t *testing.T) { + gear := New() + gear.Config = test.config + + if test.wantFail { + assert.Error(t, gear.Init()) + } else { + assert.NoError(t, gear.Init()) + } + }) + } +} + +func TestGearman_Cleanup(t *testing.T) { + tests := map[string]struct { + prepare func() *Gearman + }{ + "not initialized": { + prepare: func() *Gearman { + return New() + }, + }, + "after check": { + prepare: func() *Gearman { + gear := New() + gear.newConn = func(config Config) gearmanConn { return prepareMockOk() } + _ = gear.Check() + return gear + }, + }, + "after collect": { + prepare: func() *Gearman { + gear := New() + gear.newConn = func(config Config) gearmanConn { return prepareMockOk() } + _ = gear.Collect() + return gear + }, + }, + } + + for name, test := range tests { + t.Run(name, func(t *testing.T) { + gear := test.prepare() + + assert.NotPanics(t, gear.Cleanup) + }) + } +} + +func TestGearman_Charts(t *testing.T) { + assert.NotNil(t, New().Charts()) +} + +func TestGearman_Check(t *testing.T) { + tests := map[string]struct { + prepareMock func() *mockGearmanConn + wantFail bool + }{ + "success case": { + wantFail: false, + prepareMock: prepareMockOk, + }, + "err on connect": { + wantFail: true, + prepareMock: prepareMockErrOnConnect, + }, + "unexpected response": { + wantFail: true, + prepareMock: prepareMockUnexpectedResponse, + }, + "empty response": { + wantFail: false, + prepareMock: prepareMockEmptyResponse, + }, + } + + for name, test := range tests { + t.Run(name, func(t *testing.T) { + gear := New() + mock := test.prepareMock() + gear.newConn = func(config Config) gearmanConn { return mock } + + if test.wantFail { + assert.Error(t, gear.Check()) + } else { + assert.NoError(t, gear.Check()) + } + }) + } +} + +func TestGearman_Collect(t *testing.T) { + tests := map[string]struct { + prepareMock func() *mockGearmanConn + wantMetrics map[string]int64 + wantCharts int + disconnectBeforeCleanup bool + disconnectAfterCleanup bool + }{ + "success case": { + prepareMock: prepareMockOk, + disconnectBeforeCleanup: false, + disconnectAfterCleanup: true, + wantCharts: len(summaryCharts) + len(functionStatusChartsTmpl)*4 + len(functionPriorityStatusChartsTmpl)*4, + wantMetrics: map[string]int64{ + "function_generic_worker1_high_priority_jobs": 10, + "function_generic_worker1_jobs_queued": 4, + "function_generic_worker1_jobs_running": 3, + "function_generic_worker1_jobs_waiting": 1, + "function_generic_worker1_low_priority_jobs": 12, + "function_generic_worker1_normal_priority_jobs": 11, + "function_generic_worker1_workers_available": 500, + "function_generic_worker2_high_priority_jobs": 4, + "function_generic_worker2_jobs_queued": 78, + "function_generic_worker2_jobs_running": 78, + "function_generic_worker2_jobs_waiting": 0, + "function_generic_worker2_low_priority_jobs": 6, + "function_generic_worker2_normal_priority_jobs": 5, + "function_generic_worker2_workers_available": 500, + "function_generic_worker3_high_priority_jobs": 7, + "function_generic_worker3_jobs_queued": 2, + "function_generic_worker3_jobs_running": 1, + "function_generic_worker3_jobs_waiting": 1, + "function_generic_worker3_low_priority_jobs": 9, + "function_generic_worker3_normal_priority_jobs": 8, + "function_generic_worker3_workers_available": 760, + "function_prefix_generic_worker4_high_priority_jobs": 1, + "function_prefix_generic_worker4_jobs_queued": 78, + "function_prefix_generic_worker4_jobs_running": 78, + "function_prefix_generic_worker4_jobs_waiting": 0, + "function_prefix_generic_worker4_low_priority_jobs": 3, + "function_prefix_generic_worker4_normal_priority_jobs": 2, + "function_prefix_generic_worker4_workers_available": 500, + "total_high_priority_jobs": 22, + "total_jobs_queued": 162, + "total_jobs_running": 160, + "total_jobs_waiting": 2, + "total_low_priority_jobs": 30, + "total_normal_priority_jobs": 26, + "total_workers_avail": 0, + "total_workers_available": 2260, + }, + }, + "unexpected response": { + prepareMock: prepareMockUnexpectedResponse, + disconnectBeforeCleanup: false, + disconnectAfterCleanup: true, + }, + "empty response": { + prepareMock: prepareMockEmptyResponse, + disconnectBeforeCleanup: false, + disconnectAfterCleanup: true, + wantCharts: len(summaryCharts), + wantMetrics: map[string]int64{ + "total_high_priority_jobs": 0, + "total_jobs_queued": 0, + "total_jobs_running": 0, + "total_jobs_waiting": 0, + "total_low_priority_jobs": 0, + "total_normal_priority_jobs": 0, + "total_workers_avail": 0, + }, + }, + "err on connect": { + prepareMock: prepareMockErrOnConnect, + disconnectBeforeCleanup: false, + disconnectAfterCleanup: false, + }, + "err on query status": { + prepareMock: prepareMockErrOnQueryStatus, + disconnectBeforeCleanup: true, + disconnectAfterCleanup: true, + }, + } + + for name, test := range tests { + t.Run(name, func(t *testing.T) { + gear := New() + mock := test.prepareMock() + gear.newConn = func(config Config) gearmanConn { return mock } + + mx := gear.Collect() + + require.Equal(t, test.wantMetrics, mx, "want metrics") + + if len(test.wantMetrics) > 0 { + module.TestMetricsHasAllChartsDims(t, gear.Charts(), mx) + assert.Equal(t, test.wantCharts, len(*gear.Charts()), "want charts") + } + + assert.Equal(t, test.disconnectBeforeCleanup, mock.disconnectCalled, "disconnect before cleanup") + gear.Cleanup() + assert.Equal(t, test.disconnectAfterCleanup, mock.disconnectCalled, "disconnect after cleanup") + }) + } +} + +func prepareMockOk() *mockGearmanConn { + return &mockGearmanConn{ + responseStatus: dataStatus, + responsePriorityStatus: dataPriorityStatus, + } +} + +func prepareMockErrOnConnect() *mockGearmanConn { + return &mockGearmanConn{ + errOnConnect: true, + } +} + +func prepareMockErrOnQueryStatus() *mockGearmanConn { + return &mockGearmanConn{ + errOnQueryStatus: true, + } +} + +func prepareMockUnexpectedResponse() *mockGearmanConn { + resp := []byte("Lorem ipsum dolor sit amet, consectetur adipiscing elit.") + return &mockGearmanConn{ + responseStatus: resp, + responsePriorityStatus: resp, + } +} + +func prepareMockEmptyResponse() *mockGearmanConn { + return &mockGearmanConn{ + responseStatus: []byte("."), + responsePriorityStatus: []byte("."), + } +} + +type mockGearmanConn struct { + errOnConnect bool + + responseStatus []byte + errOnQueryStatus bool + + responsePriorityStatus []byte + errOnQueryPriorityStatus bool + + disconnectCalled bool +} + +func (m *mockGearmanConn) connect() error { + if m.errOnConnect { + return errors.New("mock.connect() error") + } + return nil +} + +func (m *mockGearmanConn) disconnect() { + m.disconnectCalled = true +} + +func (m *mockGearmanConn) queryStatus() ([]byte, error) { + if m.errOnQueryStatus { + return nil, errors.New("mock.queryStatus() error") + } + return m.responseStatus, nil +} + +func (m *mockGearmanConn) queryPriorityStatus() ([]byte, error) { + if m.errOnQueryPriorityStatus { + return nil, errors.New("mock.queryPriorityStatus() error") + } + return m.responsePriorityStatus, nil +} diff --git a/src/go/plugin/go.d/modules/gearman/integrations/gearman.md b/src/go/plugin/go.d/modules/gearman/integrations/gearman.md new file mode 100644 index 000000000..0a97a4cd4 --- /dev/null +++ b/src/go/plugin/go.d/modules/gearman/integrations/gearman.md @@ -0,0 +1,235 @@ +<!--startmeta +custom_edit_url: "https://github.com/netdata/netdata/edit/master/src/go/plugin/go.d/modules/gearman/README.md" +meta_yaml: "https://github.com/netdata/netdata/edit/master/src/go/plugin/go.d/modules/gearman/metadata.yaml" +sidebar_label: "Gearman" +learn_status: "Published" +learn_rel_path: "Collecting Metrics/Distributed Computing Systems" +most_popular: False +message: "DO NOT EDIT THIS FILE DIRECTLY, IT IS GENERATED BY THE COLLECTOR'S metadata.yaml FILE" +endmeta--> + +# Gearman + + +<img src="https://netdata.cloud/img/gearman.png" width="150"/> + + +Plugin: go.d.plugin +Module: gearman + +<img src="https://img.shields.io/badge/maintained%20by-Netdata-%2300ab44" /> + +## Overview + +Monitors jobs activity, priority and available workers. It collects summary and function-specific statistics. + + +This collector connects to a Gearman instance via TCP socket and executes the following commands: + +- status +- priority-status + + +This collector is supported on all platforms. + +This collector supports collecting metrics from multiple instances of this integration, including remote instances. + + +### Default Behavior + +#### Auto-Detection + +By default, it detects Gearman instances running on localhost that are listening on port 4730. + + +#### Limits + +The default configuration for this integration does not impose any limits on data collection. + +#### Performance Impact + +The default configuration for this integration is not expected to impose a significant performance impact on the system. + + +## Metrics + +Metrics grouped by *scope*. + +The scope defines the instance that the metric belongs to. An instance is uniquely identified by a set of labels. + + + +### Per Gearman instance + +These metrics refer to the entire monitored application. + +This scope has no labels. + +Metrics: + +| Metric | Dimensions | Unit | +|:------|:----------|:----| +| gearman.queued_jobs_activity | running, waiting | jobs | +| gearman.queued_jobs_priority | high, normal, low | jobs | + +### Per Gearman instance + +These metrics refer to the Function (task). + +Labels: + +| Label | Description | +|:-----------|:----------------| +| function_name | Function name. | + +Metrics: + +| Metric | Dimensions | Unit | +|:------|:----------|:----| +| gearman.function_queued_jobs_activity | running, waiting | jobs | +| gearman.function_queued_jobs_priority | high, normal, low | jobs | +| gearman.function_workers | available | workers | + + + +## Alerts + +There are no alerts configured by default for this integration. + + +## Setup + +### Prerequisites + +No action required. + +### Configuration + +#### File + +The configuration file name for this integration is `go.d/gearman.conf`. + + +You can edit the configuration file using the `edit-config` script from the +Netdata [config directory](/docs/netdata-agent/configuration/README.md#the-netdata-config-directory). + +```bash +cd /etc/netdata 2>/dev/null || cd /opt/netdata/etc/netdata +sudo ./edit-config go.d/gearman.conf +``` +#### Options + +The following options can be defined globally: update_every, autodetection_retry. + + +<details open><summary>Config options</summary> + +| Name | Description | Default | Required | +|:----|:-----------|:-------|:--------:| +| update_every | Data collection frequency. | 1 | no | +| autodetection_retry | Recheck interval in seconds. Zero means no recheck will be scheduled. | 0 | no | +| address | The IP address and port where the Gearman service listens for connections. | 127.0.0.1:11211 | yes | +| timeout | Connection, read, and write timeout duration in seconds. The timeout includes name resolution. | 1 | no | + +</details> + +#### Examples + +##### Basic + +A basic example configuration. + +<details open><summary>Config</summary> + +```yaml +jobs: + - name: local + address: 127.0.0.1:4730 + +``` +</details> + +##### Multi-instance + +> **Note**: When you define multiple jobs, their names must be unique. + +Collecting metrics from local and remote instances. + + +<details open><summary>Config</summary> + +```yaml +jobs: + - name: local + address: 127.0.0.1:4730 + + - name: remote + address: 203.0.113.0:4730 + +``` +</details> + + + +## Troubleshooting + +### Debug Mode + +**Important**: Debug mode is not supported for data collection jobs created via the UI using the Dyncfg feature. + +To troubleshoot issues with the `gearman` collector, run the `go.d.plugin` with the debug option enabled. The output +should give you clues as to why the collector isn't working. + +- Navigate to the `plugins.d` directory, usually at `/usr/libexec/netdata/plugins.d/`. If that's not the case on + your system, open `netdata.conf` and look for the `plugins` setting under `[directories]`. + + ```bash + cd /usr/libexec/netdata/plugins.d/ + ``` + +- Switch to the `netdata` user. + + ```bash + sudo -u netdata -s + ``` + +- Run the `go.d.plugin` to debug the collector: + + ```bash + ./go.d.plugin -d -m gearman + ``` + +### Getting Logs + +If you're encountering problems with the `gearman` collector, follow these steps to retrieve logs and identify potential issues: + +- **Run the command** specific to your system (systemd, non-systemd, or Docker container). +- **Examine the output** for any warnings or error messages that might indicate issues. These messages should provide clues about the root cause of the problem. + +#### System with systemd + +Use the following command to view logs generated since the last Netdata service restart: + +```bash +journalctl _SYSTEMD_INVOCATION_ID="$(systemctl show --value --property=InvocationID netdata)" --namespace=netdata --grep gearman +``` + +#### System without systemd + +Locate the collector log file, typically at `/var/log/netdata/collector.log`, and use `grep` to filter for collector's name: + +```bash +grep gearman /var/log/netdata/collector.log +``` + +**Note**: This method shows logs from all restarts. Focus on the **latest entries** for troubleshooting current issues. + +#### Docker Container + +If your Netdata runs in a Docker container named "netdata" (replace if different), use this command: + +```bash +docker logs netdata 2>&1 | grep gearman +``` + + diff --git a/src/go/plugin/go.d/modules/gearman/metadata.yaml b/src/go/plugin/go.d/modules/gearman/metadata.yaml new file mode 100644 index 000000000..2312c9a53 --- /dev/null +++ b/src/go/plugin/go.d/modules/gearman/metadata.yaml @@ -0,0 +1,152 @@ +plugin_name: go.d.plugin +modules: + - meta: + id: collector-go.d.plugin-gearman + plugin_name: go.d.plugin + module_name: gearman + monitored_instance: + name: Gearman + link: https://gearman.org/ + categories: + - data-collection.distributed-computing-systems + icon_filename: "gearman.png" + related_resources: + integrations: + list: [] + info_provided_to_referring_integrations: + description: "" + keywords: + - gearman + most_popular: false + overview: + data_collection: + metrics_description: | + Monitors jobs activity, priority and available workers. It collects summary and function-specific statistics. + method_description: | + This collector connects to a Gearman instance via TCP socket and executes the following commands: + + - status + - priority-status + supported_platforms: + include: [] + exclude: [] + multi_instance: true + additional_permissions: + description: "" + default_behavior: + auto_detection: + description: | + By default, it detects Gearman instances running on localhost that are listening on port 4730. + limits: + description: "" + performance_impact: + description: "" + setup: + prerequisites: + list: [] + configuration: + file: + name: go.d/gearman.conf + options: + description: | + The following options can be defined globally: update_every, autodetection_retry. + folding: + title: Config options + enabled: true + list: + - name: update_every + description: Data collection frequency. + default_value: 1 + required: false + - name: autodetection_retry + description: Recheck interval in seconds. Zero means no recheck will be scheduled. + default_value: 0 + required: false + - name: address + description: The IP address and port where the Gearman service listens for connections. + default_value: 127.0.0.1:11211 + required: true + - name: timeout + description: Connection, read, and write timeout duration in seconds. The timeout includes name resolution. + default_value: 1 + required: false + examples: + folding: + title: Config + enabled: true + list: + - name: Basic + description: A basic example configuration. + config: | + jobs: + - name: local + address: 127.0.0.1:4730 + - name: Multi-instance + description: | + > **Note**: When you define multiple jobs, their names must be unique. + + Collecting metrics from local and remote instances. + config: | + jobs: + - name: local + address: 127.0.0.1:4730 + + - name: remote + address: 203.0.113.0:4730 + troubleshooting: + problems: + list: [] + alerts: [] + metrics: + folding: + title: Metrics + enabled: false + description: "" + availability: [] + scopes: + - name: global + description: "These metrics refer to the entire monitored application." + labels: [] + metrics: + - name: gearman.queued_jobs_activity + description: Jobs Activity + unit: "jobs" + chart_type: stacked + dimensions: + - name: running + - name: waiting + - name: gearman.queued_jobs_priority + description: Jobs Priority + unit: "jobs" + chart_type: stacked + dimensions: + - name: high + - name: normal + - name: low + - name: global + description: "These metrics refer to the Function (task)." + labels: + - name: function_name + description: Function name. + metrics: + - name: gearman.function_queued_jobs_activity + description: Function Jobs Activity + unit: "jobs" + chart_type: stacked + dimensions: + - name: running + - name: waiting + - name: gearman.function_queued_jobs_priority + description: Function Jobs Priority + unit: "jobs" + chart_type: stacked + dimensions: + - name: high + - name: normal + - name: low + - name: gearman.function_workers + description: Function Workers + unit: "workers" + chart_type: line + dimensions: + - name: available diff --git a/src/go/plugin/go.d/modules/gearman/testdata/config.json b/src/go/plugin/go.d/modules/gearman/testdata/config.json new file mode 100644 index 000000000..e86834720 --- /dev/null +++ b/src/go/plugin/go.d/modules/gearman/testdata/config.json @@ -0,0 +1,5 @@ +{ + "update_every": 123, + "address": "ok", + "timeout": 123.123 +} diff --git a/src/go/plugin/go.d/modules/gearman/testdata/config.yaml b/src/go/plugin/go.d/modules/gearman/testdata/config.yaml new file mode 100644 index 000000000..1b81d09eb --- /dev/null +++ b/src/go/plugin/go.d/modules/gearman/testdata/config.yaml @@ -0,0 +1,3 @@ +update_every: 123 +address: "ok" +timeout: 123.123 diff --git a/src/go/plugin/go.d/modules/gearman/testdata/priority-status.txt b/src/go/plugin/go.d/modules/gearman/testdata/priority-status.txt new file mode 100644 index 000000000..3cb669d10 --- /dev/null +++ b/src/go/plugin/go.d/modules/gearman/testdata/priority-status.txt @@ -0,0 +1,5 @@ +prefix generic_worker4 1 2 3 500 +generic_worker2 4 5 6 500 +generic_worker3 7 8 9 760 +generic_worker1 10 11 12 500 +. diff --git a/src/go/plugin/go.d/modules/gearman/testdata/status.txt b/src/go/plugin/go.d/modules/gearman/testdata/status.txt new file mode 100644 index 000000000..33d77ab83 --- /dev/null +++ b/src/go/plugin/go.d/modules/gearman/testdata/status.txt @@ -0,0 +1,5 @@ +prefix generic_worker4 78 78 500 +generic_worker2 78 78 500 +generic_worker3 2 1 760 +generic_worker1 4 3 500 +. diff --git a/src/go/collectors/go.d.plugin/modules/geth/README.md b/src/go/plugin/go.d/modules/geth/README.md index 3a8eb0b68..3a8eb0b68 120000 --- a/src/go/collectors/go.d.plugin/modules/geth/README.md +++ b/src/go/plugin/go.d/modules/geth/README.md diff --git a/src/go/collectors/go.d.plugin/modules/geth/charts.go b/src/go/plugin/go.d/modules/geth/charts.go index 316631739..5b87168a8 100644 --- a/src/go/collectors/go.d.plugin/modules/geth/charts.go +++ b/src/go/plugin/go.d/modules/geth/charts.go @@ -2,7 +2,7 @@ package geth -import "github.com/netdata/netdata/go/go.d.plugin/agent/module" +import "github.com/netdata/netdata/go/plugins/plugin/go.d/agent/module" type ( Charts = module.Charts diff --git a/src/go/collectors/go.d.plugin/modules/geth/collect.go b/src/go/plugin/go.d/modules/geth/collect.go index dfdf54946..bd7b1d5b3 100644 --- a/src/go/collectors/go.d.plugin/modules/geth/collect.go +++ b/src/go/plugin/go.d/modules/geth/collect.go @@ -3,8 +3,8 @@ package geth import ( - "github.com/netdata/netdata/go/go.d.plugin/pkg/prometheus" - "github.com/netdata/netdata/go/go.d.plugin/pkg/stm" + "github.com/netdata/netdata/go/plugins/plugin/go.d/pkg/prometheus" + "github.com/netdata/netdata/go/plugins/plugin/go.d/pkg/stm" ) func (g *Geth) collect() (map[string]int64, error) { diff --git a/src/go/collectors/go.d.plugin/modules/geth/config_schema.json b/src/go/plugin/go.d/modules/geth/config_schema.json index 3fd239e4f..00b3071d0 100644 --- a/src/go/collectors/go.d.plugin/modules/geth/config_schema.json +++ b/src/go/plugin/go.d/modules/geth/config_schema.json @@ -167,6 +167,12 @@ "timeout": { "ui:help": "Accepts decimals for precise control (e.g., type 1.5 for 1.5 seconds)." }, + "username": { + "ui:widget": "password" + }, + "proxy_username": { + "ui:widget": "password" + }, "password": { "ui:widget": "password" }, diff --git a/src/go/collectors/go.d.plugin/modules/geth/geth.go b/src/go/plugin/go.d/modules/geth/geth.go index 070ad058a..6448965f5 100644 --- a/src/go/collectors/go.d.plugin/modules/geth/geth.go +++ b/src/go/plugin/go.d/modules/geth/geth.go @@ -7,9 +7,9 @@ import ( "errors" "time" - "github.com/netdata/netdata/go/go.d.plugin/agent/module" - "github.com/netdata/netdata/go/go.d.plugin/pkg/prometheus" - "github.com/netdata/netdata/go/go.d.plugin/pkg/web" + "github.com/netdata/netdata/go/plugins/plugin/go.d/agent/module" + "github.com/netdata/netdata/go/plugins/plugin/go.d/pkg/prometheus" + "github.com/netdata/netdata/go/plugins/plugin/go.d/pkg/web" ) //go:embed "config_schema.json" diff --git a/src/go/collectors/go.d.plugin/modules/geth/geth_test.go b/src/go/plugin/go.d/modules/geth/geth_test.go index 68c38385e..c68701c14 100644 --- a/src/go/collectors/go.d.plugin/modules/geth/geth_test.go +++ b/src/go/plugin/go.d/modules/geth/geth_test.go @@ -6,7 +6,7 @@ import ( "os" "testing" - "github.com/netdata/netdata/go/go.d.plugin/agent/module" + "github.com/netdata/netdata/go/plugins/plugin/go.d/agent/module" "github.com/stretchr/testify/require" ) diff --git a/src/go/collectors/go.d.plugin/modules/geth/init.go b/src/go/plugin/go.d/modules/geth/init.go index 9b649f859..da908560e 100644 --- a/src/go/collectors/go.d.plugin/modules/geth/init.go +++ b/src/go/plugin/go.d/modules/geth/init.go @@ -3,8 +3,8 @@ package geth import ( "errors" - "github.com/netdata/netdata/go/go.d.plugin/pkg/prometheus" - "github.com/netdata/netdata/go/go.d.plugin/pkg/web" + "github.com/netdata/netdata/go/plugins/plugin/go.d/pkg/prometheus" + "github.com/netdata/netdata/go/plugins/plugin/go.d/pkg/web" ) func (g *Geth) validateConfig() error { diff --git a/src/go/collectors/go.d.plugin/modules/geth/integrations/go-ethereum.md b/src/go/plugin/go.d/modules/geth/integrations/go-ethereum.md index c14b0a7b9..86f830529 100644 --- a/src/go/collectors/go.d.plugin/modules/geth/integrations/go-ethereum.md +++ b/src/go/plugin/go.d/modules/geth/integrations/go-ethereum.md @@ -1,6 +1,6 @@ <!--startmeta -custom_edit_url: "https://github.com/netdata/netdata/edit/master/src/go/collectors/go.d.plugin/modules/geth/README.md" -meta_yaml: "https://github.com/netdata/netdata/edit/master/src/go/collectors/go.d.plugin/modules/geth/metadata.yaml" +custom_edit_url: "https://github.com/netdata/netdata/edit/master/src/go/plugin/go.d/modules/geth/README.md" +meta_yaml: "https://github.com/netdata/netdata/edit/master/src/go/plugin/go.d/modules/geth/metadata.yaml" sidebar_label: "Go-ethereum" learn_status: "Published" learn_rel_path: "Collecting Metrics/Blockchain Servers" @@ -192,6 +192,8 @@ jobs: ### Debug Mode +**Important**: Debug mode is not supported for data collection jobs created via the UI using the Dyncfg feature. + To troubleshoot issues with the `geth` collector, run the `go.d.plugin` with the debug option enabled. The output should give you clues as to why the collector isn't working. @@ -214,4 +216,37 @@ should give you clues as to why the collector isn't working. ./go.d.plugin -d -m geth ``` +### Getting Logs + +If you're encountering problems with the `geth` collector, follow these steps to retrieve logs and identify potential issues: + +- **Run the command** specific to your system (systemd, non-systemd, or Docker container). +- **Examine the output** for any warnings or error messages that might indicate issues. These messages should provide clues about the root cause of the problem. + +#### System with systemd + +Use the following command to view logs generated since the last Netdata service restart: + +```bash +journalctl _SYSTEMD_INVOCATION_ID="$(systemctl show --value --property=InvocationID netdata)" --namespace=netdata --grep geth +``` + +#### System without systemd + +Locate the collector log file, typically at `/var/log/netdata/collector.log`, and use `grep` to filter for collector's name: + +```bash +grep geth /var/log/netdata/collector.log +``` + +**Note**: This method shows logs from all restarts. Focus on the **latest entries** for troubleshooting current issues. + +#### Docker Container + +If your Netdata runs in a Docker container named "netdata" (replace if different), use this command: + +```bash +docker logs netdata 2>&1 | grep geth +``` + diff --git a/src/go/collectors/go.d.plugin/modules/geth/metadata.yaml b/src/go/plugin/go.d/modules/geth/metadata.yaml index ef131776a..ef131776a 100644 --- a/src/go/collectors/go.d.plugin/modules/geth/metadata.yaml +++ b/src/go/plugin/go.d/modules/geth/metadata.yaml diff --git a/src/go/collectors/go.d.plugin/modules/geth/metrics.go b/src/go/plugin/go.d/modules/geth/metrics.go index 642973d69..642973d69 100644 --- a/src/go/collectors/go.d.plugin/modules/geth/metrics.go +++ b/src/go/plugin/go.d/modules/geth/metrics.go diff --git a/src/go/collectors/go.d.plugin/modules/geth/testdata/config.json b/src/go/plugin/go.d/modules/geth/testdata/config.json index 984c3ed6e..984c3ed6e 100644 --- a/src/go/collectors/go.d.plugin/modules/geth/testdata/config.json +++ b/src/go/plugin/go.d/modules/geth/testdata/config.json diff --git a/src/go/collectors/go.d.plugin/modules/geth/testdata/config.yaml b/src/go/plugin/go.d/modules/geth/testdata/config.yaml index 8558b61cc..8558b61cc 100644 --- a/src/go/collectors/go.d.plugin/modules/geth/testdata/config.yaml +++ b/src/go/plugin/go.d/modules/geth/testdata/config.yaml diff --git a/src/go/collectors/go.d.plugin/modules/geth/testdata/metrics_geth.txt b/src/go/plugin/go.d/modules/geth/testdata/metrics_geth.txt index 055fea893..055fea893 100644 --- a/src/go/collectors/go.d.plugin/modules/geth/testdata/metrics_geth.txt +++ b/src/go/plugin/go.d/modules/geth/testdata/metrics_geth.txt diff --git a/src/go/collectors/go.d.plugin/modules/haproxy/README.md b/src/go/plugin/go.d/modules/haproxy/README.md index 2f52cf846..2f52cf846 120000 --- a/src/go/collectors/go.d.plugin/modules/haproxy/README.md +++ b/src/go/plugin/go.d/modules/haproxy/README.md diff --git a/src/go/collectors/go.d.plugin/modules/haproxy/charts.go b/src/go/plugin/go.d/modules/haproxy/charts.go index 503094c58..e7118a078 100644 --- a/src/go/collectors/go.d.plugin/modules/haproxy/charts.go +++ b/src/go/plugin/go.d/modules/haproxy/charts.go @@ -5,7 +5,7 @@ package haproxy import ( "fmt" - "github.com/netdata/netdata/go/go.d.plugin/agent/module" + "github.com/netdata/netdata/go/plugins/plugin/go.d/agent/module" ) var charts = module.Charts{ diff --git a/src/go/collectors/go.d.plugin/modules/haproxy/collect.go b/src/go/plugin/go.d/modules/haproxy/collect.go index 203ff1ec4..e3ade66a5 100644 --- a/src/go/collectors/go.d.plugin/modules/haproxy/collect.go +++ b/src/go/plugin/go.d/modules/haproxy/collect.go @@ -6,8 +6,8 @@ import ( "errors" "strings" - "github.com/netdata/netdata/go/go.d.plugin/agent/module" - "github.com/netdata/netdata/go/go.d.plugin/pkg/prometheus" + "github.com/netdata/netdata/go/plugins/plugin/go.d/agent/module" + "github.com/netdata/netdata/go/plugins/plugin/go.d/pkg/prometheus" ) const ( diff --git a/src/go/collectors/go.d.plugin/modules/haproxy/config_schema.json b/src/go/plugin/go.d/modules/haproxy/config_schema.json index a5d43236c..6a794145e 100644 --- a/src/go/collectors/go.d.plugin/modules/haproxy/config_schema.json +++ b/src/go/plugin/go.d/modules/haproxy/config_schema.json @@ -167,6 +167,12 @@ "timeout": { "ui:help": "Accepts decimals for precise control (e.g., type 1.5 for 1.5 seconds)." }, + "username": { + "ui:widget": "password" + }, + "proxy_username": { + "ui:widget": "password" + }, "password": { "ui:widget": "password" }, diff --git a/src/go/collectors/go.d.plugin/modules/haproxy/haproxy.go b/src/go/plugin/go.d/modules/haproxy/haproxy.go index 217eb3c22..0e3f9f3d1 100644 --- a/src/go/collectors/go.d.plugin/modules/haproxy/haproxy.go +++ b/src/go/plugin/go.d/modules/haproxy/haproxy.go @@ -7,9 +7,9 @@ import ( "errors" "time" - "github.com/netdata/netdata/go/go.d.plugin/agent/module" - "github.com/netdata/netdata/go/go.d.plugin/pkg/prometheus" - "github.com/netdata/netdata/go/go.d.plugin/pkg/web" + "github.com/netdata/netdata/go/plugins/plugin/go.d/agent/module" + "github.com/netdata/netdata/go/plugins/plugin/go.d/pkg/prometheus" + "github.com/netdata/netdata/go/plugins/plugin/go.d/pkg/web" ) //go:embed "config_schema.json" diff --git a/src/go/collectors/go.d.plugin/modules/haproxy/haproxy_test.go b/src/go/plugin/go.d/modules/haproxy/haproxy_test.go index 3566d17e4..80a733ffb 100644 --- a/src/go/collectors/go.d.plugin/modules/haproxy/haproxy_test.go +++ b/src/go/plugin/go.d/modules/haproxy/haproxy_test.go @@ -8,9 +8,9 @@ import ( "os" "testing" - "github.com/netdata/netdata/go/go.d.plugin/agent/module" - "github.com/netdata/netdata/go/go.d.plugin/pkg/tlscfg" - "github.com/netdata/netdata/go/go.d.plugin/pkg/web" + "github.com/netdata/netdata/go/plugins/plugin/go.d/agent/module" + "github.com/netdata/netdata/go/plugins/plugin/go.d/pkg/tlscfg" + "github.com/netdata/netdata/go/plugins/plugin/go.d/pkg/web" "github.com/stretchr/testify/assert" "github.com/stretchr/testify/require" diff --git a/src/go/collectors/go.d.plugin/modules/haproxy/init.go b/src/go/plugin/go.d/modules/haproxy/init.go index 55c669000..0922a9b2d 100644 --- a/src/go/collectors/go.d.plugin/modules/haproxy/init.go +++ b/src/go/plugin/go.d/modules/haproxy/init.go @@ -5,9 +5,9 @@ package haproxy import ( "errors" - "github.com/netdata/netdata/go/go.d.plugin/pkg/prometheus" - "github.com/netdata/netdata/go/go.d.plugin/pkg/prometheus/selector" - "github.com/netdata/netdata/go/go.d.plugin/pkg/web" + "github.com/netdata/netdata/go/plugins/plugin/go.d/pkg/prometheus" + "github.com/netdata/netdata/go/plugins/plugin/go.d/pkg/prometheus/selector" + "github.com/netdata/netdata/go/plugins/plugin/go.d/pkg/web" ) func (h *Haproxy) validateConfig() error { diff --git a/src/go/collectors/go.d.plugin/modules/haproxy/integrations/haproxy.md b/src/go/plugin/go.d/modules/haproxy/integrations/haproxy.md index af6d3c9be..1619b9d70 100644 --- a/src/go/collectors/go.d.plugin/modules/haproxy/integrations/haproxy.md +++ b/src/go/plugin/go.d/modules/haproxy/integrations/haproxy.md @@ -1,6 +1,6 @@ <!--startmeta -custom_edit_url: "https://github.com/netdata/netdata/edit/master/src/go/collectors/go.d.plugin/modules/haproxy/README.md" -meta_yaml: "https://github.com/netdata/netdata/edit/master/src/go/collectors/go.d.plugin/modules/haproxy/metadata.yaml" +custom_edit_url: "https://github.com/netdata/netdata/edit/master/src/go/plugin/go.d/modules/haproxy/README.md" +meta_yaml: "https://github.com/netdata/netdata/edit/master/src/go/plugin/go.d/modules/haproxy/metadata.yaml" sidebar_label: "HAProxy" learn_status: "Published" learn_rel_path: "Collecting Metrics/Web Servers and Web Proxies" @@ -216,6 +216,8 @@ jobs: ### Debug Mode +**Important**: Debug mode is not supported for data collection jobs created via the UI using the Dyncfg feature. + To troubleshoot issues with the `haproxy` collector, run the `go.d.plugin` with the debug option enabled. The output should give you clues as to why the collector isn't working. @@ -238,4 +240,37 @@ should give you clues as to why the collector isn't working. ./go.d.plugin -d -m haproxy ``` +### Getting Logs + +If you're encountering problems with the `haproxy` collector, follow these steps to retrieve logs and identify potential issues: + +- **Run the command** specific to your system (systemd, non-systemd, or Docker container). +- **Examine the output** for any warnings or error messages that might indicate issues. These messages should provide clues about the root cause of the problem. + +#### System with systemd + +Use the following command to view logs generated since the last Netdata service restart: + +```bash +journalctl _SYSTEMD_INVOCATION_ID="$(systemctl show --value --property=InvocationID netdata)" --namespace=netdata --grep haproxy +``` + +#### System without systemd + +Locate the collector log file, typically at `/var/log/netdata/collector.log`, and use `grep` to filter for collector's name: + +```bash +grep haproxy /var/log/netdata/collector.log +``` + +**Note**: This method shows logs from all restarts. Focus on the **latest entries** for troubleshooting current issues. + +#### Docker Container + +If your Netdata runs in a Docker container named "netdata" (replace if different), use this command: + +```bash +docker logs netdata 2>&1 | grep haproxy +``` + diff --git a/src/go/collectors/go.d.plugin/modules/haproxy/metadata.yaml b/src/go/plugin/go.d/modules/haproxy/metadata.yaml index adc879602..adc879602 100644 --- a/src/go/collectors/go.d.plugin/modules/haproxy/metadata.yaml +++ b/src/go/plugin/go.d/modules/haproxy/metadata.yaml diff --git a/src/go/collectors/go.d.plugin/modules/haproxy/testdata/config.json b/src/go/plugin/go.d/modules/haproxy/testdata/config.json index 984c3ed6e..984c3ed6e 100644 --- a/src/go/collectors/go.d.plugin/modules/haproxy/testdata/config.json +++ b/src/go/plugin/go.d/modules/haproxy/testdata/config.json diff --git a/src/go/collectors/go.d.plugin/modules/haproxy/testdata/config.yaml b/src/go/plugin/go.d/modules/haproxy/testdata/config.yaml index 8558b61cc..8558b61cc 100644 --- a/src/go/collectors/go.d.plugin/modules/haproxy/testdata/config.yaml +++ b/src/go/plugin/go.d/modules/haproxy/testdata/config.yaml diff --git a/src/go/collectors/go.d.plugin/modules/haproxy/testdata/v2.3.10/metrics.txt b/src/go/plugin/go.d/modules/haproxy/testdata/v2.3.10/metrics.txt index a156485d9..a156485d9 100644 --- a/src/go/collectors/go.d.plugin/modules/haproxy/testdata/v2.3.10/metrics.txt +++ b/src/go/plugin/go.d/modules/haproxy/testdata/v2.3.10/metrics.txt diff --git a/src/go/collectors/go.d.plugin/modules/hddtemp/README.md b/src/go/plugin/go.d/modules/hddtemp/README.md index 95c7593f8..95c7593f8 120000 --- a/src/go/collectors/go.d.plugin/modules/hddtemp/README.md +++ b/src/go/plugin/go.d/modules/hddtemp/README.md diff --git a/src/go/collectors/go.d.plugin/modules/hddtemp/charts.go b/src/go/plugin/go.d/modules/hddtemp/charts.go index 7a5e9ed9f..7e0766c4f 100644 --- a/src/go/collectors/go.d.plugin/modules/hddtemp/charts.go +++ b/src/go/plugin/go.d/modules/hddtemp/charts.go @@ -6,7 +6,7 @@ import ( "fmt" "strings" - "github.com/netdata/netdata/go/go.d.plugin/agent/module" + "github.com/netdata/netdata/go/plugins/plugin/go.d/agent/module" ) const ( diff --git a/src/go/collectors/go.d.plugin/modules/hddtemp/client.go b/src/go/plugin/go.d/modules/hddtemp/client.go index 626381ee8..b89be10a2 100644 --- a/src/go/collectors/go.d.plugin/modules/hddtemp/client.go +++ b/src/go/plugin/go.d/modules/hddtemp/client.go @@ -3,7 +3,7 @@ package hddtemp import ( - "github.com/netdata/netdata/go/go.d.plugin/pkg/socket" + "github.com/netdata/netdata/go/plugins/plugin/go.d/pkg/socket" ) func newHddTempConn(conf Config) hddtempConn { diff --git a/src/go/collectors/go.d.plugin/modules/hddtemp/collect.go b/src/go/plugin/go.d/modules/hddtemp/collect.go index f5c75db04..f5c75db04 100644 --- a/src/go/collectors/go.d.plugin/modules/hddtemp/collect.go +++ b/src/go/plugin/go.d/modules/hddtemp/collect.go diff --git a/src/go/collectors/go.d.plugin/modules/hddtemp/config_schema.json b/src/go/plugin/go.d/modules/hddtemp/config_schema.json index 2858fbe02..2858fbe02 100644 --- a/src/go/collectors/go.d.plugin/modules/hddtemp/config_schema.json +++ b/src/go/plugin/go.d/modules/hddtemp/config_schema.json diff --git a/src/go/collectors/go.d.plugin/modules/hddtemp/hddtemp.go b/src/go/plugin/go.d/modules/hddtemp/hddtemp.go index 119974c4a..ac283d6ee 100644 --- a/src/go/collectors/go.d.plugin/modules/hddtemp/hddtemp.go +++ b/src/go/plugin/go.d/modules/hddtemp/hddtemp.go @@ -7,8 +7,8 @@ import ( "errors" "time" - "github.com/netdata/netdata/go/go.d.plugin/agent/module" - "github.com/netdata/netdata/go/go.d.plugin/pkg/web" + "github.com/netdata/netdata/go/plugins/plugin/go.d/agent/module" + "github.com/netdata/netdata/go/plugins/plugin/go.d/pkg/web" ) //go:embed "config_schema.json" diff --git a/src/go/collectors/go.d.plugin/modules/hddtemp/hddtemp_test.go b/src/go/plugin/go.d/modules/hddtemp/hddtemp_test.go index cab4ceb97..d20d79edb 100644 --- a/src/go/collectors/go.d.plugin/modules/hddtemp/hddtemp_test.go +++ b/src/go/plugin/go.d/modules/hddtemp/hddtemp_test.go @@ -7,7 +7,7 @@ import ( "os" "testing" - "github.com/netdata/netdata/go/go.d.plugin/agent/module" + "github.com/netdata/netdata/go/plugins/plugin/go.d/agent/module" "github.com/stretchr/testify/assert" "github.com/stretchr/testify/require" diff --git a/src/go/collectors/go.d.plugin/modules/hddtemp/integrations/hdd_temperature.md b/src/go/plugin/go.d/modules/hddtemp/integrations/hdd_temperature.md index be91e67f0..3d5f3e71a 100644 --- a/src/go/collectors/go.d.plugin/modules/hddtemp/integrations/hdd_temperature.md +++ b/src/go/plugin/go.d/modules/hddtemp/integrations/hdd_temperature.md @@ -1,6 +1,6 @@ <!--startmeta -custom_edit_url: "https://github.com/netdata/netdata/edit/master/src/go/collectors/go.d.plugin/modules/hddtemp/README.md" -meta_yaml: "https://github.com/netdata/netdata/edit/master/src/go/collectors/go.d.plugin/modules/hddtemp/metadata.yaml" +custom_edit_url: "https://github.com/netdata/netdata/edit/master/src/go/plugin/go.d/modules/hddtemp/README.md" +meta_yaml: "https://github.com/netdata/netdata/edit/master/src/go/plugin/go.d/modules/hddtemp/metadata.yaml" sidebar_label: "HDD temperature" learn_status: "Published" learn_rel_path: "Collecting Metrics/Hardware Devices and Sensors" @@ -164,6 +164,8 @@ jobs: ### Debug Mode +**Important**: Debug mode is not supported for data collection jobs created via the UI using the Dyncfg feature. + To troubleshoot issues with the `hddtemp` collector, run the `go.d.plugin` with the debug option enabled. The output should give you clues as to why the collector isn't working. @@ -186,4 +188,37 @@ should give you clues as to why the collector isn't working. ./go.d.plugin -d -m hddtemp ``` +### Getting Logs + +If you're encountering problems with the `hddtemp` collector, follow these steps to retrieve logs and identify potential issues: + +- **Run the command** specific to your system (systemd, non-systemd, or Docker container). +- **Examine the output** for any warnings or error messages that might indicate issues. These messages should provide clues about the root cause of the problem. + +#### System with systemd + +Use the following command to view logs generated since the last Netdata service restart: + +```bash +journalctl _SYSTEMD_INVOCATION_ID="$(systemctl show --value --property=InvocationID netdata)" --namespace=netdata --grep hddtemp +``` + +#### System without systemd + +Locate the collector log file, typically at `/var/log/netdata/collector.log`, and use `grep` to filter for collector's name: + +```bash +grep hddtemp /var/log/netdata/collector.log +``` + +**Note**: This method shows logs from all restarts. Focus on the **latest entries** for troubleshooting current issues. + +#### Docker Container + +If your Netdata runs in a Docker container named "netdata" (replace if different), use this command: + +```bash +docker logs netdata 2>&1 | grep hddtemp +``` + diff --git a/src/go/collectors/go.d.plugin/modules/hddtemp/metadata.yaml b/src/go/plugin/go.d/modules/hddtemp/metadata.yaml index 74206ebc9..74206ebc9 100644 --- a/src/go/collectors/go.d.plugin/modules/hddtemp/metadata.yaml +++ b/src/go/plugin/go.d/modules/hddtemp/metadata.yaml diff --git a/src/go/plugin/go.d/modules/hddtemp/testdata/config.json b/src/go/plugin/go.d/modules/hddtemp/testdata/config.json new file mode 100644 index 000000000..e86834720 --- /dev/null +++ b/src/go/plugin/go.d/modules/hddtemp/testdata/config.json @@ -0,0 +1,5 @@ +{ + "update_every": 123, + "address": "ok", + "timeout": 123.123 +} diff --git a/src/go/plugin/go.d/modules/hddtemp/testdata/config.yaml b/src/go/plugin/go.d/modules/hddtemp/testdata/config.yaml new file mode 100644 index 000000000..1b81d09eb --- /dev/null +++ b/src/go/plugin/go.d/modules/hddtemp/testdata/config.yaml @@ -0,0 +1,3 @@ +update_every: 123 +address: "ok" +timeout: 123.123 diff --git a/src/go/collectors/go.d.plugin/modules/hddtemp/testdata/hddtemp-all-ok.txt b/src/go/plugin/go.d/modules/hddtemp/testdata/hddtemp-all-ok.txt index 5f6606e81..5f6606e81 100644 --- a/src/go/collectors/go.d.plugin/modules/hddtemp/testdata/hddtemp-all-ok.txt +++ b/src/go/plugin/go.d/modules/hddtemp/testdata/hddtemp-all-ok.txt diff --git a/src/go/collectors/go.d.plugin/modules/hddtemp/testdata/hddtemp-all-sleep.txt b/src/go/plugin/go.d/modules/hddtemp/testdata/hddtemp-all-sleep.txt index 732b62c76..732b62c76 100644 --- a/src/go/collectors/go.d.plugin/modules/hddtemp/testdata/hddtemp-all-sleep.txt +++ b/src/go/plugin/go.d/modules/hddtemp/testdata/hddtemp-all-sleep.txt diff --git a/src/go/collectors/go.d.plugin/modules/hdfs/README.md b/src/go/plugin/go.d/modules/hdfs/README.md index 38f428a06..38f428a06 120000 --- a/src/go/collectors/go.d.plugin/modules/hdfs/README.md +++ b/src/go/plugin/go.d/modules/hdfs/README.md diff --git a/src/go/collectors/go.d.plugin/modules/hdfs/charts.go b/src/go/plugin/go.d/modules/hdfs/charts.go index 94af99d2f..5b264c64c 100644 --- a/src/go/collectors/go.d.plugin/modules/hdfs/charts.go +++ b/src/go/plugin/go.d/modules/hdfs/charts.go @@ -2,7 +2,7 @@ package hdfs -import "github.com/netdata/netdata/go/go.d.plugin/agent/module" +import "github.com/netdata/netdata/go/plugins/plugin/go.d/agent/module" type ( Charts = module.Charts diff --git a/src/go/collectors/go.d.plugin/modules/hdfs/client.go b/src/go/plugin/go.d/modules/hdfs/client.go index bdeced146..3c43348be 100644 --- a/src/go/collectors/go.d.plugin/modules/hdfs/client.go +++ b/src/go/plugin/go.d/modules/hdfs/client.go @@ -8,7 +8,7 @@ import ( "io" "net/http" - "github.com/netdata/netdata/go/go.d.plugin/pkg/web" + "github.com/netdata/netdata/go/plugins/plugin/go.d/pkg/web" ) func newClient(httpClient *http.Client, request web.Request) *client { diff --git a/src/go/collectors/go.d.plugin/modules/hdfs/collect.go b/src/go/plugin/go.d/modules/hdfs/collect.go index d7081d36a..6ac022b87 100644 --- a/src/go/collectors/go.d.plugin/modules/hdfs/collect.go +++ b/src/go/plugin/go.d/modules/hdfs/collect.go @@ -8,7 +8,7 @@ import ( "fmt" "strings" - "github.com/netdata/netdata/go/go.d.plugin/pkg/stm" + "github.com/netdata/netdata/go/plugins/plugin/go.d/pkg/stm" ) func (h *HDFS) collect() (map[string]int64, error) { diff --git a/src/go/collectors/go.d.plugin/modules/hdfs/config_schema.json b/src/go/plugin/go.d/modules/hdfs/config_schema.json index 416b69418..528cc4dbf 100644 --- a/src/go/collectors/go.d.plugin/modules/hdfs/config_schema.json +++ b/src/go/plugin/go.d/modules/hdfs/config_schema.json @@ -170,6 +170,12 @@ "timeout": { "ui:help": "Accepts decimals for precise control (e.g., type 1.5 for 1.5 seconds)." }, + "username": { + "ui:widget": "password" + }, + "proxy_username": { + "ui:widget": "password" + }, "password": { "ui:widget": "password" }, diff --git a/src/go/collectors/go.d.plugin/modules/hdfs/hdfs.go b/src/go/plugin/go.d/modules/hdfs/hdfs.go index 1b0f849a6..44b5840bb 100644 --- a/src/go/collectors/go.d.plugin/modules/hdfs/hdfs.go +++ b/src/go/plugin/go.d/modules/hdfs/hdfs.go @@ -7,8 +7,8 @@ import ( "errors" "time" - "github.com/netdata/netdata/go/go.d.plugin/agent/module" - "github.com/netdata/netdata/go/go.d.plugin/pkg/web" + "github.com/netdata/netdata/go/plugins/plugin/go.d/agent/module" + "github.com/netdata/netdata/go/plugins/plugin/go.d/pkg/web" ) //go:embed "config_schema.json" diff --git a/src/go/collectors/go.d.plugin/modules/hdfs/hdfs_test.go b/src/go/plugin/go.d/modules/hdfs/hdfs_test.go index f9cbdc1bb..d24e50bb6 100644 --- a/src/go/collectors/go.d.plugin/modules/hdfs/hdfs_test.go +++ b/src/go/plugin/go.d/modules/hdfs/hdfs_test.go @@ -8,7 +8,7 @@ import ( "os" "testing" - "github.com/netdata/netdata/go/go.d.plugin/agent/module" + "github.com/netdata/netdata/go/plugins/plugin/go.d/agent/module" "github.com/stretchr/testify/assert" "github.com/stretchr/testify/require" diff --git a/src/go/collectors/go.d.plugin/modules/hdfs/init.go b/src/go/plugin/go.d/modules/hdfs/init.go index 79cd2e6bf..1159ab73b 100644 --- a/src/go/collectors/go.d.plugin/modules/hdfs/init.go +++ b/src/go/plugin/go.d/modules/hdfs/init.go @@ -5,7 +5,7 @@ package hdfs import ( "errors" - "github.com/netdata/netdata/go/go.d.plugin/pkg/web" + "github.com/netdata/netdata/go/plugins/plugin/go.d/pkg/web" ) func (h *HDFS) validateConfig() error { diff --git a/src/go/collectors/go.d.plugin/modules/hdfs/integrations/hadoop_distributed_file_system_hdfs.md b/src/go/plugin/go.d/modules/hdfs/integrations/hadoop_distributed_file_system_hdfs.md index a3b39b183..e37ccde0c 100644 --- a/src/go/collectors/go.d.plugin/modules/hdfs/integrations/hadoop_distributed_file_system_hdfs.md +++ b/src/go/plugin/go.d/modules/hdfs/integrations/hadoop_distributed_file_system_hdfs.md @@ -1,6 +1,6 @@ <!--startmeta -custom_edit_url: "https://github.com/netdata/netdata/edit/master/src/go/collectors/go.d.plugin/modules/hdfs/README.md" -meta_yaml: "https://github.com/netdata/netdata/edit/master/src/go/collectors/go.d.plugin/modules/hdfs/metadata.yaml" +custom_edit_url: "https://github.com/netdata/netdata/edit/master/src/go/plugin/go.d/modules/hdfs/README.md" +meta_yaml: "https://github.com/netdata/netdata/edit/master/src/go/plugin/go.d/modules/hdfs/metadata.yaml" sidebar_label: "Hadoop Distributed File System (HDFS)" learn_status: "Published" learn_rel_path: "Collecting Metrics/Storage, Mount Points and Filesystems" @@ -226,6 +226,8 @@ jobs: ### Debug Mode +**Important**: Debug mode is not supported for data collection jobs created via the UI using the Dyncfg feature. + To troubleshoot issues with the `hfs` collector, run the `go.d.plugin` with the debug option enabled. The output should give you clues as to why the collector isn't working. @@ -248,4 +250,37 @@ should give you clues as to why the collector isn't working. ./go.d.plugin -d -m hfs ``` +### Getting Logs + +If you're encountering problems with the `hfs` collector, follow these steps to retrieve logs and identify potential issues: + +- **Run the command** specific to your system (systemd, non-systemd, or Docker container). +- **Examine the output** for any warnings or error messages that might indicate issues. These messages should provide clues about the root cause of the problem. + +#### System with systemd + +Use the following command to view logs generated since the last Netdata service restart: + +```bash +journalctl _SYSTEMD_INVOCATION_ID="$(systemctl show --value --property=InvocationID netdata)" --namespace=netdata --grep hfs +``` + +#### System without systemd + +Locate the collector log file, typically at `/var/log/netdata/collector.log`, and use `grep` to filter for collector's name: + +```bash +grep hfs /var/log/netdata/collector.log +``` + +**Note**: This method shows logs from all restarts. Focus on the **latest entries** for troubleshooting current issues. + +#### Docker Container + +If your Netdata runs in a Docker container named "netdata" (replace if different), use this command: + +```bash +docker logs netdata 2>&1 | grep hfs +``` + diff --git a/src/go/collectors/go.d.plugin/modules/hdfs/metadata.yaml b/src/go/plugin/go.d/modules/hdfs/metadata.yaml index 694868e01..694868e01 100644 --- a/src/go/collectors/go.d.plugin/modules/hdfs/metadata.yaml +++ b/src/go/plugin/go.d/modules/hdfs/metadata.yaml diff --git a/src/go/collectors/go.d.plugin/modules/hdfs/metrics.go b/src/go/plugin/go.d/modules/hdfs/metrics.go index 972436a5d..972436a5d 100644 --- a/src/go/collectors/go.d.plugin/modules/hdfs/metrics.go +++ b/src/go/plugin/go.d/modules/hdfs/metrics.go diff --git a/src/go/collectors/go.d.plugin/modules/hdfs/raw_data.go b/src/go/plugin/go.d/modules/hdfs/raw_data.go index ab434ae17..ab434ae17 100644 --- a/src/go/collectors/go.d.plugin/modules/hdfs/raw_data.go +++ b/src/go/plugin/go.d/modules/hdfs/raw_data.go diff --git a/src/go/collectors/go.d.plugin/modules/hdfs/testdata/config.json b/src/go/plugin/go.d/modules/hdfs/testdata/config.json index 984c3ed6e..984c3ed6e 100644 --- a/src/go/collectors/go.d.plugin/modules/hdfs/testdata/config.json +++ b/src/go/plugin/go.d/modules/hdfs/testdata/config.json diff --git a/src/go/collectors/go.d.plugin/modules/hdfs/testdata/config.yaml b/src/go/plugin/go.d/modules/hdfs/testdata/config.yaml index 8558b61cc..8558b61cc 100644 --- a/src/go/collectors/go.d.plugin/modules/hdfs/testdata/config.yaml +++ b/src/go/plugin/go.d/modules/hdfs/testdata/config.yaml diff --git a/src/go/collectors/go.d.plugin/modules/hdfs/testdata/datanode.json b/src/go/plugin/go.d/modules/hdfs/testdata/datanode.json index 0f657d560..0f657d560 100644 --- a/src/go/collectors/go.d.plugin/modules/hdfs/testdata/datanode.json +++ b/src/go/plugin/go.d/modules/hdfs/testdata/datanode.json diff --git a/src/go/collectors/go.d.plugin/modules/hdfs/testdata/namenode.json b/src/go/plugin/go.d/modules/hdfs/testdata/namenode.json index 2d33d32f3..2d33d32f3 100644 --- a/src/go/collectors/go.d.plugin/modules/hdfs/testdata/namenode.json +++ b/src/go/plugin/go.d/modules/hdfs/testdata/namenode.json diff --git a/src/go/collectors/go.d.plugin/modules/hdfs/testdata/unknownnode.json b/src/go/plugin/go.d/modules/hdfs/testdata/unknownnode.json index 7370a7a37..7370a7a37 100644 --- a/src/go/collectors/go.d.plugin/modules/hdfs/testdata/unknownnode.json +++ b/src/go/plugin/go.d/modules/hdfs/testdata/unknownnode.json diff --git a/src/go/collectors/go.d.plugin/modules/hpssa/README.md b/src/go/plugin/go.d/modules/hpssa/README.md index dd12f5a9c..dd12f5a9c 120000 --- a/src/go/collectors/go.d.plugin/modules/hpssa/README.md +++ b/src/go/plugin/go.d/modules/hpssa/README.md diff --git a/src/go/collectors/go.d.plugin/modules/hpssa/charts.go b/src/go/plugin/go.d/modules/hpssa/charts.go index 437870df9..14b032bd3 100644 --- a/src/go/collectors/go.d.plugin/modules/hpssa/charts.go +++ b/src/go/plugin/go.d/modules/hpssa/charts.go @@ -6,7 +6,7 @@ import ( "fmt" "strings" - "github.com/netdata/netdata/go/go.d.plugin/agent/module" + "github.com/netdata/netdata/go/plugins/plugin/go.d/agent/module" ) const ( diff --git a/src/go/collectors/go.d.plugin/modules/hpssa/collect.go b/src/go/plugin/go.d/modules/hpssa/collect.go index a0ce7d0bc..a0ce7d0bc 100644 --- a/src/go/collectors/go.d.plugin/modules/hpssa/collect.go +++ b/src/go/plugin/go.d/modules/hpssa/collect.go diff --git a/src/go/collectors/go.d.plugin/modules/hpssa/config_schema.json b/src/go/plugin/go.d/modules/hpssa/config_schema.json index 788d7685e..788d7685e 100644 --- a/src/go/collectors/go.d.plugin/modules/hpssa/config_schema.json +++ b/src/go/plugin/go.d/modules/hpssa/config_schema.json diff --git a/src/go/collectors/go.d.plugin/modules/hpssa/exec.go b/src/go/plugin/go.d/modules/hpssa/exec.go index e8bf511d7..510b7d654 100644 --- a/src/go/collectors/go.d.plugin/modules/hpssa/exec.go +++ b/src/go/plugin/go.d/modules/hpssa/exec.go @@ -8,7 +8,7 @@ import ( "os/exec" "time" - "github.com/netdata/netdata/go/go.d.plugin/logger" + "github.com/netdata/netdata/go/plugins/logger" ) func newSsacliExec(ndsudoPath string, timeout time.Duration, log *logger.Logger) *ssacliExec { diff --git a/src/go/collectors/go.d.plugin/modules/hpssa/hpssa.go b/src/go/plugin/go.d/modules/hpssa/hpssa.go index c3b317219..1245f477f 100644 --- a/src/go/collectors/go.d.plugin/modules/hpssa/hpssa.go +++ b/src/go/plugin/go.d/modules/hpssa/hpssa.go @@ -7,8 +7,8 @@ import ( "errors" "time" - "github.com/netdata/netdata/go/go.d.plugin/agent/module" - "github.com/netdata/netdata/go/go.d.plugin/pkg/web" + "github.com/netdata/netdata/go/plugins/plugin/go.d/agent/module" + "github.com/netdata/netdata/go/plugins/plugin/go.d/pkg/web" ) //go:embed "config_schema.json" diff --git a/src/go/collectors/go.d.plugin/modules/hpssa/hpssa_test.go b/src/go/plugin/go.d/modules/hpssa/hpssa_test.go index ed3116500..a3e90d2a7 100644 --- a/src/go/collectors/go.d.plugin/modules/hpssa/hpssa_test.go +++ b/src/go/plugin/go.d/modules/hpssa/hpssa_test.go @@ -7,7 +7,7 @@ import ( "os" "testing" - "github.com/netdata/netdata/go/go.d.plugin/agent/module" + "github.com/netdata/netdata/go/plugins/plugin/go.d/agent/module" "github.com/stretchr/testify/assert" "github.com/stretchr/testify/require" diff --git a/src/go/collectors/go.d.plugin/modules/hpssa/init.go b/src/go/plugin/go.d/modules/hpssa/init.go index 06038f5c2..3e08c443b 100644 --- a/src/go/collectors/go.d.plugin/modules/hpssa/init.go +++ b/src/go/plugin/go.d/modules/hpssa/init.go @@ -7,7 +7,7 @@ import ( "os" "path/filepath" - "github.com/netdata/netdata/go/go.d.plugin/agent/executable" + "github.com/netdata/netdata/go/plugins/pkg/executable" ) func (h *Hpssa) initSsacliExec() (ssacli, error) { diff --git a/src/go/collectors/go.d.plugin/modules/hpssa/integrations/hpe_smart_arrays.md b/src/go/plugin/go.d/modules/hpssa/integrations/hpe_smart_arrays.md index 90029fb9b..47fe74739 100644 --- a/src/go/collectors/go.d.plugin/modules/hpssa/integrations/hpe_smart_arrays.md +++ b/src/go/plugin/go.d/modules/hpssa/integrations/hpe_smart_arrays.md @@ -1,6 +1,6 @@ <!--startmeta -custom_edit_url: "https://github.com/netdata/netdata/edit/master/src/go/collectors/go.d.plugin/modules/hpssa/README.md" -meta_yaml: "https://github.com/netdata/netdata/edit/master/src/go/collectors/go.d.plugin/modules/hpssa/metadata.yaml" +custom_edit_url: "https://github.com/netdata/netdata/edit/master/src/go/plugin/go.d/modules/hpssa/README.md" +meta_yaml: "https://github.com/netdata/netdata/edit/master/src/go/plugin/go.d/modules/hpssa/metadata.yaml" sidebar_label: "HPE Smart Arrays" learn_status: "Published" learn_rel_path: "Collecting Metrics/Storage, Mount Points and Filesystems" @@ -211,6 +211,8 @@ jobs: ### Debug Mode +**Important**: Debug mode is not supported for data collection jobs created via the UI using the Dyncfg feature. + To troubleshoot issues with the `hpssa` collector, run the `go.d.plugin` with the debug option enabled. The output should give you clues as to why the collector isn't working. @@ -233,4 +235,37 @@ should give you clues as to why the collector isn't working. ./go.d.plugin -d -m hpssa ``` +### Getting Logs + +If you're encountering problems with the `hpssa` collector, follow these steps to retrieve logs and identify potential issues: + +- **Run the command** specific to your system (systemd, non-systemd, or Docker container). +- **Examine the output** for any warnings or error messages that might indicate issues. These messages should provide clues about the root cause of the problem. + +#### System with systemd + +Use the following command to view logs generated since the last Netdata service restart: + +```bash +journalctl _SYSTEMD_INVOCATION_ID="$(systemctl show --value --property=InvocationID netdata)" --namespace=netdata --grep hpssa +``` + +#### System without systemd + +Locate the collector log file, typically at `/var/log/netdata/collector.log`, and use `grep` to filter for collector's name: + +```bash +grep hpssa /var/log/netdata/collector.log +``` + +**Note**: This method shows logs from all restarts. Focus on the **latest entries** for troubleshooting current issues. + +#### Docker Container + +If your Netdata runs in a Docker container named "netdata" (replace if different), use this command: + +```bash +docker logs netdata 2>&1 | grep hpssa +``` + diff --git a/src/go/collectors/go.d.plugin/modules/hpssa/metadata.yaml b/src/go/plugin/go.d/modules/hpssa/metadata.yaml index 6cf7a6377..6cf7a6377 100644 --- a/src/go/collectors/go.d.plugin/modules/hpssa/metadata.yaml +++ b/src/go/plugin/go.d/modules/hpssa/metadata.yaml diff --git a/src/go/collectors/go.d.plugin/modules/hpssa/parse.go b/src/go/plugin/go.d/modules/hpssa/parse.go index 64d1c8ae9..64d1c8ae9 100644 --- a/src/go/collectors/go.d.plugin/modules/hpssa/parse.go +++ b/src/go/plugin/go.d/modules/hpssa/parse.go diff --git a/src/go/collectors/go.d.plugin/modules/logind/testdata/config.json b/src/go/plugin/go.d/modules/hpssa/testdata/config.json index 291ecee3d..291ecee3d 100644 --- a/src/go/collectors/go.d.plugin/modules/logind/testdata/config.json +++ b/src/go/plugin/go.d/modules/hpssa/testdata/config.json diff --git a/src/go/collectors/go.d.plugin/modules/logind/testdata/config.yaml b/src/go/plugin/go.d/modules/hpssa/testdata/config.yaml index 25b0b4c78..25b0b4c78 100644 --- a/src/go/collectors/go.d.plugin/modules/logind/testdata/config.yaml +++ b/src/go/plugin/go.d/modules/hpssa/testdata/config.yaml diff --git a/src/go/collectors/go.d.plugin/modules/hpssa/testdata/ssacli-P212_P410i.txt b/src/go/plugin/go.d/modules/hpssa/testdata/ssacli-P212_P410i.txt index c54cc10c7..c54cc10c7 100644 --- a/src/go/collectors/go.d.plugin/modules/hpssa/testdata/ssacli-P212_P410i.txt +++ b/src/go/plugin/go.d/modules/hpssa/testdata/ssacli-P212_P410i.txt diff --git a/src/go/collectors/go.d.plugin/modules/hpssa/testdata/ssacli-P400ar.txt b/src/go/plugin/go.d/modules/hpssa/testdata/ssacli-P400ar.txt index 7abec7179..7abec7179 100644 --- a/src/go/collectors/go.d.plugin/modules/hpssa/testdata/ssacli-P400ar.txt +++ b/src/go/plugin/go.d/modules/hpssa/testdata/ssacli-P400ar.txt diff --git a/src/go/collectors/go.d.plugin/modules/hpssa/testdata/ssacli-P400i-unassigned.txt b/src/go/plugin/go.d/modules/hpssa/testdata/ssacli-P400i-unassigned.txt index b674f26c2..b674f26c2 100644 --- a/src/go/collectors/go.d.plugin/modules/hpssa/testdata/ssacli-P400i-unassigned.txt +++ b/src/go/plugin/go.d/modules/hpssa/testdata/ssacli-P400i-unassigned.txt diff --git a/src/go/collectors/go.d.plugin/modules/httpcheck/README.md b/src/go/plugin/go.d/modules/httpcheck/README.md index 69f056137..69f056137 120000 --- a/src/go/collectors/go.d.plugin/modules/httpcheck/README.md +++ b/src/go/plugin/go.d/modules/httpcheck/README.md diff --git a/src/go/collectors/go.d.plugin/modules/httpcheck/charts.go b/src/go/plugin/go.d/modules/httpcheck/charts.go index efb0f874b..376ed99a4 100644 --- a/src/go/collectors/go.d.plugin/modules/httpcheck/charts.go +++ b/src/go/plugin/go.d/modules/httpcheck/charts.go @@ -3,7 +3,7 @@ package httpcheck import ( - "github.com/netdata/netdata/go/go.d.plugin/agent/module" + "github.com/netdata/netdata/go/plugins/plugin/go.d/agent/module" ) const ( diff --git a/src/go/collectors/go.d.plugin/modules/httpcheck/collect.go b/src/go/plugin/go.d/modules/httpcheck/collect.go index 8d88dc02f..fa0c96bc3 100644 --- a/src/go/collectors/go.d.plugin/modules/httpcheck/collect.go +++ b/src/go/plugin/go.d/modules/httpcheck/collect.go @@ -12,8 +12,8 @@ import ( "strings" "time" - "github.com/netdata/netdata/go/go.d.plugin/pkg/stm" - "github.com/netdata/netdata/go/go.d.plugin/pkg/web" + "github.com/netdata/netdata/go/plugins/plugin/go.d/pkg/stm" + "github.com/netdata/netdata/go/plugins/plugin/go.d/pkg/web" ) type reqErrCode int diff --git a/src/go/collectors/go.d.plugin/modules/httpcheck/config_schema.json b/src/go/plugin/go.d/modules/httpcheck/config_schema.json index 80db7b05c..82ffc7cb5 100644 --- a/src/go/collectors/go.d.plugin/modules/httpcheck/config_schema.json +++ b/src/go/plugin/go.d/modules/httpcheck/config_schema.json @@ -95,7 +95,7 @@ }, "value": { "title": "Header value pattern", - "description": "Specifies the [matcher pattern](https://github.com/netdata/netdata/tree/master/src/go/collectors/go.d.plugin/pkg/matcher#readme) to match against the value of the specified header.", + "description": "Specifies the [matcher pattern](https://github.com/netdata/netdata/tree/master/src/go/plugin/go.d/pkg/matcher#readme) to match against the value of the specified header.", "type": "string" } }, @@ -253,6 +253,18 @@ }, "body": { "ui:widget": "textarea" + }, + "username": { + "ui:widget": "password" + }, + "proxy_username": { + "ui:widget": "password" + }, + "password": { + "ui:widget": "password" + }, + "proxy_password": { + "ui:widget": "password" } } } diff --git a/src/go/collectors/go.d.plugin/modules/httpcheck/cookiejar.go b/src/go/plugin/go.d/modules/httpcheck/cookiejar.go index 628867caa..628867caa 100644 --- a/src/go/collectors/go.d.plugin/modules/httpcheck/cookiejar.go +++ b/src/go/plugin/go.d/modules/httpcheck/cookiejar.go diff --git a/src/go/collectors/go.d.plugin/modules/httpcheck/httpcheck.go b/src/go/plugin/go.d/modules/httpcheck/httpcheck.go index 6d597d483..1c7b6b1c0 100644 --- a/src/go/collectors/go.d.plugin/modules/httpcheck/httpcheck.go +++ b/src/go/plugin/go.d/modules/httpcheck/httpcheck.go @@ -9,8 +9,8 @@ import ( "regexp" "time" - "github.com/netdata/netdata/go/go.d.plugin/agent/module" - "github.com/netdata/netdata/go/go.d.plugin/pkg/web" + "github.com/netdata/netdata/go/plugins/plugin/go.d/agent/module" + "github.com/netdata/netdata/go/plugins/plugin/go.d/pkg/web" ) //go:embed "config_schema.json" diff --git a/src/go/collectors/go.d.plugin/modules/httpcheck/httpcheck_test.go b/src/go/plugin/go.d/modules/httpcheck/httpcheck_test.go index dde5761eb..9ae0cf4ed 100644 --- a/src/go/collectors/go.d.plugin/modules/httpcheck/httpcheck_test.go +++ b/src/go/plugin/go.d/modules/httpcheck/httpcheck_test.go @@ -3,14 +3,14 @@ package httpcheck import ( - "github.com/netdata/netdata/go/go.d.plugin/agent/module" + "github.com/netdata/netdata/go/plugins/plugin/go.d/agent/module" "net/http" "net/http/httptest" "os" "testing" "time" - "github.com/netdata/netdata/go/go.d.plugin/pkg/web" + "github.com/netdata/netdata/go/plugins/plugin/go.d/pkg/web" "github.com/stretchr/testify/assert" "github.com/stretchr/testify/require" diff --git a/src/go/collectors/go.d.plugin/modules/httpcheck/init.go b/src/go/plugin/go.d/modules/httpcheck/init.go index a7f708191..a4a3ae27d 100644 --- a/src/go/collectors/go.d.plugin/modules/httpcheck/init.go +++ b/src/go/plugin/go.d/modules/httpcheck/init.go @@ -8,9 +8,9 @@ import ( "net/http" "regexp" - "github.com/netdata/netdata/go/go.d.plugin/agent/module" - "github.com/netdata/netdata/go/go.d.plugin/pkg/matcher" - "github.com/netdata/netdata/go/go.d.plugin/pkg/web" + "github.com/netdata/netdata/go/plugins/plugin/go.d/agent/module" + "github.com/netdata/netdata/go/plugins/plugin/go.d/pkg/matcher" + "github.com/netdata/netdata/go/plugins/plugin/go.d/pkg/web" ) type headerMatch struct { diff --git a/src/go/collectors/go.d.plugin/modules/httpcheck/integrations/http_endpoints.md b/src/go/plugin/go.d/modules/httpcheck/integrations/http_endpoints.md index feb3133cd..b94735dee 100644 --- a/src/go/collectors/go.d.plugin/modules/httpcheck/integrations/http_endpoints.md +++ b/src/go/plugin/go.d/modules/httpcheck/integrations/http_endpoints.md @@ -1,6 +1,6 @@ <!--startmeta -custom_edit_url: "https://github.com/netdata/netdata/edit/master/src/go/collectors/go.d.plugin/modules/httpcheck/README.md" -meta_yaml: "https://github.com/netdata/netdata/edit/master/src/go/collectors/go.d.plugin/modules/httpcheck/metadata.yaml" +custom_edit_url: "https://github.com/netdata/netdata/edit/master/src/go/plugin/go.d/modules/httpcheck/README.md" +meta_yaml: "https://github.com/netdata/netdata/edit/master/src/go/plugin/go.d/modules/httpcheck/metadata.yaml" sidebar_label: "HTTP Endpoints" learn_status: "Published" learn_rel_path: "Collecting Metrics/Synthetic Checks" @@ -21,7 +21,19 @@ Module: httpcheck ## Overview -This collector monitors HTTP servers availability and response time. +This collector monitors HTTP servers availability status and response time. + +Possible statuses: + +| Status | Description | +|---------------|----------------------------------------------------------------------------------------------------------------------------------------------------------------------------------------------| +| success | HTTP request completed successfully with a status code matching the configured `status_accepted` range (default: 200), and the response body and headers (if configured) match expectations. | +| timeout | HTTP request timed out before receiving a response (default: 1 second). | +| no_connection | Failed to establish a connection to the target. | +| redirect | Received a redirect response (3xx status code) while `not_follow_redirects` is configured. | +| bad_status | HTTP request completed with a status code outside the configured `status_accepted` range (default: non-200). | +| bad_content | HTTP request completed successfully but the response body does not match the expected content (when using `response_match`). | +| bad_header | HTTP request completed successfully but response headers do not match the expected values (when using `headers_match`). | @@ -117,7 +129,7 @@ The following options can be defined globally: update_every, autodetection_retry | headers_match | This option defines a set of rules that check for specific key-value pairs in the HTTP headers of the response. | [] | no | | headers_match.exclude | This option determines whether the rule should check for the presence of the specified key-value pair or the absence of it. | no | no | | headers_match.key | The exact name of the HTTP header to check for. | | yes | -| headers_match.value | The [pattern](https://github.com/netdata/netdata/tree/master/src/go/collectors/go.d.plugin/pkg/matcher#supported-format) to match against the value of the specified header. | | no | +| headers_match.value | The [pattern](https://github.com/netdata/netdata/tree/master/src/go/plugin/go.d/pkg/matcher#supported-format) to match against the value of the specified header. | | no | | cookie_file | Path to cookie file. See [cookie file format](https://everything.curl.dev/http/cookies/fileformat). | | no | | timeout | HTTP request timeout. | 1 | no | | username | Username for basic HTTP authentication. | | no | @@ -189,7 +201,7 @@ jobs: ##### With `header_match` -Example configurations with `header_match`. See the value [pattern](https://github.com/netdata/netdata/tree/master/src/go/collectors/go.d.plugin/pkg/matcher#supported-format) syntax. +Example configurations with `header_match`. See the value [pattern](https://github.com/netdata/netdata/tree/master/src/go/plugin/go.d/pkg/matcher#supported-format) syntax. <details open><summary>Config</summary> @@ -292,6 +304,8 @@ jobs: ### Debug Mode +**Important**: Debug mode is not supported for data collection jobs created via the UI using the Dyncfg feature. + To troubleshoot issues with the `httpcheck` collector, run the `go.d.plugin` with the debug option enabled. The output should give you clues as to why the collector isn't working. @@ -314,4 +328,37 @@ should give you clues as to why the collector isn't working. ./go.d.plugin -d -m httpcheck ``` +### Getting Logs + +If you're encountering problems with the `httpcheck` collector, follow these steps to retrieve logs and identify potential issues: + +- **Run the command** specific to your system (systemd, non-systemd, or Docker container). +- **Examine the output** for any warnings or error messages that might indicate issues. These messages should provide clues about the root cause of the problem. + +#### System with systemd + +Use the following command to view logs generated since the last Netdata service restart: + +```bash +journalctl _SYSTEMD_INVOCATION_ID="$(systemctl show --value --property=InvocationID netdata)" --namespace=netdata --grep httpcheck +``` + +#### System without systemd + +Locate the collector log file, typically at `/var/log/netdata/collector.log`, and use `grep` to filter for collector's name: + +```bash +grep httpcheck /var/log/netdata/collector.log +``` + +**Note**: This method shows logs from all restarts. Focus on the **latest entries** for troubleshooting current issues. + +#### Docker Container + +If your Netdata runs in a Docker container named "netdata" (replace if different), use this command: + +```bash +docker logs netdata 2>&1 | grep httpcheck +``` + diff --git a/src/go/collectors/go.d.plugin/modules/httpcheck/metadata.yaml b/src/go/plugin/go.d/modules/httpcheck/metadata.yaml index 6b6b7d51c..f34993b5e 100644 --- a/src/go/collectors/go.d.plugin/modules/httpcheck/metadata.yaml +++ b/src/go/plugin/go.d/modules/httpcheck/metadata.yaml @@ -21,7 +21,19 @@ modules: overview: data_collection: metrics_description: | - This collector monitors HTTP servers availability and response time. + This collector monitors HTTP servers availability status and response time. + + Possible statuses: + + | Status | Description | + |---------------|----------------------------------------------------------------------------------------------------------------------------------------------------------------------------------------------| + | success | HTTP request completed successfully with a status code matching the configured `status_accepted` range (default: 200), and the response body and headers (if configured) match expectations. | + | timeout | HTTP request timed out before receiving a response (default: 1 second). | + | no_connection | Failed to establish a connection to the target. | + | redirect | Received a redirect response (3xx status code) while `not_follow_redirects` is configured. | + | bad_status | HTTP request completed with a status code outside the configured `status_accepted` range (default: non-200). | + | bad_content | HTTP request completed successfully but the response body does not match the expected content (when using `response_match`). | + | bad_header | HTTP request completed successfully but response headers do not match the expected values (when using `headers_match`). | method_description: "" supported_platforms: include: [] @@ -82,7 +94,7 @@ modules: default_value: "" required: true - name: headers_match.value - description: "The [pattern](https://github.com/netdata/netdata/tree/master/src/go/collectors/go.d.plugin/pkg/matcher#supported-format) to match against the value of the specified header." + description: "The [pattern](https://github.com/netdata/netdata/tree/master/src/go/plugin/go.d/pkg/matcher#supported-format) to match against the value of the specified header." default_value: "" required: false - name: cookie_file @@ -176,7 +188,7 @@ modules: - 200 - 204 - name: With `header_match` - description: Example configurations with `header_match`. See the value [pattern](https://github.com/netdata/netdata/tree/master/src/go/collectors/go.d.plugin/pkg/matcher#supported-format) syntax. + description: Example configurations with `header_match`. See the value [pattern](https://github.com/netdata/netdata/tree/master/src/go/plugin/go.d/pkg/matcher#supported-format) syntax. config: | jobs: # The "X-Robots-Tag" header must be present in the HTTP response header, diff --git a/src/go/collectors/go.d.plugin/modules/httpcheck/metrics.go b/src/go/plugin/go.d/modules/httpcheck/metrics.go index 676346fa0..676346fa0 100644 --- a/src/go/collectors/go.d.plugin/modules/httpcheck/metrics.go +++ b/src/go/plugin/go.d/modules/httpcheck/metrics.go diff --git a/src/go/collectors/go.d.plugin/modules/httpcheck/testdata/config.json b/src/go/plugin/go.d/modules/httpcheck/testdata/config.json index 649393cdd..649393cdd 100644 --- a/src/go/collectors/go.d.plugin/modules/httpcheck/testdata/config.json +++ b/src/go/plugin/go.d/modules/httpcheck/testdata/config.json diff --git a/src/go/collectors/go.d.plugin/modules/httpcheck/testdata/config.yaml b/src/go/plugin/go.d/modules/httpcheck/testdata/config.yaml index 1a66590e6..1a66590e6 100644 --- a/src/go/collectors/go.d.plugin/modules/httpcheck/testdata/config.yaml +++ b/src/go/plugin/go.d/modules/httpcheck/testdata/config.yaml diff --git a/src/go/collectors/go.d.plugin/modules/httpcheck/testdata/cookie.txt b/src/go/plugin/go.d/modules/httpcheck/testdata/cookie.txt index 2504c6ffa..2504c6ffa 100644 --- a/src/go/collectors/go.d.plugin/modules/httpcheck/testdata/cookie.txt +++ b/src/go/plugin/go.d/modules/httpcheck/testdata/cookie.txt diff --git a/src/collectors/python.d.plugin/icecast/README.md b/src/go/plugin/go.d/modules/icecast/README.md index db3c1b572..db3c1b572 120000 --- a/src/collectors/python.d.plugin/icecast/README.md +++ b/src/go/plugin/go.d/modules/icecast/README.md diff --git a/src/go/plugin/go.d/modules/icecast/charts.go b/src/go/plugin/go.d/modules/icecast/charts.go new file mode 100644 index 000000000..26d3fe100 --- /dev/null +++ b/src/go/plugin/go.d/modules/icecast/charts.go @@ -0,0 +1,65 @@ +// SPDX-License-Identifier: GPL-3.0-or-later + +package icecast + +import ( + "fmt" + "strings" + + "github.com/netdata/netdata/go/plugins/plugin/go.d/agent/module" +) + +const ( + prioSourceListeners = module.Priority + iota +) + +var sourceChartsTmpl = module.Charts{ + sourceListenersChartTmpl.Copy(), +} + +var ( + sourceListenersChartTmpl = module.Chart{ + ID: "icecast_%s_listeners", + Title: "Icecast Listeners", + Units: "listeners", + Fam: "listeners", + Ctx: "icecast.listeners", + Type: module.Line, + Priority: prioSourceListeners, + Dims: module.Dims{ + {ID: "source_%s_listeners", Name: "listeners"}, + }, + } +) + +func (ic *Icecast) addSourceCharts(name string) { + chart := sourceListenersChartTmpl.Copy() + + chart.ID = fmt.Sprintf(chart.ID, cleanSource(name)) + chart.Labels = []module.Label{ + {Key: "source", Value: name}, + } + for _, dim := range chart.Dims { + dim.ID = fmt.Sprintf(dim.ID, name) + } + + if err := ic.Charts().Add(chart); err != nil { + ic.Warning(err) + } + +} + +func (ic *Icecast) removeSourceCharts(name string) { + px := fmt.Sprintf("icecast_%s_", cleanSource(name)) + for _, chart := range *ic.Charts() { + if strings.HasPrefix(chart.ID, px) { + chart.MarkRemove() + chart.MarkNotCreated() + } + } +} + +func cleanSource(name string) string { + r := strings.NewReplacer(" ", "_", ".", "_", ",", "_") + return r.Replace(name) +} diff --git a/src/go/plugin/go.d/modules/icecast/collect.go b/src/go/plugin/go.d/modules/icecast/collect.go new file mode 100644 index 000000000..102ad31e5 --- /dev/null +++ b/src/go/plugin/go.d/modules/icecast/collect.go @@ -0,0 +1,107 @@ +// SPDX-License-Identifier: GPL-3.0-or-later + +package icecast + +import ( + "encoding/json" + "fmt" + "io" + "net/http" + + "github.com/netdata/netdata/go/plugins/plugin/go.d/pkg/web" +) + +const ( + urlPathServerStats = "/status-json.xsl" // https://icecast.org/docs/icecast-trunk/server_stats/ +) + +func (ic *Icecast) collect() (map[string]int64, error) { + mx := make(map[string]int64) + + if err := ic.collectServerStats(mx); err != nil { + return nil, err + } + + return mx, nil +} + +func (ic *Icecast) collectServerStats(mx map[string]int64) error { + stats, err := ic.queryServerStats() + if err != nil { + return err + } + if stats.IceStats == nil { + return fmt.Errorf("unexpected response: no icestats found") + } + if len(stats.IceStats.Source) == 0 { + return fmt.Errorf("no icecast sources found") + } + + seen := make(map[string]bool) + + for _, src := range stats.IceStats.Source { + name := src.ServerName + if name == "" { + continue + } + + seen[name] = true + + if !ic.seenSources[name] { + ic.seenSources[name] = true + ic.addSourceCharts(name) + } + + px := fmt.Sprintf("source_%s_", name) + + mx[px+"listeners"] = src.Listeners + } + + for name := range ic.seenSources { + if !seen[name] { + delete(ic.seenSources, name) + ic.removeSourceCharts(name) + } + } + + return nil +} + +func (ic *Icecast) queryServerStats() (*serverStats, error) { + req, err := web.NewHTTPRequestWithPath(ic.Request, urlPathServerStats) + if err != nil { + return nil, err + } + + var stats serverStats + + if err := ic.doOKDecode(req, &stats); err != nil { + return nil, err + } + + return &stats, nil +} + +func (ic *Icecast) doOKDecode(req *http.Request, in interface{}) error { + resp, err := ic.httpClient.Do(req) + if err != nil { + return fmt.Errorf("error on HTTP request '%s': %v", req.URL, err) + } + defer closeBody(resp) + + if resp.StatusCode != http.StatusOK { + return fmt.Errorf("'%s' returned HTTP status code: %d", req.URL, resp.StatusCode) + } + + if err := json.NewDecoder(resp.Body).Decode(in); err != nil { + return fmt.Errorf("error on decoding response from '%s': %v", req.URL, err) + } + return nil +} + +func closeBody(resp *http.Response) { + if resp != nil && resp.Body != nil { + _, _ = io.Copy(io.Discard, resp.Body) + _ = resp.Body.Close() + } +} diff --git a/src/go/plugin/go.d/modules/icecast/config_schema.json b/src/go/plugin/go.d/modules/icecast/config_schema.json new file mode 100644 index 000000000..3abda6e75 --- /dev/null +++ b/src/go/plugin/go.d/modules/icecast/config_schema.json @@ -0,0 +1,177 @@ +{ + "jsonSchema": { + "$schema": "http://json-schema.org/draft-07/schema#", + "title": "Icecast collector configuration.", + "type": "object", + "properties": { + "update_every": { + "title": "Update every", + "description": "Data collection interval, measured in seconds.", + "type": "integer", + "minimum": 1, + "default": 1 + }, + "url": { + "title": "URL", + "description": "The base URL where the Icecast API can be accessed.", + "type": "string", + "default": "http://127.0.0.1:8000", + "format": "uri" + }, + "timeout": { + "title": "Timeout", + "description": "The timeout in seconds for the HTTP request.", + "type": "number", + "minimum": 0.5, + "default": 1 + }, + "not_follow_redirects": { + "title": "Not follow redirects", + "description": "If set, the client will not follow HTTP redirects automatically.", + "type": "boolean" + }, + "username": { + "title": "Username", + "description": "The username for basic authentication.", + "type": "string", + "sensitive": true + }, + "password": { + "title": "Password", + "description": "The password for basic authentication.", + "type": "string", + "sensitive": true + }, + "proxy_url": { + "title": "Proxy URL", + "description": "The URL of the proxy server.", + "type": "string" + }, + "proxy_username": { + "title": "Proxy username", + "description": "The username for proxy authentication.", + "type": "string", + "sensitive": true + }, + "proxy_password": { + "title": "Proxy password", + "description": "The password for proxy authentication.", + "type": "string", + "sensitive": true + }, + "headers": { + "title": "Headers", + "description": "Additional HTTP headers to include in the request.", + "type": [ + "object", + "null" + ], + "additionalProperties": { + "type": "string" + } + }, + "tls_skip_verify": { + "title": "Skip TLS verification", + "description": "If set, TLS certificate verification will be skipped.", + "type": "boolean" + }, + "tls_ca": { + "title": "TLS CA", + "description": "The path to the CA certificate file for TLS verification.", + "type": "string", + "pattern": "^$|^/" + }, + "tls_cert": { + "title": "TLS certificate", + "description": "The path to the client certificate file for TLS authentication.", + "type": "string", + "pattern": "^$|^/" + }, + "tls_key": { + "title": "TLS key", + "description": "The path to the client key file for TLS authentication.", + "type": "string", + "pattern": "^$|^/" + }, + "body": { + "title": "Body", + "type": "string" + }, + "method": { + "title": "Method", + "type": "string" + } + }, + "required": [ + "url" + ], + "additionalProperties": false, + "patternProperties": { + "^name$": {} + } + }, + "uiSchema": { + "uiOptions": { + "fullPage": true + }, + "body": { + "ui:widget": "hidden" + }, + "method": { + "ui:widget": "hidden" + }, + "timeout": { + "ui:help": "Accepts decimals for precise control (e.g., type 1.5 for 1.5 seconds)." + }, + "password": { + "ui:widget": "password" + }, + "proxy_password": { + "ui:widget": "password" + }, + "ui:flavour": "tabs", + "ui:options": { + "tabs": [ + { + "title": "Base", + "fields": [ + "update_every", + "url", + "timeout", + "not_follow_redirects" + ] + }, + { + "title": "Auth", + "fields": [ + "username", + "password" + ] + }, + { + "title": "TLS", + "fields": [ + "tls_skip_verify", + "tls_ca", + "tls_cert", + "tls_key" + ] + }, + { + "title": "Proxy", + "fields": [ + "proxy_url", + "proxy_username", + "proxy_password" + ] + }, + { + "title": "Headers", + "fields": [ + "headers" + ] + } + ] + } + } +} diff --git a/src/go/plugin/go.d/modules/icecast/icecast.go b/src/go/plugin/go.d/modules/icecast/icecast.go new file mode 100644 index 000000000..e999421f7 --- /dev/null +++ b/src/go/plugin/go.d/modules/icecast/icecast.go @@ -0,0 +1,118 @@ +// SPDX-License-Identifier: GPL-3.0-or-later + +package icecast + +import ( + _ "embed" + "errors" + "net/http" + "time" + + "github.com/netdata/netdata/go/plugins/plugin/go.d/agent/module" + "github.com/netdata/netdata/go/plugins/plugin/go.d/pkg/web" +) + +//go:embed "config_schema.json" +var configSchema string + +func init() { + module.Register("icecast", module.Creator{ + JobConfigSchema: configSchema, + Create: func() module.Module { return New() }, + Config: func() any { return &Config{} }, + }) +} + +func New() *Icecast { + return &Icecast{ + Config: Config{ + HTTP: web.HTTP{ + Request: web.Request{ + URL: "http://127.0.0.1:8000", + }, + Client: web.Client{ + Timeout: web.Duration(time.Second * 1), + }, + }, + }, + charts: &module.Charts{}, + + seenSources: make(map[string]bool), + } +} + +type Config struct { + UpdateEvery int `yaml:"update_every,omitempty" json:"update_every"` + web.HTTP `yaml:",inline" json:""` +} + +type Icecast struct { + module.Base + Config `yaml:",inline" json:""` + + charts *module.Charts + + seenSources map[string]bool + + httpClient *http.Client +} + +func (ic *Icecast) Configuration() any { + return ic.Config +} + +func (ic *Icecast) Init() error { + if ic.URL == "" { + ic.Error("URL not set") + return errors.New("url not set") + } + + client, err := web.NewHTTPClient(ic.Client) + if err != nil { + ic.Error(err) + return err + } + ic.httpClient = client + + ic.Debugf("using URL %s", ic.URL) + ic.Debugf("using timeout: %s", ic.Timeout) + + return nil +} + +func (ic *Icecast) Check() error { + mx, err := ic.collect() + if err != nil { + ic.Error(err) + return err + } + + if len(mx) == 0 { + return errors.New("no metrics collected") + } + + return nil +} + +func (ic *Icecast) Charts() *module.Charts { + return ic.charts +} + +func (ic *Icecast) Collect() map[string]int64 { + mx, err := ic.collect() + if err != nil { + ic.Error(err) + } + + if len(mx) == 0 { + return nil + } + + return mx +} + +func (ic *Icecast) Cleanup() { + if ic.httpClient != nil { + ic.httpClient.CloseIdleConnections() + } +} diff --git a/src/go/plugin/go.d/modules/icecast/icecast_test.go b/src/go/plugin/go.d/modules/icecast/icecast_test.go new file mode 100644 index 000000000..40132986d --- /dev/null +++ b/src/go/plugin/go.d/modules/icecast/icecast_test.go @@ -0,0 +1,285 @@ +// SPDX-License-Identifier: GPL-3.0-or-later + +package icecast + +import ( + "net/http" + "net/http/httptest" + "os" + "testing" + + "github.com/netdata/netdata/go/plugins/plugin/go.d/agent/module" + "github.com/netdata/netdata/go/plugins/plugin/go.d/pkg/web" + + "github.com/stretchr/testify/assert" + "github.com/stretchr/testify/require" +) + +var ( + dataConfigJSON, _ = os.ReadFile("testdata/config.json") + dataConfigYAML, _ = os.ReadFile("testdata/config.yaml") + + dataServerStatsMultiSource, _ = os.ReadFile("testdata/stats_multi_source.json") + dataServerStatsSingleSource, _ = os.ReadFile("testdata/stats_single_source.json") + dataServerStatsNoSources, _ = os.ReadFile("testdata/stats_no_sources.json") +) + +func Test_testDataIsValid(t *testing.T) { + for name, data := range map[string][]byte{ + "dataConfigJSON": dataConfigJSON, + "dataConfigYAML": dataConfigYAML, + "dataServerStats": dataServerStatsMultiSource, + "dataServerStatsSingleSource": dataServerStatsSingleSource, + "dataServerStatsNoSources": dataServerStatsNoSources, + } { + require.NotNil(t, data, name) + } +} + +func TestIcecast_ConfigurationSerialize(t *testing.T) { + module.TestConfigurationSerialize(t, &Icecast{}, dataConfigJSON, dataConfigYAML) +} + +func TestIcecast_Init(t *testing.T) { + tests := map[string]struct { + wantFail bool + config Config + }{ + "success with default": { + wantFail: false, + config: New().Config, + }, + "fail when URL not set": { + wantFail: true, + config: Config{ + HTTP: web.HTTP{ + Request: web.Request{URL: ""}, + }, + }, + }, + } + + for name, test := range tests { + t.Run(name, func(t *testing.T) { + icecast := New() + icecast.Config = test.config + + if test.wantFail { + assert.Error(t, icecast.Init()) + } else { + assert.NoError(t, icecast.Init()) + } + }) + } +} + +func TestIcecast_Charts(t *testing.T) { + assert.NotNil(t, New().Charts()) +} + +func TestIcecast_Check(t *testing.T) { + tests := map[string]struct { + wantFail bool + prepare func(t *testing.T) (*Icecast, func()) + }{ + "success multiple sources": { + wantFail: false, + prepare: prepareCaseMultipleSources, + }, + "success single source": { + wantFail: false, + prepare: prepareCaseMultipleSources, + }, + "fails on no sources": { + wantFail: true, + prepare: prepareCaseNoSources, + }, + "fails on unexpected json response": { + wantFail: true, + prepare: prepareCaseUnexpectedJsonResponse, + }, + "fails on invalid format response": { + wantFail: true, + prepare: prepareCaseInvalidFormatResponse, + }, + "fails on connection refused": { + wantFail: true, + prepare: prepareCaseConnectionRefused, + }, + } + + for name, test := range tests { + t.Run(name, func(t *testing.T) { + icecast, cleanup := test.prepare(t) + defer cleanup() + + if test.wantFail { + assert.Error(t, icecast.Check()) + } else { + assert.NoError(t, icecast.Check()) + } + }) + } +} + +func TestIcecast_Collect(t *testing.T) { + tests := map[string]struct { + prepare func(t *testing.T) (*Icecast, func()) + wantMetrics map[string]int64 + wantCharts int + }{ + "success multiple sources": { + prepare: prepareCaseMultipleSources, + wantCharts: len(sourceChartsTmpl) * 2, + wantMetrics: map[string]int64{ + "source_abc_listeners": 1, + "source_efg_listeners": 10, + }, + }, + "success single source": { + prepare: prepareCaseSingleSource, + wantCharts: len(sourceChartsTmpl) * 1, + wantMetrics: map[string]int64{ + "source_abc_listeners": 1, + }, + }, + "fails on no sources": { + prepare: prepareCaseNoSources, + }, + "fails on unexpected json response": { + prepare: prepareCaseUnexpectedJsonResponse, + }, + "fails on invalid format response": { + prepare: prepareCaseInvalidFormatResponse, + }, + "fails on connection refused": { + prepare: prepareCaseConnectionRefused, + }, + } + + for name, test := range tests { + t.Run(name, func(t *testing.T) { + icecast, cleanup := test.prepare(t) + defer cleanup() + + mx := icecast.Collect() + + require.Equal(t, test.wantMetrics, mx) + if len(test.wantMetrics) > 0 { + assert.Equal(t, test.wantCharts, len(*icecast.Charts())) + module.TestMetricsHasAllChartsDims(t, icecast.Charts(), mx) + } + }) + } +} + +func prepareCaseMultipleSources(t *testing.T) (*Icecast, func()) { + t.Helper() + srv := httptest.NewServer(http.HandlerFunc( + func(w http.ResponseWriter, r *http.Request) { + switch r.URL.Path { + case urlPathServerStats: + _, _ = w.Write(dataServerStatsMultiSource) + default: + w.WriteHeader(http.StatusNotFound) + } + })) + + icecast := New() + icecast.URL = srv.URL + require.NoError(t, icecast.Init()) + + return icecast, srv.Close +} + +func prepareCaseSingleSource(t *testing.T) (*Icecast, func()) { + t.Helper() + srv := httptest.NewServer(http.HandlerFunc( + func(w http.ResponseWriter, r *http.Request) { + switch r.URL.Path { + case urlPathServerStats: + _, _ = w.Write(dataServerStatsSingleSource) + default: + w.WriteHeader(http.StatusNotFound) + } + })) + + icecast := New() + icecast.URL = srv.URL + require.NoError(t, icecast.Init()) + + return icecast, srv.Close +} + +func prepareCaseNoSources(t *testing.T) (*Icecast, func()) { + t.Helper() + srv := httptest.NewServer(http.HandlerFunc( + func(w http.ResponseWriter, r *http.Request) { + switch r.URL.Path { + case urlPathServerStats: + _, _ = w.Write(dataServerStatsNoSources) + default: + w.WriteHeader(http.StatusNotFound) + } + })) + + icecast := New() + icecast.URL = srv.URL + require.NoError(t, icecast.Init()) + + return icecast, srv.Close +} + +func prepareCaseUnexpectedJsonResponse(t *testing.T) (*Icecast, func()) { + t.Helper() + resp := ` +{ + "elephant": { + "burn": false, + "mountain": true, + "fog": false, + "skin": -1561907625, + "burst": "anyway", + "shadow": 1558616893 + }, + "start": "ever", + "base": 2093056027, + "mission": -2007590351, + "victory": 999053756, + "die": false +} +` + srv := httptest.NewServer(http.HandlerFunc( + func(w http.ResponseWriter, r *http.Request) { + _, _ = w.Write([]byte(resp)) + })) + + icecast := New() + icecast.URL = srv.URL + require.NoError(t, icecast.Init()) + + return icecast, srv.Close +} + +func prepareCaseInvalidFormatResponse(t *testing.T) (*Icecast, func()) { + t.Helper() + srv := httptest.NewServer(http.HandlerFunc( + func(w http.ResponseWriter, r *http.Request) { + _, _ = w.Write([]byte("hello and\n goodbye")) + })) + + icecast := New() + icecast.URL = srv.URL + require.NoError(t, icecast.Init()) + + return icecast, srv.Close +} + +func prepareCaseConnectionRefused(t *testing.T) (*Icecast, func()) { + t.Helper() + icecast := New() + icecast.URL = "http://127.0.0.1:65001" + require.NoError(t, icecast.Init()) + + return icecast, func() {} +} diff --git a/src/go/plugin/go.d/modules/icecast/integrations/icecast.md b/src/go/plugin/go.d/modules/icecast/integrations/icecast.md new file mode 100644 index 000000000..9ff06a4dd --- /dev/null +++ b/src/go/plugin/go.d/modules/icecast/integrations/icecast.md @@ -0,0 +1,226 @@ +<!--startmeta +custom_edit_url: "https://github.com/netdata/netdata/edit/master/src/go/plugin/go.d/modules/icecast/README.md" +meta_yaml: "https://github.com/netdata/netdata/edit/master/src/go/plugin/go.d/modules/icecast/metadata.yaml" +sidebar_label: "Icecast" +learn_status: "Published" +learn_rel_path: "Collecting Metrics/Media Services" +most_popular: False +message: "DO NOT EDIT THIS FILE DIRECTLY, IT IS GENERATED BY THE COLLECTOR'S metadata.yaml FILE" +endmeta--> + +# Icecast + + +<img src="https://netdata.cloud/img/icecast.svg" width="150"/> + + +Plugin: go.d.plugin +Module: icecast + +<img src="https://img.shields.io/badge/maintained%20by-Netdata-%2300ab44" /> + +## Overview + +This collector monitors Icecast listener counts. + +It uses the Icecast server statistics `status-json.xsl` endpoint to retrieve the metrics. + +This collector is supported on all platforms. + +This collector supports collecting metrics from multiple instances of this integration, including remote instances. + + +### Default Behavior + +#### Auto-Detection + +By default, it detects Icecast instances running on localhost that are listening on port 8000. + +#### Limits + +The default configuration for this integration does not impose any limits on data collection. + +#### Performance Impact + +The default configuration for this integration is not expected to impose a significant performance impact on the system. + + +## Metrics + +Metrics grouped by *scope*. + +The scope defines the instance that the metric belongs to. An instance is uniquely identified by a set of labels. + + + +### Per Icecast source + +These metrics refer to an icecast source. + +Labels: + +| Label | Description | +|:-----------|:----------------| +| source | Source name. | + +Metrics: + +| Metric | Dimensions | Unit | +|:------|:----------|:----| +| icecast.listeners | listeners | listeners | + + + +## Alerts + +There are no alerts configured by default for this integration. + + +## Setup + +### Prerequisites + +#### Icecast minimum version + +Needs at least Icecast version >= 2.4.0 + + +### Configuration + +#### File + +The configuration file name for this integration is `go.d/icecast.conf`. + + +You can edit the configuration file using the `edit-config` script from the +Netdata [config directory](/docs/netdata-agent/configuration/README.md#the-netdata-config-directory). + +```bash +cd /etc/netdata 2>/dev/null || cd /opt/netdata/etc/netdata +sudo ./edit-config go.d/icecast.conf +``` +#### Options + +The following options can be defined globally: update_every, autodetection_retry. + + +<details open><summary>Config options</summary> + +| Name | Description | Default | Required | +|:----|:-----------|:-------|:--------:| +| update_every | Data collection frequency. | 1 | no | +| autodetection_retry | Recheck interval in seconds. Zero means no recheck will be scheduled. | 0 | no | +| url | Server URL. | http://127.0.0.1:8000 | yes | +| timeout | HTTP request timeout. | 1 | no | +| username | Username for basic HTTP authentication. | | no | +| password | Password for basic HTTP authentication. | | no | +| proxy_url | Proxy URL. | | no | +| proxy_username | Username for proxy basic HTTP authentication. | | no | +| proxy_password | Password for proxy basic HTTP authentication. | | no | +| method | HTTP request method. | POST | no | +| body | HTTP request body. | | no | +| headers | HTTP request headers. | | no | +| not_follow_redirects | Redirect handling policy. Controls whether the client follows redirects. | no | no | +| tls_skip_verify | Server certificate chain and hostname validation policy. Controls whether the client performs this check. | no | no | +| tls_ca | Certification authority that the client uses when verifying the server's certificates. | | no | +| tls_cert | Client TLS certificate. | | no | +| tls_key | Client TLS key. | | no | + +</details> + +#### Examples + +##### Basic + +A basic example configuration. + +```yaml +jobs: + - name: local + url: http://127.0.0.1:8000 + +``` +##### Multi-instance + +> **Note**: When you define multiple jobs, their names must be unique. + +Collecting metrics from local and remote instances. + + +<details open><summary>Config</summary> + +```yaml +jobs: + - name: local + url: http://127.0.0.1:8000 + + - name: remote + url: http://192.0.2.1:8000 + +``` +</details> + + + +## Troubleshooting + +### Debug Mode + +**Important**: Debug mode is not supported for data collection jobs created via the UI using the Dyncfg feature. + +To troubleshoot issues with the `icecast` collector, run the `go.d.plugin` with the debug option enabled. The output +should give you clues as to why the collector isn't working. + +- Navigate to the `plugins.d` directory, usually at `/usr/libexec/netdata/plugins.d/`. If that's not the case on + your system, open `netdata.conf` and look for the `plugins` setting under `[directories]`. + + ```bash + cd /usr/libexec/netdata/plugins.d/ + ``` + +- Switch to the `netdata` user. + + ```bash + sudo -u netdata -s + ``` + +- Run the `go.d.plugin` to debug the collector: + + ```bash + ./go.d.plugin -d -m icecast + ``` + +### Getting Logs + +If you're encountering problems with the `icecast` collector, follow these steps to retrieve logs and identify potential issues: + +- **Run the command** specific to your system (systemd, non-systemd, or Docker container). +- **Examine the output** for any warnings or error messages that might indicate issues. These messages should provide clues about the root cause of the problem. + +#### System with systemd + +Use the following command to view logs generated since the last Netdata service restart: + +```bash +journalctl _SYSTEMD_INVOCATION_ID="$(systemctl show --value --property=InvocationID netdata)" --namespace=netdata --grep icecast +``` + +#### System without systemd + +Locate the collector log file, typically at `/var/log/netdata/collector.log`, and use `grep` to filter for collector's name: + +```bash +grep icecast /var/log/netdata/collector.log +``` + +**Note**: This method shows logs from all restarts. Focus on the **latest entries** for troubleshooting current issues. + +#### Docker Container + +If your Netdata runs in a Docker container named "netdata" (replace if different), use this command: + +```bash +docker logs netdata 2>&1 | grep icecast +``` + + diff --git a/src/go/plugin/go.d/modules/icecast/metadata.yaml b/src/go/plugin/go.d/modules/icecast/metadata.yaml new file mode 100644 index 000000000..bcaa4b07c --- /dev/null +++ b/src/go/plugin/go.d/modules/icecast/metadata.yaml @@ -0,0 +1,169 @@ +plugin_name: go.d.plugin +modules: + - meta: + plugin_name: go.d.plugin + module_name: icecast + monitored_instance: + name: Icecast + link: "https://icecast.org/" + categories: + - data-collection.media-streaming-servers + icon_filename: "icecast.svg" + related_resources: + integrations: + list: [] + info_provided_to_referring_integrations: + description: "" + keywords: + - icecast + - streaming + - media + most_popular: false + overview: + data_collection: + metrics_description: "This collector monitors Icecast listener counts." + method_description: "It uses the Icecast server statistics `status-json.xsl` endpoint to retrieve the metrics." + supported_platforms: + include: [] + exclude: [] + multi_instance: true + additional_permissions: + description: "" + default_behavior: + auto_detection: + description: By default, it detects Icecast instances running on localhost that are listening on port 8000. + limits: + description: "" + performance_impact: + description: "" + setup: + prerequisites: + list: + - title: "Icecast minimum version" + description: "Needs at least Icecast version >= 2.4.0" + configuration: + file: + name: go.d/icecast.conf + options: + description: | + The following options can be defined globally: update_every, autodetection_retry. + folding: + title: "Config options" + enabled: true + list: + - name: update_every + description: Data collection frequency. + default_value: 1 + required: false + - name: autodetection_retry + description: Recheck interval in seconds. Zero means no recheck will be scheduled. + default_value: 0 + required: false + - name: url + description: Server URL. + default_value: http://127.0.0.1:8000 + required: true + - name: timeout + description: HTTP request timeout. + default_value: 1 + required: false + - name: username + description: Username for basic HTTP authentication. + default_value: "" + required: false + - name: password + description: Password for basic HTTP authentication. + default_value: "" + required: false + - name: proxy_url + description: Proxy URL. + default_value: "" + required: false + - name: proxy_username + description: Username for proxy basic HTTP authentication. + default_value: "" + required: false + - name: proxy_password + description: Password for proxy basic HTTP authentication. + default_value: "" + required: false + - name: method + description: HTTP request method. + default_value: POST + required: false + - name: body + description: HTTP request body. + default_value: "" + required: false + - name: headers + description: HTTP request headers. + default_value: "" + required: false + - name: not_follow_redirects + description: Redirect handling policy. Controls whether the client follows redirects. + default_value: false + required: false + - name: tls_skip_verify + description: Server certificate chain and hostname validation policy. Controls whether the client performs this check. + default_value: false + required: false + - name: tls_ca + description: Certification authority that the client uses when verifying the server's certificates. + default_value: "" + required: false + - name: tls_cert + description: Client TLS certificate. + default_value: "" + required: false + - name: tls_key + description: Client TLS key. + default_value: "" + required: false + examples: + folding: + enabled: true + title: Config + list: + - name: Basic + description: A basic example configuration. + folding: + enabled: false + config: | + jobs: + - name: local + url: http://127.0.0.1:8000 + - name: Multi-instance + description: | + > **Note**: When you define multiple jobs, their names must be unique. + + Collecting metrics from local and remote instances. + config: | + jobs: + - name: local + url: http://127.0.0.1:8000 + + - name: remote + url: http://192.0.2.1:8000 + troubleshooting: + problems: + list: [] + alerts: [] + metrics: + folding: + title: Metrics + enabled: false + description: "" + availability: [] + scopes: + - name: Icecast source + description: "These metrics refer to an icecast source." + labels: + - name: source + description: Source name. + metrics: + - name: icecast.listeners + description: Icecast Listeners + unit: "listeners" + chart_type: line + dimensions: + - name: listeners diff --git a/src/go/plugin/go.d/modules/icecast/server_stats.go b/src/go/plugin/go.d/modules/icecast/server_stats.go new file mode 100644 index 000000000..404d12555 --- /dev/null +++ b/src/go/plugin/go.d/modules/icecast/server_stats.go @@ -0,0 +1,45 @@ +// SPDX-License-Identifier: GPL-3.0-or-later + +package icecast + +import ( + "encoding/json" + "fmt" +) + +type ( + serverStats struct { + IceStats *struct { + Source iceSource `json:"source"` + } `json:"icestats"` + } + iceSource []sourceStats + sourceStats struct { + ServerName string `json:"server_name"` + StreamStart string `json:"stream_start"` + Listeners int64 `json:"listeners"` + } +) + +func (i *iceSource) UnmarshalJSON(data []byte) error { + var v any + if err := json.Unmarshal(data, &v); err != nil { + return err + } + + switch v.(type) { + case []any: + type plain iceSource + return json.Unmarshal(data, (*plain)(i)) + case map[string]any: + var s sourceStats + if err := json.Unmarshal(data, &s); err != nil { + return err + } + *i = []sourceStats{s} + default: + return fmt.Errorf("invalid source data type: expected array or object") + } + + return nil +} diff --git a/src/go/collectors/go.d.plugin/modules/k8s_kubeproxy/testdata/config.json b/src/go/plugin/go.d/modules/icecast/testdata/config.json index 984c3ed6e..984c3ed6e 100644 --- a/src/go/collectors/go.d.plugin/modules/k8s_kubeproxy/testdata/config.json +++ b/src/go/plugin/go.d/modules/icecast/testdata/config.json diff --git a/src/go/collectors/go.d.plugin/modules/k8s_kubeproxy/testdata/config.yaml b/src/go/plugin/go.d/modules/icecast/testdata/config.yaml index 8558b61cc..8558b61cc 100644 --- a/src/go/collectors/go.d.plugin/modules/k8s_kubeproxy/testdata/config.yaml +++ b/src/go/plugin/go.d/modules/icecast/testdata/config.yaml diff --git a/src/go/plugin/go.d/modules/icecast/testdata/stats_multi_source.json b/src/go/plugin/go.d/modules/icecast/testdata/stats_multi_source.json new file mode 100644 index 000000000..0a9c45151 --- /dev/null +++ b/src/go/plugin/go.d/modules/icecast/testdata/stats_multi_source.json @@ -0,0 +1,46 @@ +{ + "icestats": { + "admin": "icemaster@localhost", + "host": "localhost", + "location": "Earth", + "server_id": "Icecast 2.4.4", + "server_start": "Wed, 17 Jul 2024 11:27:40 +0300", + "server_start_iso8601": "2024-07-17T11:27:40+0300", + "source": [ + { + "audio_info": "ice-bitrate=128;ice-channels=2;ice-samplerate=44100", + "genre": "(null)", + "ice-bitrate": 128, + "ice-channels": 2, + "ice-samplerate": 44100, + "listener_peak": 2, + "listeners": 1, + "listenurl": "http://localhost:8000/line.nsv", + "server_description": "(null)", + "server_name": "abc", + "server_type": "audio/mpeg", + "server_url": "(null)", + "stream_start": "Wed, 17 Jul 2024 12:10:20 +0300", + "stream_start_iso8601": "2024-07-17T12:10:20+0300", + "dummy": null + }, + { + "audio_info": "ice-bitrate=128;ice-channels=2;ice-samplerate=44100", + "genre": "(null)", + "ice-bitrate": 128, + "ice-channels": 2, + "ice-samplerate": 44100, + "listener_peak": 10, + "listeners": 10, + "listenurl": "http://localhost:8000/lineb.nsv", + "server_description": "(null)", + "server_name": "efg", + "server_type": "audio/mpeg", + "server_url": "(null)", + "stream_start": "Wed, 17 Jul 2024 12:10:20 +0300", + "stream_start_iso8601": "2024-07-17T12:10:20+0300", + "dummy": null + } + ] + } +} diff --git a/src/go/plugin/go.d/modules/icecast/testdata/stats_no_sources.json b/src/go/plugin/go.d/modules/icecast/testdata/stats_no_sources.json new file mode 100644 index 000000000..3af4fbe37 --- /dev/null +++ b/src/go/plugin/go.d/modules/icecast/testdata/stats_no_sources.json @@ -0,0 +1,11 @@ +{ + "icestats": { + "admin": "icemaster@localhost", + "host": "localhost", + "location": "Earth", + "server_id": "Icecast 2.4.4", + "server_start": "Wed, 17 Jul 2024 11:27:40 +0300", + "server_start_iso8601": "2024-07-17T11:27:40+0300", + "dummy": null + } +}
\ No newline at end of file diff --git a/src/go/plugin/go.d/modules/icecast/testdata/stats_single_source.json b/src/go/plugin/go.d/modules/icecast/testdata/stats_single_source.json new file mode 100644 index 000000000..9d14e7d64 --- /dev/null +++ b/src/go/plugin/go.d/modules/icecast/testdata/stats_single_source.json @@ -0,0 +1,27 @@ +{ + "icestats": { + "admin": "icemaster@localhost", + "host": "localhost", + "location": "Earth", + "server_id": "Icecast 2.4.4", + "server_start": "Wed, 17 Jul 2024 11:27:40 +0300", + "server_start_iso8601": "2024-07-17T11:27:40+0300", + "source": { + "audio_info": "ice-bitrate=128;ice-channels=2;ice-samplerate=44100", + "genre": "(null)", + "ice-bitrate": 128, + "ice-channels": 2, + "ice-samplerate": 44100, + "listener_peak": 2, + "listeners": 1, + "listenurl": "http://localhost:8000/line.nsv", + "server_description": "(null)", + "server_name": "abc", + "server_type": "audio/mpeg", + "server_url": "(null)", + "stream_start": "Wed, 17 Jul 2024 12:10:20 +0300", + "stream_start_iso8601": "2024-07-17T12:10:20+0300", + "dummy": null + } + } +} diff --git a/src/go/plugin/go.d/modules/init.go b/src/go/plugin/go.d/modules/init.go new file mode 100644 index 000000000..8271a70ee --- /dev/null +++ b/src/go/plugin/go.d/modules/init.go @@ -0,0 +1,116 @@ +// SPDX-License-Identifier: GPL-3.0-or-later + +package modules + +import ( + _ "github.com/netdata/netdata/go/plugins/plugin/go.d/modules/activemq" + _ "github.com/netdata/netdata/go/plugins/plugin/go.d/modules/adaptecraid" + _ "github.com/netdata/netdata/go/plugins/plugin/go.d/modules/ap" + _ "github.com/netdata/netdata/go/plugins/plugin/go.d/modules/apache" + _ "github.com/netdata/netdata/go/plugins/plugin/go.d/modules/beanstalk" + _ "github.com/netdata/netdata/go/plugins/plugin/go.d/modules/bind" + _ "github.com/netdata/netdata/go/plugins/plugin/go.d/modules/cassandra" + _ "github.com/netdata/netdata/go/plugins/plugin/go.d/modules/chrony" + _ "github.com/netdata/netdata/go/plugins/plugin/go.d/modules/clickhouse" + _ "github.com/netdata/netdata/go/plugins/plugin/go.d/modules/cockroachdb" + _ "github.com/netdata/netdata/go/plugins/plugin/go.d/modules/consul" + _ "github.com/netdata/netdata/go/plugins/plugin/go.d/modules/coredns" + _ "github.com/netdata/netdata/go/plugins/plugin/go.d/modules/couchbase" + _ "github.com/netdata/netdata/go/plugins/plugin/go.d/modules/couchdb" + _ "github.com/netdata/netdata/go/plugins/plugin/go.d/modules/dmcache" + _ "github.com/netdata/netdata/go/plugins/plugin/go.d/modules/dnsdist" + _ "github.com/netdata/netdata/go/plugins/plugin/go.d/modules/dnsmasq" + _ "github.com/netdata/netdata/go/plugins/plugin/go.d/modules/dnsmasq_dhcp" + _ "github.com/netdata/netdata/go/plugins/plugin/go.d/modules/dnsquery" + _ "github.com/netdata/netdata/go/plugins/plugin/go.d/modules/docker" + _ "github.com/netdata/netdata/go/plugins/plugin/go.d/modules/docker_engine" + _ "github.com/netdata/netdata/go/plugins/plugin/go.d/modules/dockerhub" + _ "github.com/netdata/netdata/go/plugins/plugin/go.d/modules/dovecot" + _ "github.com/netdata/netdata/go/plugins/plugin/go.d/modules/elasticsearch" + _ "github.com/netdata/netdata/go/plugins/plugin/go.d/modules/envoy" + _ "github.com/netdata/netdata/go/plugins/plugin/go.d/modules/example" + _ "github.com/netdata/netdata/go/plugins/plugin/go.d/modules/exim" + _ "github.com/netdata/netdata/go/plugins/plugin/go.d/modules/fail2ban" + _ "github.com/netdata/netdata/go/plugins/plugin/go.d/modules/filecheck" + _ "github.com/netdata/netdata/go/plugins/plugin/go.d/modules/fluentd" + _ "github.com/netdata/netdata/go/plugins/plugin/go.d/modules/freeradius" + _ "github.com/netdata/netdata/go/plugins/plugin/go.d/modules/gearman" + _ "github.com/netdata/netdata/go/plugins/plugin/go.d/modules/geth" + _ "github.com/netdata/netdata/go/plugins/plugin/go.d/modules/haproxy" + _ "github.com/netdata/netdata/go/plugins/plugin/go.d/modules/hddtemp" + _ "github.com/netdata/netdata/go/plugins/plugin/go.d/modules/hdfs" + _ "github.com/netdata/netdata/go/plugins/plugin/go.d/modules/hpssa" + _ "github.com/netdata/netdata/go/plugins/plugin/go.d/modules/httpcheck" + _ "github.com/netdata/netdata/go/plugins/plugin/go.d/modules/icecast" + _ "github.com/netdata/netdata/go/plugins/plugin/go.d/modules/intelgpu" + _ "github.com/netdata/netdata/go/plugins/plugin/go.d/modules/ipfs" + _ "github.com/netdata/netdata/go/plugins/plugin/go.d/modules/isc_dhcpd" + _ "github.com/netdata/netdata/go/plugins/plugin/go.d/modules/k8s_kubelet" + _ "github.com/netdata/netdata/go/plugins/plugin/go.d/modules/k8s_kubeproxy" + _ "github.com/netdata/netdata/go/plugins/plugin/go.d/modules/k8s_state" + _ "github.com/netdata/netdata/go/plugins/plugin/go.d/modules/lighttpd" + _ "github.com/netdata/netdata/go/plugins/plugin/go.d/modules/litespeed" + _ "github.com/netdata/netdata/go/plugins/plugin/go.d/modules/logind" + _ "github.com/netdata/netdata/go/plugins/plugin/go.d/modules/logstash" + _ "github.com/netdata/netdata/go/plugins/plugin/go.d/modules/lvm" + _ "github.com/netdata/netdata/go/plugins/plugin/go.d/modules/megacli" + _ "github.com/netdata/netdata/go/plugins/plugin/go.d/modules/memcached" + _ "github.com/netdata/netdata/go/plugins/plugin/go.d/modules/mongodb" + _ "github.com/netdata/netdata/go/plugins/plugin/go.d/modules/monit" + _ "github.com/netdata/netdata/go/plugins/plugin/go.d/modules/mysql" + _ "github.com/netdata/netdata/go/plugins/plugin/go.d/modules/nginx" + _ "github.com/netdata/netdata/go/plugins/plugin/go.d/modules/nginxplus" + _ "github.com/netdata/netdata/go/plugins/plugin/go.d/modules/nginxvts" + _ "github.com/netdata/netdata/go/plugins/plugin/go.d/modules/nsd" + _ "github.com/netdata/netdata/go/plugins/plugin/go.d/modules/ntpd" + _ "github.com/netdata/netdata/go/plugins/plugin/go.d/modules/nvidia_smi" + _ "github.com/netdata/netdata/go/plugins/plugin/go.d/modules/nvme" + _ "github.com/netdata/netdata/go/plugins/plugin/go.d/modules/openvpn" + _ "github.com/netdata/netdata/go/plugins/plugin/go.d/modules/openvpn_status_log" + _ "github.com/netdata/netdata/go/plugins/plugin/go.d/modules/pgbouncer" + _ "github.com/netdata/netdata/go/plugins/plugin/go.d/modules/phpdaemon" + _ "github.com/netdata/netdata/go/plugins/plugin/go.d/modules/phpfpm" + _ "github.com/netdata/netdata/go/plugins/plugin/go.d/modules/pihole" + _ "github.com/netdata/netdata/go/plugins/plugin/go.d/modules/pika" + _ "github.com/netdata/netdata/go/plugins/plugin/go.d/modules/ping" + _ "github.com/netdata/netdata/go/plugins/plugin/go.d/modules/portcheck" + _ "github.com/netdata/netdata/go/plugins/plugin/go.d/modules/postfix" + _ "github.com/netdata/netdata/go/plugins/plugin/go.d/modules/postgres" + _ "github.com/netdata/netdata/go/plugins/plugin/go.d/modules/powerdns" + _ "github.com/netdata/netdata/go/plugins/plugin/go.d/modules/powerdns_recursor" + _ "github.com/netdata/netdata/go/plugins/plugin/go.d/modules/prometheus" + _ "github.com/netdata/netdata/go/plugins/plugin/go.d/modules/proxysql" + _ "github.com/netdata/netdata/go/plugins/plugin/go.d/modules/pulsar" + _ "github.com/netdata/netdata/go/plugins/plugin/go.d/modules/puppet" + _ "github.com/netdata/netdata/go/plugins/plugin/go.d/modules/rabbitmq" + _ "github.com/netdata/netdata/go/plugins/plugin/go.d/modules/redis" + _ "github.com/netdata/netdata/go/plugins/plugin/go.d/modules/rethinkdb" + _ "github.com/netdata/netdata/go/plugins/plugin/go.d/modules/riakkv" + _ "github.com/netdata/netdata/go/plugins/plugin/go.d/modules/rspamd" + _ "github.com/netdata/netdata/go/plugins/plugin/go.d/modules/scaleio" + _ "github.com/netdata/netdata/go/plugins/plugin/go.d/modules/sensors" + _ "github.com/netdata/netdata/go/plugins/plugin/go.d/modules/smartctl" + _ "github.com/netdata/netdata/go/plugins/plugin/go.d/modules/snmp" + _ "github.com/netdata/netdata/go/plugins/plugin/go.d/modules/squid" + _ "github.com/netdata/netdata/go/plugins/plugin/go.d/modules/squidlog" + _ "github.com/netdata/netdata/go/plugins/plugin/go.d/modules/storcli" + _ "github.com/netdata/netdata/go/plugins/plugin/go.d/modules/supervisord" + _ "github.com/netdata/netdata/go/plugins/plugin/go.d/modules/systemdunits" + _ "github.com/netdata/netdata/go/plugins/plugin/go.d/modules/tengine" + _ "github.com/netdata/netdata/go/plugins/plugin/go.d/modules/tomcat" + _ "github.com/netdata/netdata/go/plugins/plugin/go.d/modules/tor" + _ "github.com/netdata/netdata/go/plugins/plugin/go.d/modules/traefik" + _ "github.com/netdata/netdata/go/plugins/plugin/go.d/modules/unbound" + _ "github.com/netdata/netdata/go/plugins/plugin/go.d/modules/upsd" + _ "github.com/netdata/netdata/go/plugins/plugin/go.d/modules/uwsgi" + _ "github.com/netdata/netdata/go/plugins/plugin/go.d/modules/vcsa" + _ "github.com/netdata/netdata/go/plugins/plugin/go.d/modules/vernemq" + _ "github.com/netdata/netdata/go/plugins/plugin/go.d/modules/vsphere" + _ "github.com/netdata/netdata/go/plugins/plugin/go.d/modules/weblog" + _ "github.com/netdata/netdata/go/plugins/plugin/go.d/modules/whoisquery" + _ "github.com/netdata/netdata/go/plugins/plugin/go.d/modules/windows" + _ "github.com/netdata/netdata/go/plugins/plugin/go.d/modules/wireguard" + _ "github.com/netdata/netdata/go/plugins/plugin/go.d/modules/x509check" + _ "github.com/netdata/netdata/go/plugins/plugin/go.d/modules/zfspool" + _ "github.com/netdata/netdata/go/plugins/plugin/go.d/modules/zookeeper" +) diff --git a/src/go/collectors/go.d.plugin/modules/intelgpu/README.md b/src/go/plugin/go.d/modules/intelgpu/README.md index 44282e036..44282e036 120000 --- a/src/go/collectors/go.d.plugin/modules/intelgpu/README.md +++ b/src/go/plugin/go.d/modules/intelgpu/README.md diff --git a/src/go/collectors/go.d.plugin/modules/intelgpu/charts.go b/src/go/plugin/go.d/modules/intelgpu/charts.go index 93670633c..a73efc726 100644 --- a/src/go/collectors/go.d.plugin/modules/intelgpu/charts.go +++ b/src/go/plugin/go.d/modules/intelgpu/charts.go @@ -6,7 +6,7 @@ import ( "fmt" "strings" - "github.com/netdata/netdata/go/go.d.plugin/agent/module" + "github.com/netdata/netdata/go/plugins/plugin/go.d/agent/module" ) const ( diff --git a/src/go/collectors/go.d.plugin/modules/intelgpu/collect.go b/src/go/plugin/go.d/modules/intelgpu/collect.go index 38e8b305a..38e8b305a 100644 --- a/src/go/collectors/go.d.plugin/modules/intelgpu/collect.go +++ b/src/go/plugin/go.d/modules/intelgpu/collect.go diff --git a/src/go/collectors/go.d.plugin/modules/intelgpu/config_schema.json b/src/go/plugin/go.d/modules/intelgpu/config_schema.json index ac8183421..ac8183421 100644 --- a/src/go/collectors/go.d.plugin/modules/intelgpu/config_schema.json +++ b/src/go/plugin/go.d/modules/intelgpu/config_schema.json diff --git a/src/go/collectors/go.d.plugin/modules/intelgpu/exec.go b/src/go/plugin/go.d/modules/intelgpu/exec.go index 8a57c798b..bdfb526ef 100644 --- a/src/go/collectors/go.d.plugin/modules/intelgpu/exec.go +++ b/src/go/plugin/go.d/modules/intelgpu/exec.go @@ -11,7 +11,7 @@ import ( "sync" "time" - "github.com/netdata/netdata/go/go.d.plugin/logger" + "github.com/netdata/netdata/go/plugins/logger" ) func newIntelGpuTopExec(log *logger.Logger, ndsudoPath string, updateEvery int, device string) (*intelGpuTopExec, error) { diff --git a/src/go/collectors/go.d.plugin/modules/intelgpu/init.go b/src/go/plugin/go.d/modules/intelgpu/init.go index 5b02d02b2..df489686d 100644 --- a/src/go/collectors/go.d.plugin/modules/intelgpu/init.go +++ b/src/go/plugin/go.d/modules/intelgpu/init.go @@ -7,7 +7,7 @@ import ( "os" "path/filepath" - "github.com/netdata/netdata/go/go.d.plugin/agent/executable" + "github.com/netdata/netdata/go/plugins/pkg/executable" ) func (ig *IntelGPU) initIntelGPUTopExec() (intelGpuTop, error) { diff --git a/src/go/collectors/go.d.plugin/modules/intelgpu/integrations/intel_gpu.md b/src/go/plugin/go.d/modules/intelgpu/integrations/intel_gpu.md index 1c17f5656..696746601 100644 --- a/src/go/collectors/go.d.plugin/modules/intelgpu/integrations/intel_gpu.md +++ b/src/go/plugin/go.d/modules/intelgpu/integrations/intel_gpu.md @@ -1,6 +1,6 @@ <!--startmeta -custom_edit_url: "https://github.com/netdata/netdata/edit/master/src/go/collectors/go.d.plugin/modules/intelgpu/README.md" -meta_yaml: "https://github.com/netdata/netdata/edit/master/src/go/collectors/go.d.plugin/modules/intelgpu/metadata.yaml" +custom_edit_url: "https://github.com/netdata/netdata/edit/master/src/go/plugin/go.d/modules/intelgpu/README.md" +meta_yaml: "https://github.com/netdata/netdata/edit/master/src/go/plugin/go.d/modules/intelgpu/metadata.yaml" sidebar_label: "Intel GPU" learn_status: "Published" learn_rel_path: "Collecting Metrics/Hardware Devices and Sensors" @@ -153,6 +153,8 @@ jobs: ### Debug Mode +**Important**: Debug mode is not supported for data collection jobs created via the UI using the Dyncfg feature. + To troubleshoot issues with the `intelgpu` collector, run the `go.d.plugin` with the debug option enabled. The output should give you clues as to why the collector isn't working. @@ -175,4 +177,37 @@ should give you clues as to why the collector isn't working. ./go.d.plugin -d -m intelgpu ``` +### Getting Logs + +If you're encountering problems with the `intelgpu` collector, follow these steps to retrieve logs and identify potential issues: + +- **Run the command** specific to your system (systemd, non-systemd, or Docker container). +- **Examine the output** for any warnings or error messages that might indicate issues. These messages should provide clues about the root cause of the problem. + +#### System with systemd + +Use the following command to view logs generated since the last Netdata service restart: + +```bash +journalctl _SYSTEMD_INVOCATION_ID="$(systemctl show --value --property=InvocationID netdata)" --namespace=netdata --grep intelgpu +``` + +#### System without systemd + +Locate the collector log file, typically at `/var/log/netdata/collector.log`, and use `grep` to filter for collector's name: + +```bash +grep intelgpu /var/log/netdata/collector.log +``` + +**Note**: This method shows logs from all restarts. Focus on the **latest entries** for troubleshooting current issues. + +#### Docker Container + +If your Netdata runs in a Docker container named "netdata" (replace if different), use this command: + +```bash +docker logs netdata 2>&1 | grep intelgpu +``` + diff --git a/src/go/collectors/go.d.plugin/modules/intelgpu/intelgpu.go b/src/go/plugin/go.d/modules/intelgpu/intelgpu.go index d36295c2b..8e98c688d 100644 --- a/src/go/collectors/go.d.plugin/modules/intelgpu/intelgpu.go +++ b/src/go/plugin/go.d/modules/intelgpu/intelgpu.go @@ -6,7 +6,7 @@ import ( _ "embed" "errors" - "github.com/netdata/netdata/go/go.d.plugin/agent/module" + "github.com/netdata/netdata/go/plugins/plugin/go.d/agent/module" ) //go:embed "config_schema.json" diff --git a/src/go/collectors/go.d.plugin/modules/intelgpu/intelgpu_test.go b/src/go/plugin/go.d/modules/intelgpu/intelgpu_test.go index ac38727c6..e38adc284 100644 --- a/src/go/collectors/go.d.plugin/modules/intelgpu/intelgpu_test.go +++ b/src/go/plugin/go.d/modules/intelgpu/intelgpu_test.go @@ -7,7 +7,7 @@ import ( "os" "testing" - "github.com/netdata/netdata/go/go.d.plugin/agent/module" + "github.com/netdata/netdata/go/plugins/plugin/go.d/agent/module" "github.com/stretchr/testify/assert" "github.com/stretchr/testify/require" diff --git a/src/go/collectors/go.d.plugin/modules/intelgpu/metadata.yaml b/src/go/plugin/go.d/modules/intelgpu/metadata.yaml index 3b5b39f25..3b5b39f25 100644 --- a/src/go/collectors/go.d.plugin/modules/intelgpu/metadata.yaml +++ b/src/go/plugin/go.d/modules/intelgpu/metadata.yaml diff --git a/src/go/collectors/go.d.plugin/modules/intelgpu/testdata/config.json b/src/go/plugin/go.d/modules/intelgpu/testdata/config.json index 167bd15fe..167bd15fe 100644 --- a/src/go/collectors/go.d.plugin/modules/intelgpu/testdata/config.json +++ b/src/go/plugin/go.d/modules/intelgpu/testdata/config.json diff --git a/src/go/collectors/go.d.plugin/modules/intelgpu/testdata/config.yaml b/src/go/plugin/go.d/modules/intelgpu/testdata/config.yaml index f27729e3c..f27729e3c 100644 --- a/src/go/collectors/go.d.plugin/modules/intelgpu/testdata/config.yaml +++ b/src/go/plugin/go.d/modules/intelgpu/testdata/config.yaml diff --git a/src/go/collectors/go.d.plugin/modules/intelgpu/testdata/igt.json b/src/go/plugin/go.d/modules/intelgpu/testdata/igt.json index 4d43cbc5f..4d43cbc5f 100644 --- a/src/go/collectors/go.d.plugin/modules/intelgpu/testdata/igt.json +++ b/src/go/plugin/go.d/modules/intelgpu/testdata/igt.json diff --git a/src/collectors/python.d.plugin/ipfs/README.md b/src/go/plugin/go.d/modules/ipfs/README.md index eee6a07b2..eee6a07b2 120000 --- a/src/collectors/python.d.plugin/ipfs/README.md +++ b/src/go/plugin/go.d/modules/ipfs/README.md diff --git a/src/go/plugin/go.d/modules/ipfs/charts.go b/src/go/plugin/go.d/modules/ipfs/charts.go new file mode 100644 index 000000000..1f71c7b40 --- /dev/null +++ b/src/go/plugin/go.d/modules/ipfs/charts.go @@ -0,0 +1,105 @@ +// SPDX-License-Identifier: GPL-3.0-or-later + +package ipfs + +import ( + "github.com/netdata/netdata/go/plugins/plugin/go.d/agent/module" +) + +const ( + prioBandwidth = module.Priority + iota + prioSwarmPeers + prioDatastoreSpaceUtilization + prioRepoSize + prioRepoObj + prioRepoPinnedObj +) + +var charts = module.Charts{ + bandwidthChart.Copy(), + peersChart.Copy(), + datastoreUtilizationChart.Copy(), + repoSizeChart.Copy(), + repoObjChart.Copy(), + repoPinnedObjChart.Copy(), +} + +var ( + bandwidthChart = module.Chart{ + ID: "bandwidth", + Title: "IPFS Bandwidth", + Units: "bytes/s", + Fam: "bandwidth", + Ctx: "ipfs.bandwidth", + Type: module.Area, + Priority: prioBandwidth, + Dims: module.Dims{ + {ID: "in", Algo: module.Incremental}, + {ID: "out", Mul: -1, Algo: module.Incremental}, + }, + } + + peersChart = module.Chart{ + ID: "peers", + Title: "IPFS Peers", + Units: "peers", + Fam: "peers", + Ctx: "ipfs.peers", + Type: module.Line, + Priority: prioSwarmPeers, + Dims: module.Dims{ + {ID: "peers"}, + }, + } + + datastoreUtilizationChart = module.Chart{ + ID: "datastore_space_utilization", + Title: "IPFS Datastore Space Utilization", + Units: "percent", + Fam: "size", + Ctx: "ipfs.datastore_space_utilization", + Type: module.Area, + Priority: prioDatastoreSpaceUtilization, + Dims: module.Dims{ + {ID: "used_percent", Name: "used"}, + }, + } + repoSizeChart = module.Chart{ + ID: "repo_size", + Title: "IPFS Repo Size", + Units: "bytes", + Fam: "size", + Ctx: "ipfs.repo_size", + Type: module.Line, + Priority: prioRepoSize, + Dims: module.Dims{ + {ID: "size"}, + }, + } + + repoObjChart = module.Chart{ + ID: "repo_objects", + Title: "IPFS Repo Objects", + Units: "objects", + Fam: "objects", + Ctx: "ipfs.repo_objects", + Type: module.Line, + Priority: prioRepoObj, + Dims: module.Dims{ + {ID: "objects"}, + }, + } + repoPinnedObjChart = module.Chart{ + ID: "repo_pinned_objects", + Title: "IPFS Repo Pinned Objects", + Units: "objects", + Fam: "objects", + Ctx: "ipfs.repo_pinned_objects", + Type: module.Line, + Priority: prioRepoPinnedObj, + Dims: module.Dims{ + {ID: "pinned"}, + {ID: "recursive_pins"}, + }, + } +) diff --git a/src/go/plugin/go.d/modules/ipfs/collect.go b/src/go/plugin/go.d/modules/ipfs/collect.go new file mode 100644 index 000000000..6bd0b128a --- /dev/null +++ b/src/go/plugin/go.d/modules/ipfs/collect.go @@ -0,0 +1,209 @@ +// SPDX-License-Identifier: GPL-3.0-or-later + +package ipfs + +import ( + "encoding/json" + "fmt" + "io" + "net/http" + + "github.com/netdata/netdata/go/plugins/plugin/go.d/pkg/web" +) + +type ( + ipfsStatsBw struct { + TotalIn int64 `json:"TotalIn"` + TotalOut int64 `json:"TotalOut"` + RateIn *float64 `json:"RateIn"` + RateOut *float64 `json:"RateOut"` + } + ipfsStatsRepo struct { + RepoSize int64 `json:"RepoSize"` + StorageMax int64 `json:"StorageMax"` + NumObjects int64 `json:"NumObjects"` + } + ipfsSwarmPeers struct { + Peers []any `json:"Peers"` + } + ipfsPinsLs struct { + Keys map[string]struct { + Type string `json:"type"` + } `json:"Keys"` + } +) + +const ( + urlPathStatsBandwidth = "/api/v0/stats/bw" // https://docs.ipfs.tech/reference/kubo/rpc/#api-v0-stats-bw + urlPathStatsRepo = "/api/v0/stats/repo" // https://docs.ipfs.tech/reference/kubo/rpc/#api-v0-stats-repo + urlPathSwarmPeers = "/api/v0/swarm/peers" // https://docs.ipfs.tech/reference/kubo/rpc/#api-v0-swarm-peers + urlPathPinLs = "/api/v0/pin/ls" // https://docs.ipfs.tech/reference/kubo/rpc/#api-v0-pin-ls +) + +func (ip *IPFS) collect() (map[string]int64, error) { + mx := make(map[string]int64) + + if err := ip.collectStatsBandwidth(mx); err != nil { + return nil, err + } + if err := ip.collectSwarmPeers(mx); err != nil { + return nil, err + } + if ip.QueryRepoApi { + // https://github.com/netdata/netdata/pull/9687 + // TODO: collect by default with "size-only" + // https://github.com/ipfs/kubo/issues/7528#issuecomment-657398332 + if err := ip.collectStatsRepo(mx); err != nil { + return nil, err + } + } + if ip.QueryPinApi { + if err := ip.collectPinLs(mx); err != nil { + return nil, err + } + } + + return mx, nil +} + +func (ip *IPFS) collectStatsBandwidth(mx map[string]int64) error { + stats, err := ip.queryStatsBandwidth() + if err != nil { + return err + } + + mx["in"] = stats.TotalIn + mx["out"] = stats.TotalOut + + return nil +} + +func (ip *IPFS) collectSwarmPeers(mx map[string]int64) error { + stats, err := ip.querySwarmPeers() + if err != nil { + return err + } + + mx["peers"] = int64(len(stats.Peers)) + + return nil +} + +func (ip *IPFS) collectStatsRepo(mx map[string]int64) error { + stats, err := ip.queryStatsRepo() + if err != nil { + return err + } + + mx["used_percent"] = 0 + if stats.StorageMax > 0 { + mx["used_percent"] = stats.RepoSize * 100 / stats.StorageMax + } + mx["size"] = stats.RepoSize + mx["objects"] = stats.NumObjects + + return nil +} + +func (ip *IPFS) collectPinLs(mx map[string]int64) error { + stats, err := ip.queryPinLs() + if err != nil { + return err + } + + var n int64 + for _, v := range stats.Keys { + if v.Type == "recursive" { + n++ + } + } + + mx["pinned"] = int64(len(stats.Keys)) + mx["recursive_pins"] = n + + return nil +} + +func (ip *IPFS) queryStatsBandwidth() (*ipfsStatsBw, error) { + req, err := web.NewHTTPRequestWithPath(ip.Request, urlPathStatsBandwidth) + if err != nil { + return nil, err + } + + var stats ipfsStatsBw + if err := ip.doOKDecode(req, &stats); err != nil { + return nil, err + } + + if stats.RateIn == nil || stats.RateOut == nil { + return nil, fmt.Errorf("unexpected response: not ipfs data") + } + + return &stats, nil +} + +func (ip *IPFS) querySwarmPeers() (*ipfsSwarmPeers, error) { + req, err := web.NewHTTPRequestWithPath(ip.Request, urlPathSwarmPeers) + if err != nil { + return nil, err + } + + var stats ipfsSwarmPeers + if err := ip.doOKDecode(req, &stats); err != nil { + return nil, err + } + + return &stats, nil +} + +func (ip *IPFS) queryStatsRepo() (*ipfsStatsRepo, error) { + req, err := web.NewHTTPRequestWithPath(ip.Request, urlPathStatsRepo) + if err != nil { + return nil, err + } + + var stats ipfsStatsRepo + if err := ip.doOKDecode(req, &stats); err != nil { + return nil, err + } + + return &stats, nil +} + +func (ip *IPFS) queryPinLs() (*ipfsPinsLs, error) { + req, err := web.NewHTTPRequestWithPath(ip.Request, urlPathPinLs) + if err != nil { + return nil, err + } + + var stats ipfsPinsLs + if err := ip.doOKDecode(req, &stats); err != nil { + return nil, err + } + + return &stats, nil +} + +func (ip *IPFS) doOKDecode(req *http.Request, in interface{}) error { + resp, err := ip.httpClient.Do(req) + if err != nil { + return fmt.Errorf("error on HTTP request '%s': %v", req.URL, err) + } + defer closeBody(resp) + + if resp.StatusCode != http.StatusOK { + return fmt.Errorf("'%s' returned HTTP status code: %d", req.URL, resp.StatusCode) + } + + if err := json.NewDecoder(resp.Body).Decode(in); err != nil { + return fmt.Errorf("error on decoding response from '%s': %v", req.URL, err) + } + return nil +} + +func closeBody(resp *http.Response) { + if resp != nil && resp.Body != nil { + _, _ = io.Copy(io.Discard, resp.Body) + _ = resp.Body.Close() + } +} diff --git a/src/go/plugin/go.d/modules/ipfs/config_schema.json b/src/go/plugin/go.d/modules/ipfs/config_schema.json new file mode 100644 index 000000000..ce4921c3e --- /dev/null +++ b/src/go/plugin/go.d/modules/ipfs/config_schema.json @@ -0,0 +1,195 @@ +{ + "jsonSchema": { + "$schema": "http://json-schema.org/draft-07/schema#", + "title": "IPFS collector configuration.", + "type": "object", + "properties": { + "update_every": { + "title": "Update every", + "description": "Data collection interval, measured in seconds.", + "type": "integer", + "minimum": 1, + "default": 1 + }, + "url": { + "title": "URL", + "description": "The base URL where the IPFS API can be accessed.", + "type": "string", + "default": "http://127.0.0.1:5001", + "format": "uri" + }, + "timeout": { + "title": "Timeout", + "description": "The timeout in seconds for the HTTP request.", + "type": "number", + "minimum": 0.5, + "default": 1 + }, + "not_follow_redirects": { + "title": "Not follow redirects", + "description": "If set, the client will not follow HTTP redirects automatically.", + "type": "boolean" + }, + "repoapi": { + "title": "Query Repo API", + "description": "Enables querying the [/api/v0/stats/repo](https://docs.ipfs.tech/reference/kubo/rpc/#api-v0-repo-stat) endpoint for repository statistics. **Disabled by default** due to potential high CPU usage.", + "type": "boolean" + }, + "pinapi": { + "title": "Query Pin API", + "description": "Enables querying the [/api/v0/pin/ls](https://docs.ipfs.tech/reference/kubo/rpc/#api-v0-pin-ls) endpoint to retrieve a list of all pinned objects. **Consider enabling only if necessary**.", + "type": "boolean" + }, + "username": { + "title": "Username", + "description": "The username for basic authentication.", + "type": "string", + "sensitive": true + }, + "password": { + "title": "Password", + "description": "The password for basic authentication.", + "type": "string", + "sensitive": true + }, + "proxy_url": { + "title": "Proxy URL", + "description": "The URL of the proxy server.", + "type": "string" + }, + "proxy_username": { + "title": "Proxy username", + "description": "The username for proxy authentication.", + "type": "string", + "sensitive": true + }, + "proxy_password": { + "title": "Proxy password", + "description": "The password for proxy authentication.", + "type": "string", + "sensitive": true + }, + "headers": { + "title": "Headers", + "description": "Additional HTTP headers to include in the request.", + "type": [ + "object", + "null" + ], + "additionalProperties": { + "type": "string" + } + }, + "tls_skip_verify": { + "title": "Skip TLS verification", + "description": "If set, TLS certificate verification will be skipped.", + "type": "boolean" + }, + "tls_ca": { + "title": "TLS CA", + "description": "The path to the CA certificate file for TLS verification.", + "type": "string", + "pattern": "^$|^/" + }, + "tls_cert": { + "title": "TLS certificate", + "description": "The path to the client certificate file for TLS authentication.", + "type": "string", + "pattern": "^$|^/" + }, + "tls_key": { + "title": "TLS key", + "description": "The path to the client key file for TLS authentication.", + "type": "string", + "pattern": "^$|^/" + }, + "body": { + "title": "Body", + "type": "string" + }, + "method": { + "title": "Method", + "type": "string" + } + }, + "required": [ + "url" + ], + "additionalProperties": false, + "patternProperties": { + "^name$": {} + } + }, + "uiSchema": { + "uiOptions": { + "fullPage": true + }, + "body": { + "ui:widget": "hidden" + }, + "method": { + "ui:widget": "hidden" + }, + "timeout": { + "ui:help": "Accepts decimals for precise control (e.g., type 1.5 for 1.5 seconds)." + }, + "repoapi": { + "ui:help": "This endpoint retrieves the number of objects in the local repository, which is not cached and can be computationally expensive for IPFS to calculate, especially with frequent collection intervals. See [#7528](https://github.com/ipfs/go-ipfs/issues/7528)." + }, + "pinapi": { + "ui:help": "Performance may decrease as the number of pinned objects grows, as the entire list needs to be retrieved. See [#3874](https://github.com/ipfs/go-ipfs/issues/3874)." + }, + "password": { + "ui:widget": "password" + }, + "proxy_password": { + "ui:widget": "password" + }, + "ui:flavour": "tabs", + "ui:options": { + "tabs": [ + { + "title": "Base", + "fields": [ + "update_every", + "url", + "timeout", + "repoapi", + "pinapi", + "not_follow_redirects" + ] + }, + { + "title": "Auth", + "fields": [ + "username", + "password" + ] + }, + { + "title": "TLS", + "fields": [ + "tls_skip_verify", + "tls_ca", + "tls_cert", + "tls_key" + ] + }, + { + "title": "Proxy", + "fields": [ + "proxy_url", + "proxy_username", + "proxy_password" + ] + }, + { + "title": "Headers", + "fields": [ + "headers" + ] + } + ] + } + } +} diff --git a/src/go/plugin/go.d/modules/ipfs/integrations/ipfs.md b/src/go/plugin/go.d/modules/ipfs/integrations/ipfs.md new file mode 100644 index 000000000..4357b8665 --- /dev/null +++ b/src/go/plugin/go.d/modules/ipfs/integrations/ipfs.md @@ -0,0 +1,246 @@ +<!--startmeta +custom_edit_url: "https://github.com/netdata/netdata/edit/master/src/go/plugin/go.d/modules/ipfs/README.md" +meta_yaml: "https://github.com/netdata/netdata/edit/master/src/go/plugin/go.d/modules/ipfs/metadata.yaml" +sidebar_label: "IPFS" +learn_status: "Published" +learn_rel_path: "Collecting Metrics/Storage, Mount Points and Filesystems" +most_popular: False +message: "DO NOT EDIT THIS FILE DIRECTLY, IT IS GENERATED BY THE COLLECTOR'S metadata.yaml FILE" +endmeta--> + +# IPFS + + +<img src="https://netdata.cloud/img/ipfs.svg" width="150"/> + + +Plugin: go.d.plugin +Module: ipfs + +<img src="https://img.shields.io/badge/maintained%20by-Netdata-%2300ab44" /> + +## Overview + +This collector monitors IPFS daemon health and network activity. + +It uses [RPC API](https://docs.ipfs.tech/reference/kubo/rpc/) to collect metrics. + +Used endpoints: + +- [/api/v0/stats/bw](https://docs.ipfs.tech/reference/kubo/rpc/#api-v0-stats-bw) +- [/api/v0/swarm/peers](https://docs.ipfs.tech/reference/kubo/rpc/#api-v0-swarm-peers) +- [/api/v0/stats/repo](https://docs.ipfs.tech/reference/kubo/rpc/#api-v0-stats-repo) +- [/api/v0/pin/ls](https://docs.ipfs.tech/reference/kubo/rpc/#api-v0-pin-ls) + + +This collector is supported on all platforms. + +This collector supports collecting metrics from multiple instances of this integration, including remote instances. + + +### Default Behavior + +#### Auto-Detection + +By default, it detects IPFS instances running on localhost that are listening on port 5001. + + +#### Limits + +The default configuration for this integration does not impose any limits on data collection. + +#### Performance Impact + +Calls to the following endpoints are disabled by default due to IPFS bugs: + +- /api/v0/stats/repo ([#7528](https://github.com/ipfs/go-ipfs/issues/7528)). +- /api/v0/pin/ls ([#3874](https://github.com/ipfs/go-ipfs/issues/3874)). + +**Disabled by default** due to potential high CPU usage. Consider enabling only if necessary. + + + +## Metrics + +Metrics grouped by *scope*. + +The scope defines the instance that the metric belongs to. An instance is uniquely identified by a set of labels. + + + +### Per IPFS instance + +These metrics refer to the entire monitored application. + +This scope has no labels. + +Metrics: + +| Metric | Dimensions | Unit | +|:------|:----------|:----| +| ipfs.bandwidth | in, out | bytes/s | +| ipfs.peers | peers | peers | +| ipfs.datastore_space_utilization | used | percent | +| ipfs.repo_size | size | bytes | +| ipfs.repo_objects | objects | objects | +| ipfs.repo_pinned_objects | pinned, recursive_pins | objects | + + + +## Alerts + + +The following alerts are available: + +| Alert name | On metric | Description | +|:------------|:----------|:------------| +| [ ipfs_datastore_usage ](https://github.com/netdata/netdata/blob/master/src/health/health.d/ipfs.conf) | ipfs.datastore_space_utilization | IPFS datastore utilization | + + +## Setup + +### Prerequisites + +No action required. + +### Configuration + +#### File + +The configuration file name for this integration is `go.d/ipfs.conf`. + + +You can edit the configuration file using the `edit-config` script from the +Netdata [config directory](/docs/netdata-agent/configuration/README.md#the-netdata-config-directory). + +```bash +cd /etc/netdata 2>/dev/null || cd /opt/netdata/etc/netdata +sudo ./edit-config go.d/ipfs.conf +``` +#### Options + +The following options can be defined globally: update_every, autodetection_retry. + + +<details open><summary>Config options</summary> + +| Name | Description | Default | Required | +|:----|:-----------|:-------|:--------:| +| update_every | Data collection frequency. | 1 | no | +| autodetection_retry | Recheck interval in seconds. Zero means no recheck will be scheduled. | 0 | no | +| repoapi | Enables querying the [/api/v0/stats/repo](https://docs.ipfs.tech/reference/kubo/rpc/#api-v0-repo-stat) endpoint for repository statistics. | no | no | +| pinapi | Enables querying the [/api/v0/pin/ls](https://docs.ipfs.tech/reference/kubo/rpc/#api-v0-pin-ls) endpoint to retrieve a list of all pinned objects. | no | no | +| url | Server URL. | http://127.0.0.1:5001 | yes | +| timeout | HTTP request timeout. | 1 | no | +| username | Username for basic HTTP authentication. | | no | +| password | Password for basic HTTP authentication. | | no | +| proxy_url | Proxy URL. | | no | +| proxy_username | Username for proxy basic HTTP authentication. | | no | +| proxy_password | Password for proxy basic HTTP authentication. | | no | +| method | HTTP request method. | POST | no | +| body | HTTP request body. | | no | +| headers | HTTP request headers. | | no | +| not_follow_redirects | Redirect handling policy. Controls whether the client follows redirects. | no | no | +| tls_skip_verify | Server certificate chain and hostname validation policy. Controls whether the client performs this check. | no | no | +| tls_ca | Certification authority that the client uses when verifying the server's certificates. | | no | +| tls_cert | Client TLS certificate. | | no | +| tls_key | Client TLS key. | | no | + +</details> + +#### Examples + +##### Basic + +A basic example configuration. + +```yaml +jobs: + - name: local + url: http://127.0.0.1:5001 + +``` +##### Multi-instance + +> **Note**: When you define multiple jobs, their names must be unique. + +Collecting metrics from local and remote instances. + + +<details open><summary>Config</summary> + +```yaml +jobs: + - name: local + url: http://127.0.0.1:5001 + + - name: remote + url: http://192.0.2.1:5001 + +``` +</details> + + + +## Troubleshooting + +### Debug Mode + +**Important**: Debug mode is not supported for data collection jobs created via the UI using the Dyncfg feature. + +To troubleshoot issues with the `ipfs` collector, run the `go.d.plugin` with the debug option enabled. The output +should give you clues as to why the collector isn't working. + +- Navigate to the `plugins.d` directory, usually at `/usr/libexec/netdata/plugins.d/`. If that's not the case on + your system, open `netdata.conf` and look for the `plugins` setting under `[directories]`. + + ```bash + cd /usr/libexec/netdata/plugins.d/ + ``` + +- Switch to the `netdata` user. + + ```bash + sudo -u netdata -s + ``` + +- Run the `go.d.plugin` to debug the collector: + + ```bash + ./go.d.plugin -d -m ipfs + ``` + +### Getting Logs + +If you're encountering problems with the `ipfs` collector, follow these steps to retrieve logs and identify potential issues: + +- **Run the command** specific to your system (systemd, non-systemd, or Docker container). +- **Examine the output** for any warnings or error messages that might indicate issues. These messages should provide clues about the root cause of the problem. + +#### System with systemd + +Use the following command to view logs generated since the last Netdata service restart: + +```bash +journalctl _SYSTEMD_INVOCATION_ID="$(systemctl show --value --property=InvocationID netdata)" --namespace=netdata --grep ipfs +``` + +#### System without systemd + +Locate the collector log file, typically at `/var/log/netdata/collector.log`, and use `grep` to filter for collector's name: + +```bash +grep ipfs /var/log/netdata/collector.log +``` + +**Note**: This method shows logs from all restarts. Focus on the **latest entries** for troubleshooting current issues. + +#### Docker Container + +If your Netdata runs in a Docker container named "netdata" (replace if different), use this command: + +```bash +docker logs netdata 2>&1 | grep ipfs +``` + + diff --git a/src/go/plugin/go.d/modules/ipfs/ipfs.go b/src/go/plugin/go.d/modules/ipfs/ipfs.go new file mode 100644 index 000000000..0caed8d9b --- /dev/null +++ b/src/go/plugin/go.d/modules/ipfs/ipfs.go @@ -0,0 +1,128 @@ +// SPDX-License-Identifier: GPL-3.0-or-later + +package ipfs + +import ( + _ "embed" + "errors" + "net/http" + "time" + + "github.com/netdata/netdata/go/plugins/plugin/go.d/agent/module" + "github.com/netdata/netdata/go/plugins/plugin/go.d/pkg/web" +) + +//go:embed "config_schema.json" +var configSchema string + +func init() { + module.Register("ipfs", module.Creator{ + JobConfigSchema: configSchema, + Create: func() module.Module { return New() }, + Config: func() any { return &Config{} }, + }) +} + +func New() *IPFS { + return &IPFS{ + Config: Config{ + HTTP: web.HTTP{ + Request: web.Request{ + URL: "http://127.0.0.1:5001", + Method: http.MethodPost, + }, + Client: web.Client{ + Timeout: web.Duration(time.Second * 1), + }, + }, + QueryRepoApi: false, + QueryPinApi: false, + }, + charts: charts.Copy(), + } +} + +type Config struct { + UpdateEvery int `yaml:"update_every,omitempty" json:"update_every"` + web.HTTP `yaml:",inline" json:""` + QueryPinApi bool `yaml:"pinapi" json:"pinapi"` + QueryRepoApi bool `yaml:"repoapi" json:"repoapi"` +} + +type IPFS struct { + module.Base + Config `yaml:",inline" json:""` + + charts *module.Charts + + httpClient *http.Client +} + +func (ip *IPFS) Configuration() any { + return ip.Config +} + +func (ip *IPFS) Init() error { + if ip.URL == "" { + ip.Error("URL not set") + return errors.New("url not set") + } + + client, err := web.NewHTTPClient(ip.Client) + if err != nil { + ip.Error(err) + return err + } + ip.httpClient = client + + if !ip.QueryPinApi { + _ = ip.Charts().Remove(repoPinnedObjChart.ID) + } + if !ip.QueryRepoApi { + _ = ip.Charts().Remove(datastoreUtilizationChart.ID) + _ = ip.Charts().Remove(repoSizeChart.ID) + _ = ip.Charts().Remove(repoObjChart.ID) + } + + ip.Debugf("using URL %s", ip.URL) + ip.Debugf("using timeout: %s", ip.Timeout) + + return nil +} + +func (ip *IPFS) Check() error { + mx, err := ip.collect() + if err != nil { + ip.Error(err) + return err + } + + if len(mx) == 0 { + return errors.New("no metrics collected") + } + + return nil +} + +func (ip *IPFS) Charts() *module.Charts { + return ip.charts +} + +func (ip *IPFS) Collect() map[string]int64 { + mx, err := ip.collect() + if err != nil { + ip.Error(err) + } + + if len(mx) == 0 { + return nil + } + + return mx +} + +func (ip *IPFS) Cleanup() { + if ip.httpClient != nil { + ip.httpClient.CloseIdleConnections() + } +} diff --git a/src/go/plugin/go.d/modules/ipfs/ipfs_test.go b/src/go/plugin/go.d/modules/ipfs/ipfs_test.go new file mode 100644 index 000000000..5e353a1bc --- /dev/null +++ b/src/go/plugin/go.d/modules/ipfs/ipfs_test.go @@ -0,0 +1,278 @@ +// SPDX-License-Identifier: GPL-3.0-or-later + +package ipfs + +import ( + "net/http" + "net/http/httptest" + "os" + "testing" + + "github.com/netdata/netdata/go/plugins/plugin/go.d/agent/module" + "github.com/netdata/netdata/go/plugins/plugin/go.d/pkg/web" + + "github.com/stretchr/testify/assert" + "github.com/stretchr/testify/require" +) + +var ( + dataConfigJSON, _ = os.ReadFile("testdata/config.json") + dataConfigYAML, _ = os.ReadFile("testdata/config.yaml") + + apiv0PinLsData, _ = os.ReadFile("testdata/api_v0_pin_ls.json") + apiv0StatsBwData, _ = os.ReadFile("testdata/api_v0_stats_bw.json") + apiv0StatsRepoData, _ = os.ReadFile("testdata/api_v0_stats_repo.json") + apiv0SwarmPeersData, _ = os.ReadFile("testdata/api_v0_swarm_peers.json") +) + +func Test_testDataIsValid(t *testing.T) { + for name, data := range map[string][]byte{ + "dataConfigJSON": dataConfigJSON, + "dataConfigYAML": dataConfigYAML, + "apiv0PinLsData": apiv0PinLsData, + "apiv0StatsBwData": apiv0StatsBwData, + "apiv0StatsRepoData": apiv0StatsRepoData, + "apiv0SwarmPeersData": apiv0SwarmPeersData, + } { + require.NotNil(t, data, name) + } +} + +func TestIPFS_ConfigurationSerialize(t *testing.T) { + module.TestConfigurationSerialize(t, &IPFS{}, dataConfigJSON, dataConfigYAML) +} + +func TestIPFS_Init(t *testing.T) { + tests := map[string]struct { + wantFail bool + config Config + }{ + "success with default": { + wantFail: false, + config: New().Config, + }, + "fail when URL not set": { + wantFail: true, + config: Config{ + HTTP: web.HTTP{ + Request: web.Request{URL: ""}, + }, + }, + }, + } + + for name, test := range tests { + t.Run(name, func(t *testing.T) { + ipfs := New() + ipfs.Config = test.config + + if test.wantFail { + assert.Error(t, ipfs.Init()) + } else { + assert.NoError(t, ipfs.Init()) + } + }) + } +} + +func TestIPFS_Charts(t *testing.T) { + assert.NotNil(t, New().Charts()) +} + +func TestIPFS_Check(t *testing.T) { + tests := map[string]struct { + wantFail bool + prepare func(t *testing.T) (*IPFS, func()) + }{ + "success default config": { + wantFail: false, + prepare: prepareCaseOkDefault, + }, + "success all queries enabled": { + wantFail: false, + prepare: prepareCaseOkDefault, + }, + "fails on unexpected json response": { + wantFail: true, + prepare: prepareCaseUnexpectedJsonResponse, + }, + "fails on invalid format response": { + wantFail: true, + prepare: prepareCaseInvalidFormatResponse, + }, + "fails on connection refused": { + wantFail: true, + prepare: prepareCaseConnectionRefused, + }, + } + + for name, test := range tests { + t.Run(name, func(t *testing.T) { + ipfs, cleanup := test.prepare(t) + defer cleanup() + + if test.wantFail { + assert.Error(t, ipfs.Check()) + } else { + assert.NoError(t, ipfs.Check()) + } + }) + } +} + +func TestIPFS_Collect(t *testing.T) { + tests := map[string]struct { + prepare func(t *testing.T) (*IPFS, func()) + wantMetrics map[string]int64 + }{ + "success default config": { + prepare: prepareCaseOkDefault, + wantMetrics: map[string]int64{ + "in": 20113594, + "out": 3113852, + "peers": 6, + }, + }, + "success all queries enabled": { + prepare: prepareCaseOkAllQueriesEnabled, + wantMetrics: map[string]int64{ + "in": 20113594, + "objects": 1, + "out": 3113852, + "peers": 6, + "pinned": 1, + "recursive_pins": 1, + "size": 25495, + "used_percent": 0, + }, + }, + "fails on unexpected json response": { + prepare: prepareCaseUnexpectedJsonResponse, + }, + "fails on invalid format response": { + prepare: prepareCaseInvalidFormatResponse, + }, + "fails on connection refused": { + prepare: prepareCaseConnectionRefused, + }, + } + + for name, test := range tests { + t.Run(name, func(t *testing.T) { + ipfs, cleanup := test.prepare(t) + defer cleanup() + + mx := ipfs.Collect() + + require.Equal(t, test.wantMetrics, mx) + if len(test.wantMetrics) > 0 { + testMetricsHasAllChartsDims(t, ipfs, mx) + } + }) + } +} + +func testMetricsHasAllChartsDims(t *testing.T, ipfs *IPFS, mx map[string]int64) { + for _, chart := range *ipfs.Charts() { + if chart.Obsolete { + continue + } + for _, dim := range chart.Dims { + _, ok := mx[dim.ID] + assert.Truef(t, ok, "collected metrics has no data for dim '%s' chart '%s'", dim.ID, chart.ID) + } + for _, v := range chart.Vars { + _, ok := mx[v.ID] + assert.Truef(t, ok, "collected metrics has no data for var '%s' chart '%s'", v.ID, chart.ID) + } + } +} + +func prepareCaseOkDefault(t *testing.T) (*IPFS, func()) { + t.Helper() + srv := httptest.NewServer(http.HandlerFunc( + func(w http.ResponseWriter, r *http.Request) { + switch r.URL.Path { + case urlPathStatsBandwidth: + _, _ = w.Write(apiv0StatsBwData) + case urlPathStatsRepo: + _, _ = w.Write(apiv0StatsRepoData) + case urlPathSwarmPeers: + _, _ = w.Write(apiv0SwarmPeersData) + case urlPathPinLs: + _, _ = w.Write(apiv0PinLsData) + default: + w.WriteHeader(http.StatusNotFound) + } + })) + + ipfs := New() + ipfs.URL = srv.URL + require.NoError(t, ipfs.Init()) + + return ipfs, srv.Close +} + +func prepareCaseOkAllQueriesEnabled(t *testing.T) (*IPFS, func()) { + t.Helper() + ipfs, cleanup := prepareCaseOkDefault(t) + + ipfs.QueryRepoApi = true + ipfs.QueryPinApi = true + + return ipfs, cleanup +} + +func prepareCaseUnexpectedJsonResponse(t *testing.T) (*IPFS, func()) { + t.Helper() + resp := ` +{ + "elephant": { + "burn": false, + "mountain": true, + "fog": false, + "skin": -1561907625, + "burst": "anyway", + "shadow": 1558616893 + }, + "start": "ever", + "base": 2093056027, + "mission": -2007590351, + "victory": 999053756, + "die": false +} +` + srv := httptest.NewServer(http.HandlerFunc( + func(w http.ResponseWriter, r *http.Request) { + _, _ = w.Write([]byte(resp)) + })) + + ipfs := New() + ipfs.URL = srv.URL + require.NoError(t, ipfs.Init()) + + return ipfs, srv.Close +} + +func prepareCaseInvalidFormatResponse(t *testing.T) (*IPFS, func()) { + t.Helper() + srv := httptest.NewServer(http.HandlerFunc( + func(w http.ResponseWriter, r *http.Request) { + _, _ = w.Write([]byte("hello and\n goodbye")) + })) + + ipfs := New() + ipfs.URL = srv.URL + require.NoError(t, ipfs.Init()) + + return ipfs, srv.Close +} + +func prepareCaseConnectionRefused(t *testing.T) (*IPFS, func()) { + t.Helper() + ipfs := New() + ipfs.URL = "http://127.0.0.1:65001" + require.NoError(t, ipfs.Init()) + + return ipfs, func() {} +} diff --git a/src/go/plugin/go.d/modules/ipfs/metadata.yaml b/src/go/plugin/go.d/modules/ipfs/metadata.yaml new file mode 100644 index 000000000..a37935785 --- /dev/null +++ b/src/go/plugin/go.d/modules/ipfs/metadata.yaml @@ -0,0 +1,224 @@ +plugin_name: go.d.plugin +modules: + - meta: + id: collector-go.d.plugin-ipfs + plugin_name: go.d.plugin + module_name: ipfs + monitored_instance: + name: IPFS + link: "https://ipfs.tech/" + categories: + - data-collection.storage-mount-points-and-filesystems + icon_filename: "ipfs.svg" + related_resources: + integrations: + list: [] + info_provided_to_referring_integrations: + description: "" + keywords: + - ipfs + - filesystem + most_popular: false + overview: + data_collection: + metrics_description: "This collector monitors IPFS daemon health and network activity." + method_description: | + It uses [RPC API](https://docs.ipfs.tech/reference/kubo/rpc/) to collect metrics. + + Used endpoints: + + - [/api/v0/stats/bw](https://docs.ipfs.tech/reference/kubo/rpc/#api-v0-stats-bw) + - [/api/v0/swarm/peers](https://docs.ipfs.tech/reference/kubo/rpc/#api-v0-swarm-peers) + - [/api/v0/stats/repo](https://docs.ipfs.tech/reference/kubo/rpc/#api-v0-stats-repo) + - [/api/v0/pin/ls](https://docs.ipfs.tech/reference/kubo/rpc/#api-v0-pin-ls) + supported_platforms: + include: [] + exclude: [] + multi_instance: true + additional_permissions: + description: "" + default_behavior: + auto_detection: + description: | + By default, it detects IPFS instances running on localhost that are listening on port 5001. + limits: + description: "" + performance_impact: + description: | + Calls to the following endpoints are disabled by default due to IPFS bugs: + + - /api/v0/stats/repo ([#7528](https://github.com/ipfs/go-ipfs/issues/7528)). + - /api/v0/pin/ls ([#3874](https://github.com/ipfs/go-ipfs/issues/3874)). + + **Disabled by default** due to potential high CPU usage. Consider enabling only if necessary. + setup: + prerequisites: + list: [] + configuration: + file: + name: go.d/ipfs.conf + options: + description: | + The following options can be defined globally: update_every, autodetection_retry. + folding: + title: "Config options" + enabled: true + list: + - name: update_every + description: Data collection frequency. + default_value: 1 + required: false + - name: autodetection_retry + description: Recheck interval in seconds. Zero means no recheck will be scheduled. + default_value: 0 + required: false + - name: repoapi + description: Enables querying the [/api/v0/stats/repo](https://docs.ipfs.tech/reference/kubo/rpc/#api-v0-repo-stat) endpoint for repository statistics. + default_value: false + required: false + - name: pinapi + description: Enables querying the [/api/v0/pin/ls](https://docs.ipfs.tech/reference/kubo/rpc/#api-v0-pin-ls) endpoint to retrieve a list of all pinned objects. + default_value: false + required: false + - name: url + description: Server URL. + default_value: http://127.0.0.1:5001 + required: true + - name: timeout + description: HTTP request timeout. + default_value: 1 + required: false + - name: username + description: Username for basic HTTP authentication. + default_value: "" + required: false + - name: password + description: Password for basic HTTP authentication. + default_value: "" + required: false + - name: proxy_url + description: Proxy URL. + default_value: "" + required: false + - name: proxy_username + description: Username for proxy basic HTTP authentication. + default_value: "" + required: false + - name: proxy_password + description: Password for proxy basic HTTP authentication. + default_value: "" + required: false + - name: method + description: HTTP request method. + default_value: POST + required: false + - name: body + description: HTTP request body. + default_value: "" + required: false + - name: headers + description: HTTP request headers. + default_value: "" + required: false + - name: not_follow_redirects + description: Redirect handling policy. Controls whether the client follows redirects. + default_value: false + required: false + - name: tls_skip_verify + description: Server certificate chain and hostname validation policy. Controls whether the client performs this check. + default_value: false + required: false + - name: tls_ca + description: Certification authority that the client uses when verifying the server's certificates. + default_value: "" + required: false + - name: tls_cert + description: Client TLS certificate. + default_value: "" + required: false + - name: tls_key + description: Client TLS key. + default_value: "" + required: false + examples: + folding: + enabled: true + title: "Config" + list: + - name: Basic + description: A basic example configuration. + folding: + enabled: false + config: | + jobs: + - name: local + url: http://127.0.0.1:5001 + - name: Multi-instance + description: | + > **Note**: When you define multiple jobs, their names must be unique. + + Collecting metrics from local and remote instances. + config: | + jobs: + - name: local + url: http://127.0.0.1:5001 + + - name: remote + url: http://192.0.2.1:5001 + troubleshooting: + problems: + list: [] + alerts: + - name: ipfs_datastore_usage + link: https://github.com/netdata/netdata/blob/master/src/health/health.d/ipfs.conf + metric: ipfs.datastore_space_utilization + info: IPFS datastore utilization + metrics: + folding: + title: Metrics + enabled: false + description: "" + availability: [] + scopes: + - name: global + description: "These metrics refer to the entire monitored application." + labels: [] + metrics: + - name: ipfs.bandwidth + description: IPFS Bandwidth + unit: "bytes/s" + chart_type: area + dimensions: + - name: in + - name: out + - name: ipfs.peers + description: IPFS Peers + unit: "peers" + chart_type: line + dimensions: + - name: peers + - name: ipfs.datastore_space_utilization + description: IPFS Datastore Space Utilization + unit: "percent" + chart_type: area + dimensions: + - name: used + - name: ipfs.repo_size + description: IPFS Repo Size + unit: "bytes" + chart_type: line + dimensions: + - name: size + - name: ipfs.repo_objects + description: IPFS Repo Objects + unit: "objects" + chart_type: line + dimensions: + - name: objects + - name: ipfs.repo_pinned_objects + description: IPFS Repo Pinned Objects + unit: "objects" + chart_type: line + dimensions: + - name: pinned + - name: recursive_pins diff --git a/src/go/plugin/go.d/modules/ipfs/testdata/api_v0_pin_ls.json b/src/go/plugin/go.d/modules/ipfs/testdata/api_v0_pin_ls.json new file mode 100644 index 000000000..b1d4d0192 --- /dev/null +++ b/src/go/plugin/go.d/modules/ipfs/testdata/api_v0_pin_ls.json @@ -0,0 +1,8 @@ +{ + "Keys": { + "k1i2m3c4h5i6key": { + "Type": "recursive", + "Name": "" + } + } +} diff --git a/src/go/plugin/go.d/modules/ipfs/testdata/api_v0_stats_bw.json b/src/go/plugin/go.d/modules/ipfs/testdata/api_v0_stats_bw.json new file mode 100644 index 000000000..366cb8a2b --- /dev/null +++ b/src/go/plugin/go.d/modules/ipfs/testdata/api_v0_stats_bw.json @@ -0,0 +1,6 @@ +{ + "TotalIn": 20113594, + "TotalOut": 3113852, + "RateIn": 1623.2181369394084, + "RateOut": 0.13743234792898051 +} diff --git a/src/go/plugin/go.d/modules/ipfs/testdata/api_v0_stats_repo.json b/src/go/plugin/go.d/modules/ipfs/testdata/api_v0_stats_repo.json new file mode 100644 index 000000000..247fb29fa --- /dev/null +++ b/src/go/plugin/go.d/modules/ipfs/testdata/api_v0_stats_repo.json @@ -0,0 +1,7 @@ +{ + "RepoSize": 25495, + "StorageMax": 10000000000, + "NumObjects": 1, + "RepoPath": "/home/fotis/.ipfs", + "Version": "fs-repo@15" +} diff --git a/src/go/plugin/go.d/modules/ipfs/testdata/api_v0_swarm_peers.json b/src/go/plugin/go.d/modules/ipfs/testdata/api_v0_swarm_peers.json new file mode 100644 index 000000000..8f8386e53 --- /dev/null +++ b/src/go/plugin/go.d/modules/ipfs/testdata/api_v0_swarm_peers.json @@ -0,0 +1,70 @@ +{ + "Peers": [ + { + "Addr": "/ip4/1/tcp/27963", + "Peer": "a", + "Identify": { + "ID": "", + "PublicKey": "", + "Addresses": null, + "AgentVersion": "", + "Protocols": null + } + }, + { + "Addr": "/ip4/1/udp/4001/quic-v1", + "Peer": "b", + "Identify": { + "ID": "", + "PublicKey": "", + "Addresses": null, + "AgentVersion": "", + "Protocols": null + } + }, + { + "Addr": "/ip4/1/udp/4001/quic-v1/p2p/12D3KooWCqocoHdBANn2hH5acYAU4NdjEeBqERYk1MMTX49s1syY/p2p-circuit", + "Peer": "c", + "Identify": { + "ID": "", + "PublicKey": "", + "Addresses": null, + "AgentVersion": "", + "Protocols": null + } + }, + { + "Addr": "/ip4/1/tcp/4001", + "Peer": "c", + "Identify": { + "ID": "", + "PublicKey": "", + "Addresses": null, + "AgentVersion": "", + "Protocols": null + } + }, + { + "Addr": "/ip4/1/udp/33556/quic-v1", + "Peer": "e", + "Identify": { + "ID": "", + "PublicKey": "", + "Addresses": null, + "AgentVersion": "", + "Protocols": null + } + }, + { + "Addr": "/ip6/1::1/udp/4001/quic-v1", + "Peer": "f", + "Identify": { + "ID": "", + "PublicKey": "", + "Addresses": null, + "AgentVersion": "", + "Protocols": null + } + } + ] +} diff --git a/src/go/plugin/go.d/modules/ipfs/testdata/config.json b/src/go/plugin/go.d/modules/ipfs/testdata/config.json new file mode 100644 index 000000000..b99928ca6 --- /dev/null +++ b/src/go/plugin/go.d/modules/ipfs/testdata/config.json @@ -0,0 +1,22 @@ +{ + "update_every": 123, + "url": "ok", + "body": "ok", + "method": "ok", + "headers": { + "ok": "ok" + }, + "username": "ok", + "password": "ok", + "proxy_url": "ok", + "proxy_username": "ok", + "proxy_password": "ok", + "timeout": 123.123, + "not_follow_redirects": true, + "tls_ca": "ok", + "tls_cert": "ok", + "tls_key": "ok", + "tls_skip_verify": true, + "pinapi": false, + "repoapi": false +} diff --git a/src/go/plugin/go.d/modules/ipfs/testdata/config.yaml b/src/go/plugin/go.d/modules/ipfs/testdata/config.yaml new file mode 100644 index 000000000..271695e64 --- /dev/null +++ b/src/go/plugin/go.d/modules/ipfs/testdata/config.yaml @@ -0,0 +1,19 @@ +update_every: 123 +url: "ok" +body: "ok" +method: "ok" +headers: + ok: "ok" +username: "ok" +password: "ok" +proxy_url: "ok" +proxy_username: "ok" +proxy_password: "ok" +timeout: 123.123 +not_follow_redirects: yes +tls_ca: "ok" +tls_cert: "ok" +tls_key: "ok" +tls_skip_verify: yes +pinapi: no +repoapi: no diff --git a/src/go/collectors/go.d.plugin/modules/isc_dhcpd/README.md b/src/go/plugin/go.d/modules/isc_dhcpd/README.md index 3385a00a4..3385a00a4 120000 --- a/src/go/collectors/go.d.plugin/modules/isc_dhcpd/README.md +++ b/src/go/plugin/go.d/modules/isc_dhcpd/README.md diff --git a/src/go/collectors/go.d.plugin/modules/isc_dhcpd/charts.go b/src/go/plugin/go.d/modules/isc_dhcpd/charts.go index 7165bbffb..a8b3581ea 100644 --- a/src/go/collectors/go.d.plugin/modules/isc_dhcpd/charts.go +++ b/src/go/plugin/go.d/modules/isc_dhcpd/charts.go @@ -3,7 +3,7 @@ package isc_dhcpd import ( - "github.com/netdata/netdata/go/go.d.plugin/agent/module" + "github.com/netdata/netdata/go/plugins/plugin/go.d/agent/module" ) const ( diff --git a/src/go/collectors/go.d.plugin/modules/isc_dhcpd/collect.go b/src/go/plugin/go.d/modules/isc_dhcpd/collect.go index 08716a108..08716a108 100644 --- a/src/go/collectors/go.d.plugin/modules/isc_dhcpd/collect.go +++ b/src/go/plugin/go.d/modules/isc_dhcpd/collect.go diff --git a/src/go/collectors/go.d.plugin/modules/isc_dhcpd/config_schema.json b/src/go/plugin/go.d/modules/isc_dhcpd/config_schema.json index e357fd86d..a34e79c70 100644 --- a/src/go/collectors/go.d.plugin/modules/isc_dhcpd/config_schema.json +++ b/src/go/plugin/go.d/modules/isc_dhcpd/config_schema.json @@ -39,7 +39,7 @@ }, "networks": { "title": "Networks", - "description": "A space-separated list of [IP ranges](https://github.com/netdata/netdata/tree/master/src/go/collectors/go.d.plugin/pkg/iprange#supported-formats) for the pool.", + "description": "A space-separated list of [IP ranges](https://github.com/netdata/netdata/tree/master/src/go/plugin/go.d/pkg/iprange#supported-formats) for the pool.", "type": "string" } }, diff --git a/src/go/collectors/go.d.plugin/modules/isc_dhcpd/init.go b/src/go/plugin/go.d/modules/isc_dhcpd/init.go index 861ded398..d103a223c 100644 --- a/src/go/collectors/go.d.plugin/modules/isc_dhcpd/init.go +++ b/src/go/plugin/go.d/modules/isc_dhcpd/init.go @@ -7,8 +7,8 @@ import ( "fmt" "strings" - "github.com/netdata/netdata/go/go.d.plugin/agent/module" - "github.com/netdata/netdata/go/go.d.plugin/pkg/iprange" + "github.com/netdata/netdata/go/plugins/plugin/go.d/agent/module" + "github.com/netdata/netdata/go/plugins/plugin/go.d/pkg/iprange" ) type ipPool struct { diff --git a/src/go/collectors/go.d.plugin/modules/isc_dhcpd/integrations/isc_dhcp.md b/src/go/plugin/go.d/modules/isc_dhcpd/integrations/isc_dhcp.md index 29d657c8d..4607c1a5a 100644 --- a/src/go/collectors/go.d.plugin/modules/isc_dhcpd/integrations/isc_dhcp.md +++ b/src/go/plugin/go.d/modules/isc_dhcpd/integrations/isc_dhcp.md @@ -1,6 +1,6 @@ <!--startmeta -custom_edit_url: "https://github.com/netdata/netdata/edit/master/src/go/collectors/go.d.plugin/modules/isc_dhcpd/README.md" -meta_yaml: "https://github.com/netdata/netdata/edit/master/src/go/collectors/go.d.plugin/modules/isc_dhcpd/metadata.yaml" +custom_edit_url: "https://github.com/netdata/netdata/edit/master/src/go/plugin/go.d/modules/isc_dhcpd/README.md" +meta_yaml: "https://github.com/netdata/netdata/edit/master/src/go/plugin/go.d/modules/isc_dhcpd/metadata.yaml" sidebar_label: "ISC DHCP" learn_status: "Published" learn_rel_path: "Collecting Metrics/DNS and DHCP Servers" @@ -128,7 +128,7 @@ The following options can be defined globally: update_every, autodetection_retry List of IP pools to monitor. -- IP range syntax: see [supported formats](https://github.com/netdata/netdata/tree/master/src/go/collectors/go.d.plugin/pkg/iprange#supported-formats). +- IP range syntax: see [supported formats](https://github.com/netdata/netdata/tree/master/src/go/plugin/go.d/pkg/iprange#supported-formats). - Syntax: ```yaml @@ -168,6 +168,8 @@ jobs: ### Debug Mode +**Important**: Debug mode is not supported for data collection jobs created via the UI using the Dyncfg feature. + To troubleshoot issues with the `isc_dhcpd` collector, run the `go.d.plugin` with the debug option enabled. The output should give you clues as to why the collector isn't working. @@ -190,4 +192,37 @@ should give you clues as to why the collector isn't working. ./go.d.plugin -d -m isc_dhcpd ``` +### Getting Logs + +If you're encountering problems with the `isc_dhcpd` collector, follow these steps to retrieve logs and identify potential issues: + +- **Run the command** specific to your system (systemd, non-systemd, or Docker container). +- **Examine the output** for any warnings or error messages that might indicate issues. These messages should provide clues about the root cause of the problem. + +#### System with systemd + +Use the following command to view logs generated since the last Netdata service restart: + +```bash +journalctl _SYSTEMD_INVOCATION_ID="$(systemctl show --value --property=InvocationID netdata)" --namespace=netdata --grep isc_dhcpd +``` + +#### System without systemd + +Locate the collector log file, typically at `/var/log/netdata/collector.log`, and use `grep` to filter for collector's name: + +```bash +grep isc_dhcpd /var/log/netdata/collector.log +``` + +**Note**: This method shows logs from all restarts. Focus on the **latest entries** for troubleshooting current issues. + +#### Docker Container + +If your Netdata runs in a Docker container named "netdata" (replace if different), use this command: + +```bash +docker logs netdata 2>&1 | grep isc_dhcpd +``` + diff --git a/src/go/collectors/go.d.plugin/modules/isc_dhcpd/isc_dhcpd.go b/src/go/plugin/go.d/modules/isc_dhcpd/isc_dhcpd.go index c51abc75b..1733cb221 100644 --- a/src/go/collectors/go.d.plugin/modules/isc_dhcpd/isc_dhcpd.go +++ b/src/go/plugin/go.d/modules/isc_dhcpd/isc_dhcpd.go @@ -7,7 +7,7 @@ import ( "errors" "time" - "github.com/netdata/netdata/go/go.d.plugin/agent/module" + "github.com/netdata/netdata/go/plugins/plugin/go.d/agent/module" ) //go:embed "config_schema.json" diff --git a/src/go/collectors/go.d.plugin/modules/isc_dhcpd/isc_dhcpd_test.go b/src/go/plugin/go.d/modules/isc_dhcpd/isc_dhcpd_test.go index d91dfca15..24540ea2f 100644 --- a/src/go/collectors/go.d.plugin/modules/isc_dhcpd/isc_dhcpd_test.go +++ b/src/go/plugin/go.d/modules/isc_dhcpd/isc_dhcpd_test.go @@ -6,7 +6,7 @@ import ( "os" "testing" - "github.com/netdata/netdata/go/go.d.plugin/agent/module" + "github.com/netdata/netdata/go/plugins/plugin/go.d/agent/module" "github.com/stretchr/testify/assert" "github.com/stretchr/testify/require" diff --git a/src/go/collectors/go.d.plugin/modules/isc_dhcpd/metadata.yaml b/src/go/plugin/go.d/modules/isc_dhcpd/metadata.yaml index e6e11d72e..09eee81d0 100644 --- a/src/go/collectors/go.d.plugin/modules/isc_dhcpd/metadata.yaml +++ b/src/go/plugin/go.d/modules/isc_dhcpd/metadata.yaml @@ -69,7 +69,7 @@ modules: detailed_description: | List of IP pools to monitor. - - IP range syntax: see [supported formats](https://github.com/netdata/netdata/tree/master/src/go/collectors/go.d.plugin/pkg/iprange#supported-formats). + - IP range syntax: see [supported formats](https://github.com/netdata/netdata/tree/master/src/go/plugin/go.d/pkg/iprange#supported-formats). - Syntax: ```yaml diff --git a/src/go/collectors/go.d.plugin/modules/isc_dhcpd/parse.go b/src/go/plugin/go.d/modules/isc_dhcpd/parse.go index cb4161745..cb4161745 100644 --- a/src/go/collectors/go.d.plugin/modules/isc_dhcpd/parse.go +++ b/src/go/plugin/go.d/modules/isc_dhcpd/parse.go diff --git a/src/go/collectors/go.d.plugin/modules/isc_dhcpd/testdata/config.json b/src/go/plugin/go.d/modules/isc_dhcpd/testdata/config.json index 945f8865e..945f8865e 100644 --- a/src/go/collectors/go.d.plugin/modules/isc_dhcpd/testdata/config.json +++ b/src/go/plugin/go.d/modules/isc_dhcpd/testdata/config.json diff --git a/src/go/collectors/go.d.plugin/modules/isc_dhcpd/testdata/config.yaml b/src/go/plugin/go.d/modules/isc_dhcpd/testdata/config.yaml index a33defc55..a33defc55 100644 --- a/src/go/collectors/go.d.plugin/modules/isc_dhcpd/testdata/config.yaml +++ b/src/go/plugin/go.d/modules/isc_dhcpd/testdata/config.yaml diff --git a/src/go/collectors/go.d.plugin/modules/isc_dhcpd/testdata/dhcpd.leases_empty b/src/go/plugin/go.d/modules/isc_dhcpd/testdata/dhcpd.leases_empty index e69de29bb..e69de29bb 100644 --- a/src/go/collectors/go.d.plugin/modules/isc_dhcpd/testdata/dhcpd.leases_empty +++ b/src/go/plugin/go.d/modules/isc_dhcpd/testdata/dhcpd.leases_empty diff --git a/src/go/collectors/go.d.plugin/modules/isc_dhcpd/testdata/dhcpd.leases_ipv4 b/src/go/plugin/go.d/modules/isc_dhcpd/testdata/dhcpd.leases_ipv4 index 08e0e3f20..08e0e3f20 100644 --- a/src/go/collectors/go.d.plugin/modules/isc_dhcpd/testdata/dhcpd.leases_ipv4 +++ b/src/go/plugin/go.d/modules/isc_dhcpd/testdata/dhcpd.leases_ipv4 diff --git a/src/go/collectors/go.d.plugin/modules/isc_dhcpd/testdata/dhcpd.leases_ipv4_backup b/src/go/plugin/go.d/modules/isc_dhcpd/testdata/dhcpd.leases_ipv4_backup index e822ca846..e822ca846 100644 --- a/src/go/collectors/go.d.plugin/modules/isc_dhcpd/testdata/dhcpd.leases_ipv4_backup +++ b/src/go/plugin/go.d/modules/isc_dhcpd/testdata/dhcpd.leases_ipv4_backup diff --git a/src/go/collectors/go.d.plugin/modules/isc_dhcpd/testdata/dhcpd.leases_ipv4_inactive b/src/go/plugin/go.d/modules/isc_dhcpd/testdata/dhcpd.leases_ipv4_inactive index c5aed080f..c5aed080f 100644 --- a/src/go/collectors/go.d.plugin/modules/isc_dhcpd/testdata/dhcpd.leases_ipv4_inactive +++ b/src/go/plugin/go.d/modules/isc_dhcpd/testdata/dhcpd.leases_ipv4_inactive diff --git a/src/go/collectors/go.d.plugin/modules/isc_dhcpd/testdata/dhcpd.leases_ipv6 b/src/go/plugin/go.d/modules/isc_dhcpd/testdata/dhcpd.leases_ipv6 index 3a4f1520e..3a4f1520e 100644 --- a/src/go/collectors/go.d.plugin/modules/isc_dhcpd/testdata/dhcpd.leases_ipv6 +++ b/src/go/plugin/go.d/modules/isc_dhcpd/testdata/dhcpd.leases_ipv6 diff --git a/src/go/collectors/go.d.plugin/modules/k8s_kubelet/README.md b/src/go/plugin/go.d/modules/k8s_kubelet/README.md index 036630b3e..036630b3e 120000 --- a/src/go/collectors/go.d.plugin/modules/k8s_kubelet/README.md +++ b/src/go/plugin/go.d/modules/k8s_kubelet/README.md diff --git a/src/go/collectors/go.d.plugin/modules/k8s_kubelet/charts.go b/src/go/plugin/go.d/modules/k8s_kubelet/charts.go index 564f7be58..e2848ea3e 100644 --- a/src/go/collectors/go.d.plugin/modules/k8s_kubelet/charts.go +++ b/src/go/plugin/go.d/modules/k8s_kubelet/charts.go @@ -2,7 +2,7 @@ package k8s_kubelet -import "github.com/netdata/netdata/go/go.d.plugin/agent/module" +import "github.com/netdata/netdata/go/plugins/plugin/go.d/agent/module" type ( // Charts is an alias for module.Charts diff --git a/src/go/collectors/go.d.plugin/modules/k8s_kubelet/collect.go b/src/go/plugin/go.d/modules/k8s_kubelet/collect.go index 350c0bf45..f014617fc 100644 --- a/src/go/collectors/go.d.plugin/modules/k8s_kubelet/collect.go +++ b/src/go/plugin/go.d/modules/k8s_kubelet/collect.go @@ -5,11 +5,11 @@ package k8s_kubelet import ( "math" - mtx "github.com/netdata/netdata/go/go.d.plugin/pkg/metrics" - "github.com/netdata/netdata/go/go.d.plugin/pkg/prometheus" - "github.com/netdata/netdata/go/go.d.plugin/pkg/stm" + mtx "github.com/netdata/netdata/go/plugins/plugin/go.d/pkg/metrics" + "github.com/netdata/netdata/go/plugins/plugin/go.d/pkg/prometheus" + "github.com/netdata/netdata/go/plugins/plugin/go.d/pkg/stm" - "github.com/netdata/netdata/go/go.d.plugin/agent/module" + "github.com/netdata/netdata/go/plugins/plugin/go.d/agent/module" ) func (k *Kubelet) collect() (map[string]int64, error) { diff --git a/src/go/collectors/go.d.plugin/modules/k8s_kubelet/config_schema.json b/src/go/plugin/go.d/modules/k8s_kubelet/config_schema.json index ffc55b837..16f9029a6 100644 --- a/src/go/collectors/go.d.plugin/modules/k8s_kubelet/config_schema.json +++ b/src/go/plugin/go.d/modules/k8s_kubelet/config_schema.json @@ -167,6 +167,12 @@ "timeout": { "ui:help": "Accepts decimals for precise control (e.g., type 1.5 for 1.5 seconds)." }, + "username": { + "ui:widget": "password" + }, + "proxy_username": { + "ui:widget": "password" + }, "password": { "ui:widget": "password" }, diff --git a/src/go/collectors/go.d.plugin/modules/k8s_kubelet/init.go b/src/go/plugin/go.d/modules/k8s_kubelet/init.go index 3a076160b..803cd984c 100644 --- a/src/go/collectors/go.d.plugin/modules/k8s_kubelet/init.go +++ b/src/go/plugin/go.d/modules/k8s_kubelet/init.go @@ -6,8 +6,8 @@ import ( "errors" "os" - "github.com/netdata/netdata/go/go.d.plugin/pkg/prometheus" - "github.com/netdata/netdata/go/go.d.plugin/pkg/web" + "github.com/netdata/netdata/go/plugins/plugin/go.d/pkg/prometheus" + "github.com/netdata/netdata/go/plugins/plugin/go.d/pkg/web" ) func (k *Kubelet) validateConfig() error { diff --git a/src/go/collectors/go.d.plugin/modules/k8s_kubelet/integrations/kubelet.md b/src/go/plugin/go.d/modules/k8s_kubelet/integrations/kubelet.md index 3421b7a7a..d92f82be7 100644 --- a/src/go/collectors/go.d.plugin/modules/k8s_kubelet/integrations/kubelet.md +++ b/src/go/plugin/go.d/modules/k8s_kubelet/integrations/kubelet.md @@ -1,6 +1,6 @@ <!--startmeta -custom_edit_url: "https://github.com/netdata/netdata/edit/master/src/go/collectors/go.d.plugin/modules/k8s_kubelet/README.md" -meta_yaml: "https://github.com/netdata/netdata/edit/master/src/go/collectors/go.d.plugin/modules/k8s_kubelet/metadata.yaml" +custom_edit_url: "https://github.com/netdata/netdata/edit/master/src/go/plugin/go.d/modules/k8s_kubelet/README.md" +meta_yaml: "https://github.com/netdata/netdata/edit/master/src/go/plugin/go.d/modules/k8s_kubelet/metadata.yaml" sidebar_label: "Kubelet" learn_status: "Published" learn_rel_path: "Collecting Metrics/Kubernetes" @@ -194,6 +194,8 @@ jobs: ### Debug Mode +**Important**: Debug mode is not supported for data collection jobs created via the UI using the Dyncfg feature. + To troubleshoot issues with the `k8s_kubelet` collector, run the `go.d.plugin` with the debug option enabled. The output should give you clues as to why the collector isn't working. @@ -216,4 +218,37 @@ should give you clues as to why the collector isn't working. ./go.d.plugin -d -m k8s_kubelet ``` +### Getting Logs + +If you're encountering problems with the `k8s_kubelet` collector, follow these steps to retrieve logs and identify potential issues: + +- **Run the command** specific to your system (systemd, non-systemd, or Docker container). +- **Examine the output** for any warnings or error messages that might indicate issues. These messages should provide clues about the root cause of the problem. + +#### System with systemd + +Use the following command to view logs generated since the last Netdata service restart: + +```bash +journalctl _SYSTEMD_INVOCATION_ID="$(systemctl show --value --property=InvocationID netdata)" --namespace=netdata --grep k8s_kubelet +``` + +#### System without systemd + +Locate the collector log file, typically at `/var/log/netdata/collector.log`, and use `grep` to filter for collector's name: + +```bash +grep k8s_kubelet /var/log/netdata/collector.log +``` + +**Note**: This method shows logs from all restarts. Focus on the **latest entries** for troubleshooting current issues. + +#### Docker Container + +If your Netdata runs in a Docker container named "netdata" (replace if different), use this command: + +```bash +docker logs netdata 2>&1 | grep k8s_kubelet +``` + diff --git a/src/go/collectors/go.d.plugin/modules/k8s_kubelet/kubelet.go b/src/go/plugin/go.d/modules/k8s_kubelet/kubelet.go index 271950ad1..19fb9dd9e 100644 --- a/src/go/collectors/go.d.plugin/modules/k8s_kubelet/kubelet.go +++ b/src/go/plugin/go.d/modules/k8s_kubelet/kubelet.go @@ -7,9 +7,9 @@ import ( "errors" "time" - "github.com/netdata/netdata/go/go.d.plugin/agent/module" - "github.com/netdata/netdata/go/go.d.plugin/pkg/prometheus" - "github.com/netdata/netdata/go/go.d.plugin/pkg/web" + "github.com/netdata/netdata/go/plugins/plugin/go.d/agent/module" + "github.com/netdata/netdata/go/plugins/plugin/go.d/pkg/prometheus" + "github.com/netdata/netdata/go/plugins/plugin/go.d/pkg/web" ) //go:embed "config_schema.json" diff --git a/src/go/collectors/go.d.plugin/modules/k8s_kubelet/kubelet_test.go b/src/go/plugin/go.d/modules/k8s_kubelet/kubelet_test.go index d4f216908..d55ee31a3 100644 --- a/src/go/collectors/go.d.plugin/modules/k8s_kubelet/kubelet_test.go +++ b/src/go/plugin/go.d/modules/k8s_kubelet/kubelet_test.go @@ -8,7 +8,7 @@ import ( "os" "testing" - "github.com/netdata/netdata/go/go.d.plugin/agent/module" + "github.com/netdata/netdata/go/plugins/plugin/go.d/agent/module" "github.com/stretchr/testify/assert" "github.com/stretchr/testify/require" diff --git a/src/go/collectors/go.d.plugin/modules/k8s_kubelet/metadata.yaml b/src/go/plugin/go.d/modules/k8s_kubelet/metadata.yaml index 0d5229bb5..0d5229bb5 100644 --- a/src/go/collectors/go.d.plugin/modules/k8s_kubelet/metadata.yaml +++ b/src/go/plugin/go.d/modules/k8s_kubelet/metadata.yaml diff --git a/src/go/collectors/go.d.plugin/modules/k8s_kubelet/metrics.go b/src/go/plugin/go.d/modules/k8s_kubelet/metrics.go index 15867b975..f8a4c5c57 100644 --- a/src/go/collectors/go.d.plugin/modules/k8s_kubelet/metrics.go +++ b/src/go/plugin/go.d/modules/k8s_kubelet/metrics.go @@ -3,7 +3,7 @@ package k8s_kubelet import ( - mtx "github.com/netdata/netdata/go/go.d.plugin/pkg/metrics" + mtx "github.com/netdata/netdata/go/plugins/plugin/go.d/pkg/metrics" ) func newMetrics() *metrics { diff --git a/src/go/collectors/go.d.plugin/modules/k8s_kubelet/testdata/config.json b/src/go/plugin/go.d/modules/k8s_kubelet/testdata/config.json index d85483953..d85483953 100644 --- a/src/go/collectors/go.d.plugin/modules/k8s_kubelet/testdata/config.json +++ b/src/go/plugin/go.d/modules/k8s_kubelet/testdata/config.json diff --git a/src/go/collectors/go.d.plugin/modules/k8s_kubelet/testdata/config.yaml b/src/go/plugin/go.d/modules/k8s_kubelet/testdata/config.yaml index 9e4f3fdc4..9e4f3fdc4 100644 --- a/src/go/collectors/go.d.plugin/modules/k8s_kubelet/testdata/config.yaml +++ b/src/go/plugin/go.d/modules/k8s_kubelet/testdata/config.yaml diff --git a/src/go/collectors/go.d.plugin/modules/k8s_kubelet/testdata/metrics.txt b/src/go/plugin/go.d/modules/k8s_kubelet/testdata/metrics.txt index 47b63bd55..47b63bd55 100644 --- a/src/go/collectors/go.d.plugin/modules/k8s_kubelet/testdata/metrics.txt +++ b/src/go/plugin/go.d/modules/k8s_kubelet/testdata/metrics.txt diff --git a/src/go/collectors/go.d.plugin/modules/k8s_kubelet/testdata/token.txt b/src/go/plugin/go.d/modules/k8s_kubelet/testdata/token.txt index e769c538e..e769c538e 100644 --- a/src/go/collectors/go.d.plugin/modules/k8s_kubelet/testdata/token.txt +++ b/src/go/plugin/go.d/modules/k8s_kubelet/testdata/token.txt diff --git a/src/go/collectors/go.d.plugin/modules/k8s_kubeproxy/README.md b/src/go/plugin/go.d/modules/k8s_kubeproxy/README.md index 020405250..020405250 120000 --- a/src/go/collectors/go.d.plugin/modules/k8s_kubeproxy/README.md +++ b/src/go/plugin/go.d/modules/k8s_kubeproxy/README.md diff --git a/src/go/collectors/go.d.plugin/modules/k8s_kubeproxy/charts.go b/src/go/plugin/go.d/modules/k8s_kubeproxy/charts.go index b00097b3f..3eea903fc 100644 --- a/src/go/collectors/go.d.plugin/modules/k8s_kubeproxy/charts.go +++ b/src/go/plugin/go.d/modules/k8s_kubeproxy/charts.go @@ -2,7 +2,7 @@ package k8s_kubeproxy -import "github.com/netdata/netdata/go/go.d.plugin/agent/module" +import "github.com/netdata/netdata/go/plugins/plugin/go.d/agent/module" type ( // Charts is an alias for module.Charts diff --git a/src/go/collectors/go.d.plugin/modules/k8s_kubeproxy/collect.go b/src/go/plugin/go.d/modules/k8s_kubeproxy/collect.go index 625713f10..8664efaae 100644 --- a/src/go/collectors/go.d.plugin/modules/k8s_kubeproxy/collect.go +++ b/src/go/plugin/go.d/modules/k8s_kubeproxy/collect.go @@ -5,11 +5,11 @@ package k8s_kubeproxy import ( "math" - mtx "github.com/netdata/netdata/go/go.d.plugin/pkg/metrics" - "github.com/netdata/netdata/go/go.d.plugin/pkg/prometheus" - "github.com/netdata/netdata/go/go.d.plugin/pkg/stm" + mtx "github.com/netdata/netdata/go/plugins/plugin/go.d/pkg/metrics" + "github.com/netdata/netdata/go/plugins/plugin/go.d/pkg/prometheus" + "github.com/netdata/netdata/go/plugins/plugin/go.d/pkg/stm" - "github.com/netdata/netdata/go/go.d.plugin/agent/module" + "github.com/netdata/netdata/go/plugins/plugin/go.d/agent/module" ) func (kp *KubeProxy) collect() (map[string]int64, error) { diff --git a/src/go/collectors/go.d.plugin/modules/k8s_kubeproxy/config_schema.json b/src/go/plugin/go.d/modules/k8s_kubeproxy/config_schema.json index 9e68e80c4..f5d2d3424 100644 --- a/src/go/collectors/go.d.plugin/modules/k8s_kubeproxy/config_schema.json +++ b/src/go/plugin/go.d/modules/k8s_kubeproxy/config_schema.json @@ -167,6 +167,12 @@ "timeout": { "ui:help": "Accepts decimals for precise control (e.g., type 1.5 for 1.5 seconds)." }, + "username": { + "ui:widget": "password" + }, + "proxy_username": { + "ui:widget": "password" + }, "password": { "ui:widget": "password" }, diff --git a/src/go/collectors/go.d.plugin/modules/k8s_kubeproxy/init.go b/src/go/plugin/go.d/modules/k8s_kubeproxy/init.go index 29386210d..93e4427e3 100644 --- a/src/go/collectors/go.d.plugin/modules/k8s_kubeproxy/init.go +++ b/src/go/plugin/go.d/modules/k8s_kubeproxy/init.go @@ -5,8 +5,8 @@ package k8s_kubeproxy import ( "errors" - "github.com/netdata/netdata/go/go.d.plugin/pkg/prometheus" - "github.com/netdata/netdata/go/go.d.plugin/pkg/web" + "github.com/netdata/netdata/go/plugins/plugin/go.d/pkg/prometheus" + "github.com/netdata/netdata/go/plugins/plugin/go.d/pkg/web" ) func (kp *KubeProxy) validateConfig() error { diff --git a/src/go/collectors/go.d.plugin/modules/k8s_kubeproxy/integrations/kubeproxy.md b/src/go/plugin/go.d/modules/k8s_kubeproxy/integrations/kubeproxy.md index beea0c080..bfeb00b54 100644 --- a/src/go/collectors/go.d.plugin/modules/k8s_kubeproxy/integrations/kubeproxy.md +++ b/src/go/plugin/go.d/modules/k8s_kubeproxy/integrations/kubeproxy.md @@ -1,6 +1,6 @@ <!--startmeta -custom_edit_url: "https://github.com/netdata/netdata/edit/master/src/go/collectors/go.d.plugin/modules/k8s_kubeproxy/README.md" -meta_yaml: "https://github.com/netdata/netdata/edit/master/src/go/collectors/go.d.plugin/modules/k8s_kubeproxy/metadata.yaml" +custom_edit_url: "https://github.com/netdata/netdata/edit/master/src/go/plugin/go.d/modules/k8s_kubeproxy/README.md" +meta_yaml: "https://github.com/netdata/netdata/edit/master/src/go/plugin/go.d/modules/k8s_kubeproxy/metadata.yaml" sidebar_label: "Kubeproxy" learn_status: "Published" learn_rel_path: "Collecting Metrics/Kubernetes" @@ -161,6 +161,8 @@ jobs: ### Debug Mode +**Important**: Debug mode is not supported for data collection jobs created via the UI using the Dyncfg feature. + To troubleshoot issues with the `k8s_kubeproxy` collector, run the `go.d.plugin` with the debug option enabled. The output should give you clues as to why the collector isn't working. @@ -183,4 +185,37 @@ should give you clues as to why the collector isn't working. ./go.d.plugin -d -m k8s_kubeproxy ``` +### Getting Logs + +If you're encountering problems with the `k8s_kubeproxy` collector, follow these steps to retrieve logs and identify potential issues: + +- **Run the command** specific to your system (systemd, non-systemd, or Docker container). +- **Examine the output** for any warnings or error messages that might indicate issues. These messages should provide clues about the root cause of the problem. + +#### System with systemd + +Use the following command to view logs generated since the last Netdata service restart: + +```bash +journalctl _SYSTEMD_INVOCATION_ID="$(systemctl show --value --property=InvocationID netdata)" --namespace=netdata --grep k8s_kubeproxy +``` + +#### System without systemd + +Locate the collector log file, typically at `/var/log/netdata/collector.log`, and use `grep` to filter for collector's name: + +```bash +grep k8s_kubeproxy /var/log/netdata/collector.log +``` + +**Note**: This method shows logs from all restarts. Focus on the **latest entries** for troubleshooting current issues. + +#### Docker Container + +If your Netdata runs in a Docker container named "netdata" (replace if different), use this command: + +```bash +docker logs netdata 2>&1 | grep k8s_kubeproxy +``` + diff --git a/src/go/collectors/go.d.plugin/modules/k8s_kubeproxy/kubeproxy.go b/src/go/plugin/go.d/modules/k8s_kubeproxy/kubeproxy.go index 3af89c12f..3c9848431 100644 --- a/src/go/collectors/go.d.plugin/modules/k8s_kubeproxy/kubeproxy.go +++ b/src/go/plugin/go.d/modules/k8s_kubeproxy/kubeproxy.go @@ -7,9 +7,9 @@ import ( "errors" "time" - "github.com/netdata/netdata/go/go.d.plugin/agent/module" - "github.com/netdata/netdata/go/go.d.plugin/pkg/prometheus" - "github.com/netdata/netdata/go/go.d.plugin/pkg/web" + "github.com/netdata/netdata/go/plugins/plugin/go.d/agent/module" + "github.com/netdata/netdata/go/plugins/plugin/go.d/pkg/prometheus" + "github.com/netdata/netdata/go/plugins/plugin/go.d/pkg/web" ) //go:embed "config_schema.json" diff --git a/src/go/collectors/go.d.plugin/modules/k8s_kubeproxy/kubeproxy_test.go b/src/go/plugin/go.d/modules/k8s_kubeproxy/kubeproxy_test.go index 27a6c9174..206528a23 100644 --- a/src/go/collectors/go.d.plugin/modules/k8s_kubeproxy/kubeproxy_test.go +++ b/src/go/plugin/go.d/modules/k8s_kubeproxy/kubeproxy_test.go @@ -8,7 +8,7 @@ import ( "os" "testing" - "github.com/netdata/netdata/go/go.d.plugin/agent/module" + "github.com/netdata/netdata/go/plugins/plugin/go.d/agent/module" "github.com/stretchr/testify/assert" "github.com/stretchr/testify/require" diff --git a/src/go/collectors/go.d.plugin/modules/k8s_kubeproxy/metadata.yaml b/src/go/plugin/go.d/modules/k8s_kubeproxy/metadata.yaml index 0f8d0d72a..0f8d0d72a 100644 --- a/src/go/collectors/go.d.plugin/modules/k8s_kubeproxy/metadata.yaml +++ b/src/go/plugin/go.d/modules/k8s_kubeproxy/metadata.yaml diff --git a/src/go/collectors/go.d.plugin/modules/k8s_kubeproxy/metrics.go b/src/go/plugin/go.d/modules/k8s_kubeproxy/metrics.go index 1cc58f0df..f5c587a23 100644 --- a/src/go/collectors/go.d.plugin/modules/k8s_kubeproxy/metrics.go +++ b/src/go/plugin/go.d/modules/k8s_kubeproxy/metrics.go @@ -3,7 +3,7 @@ package k8s_kubeproxy import ( - mtx "github.com/netdata/netdata/go/go.d.plugin/pkg/metrics" + mtx "github.com/netdata/netdata/go/plugins/plugin/go.d/pkg/metrics" ) func newMetrics() *metrics { diff --git a/src/go/collectors/go.d.plugin/modules/lighttpd/testdata/config.json b/src/go/plugin/go.d/modules/k8s_kubeproxy/testdata/config.json index 984c3ed6e..984c3ed6e 100644 --- a/src/go/collectors/go.d.plugin/modules/lighttpd/testdata/config.json +++ b/src/go/plugin/go.d/modules/k8s_kubeproxy/testdata/config.json diff --git a/src/go/collectors/go.d.plugin/modules/lighttpd/testdata/config.yaml b/src/go/plugin/go.d/modules/k8s_kubeproxy/testdata/config.yaml index 8558b61cc..8558b61cc 100644 --- a/src/go/collectors/go.d.plugin/modules/lighttpd/testdata/config.yaml +++ b/src/go/plugin/go.d/modules/k8s_kubeproxy/testdata/config.yaml diff --git a/src/go/collectors/go.d.plugin/modules/k8s_kubeproxy/testdata/metrics.txt b/src/go/plugin/go.d/modules/k8s_kubeproxy/testdata/metrics.txt index 7a10d8477..7a10d8477 100644 --- a/src/go/collectors/go.d.plugin/modules/k8s_kubeproxy/testdata/metrics.txt +++ b/src/go/plugin/go.d/modules/k8s_kubeproxy/testdata/metrics.txt diff --git a/src/go/collectors/go.d.plugin/modules/k8s_state/README.md b/src/go/plugin/go.d/modules/k8s_state/README.md index 72c4e5cab..72c4e5cab 120000 --- a/src/go/collectors/go.d.plugin/modules/k8s_state/README.md +++ b/src/go/plugin/go.d/modules/k8s_state/README.md diff --git a/src/go/collectors/go.d.plugin/modules/k8s_state/charts.go b/src/go/plugin/go.d/modules/k8s_state/charts.go index 0cec12512..471d12577 100644 --- a/src/go/collectors/go.d.plugin/modules/k8s_state/charts.go +++ b/src/go/plugin/go.d/modules/k8s_state/charts.go @@ -7,7 +7,7 @@ import ( "regexp" "strings" - "github.com/netdata/netdata/go/go.d.plugin/agent/module" + "github.com/netdata/netdata/go/plugins/plugin/go.d/agent/module" ) // NETDATA_CHART_PRIO_CGROUPS_CONTAINERS 40000 diff --git a/src/go/collectors/go.d.plugin/modules/k8s_state/client.go b/src/go/plugin/go.d/modules/k8s_state/client.go index 315e823fe..315e823fe 100644 --- a/src/go/collectors/go.d.plugin/modules/k8s_state/client.go +++ b/src/go/plugin/go.d/modules/k8s_state/client.go diff --git a/src/go/collectors/go.d.plugin/modules/k8s_state/cluster_meta.go b/src/go/plugin/go.d/modules/k8s_state/cluster_meta.go index e7eb809cc..e7eb809cc 100644 --- a/src/go/collectors/go.d.plugin/modules/k8s_state/cluster_meta.go +++ b/src/go/plugin/go.d/modules/k8s_state/cluster_meta.go diff --git a/src/go/collectors/go.d.plugin/modules/k8s_state/collect.go b/src/go/plugin/go.d/modules/k8s_state/collect.go index 033d330ce..081a0fdf1 100644 --- a/src/go/collectors/go.d.plugin/modules/k8s_state/collect.go +++ b/src/go/plugin/go.d/modules/k8s_state/collect.go @@ -8,7 +8,7 @@ import ( "strings" "time" - "github.com/netdata/netdata/go/go.d.plugin/agent/module" + "github.com/netdata/netdata/go/plugins/plugin/go.d/agent/module" corev1 "k8s.io/api/core/v1" ) @@ -68,6 +68,13 @@ func (ks *KubeState) collectKubeState(mx map[string]int64) { func (ks *KubeState) collectPodsState(mx map[string]int64) { now := time.Now() for _, ps := range ks.state.pods { + // Skip cronjobs (each of them is a unique container because name contains hash) + // to avoid overwhelming Netdata with high cardinality metrics. + // Related issue https://github.com/netdata/netdata/issues/16412 + if ps.controllerKind == "Job" { + continue + } + if ps.deleted { delete(ks.state.pods, podSource(ps.namespace, ps.name)) ks.removePodCharts(ps) diff --git a/src/go/collectors/go.d.plugin/modules/k8s_state/config_schema.json b/src/go/plugin/go.d/modules/k8s_state/config_schema.json index ae66d7cb5..ae66d7cb5 100644 --- a/src/go/collectors/go.d.plugin/modules/k8s_state/config_schema.json +++ b/src/go/plugin/go.d/modules/k8s_state/config_schema.json diff --git a/src/go/collectors/go.d.plugin/modules/k8s_state/discover_kubernetes.go b/src/go/plugin/go.d/modules/k8s_state/discover_kubernetes.go index a4aeee974..5d435871a 100644 --- a/src/go/collectors/go.d.plugin/modules/k8s_state/discover_kubernetes.go +++ b/src/go/plugin/go.d/modules/k8s_state/discover_kubernetes.go @@ -8,7 +8,7 @@ import ( "sync" "time" - "github.com/netdata/netdata/go/go.d.plugin/logger" + "github.com/netdata/netdata/go/plugins/logger" corev1 "k8s.io/api/core/v1" metav1 "k8s.io/apimachinery/pkg/apis/meta/v1" diff --git a/src/go/collectors/go.d.plugin/modules/k8s_state/discover_node.go b/src/go/plugin/go.d/modules/k8s_state/discover_node.go index 29761b204..1d91436c8 100644 --- a/src/go/collectors/go.d.plugin/modules/k8s_state/discover_node.go +++ b/src/go/plugin/go.d/modules/k8s_state/discover_node.go @@ -5,7 +5,7 @@ package k8s_state import ( "context" - "github.com/netdata/netdata/go/go.d.plugin/logger" + "github.com/netdata/netdata/go/plugins/logger" "k8s.io/client-go/tools/cache" "k8s.io/client-go/util/workqueue" diff --git a/src/go/collectors/go.d.plugin/modules/k8s_state/discover_pod.go b/src/go/plugin/go.d/modules/k8s_state/discover_pod.go index 2def7ad50..53e9ceb92 100644 --- a/src/go/collectors/go.d.plugin/modules/k8s_state/discover_pod.go +++ b/src/go/plugin/go.d/modules/k8s_state/discover_pod.go @@ -5,7 +5,7 @@ package k8s_state import ( "context" - "github.com/netdata/netdata/go/go.d.plugin/logger" + "github.com/netdata/netdata/go/plugins/logger" "k8s.io/client-go/tools/cache" "k8s.io/client-go/util/workqueue" diff --git a/src/go/collectors/go.d.plugin/modules/k8s_state/init.go b/src/go/plugin/go.d/modules/k8s_state/init.go index 998131394..998131394 100644 --- a/src/go/collectors/go.d.plugin/modules/k8s_state/init.go +++ b/src/go/plugin/go.d/modules/k8s_state/init.go diff --git a/src/go/collectors/go.d.plugin/modules/k8s_state/integrations/kubernetes_cluster_state.md b/src/go/plugin/go.d/modules/k8s_state/integrations/kubernetes_cluster_state.md index 88d81e257..5f5e36f87 100644 --- a/src/go/collectors/go.d.plugin/modules/k8s_state/integrations/kubernetes_cluster_state.md +++ b/src/go/plugin/go.d/modules/k8s_state/integrations/kubernetes_cluster_state.md @@ -1,6 +1,6 @@ <!--startmeta -custom_edit_url: "https://github.com/netdata/netdata/edit/master/src/go/collectors/go.d.plugin/modules/k8s_state/README.md" -meta_yaml: "https://github.com/netdata/netdata/edit/master/src/go/collectors/go.d.plugin/modules/k8s_state/metadata.yaml" +custom_edit_url: "https://github.com/netdata/netdata/edit/master/src/go/plugin/go.d/modules/k8s_state/README.md" +meta_yaml: "https://github.com/netdata/netdata/edit/master/src/go/plugin/go.d/modules/k8s_state/metadata.yaml" sidebar_label: "Kubernetes Cluster State" learn_status: "Published" learn_rel_path: "Collecting Metrics/Kubernetes" @@ -193,6 +193,8 @@ There are no configuration examples. ### Debug Mode +**Important**: Debug mode is not supported for data collection jobs created via the UI using the Dyncfg feature. + To troubleshoot issues with the `k8s_state` collector, run the `go.d.plugin` with the debug option enabled. The output should give you clues as to why the collector isn't working. @@ -215,4 +217,37 @@ should give you clues as to why the collector isn't working. ./go.d.plugin -d -m k8s_state ``` +### Getting Logs + +If you're encountering problems with the `k8s_state` collector, follow these steps to retrieve logs and identify potential issues: + +- **Run the command** specific to your system (systemd, non-systemd, or Docker container). +- **Examine the output** for any warnings or error messages that might indicate issues. These messages should provide clues about the root cause of the problem. + +#### System with systemd + +Use the following command to view logs generated since the last Netdata service restart: + +```bash +journalctl _SYSTEMD_INVOCATION_ID="$(systemctl show --value --property=InvocationID netdata)" --namespace=netdata --grep k8s_state +``` + +#### System without systemd + +Locate the collector log file, typically at `/var/log/netdata/collector.log`, and use `grep` to filter for collector's name: + +```bash +grep k8s_state /var/log/netdata/collector.log +``` + +**Note**: This method shows logs from all restarts. Focus on the **latest entries** for troubleshooting current issues. + +#### Docker Container + +If your Netdata runs in a Docker container named "netdata" (replace if different), use this command: + +```bash +docker logs netdata 2>&1 | grep k8s_state +``` + diff --git a/src/go/collectors/go.d.plugin/modules/k8s_state/kube_state.go b/src/go/plugin/go.d/modules/k8s_state/kube_state.go index 95fd2d1ca..26962928e 100644 --- a/src/go/collectors/go.d.plugin/modules/k8s_state/kube_state.go +++ b/src/go/plugin/go.d/modules/k8s_state/kube_state.go @@ -10,7 +10,7 @@ import ( "sync" "time" - "github.com/netdata/netdata/go/go.d.plugin/agent/module" + "github.com/netdata/netdata/go/plugins/plugin/go.d/agent/module" "k8s.io/client-go/kubernetes" ) diff --git a/src/go/collectors/go.d.plugin/modules/k8s_state/kube_state_test.go b/src/go/plugin/go.d/modules/k8s_state/kube_state_test.go index 99560d6dc..cf52c08b6 100644 --- a/src/go/collectors/go.d.plugin/modules/k8s_state/kube_state_test.go +++ b/src/go/plugin/go.d/modules/k8s_state/kube_state_test.go @@ -11,7 +11,7 @@ import ( "testing" "time" - "github.com/netdata/netdata/go/go.d.plugin/agent/module" + "github.com/netdata/netdata/go/plugins/plugin/go.d/agent/module" "github.com/stretchr/testify/assert" "github.com/stretchr/testify/require" diff --git a/src/go/collectors/go.d.plugin/modules/k8s_state/metadata.yaml b/src/go/plugin/go.d/modules/k8s_state/metadata.yaml index 7617b297f..7617b297f 100644 --- a/src/go/collectors/go.d.plugin/modules/k8s_state/metadata.yaml +++ b/src/go/plugin/go.d/modules/k8s_state/metadata.yaml diff --git a/src/go/collectors/go.d.plugin/modules/k8s_state/resource.go b/src/go/plugin/go.d/modules/k8s_state/resource.go index cabd41a67..cabd41a67 100644 --- a/src/go/collectors/go.d.plugin/modules/k8s_state/resource.go +++ b/src/go/plugin/go.d/modules/k8s_state/resource.go diff --git a/src/go/collectors/go.d.plugin/modules/k8s_state/state.go b/src/go/plugin/go.d/modules/k8s_state/state.go index 72bac88ee..72bac88ee 100644 --- a/src/go/collectors/go.d.plugin/modules/k8s_state/state.go +++ b/src/go/plugin/go.d/modules/k8s_state/state.go diff --git a/src/go/collectors/go.d.plugin/modules/k8s_state/testdata/config.json b/src/go/plugin/go.d/modules/k8s_state/testdata/config.json index 0e3f7c403..0e3f7c403 100644 --- a/src/go/collectors/go.d.plugin/modules/k8s_state/testdata/config.json +++ b/src/go/plugin/go.d/modules/k8s_state/testdata/config.json diff --git a/src/go/collectors/go.d.plugin/modules/k8s_state/testdata/config.yaml b/src/go/plugin/go.d/modules/k8s_state/testdata/config.yaml index f21a3a7a0..f21a3a7a0 100644 --- a/src/go/collectors/go.d.plugin/modules/k8s_state/testdata/config.yaml +++ b/src/go/plugin/go.d/modules/k8s_state/testdata/config.yaml diff --git a/src/go/collectors/go.d.plugin/modules/k8s_state/update_node_state.go b/src/go/plugin/go.d/modules/k8s_state/update_node_state.go index 80f5c26c8..80f5c26c8 100644 --- a/src/go/collectors/go.d.plugin/modules/k8s_state/update_node_state.go +++ b/src/go/plugin/go.d/modules/k8s_state/update_node_state.go diff --git a/src/go/collectors/go.d.plugin/modules/k8s_state/update_pod_state.go b/src/go/plugin/go.d/modules/k8s_state/update_pod_state.go index 22ef0f7fc..16b0f433b 100644 --- a/src/go/collectors/go.d.plugin/modules/k8s_state/update_pod_state.go +++ b/src/go/plugin/go.d/modules/k8s_state/update_pod_state.go @@ -149,13 +149,6 @@ func (ks *KubeState) updatePodState(r resource) { } } -func max(a, b int64) int64 { - if a < b { - return b - } - return a -} - func extractContainerID(id string) string { // docker://d98... if i := strings.LastIndexByte(id, '/'); i != -1 { diff --git a/src/go/collectors/go.d.plugin/modules/k8s_state/update_state.go b/src/go/plugin/go.d/modules/k8s_state/update_state.go index 88f3272c1..88f3272c1 100644 --- a/src/go/collectors/go.d.plugin/modules/k8s_state/update_state.go +++ b/src/go/plugin/go.d/modules/k8s_state/update_state.go diff --git a/src/go/collectors/go.d.plugin/modules/lighttpd/README.md b/src/go/plugin/go.d/modules/lighttpd/README.md index b0d3613bf..b0d3613bf 120000 --- a/src/go/collectors/go.d.plugin/modules/lighttpd/README.md +++ b/src/go/plugin/go.d/modules/lighttpd/README.md diff --git a/src/go/collectors/go.d.plugin/modules/lighttpd/apiclient.go b/src/go/plugin/go.d/modules/lighttpd/apiclient.go index 2d4bf0fc7..1686272cd 100644 --- a/src/go/collectors/go.d.plugin/modules/lighttpd/apiclient.go +++ b/src/go/plugin/go.d/modules/lighttpd/apiclient.go @@ -10,7 +10,7 @@ import ( "strconv" "strings" - "github.com/netdata/netdata/go/go.d.plugin/pkg/web" + "github.com/netdata/netdata/go/plugins/plugin/go.d/pkg/web" ) const ( diff --git a/src/go/collectors/go.d.plugin/modules/lighttpd/charts.go b/src/go/plugin/go.d/modules/lighttpd/charts.go index 293e57414..4780384c8 100644 --- a/src/go/collectors/go.d.plugin/modules/lighttpd/charts.go +++ b/src/go/plugin/go.d/modules/lighttpd/charts.go @@ -2,7 +2,7 @@ package lighttpd -import "github.com/netdata/netdata/go/go.d.plugin/agent/module" +import "github.com/netdata/netdata/go/plugins/plugin/go.d/agent/module" type ( // Charts is an alias for module.Charts diff --git a/src/go/collectors/go.d.plugin/modules/lighttpd/collect.go b/src/go/plugin/go.d/modules/lighttpd/collect.go index d6a0f1b85..84c88af45 100644 --- a/src/go/collectors/go.d.plugin/modules/lighttpd/collect.go +++ b/src/go/plugin/go.d/modules/lighttpd/collect.go @@ -5,7 +5,7 @@ package lighttpd import ( "fmt" - "github.com/netdata/netdata/go/go.d.plugin/pkg/stm" + "github.com/netdata/netdata/go/plugins/plugin/go.d/pkg/stm" ) func (l *Lighttpd) collect() (map[string]int64, error) { diff --git a/src/go/collectors/go.d.plugin/modules/lighttpd/config_schema.json b/src/go/plugin/go.d/modules/lighttpd/config_schema.json index f4f26162e..32700b3b2 100644 --- a/src/go/collectors/go.d.plugin/modules/lighttpd/config_schema.json +++ b/src/go/plugin/go.d/modules/lighttpd/config_schema.json @@ -167,6 +167,12 @@ "timeout": { "ui:help": "Accepts decimals for precise control (e.g., type 1.5 for 1.5 seconds)." }, + "username": { + "ui:widget": "password" + }, + "proxy_username": { + "ui:widget": "password" + }, "password": { "ui:widget": "password" }, diff --git a/src/go/collectors/go.d.plugin/modules/lighttpd/init.go b/src/go/plugin/go.d/modules/lighttpd/init.go index c0dae5e7b..0923262c3 100644 --- a/src/go/collectors/go.d.plugin/modules/lighttpd/init.go +++ b/src/go/plugin/go.d/modules/lighttpd/init.go @@ -7,7 +7,7 @@ import ( "fmt" "strings" - "github.com/netdata/netdata/go/go.d.plugin/pkg/web" + "github.com/netdata/netdata/go/plugins/plugin/go.d/pkg/web" ) func (l *Lighttpd) validateConfig() error { diff --git a/src/go/collectors/go.d.plugin/modules/lighttpd/integrations/lighttpd.md b/src/go/plugin/go.d/modules/lighttpd/integrations/lighttpd.md index 8737694ab..bcf434fc5 100644 --- a/src/go/collectors/go.d.plugin/modules/lighttpd/integrations/lighttpd.md +++ b/src/go/plugin/go.d/modules/lighttpd/integrations/lighttpd.md @@ -1,6 +1,6 @@ <!--startmeta -custom_edit_url: "https://github.com/netdata/netdata/edit/master/src/go/collectors/go.d.plugin/modules/lighttpd/README.md" -meta_yaml: "https://github.com/netdata/netdata/edit/master/src/go/collectors/go.d.plugin/modules/lighttpd/metadata.yaml" +custom_edit_url: "https://github.com/netdata/netdata/edit/master/src/go/plugin/go.d/modules/lighttpd/README.md" +meta_yaml: "https://github.com/netdata/netdata/edit/master/src/go/plugin/go.d/modules/lighttpd/metadata.yaml" sidebar_label: "Lighttpd" learn_status: "Published" learn_rel_path: "Collecting Metrics/Web Servers and Web Proxies" @@ -206,6 +206,8 @@ jobs: ### Debug Mode +**Important**: Debug mode is not supported for data collection jobs created via the UI using the Dyncfg feature. + To troubleshoot issues with the `lighttpd` collector, run the `go.d.plugin` with the debug option enabled. The output should give you clues as to why the collector isn't working. @@ -228,4 +230,37 @@ should give you clues as to why the collector isn't working. ./go.d.plugin -d -m lighttpd ``` +### Getting Logs + +If you're encountering problems with the `lighttpd` collector, follow these steps to retrieve logs and identify potential issues: + +- **Run the command** specific to your system (systemd, non-systemd, or Docker container). +- **Examine the output** for any warnings or error messages that might indicate issues. These messages should provide clues about the root cause of the problem. + +#### System with systemd + +Use the following command to view logs generated since the last Netdata service restart: + +```bash +journalctl _SYSTEMD_INVOCATION_ID="$(systemctl show --value --property=InvocationID netdata)" --namespace=netdata --grep lighttpd +``` + +#### System without systemd + +Locate the collector log file, typically at `/var/log/netdata/collector.log`, and use `grep` to filter for collector's name: + +```bash +grep lighttpd /var/log/netdata/collector.log +``` + +**Note**: This method shows logs from all restarts. Focus on the **latest entries** for troubleshooting current issues. + +#### Docker Container + +If your Netdata runs in a Docker container named "netdata" (replace if different), use this command: + +```bash +docker logs netdata 2>&1 | grep lighttpd +``` + diff --git a/src/go/collectors/go.d.plugin/modules/lighttpd/lighttpd.go b/src/go/plugin/go.d/modules/lighttpd/lighttpd.go index 373cc4064..1b17833e9 100644 --- a/src/go/collectors/go.d.plugin/modules/lighttpd/lighttpd.go +++ b/src/go/plugin/go.d/modules/lighttpd/lighttpd.go @@ -7,8 +7,8 @@ import ( "errors" "time" - "github.com/netdata/netdata/go/go.d.plugin/agent/module" - "github.com/netdata/netdata/go/go.d.plugin/pkg/web" + "github.com/netdata/netdata/go/plugins/plugin/go.d/agent/module" + "github.com/netdata/netdata/go/plugins/plugin/go.d/pkg/web" ) //go:embed "config_schema.json" diff --git a/src/go/collectors/go.d.plugin/modules/lighttpd/lighttpd_test.go b/src/go/plugin/go.d/modules/lighttpd/lighttpd_test.go index 8a015c85b..05c7504ee 100644 --- a/src/go/collectors/go.d.plugin/modules/lighttpd/lighttpd_test.go +++ b/src/go/plugin/go.d/modules/lighttpd/lighttpd_test.go @@ -8,7 +8,7 @@ import ( "os" "testing" - "github.com/netdata/netdata/go/go.d.plugin/agent/module" + "github.com/netdata/netdata/go/plugins/plugin/go.d/agent/module" "github.com/stretchr/testify/assert" "github.com/stretchr/testify/require" diff --git a/src/go/collectors/go.d.plugin/modules/lighttpd/metadata.yaml b/src/go/plugin/go.d/modules/lighttpd/metadata.yaml index a90ac05ed..a90ac05ed 100644 --- a/src/go/collectors/go.d.plugin/modules/lighttpd/metadata.yaml +++ b/src/go/plugin/go.d/modules/lighttpd/metadata.yaml diff --git a/src/go/collectors/go.d.plugin/modules/lighttpd/metrics.go b/src/go/plugin/go.d/modules/lighttpd/metrics.go index 6c39d2d06..6c39d2d06 100644 --- a/src/go/collectors/go.d.plugin/modules/lighttpd/metrics.go +++ b/src/go/plugin/go.d/modules/lighttpd/metrics.go diff --git a/src/go/collectors/go.d.plugin/modules/lighttpd/testdata/apache-status.txt b/src/go/plugin/go.d/modules/lighttpd/testdata/apache-status.txt index 136b69363..136b69363 100644 --- a/src/go/collectors/go.d.plugin/modules/lighttpd/testdata/apache-status.txt +++ b/src/go/plugin/go.d/modules/lighttpd/testdata/apache-status.txt diff --git a/src/go/collectors/go.d.plugin/modules/logstash/testdata/config.json b/src/go/plugin/go.d/modules/lighttpd/testdata/config.json index 984c3ed6e..984c3ed6e 100644 --- a/src/go/collectors/go.d.plugin/modules/logstash/testdata/config.json +++ b/src/go/plugin/go.d/modules/lighttpd/testdata/config.json diff --git a/src/go/collectors/go.d.plugin/modules/logstash/testdata/config.yaml b/src/go/plugin/go.d/modules/lighttpd/testdata/config.yaml index 8558b61cc..8558b61cc 100644 --- a/src/go/collectors/go.d.plugin/modules/logstash/testdata/config.yaml +++ b/src/go/plugin/go.d/modules/lighttpd/testdata/config.yaml diff --git a/src/go/collectors/go.d.plugin/modules/lighttpd/testdata/status.txt b/src/go/plugin/go.d/modules/lighttpd/testdata/status.txt index 07d8e06e8..07d8e06e8 100644 --- a/src/go/collectors/go.d.plugin/modules/lighttpd/testdata/status.txt +++ b/src/go/plugin/go.d/modules/lighttpd/testdata/status.txt diff --git a/src/go/collectors/go.d.plugin/modules/litespeed/README.md b/src/go/plugin/go.d/modules/litespeed/README.md index e7418b3dc..e7418b3dc 120000 --- a/src/go/collectors/go.d.plugin/modules/litespeed/README.md +++ b/src/go/plugin/go.d/modules/litespeed/README.md diff --git a/src/go/collectors/go.d.plugin/modules/litespeed/charts.go b/src/go/plugin/go.d/modules/litespeed/charts.go index 0bb25f23c..b7309f287 100644 --- a/src/go/collectors/go.d.plugin/modules/litespeed/charts.go +++ b/src/go/plugin/go.d/modules/litespeed/charts.go @@ -2,7 +2,7 @@ package litespeed -import "github.com/netdata/netdata/go/go.d.plugin/agent/module" +import "github.com/netdata/netdata/go/plugins/plugin/go.d/agent/module" const ( prioRequests = module.Priority + iota diff --git a/src/go/collectors/go.d.plugin/modules/litespeed/collect.go b/src/go/plugin/go.d/modules/litespeed/collect.go index a68cf119c..a68cf119c 100644 --- a/src/go/collectors/go.d.plugin/modules/litespeed/collect.go +++ b/src/go/plugin/go.d/modules/litespeed/collect.go diff --git a/src/go/collectors/go.d.plugin/modules/litespeed/config_schema.json b/src/go/plugin/go.d/modules/litespeed/config_schema.json index 2ec13468f..2ec13468f 100644 --- a/src/go/collectors/go.d.plugin/modules/litespeed/config_schema.json +++ b/src/go/plugin/go.d/modules/litespeed/config_schema.json diff --git a/src/go/collectors/go.d.plugin/modules/litespeed/integrations/litespeed.md b/src/go/plugin/go.d/modules/litespeed/integrations/litespeed.md index 5b7d3eb6d..96858fdab 100644 --- a/src/go/collectors/go.d.plugin/modules/litespeed/integrations/litespeed.md +++ b/src/go/plugin/go.d/modules/litespeed/integrations/litespeed.md @@ -1,6 +1,6 @@ <!--startmeta -custom_edit_url: "https://github.com/netdata/netdata/edit/master/src/go/collectors/go.d.plugin/modules/litespeed/README.md" -meta_yaml: "https://github.com/netdata/netdata/edit/master/src/go/collectors/go.d.plugin/modules/litespeed/metadata.yaml" +custom_edit_url: "https://github.com/netdata/netdata/edit/master/src/go/plugin/go.d/modules/litespeed/README.md" +meta_yaml: "https://github.com/netdata/netdata/edit/master/src/go/plugin/go.d/modules/litespeed/metadata.yaml" sidebar_label: "Litespeed" learn_status: "Published" learn_rel_path: "Collecting Metrics/Web Servers and Web Proxies" @@ -133,6 +133,8 @@ local: ### Debug Mode +**Important**: Debug mode is not supported for data collection jobs created via the UI using the Dyncfg feature. + To troubleshoot issues with the `litespeed` collector, run the `go.d.plugin` with the debug option enabled. The output should give you clues as to why the collector isn't working. @@ -155,4 +157,37 @@ should give you clues as to why the collector isn't working. ./go.d.plugin -d -m litespeed ``` +### Getting Logs + +If you're encountering problems with the `litespeed` collector, follow these steps to retrieve logs and identify potential issues: + +- **Run the command** specific to your system (systemd, non-systemd, or Docker container). +- **Examine the output** for any warnings or error messages that might indicate issues. These messages should provide clues about the root cause of the problem. + +#### System with systemd + +Use the following command to view logs generated since the last Netdata service restart: + +```bash +journalctl _SYSTEMD_INVOCATION_ID="$(systemctl show --value --property=InvocationID netdata)" --namespace=netdata --grep litespeed +``` + +#### System without systemd + +Locate the collector log file, typically at `/var/log/netdata/collector.log`, and use `grep` to filter for collector's name: + +```bash +grep litespeed /var/log/netdata/collector.log +``` + +**Note**: This method shows logs from all restarts. Focus on the **latest entries** for troubleshooting current issues. + +#### Docker Container + +If your Netdata runs in a Docker container named "netdata" (replace if different), use this command: + +```bash +docker logs netdata 2>&1 | grep litespeed +``` + diff --git a/src/go/collectors/go.d.plugin/modules/litespeed/litespeed.go b/src/go/plugin/go.d/modules/litespeed/litespeed.go index 3e278a372..f57c0eed5 100644 --- a/src/go/collectors/go.d.plugin/modules/litespeed/litespeed.go +++ b/src/go/plugin/go.d/modules/litespeed/litespeed.go @@ -6,7 +6,7 @@ import ( _ "embed" "errors" - "github.com/netdata/netdata/go/go.d.plugin/agent/module" + "github.com/netdata/netdata/go/plugins/plugin/go.d/agent/module" ) //go:embed "config_schema.json" diff --git a/src/go/collectors/go.d.plugin/modules/litespeed/litespeed_test.go b/src/go/plugin/go.d/modules/litespeed/litespeed_test.go index 86c89d823..576609dca 100644 --- a/src/go/collectors/go.d.plugin/modules/litespeed/litespeed_test.go +++ b/src/go/plugin/go.d/modules/litespeed/litespeed_test.go @@ -6,7 +6,7 @@ import ( "os" "testing" - "github.com/netdata/netdata/go/go.d.plugin/agent/module" + "github.com/netdata/netdata/go/plugins/plugin/go.d/agent/module" "github.com/stretchr/testify/assert" "github.com/stretchr/testify/require" diff --git a/src/go/collectors/go.d.plugin/modules/litespeed/metadata.yaml b/src/go/plugin/go.d/modules/litespeed/metadata.yaml index 1c7957532..1c7957532 100644 --- a/src/go/collectors/go.d.plugin/modules/litespeed/metadata.yaml +++ b/src/go/plugin/go.d/modules/litespeed/metadata.yaml diff --git a/src/go/collectors/go.d.plugin/modules/litespeed/testdata/.rtreport b/src/go/plugin/go.d/modules/litespeed/testdata/.rtreport index e262cf3cc..e262cf3cc 100644 --- a/src/go/collectors/go.d.plugin/modules/litespeed/testdata/.rtreport +++ b/src/go/plugin/go.d/modules/litespeed/testdata/.rtreport diff --git a/src/go/collectors/go.d.plugin/modules/litespeed/testdata/.rtreport.2 b/src/go/plugin/go.d/modules/litespeed/testdata/.rtreport.2 index e262cf3cc..e262cf3cc 100644 --- a/src/go/collectors/go.d.plugin/modules/litespeed/testdata/.rtreport.2 +++ b/src/go/plugin/go.d/modules/litespeed/testdata/.rtreport.2 diff --git a/src/go/collectors/go.d.plugin/modules/litespeed/testdata/config.json b/src/go/plugin/go.d/modules/litespeed/testdata/config.json index 309245495..309245495 100644 --- a/src/go/collectors/go.d.plugin/modules/litespeed/testdata/config.json +++ b/src/go/plugin/go.d/modules/litespeed/testdata/config.json diff --git a/src/go/collectors/go.d.plugin/modules/litespeed/testdata/config.yaml b/src/go/plugin/go.d/modules/litespeed/testdata/config.yaml index 03905e5ce..03905e5ce 100644 --- a/src/go/collectors/go.d.plugin/modules/litespeed/testdata/config.yaml +++ b/src/go/plugin/go.d/modules/litespeed/testdata/config.yaml diff --git a/src/go/collectors/go.d.plugin/modules/logind/README.md b/src/go/plugin/go.d/modules/logind/README.md index 22c20d705..22c20d705 120000 --- a/src/go/collectors/go.d.plugin/modules/logind/README.md +++ b/src/go/plugin/go.d/modules/logind/README.md diff --git a/src/go/collectors/go.d.plugin/modules/logind/charts.go b/src/go/plugin/go.d/modules/logind/charts.go index 91bc0f202..61fa0490c 100644 --- a/src/go/collectors/go.d.plugin/modules/logind/charts.go +++ b/src/go/plugin/go.d/modules/logind/charts.go @@ -5,7 +5,7 @@ package logind -import "github.com/netdata/netdata/go/go.d.plugin/agent/module" +import "github.com/netdata/netdata/go/plugins/plugin/go.d/agent/module" const ( prioSessions = module.Priority + iota diff --git a/src/go/collectors/go.d.plugin/modules/logind/collect.go b/src/go/plugin/go.d/modules/logind/collect.go index 1f22478b1..1f22478b1 100644 --- a/src/go/collectors/go.d.plugin/modules/logind/collect.go +++ b/src/go/plugin/go.d/modules/logind/collect.go diff --git a/src/go/collectors/go.d.plugin/modules/logind/config_schema.json b/src/go/plugin/go.d/modules/logind/config_schema.json index 0a8618538..0a8618538 100644 --- a/src/go/collectors/go.d.plugin/modules/logind/config_schema.json +++ b/src/go/plugin/go.d/modules/logind/config_schema.json diff --git a/src/go/collectors/go.d.plugin/modules/logind/connection.go b/src/go/plugin/go.d/modules/logind/connection.go index b97387acf..b97387acf 100644 --- a/src/go/collectors/go.d.plugin/modules/logind/connection.go +++ b/src/go/plugin/go.d/modules/logind/connection.go diff --git a/src/go/collectors/go.d.plugin/modules/logind/doc.go b/src/go/plugin/go.d/modules/logind/doc.go index 90aa8b4ef..90aa8b4ef 100644 --- a/src/go/collectors/go.d.plugin/modules/logind/doc.go +++ b/src/go/plugin/go.d/modules/logind/doc.go diff --git a/src/go/collectors/go.d.plugin/modules/logind/integrations/systemd-logind_users.md b/src/go/plugin/go.d/modules/logind/integrations/systemd-logind_users.md index 9f80e924c..3450ff669 100644 --- a/src/go/collectors/go.d.plugin/modules/logind/integrations/systemd-logind_users.md +++ b/src/go/plugin/go.d/modules/logind/integrations/systemd-logind_users.md @@ -1,6 +1,6 @@ <!--startmeta -custom_edit_url: "https://github.com/netdata/netdata/edit/master/src/go/collectors/go.d.plugin/modules/logind/README.md" -meta_yaml: "https://github.com/netdata/netdata/edit/master/src/go/collectors/go.d.plugin/modules/logind/metadata.yaml" +custom_edit_url: "https://github.com/netdata/netdata/edit/master/src/go/plugin/go.d/modules/logind/README.md" +meta_yaml: "https://github.com/netdata/netdata/edit/master/src/go/plugin/go.d/modules/logind/metadata.yaml" sidebar_label: "systemd-logind users" learn_status: "Published" learn_rel_path: "Collecting Metrics/Systemd" @@ -110,6 +110,8 @@ There are no configuration examples. ### Debug Mode +**Important**: Debug mode is not supported for data collection jobs created via the UI using the Dyncfg feature. + To troubleshoot issues with the `logind` collector, run the `go.d.plugin` with the debug option enabled. The output should give you clues as to why the collector isn't working. @@ -132,4 +134,37 @@ should give you clues as to why the collector isn't working. ./go.d.plugin -d -m logind ``` +### Getting Logs + +If you're encountering problems with the `logind` collector, follow these steps to retrieve logs and identify potential issues: + +- **Run the command** specific to your system (systemd, non-systemd, or Docker container). +- **Examine the output** for any warnings or error messages that might indicate issues. These messages should provide clues about the root cause of the problem. + +#### System with systemd + +Use the following command to view logs generated since the last Netdata service restart: + +```bash +journalctl _SYSTEMD_INVOCATION_ID="$(systemctl show --value --property=InvocationID netdata)" --namespace=netdata --grep logind +``` + +#### System without systemd + +Locate the collector log file, typically at `/var/log/netdata/collector.log`, and use `grep` to filter for collector's name: + +```bash +grep logind /var/log/netdata/collector.log +``` + +**Note**: This method shows logs from all restarts. Focus on the **latest entries** for troubleshooting current issues. + +#### Docker Container + +If your Netdata runs in a Docker container named "netdata" (replace if different), use this command: + +```bash +docker logs netdata 2>&1 | grep logind +``` + diff --git a/src/go/collectors/go.d.plugin/modules/logind/logind.go b/src/go/plugin/go.d/modules/logind/logind.go index 97d2083a7..ff2866349 100644 --- a/src/go/collectors/go.d.plugin/modules/logind/logind.go +++ b/src/go/plugin/go.d/modules/logind/logind.go @@ -10,8 +10,8 @@ import ( "errors" "time" - "github.com/netdata/netdata/go/go.d.plugin/agent/module" - "github.com/netdata/netdata/go/go.d.plugin/pkg/web" + "github.com/netdata/netdata/go/plugins/plugin/go.d/agent/module" + "github.com/netdata/netdata/go/plugins/plugin/go.d/pkg/web" ) //go:embed "config_schema.json" diff --git a/src/go/collectors/go.d.plugin/modules/logind/logind_test.go b/src/go/plugin/go.d/modules/logind/logind_test.go index 7ba6b2258..21cbba871 100644 --- a/src/go/collectors/go.d.plugin/modules/logind/logind_test.go +++ b/src/go/plugin/go.d/modules/logind/logind_test.go @@ -10,7 +10,7 @@ import ( "os" "testing" - "github.com/netdata/netdata/go/go.d.plugin/agent/module" + "github.com/netdata/netdata/go/plugins/plugin/go.d/agent/module" "github.com/coreos/go-systemd/v22/login1" "github.com/godbus/dbus/v5" diff --git a/src/go/collectors/go.d.plugin/modules/logind/metadata.yaml b/src/go/plugin/go.d/modules/logind/metadata.yaml index 792a515fe..792a515fe 100644 --- a/src/go/collectors/go.d.plugin/modules/logind/metadata.yaml +++ b/src/go/plugin/go.d/modules/logind/metadata.yaml diff --git a/src/go/collectors/go.d.plugin/modules/lvm/testdata/config.json b/src/go/plugin/go.d/modules/logind/testdata/config.json index 291ecee3d..291ecee3d 100644 --- a/src/go/collectors/go.d.plugin/modules/lvm/testdata/config.json +++ b/src/go/plugin/go.d/modules/logind/testdata/config.json diff --git a/src/go/collectors/go.d.plugin/modules/lvm/testdata/config.yaml b/src/go/plugin/go.d/modules/logind/testdata/config.yaml index 25b0b4c78..25b0b4c78 100644 --- a/src/go/collectors/go.d.plugin/modules/lvm/testdata/config.yaml +++ b/src/go/plugin/go.d/modules/logind/testdata/config.yaml diff --git a/src/go/collectors/go.d.plugin/modules/logstash/README.md b/src/go/plugin/go.d/modules/logstash/README.md index 7a35ae8ff..7a35ae8ff 120000 --- a/src/go/collectors/go.d.plugin/modules/logstash/README.md +++ b/src/go/plugin/go.d/modules/logstash/README.md diff --git a/src/go/collectors/go.d.plugin/modules/logstash/charts.go b/src/go/plugin/go.d/modules/logstash/charts.go index 555a7e3e7..3fed45f4a 100644 --- a/src/go/collectors/go.d.plugin/modules/logstash/charts.go +++ b/src/go/plugin/go.d/modules/logstash/charts.go @@ -6,7 +6,7 @@ import ( "fmt" "strings" - "github.com/netdata/netdata/go/go.d.plugin/agent/module" + "github.com/netdata/netdata/go/plugins/plugin/go.d/agent/module" ) const ( diff --git a/src/go/collectors/go.d.plugin/modules/logstash/collect.go b/src/go/plugin/go.d/modules/logstash/collect.go index 3eceb9bf6..ff506d640 100644 --- a/src/go/collectors/go.d.plugin/modules/logstash/collect.go +++ b/src/go/plugin/go.d/modules/logstash/collect.go @@ -8,8 +8,8 @@ import ( "io" "net/http" - "github.com/netdata/netdata/go/go.d.plugin/pkg/stm" - "github.com/netdata/netdata/go/go.d.plugin/pkg/web" + "github.com/netdata/netdata/go/plugins/plugin/go.d/pkg/stm" + "github.com/netdata/netdata/go/plugins/plugin/go.d/pkg/web" ) const urlPathNodeStatsAPI = "/_node/stats" @@ -45,8 +45,10 @@ func (l *Logstash) updateCharts(pipelines map[string]pipelineStats) { } func (l *Logstash) queryNodeStats() (*nodeStats, error) { - req, _ := web.NewHTTPRequest(l.Request.Copy()) - req.URL.Path = urlPathNodeStatsAPI + req, err := web.NewHTTPRequestWithPath(l.Request, urlPathNodeStatsAPI) + if err != nil { + return nil, err + } var stats nodeStats diff --git a/src/go/collectors/go.d.plugin/modules/logstash/config_schema.json b/src/go/plugin/go.d/modules/logstash/config_schema.json index f9b2d5708..c08d136f1 100644 --- a/src/go/collectors/go.d.plugin/modules/logstash/config_schema.json +++ b/src/go/plugin/go.d/modules/logstash/config_schema.json @@ -167,6 +167,12 @@ "timeout": { "ui:help": "Accepts decimals for precise control (e.g., type 1.5 for 1.5 seconds)." }, + "username": { + "ui:widget": "password" + }, + "proxy_username": { + "ui:widget": "password" + }, "password": { "ui:widget": "password" }, diff --git a/src/go/collectors/go.d.plugin/modules/logstash/integrations/logstash.md b/src/go/plugin/go.d/modules/logstash/integrations/logstash.md index b4715abfb..0ca751ebf 100644 --- a/src/go/collectors/go.d.plugin/modules/logstash/integrations/logstash.md +++ b/src/go/plugin/go.d/modules/logstash/integrations/logstash.md @@ -1,6 +1,6 @@ <!--startmeta -custom_edit_url: "https://github.com/netdata/netdata/edit/master/src/go/collectors/go.d.plugin/modules/logstash/README.md" -meta_yaml: "https://github.com/netdata/netdata/edit/master/src/go/collectors/go.d.plugin/modules/logstash/metadata.yaml" +custom_edit_url: "https://github.com/netdata/netdata/edit/master/src/go/plugin/go.d/modules/logstash/README.md" +meta_yaml: "https://github.com/netdata/netdata/edit/master/src/go/plugin/go.d/modules/logstash/metadata.yaml" sidebar_label: "Logstash" learn_status: "Published" learn_rel_path: "Collecting Metrics/Logs Servers" @@ -223,6 +223,8 @@ jobs: ### Debug Mode +**Important**: Debug mode is not supported for data collection jobs created via the UI using the Dyncfg feature. + To troubleshoot issues with the `logstash` collector, run the `go.d.plugin` with the debug option enabled. The output should give you clues as to why the collector isn't working. @@ -245,4 +247,37 @@ should give you clues as to why the collector isn't working. ./go.d.plugin -d -m logstash ``` +### Getting Logs + +If you're encountering problems with the `logstash` collector, follow these steps to retrieve logs and identify potential issues: + +- **Run the command** specific to your system (systemd, non-systemd, or Docker container). +- **Examine the output** for any warnings or error messages that might indicate issues. These messages should provide clues about the root cause of the problem. + +#### System with systemd + +Use the following command to view logs generated since the last Netdata service restart: + +```bash +journalctl _SYSTEMD_INVOCATION_ID="$(systemctl show --value --property=InvocationID netdata)" --namespace=netdata --grep logstash +``` + +#### System without systemd + +Locate the collector log file, typically at `/var/log/netdata/collector.log`, and use `grep` to filter for collector's name: + +```bash +grep logstash /var/log/netdata/collector.log +``` + +**Note**: This method shows logs from all restarts. Focus on the **latest entries** for troubleshooting current issues. + +#### Docker Container + +If your Netdata runs in a Docker container named "netdata" (replace if different), use this command: + +```bash +docker logs netdata 2>&1 | grep logstash +``` + diff --git a/src/go/collectors/go.d.plugin/modules/logstash/logstash.go b/src/go/plugin/go.d/modules/logstash/logstash.go index 197616be4..3ee95594e 100644 --- a/src/go/collectors/go.d.plugin/modules/logstash/logstash.go +++ b/src/go/plugin/go.d/modules/logstash/logstash.go @@ -8,8 +8,8 @@ import ( "net/http" "time" - "github.com/netdata/netdata/go/go.d.plugin/agent/module" - "github.com/netdata/netdata/go/go.d.plugin/pkg/web" + "github.com/netdata/netdata/go/plugins/plugin/go.d/agent/module" + "github.com/netdata/netdata/go/plugins/plugin/go.d/pkg/web" ) //go:embed "config_schema.json" diff --git a/src/go/collectors/go.d.plugin/modules/logstash/logstash_test.go b/src/go/plugin/go.d/modules/logstash/logstash_test.go index 6ea2e4191..166d39815 100644 --- a/src/go/collectors/go.d.plugin/modules/logstash/logstash_test.go +++ b/src/go/plugin/go.d/modules/logstash/logstash_test.go @@ -3,13 +3,13 @@ package logstash import ( - "github.com/netdata/netdata/go/go.d.plugin/agent/module" + "github.com/netdata/netdata/go/plugins/plugin/go.d/agent/module" "net/http" "net/http/httptest" "os" "testing" - "github.com/netdata/netdata/go/go.d.plugin/pkg/web" + "github.com/netdata/netdata/go/plugins/plugin/go.d/pkg/web" "github.com/stretchr/testify/assert" "github.com/stretchr/testify/require" diff --git a/src/go/collectors/go.d.plugin/modules/logstash/metadata.yaml b/src/go/plugin/go.d/modules/logstash/metadata.yaml index 00d92db2a..00d92db2a 100644 --- a/src/go/collectors/go.d.plugin/modules/logstash/metadata.yaml +++ b/src/go/plugin/go.d/modules/logstash/metadata.yaml diff --git a/src/go/collectors/go.d.plugin/modules/logstash/node_stats.go b/src/go/plugin/go.d/modules/logstash/node_stats.go index 1687f333d..1687f333d 100644 --- a/src/go/collectors/go.d.plugin/modules/logstash/node_stats.go +++ b/src/go/plugin/go.d/modules/logstash/node_stats.go diff --git a/src/go/collectors/go.d.plugin/modules/nginx/testdata/config.json b/src/go/plugin/go.d/modules/logstash/testdata/config.json index 984c3ed6e..984c3ed6e 100644 --- a/src/go/collectors/go.d.plugin/modules/nginx/testdata/config.json +++ b/src/go/plugin/go.d/modules/logstash/testdata/config.json diff --git a/src/go/collectors/go.d.plugin/modules/nginx/testdata/config.yaml b/src/go/plugin/go.d/modules/logstash/testdata/config.yaml index 8558b61cc..8558b61cc 100644 --- a/src/go/collectors/go.d.plugin/modules/nginx/testdata/config.yaml +++ b/src/go/plugin/go.d/modules/logstash/testdata/config.yaml diff --git a/src/go/collectors/go.d.plugin/modules/logstash/testdata/stats.json b/src/go/plugin/go.d/modules/logstash/testdata/stats.json index 50fd7b071..50fd7b071 100644 --- a/src/go/collectors/go.d.plugin/modules/logstash/testdata/stats.json +++ b/src/go/plugin/go.d/modules/logstash/testdata/stats.json diff --git a/src/go/collectors/go.d.plugin/modules/lvm/README.md b/src/go/plugin/go.d/modules/lvm/README.md index 9b86695a2..9b86695a2 120000 --- a/src/go/collectors/go.d.plugin/modules/lvm/README.md +++ b/src/go/plugin/go.d/modules/lvm/README.md diff --git a/src/go/collectors/go.d.plugin/modules/lvm/charts.go b/src/go/plugin/go.d/modules/lvm/charts.go index 20db6615e..8d2f0fa19 100644 --- a/src/go/collectors/go.d.plugin/modules/lvm/charts.go +++ b/src/go/plugin/go.d/modules/lvm/charts.go @@ -5,7 +5,7 @@ package lvm import ( "fmt" - "github.com/netdata/netdata/go/go.d.plugin/agent/module" + "github.com/netdata/netdata/go/plugins/plugin/go.d/agent/module" ) const ( diff --git a/src/go/collectors/go.d.plugin/modules/lvm/collect.go b/src/go/plugin/go.d/modules/lvm/collect.go index 8f57a1a80..8f57a1a80 100644 --- a/src/go/collectors/go.d.plugin/modules/lvm/collect.go +++ b/src/go/plugin/go.d/modules/lvm/collect.go diff --git a/src/go/collectors/go.d.plugin/modules/lvm/config_schema.json b/src/go/plugin/go.d/modules/lvm/config_schema.json index 1e0788074..1e0788074 100644 --- a/src/go/collectors/go.d.plugin/modules/lvm/config_schema.json +++ b/src/go/plugin/go.d/modules/lvm/config_schema.json diff --git a/src/go/collectors/go.d.plugin/modules/lvm/exec.go b/src/go/plugin/go.d/modules/lvm/exec.go index 529cbdef3..66863a051 100644 --- a/src/go/collectors/go.d.plugin/modules/lvm/exec.go +++ b/src/go/plugin/go.d/modules/lvm/exec.go @@ -8,7 +8,7 @@ import ( "os/exec" "time" - "github.com/netdata/netdata/go/go.d.plugin/logger" + "github.com/netdata/netdata/go/plugins/logger" ) func newLVMCLIExec(ndsudoPath string, timeout time.Duration, log *logger.Logger) *lvmCLIExec { diff --git a/src/go/collectors/go.d.plugin/modules/lvm/init.go b/src/go/plugin/go.d/modules/lvm/init.go index 057e51dd5..5c4db1add 100644 --- a/src/go/collectors/go.d.plugin/modules/lvm/init.go +++ b/src/go/plugin/go.d/modules/lvm/init.go @@ -7,7 +7,7 @@ import ( "os" "path/filepath" - "github.com/netdata/netdata/go/go.d.plugin/agent/executable" + "github.com/netdata/netdata/go/plugins/pkg/executable" ) func (l *LVM) initLVMCLIExec() (lvmCLI, error) { diff --git a/src/go/collectors/go.d.plugin/modules/lvm/integrations/lvm_logical_volumes.md b/src/go/plugin/go.d/modules/lvm/integrations/lvm_logical_volumes.md index 404631583..1d76c3635 100644 --- a/src/go/collectors/go.d.plugin/modules/lvm/integrations/lvm_logical_volumes.md +++ b/src/go/plugin/go.d/modules/lvm/integrations/lvm_logical_volumes.md @@ -1,6 +1,6 @@ <!--startmeta -custom_edit_url: "https://github.com/netdata/netdata/edit/master/src/go/collectors/go.d.plugin/modules/lvm/README.md" -meta_yaml: "https://github.com/netdata/netdata/edit/master/src/go/collectors/go.d.plugin/modules/lvm/metadata.yaml" +custom_edit_url: "https://github.com/netdata/netdata/edit/master/src/go/plugin/go.d/modules/lvm/README.md" +meta_yaml: "https://github.com/netdata/netdata/edit/master/src/go/plugin/go.d/modules/lvm/metadata.yaml" sidebar_label: "LVM logical volumes" learn_status: "Published" learn_rel_path: "Collecting Metrics/Storage, Mount Points and Filesystems" @@ -142,6 +142,8 @@ jobs: ### Debug Mode +**Important**: Debug mode is not supported for data collection jobs created via the UI using the Dyncfg feature. + To troubleshoot issues with the `lvm` collector, run the `go.d.plugin` with the debug option enabled. The output should give you clues as to why the collector isn't working. @@ -164,4 +166,37 @@ should give you clues as to why the collector isn't working. ./go.d.plugin -d -m lvm ``` +### Getting Logs + +If you're encountering problems with the `lvm` collector, follow these steps to retrieve logs and identify potential issues: + +- **Run the command** specific to your system (systemd, non-systemd, or Docker container). +- **Examine the output** for any warnings or error messages that might indicate issues. These messages should provide clues about the root cause of the problem. + +#### System with systemd + +Use the following command to view logs generated since the last Netdata service restart: + +```bash +journalctl _SYSTEMD_INVOCATION_ID="$(systemctl show --value --property=InvocationID netdata)" --namespace=netdata --grep lvm +``` + +#### System without systemd + +Locate the collector log file, typically at `/var/log/netdata/collector.log`, and use `grep` to filter for collector's name: + +```bash +grep lvm /var/log/netdata/collector.log +``` + +**Note**: This method shows logs from all restarts. Focus on the **latest entries** for troubleshooting current issues. + +#### Docker Container + +If your Netdata runs in a Docker container named "netdata" (replace if different), use this command: + +```bash +docker logs netdata 2>&1 | grep lvm +``` + diff --git a/src/go/collectors/go.d.plugin/modules/lvm/lvm.go b/src/go/plugin/go.d/modules/lvm/lvm.go index 5435cd3af..c6754e06a 100644 --- a/src/go/collectors/go.d.plugin/modules/lvm/lvm.go +++ b/src/go/plugin/go.d/modules/lvm/lvm.go @@ -7,8 +7,8 @@ import ( "errors" "time" - "github.com/netdata/netdata/go/go.d.plugin/agent/module" - "github.com/netdata/netdata/go/go.d.plugin/pkg/web" + "github.com/netdata/netdata/go/plugins/plugin/go.d/agent/module" + "github.com/netdata/netdata/go/plugins/plugin/go.d/pkg/web" ) //go:embed "config_schema.json" diff --git a/src/go/collectors/go.d.plugin/modules/lvm/lvm_test.go b/src/go/plugin/go.d/modules/lvm/lvm_test.go index db85fc7df..a3c072837 100644 --- a/src/go/collectors/go.d.plugin/modules/lvm/lvm_test.go +++ b/src/go/plugin/go.d/modules/lvm/lvm_test.go @@ -7,7 +7,7 @@ import ( "os" "testing" - "github.com/netdata/netdata/go/go.d.plugin/agent/module" + "github.com/netdata/netdata/go/plugins/plugin/go.d/agent/module" "github.com/stretchr/testify/assert" "github.com/stretchr/testify/require" diff --git a/src/go/collectors/go.d.plugin/modules/lvm/metadata.yaml b/src/go/plugin/go.d/modules/lvm/metadata.yaml index 46d036946..46d036946 100644 --- a/src/go/collectors/go.d.plugin/modules/lvm/metadata.yaml +++ b/src/go/plugin/go.d/modules/lvm/metadata.yaml diff --git a/src/go/collectors/go.d.plugin/modules/megacli/testdata/config.json b/src/go/plugin/go.d/modules/lvm/testdata/config.json index 291ecee3d..291ecee3d 100644 --- a/src/go/collectors/go.d.plugin/modules/megacli/testdata/config.json +++ b/src/go/plugin/go.d/modules/lvm/testdata/config.json diff --git a/src/go/collectors/go.d.plugin/modules/megacli/testdata/config.yaml b/src/go/plugin/go.d/modules/lvm/testdata/config.yaml index 25b0b4c78..25b0b4c78 100644 --- a/src/go/collectors/go.d.plugin/modules/megacli/testdata/config.yaml +++ b/src/go/plugin/go.d/modules/lvm/testdata/config.yaml diff --git a/src/go/collectors/go.d.plugin/modules/lvm/testdata/lvs-report-no-thin.json b/src/go/plugin/go.d/modules/lvm/testdata/lvs-report-no-thin.json index 1fe8ec44f..1fe8ec44f 100644 --- a/src/go/collectors/go.d.plugin/modules/lvm/testdata/lvs-report-no-thin.json +++ b/src/go/plugin/go.d/modules/lvm/testdata/lvs-report-no-thin.json diff --git a/src/go/collectors/go.d.plugin/modules/lvm/testdata/lvs-report.json b/src/go/plugin/go.d/modules/lvm/testdata/lvs-report.json index bd04fad75..bd04fad75 100644 --- a/src/go/collectors/go.d.plugin/modules/lvm/testdata/lvs-report.json +++ b/src/go/plugin/go.d/modules/lvm/testdata/lvs-report.json diff --git a/src/go/collectors/go.d.plugin/modules/megacli/README.md b/src/go/plugin/go.d/modules/megacli/README.md index bf0d30985..bf0d30985 120000 --- a/src/go/collectors/go.d.plugin/modules/megacli/README.md +++ b/src/go/plugin/go.d/modules/megacli/README.md diff --git a/src/go/collectors/go.d.plugin/modules/megacli/charts.go b/src/go/plugin/go.d/modules/megacli/charts.go index c1ae8f338..c479d5677 100644 --- a/src/go/collectors/go.d.plugin/modules/megacli/charts.go +++ b/src/go/plugin/go.d/modules/megacli/charts.go @@ -5,7 +5,7 @@ package megacli import ( "fmt" - "github.com/netdata/netdata/go/go.d.plugin/agent/module" + "github.com/netdata/netdata/go/plugins/plugin/go.d/agent/module" ) const ( @@ -16,6 +16,7 @@ const ( prioBBURelativeCharge prioBBURechargeCycles + prioBBUCapDegradationPerc prioBBUTemperature ) @@ -76,6 +77,7 @@ var ( var bbuChartsTmpl = module.Charts{ bbuRelativeChargeChartsTmpl.Copy(), bbuRechargeCyclesChartsTmpl.Copy(), + bbuCapacityDegradationChartsTmpl.Copy(), bbuTemperatureChartsTmpl.Copy(), } @@ -104,6 +106,18 @@ var ( {ID: "bbu_adapter_%s_cycle_count", Name: "recharge"}, }, } + bbuCapacityDegradationChartsTmpl = module.Chart{ + ID: "bbu_adapter_%s_capacity_degradation", + Title: "BBU capacity degradation", + Units: "percent", + Fam: "bbu charge", + Ctx: "megacli.bbu_capacity_degradation", + Type: module.Line, + Priority: prioBBUCapDegradationPerc, + Dims: module.Dims{ + {ID: "bbu_adapter_%s_capacity_degradation_perc", Name: "cap_degradation"}, + }, + } bbuTemperatureChartsTmpl = module.Chart{ ID: "bbu_adapter_%s_temperature", Title: "BBU temperature", @@ -161,6 +175,10 @@ func (m *MegaCli) addPhysDriveCharts(pd *megaPhysDrive) { func (m *MegaCli) addBBUCharts(bbu *megaBBU) { charts := bbuChartsTmpl.Copy() + if _, ok := calcCapDegradationPerc(bbu); !ok { + _ = charts.Remove(bbuCapacityDegradationChartsTmpl.ID) + } + for _, chart := range *charts { chart.ID = fmt.Sprintf(chart.ID, bbu.adapterNumber) chart.Labels = []module.Label{ diff --git a/src/go/collectors/go.d.plugin/modules/megacli/collect.go b/src/go/plugin/go.d/modules/megacli/collect.go index c4e74b78b..c4e74b78b 100644 --- a/src/go/collectors/go.d.plugin/modules/megacli/collect.go +++ b/src/go/plugin/go.d/modules/megacli/collect.go diff --git a/src/go/collectors/go.d.plugin/modules/megacli/collect_bbu.go b/src/go/plugin/go.d/modules/megacli/collect_bbu.go index 1ba827185..33b048e64 100644 --- a/src/go/collectors/go.d.plugin/modules/megacli/collect_bbu.go +++ b/src/go/plugin/go.d/modules/megacli/collect_bbu.go @@ -6,16 +6,19 @@ import ( "bufio" "bytes" "fmt" + "strconv" "strings" ) type megaBBU struct { - adapterNumber string - batteryType string - temperature string - relativeStateOfCharge string - absoluteStateOfCharge string // apparently can be 0 while relative > 0 (e.g. relative 91%, absolute 0%) - cycleCount string + adapterNumber string + batteryType string + temperature string + rsoc string + asoc string // apparently can be 0 while relative > 0 (e.g. relative 91%, absolute 0%) + cycleCount string + fullChargeCap string + designCap string } func (m *MegaCli) collectBBU(mx map[string]int64) error { @@ -29,6 +32,11 @@ func (m *MegaCli) collectBBU(mx map[string]int64) error { return err } + if len(bbus) == 0 { + m.Debugf("no BBUs found") + return nil + } + for _, bbu := range bbus { if !m.bbu[bbu.adapterNumber] { m.bbu[bbu.adapterNumber] = true @@ -38,11 +46,16 @@ func (m *MegaCli) collectBBU(mx map[string]int64) error { px := fmt.Sprintf("bbu_adapter_%s_", bbu.adapterNumber) writeInt(mx, px+"temperature", bbu.temperature) - writeInt(mx, px+"relative_state_of_charge", bbu.relativeStateOfCharge) - writeInt(mx, px+"absolute_state_of_charge", bbu.absoluteStateOfCharge) + writeInt(mx, px+"relative_state_of_charge", bbu.rsoc) + writeInt(mx, px+"absolute_state_of_charge", bbu.asoc) writeInt(mx, px+"cycle_count", bbu.cycleCount) + if v, ok := calcCapDegradationPerc(bbu); ok { + mx[px+"capacity_degradation_perc"] = v + } } + m.Debugf("found %d BBUs", len(m.bbu)) + return nil } @@ -69,9 +82,11 @@ func parseBBUInfo(bs []byte) (map[string]*megaBBU, error) { case strings.HasPrefix(line, "BBU Capacity Info for Adapter"): section = "capacity" continue + case strings.HasPrefix(line, "BBU Design Info for Adapter"): + section = "design" + continue case strings.HasPrefix(line, "BBU Firmware Status"), strings.HasPrefix(line, "BBU GasGauge Status"), - strings.HasPrefix(line, "BBU Design Info for Adapter"), strings.HasPrefix(line, "BBU Properties for Adapter"): section = "" continue @@ -92,14 +107,35 @@ func parseBBUInfo(bs []byte) (map[string]*megaBBU, error) { case "capacity": switch { case strings.HasPrefix(line, "Relative State of Charge:"): - bbu.relativeStateOfCharge = getColonSepNumValue(line) + bbu.rsoc = getColonSepNumValue(line) case strings.HasPrefix(line, "Absolute State of charge:"): - bbu.absoluteStateOfCharge = getColonSepNumValue(line) + bbu.asoc = getColonSepNumValue(line) + case strings.HasPrefix(line, "Full Charge Capacity:"): + bbu.fullChargeCap = getColonSepNumValue(line) case strings.HasPrefix(line, "Cycle Count:"): bbu.cycleCount = getColonSepNumValue(line) } + case "design": + if strings.HasPrefix(line, "Design Capacity:") { + bbu.designCap = getColonSepNumValue(line) + } } } return bbus, nil } + +func calcCapDegradationPerc(bbu *megaBBU) (int64, bool) { + full, err := strconv.ParseInt(bbu.fullChargeCap, 10, 64) + if err != nil || full == 0 { + return 0, false + } + design, err := strconv.ParseInt(bbu.designCap, 10, 64) + if err != nil || design == 0 { + return 0, false + } + + v := 100 - float64(full)/float64(design)*100 + + return int64(v), true +} diff --git a/src/go/collectors/go.d.plugin/modules/megacli/collect_phys_drives.go b/src/go/plugin/go.d/modules/megacli/collect_phys_drives.go index 531228f46..71d4546e3 100644 --- a/src/go/collectors/go.d.plugin/modules/megacli/collect_phys_drives.go +++ b/src/go/plugin/go.d/modules/megacli/collect_phys_drives.go @@ -5,6 +5,7 @@ package megacli import ( "bufio" "bytes" + "errors" "fmt" "strings" ) @@ -45,6 +46,11 @@ func (m *MegaCli) collectPhysDrives(mx map[string]int64) error { if err != nil { return err } + if len(adapters) == 0 { + return errors.New("no adapters found") + } + + var drives int for _, ad := range adapters { if !m.adapters[ad.number] { @@ -64,6 +70,7 @@ func (m *MegaCli) collectPhysDrives(mx map[string]int64) error { m.adapters[pd.wwn] = true m.addPhysDriveCharts(pd) } + drives++ px := fmt.Sprintf("phys_drive_%s_", pd.wwn) @@ -72,6 +79,8 @@ func (m *MegaCli) collectPhysDrives(mx map[string]int64) error { } } + m.Debugf("found %d adapters, %d physical drives", len(m.adapters), drives) + return nil } diff --git a/src/go/collectors/go.d.plugin/modules/megacli/config_schema.json b/src/go/plugin/go.d/modules/megacli/config_schema.json index 6eb36519d..6eb36519d 100644 --- a/src/go/collectors/go.d.plugin/modules/megacli/config_schema.json +++ b/src/go/plugin/go.d/modules/megacli/config_schema.json diff --git a/src/go/collectors/go.d.plugin/modules/megacli/exec.go b/src/go/plugin/go.d/modules/megacli/exec.go index 4fa971dc8..846952b25 100644 --- a/src/go/collectors/go.d.plugin/modules/megacli/exec.go +++ b/src/go/plugin/go.d/modules/megacli/exec.go @@ -8,7 +8,7 @@ import ( "os/exec" "time" - "github.com/netdata/netdata/go/go.d.plugin/logger" + "github.com/netdata/netdata/go/plugins/logger" ) func newMegaCliExec(ndsudoPath string, timeout time.Duration, log *logger.Logger) *megaCliExec { diff --git a/src/go/collectors/go.d.plugin/modules/megacli/init.go b/src/go/plugin/go.d/modules/megacli/init.go index 2b0840a7d..78b7bf482 100644 --- a/src/go/collectors/go.d.plugin/modules/megacli/init.go +++ b/src/go/plugin/go.d/modules/megacli/init.go @@ -7,7 +7,7 @@ import ( "os" "path/filepath" - "github.com/netdata/netdata/go/go.d.plugin/agent/executable" + "github.com/netdata/netdata/go/plugins/pkg/executable" ) func (m *MegaCli) initMegaCliExec() (megaCli, error) { diff --git a/src/go/collectors/go.d.plugin/modules/megacli/integrations/megacli_megaraid.md b/src/go/plugin/go.d/modules/megacli/integrations/megacli_megaraid.md index d043d5451..d1efa7df1 100644 --- a/src/go/collectors/go.d.plugin/modules/megacli/integrations/megacli_megaraid.md +++ b/src/go/plugin/go.d/modules/megacli/integrations/megacli_megaraid.md @@ -1,6 +1,6 @@ <!--startmeta -custom_edit_url: "https://github.com/netdata/netdata/edit/master/src/go/collectors/go.d.plugin/modules/megacli/README.md" -meta_yaml: "https://github.com/netdata/netdata/edit/master/src/go/collectors/go.d.plugin/modules/megacli/metadata.yaml" +custom_edit_url: "https://github.com/netdata/netdata/edit/master/src/go/plugin/go.d/modules/megacli/README.md" +meta_yaml: "https://github.com/netdata/netdata/edit/master/src/go/plugin/go.d/modules/megacli/metadata.yaml" sidebar_label: "MegaCLI MegaRAID" learn_status: "Published" learn_rel_path: "Collecting Metrics/Storage, Mount Points and Filesystems" @@ -113,8 +113,9 @@ Metrics: | Metric | Dimensions | Unit | |:------|:----------|:----| -| megacli.bbu_relative_charge | charge | percentage | +| megacli.bbu_charge | charge | percentage | | megacli.bbu_recharge_cycles | recharge | cycles | +| megacli.bbu_capacity_degradation | cap_degradation | percent | | megacli.bbu_temperature | temperature | Celsius | @@ -189,6 +190,8 @@ jobs: ### Debug Mode +**Important**: Debug mode is not supported for data collection jobs created via the UI using the Dyncfg feature. + To troubleshoot issues with the `megacli` collector, run the `go.d.plugin` with the debug option enabled. The output should give you clues as to why the collector isn't working. @@ -211,4 +214,37 @@ should give you clues as to why the collector isn't working. ./go.d.plugin -d -m megacli ``` +### Getting Logs + +If you're encountering problems with the `megacli` collector, follow these steps to retrieve logs and identify potential issues: + +- **Run the command** specific to your system (systemd, non-systemd, or Docker container). +- **Examine the output** for any warnings or error messages that might indicate issues. These messages should provide clues about the root cause of the problem. + +#### System with systemd + +Use the following command to view logs generated since the last Netdata service restart: + +```bash +journalctl _SYSTEMD_INVOCATION_ID="$(systemctl show --value --property=InvocationID netdata)" --namespace=netdata --grep megacli +``` + +#### System without systemd + +Locate the collector log file, typically at `/var/log/netdata/collector.log`, and use `grep` to filter for collector's name: + +```bash +grep megacli /var/log/netdata/collector.log +``` + +**Note**: This method shows logs from all restarts. Focus on the **latest entries** for troubleshooting current issues. + +#### Docker Container + +If your Netdata runs in a Docker container named "netdata" (replace if different), use this command: + +```bash +docker logs netdata 2>&1 | grep megacli +``` + diff --git a/src/go/collectors/go.d.plugin/modules/megacli/megacli.go b/src/go/plugin/go.d/modules/megacli/megacli.go index f49d7ba00..41abd7a12 100644 --- a/src/go/collectors/go.d.plugin/modules/megacli/megacli.go +++ b/src/go/plugin/go.d/modules/megacli/megacli.go @@ -7,8 +7,8 @@ import ( "errors" "time" - "github.com/netdata/netdata/go/go.d.plugin/agent/module" - "github.com/netdata/netdata/go/go.d.plugin/pkg/web" + "github.com/netdata/netdata/go/plugins/plugin/go.d/agent/module" + "github.com/netdata/netdata/go/plugins/plugin/go.d/pkg/web" ) //go:embed "config_schema.json" diff --git a/src/go/collectors/go.d.plugin/modules/megacli/megacli_test.go b/src/go/plugin/go.d/modules/megacli/megacli_test.go index ee1e56b3f..4991a28ce 100644 --- a/src/go/collectors/go.d.plugin/modules/megacli/megacli_test.go +++ b/src/go/plugin/go.d/modules/megacli/megacli_test.go @@ -7,7 +7,7 @@ import ( "os" "testing" - "github.com/netdata/netdata/go/go.d.plugin/agent/module" + "github.com/netdata/netdata/go/plugins/plugin/go.d/agent/module" "github.com/stretchr/testify/assert" "github.com/stretchr/testify/require" @@ -160,6 +160,7 @@ func TestMegaCli_Collect(t *testing.T) { "adapter_0_health_state_optimal": 1, "adapter_0_health_state_partially_degraded": 0, "bbu_adapter_0_absolute_state_of_charge": 63, + "bbu_adapter_0_capacity_degradation_perc": 10, "bbu_adapter_0_cycle_count": 4, "bbu_adapter_0_relative_state_of_charge": 71, "bbu_adapter_0_temperature": 33, @@ -190,6 +191,7 @@ func TestMegaCli_Collect(t *testing.T) { "adapter_0_health_state_optimal": 1, "adapter_0_health_state_partially_degraded": 0, "bbu_adapter_0_absolute_state_of_charge": 83, + "bbu_adapter_0_capacity_degradation_perc": 17, "bbu_adapter_0_cycle_count": 61, "bbu_adapter_0_relative_state_of_charge": 100, "bbu_adapter_0_temperature": 31, @@ -235,6 +237,9 @@ func TestMegaCli_Collect(t *testing.T) { assert.Equal(t, test.wantMetrics, mx) assert.Len(t, *mega.Charts(), test.wantCharts) + if len(test.wantMetrics) > 0 { + module.TestMetricsHasAllChartsDims(t, mega.Charts(), mx) + } }) } } diff --git a/src/go/collectors/go.d.plugin/modules/megacli/metadata.yaml b/src/go/plugin/go.d/modules/megacli/metadata.yaml index 5ede8f7e7..da5f4fefa 100644 --- a/src/go/collectors/go.d.plugin/modules/megacli/metadata.yaml +++ b/src/go/plugin/go.d/modules/megacli/metadata.yaml @@ -157,7 +157,7 @@ modules: - name: battery_type description: Battery type (e.g. BBU) metrics: - - name: megacli.bbu_relative_charge + - name: megacli.bbu_charge description: BBU relative charge unit: percentage chart_type: area @@ -169,6 +169,12 @@ modules: chart_type: line dimensions: - name: recharge + - name: megacli.bbu_capacity_degradation + description: BBU capacity degradation + unit: percent + chart_type: area + dimensions: + - name: cap_degradation - name: megacli.bbu_temperature description: BBU bbu_temperature unit: Celsius diff --git a/src/go/collectors/go.d.plugin/modules/nvme/testdata/config.json b/src/go/plugin/go.d/modules/megacli/testdata/config.json index 291ecee3d..291ecee3d 100644 --- a/src/go/collectors/go.d.plugin/modules/nvme/testdata/config.json +++ b/src/go/plugin/go.d/modules/megacli/testdata/config.json diff --git a/src/go/collectors/go.d.plugin/modules/nvme/testdata/config.yaml b/src/go/plugin/go.d/modules/megacli/testdata/config.yaml index 25b0b4c78..25b0b4c78 100644 --- a/src/go/collectors/go.d.plugin/modules/nvme/testdata/config.yaml +++ b/src/go/plugin/go.d/modules/megacli/testdata/config.yaml diff --git a/src/go/collectors/go.d.plugin/modules/megacli/testdata/mega-bbu-info-old.txt b/src/go/plugin/go.d/modules/megacli/testdata/mega-bbu-info-old.txt index 054ce54df..054ce54df 100644 --- a/src/go/collectors/go.d.plugin/modules/megacli/testdata/mega-bbu-info-old.txt +++ b/src/go/plugin/go.d/modules/megacli/testdata/mega-bbu-info-old.txt diff --git a/src/go/collectors/go.d.plugin/modules/megacli/testdata/mega-bbu-info-recent.txt b/src/go/plugin/go.d/modules/megacli/testdata/mega-bbu-info-recent.txt index 948be372b..948be372b 100644 --- a/src/go/collectors/go.d.plugin/modules/megacli/testdata/mega-bbu-info-recent.txt +++ b/src/go/plugin/go.d/modules/megacli/testdata/mega-bbu-info-recent.txt diff --git a/src/go/collectors/go.d.plugin/modules/megacli/testdata/mega-phys-drives-info.txt b/src/go/plugin/go.d/modules/megacli/testdata/mega-phys-drives-info.txt index 142ddc822..142ddc822 100644 --- a/src/go/collectors/go.d.plugin/modules/megacli/testdata/mega-phys-drives-info.txt +++ b/src/go/plugin/go.d/modules/megacli/testdata/mega-phys-drives-info.txt diff --git a/src/collectors/python.d.plugin/memcached/README.md b/src/go/plugin/go.d/modules/memcached/README.md index 2cb76d33c..2cb76d33c 120000 --- a/src/collectors/python.d.plugin/memcached/README.md +++ b/src/go/plugin/go.d/modules/memcached/README.md diff --git a/src/go/plugin/go.d/modules/memcached/charts.go b/src/go/plugin/go.d/modules/memcached/charts.go new file mode 100644 index 000000000..14cb1bf11 --- /dev/null +++ b/src/go/plugin/go.d/modules/memcached/charts.go @@ -0,0 +1,229 @@ +// SPDX-License-Identifier: GPL-3.0-or-later + +package memcached + +import ( + "github.com/netdata/netdata/go/plugins/plugin/go.d/agent/module" +) + +const ( + prioCache = module.Priority + iota + prioNet + prioConnections + prioItems + prioEvictedReclaimed + prioGet + prioGetRate + prioSetRate + prioDelete + prioCas + prioIncrement + prioDecrement + prioTouch + prioTouchRate +) + +var charts = module.Charts{ + cacheChart.Copy(), + netChart.Copy(), + connectionsChart.Copy(), + itemsChart.Copy(), + EvictedReclaimedChart.Copy(), + getChart.Copy(), + getRateChart.Copy(), + setRateChart.Copy(), + deleteChart.Copy(), + casChart.Copy(), + incrementChart.Copy(), + decrementChart.Copy(), + touchChart.Copy(), + touchRateChart.Copy(), +} + +const ( + byteToMiB = 1 << 20 +) + +var ( + cacheChart = module.Chart{ + ID: "cache", + Title: "Cache Size", + Units: "MiB", + Fam: "cache", + Ctx: "memcached.cache", + Type: module.Stacked, + Priority: prioCache, + Dims: module.Dims{ + {ID: "avail", Div: byteToMiB}, + {ID: "bytes", Name: "used", Div: byteToMiB}, + }, + } + netChart = module.Chart{ + ID: "net", + Title: "Network", + Units: "kilobits/s", + Fam: "network", + Ctx: "memcached.net", + Type: module.Area, + Priority: prioNet, + Dims: module.Dims{ + {ID: "bytes_read", Name: "in", Mul: 8, Div: 1000, Algo: module.Incremental}, + {ID: "bytes_written", Name: "out", Mul: -8, Div: 1000, Algo: module.Incremental}, + }, + } + connectionsChart = module.Chart{ + ID: "connections", + Title: "Connections", + Units: "connections/s", + Fam: "connections", + Ctx: "memcached.connections", + Type: module.Line, + Priority: prioConnections, + Dims: module.Dims{ + {ID: "curr_connections", Name: "current", Algo: module.Incremental}, + {ID: "rejected_connections", Name: "rejected", Algo: module.Incremental}, + {ID: "total_connections", Name: "total", Algo: module.Incremental}, + }, + } + itemsChart = module.Chart{ + ID: "items", + Title: "Items", + Units: "items", + Fam: "items", + Ctx: "memcached.items", + Type: module.Line, + Priority: prioItems, + Dims: module.Dims{ + {ID: "curr_items", Name: "current"}, + {ID: "total_items", Name: "total"}, + }, + } + EvictedReclaimedChart = module.Chart{ + ID: "evicted_reclaimed", + Title: "Evicted and Reclaimed Items", + Units: "items", + Fam: "items", + Ctx: "memcached.evicted_reclaimed", + Type: module.Line, + Priority: prioEvictedReclaimed, + Dims: module.Dims{ + {ID: "reclaimed"}, + {ID: "evictions", Name: "evicted"}, + }, + } + getChart = module.Chart{ + ID: "get", + Title: "Get Requests", + Units: "requests", + Fam: "get ops", + Ctx: "memcached.get", + Type: module.Stacked, + Priority: prioGet, + Dims: module.Dims{ + {ID: "get_hits", Name: "hits", Algo: module.PercentOfAbsolute}, + {ID: "get_misses", Name: "misses", Algo: module.PercentOfAbsolute}, + }, + } + getRateChart = module.Chart{ + ID: "get_rate", + Title: "Get Request Rate", + Units: "requests/s", + Fam: "get ops", + Ctx: "memcached.get_rate", + Type: module.Line, + Priority: prioGetRate, + Dims: module.Dims{ + {ID: "cmd_get", Name: "rate", Algo: module.Incremental}, + }, + } + setRateChart = module.Chart{ + ID: "set_rate", + Title: "Set Request Rate", + Units: "requests/s", + Fam: "set ops", + Ctx: "memcached.set_rate", + Type: module.Line, + Priority: prioSetRate, + Dims: module.Dims{ + {ID: "cmd_set", Name: "rate", Algo: module.Incremental}, + }, + } + deleteChart = module.Chart{ + ID: "delete", + Title: "Delete Requests", + Units: "requests", + Fam: "delete ops", + Ctx: "memcached.delete", + Type: module.Stacked, + Priority: prioDelete, + Dims: module.Dims{ + {ID: "delete_hits", Name: "hits", Algo: module.PercentOfAbsolute}, + {ID: "delete_misses", Name: "misses", Algo: module.PercentOfAbsolute}, + }, + } + casChart = module.Chart{ + ID: "cas", + Title: "Check and Set Requests", + Units: "requests", + Fam: "check and set ops", + Ctx: "memcached.cas", + Type: module.Stacked, + Priority: prioCas, + Dims: module.Dims{ + {ID: "cas_hits", Name: "hits", Algo: module.PercentOfAbsolute}, + {ID: "cas_misses", Name: "misses", Algo: module.PercentOfAbsolute}, + {ID: "cas_badval", Name: "bad value", Algo: module.PercentOfAbsolute}, + }, + } + incrementChart = module.Chart{ + ID: "increment", + Title: "Increment Requests", + Units: "requests", + Fam: "increment ops", + Ctx: "memcached.increment", + Type: module.Stacked, + Priority: prioIncrement, + Dims: module.Dims{ + {ID: "incr_hits", Name: "hits", Algo: module.PercentOfAbsolute}, + {ID: "incr_misses", Name: "misses", Algo: module.PercentOfAbsolute}, + }, + } + decrementChart = module.Chart{ + ID: "decrement", + Title: "Decrement Requests", + Units: "requests", + Fam: "decrement ops", + Ctx: "memcached.decrement", + Type: module.Stacked, + Priority: prioDecrement, + Dims: module.Dims{ + {ID: "decr_hits", Name: "hits", Algo: module.PercentOfAbsolute}, + {ID: "decr_misses", Name: "misses", Algo: module.PercentOfAbsolute}, + }, + } + touchChart = module.Chart{ + ID: "touch", + Title: "Touch Requests", + Units: "requests", + Fam: "touch ops", + Ctx: "memcached.touch", + Type: module.Stacked, + Priority: prioTouch, + Dims: module.Dims{ + {ID: "touch_hits", Name: "hits", Algo: module.PercentOfAbsolute}, + {ID: "touch_misses", Name: "misses", Algo: module.PercentOfAbsolute}, + }, + } + touchRateChart = module.Chart{ + ID: "touch_rate", + Title: "Touch Requests Rate", + Units: "requests/s", + Fam: "touch ops", + Ctx: "memcached.touch_rate", + Type: module.Line, + Priority: prioTouchRate, + Dims: module.Dims{ + {ID: "cmd_touch", Name: "rate", Algo: module.Incremental}, + }, + } +) diff --git a/src/go/plugin/go.d/modules/memcached/client.go b/src/go/plugin/go.d/modules/memcached/client.go new file mode 100644 index 000000000..679e3eb0f --- /dev/null +++ b/src/go/plugin/go.d/modules/memcached/client.go @@ -0,0 +1,45 @@ +// SPDX-License-Identifier: GPL-3.0-or-later + +package memcached + +import ( + "bytes" + "strings" + + "github.com/netdata/netdata/go/plugins/plugin/go.d/pkg/socket" +) + +func newMemcachedConn(conf Config) memcachedConn { + return &memcachedClient{conn: socket.New(socket.Config{ + Address: conf.Address, + ConnectTimeout: conf.Timeout.Duration(), + ReadTimeout: conf.Timeout.Duration(), + WriteTimeout: conf.Timeout.Duration(), + })} +} + +type memcachedClient struct { + conn socket.Client +} + +func (c *memcachedClient) connect() error { + return c.conn.Connect() +} + +func (c *memcachedClient) disconnect() { + _ = c.conn.Disconnect() +} + +func (c *memcachedClient) queryStats() ([]byte, error) { + var b bytes.Buffer + err := c.conn.Command("stats\r\n", func(bytes []byte) bool { + s := strings.TrimSpace(string(bytes)) + b.WriteString(s) + b.WriteByte('\n') + return !(strings.HasPrefix(s, "END") || strings.HasPrefix(s, "ERROR")) + }) + if err != nil { + return nil, err + } + return b.Bytes(), nil +} diff --git a/src/go/plugin/go.d/modules/memcached/collect.go b/src/go/plugin/go.d/modules/memcached/collect.go new file mode 100644 index 000000000..9ead8f47b --- /dev/null +++ b/src/go/plugin/go.d/modules/memcached/collect.go @@ -0,0 +1,121 @@ +// SPDX-License-Identifier: GPL-3.0-or-later + +package memcached + +import ( + "bufio" + "bytes" + "errors" + "strconv" + "strings" +) + +// https://github.com/memcached/memcached/blob/b1aefcdf8a265f8a5126e8aa107a50988fa1ec35/doc/protocol.txt#L1267 +var statsMetrics = map[string]bool{ + "limit_maxbytes": true, + "bytes": true, + "bytes_read": true, + "bytes_written": true, + "cas_badval": true, + "cas_hits": true, + "cas_misses": true, + "cmd_get": true, + "cmd_set": true, + "cmd_touch": true, + "curr_connections": true, + "curr_items": true, + "decr_hits": true, + "decr_misses": true, + "delete_hits": true, + "delete_misses": true, + "evictions": true, + "get_hits": true, + "get_misses": true, + "incr_hits": true, + "incr_misses": true, + "reclaimed": true, + "rejected_connections": true, + "total_connections": true, + "total_items": true, + "touch_hits": true, + "touch_misses": true, +} + +func (m *Memcached) collect() (map[string]int64, error) { + if m.conn == nil { + conn, err := m.establishConn() + if err != nil { + return nil, err + } + m.conn = conn + } + + stats, err := m.conn.queryStats() + if err != nil { + m.conn.disconnect() + m.conn = nil + return nil, err + } + + mx := make(map[string]int64) + + if err := m.collectStats(mx, stats); err != nil { + return nil, err + } + + return mx, nil +} + +func (m *Memcached) collectStats(mx map[string]int64, stats []byte) error { + if len(stats) == 0 { + return errors.New("empty stats response") + } + + var n int + sc := bufio.NewScanner(bytes.NewReader(stats)) + + for sc.Scan() { + line := strings.TrimSpace(sc.Text()) + + switch { + case strings.HasPrefix(line, "STAT"): + key, value := getStatKeyValue(line) + if !statsMetrics[key] { + continue + } + if v, err := strconv.ParseInt(value, 10, 64); err == nil { + mx[key] = v + n++ + } + case strings.HasPrefix(line, "ERROR"): + return errors.New("received ERROR response") + } + } + + if n == 0 { + return errors.New("unexpected memcached response") + } + + mx["avail"] = mx["limit_maxbytes"] - mx["bytes"] + + return nil +} + +func (m *Memcached) establishConn() (memcachedConn, error) { + conn := m.newMemcachedConn(m.Config) + + if err := conn.connect(); err != nil { + return nil, err + } + + return conn, nil +} + +func getStatKeyValue(line string) (string, string) { + line = strings.TrimPrefix(line, "STAT ") + i := strings.IndexByte(line, ' ') + if i < 0 { + return "", "" + } + return line[:i], line[i+1:] +} diff --git a/src/go/plugin/go.d/modules/memcached/config_schema.json b/src/go/plugin/go.d/modules/memcached/config_schema.json new file mode 100644 index 000000000..f92a8eee9 --- /dev/null +++ b/src/go/plugin/go.d/modules/memcached/config_schema.json @@ -0,0 +1,44 @@ +{ + "jsonSchema": { + "$schema": "http://json-schema.org/draft-07/schema#", + "title": "Memcached collector configuration.", + "type": "object", + "properties": { + "update_every": { + "title": "Update every", + "description": "Data collection interval, measured in seconds.", + "type": "integer", + "minimum": 1, + "default": 1 + }, + "address": { + "title": "Address", + "description": "The IP address and port where the memcached service listens for connections.", + "type": "string", + "default": "127.0.0.1:11211" + }, + "timeout": { + "title": "Timeout", + "description": "Timeout for establishing a connection and communication (reading and writing) in seconds.", + "type": "number", + "minimum": 0.5, + "default": 1 + } + }, + "required": [ + "address" + ], + "additionalProperties": false, + "patternProperties": { + "^name$": {} + } + }, + "uiSchema": { + "uiOptions": { + "fullPage": true + }, + "timeout": { + "ui:help": "Accepts decimals for precise control (e.g., type 1.5 for 1.5 seconds)." + } + } +}
\ No newline at end of file diff --git a/src/collectors/python.d.plugin/memcached/integrations/memcached.md b/src/go/plugin/go.d/modules/memcached/integrations/memcached.md index 5e813eac2..1e653902f 100644 --- a/src/collectors/python.d.plugin/memcached/integrations/memcached.md +++ b/src/go/plugin/go.d/modules/memcached/integrations/memcached.md @@ -1,6 +1,6 @@ <!--startmeta -custom_edit_url: "https://github.com/netdata/netdata/edit/master/src/collectors/python.d.plugin/memcached/README.md" -meta_yaml: "https://github.com/netdata/netdata/edit/master/src/collectors/python.d.plugin/memcached/metadata.yaml" +custom_edit_url: "https://github.com/netdata/netdata/edit/master/src/go/plugin/go.d/modules/memcached/README.md" +meta_yaml: "https://github.com/netdata/netdata/edit/master/src/go/plugin/go.d/modules/memcached/metadata.yaml" sidebar_label: "Memcached" learn_status: "Published" learn_rel_path: "Collecting Metrics/Databases" @@ -14,7 +14,7 @@ endmeta--> <img src="https://netdata.cloud/img/memcached.svg" width="150"/> -Plugin: python.d.plugin +Plugin: go.d.plugin Module: memcached <img src="https://img.shields.io/badge/maintained%20by-Netdata-%2300ab44" /> @@ -23,7 +23,7 @@ Module: memcached Monitor Memcached metrics for proficient in-memory key-value store operations. Track cache hits, misses, and memory usage for efficient data caching. -It reads server response to stats command ([stats interface](https://github.com/memcached/memcached/wiki/Commands#stats)). +It reads the server's response to the `stats` command. This collector is supported on all platforms. @@ -103,7 +103,7 @@ No action required. #### File -The configuration file name for this integration is `python.d/memcached.conf`. +The configuration file name for this integration is `go.d/memcached.conf`. You can edit the configuration file using the `edit-config` script from the @@ -111,75 +111,56 @@ Netdata [config directory](/docs/netdata-agent/configuration/README.md#the-netda ```bash cd /etc/netdata 2>/dev/null || cd /opt/netdata/etc/netdata -sudo ./edit-config python.d/memcached.conf +sudo ./edit-config go.d/memcached.conf ``` #### Options -There are 2 sections: - -* Global variables -* One or more JOBS that can define multiple different instances to monitor. - -The following options can be defined globally: priority, penalty, autodetection_retry, update_every, but can also be defined per JOB to override the global values. - -Additionally, the following collapsed table contains all the options that can be configured inside a JOB definition. - -Every configuration JOB starts with a `job_name` value which will appear in the dashboard, unless a `name` parameter is specified. +The following options can be defined globally: update_every, autodetection_retry. <details open><summary>Config options</summary> | Name | Description | Default | Required | |:----|:-----------|:-------|:--------:| -| host | the host to connect to. | 127.0.0.1 | no | -| port | the port to connect to. | 11211 | no | -| update_every | Sets the default data collection frequency. | 10 | no | -| priority | Controls the order of charts at the netdata dashboard. | 60000 | no | -| autodetection_retry | Sets the job re-check interval in seconds. | 0 | no | -| penalty | Indicates whether to apply penalty to update_every in case of failures. | yes | no | -| name | Job name. This value will overwrite the `job_name` value. JOBS with the same name are mutually exclusive. Only one of them will be allowed running at any time. This allows autodetection to try several alternatives and pick the one that works. | | no | +| update_every | Data collection frequency. | 1 | no | +| autodetection_retry | Recheck interval in seconds. Zero means no recheck will be scheduled. | 0 | no | +| address | The IP address and port where the memcached service listens for connections. | 127.0.0.1:11211 | yes | +| timeout | Connection, read, and write timeout duration in seconds. The timeout includes name resolution. | 1 | no | </details> #### Examples -##### localhost - -An example configuration for localhost. - -```yaml -localhost: - name: 'local' - host: 'localhost' - port: 11211 - -``` -##### localipv4 +##### Basic -An example configuration for localipv4. +A basic example configuration. <details open><summary>Config</summary> ```yaml -localhost: - name: 'local' - host: '127.0.0.1' - port: 11211 +jobs: + - name: local + address: 127.0.0.1:11211 ``` </details> -##### localipv6 +##### Multi-instance + +> **Note**: When you define multiple jobs, their names must be unique. + +Collecting metrics from local and remote instances. -An example configuration for localipv6. <details open><summary>Config</summary> ```yaml -localhost: - name: 'local' - host: '::1' - port: 11211 +jobs: + - name: local + address: 127.0.0.1:11211 + + - name: remote + address: 203.0.113.0:11211 ``` </details> @@ -190,7 +171,9 @@ localhost: ### Debug Mode -To troubleshoot issues with the `memcached` collector, run the `python.d.plugin` with the debug option enabled. The output +**Important**: Debug mode is not supported for data collection jobs created via the UI using the Dyncfg feature. + +To troubleshoot issues with the `memcached` collector, run the `go.d.plugin` with the debug option enabled. The output should give you clues as to why the collector isn't working. - Navigate to the `plugins.d` directory, usually at `/usr/libexec/netdata/plugins.d/`. If that's not the case on @@ -206,10 +189,43 @@ should give you clues as to why the collector isn't working. sudo -u netdata -s ``` -- Run the `python.d.plugin` to debug the collector: +- Run the `go.d.plugin` to debug the collector: ```bash - ./python.d.plugin memcached debug trace + ./go.d.plugin -d -m memcached ``` +### Getting Logs + +If you're encountering problems with the `memcached` collector, follow these steps to retrieve logs and identify potential issues: + +- **Run the command** specific to your system (systemd, non-systemd, or Docker container). +- **Examine the output** for any warnings or error messages that might indicate issues. These messages should provide clues about the root cause of the problem. + +#### System with systemd + +Use the following command to view logs generated since the last Netdata service restart: + +```bash +journalctl _SYSTEMD_INVOCATION_ID="$(systemctl show --value --property=InvocationID netdata)" --namespace=netdata --grep memcached +``` + +#### System without systemd + +Locate the collector log file, typically at `/var/log/netdata/collector.log`, and use `grep` to filter for collector's name: + +```bash +grep memcached /var/log/netdata/collector.log +``` + +**Note**: This method shows logs from all restarts. Focus on the **latest entries** for troubleshooting current issues. + +#### Docker Container + +If your Netdata runs in a Docker container named "netdata" (replace if different), use this command: + +```bash +docker logs netdata 2>&1 | grep memcached +``` + diff --git a/src/go/plugin/go.d/modules/memcached/memcached.go b/src/go/plugin/go.d/modules/memcached/memcached.go new file mode 100644 index 000000000..bd6039aee --- /dev/null +++ b/src/go/plugin/go.d/modules/memcached/memcached.go @@ -0,0 +1,108 @@ +// SPDX-License-Identifier: GPL-3.0-or-later + +package memcached + +import ( + _ "embed" + "errors" + "time" + + "github.com/netdata/netdata/go/plugins/plugin/go.d/agent/module" + "github.com/netdata/netdata/go/plugins/plugin/go.d/pkg/web" +) + +//go:embed "config_schema.json" +var configSchema string + +func init() { + module.Register("memcached", module.Creator{ + JobConfigSchema: configSchema, + Create: func() module.Module { return New() }, + Config: func() any { return &Config{} }, + }) +} + +func New() *Memcached { + return &Memcached{ + Config: Config{ + Address: "127.0.0.1:11211", + Timeout: web.Duration(time.Second * 1), + }, + newMemcachedConn: newMemcachedConn, + charts: charts.Copy(), + } +} + +type Config struct { + UpdateEvery int `yaml:"update_every,omitempty" json:"update_every"` + Address string `yaml:"address" json:"address"` + Timeout web.Duration `yaml:"timeout" json:"timeout"` +} + +type ( + Memcached struct { + module.Base + Config `yaml:",inline" json:""` + + charts *module.Charts + + newMemcachedConn func(Config) memcachedConn + conn memcachedConn + } + memcachedConn interface { + connect() error + disconnect() + queryStats() ([]byte, error) + } +) + +func (m *Memcached) Configuration() any { + return m.Config +} + +func (m *Memcached) Init() error { + if m.Address == "" { + m.Error("config: 'address' not set") + return errors.New("address not set") + } + + return nil +} + +func (m *Memcached) Check() error { + mx, err := m.collect() + if err != nil { + m.Error(err) + return err + } + + if len(mx) == 0 { + return errors.New("no metrics collected") + } + + return nil +} + +func (m *Memcached) Charts() *module.Charts { + return m.charts +} + +func (m *Memcached) Collect() map[string]int64 { + mx, err := m.collect() + if err != nil { + m.Error(err) + } + + if len(mx) == 0 { + return nil + } + + return mx +} + +func (m *Memcached) Cleanup() { + if m.conn != nil { + m.conn.disconnect() + m.conn = nil + } +} diff --git a/src/go/plugin/go.d/modules/memcached/memcached_test.go b/src/go/plugin/go.d/modules/memcached/memcached_test.go new file mode 100644 index 000000000..33a85d330 --- /dev/null +++ b/src/go/plugin/go.d/modules/memcached/memcached_test.go @@ -0,0 +1,296 @@ +// SPDX-License-Identifier: GPL-3.0-or-later + +package memcached + +import ( + "errors" + "os" + "testing" + + "github.com/netdata/netdata/go/plugins/plugin/go.d/agent/module" + + "github.com/stretchr/testify/assert" + "github.com/stretchr/testify/require" +) + +var ( + dataConfigJSON, _ = os.ReadFile("testdata/config.json") + dataConfigYAML, _ = os.ReadFile("testdata/config.yaml") + + dataMemcachedStats, _ = os.ReadFile("testdata/stats.txt") +) + +func Test_testDataIsValid(t *testing.T) { + for name, data := range map[string][]byte{ + "dataConfigJSON": dataConfigJSON, + "dataConfigYAML": dataConfigYAML, + + "dataMemcachedStats": dataMemcachedStats, + } { + require.NotNil(t, data, name) + } +} + +func TestMemcached_ConfigurationSerialize(t *testing.T) { + module.TestConfigurationSerialize(t, &Memcached{}, dataConfigJSON, dataConfigYAML) +} + +func TestMemcached_Init(t *testing.T) { + tests := map[string]struct { + config Config + wantFail bool + }{ + "success with default config": { + wantFail: false, + config: New().Config, + }, + "fails if address not set": { + wantFail: true, + config: func() Config { + conf := New().Config + conf.Address = "" + return conf + }(), + }, + } + + for name, test := range tests { + t.Run(name, func(t *testing.T) { + mem := New() + mem.Config = test.config + + if test.wantFail { + assert.Error(t, mem.Init()) + } else { + assert.NoError(t, mem.Init()) + } + }) + } +} + +func TestMemcached_Cleanup(t *testing.T) { + tests := map[string]struct { + prepare func() *Memcached + }{ + "not initialized": { + prepare: func() *Memcached { + return New() + }, + }, + "after check": { + prepare: func() *Memcached { + mem := New() + mem.newMemcachedConn = func(config Config) memcachedConn { return prepareMockOk() } + _ = mem.Check() + return mem + }, + }, + "after collect": { + prepare: func() *Memcached { + mem := New() + mem.newMemcachedConn = func(config Config) memcachedConn { return prepareMockOk() } + _ = mem.Collect() + return mem + }, + }, + } + + for name, test := range tests { + t.Run(name, func(t *testing.T) { + mem := test.prepare() + + assert.NotPanics(t, mem.Cleanup) + }) + } +} + +func TestMemcached_Charts(t *testing.T) { + assert.NotNil(t, New().Charts()) +} + +func TestMemcached_Check(t *testing.T) { + tests := map[string]struct { + prepareMock func() *mockMemcachedConn + wantFail bool + }{ + "success case": { + wantFail: false, + prepareMock: prepareMockOk, + }, + "err on connect": { + wantFail: true, + prepareMock: prepareMockErrOnConnect, + }, + "unexpected response": { + wantFail: true, + prepareMock: prepareMockUnexpectedResponse, + }, + "empty response": { + wantFail: true, + prepareMock: prepareMockEmptyResponse, + }, + } + + for name, test := range tests { + t.Run(name, func(t *testing.T) { + mem := New() + mock := test.prepareMock() + mem.newMemcachedConn = func(config Config) memcachedConn { return mock } + + if test.wantFail { + assert.Error(t, mem.Check()) + } else { + assert.NoError(t, mem.Check()) + } + }) + } +} + +func TestMemcached_Collect(t *testing.T) { + tests := map[string]struct { + prepareMock func() *mockMemcachedConn + wantMetrics map[string]int64 + disconnectBeforeCleanup bool + disconnectAfterCleanup bool + }{ + "success case": { + prepareMock: prepareMockOk, + disconnectBeforeCleanup: false, + disconnectAfterCleanup: true, + wantMetrics: map[string]int64{ + "avail": 67108831, + "bytes": 33, + "bytes_read": 108662, + "bytes_written": 9761348, + "cas_badval": 0, + "cas_hits": 0, + "cas_misses": 0, + "cmd_get": 1, + "cmd_set": 1, + "cmd_touch": 0, + "curr_connections": 3, + "curr_items": 0, + "decr_hits": 0, + "decr_misses": 0, + "delete_hits": 0, + "delete_misses": 0, + "evictions": 0, + "get_hits": 0, + "get_misses": 1, + "incr_hits": 0, + "incr_misses": 0, + "limit_maxbytes": 67108864, + "reclaimed": 1, + "rejected_connections": 0, + "total_connections": 39, + "total_items": 1, + "touch_hits": 0, + "touch_misses": 0, + }, + }, + "error response": { + prepareMock: prepareMockErrorResponse, + disconnectBeforeCleanup: false, + disconnectAfterCleanup: true, + }, + "unexpected response": { + prepareMock: prepareMockUnexpectedResponse, + disconnectBeforeCleanup: false, + disconnectAfterCleanup: true, + }, + "empty response": { + prepareMock: prepareMockEmptyResponse, + disconnectBeforeCleanup: false, + disconnectAfterCleanup: true, + }, + "err on connect": { + prepareMock: prepareMockErrOnConnect, + disconnectBeforeCleanup: false, + disconnectAfterCleanup: false, + }, + "err on query stats": { + prepareMock: prepareMockErrOnQueryStats, + disconnectBeforeCleanup: true, + disconnectAfterCleanup: true, + }, + } + + for name, test := range tests { + t.Run(name, func(t *testing.T) { + mem := New() + mock := test.prepareMock() + mem.newMemcachedConn = func(config Config) memcachedConn { return mock } + + mx := mem.Collect() + + require.Equal(t, test.wantMetrics, mx) + + if len(test.wantMetrics) > 0 { + module.TestMetricsHasAllChartsDims(t, mem.Charts(), mx) + } + + assert.Equal(t, test.disconnectBeforeCleanup, mock.disconnectCalled, "disconnect before cleanup") + mem.Cleanup() + assert.Equal(t, test.disconnectAfterCleanup, mock.disconnectCalled, "disconnect after cleanup") + }) + } +} + +func prepareMockOk() *mockMemcachedConn { + return &mockMemcachedConn{ + statsResponse: dataMemcachedStats, + } +} + +func prepareMockErrorResponse() *mockMemcachedConn { + return &mockMemcachedConn{ + statsResponse: []byte("ERROR"), + } +} + +func prepareMockErrOnConnect() *mockMemcachedConn { + return &mockMemcachedConn{ + errOnConnect: true, + } +} + +func prepareMockErrOnQueryStats() *mockMemcachedConn { + return &mockMemcachedConn{ + errOnQueryStats: true, + } +} + +func prepareMockUnexpectedResponse() *mockMemcachedConn { + return &mockMemcachedConn{ + statsResponse: []byte("Lorem ipsum dolor sit amet, consectetur adipiscing elit."), + } +} + +func prepareMockEmptyResponse() *mockMemcachedConn { + return &mockMemcachedConn{} +} + +type mockMemcachedConn struct { + errOnConnect bool + errOnQueryStats bool + statsResponse []byte + disconnectCalled bool +} + +func (m *mockMemcachedConn) connect() error { + if m.errOnConnect { + return errors.New("mock.connect() error") + } + return nil +} + +func (m *mockMemcachedConn) disconnect() { + m.disconnectCalled = true +} + +func (m *mockMemcachedConn) queryStats() ([]byte, error) { + if m.errOnQueryStats { + return nil, errors.New("mock.queryStats() error") + } + return m.statsResponse, nil +} diff --git a/src/collectors/python.d.plugin/memcached/metadata.yaml b/src/go/plugin/go.d/modules/memcached/metadata.yaml index ae420f1c1..c307ef018 100644 --- a/src/collectors/python.d.plugin/memcached/metadata.yaml +++ b/src/go/plugin/go.d/modules/memcached/metadata.yaml @@ -1,7 +1,8 @@ -plugin_name: python.d.plugin +plugin_name: go.d.plugin modules: - meta: - plugin_name: python.d.plugin + id: collector-go.d.plugin-memcached + plugin_name: go.d.plugin module_name: memcached monitored_instance: name: Memcached @@ -23,7 +24,7 @@ modules: overview: data_collection: metrics_description: "Monitor Memcached metrics for proficient in-memory key-value store operations. Track cache hits, misses, and memory usage for efficient data caching." - method_description: "It reads server response to stats command ([stats interface](https://github.com/memcached/memcached/wiki/Commands#stats))." + method_description: "It reads the server's response to the `stats` command." supported_platforms: include: [] exclude: [] @@ -43,84 +44,53 @@ modules: list: [] configuration: file: - name: python.d/memcached.conf - description: "" + name: go.d/memcached.conf options: description: | - There are 2 sections: - - * Global variables - * One or more JOBS that can define multiple different instances to monitor. - - The following options can be defined globally: priority, penalty, autodetection_retry, update_every, but can also be defined per JOB to override the global values. - - Additionally, the following collapsed table contains all the options that can be configured inside a JOB definition. - - Every configuration JOB starts with a `job_name` value which will appear in the dashboard, unless a `name` parameter is specified. + The following options can be defined globally: update_every, autodetection_retry. folding: title: Config options enabled: true list: - - name: host - description: the host to connect to. - default_value: "127.0.0.1" - required: false - - name: port - description: the port to connect to. - default_value: "11211" - required: false - name: update_every - description: Sets the default data collection frequency. - default_value: 10 - required: false - - name: priority - description: Controls the order of charts at the netdata dashboard. - default_value: 60000 + description: Data collection frequency. + default_value: 1 required: false - name: autodetection_retry - description: Sets the job re-check interval in seconds. + description: Recheck interval in seconds. Zero means no recheck will be scheduled. default_value: 0 required: false - - name: penalty - description: Indicates whether to apply penalty to update_every in case of failures. - default_value: yes - required: false - - name: name - description: Job name. This value will overwrite the `job_name` value. JOBS with the same name are mutually exclusive. Only one of them will be allowed running at any time. This allows autodetection to try several alternatives and pick the one that works. - default_value: "" + - name: address + description: The IP address and port where the memcached service listens for connections. + default_value: 127.0.0.1:11211 + required: true + - name: timeout + description: Connection, read, and write timeout duration in seconds. The timeout includes name resolution. + default_value: 1 required: false examples: folding: + title: Config enabled: true - title: "Config" list: - - name: localhost - description: An example configuration for localhost. - folding: - enabled: false - config: | - localhost: - name: 'local' - host: 'localhost' - port: 11211 - - name: localipv4 - description: An example configuration for localipv4. - folding: - enabled: true + - name: Basic + description: A basic example configuration. config: | - localhost: - name: 'local' - host: '127.0.0.1' - port: 11211 - - name: localipv6 - description: An example configuration for localipv6. - folding: - enabled: true + jobs: + - name: local + address: 127.0.0.1:11211 + - name: Multi-instance + description: | + > **Note**: When you define multiple jobs, their names must be unique. + + Collecting metrics from local and remote instances. config: | - localhost: - name: 'local' - host: '::1' - port: 11211 + jobs: + - name: local + address: 127.0.0.1:11211 + + - name: remote + address: 203.0.113.0:11211 troubleshooting: problems: list: [] diff --git a/src/go/plugin/go.d/modules/memcached/testdata/config.json b/src/go/plugin/go.d/modules/memcached/testdata/config.json new file mode 100644 index 000000000..e86834720 --- /dev/null +++ b/src/go/plugin/go.d/modules/memcached/testdata/config.json @@ -0,0 +1,5 @@ +{ + "update_every": 123, + "address": "ok", + "timeout": 123.123 +} diff --git a/src/go/plugin/go.d/modules/memcached/testdata/config.yaml b/src/go/plugin/go.d/modules/memcached/testdata/config.yaml new file mode 100644 index 000000000..1b81d09eb --- /dev/null +++ b/src/go/plugin/go.d/modules/memcached/testdata/config.yaml @@ -0,0 +1,3 @@ +update_every: 123 +address: "ok" +timeout: 123.123 diff --git a/src/go/plugin/go.d/modules/memcached/testdata/stats.txt b/src/go/plugin/go.d/modules/memcached/testdata/stats.txt new file mode 100644 index 000000000..b9647cc1d --- /dev/null +++ b/src/go/plugin/go.d/modules/memcached/testdata/stats.txt @@ -0,0 +1,93 @@ +STAT pid 30783 +STAT uptime 5028 +STAT time 1721297802 +STAT version 1.6.24 +STAT libevent 2.1.12-stable +STAT pointer_size 64 +STAT rusage_user 1.026626 +STAT rusage_system 0.685365 +STAT max_connections 1024 +STAT curr_connections 3 +STAT total_connections 39 +STAT rejected_connections 0 +STAT connection_structures 6 +STAT response_obj_oom 0 +STAT response_obj_count 1 +STAT response_obj_bytes 65536 +STAT read_buf_count 9 +STAT read_buf_bytes 147456 +STAT read_buf_bytes_free 65536 +STAT read_buf_oom 0 +STAT reserved_fds 20 +STAT cmd_get 1 +STAT cmd_set 1 +STAT cmd_flush 0 +STAT cmd_touch 0 +STAT cmd_meta 0 +STAT get_hits 0 +STAT get_misses 1 +STAT get_expired 0 +STAT get_flushed 0 +STAT delete_misses 0 +STAT delete_hits 0 +STAT incr_misses 0 +STAT incr_hits 0 +STAT decr_misses 0 +STAT decr_hits 0 +STAT cas_misses 0 +STAT cas_hits 0 +STAT cas_badval 0 +STAT touch_hits 0 +STAT touch_misses 0 +STAT store_too_large 0 +STAT store_no_memory 0 +STAT auth_cmds 0 +STAT auth_errors 0 +STAT bytes_read 108662 +STAT bytes_written 9761348 +STAT limit_maxbytes 67108864 +STAT accepting_conns 1 +STAT listen_disabled_num 0 +STAT time_in_listen_disabled_us 0 +STAT threads 4 +STAT conn_yields 0 +STAT hash_power_level 16 +STAT hash_bytes 524288 +STAT hash_is_expanding 0 +STAT slab_reassign_rescues 0 +STAT slab_reassign_chunk_rescues 0 +STAT slab_reassign_evictions_nomem 0 +STAT slab_reassign_inline_reclaim 0 +STAT slab_reassign_busy_items 0 +STAT slab_reassign_busy_deletes 0 +STAT slab_reassign_running 0 +STAT slabs_moved 0 +STAT lru_crawler_running 0 +STAT lru_crawler_starts 13 +STAT lru_maintainer_juggles 9280 +STAT malloc_fails 0 +STAT log_worker_dropped 0 +STAT log_worker_written 0 +STAT log_watcher_skipped 0 +STAT log_watcher_sent 0 +STAT log_watchers 0 +STAT unexpected_napi_ids 0 +STAT round_robin_fallback 0 +STAT bytes 33 +STAT curr_items 0 +STAT total_items 1 +STAT slab_global_page_pool 0 +STAT expired_unfetched 1 +STAT evicted_unfetched 0 +STAT evicted_active 0 +STAT evictions 0 +STAT reclaimed 1 +STAT crawler_reclaimed 0 +STAT crawler_items_checked 0 +STAT lrutail_reflocked 0 +STAT moves_to_cold 1 +STAT moves_to_warm 0 +STAT moves_within_lru 0 +STAT direct_reclaims 0 +STAT lru_bumps_dropped 0 +END diff --git a/src/go/collectors/go.d.plugin/modules/mongodb/README.md b/src/go/plugin/go.d/modules/mongodb/README.md index a28253054..a28253054 120000 --- a/src/go/collectors/go.d.plugin/modules/mongodb/README.md +++ b/src/go/plugin/go.d/modules/mongodb/README.md diff --git a/src/go/collectors/go.d.plugin/modules/mongodb/charts.go b/src/go/plugin/go.d/modules/mongodb/charts.go index f1b9c1a07..af9dfcefc 100644 --- a/src/go/collectors/go.d.plugin/modules/mongodb/charts.go +++ b/src/go/plugin/go.d/modules/mongodb/charts.go @@ -3,7 +3,7 @@ package mongo import ( - "github.com/netdata/netdata/go/go.d.plugin/agent/module" + "github.com/netdata/netdata/go/plugins/plugin/go.d/agent/module" ) const ( diff --git a/src/go/collectors/go.d.plugin/modules/mongodb/client.go b/src/go/plugin/go.d/modules/mongodb/client.go index eb36fa8ac..eb36fa8ac 100644 --- a/src/go/collectors/go.d.plugin/modules/mongodb/client.go +++ b/src/go/plugin/go.d/modules/mongodb/client.go diff --git a/src/go/collectors/go.d.plugin/modules/mongodb/collect.go b/src/go/plugin/go.d/modules/mongodb/collect.go index 232145de3..232145de3 100644 --- a/src/go/collectors/go.d.plugin/modules/mongodb/collect.go +++ b/src/go/plugin/go.d/modules/mongodb/collect.go diff --git a/src/go/collectors/go.d.plugin/modules/mongodb/collect_dbstats.go b/src/go/plugin/go.d/modules/mongodb/collect_dbstats.go index edd7077e1..3a20bee7f 100644 --- a/src/go/collectors/go.d.plugin/modules/mongodb/collect_dbstats.go +++ b/src/go/plugin/go.d/modules/mongodb/collect_dbstats.go @@ -6,7 +6,7 @@ import ( "fmt" "strings" - "github.com/netdata/netdata/go/go.d.plugin/agent/module" + "github.com/netdata/netdata/go/plugins/plugin/go.d/agent/module" ) func (m *Mongo) collectDbStats(mx map[string]int64) error { diff --git a/src/go/collectors/go.d.plugin/modules/mongodb/collect_replsetgetstatus.go b/src/go/plugin/go.d/modules/mongodb/collect_replsetgetstatus.go index 235e8900e..43d4168db 100644 --- a/src/go/collectors/go.d.plugin/modules/mongodb/collect_replsetgetstatus.go +++ b/src/go/plugin/go.d/modules/mongodb/collect_replsetgetstatus.go @@ -6,7 +6,7 @@ import ( "fmt" "strings" - "github.com/netdata/netdata/go/go.d.plugin/agent/module" + "github.com/netdata/netdata/go/plugins/plugin/go.d/agent/module" ) // https://www.mongodb.com/docs/manual/reference/replica-states/#replica-set-member-states diff --git a/src/go/collectors/go.d.plugin/modules/mongodb/collect_serverstatus.go b/src/go/plugin/go.d/modules/mongodb/collect_serverstatus.go index 33fd86b76..861726386 100644 --- a/src/go/collectors/go.d.plugin/modules/mongodb/collect_serverstatus.go +++ b/src/go/plugin/go.d/modules/mongodb/collect_serverstatus.go @@ -6,8 +6,8 @@ import ( "fmt" "reflect" - "github.com/netdata/netdata/go/go.d.plugin/agent/module" - "github.com/netdata/netdata/go/go.d.plugin/pkg/stm" + "github.com/netdata/netdata/go/plugins/plugin/go.d/agent/module" + "github.com/netdata/netdata/go/plugins/plugin/go.d/pkg/stm" ) // collectServerStatus creates the map[string]int64 for the available dims. diff --git a/src/go/collectors/go.d.plugin/modules/mongodb/collect_sharding.go b/src/go/plugin/go.d/modules/mongodb/collect_sharding.go index 175004d34..43e9ae8bd 100644 --- a/src/go/collectors/go.d.plugin/modules/mongodb/collect_sharding.go +++ b/src/go/plugin/go.d/modules/mongodb/collect_sharding.go @@ -6,7 +6,7 @@ import ( "fmt" "strings" - "github.com/netdata/netdata/go/go.d.plugin/agent/module" + "github.com/netdata/netdata/go/plugins/plugin/go.d/agent/module" ) func (m *Mongo) collectSharding(mx map[string]int64) error { diff --git a/src/go/collectors/go.d.plugin/modules/mongodb/config_schema.json b/src/go/plugin/go.d/modules/mongodb/config_schema.json index 406468189..fc5c42eff 100644 --- a/src/go/collectors/go.d.plugin/modules/mongodb/config_schema.json +++ b/src/go/plugin/go.d/modules/mongodb/config_schema.json @@ -34,7 +34,7 @@ "properties": { "includes": { "title": "Include", - "description": "Include databases that match any of the specified include [patterns](https://github.com/netdata/netdata/tree/master/src/go/collectors/go.d.plugin/pkg/matcher#readme).", + "description": "Include databases that match any of the specified include [patterns](https://github.com/netdata/netdata/tree/master/src/go/plugin/go.d/pkg/matcher#readme).", "type": [ "array", "null" @@ -47,7 +47,7 @@ }, "excludes": { "title": "Exclude", - "description": "Exclude databases that match any of the specified exclude [patterns](https://github.com/netdata/netdata/tree/master/src/go/collectors/go.d.plugin/pkg/matcher#readme).", + "description": "Exclude databases that match any of the specified exclude [patterns](https://github.com/netdata/netdata/tree/master/src/go/plugin/go.d/pkg/matcher#readme).", "type": [ "array", "null" diff --git a/src/go/collectors/go.d.plugin/modules/mongodb/documents.go b/src/go/plugin/go.d/modules/mongodb/documents.go index 5c95e952e..5c95e952e 100644 --- a/src/go/collectors/go.d.plugin/modules/mongodb/documents.go +++ b/src/go/plugin/go.d/modules/mongodb/documents.go diff --git a/src/go/collectors/go.d.plugin/modules/mongodb/init.go b/src/go/plugin/go.d/modules/mongodb/init.go index b881e8711..b881e8711 100644 --- a/src/go/collectors/go.d.plugin/modules/mongodb/init.go +++ b/src/go/plugin/go.d/modules/mongodb/init.go diff --git a/src/go/collectors/go.d.plugin/modules/mongodb/integrations/mongodb.md b/src/go/plugin/go.d/modules/mongodb/integrations/mongodb.md index ce72671ce..e47c3865d 100644 --- a/src/go/collectors/go.d.plugin/modules/mongodb/integrations/mongodb.md +++ b/src/go/plugin/go.d/modules/mongodb/integrations/mongodb.md @@ -1,6 +1,6 @@ <!--startmeta -custom_edit_url: "https://github.com/netdata/netdata/edit/master/src/go/collectors/go.d.plugin/modules/mongodb/README.md" -meta_yaml: "https://github.com/netdata/netdata/edit/master/src/go/collectors/go.d.plugin/modules/mongodb/metadata.yaml" +custom_edit_url: "https://github.com/netdata/netdata/edit/master/src/go/plugin/go.d/modules/mongodb/README.md" +meta_yaml: "https://github.com/netdata/netdata/edit/master/src/go/plugin/go.d/modules/mongodb/metadata.yaml" sidebar_label: "MongoDB" learn_status: "Published" learn_rel_path: "Collecting Metrics/Databases" @@ -331,6 +331,8 @@ jobs: ### Debug Mode +**Important**: Debug mode is not supported for data collection jobs created via the UI using the Dyncfg feature. + To troubleshoot issues with the `mongodb` collector, run the `go.d.plugin` with the debug option enabled. The output should give you clues as to why the collector isn't working. @@ -353,4 +355,37 @@ should give you clues as to why the collector isn't working. ./go.d.plugin -d -m mongodb ``` +### Getting Logs + +If you're encountering problems with the `mongodb` collector, follow these steps to retrieve logs and identify potential issues: + +- **Run the command** specific to your system (systemd, non-systemd, or Docker container). +- **Examine the output** for any warnings or error messages that might indicate issues. These messages should provide clues about the root cause of the problem. + +#### System with systemd + +Use the following command to view logs generated since the last Netdata service restart: + +```bash +journalctl _SYSTEMD_INVOCATION_ID="$(systemctl show --value --property=InvocationID netdata)" --namespace=netdata --grep mongodb +``` + +#### System without systemd + +Locate the collector log file, typically at `/var/log/netdata/collector.log`, and use `grep` to filter for collector's name: + +```bash +grep mongodb /var/log/netdata/collector.log +``` + +**Note**: This method shows logs from all restarts. Focus on the **latest entries** for troubleshooting current issues. + +#### Docker Container + +If your Netdata runs in a Docker container named "netdata" (replace if different), use this command: + +```bash +docker logs netdata 2>&1 | grep mongodb +``` + diff --git a/src/go/collectors/go.d.plugin/modules/mongodb/metadata.yaml b/src/go/plugin/go.d/modules/mongodb/metadata.yaml index bad65393d..ae013539f 100644 --- a/src/go/collectors/go.d.plugin/modules/mongodb/metadata.yaml +++ b/src/go/plugin/go.d/modules/mongodb/metadata.yaml @@ -104,7 +104,7 @@ modules: Metrics of databases matching the selector will be collected. - Logic: (pattern1 OR pattern2) AND !(pattern3 or pattern4) - - Pattern syntax: [matcher](https://github.com/netdata/netdata/tree/master/src/go/collectors/go.d.plugin/pkg/matcher#supported-format). + - Pattern syntax: [matcher](https://github.com/netdata/netdata/tree/master/src/go/plugin/go.d/pkg/matcher#supported-format). - Syntax: ```yaml diff --git a/src/go/collectors/go.d.plugin/modules/mongodb/mongodb.go b/src/go/plugin/go.d/modules/mongodb/mongodb.go index edc73f96a..7b8550251 100644 --- a/src/go/collectors/go.d.plugin/modules/mongodb/mongodb.go +++ b/src/go/plugin/go.d/modules/mongodb/mongodb.go @@ -8,9 +8,9 @@ import ( "sync" "time" - "github.com/netdata/netdata/go/go.d.plugin/agent/module" - "github.com/netdata/netdata/go/go.d.plugin/pkg/matcher" - "github.com/netdata/netdata/go/go.d.plugin/pkg/web" + "github.com/netdata/netdata/go/plugins/plugin/go.d/agent/module" + "github.com/netdata/netdata/go/plugins/plugin/go.d/pkg/matcher" + "github.com/netdata/netdata/go/plugins/plugin/go.d/pkg/web" ) //go:embed "config_schema.json" diff --git a/src/go/collectors/go.d.plugin/modules/mongodb/mongodb_test.go b/src/go/plugin/go.d/modules/mongodb/mongodb_test.go index c7cf0f42b..835ea20e2 100644 --- a/src/go/collectors/go.d.plugin/modules/mongodb/mongodb_test.go +++ b/src/go/plugin/go.d/modules/mongodb/mongodb_test.go @@ -9,8 +9,8 @@ import ( "testing" "time" - "github.com/netdata/netdata/go/go.d.plugin/agent/module" - "github.com/netdata/netdata/go/go.d.plugin/pkg/matcher" + "github.com/netdata/netdata/go/plugins/plugin/go.d/agent/module" + "github.com/netdata/netdata/go/plugins/plugin/go.d/pkg/matcher" "github.com/stretchr/testify/assert" "github.com/stretchr/testify/require" diff --git a/src/go/collectors/go.d.plugin/modules/mongodb/testdata/config.json b/src/go/plugin/go.d/modules/mongodb/testdata/config.json index bc3f94d81..bc3f94d81 100644 --- a/src/go/collectors/go.d.plugin/modules/mongodb/testdata/config.json +++ b/src/go/plugin/go.d/modules/mongodb/testdata/config.json diff --git a/src/go/collectors/go.d.plugin/modules/mongodb/testdata/config.yaml b/src/go/plugin/go.d/modules/mongodb/testdata/config.yaml index 03a11029c..03a11029c 100644 --- a/src/go/collectors/go.d.plugin/modules/mongodb/testdata/config.yaml +++ b/src/go/plugin/go.d/modules/mongodb/testdata/config.yaml diff --git a/src/go/collectors/go.d.plugin/modules/mongodb/testdata/v6.0.3/dbStats.json b/src/go/plugin/go.d/modules/mongodb/testdata/v6.0.3/dbStats.json index 52a513203..52a513203 100644 --- a/src/go/collectors/go.d.plugin/modules/mongodb/testdata/v6.0.3/dbStats.json +++ b/src/go/plugin/go.d/modules/mongodb/testdata/v6.0.3/dbStats.json diff --git a/src/go/collectors/go.d.plugin/modules/mongodb/testdata/v6.0.3/mongod-serverStatus.json b/src/go/plugin/go.d/modules/mongodb/testdata/v6.0.3/mongod-serverStatus.json index 77f083923..77f083923 100644 --- a/src/go/collectors/go.d.plugin/modules/mongodb/testdata/v6.0.3/mongod-serverStatus.json +++ b/src/go/plugin/go.d/modules/mongodb/testdata/v6.0.3/mongod-serverStatus.json diff --git a/src/go/collectors/go.d.plugin/modules/mongodb/testdata/v6.0.3/mongos-serverStatus.json b/src/go/plugin/go.d/modules/mongodb/testdata/v6.0.3/mongos-serverStatus.json index ecf766715..ecf766715 100644 --- a/src/go/collectors/go.d.plugin/modules/mongodb/testdata/v6.0.3/mongos-serverStatus.json +++ b/src/go/plugin/go.d/modules/mongodb/testdata/v6.0.3/mongos-serverStatus.json diff --git a/src/go/collectors/go.d.plugin/modules/mongodb/testdata/v6.0.3/replSetGetStatus.json b/src/go/plugin/go.d/modules/mongodb/testdata/v6.0.3/replSetGetStatus.json index c97a77f31..c97a77f31 100644 --- a/src/go/collectors/go.d.plugin/modules/mongodb/testdata/v6.0.3/replSetGetStatus.json +++ b/src/go/plugin/go.d/modules/mongodb/testdata/v6.0.3/replSetGetStatus.json diff --git a/src/collectors/python.d.plugin/monit/README.md b/src/go/plugin/go.d/modules/monit/README.md index ac69496f4..ac69496f4 120000 --- a/src/collectors/python.d.plugin/monit/README.md +++ b/src/go/plugin/go.d/modules/monit/README.md diff --git a/src/go/plugin/go.d/modules/monit/charts.go b/src/go/plugin/go.d/modules/monit/charts.go new file mode 100644 index 000000000..58fcf6c78 --- /dev/null +++ b/src/go/plugin/go.d/modules/monit/charts.go @@ -0,0 +1,91 @@ +// SPDX-License-Identifier: GPL-3.0-or-later + +package monit + +import ( + "fmt" + "strings" + + "github.com/netdata/netdata/go/plugins/plugin/go.d/agent/module" +) + +const ( + prioServiceCheckStatus = module.Priority + iota + prioUptime +) + +var baseCharts = module.Charts{ + uptimeChart.Copy(), +} + +var ( + uptimeChart = module.Chart{ + ID: "uptime", + Title: "Uptime", + Units: "seconds", + Fam: "uptime", + Ctx: "monit.uptime", + Priority: prioUptime, + Dims: module.Dims{ + {ID: "uptime"}, + }, + } +) + +var serviceCheckChartsTmpl = module.Charts{ + serviceCheckStatusChartTmpl.Copy(), +} + +var ( + serviceCheckStatusChartTmpl = module.Chart{ + ID: "service_check_type_%s_name_%s_status", + Title: "Service Check Status", + Units: "status", + Fam: "service status", + Ctx: "monit.service_check_status", + Priority: prioServiceCheckStatus, + Dims: module.Dims{ + {ID: "service_check_type_%s_name_%s_status_ok", Name: "ok"}, + {ID: "service_check_type_%s_name_%s_status_error", Name: "error"}, + {ID: "service_check_type_%s_name_%s_status_initializing", Name: "initializing"}, + {ID: "service_check_type_%s_name_%s_status_not_monitored", Name: "not_monitored"}, + }, + } +) + +func (m *Monit) addServiceCheckCharts(svc statusServiceCheck, srv *statusServer) { + charts := serviceCheckChartsTmpl.Copy() + + for _, chart := range *charts { + chart.ID = cleanChartId(fmt.Sprintf(chart.ID, svc.svcType(), svc.Name)) + chart.Labels = []module.Label{ + {Key: "server_hostname", Value: srv.LocalHostname}, + {Key: "service_check_name", Value: svc.Name}, + {Key: "service_check_type", Value: svc.svcType()}, + } + for _, dim := range chart.Dims { + dim.ID = fmt.Sprintf(dim.ID, svc.svcType(), svc.Name) + } + } + + if err := m.Charts().Add(*charts...); err != nil { + m.Warning(err) + } +} + +func (m *Monit) removeServiceCharts(svc statusServiceCheck) { + px := fmt.Sprintf("service_check_type_%s_name_%s_", svc.svcType(), svc.Name) + px = cleanChartId(px) + + for _, chart := range *m.Charts() { + if strings.HasPrefix(chart.ID, px) { + chart.MarkRemove() + chart.MarkNotCreated() + } + } +} + +func cleanChartId(s string) string { + r := strings.NewReplacer(" ", "_", ".", "_", ",", "_") + return r.Replace(s) +} diff --git a/src/go/plugin/go.d/modules/monit/collect.go b/src/go/plugin/go.d/modules/monit/collect.go new file mode 100644 index 000000000..580aa6d99 --- /dev/null +++ b/src/go/plugin/go.d/modules/monit/collect.go @@ -0,0 +1,117 @@ +// SPDX-License-Identifier: GPL-3.0-or-later + +package monit + +import ( + "encoding/xml" + "errors" + "fmt" + "io" + "net/http" + "net/url" + + "github.com/netdata/netdata/go/plugins/plugin/go.d/pkg/web" + + "golang.org/x/net/html/charset" +) + +var ( + urlPathStatus = "/_status" + urlQueryStatus = url.Values{"format": {"xml"}, "level": {"full"}}.Encode() +) + +func (m *Monit) collect() (map[string]int64, error) { + mx := make(map[string]int64) + + if err := m.collectStatus(mx); err != nil { + return nil, err + } + + return mx, nil +} + +func (m *Monit) collectStatus(mx map[string]int64) error { + status, err := m.fetchStatus() + if err != nil { + return err + } + + if status.Server == nil { + // not Monit + return errors.New("invalid Monit status response: missing server data") + } + + mx["uptime"] = status.Server.Uptime + + seen := make(map[string]bool) + + for _, svc := range status.Services { + seen[svc.id()] = true + + if _, ok := m.seenServices[svc.id()]; !ok { + m.seenServices[svc.id()] = svc + m.addServiceCheckCharts(svc, status.Server) + } + + px := fmt.Sprintf("service_check_type_%s_name_%s_status_", svc.svcType(), svc.Name) + + for _, v := range []string{"not_monitored", "ok", "initializing", "error"} { + mx[px+v] = 0 + if svc.status() == v { + mx[px+v] = 1 + } + } + } + + for id, svc := range m.seenServices { + if !seen[id] { + delete(m.seenServices, id) + m.removeServiceCharts(svc) + } + } + + return nil +} + +func (m *Monit) fetchStatus() (*monitStatus, error) { + req, err := web.NewHTTPRequestWithPath(m.Request, urlPathStatus) + if err != nil { + return nil, err + } + req.URL.RawQuery = urlQueryStatus + + var status monitStatus + if err := m.doOKDecode(req, &status); err != nil { + return nil, err + } + + return &status, nil +} + +func (m *Monit) doOKDecode(req *http.Request, in interface{}) error { + resp, err := m.httpClient.Do(req) + if err != nil { + return fmt.Errorf("error on HTTP request '%s': %v", req.URL, err) + } + defer closeBody(resp) + + if resp.StatusCode != http.StatusOK { + return fmt.Errorf("'%s' returned HTTP status code: %d", req.URL, resp.StatusCode) + } + + dec := xml.NewDecoder(resp.Body) + dec.CharsetReader = charset.NewReaderLabel + + if err := dec.Decode(in); err != nil { + return fmt.Errorf("error on decoding XML response from '%s': %v", req.URL, err) + } + + return nil +} + +func closeBody(resp *http.Response) { + if resp != nil && resp.Body != nil { + _, _ = io.Copy(io.Discard, resp.Body) + _ = resp.Body.Close() + } +} diff --git a/src/go/plugin/go.d/modules/monit/config_schema.json b/src/go/plugin/go.d/modules/monit/config_schema.json new file mode 100644 index 000000000..4d23760b3 --- /dev/null +++ b/src/go/plugin/go.d/modules/monit/config_schema.json @@ -0,0 +1,185 @@ +{ + "jsonSchema": { + "$schema": "http://json-schema.org/draft-07/schema#", + "title": "Monit collector configuration.", + "type": "object", + "properties": { + "update_every": { + "title": "Update every", + "description": "Data collection interval, measured in seconds.", + "type": "integer", + "minimum": 1, + "default": 1 + }, + "url": { + "title": "URL", + "description": "The base URL of the Monit server.", + "type": "string", + "default": "http://127.0.0.1:2812", + "format": "uri" + }, + "timeout": { + "title": "Timeout", + "description": "The timeout in seconds for the HTTP request.", + "type": "number", + "minimum": 0.5, + "default": 1 + }, + "not_follow_redirects": { + "title": "Not follow redirects", + "description": "If set, the client will not follow HTTP redirects automatically.", + "type": "boolean" + }, + "username": { + "title": "Username", + "description": "The username for basic authentication.", + "type": "string", + "sensitive": true, + "default": "admin" + }, + "password": { + "title": "Password", + "description": "The password for basic authentication.", + "type": "string", + "sensitive": true, + "default": "monit" + }, + "proxy_url": { + "title": "Proxy URL", + "description": "The URL of the proxy server.", + "type": "string" + }, + "proxy_username": { + "title": "Proxy username", + "description": "The username for proxy authentication.", + "type": "string", + "sensitive": true + }, + "proxy_password": { + "title": "Proxy password", + "description": "The password for proxy authentication.", + "type": "string", + "sensitive": true + }, + "headers": { + "title": "Headers", + "description": "Additional HTTP headers to include in the request.", + "type": [ + "object", + "null" + ], + "additionalProperties": { + "type": "string" + } + }, + "tls_skip_verify": { + "title": "Skip TLS verification", + "description": "If set, TLS certificate verification will be skipped.", + "type": "boolean" + }, + "tls_ca": { + "title": "TLS CA", + "description": "The path to the CA certificate file for TLS verification.", + "type": "string", + "pattern": "^$|^/" + }, + "tls_cert": { + "title": "TLS certificate", + "description": "The path to the client certificate file for TLS authentication.", + "type": "string", + "pattern": "^$|^/" + }, + "tls_key": { + "title": "TLS key", + "description": "The path to the client key file for TLS authentication.", + "type": "string", + "pattern": "^$|^/" + }, + "body": { + "title": "Body", + "type": "string" + }, + "method": { + "title": "Method", + "type": "string" + } + }, + "required": [ + "url" + ], + "additionalProperties": false, + "patternProperties": { + "^name$": {} + } + }, + "uiSchema": { + "uiOptions": { + "fullPage": true + }, + "body": { + "ui:widget": "hidden" + }, + "method": { + "ui:widget": "hidden" + }, + "timeout": { + "ui:help": "Accepts decimals for precise control (e.g., type 1.5 for 1.5 seconds)." + }, + "username": { + "ui:widget": "password" + }, + "proxy_username": { + "ui:widget": "password" + }, + "password": { + "ui:widget": "password" + }, + "proxy_password": { + "ui:widget": "password" + }, + "ui:flavour": "tabs", + "ui:options": { + "tabs": [ + { + "title": "Base", + "fields": [ + "update_every", + "url", + "timeout", + "not_follow_redirects" + ] + }, + { + "title": "Auth", + "fields": [ + "username", + "password" + ] + }, + { + "title": "TLS", + "fields": [ + "tls_skip_verify", + "tls_ca", + "tls_cert", + "tls_key" + ] + }, + { + "title": "Proxy", + "fields": [ + "proxy_url", + "proxy_username", + "proxy_password" + ] + }, + { + "title": "Headers", + "fields": [ + "headers" + ] + } + ] + } + } +} diff --git a/src/go/plugin/go.d/modules/monit/integrations/monit.md b/src/go/plugin/go.d/modules/monit/integrations/monit.md new file mode 100644 index 000000000..8d3739ac4 --- /dev/null +++ b/src/go/plugin/go.d/modules/monit/integrations/monit.md @@ -0,0 +1,255 @@ +<!--startmeta +custom_edit_url: "https://github.com/netdata/netdata/edit/master/src/go/plugin/go.d/modules/monit/README.md" +meta_yaml: "https://github.com/netdata/netdata/edit/master/src/go/plugin/go.d/modules/monit/metadata.yaml" +sidebar_label: "Monit" +learn_status: "Published" +learn_rel_path: "Collecting Metrics/Synthetic Checks" +most_popular: False +message: "DO NOT EDIT THIS FILE DIRECTLY, IT IS GENERATED BY THE COLLECTOR'S metadata.yaml FILE" +endmeta--> + +# Monit + + +<img src="https://netdata.cloud/img/monit.png" width="150"/> + + +Plugin: go.d.plugin +Module: monit + +<img src="https://img.shields.io/badge/maintained%20by-Netdata-%2300ab44" /> + +## Overview + +This collector monitors status of Monit's service checks. + + +It sends HTTP requests to the Monit `/_status?format=xml&level=full` endpoint. + + +This collector is supported on all platforms. + +This collector supports collecting metrics from multiple instances of this integration, including remote instances. + + +### Default Behavior + +#### Auto-Detection + +By default, it detects Monit instances running on localhost that are listening on port 2812. +On startup, it tries to collect metrics from: + +- http://127.0.0.1:2812 + + +#### Limits + +The default configuration for this integration does not impose any limits on data collection. + +#### Performance Impact + +The default configuration for this integration is not expected to impose a significant performance impact on the system. + + +## Metrics + +Metrics grouped by *scope*. + +The scope defines the instance that the metric belongs to. An instance is uniquely identified by a set of labels. + + + +### Per service + +These metrics refer to the monitored Service. + +Labels: + +| Label | Description | +|:-----------|:----------------| +| server_hostname | Hostname of the Monit server. | +| service_check_name | Service check name. | +| service_check_type | Service check type. | + +Metrics: + +| Metric | Dimensions | Unit | +|:------|:----------|:----| +| monit.service_check_status | ok, error, initializing, not_monitored | status | + + + +## Alerts + +There are no alerts configured by default for this integration. + + +## Setup + +### Prerequisites + +#### Enable TCP PORT + +See [Syntax for TCP port](https://mmonit.com/monit/documentation/monit.html#TCP-PORT) for details. + + +### Configuration + +#### File + +The configuration file name for this integration is `go.d/monit.conf`. + + +You can edit the configuration file using the `edit-config` script from the +Netdata [config directory](/docs/netdata-agent/configuration/README.md#the-netdata-config-directory). + +```bash +cd /etc/netdata 2>/dev/null || cd /opt/netdata/etc/netdata +sudo ./edit-config go.d/monit.conf +``` +#### Options + +The following options can be defined globally: update_every, autodetection_retry. + + +<details open><summary>Config options</summary> + +| Name | Description | Default | Required | +|:----|:-----------|:-------|:--------:| +| update_every | Data collection frequency. | 1 | no | +| autodetection_retry | Recheck interval in seconds. Zero means no recheck will be scheduled. | 0 | no | +| url | Server URL. | http://127.0.0.1:2812 | yes | +| timeout | HTTP request timeout. | 1 | no | +| username | Username for basic HTTP authentication. | admin | no | +| password | Password for basic HTTP authentication. | monit | no | +| proxy_url | Proxy URL. | | no | +| proxy_username | Username for proxy basic HTTP authentication. | | no | +| proxy_password | Password for proxy basic HTTP authentication. | | no | +| method | HTTP request method. | GET | no | +| body | HTTP request body. | | no | +| headers | HTTP request headers. | | no | +| not_follow_redirects | Redirect handling policy. Controls whether the client follows redirects. | no | no | +| tls_skip_verify | Server certificate chain and hostname validation policy. Controls whether the client performs this check. | no | no | +| tls_ca | Certification authority that the client uses when verifying the server's certificates. | | no | +| tls_cert | Client TLS certificate. | | no | +| tls_key | Client TLS key. | | no | + +</details> + +#### Examples + +##### HTTP authentication + +Basic HTTP authentication. + +<details open><summary>Config</summary> + +```yaml +jobs: + - name: local + url: http://127.0.0.1:2812 + username: admin + password: monit + +``` +</details> + +##### HTTPS with self-signed certificate + +With enabled HTTPS and self-signed certificate. + +<details open><summary>Config</summary> + +```yaml +jobs: + - name: local + url: http://127.0.0.1:2812 + tls_skip_verify: yes + +``` +</details> + +##### Multi-instance + +> **Note**: When you define multiple jobs, their names must be unique. + +Collecting metrics from local and remote instances. + + +<details open><summary>Config</summary> + +```yaml +jobs: + - name: local + url: http://127.0.0.1:2812 + + - name: remote + url: http://192.0.2.1:2812 + +``` +</details> + + + +## Troubleshooting + +### Debug Mode + +**Important**: Debug mode is not supported for data collection jobs created via the UI using the Dyncfg feature. + +To troubleshoot issues with the `monit` collector, run the `go.d.plugin` with the debug option enabled. The output +should give you clues as to why the collector isn't working. + +- Navigate to the `plugins.d` directory, usually at `/usr/libexec/netdata/plugins.d/`. If that's not the case on + your system, open `netdata.conf` and look for the `plugins` setting under `[directories]`. + + ```bash + cd /usr/libexec/netdata/plugins.d/ + ``` + +- Switch to the `netdata` user. + + ```bash + sudo -u netdata -s + ``` + +- Run the `go.d.plugin` to debug the collector: + + ```bash + ./go.d.plugin -d -m monit + ``` + +### Getting Logs + +If you're encountering problems with the `monit` collector, follow these steps to retrieve logs and identify potential issues: + +- **Run the command** specific to your system (systemd, non-systemd, or Docker container). +- **Examine the output** for any warnings or error messages that might indicate issues. These messages should provide clues about the root cause of the problem. + +#### System with systemd + +Use the following command to view logs generated since the last Netdata service restart: + +```bash +journalctl _SYSTEMD_INVOCATION_ID="$(systemctl show --value --property=InvocationID netdata)" --namespace=netdata --grep monit +``` + +#### System without systemd + +Locate the collector log file, typically at `/var/log/netdata/collector.log`, and use `grep` to filter for collector's name: + +```bash +grep monit /var/log/netdata/collector.log +``` + +**Note**: This method shows logs from all restarts. Focus on the **latest entries** for troubleshooting current issues. + +#### Docker Container + +If your Netdata runs in a Docker container named "netdata" (replace if different), use this command: + +```bash +docker logs netdata 2>&1 | grep monit +``` + + diff --git a/src/go/plugin/go.d/modules/monit/metadata.yaml b/src/go/plugin/go.d/modules/monit/metadata.yaml new file mode 100644 index 000000000..d54793984 --- /dev/null +++ b/src/go/plugin/go.d/modules/monit/metadata.yaml @@ -0,0 +1,193 @@ +plugin_name: go.d.plugin +modules: + - meta: + id: collector-go.d.plugin-monit + plugin_name: go.d.plugin + module_name: monit + monitored_instance: + name: Monit + link: https://mmonit.com/monit/ + categories: + - data-collection.synthetic-checks + icon_filename: monit.png + related_resources: + integrations: + list: [] + alternative_monitored_instances: [] + info_provided_to_referring_integrations: + description: "" + keywords: + - monit + - mmonit + - supervision tool + - monitrc + most_popular: false + overview: + data_collection: + metrics_description: | + This collector monitors status of Monit's service checks. + method_description: | + It sends HTTP requests to the Monit `/_status?format=xml&level=full` endpoint. + default_behavior: + auto_detection: + description: | + By default, it detects Monit instances running on localhost that are listening on port 2812. + On startup, it tries to collect metrics from: + + - http://127.0.0.1:2812 + limits: + description: "" + performance_impact: + description: "" + additional_permissions: + description: "" + multi_instance: true + supported_platforms: + include: [] + exclude: [] + setup: + prerequisites: + list: + - title: Enable TCP PORT + description: + See [Syntax for TCP port](https://mmonit.com/monit/documentation/monit.html#TCP-PORT) for details. + configuration: + file: + name: go.d/monit.conf + options: + description: | + The following options can be defined globally: update_every, autodetection_retry. + folding: + title: Config options + enabled: true + list: + - name: update_every + description: Data collection frequency. + default_value: 1 + required: false + - name: autodetection_retry + description: Recheck interval in seconds. Zero means no recheck will be scheduled. + default_value: 0 + required: false + - name: url + description: Server URL. + default_value: http://127.0.0.1:2812 + required: true + - name: timeout + description: HTTP request timeout. + default_value: 1 + required: false + - name: username + description: Username for basic HTTP authentication. + default_value: "admin" + required: false + - name: password + description: Password for basic HTTP authentication. + default_value: "monit" + required: false + - name: proxy_url + description: Proxy URL. + default_value: "" + required: false + - name: proxy_username + description: Username for proxy basic HTTP authentication. + default_value: "" + required: false + - name: proxy_password + description: Password for proxy basic HTTP authentication. + default_value: "" + required: false + - name: method + description: HTTP request method. + default_value: GET + required: false + - name: body + description: HTTP request body. + default_value: "" + required: false + - name: headers + description: HTTP request headers. + default_value: "" + required: false + - name: not_follow_redirects + description: Redirect handling policy. Controls whether the client follows redirects. + default_value: false + required: false + - name: tls_skip_verify + description: Server certificate chain and hostname validation policy. Controls whether the client performs this check. + default_value: false + required: false + - name: tls_ca + description: Certification authority that the client uses when verifying the server's certificates. + default_value: "" + required: false + - name: tls_cert + description: Client TLS certificate. + default_value: "" + required: false + - name: tls_key + description: Client TLS key. + default_value: "" + required: false + examples: + folding: + title: Config + enabled: true + list: + - name: HTTP authentication + description: Basic HTTP authentication. + config: | + jobs: + - name: local + url: http://127.0.0.1:2812 + username: admin + password: monit + - name: HTTPS with self-signed certificate + description: With enabled HTTPS and self-signed certificate. + config: | + jobs: + - name: local + url: http://127.0.0.1:2812 + tls_skip_verify: yes + - name: Multi-instance + description: | + > **Note**: When you define multiple jobs, their names must be unique. + + Collecting metrics from local and remote instances. + config: | + jobs: + - name: local + url: http://127.0.0.1:2812 + + - name: remote + url: http://192.0.2.1:2812 + troubleshooting: + problems: + list: [] + alerts: [] + metrics: + folding: + title: Metrics + enabled: false + description: "" + availability: [] + scopes: + - name: service + description: These metrics refer to the monitored Service. + labels: + - name: server_hostname + description: Hostname of the Monit server. + - name: service_check_name + description: Service check name. + - name: service_check_type + description: Service check type. + metrics: + - name: monit.service_check_status + description: Service Check Status + unit: status + chart_type: line + dimensions: + - name: ok + - name: error + - name: initializing + - name: not_monitored diff --git a/src/go/plugin/go.d/modules/monit/monit.go b/src/go/plugin/go.d/modules/monit/monit.go new file mode 100644 index 000000000..d0fe90b14 --- /dev/null +++ b/src/go/plugin/go.d/modules/monit/monit.go @@ -0,0 +1,117 @@ +// SPDX-License-Identifier: GPL-3.0-or-later + +package monit + +import ( + _ "embed" + "errors" + "net/http" + "time" + + "github.com/netdata/netdata/go/plugins/plugin/go.d/agent/module" + "github.com/netdata/netdata/go/plugins/plugin/go.d/pkg/web" +) + +//go:embed "config_schema.json" +var configSchema string + +func init() { + module.Register("monit", module.Creator{ + Create: func() module.Module { return New() }, + JobConfigSchema: configSchema, + Config: func() any { return &Config{} }, + }) +} + +func New() *Monit { + return &Monit{ + Config: Config{ + HTTP: web.HTTP{ + Request: web.Request{ + URL: "http://127.0.0.1:2812", + Username: "admin", + Password: "monit", + }, + Client: web.Client{ + Timeout: web.Duration(time.Second), + }, + }, + }, + charts: baseCharts.Copy(), + seenServices: make(map[string]statusServiceCheck), + } +} + +type Config struct { + UpdateEvery int `yaml:"update_every,omitempty" json:"update_every"` + web.HTTP `yaml:",inline" json:""` +} + +type Monit struct { + module.Base + Config `yaml:",inline" json:""` + + charts *module.Charts + + httpClient *http.Client + + seenServices map[string]statusServiceCheck +} + +func (m *Monit) Configuration() any { + return m.Config +} + +func (m *Monit) Init() error { + if m.URL == "" { + m.Error("config: monit url is required but not set") + return errors.New("config: missing URL") + } + + httpClient, err := web.NewHTTPClient(m.Client) + if err != nil { + m.Errorf("init HTTP client: %v", err) + return err + } + m.httpClient = httpClient + + m.Debugf("using URL %s", m.URL) + m.Debugf("using timeout: %s", m.Timeout) + + return nil +} + +func (m *Monit) Check() error { + mx, err := m.collect() + if err != nil { + m.Error(err) + return err + } + if len(mx) == 0 { + return errors.New("no metrics collected") + + } + return nil +} + +func (m *Monit) Charts() *module.Charts { + return m.charts +} + +func (m *Monit) Collect() map[string]int64 { + mx, err := m.collect() + if err != nil { + m.Error(err) + } + + if len(mx) == 0 { + return nil + } + return mx +} + +func (m *Monit) Cleanup() { + if m.httpClient != nil { + m.httpClient.CloseIdleConnections() + } +} diff --git a/src/go/plugin/go.d/modules/monit/monit_test.go b/src/go/plugin/go.d/modules/monit/monit_test.go new file mode 100644 index 000000000..7735dcdc2 --- /dev/null +++ b/src/go/plugin/go.d/modules/monit/monit_test.go @@ -0,0 +1,371 @@ +// SPDX-License-Identifier: GPL-3.0-or-later + +package monit + +import ( + "net/http" + "net/http/httptest" + "os" + "testing" + + "github.com/netdata/netdata/go/plugins/plugin/go.d/agent/module" + "github.com/netdata/netdata/go/plugins/plugin/go.d/pkg/web" + + "github.com/stretchr/testify/assert" + "github.com/stretchr/testify/require" +) + +var ( + dataConfigJSON, _ = os.ReadFile("testdata/config.json") + dataConfigYAML, _ = os.ReadFile("testdata/config.yaml") + + dataStatus, _ = os.ReadFile("testdata/v5.33.0/status.xml") +) + +func Test_testDataIsValid(t *testing.T) { + for name, data := range map[string][]byte{ + "dataConfigJSON": dataConfigJSON, + "dataConfigYAML": dataConfigYAML, + "dataStatus": dataStatus, + } { + require.NotNil(t, data, name) + + } +} + +func TestMonit_ConfigurationSerialize(t *testing.T) { + module.TestConfigurationSerialize(t, &Monit{}, dataConfigJSON, dataConfigYAML) +} + +func TestMonit_Init(t *testing.T) { + tests := map[string]struct { + wantFail bool + config Config + }{ + "success with default": { + wantFail: false, + config: New().Config, + }, + "fail when URL not set": { + wantFail: true, + config: Config{ + HTTP: web.HTTP{ + Request: web.Request{URL: ""}, + }, + }, + }, + } + + for name, test := range tests { + t.Run(name, func(t *testing.T) { + monit := New() + monit.Config = test.config + + if test.wantFail { + assert.Error(t, monit.Init()) + } else { + assert.NoError(t, monit.Init()) + } + }) + } +} + +func TestMonit_Check(t *testing.T) { + tests := map[string]struct { + wantFail bool + prepare func(t *testing.T) (monit *Monit, cleanup func()) + }{ + "success on valid response": { + wantFail: false, + prepare: caseOk, + }, + "fail on unexpected XML response": { + wantFail: true, + prepare: caseUnexpectedXMLResponse, + }, + "fail on invalid data response": { + wantFail: true, + prepare: caseInvalidDataResponse, + }, + "fail on connection refused": { + wantFail: true, + prepare: caseConnectionRefused, + }, + "fail on 404 response": { + wantFail: true, + prepare: case404, + }, + } + + for name, test := range tests { + t.Run(name, func(t *testing.T) { + monit, cleanup := test.prepare(t) + defer cleanup() + + if test.wantFail { + assert.Error(t, monit.Check()) + } else { + assert.NoError(t, monit.Check()) + } + }) + } +} + +func TestMonit_Charts(t *testing.T) { + assert.NotNil(t, New().Charts()) +} + +func TestMonit_Collect(t *testing.T) { + tests := map[string]struct { + prepare func(t *testing.T) (monit *Monit, cleanup func()) + wantNumOfCharts int + wantMetrics map[string]int64 + }{ + "success on valid response": { + prepare: caseOk, + wantNumOfCharts: len(baseCharts) + len(serviceCheckChartsTmpl)*25, + wantMetrics: map[string]int64{ + "service_check_type_directory_name_directoryAlert_status_error": 1, + "service_check_type_directory_name_directoryAlert_status_initializing": 0, + "service_check_type_directory_name_directoryAlert_status_not_monitored": 0, + "service_check_type_directory_name_directoryAlert_status_ok": 0, + "service_check_type_directory_name_directoryDisabled_status_error": 0, + "service_check_type_directory_name_directoryDisabled_status_initializing": 0, + "service_check_type_directory_name_directoryDisabled_status_not_monitored": 1, + "service_check_type_directory_name_directoryDisabled_status_ok": 0, + "service_check_type_directory_name_directoryNotExists_status_error": 1, + "service_check_type_directory_name_directoryNotExists_status_initializing": 0, + "service_check_type_directory_name_directoryNotExists_status_not_monitored": 0, + "service_check_type_directory_name_directoryNotExists_status_ok": 0, + "service_check_type_directory_name_directoryOk_status_error": 0, + "service_check_type_directory_name_directoryOk_status_initializing": 0, + "service_check_type_directory_name_directoryOk_status_not_monitored": 0, + "service_check_type_directory_name_directoryOk_status_ok": 1, + "service_check_type_file_name_fileAlert_status_error": 1, + "service_check_type_file_name_fileAlert_status_initializing": 0, + "service_check_type_file_name_fileAlert_status_not_monitored": 0, + "service_check_type_file_name_fileAlert_status_ok": 0, + "service_check_type_file_name_fileDisabled_status_error": 0, + "service_check_type_file_name_fileDisabled_status_initializing": 0, + "service_check_type_file_name_fileDisabled_status_not_monitored": 1, + "service_check_type_file_name_fileDisabled_status_ok": 0, + "service_check_type_file_name_fileNotExists_status_error": 1, + "service_check_type_file_name_fileNotExists_status_initializing": 0, + "service_check_type_file_name_fileNotExists_status_not_monitored": 0, + "service_check_type_file_name_fileNotExists_status_ok": 0, + "service_check_type_file_name_fileOk_status_error": 0, + "service_check_type_file_name_fileOk_status_initializing": 0, + "service_check_type_file_name_fileOk_status_not_monitored": 0, + "service_check_type_file_name_fileOk_status_ok": 1, + "service_check_type_filesystem_name_filesystemAlert_status_error": 1, + "service_check_type_filesystem_name_filesystemAlert_status_initializing": 0, + "service_check_type_filesystem_name_filesystemAlert_status_not_monitored": 0, + "service_check_type_filesystem_name_filesystemAlert_status_ok": 0, + "service_check_type_filesystem_name_filesystemDisabled_status_error": 0, + "service_check_type_filesystem_name_filesystemDisabled_status_initializing": 0, + "service_check_type_filesystem_name_filesystemDisabled_status_not_monitored": 1, + "service_check_type_filesystem_name_filesystemDisabled_status_ok": 0, + "service_check_type_filesystem_name_filesystemNotExists_status_error": 1, + "service_check_type_filesystem_name_filesystemNotExists_status_initializing": 0, + "service_check_type_filesystem_name_filesystemNotExists_status_not_monitored": 0, + "service_check_type_filesystem_name_filesystemNotExists_status_ok": 0, + "service_check_type_filesystem_name_filsystemOk_status_error": 0, + "service_check_type_filesystem_name_filsystemOk_status_initializing": 0, + "service_check_type_filesystem_name_filsystemOk_status_not_monitored": 0, + "service_check_type_filesystem_name_filsystemOk_status_ok": 1, + "service_check_type_host_name_hostAlert_status_error": 1, + "service_check_type_host_name_hostAlert_status_initializing": 0, + "service_check_type_host_name_hostAlert_status_not_monitored": 0, + "service_check_type_host_name_hostAlert_status_ok": 0, + "service_check_type_host_name_hostDisabled_status_error": 0, + "service_check_type_host_name_hostDisabled_status_initializing": 0, + "service_check_type_host_name_hostDisabled_status_not_monitored": 1, + "service_check_type_host_name_hostDisabled_status_ok": 0, + "service_check_type_host_name_hostNotExists_status_error": 1, + "service_check_type_host_name_hostNotExists_status_initializing": 0, + "service_check_type_host_name_hostNotExists_status_not_monitored": 0, + "service_check_type_host_name_hostNotExists_status_ok": 0, + "service_check_type_host_name_hostOk_status_error": 0, + "service_check_type_host_name_hostOk_status_initializing": 0, + "service_check_type_host_name_hostOk_status_not_monitored": 0, + "service_check_type_host_name_hostOk_status_ok": 1, + "service_check_type_network_name_networkAlert_status_error": 1, + "service_check_type_network_name_networkAlert_status_initializing": 0, + "service_check_type_network_name_networkAlert_status_not_monitored": 0, + "service_check_type_network_name_networkAlert_status_ok": 0, + "service_check_type_network_name_networkDisabled_status_error": 0, + "service_check_type_network_name_networkDisabled_status_initializing": 0, + "service_check_type_network_name_networkDisabled_status_not_monitored": 1, + "service_check_type_network_name_networkDisabled_status_ok": 0, + "service_check_type_network_name_networkNotExists_status_error": 1, + "service_check_type_network_name_networkNotExists_status_initializing": 0, + "service_check_type_network_name_networkNotExists_status_not_monitored": 0, + "service_check_type_network_name_networkNotExists_status_ok": 0, + "service_check_type_network_name_networkOk_status_error": 0, + "service_check_type_network_name_networkOk_status_initializing": 0, + "service_check_type_network_name_networkOk_status_not_monitored": 0, + "service_check_type_network_name_networkOk_status_ok": 1, + "service_check_type_process_name_processAlert_status_error": 1, + "service_check_type_process_name_processAlert_status_initializing": 0, + "service_check_type_process_name_processAlert_status_not_monitored": 0, + "service_check_type_process_name_processAlert_status_ok": 0, + "service_check_type_process_name_processDisabled_status_error": 0, + "service_check_type_process_name_processDisabled_status_initializing": 0, + "service_check_type_process_name_processDisabled_status_not_monitored": 1, + "service_check_type_process_name_processDisabled_status_ok": 0, + "service_check_type_process_name_processNotExists_status_error": 1, + "service_check_type_process_name_processNotExists_status_initializing": 0, + "service_check_type_process_name_processNotExists_status_not_monitored": 0, + "service_check_type_process_name_processNotExists_status_ok": 0, + "service_check_type_process_name_processOk_status_error": 0, + "service_check_type_process_name_processOk_status_initializing": 0, + "service_check_type_process_name_processOk_status_not_monitored": 0, + "service_check_type_process_name_processOk_status_ok": 1, + "service_check_type_system_name_pve-deb-work_status_error": 0, + "service_check_type_system_name_pve-deb-work_status_initializing": 0, + "service_check_type_system_name_pve-deb-work_status_not_monitored": 0, + "service_check_type_system_name_pve-deb-work_status_ok": 1, + "uptime": 33, + }, + }, + "fail on unexpected XML response": { + prepare: caseUnexpectedXMLResponse, + wantNumOfCharts: len(baseCharts), + wantMetrics: nil, + }, + "fail on invalid data response": { + prepare: caseInvalidDataResponse, + wantNumOfCharts: len(baseCharts), + wantMetrics: nil, + }, + "fail on connection refused": { + prepare: caseConnectionRefused, + wantNumOfCharts: len(baseCharts), + wantMetrics: nil, + }, + "fail on 404 response": { + prepare: case404, + wantNumOfCharts: len(baseCharts), + wantMetrics: nil, + }, + } + + for name, test := range tests { + t.Run(name, func(t *testing.T) { + monit, cleanup := test.prepare(t) + defer cleanup() + + _ = monit.Check() + + mx := monit.Collect() + + require.Equal(t, test.wantMetrics, mx) + + if len(test.wantMetrics) > 0 { + module.TestMetricsHasAllChartsDims(t, monit.Charts(), mx) + assert.Equal(t, test.wantNumOfCharts, len(*monit.Charts()), "want number of charts") + } + }) + } +} + +func caseOk(t *testing.T) (*Monit, func()) { + t.Helper() + srv := httptest.NewServer(http.HandlerFunc( + func(w http.ResponseWriter, r *http.Request) { + if r.URL.Path != urlPathStatus || r.URL.RawQuery != urlQueryStatus { + w.WriteHeader(http.StatusNotFound) + return + } + _, _ = w.Write(dataStatus) + })) + monit := New() + monit.URL = srv.URL + require.NoError(t, monit.Init()) + + return monit, srv.Close +} + +func caseUnexpectedXMLResponse(t *testing.T) (*Monit, func()) { + t.Helper() + data := `<?xml version="1.0" encoding="UTF-8"?> +<Response> + <Status> + <Code>200</Code> + <Message>Success</Message> + </Status> + <Data> + <User> + <ID>12345</ID> + <Name>John Doe</Name> + <Email>johndoe@example.com</Email> + <Roles> + <Role>Admin</Role> + <Role>User</Role> + </Roles> + </User> + <Order> + <OrderID>98765</OrderID> + <Date>2024-08-15</Date> + <Items> + <Item> + <Name>Widget A</Name> + <Quantity>2</Quantity> + <Price>19.99</Price> + </Item> + <Item> + <Name>Gadget B</Name> + <Quantity>1</Quantity> + <Price>99.99</Price> + </Item> + </Items> + <Total>139.97</Total> + </Order> + </Data> +</Response> +` + srv := httptest.NewServer(http.HandlerFunc( + func(w http.ResponseWriter, r *http.Request) { + _, _ = w.Write([]byte(data)) + })) + monit := New() + monit.URL = srv.URL + require.NoError(t, monit.Init()) + + return monit, srv.Close +} + +func caseInvalidDataResponse(t *testing.T) (*Monit, func()) { + t.Helper() + srv := httptest.NewServer(http.HandlerFunc( + func(w http.ResponseWriter, r *http.Request) { + _, _ = w.Write([]byte("hello and\n goodbye")) + })) + monit := New() + monit.URL = srv.URL + require.NoError(t, monit.Init()) + + return monit, srv.Close +} + +func caseConnectionRefused(t *testing.T) (*Monit, func()) { + t.Helper() + monit := New() + monit.URL = "http://127.0.0.1:65001" + require.NoError(t, monit.Init()) + + return monit, func() {} +} + +func case404(t *testing.T) (*Monit, func()) { + t.Helper() + srv := httptest.NewServer(http.HandlerFunc( + func(w http.ResponseWriter, r *http.Request) { + w.WriteHeader(http.StatusNotFound) + })) + monit := New() + monit.URL = srv.URL + require.NoError(t, monit.Init()) + + return monit, srv.Close +} diff --git a/src/go/plugin/go.d/modules/monit/status.go b/src/go/plugin/go.d/modules/monit/status.go new file mode 100644 index 000000000..4a87e8c90 --- /dev/null +++ b/src/go/plugin/go.d/modules/monit/status.go @@ -0,0 +1,153 @@ +// SPDX-License-Identifier: GPL-3.0-or-later + +package monit + +// status_xml(): https://bitbucket.org/tildeslash/monit/src/5467d37d70c3c63c5760cddb93831bde4e17c14b/src/http/xml.c#lines-631 +type monitStatus struct { + Server *statusServer `xml:"server"` + Services []statusServiceCheck `xml:"service"` +} + +type statusServer struct { + ID string `xml:"id"` + Version string `xml:"version"` + Uptime int64 `xml:"uptime"` + LocalHostname string `xml:"localhostname"` +} + +// status_service(): https://bitbucket.org/tildeslash/monit/src/5467d37d70c3c63c5760cddb93831bde4e17c14b/src/http/xml.c#lines-196 +// struct Service_T: https://bitbucket.org/tildeslash/monit/src/5467d37d70c3c63c5760cddb93831bde4e17c14b/src/monit.h#lines-1212 +type statusServiceCheck struct { + Type string `xml:"type,attr"` + Name string `xml:"name"` + + Status int `xml:"status"` // Error flags bitmap + + // https://bitbucket.org/tildeslash/monit/src/5467d37d70c3c63c5760cddb93831bde4e17c14b/src/monit.h#lines-269 + MonitoringStatus int `xml:"monitor"` + + // https://bitbucket.org/tildeslash/monit/src/5467d37d70c3c63c5760cddb93831bde4e17c14b/src/monit.h#lines-254 + MonitorMode int `xml:"monitormode"` + + // https://bitbucket.org/tildeslash/monit/src/5467d37d70c3c63c5760cddb93831bde4e17c14b/src/monit.h#lines-261 + OnReboot int `xml:"onreboot"` + + // https://bitbucket.org/tildeslash/monit/src/5467d37d70c3c63c5760cddb93831bde4e17c14b/src/monit.h#lines-248 + PendingAction int `xml:"pendingaction"` +} + +func (s *statusServiceCheck) id() string { + return s.svcType() + ":" + s.Name +} + +func (s *statusServiceCheck) svcType() string { + // See enum Service_Type https://bitbucket.org/tildeslash/monit/src/master/src/monit.h + + switch s.Type { + case "0": + return "filesystem" + case "1": + return "directory" + case "2": + return "file" + case "3": + return "process" + case "4": + return "host" + case "5": + return "system" + case "6": + return "fifo" + case "7": + return "program" + case "8": + return "network" + default: + return "unknown" + } +} + +func (s *statusServiceCheck) status() string { + // https://bitbucket.org/tildeslash/monit/src/5467d37d70c3c63c5760cddb93831bde4e17c14b/src/http/cervlet.c#lines-2866 + + switch st := s.monitoringStatus(); st { + case "not_monitored", "initializing": + return st + default: + if s.Status != 0 { + return "error" + } + return "ok" + } +} + +func (s *statusServiceCheck) monitoringStatus() string { + switch s.MonitoringStatus { + case 0: + return "not_monitored" + case 1: + return "monitored" + case 2: + return "initializing" + case 4: + return "waiting" + default: + return "unknown" + } +} + +func (s *statusServiceCheck) monitorMode() string { + switch s.MonitorMode { + case 0: + return "active" + case 1: + return "passive" + default: + return "unknown" + } +} + +func (s *statusServiceCheck) onReboot() string { + switch s.OnReboot { + case 0: + return "start" + case 1: + return "no_start" + default: + return "unknown" + } +} + +func (s *statusServiceCheck) pendingAction() string { + switch s.PendingAction { + case 0: + return "ignored" + case 1: + return "alert" + case 2: + return "restart" + case 3: + return "stop" + case 4: + return "exec" + case 5: + return "unmonitor" + case 6: + return "start" + case 7: + return "monitor" + default: + return "unknown" + } +} + +func (s *statusServiceCheck) hasServiceStatus() bool { + // https://bitbucket.org/tildeslash/monit/src/5467d37d70c3c63c5760cddb93831bde4e17c14b/src/util.c#lines-1721 + + const eventNonExist = 512 + const eventData = 2048 + + return s.monitoringStatus() == "monitored" && + !(s.Status&eventNonExist != 0) && + !(s.Status&eventData != 0) +} diff --git a/src/go/collectors/go.d.plugin/modules/nginxplus/testdata/config.json b/src/go/plugin/go.d/modules/monit/testdata/config.json index 984c3ed6e..984c3ed6e 100644 --- a/src/go/collectors/go.d.plugin/modules/nginxplus/testdata/config.json +++ b/src/go/plugin/go.d/modules/monit/testdata/config.json diff --git a/src/go/collectors/go.d.plugin/modules/nginxplus/testdata/config.yaml b/src/go/plugin/go.d/modules/monit/testdata/config.yaml index 8558b61cc..8558b61cc 100644 --- a/src/go/collectors/go.d.plugin/modules/nginxplus/testdata/config.yaml +++ b/src/go/plugin/go.d/modules/monit/testdata/config.yaml diff --git a/src/go/plugin/go.d/modules/monit/testdata/v5.33.0/status.xml b/src/go/plugin/go.d/modules/monit/testdata/v5.33.0/status.xml new file mode 100644 index 000000000..ca4178c6c --- /dev/null +++ b/src/go/plugin/go.d/modules/monit/testdata/v5.33.0/status.xml @@ -0,0 +1,688 @@ +<?xml version="1.0" encoding="ISO-8859-1"?> +<monit> + <server> + <id>309dc5d56ccd5964cef9b42d1d8305e7</id> + <incarnation>1723810534</incarnation> + <version>5.33.0</version> + <uptime>33</uptime> + <poll>120</poll> + <startdelay>0</startdelay> + <localhostname>pve-deb-work</localhostname> + <controlfile>/etc/monit/monitrc</controlfile> + <httpd> + <address>127.0.0.1</address> + <port>2812</port> + <ssl>0</ssl> + </httpd> + </server> + <platform> + <name>Linux</name> + <release>6.1.0-23-amd64</release> + <version>#1 SMP PREEMPT_DYNAMIC Debian 6.1.99-1 (2024-07-15)</version> + <machine>x86_64</machine> + <cpu>16</cpu> + <memory>32864100</memory> + <swap>262140</swap> + </platform> + <service type="3"> + <name>processOk</name> + <collected_sec>1723810534</collected_sec> + <collected_usec>86510</collected_usec> + <status>0</status> + <status_hint>0</status_hint> + <monitor>1</monitor> + <monitormode>0</monitormode> + <onreboot>0</onreboot> + <pendingaction>0</pendingaction> + <pid>843</pid> + <ppid>1</ppid> + <uid>0</uid> + <euid>0</euid> + <gid>0</gid> + <uptime>66112</uptime> + <threads>1</threads> + <children>2</children> + <memory> + <percent>0.0</percent> + <percenttotal>0.1</percenttotal> + <kilobyte>5036</kilobyte> + <kilobytetotal>34156</kilobytetotal> + </memory> + <cpu> + <percent>-1.0</percent> + <percenttotal>-1.0</percenttotal> + </cpu> + <filedescriptors> + <open>9</open> + <opentotal>34</opentotal> + <limit> + <soft>8192</soft> + <hard>8192</hard> + </limit> + </filedescriptors> + <read> + <bytesgeneric> + <count>0</count> + <total>1733465</total> + </bytesgeneric> + <bytes> + <count>0</count> + <total>135168</total> + </bytes> + <operations> + <count>0</count> + <total>23145</total> + </operations> + </read> + <write> + <bytesgeneric> + <count>0</count> + <total>8842272</total> + </bytesgeneric> + <bytes> + <count>0</count> + <total>9150464</total> + </bytes> + <operations> + <count>0</count> + <total>22890</total> + </operations> + </write> + </service> + <service type="3"> + <name>processDisabled</name> + <collected_sec>1723810534</collected_sec> + <collected_usec>68402</collected_usec> + <status>0</status> + <status_hint>0</status_hint> + <monitor>0</monitor> + <monitormode>0</monitormode> + <onreboot>0</onreboot> + <pendingaction>0</pendingaction> + </service> + <service type="3"> + <name>processAlert</name> + <collected_sec>1723810534</collected_sec> + <collected_usec>86548</collected_usec> + <status>2</status> + <status_hint>0</status_hint> + <monitor>1</monitor> + <monitormode>0</monitormode> + <onreboot>0</onreboot> + <pendingaction>0</pendingaction> + <pid>843</pid> + <ppid>1</ppid> + <uid>0</uid> + <euid>0</euid> + <gid>0</gid> + <uptime>66112</uptime> + <threads>1</threads> + <children>2</children> + <memory> + <percent>0.0</percent> + <percenttotal>0.1</percenttotal> + <kilobyte>5036</kilobyte> + <kilobytetotal>34156</kilobytetotal> + </memory> + <cpu> + <percent>-1.0</percent> + <percenttotal>-1.0</percenttotal> + </cpu> + <filedescriptors> + <open>9</open> + <opentotal>34</opentotal> + <limit> + <soft>8192</soft> + <hard>8192</hard> + </limit> + </filedescriptors> + <read> + <bytesgeneric> + <count>0</count> + <total>1733465</total> + </bytesgeneric> + <bytes> + <count>0</count> + <total>135168</total> + </bytes> + <operations> + <count>0</count> + <total>23145</total> + </operations> + </read> + <write> + <bytesgeneric> + <count>0</count> + <total>8842272</total> + </bytesgeneric> + <bytes> + <count>0</count> + <total>9150464</total> + </bytes> + <operations> + <count>0</count> + <total>22890</total> + </operations> + </write> + </service> + <service type="3"> + <name>processNotExists</name> + <collected_sec>1723810534</collected_sec> + <collected_usec>86595</collected_usec> + <status>4608</status> + <status_hint>0</status_hint> + <monitor>1</monitor> + <monitormode>0</monitormode> + <onreboot>0</onreboot> + <pendingaction>0</pendingaction> + </service> + <service type="0"> + <name>filsystemOk</name> + <collected_sec>1723810534</collected_sec> + <collected_usec>86891</collected_usec> + <status>0</status> + <status_hint>0</status_hint> + <monitor>1</monitor> + <monitormode>0</monitormode> + <onreboot>0</onreboot> + <pendingaction>0</pendingaction> + <fstype>ext2</fstype> + <fsflags>rw,relatime</fsflags> + <mode>660</mode> + <uid>0</uid> + <gid>6</gid> + <block> + <percent>19.6</percent> + <usage>92.0</usage> + <total>469.4</total> + </block> + <inode> + <percent>0.3</percent> + <usage>356</usage> + <total>124928</total> + </inode> + <read> + <bytes> + <count>0</count> + <total>5706752</total> + </bytes> + <operations> + <count>0</count> + <total>210</total> + </operations> + </read> + <write> + <bytes> + <count>0</count> + <total>1024</total> + </bytes> + <operations> + <count>0</count> + <total>1</total> + </operations> + </write> + <servicetime> + <read>0.000</read> + <write>0.000</write> + </servicetime> + </service> + <service type="0"> + <name>filesystemDisabled</name> + <collected_sec>1723810534</collected_sec> + <collected_usec>68613</collected_usec> + <status>0</status> + <status_hint>0</status_hint> + <monitor>0</monitor> + <monitormode>0</monitormode> + <onreboot>0</onreboot> + <pendingaction>0</pendingaction> + </service> + <service type="0"> + <name>filesystemAlert</name> + <collected_sec>1723810534</collected_sec> + <collected_usec>87124</collected_usec> + <status>384</status> + <status_hint>0</status_hint> + <monitor>1</monitor> + <monitormode>0</monitormode> + <onreboot>0</onreboot> + <pendingaction>0</pendingaction> + <fstype>ext2</fstype> + <fsflags>rw,relatime</fsflags> + <mode>660</mode> + <uid>0</uid> + <gid>6</gid> + <block> + <percent>19.6</percent> + <usage>92.0</usage> + <total>469.4</total> + </block> + <inode> + <percent>0.3</percent> + <usage>356</usage> + <total>124928</total> + </inode> + <read> + <bytes> + <count>0</count> + <total>5706752</total> + </bytes> + <operations> + <count>0</count> + <total>210</total> + </operations> + </read> + <write> + <bytes> + <count>0</count> + <total>1024</total> + </bytes> + <operations> + <count>0</count> + <total>1</total> + </operations> + </write> + <servicetime> + <read>0.000</read> + <write>0.000</write> + </servicetime> + </service> + <service type="0"> + <name>filesystemNotExists</name> + <collected_sec>1723810534</collected_sec> + <collected_usec>87334</collected_usec> + <status>512</status> + <status_hint>0</status_hint> + <monitor>1</monitor> + <monitormode>0</monitormode> + <onreboot>0</onreboot> + <pendingaction>0</pendingaction> + </service> + <service type="2"> + <name>fileOk</name> + <collected_sec>1723810534</collected_sec> + <collected_usec>87339</collected_usec> + <status>0</status> + <status_hint>0</status_hint> + <monitor>1</monitor> + <monitormode>0</monitormode> + <onreboot>0</onreboot> + <pendingaction>0</pendingaction> + <mode>755</mode> + <uid>0</uid> + <gid>0</gid> + <timestamps> + <access>1723744256</access> + <change>1723744256</change> + <modify>1723744256</modify> + </timestamps> + <size>84820392</size> + </service> + <service type="2"> + <name>fileDisabled</name> + <collected_sec>1723810534</collected_sec> + <collected_usec>68835</collected_usec> + <status>0</status> + <status_hint>0</status_hint> + <monitor>0</monitor> + <monitormode>0</monitormode> + <onreboot>0</onreboot> + <pendingaction>0</pendingaction> + </service> + <service type="2"> + <name>fileAlert</name> + <collected_sec>1723810534</collected_sec> + <collected_usec>87356</collected_usec> + <status>384</status> + <status_hint>0</status_hint> + <monitor>1</monitor> + <monitormode>0</monitormode> + <onreboot>0</onreboot> + <pendingaction>0</pendingaction> + <mode>755</mode> + <uid>0</uid> + <gid>0</gid> + <timestamps> + <access>1723744256</access> + <change>1723744256</change> + <modify>1723744256</modify> + </timestamps> + <size>84820392</size> + </service> + <service type="2"> + <name>fileNotExists</name> + <collected_sec>1723810534</collected_sec> + <collected_usec>87371</collected_usec> + <status>512</status> + <status_hint>0</status_hint> + <monitor>1</monitor> + <monitormode>0</monitormode> + <onreboot>0</onreboot> + <pendingaction>0</pendingaction> + </service> + <service type="1"> + <name>directoryOk</name> + <collected_sec>1723810534</collected_sec> + <collected_usec>87375</collected_usec> + <status>0</status> + <status_hint>0</status_hint> + <monitor>1</monitor> + <monitormode>0</monitormode> + <onreboot>0</onreboot> + <pendingaction>0</pendingaction> + <mode>775</mode> + <uid>0</uid> + <gid>0</gid> + <timestamps> + <access>1723740545</access> + <change>1720694060</change> + <modify>1720694060</modify> + </timestamps> + </service> + <service type="1"> + <name>directoryDisabled</name> + <collected_sec>1723810534</collected_sec> + <collected_usec>68957</collected_usec> + <status>0</status> + <status_hint>0</status_hint> + <monitor>0</monitor> + <monitormode>0</monitormode> + <onreboot>0</onreboot> + <pendingaction>0</pendingaction> + </service> + <service type="1"> + <name>directoryAlert</name> + <collected_sec>1723810534</collected_sec> + <collected_usec>87385</collected_usec> + <status>64</status> + <status_hint>0</status_hint> + <monitor>1</monitor> + <monitormode>0</monitormode> + <onreboot>0</onreboot> + <pendingaction>0</pendingaction> + <mode>775</mode> + <uid>0</uid> + <gid>0</gid> + <timestamps> + <access>1723740545</access> + <change>1720694060</change> + <modify>1720694060</modify> + </timestamps> + </service> + <service type="1"> + <name>directoryNotExists</name> + <collected_sec>1723810534</collected_sec> + <collected_usec>87400</collected_usec> + <status>512</status> + <status_hint>0</status_hint> + <monitor>1</monitor> + <monitormode>0</monitormode> + <onreboot>0</onreboot> + <pendingaction>0</pendingaction> + </service> + <service type="4"> + <name>hostOk</name> + <collected_sec>1723810534</collected_sec> + <collected_usec>89652</collected_usec> + <status>0</status> + <status_hint>0</status_hint> + <monitor>1</monitor> + <monitormode>0</monitormode> + <onreboot>0</onreboot> + <pendingaction>0</pendingaction> + <icmp> + <type>Ping</type> + <responsetime>0.000144</responsetime> + </icmp> + <port> + <hostname>10.20.4.200</hostname> + <portnumber>19999</portnumber> + <request><![CDATA[/api/v1/info]]></request> + <protocol>HTTP</protocol> + <type>TCP</type> + <responsetime>0.002077</responsetime> + </port> + </service> + <service type="4"> + <name>hostDisabled</name> + <collected_sec>1723810534</collected_sec> + <collected_usec>69066</collected_usec> + <status>0</status> + <status_hint>0</status_hint> + <monitor>0</monitor> + <monitormode>0</monitormode> + <onreboot>0</onreboot> + <pendingaction>0</pendingaction> + </service> + <service type="4"> + <name>hostAlert</name> + <collected_sec>1723810534</collected_sec> + <collected_usec>89857</collected_usec> + <status>32</status> + <status_hint>0</status_hint> + <monitor>1</monitor> + <monitormode>0</monitormode> + <onreboot>0</onreboot> + <pendingaction>0</pendingaction> + <icmp> + <type>Ping</type> + <responsetime>0.000069</responsetime> + </icmp> + <port> + <hostname>10.20.4.200</hostname> + <portnumber>19991</portnumber> + <request><![CDATA[/api/v1/info]]></request> + <protocol>HTTP</protocol> + <type>TCP</type> + <responsetime>-1.000000</responsetime> + </port> + </service> + <service type="4"> + <name>hostNotExists</name> + <collected_sec>1723810549</collected_sec> + <collected_usec>94459</collected_usec> + <status>16384</status> + <status_hint>0</status_hint> + <monitor>1</monitor> + <monitormode>0</monitormode> + <onreboot>0</onreboot> + <pendingaction>0</pendingaction> + <icmp> + <type>Ping</type> + <responsetime>-1.000000</responsetime> + </icmp> + <port> + <hostname>10.20.4.233</hostname> + <portnumber>19999</portnumber> + <request><![CDATA[/api/v1/info]]></request> + <protocol>HTTP</protocol> + <type>TCP</type> + <responsetime>-1.000000</responsetime> + </port> + </service> + <service type="8"> + <name>networkOk</name> + <collected_sec>1723810549</collected_sec> + <collected_usec>94801</collected_usec> + <status>0</status> + <status_hint>0</status_hint> + <monitor>1</monitor> + <monitormode>0</monitormode> + <onreboot>0</onreboot> + <pendingaction>0</pendingaction> + <link> + <state>1</state> + <speed>-1000000</speed> + <duplex>-1</duplex> + <download> + <packets> + <now>0</now> + <total>319258</total> + </packets> + <bytes> + <now>0</now> + <total>714558077</total> + </bytes> + <errors> + <now>0</now> + <total>0</total> + </errors> + </download> + <upload> + <packets> + <now>0</now> + <total>172909</total> + </packets> + <bytes> + <now>0</now> + <total>25128489</total> + </bytes> + <errors> + <now>0</now> + <total>0</total> + </errors> + </upload> + </link> + </service> + <service type="8"> + <name>networkDisabled</name> + <collected_sec>1723810534</collected_sec> + <collected_usec>69103</collected_usec> + <status>0</status> + <status_hint>0</status_hint> + <monitor>0</monitor> + <monitormode>0</monitormode> + <onreboot>0</onreboot> + <pendingaction>0</pendingaction> + </service> + <service type="8"> + <name>networkAlert</name> + <collected_sec>1723810549</collected_sec> + <collected_usec>94969</collected_usec> + <status>8388608</status> + <status_hint>0</status_hint> + <monitor>1</monitor> + <monitormode>0</monitormode> + <onreboot>0</onreboot> + <pendingaction>0</pendingaction> + <link> + <state>0</state> + <speed>-1</speed> + <duplex>-1</duplex> + <download> + <packets> + <now>-1</now> + <total>-1</total> + </packets> + <bytes> + <now>-1</now> + <total>-1</total> + </bytes> + <errors> + <now>-1</now> + <total>-1</total> + </errors> + </download> + <upload> + <packets> + <now>-1</now> + <total>-1</total> + </packets> + <bytes> + <now>-1</now> + <total>-1</total> + </bytes> + <errors> + <now>-1</now> + <total>-1</total> + </errors> + </upload> + </link> + </service> + <service type="8"> + <name>networkNotExists</name> + <collected_sec>1723810549</collected_sec> + <collected_usec>94992</collected_usec> + <status>8388608</status> + <status_hint>0</status_hint> + <monitor>1</monitor> + <monitormode>0</monitormode> + <onreboot>0</onreboot> + <pendingaction>0</pendingaction> + <link> + <state>-1</state> + <speed>-1</speed> + <duplex>-1</duplex> + <download> + <packets> + <now>-1</now> + <total>-1</total> + </packets> + <bytes> + <now>-1</now> + <total>-1</total> + </bytes> + <errors> + <now>-1</now> + <total>-1</total> + </errors> + </download> + <upload> + <packets> + <now>-1</now> + <total>-1</total> + </packets> + <bytes> + <now>-1</now> + <total>-1</total> + </bytes> + <errors> + <now>-1</now> + <total>-1</total> + </errors> + </upload> + </link> + </service> + <service type="5"> + <name>pve-deb-work</name> + <collected_sec>1723810549</collected_sec> + <collected_usec>94992</collected_usec> + <status>0</status> + <status_hint>0</status_hint> + <monitor>1</monitor> + <monitormode>0</monitormode> + <onreboot>0</onreboot> + <pendingaction>0</pendingaction> + <filedescriptors> + <allocated>1664</allocated> + <unused>0</unused> + <maximum>9223372036854775807</maximum> + </filedescriptors> + <system> + <load> + <avg01>0.00</avg01> + <avg05>0.04</avg05> + <avg15>0.03</avg15> + </load> + <cpu> + <user>0.0</user> + <system>0.0</system> + <nice>0.0</nice> + <wait>0.0</wait> + <hardirq>0.0</hardirq> + <softirq>0.0</softirq> + <steal>0.0</steal> + <guest>0.0</guest> + <guestnice>0.0</guestnice> + </cpu> + <memory> + <percent>3.1</percent> + <kilobyte>1020120</kilobyte> + </memory> + <swap> + <percent>0.0</percent> + <kilobyte>0</kilobyte> + </swap> + </system> + </service> +</monit> diff --git a/src/go/collectors/go.d.plugin/modules/mysql/README.md b/src/go/plugin/go.d/modules/mysql/README.md index edf116dee..edf116dee 120000 --- a/src/go/collectors/go.d.plugin/modules/mysql/README.md +++ b/src/go/plugin/go.d/modules/mysql/README.md diff --git a/src/go/collectors/go.d.plugin/modules/mysql/charts.go b/src/go/plugin/go.d/modules/mysql/charts.go index 054e4e01d..bb5089114 100644 --- a/src/go/collectors/go.d.plugin/modules/mysql/charts.go +++ b/src/go/plugin/go.d/modules/mysql/charts.go @@ -6,7 +6,7 @@ import ( "fmt" "strings" - "github.com/netdata/netdata/go/go.d.plugin/agent/module" + "github.com/netdata/netdata/go/plugins/plugin/go.d/agent/module" ) const ( diff --git a/src/go/collectors/go.d.plugin/modules/mysql/collect.go b/src/go/plugin/go.d/modules/mysql/collect.go index 5f28cd139..5f28cd139 100644 --- a/src/go/collectors/go.d.plugin/modules/mysql/collect.go +++ b/src/go/plugin/go.d/modules/mysql/collect.go diff --git a/src/go/collectors/go.d.plugin/modules/mysql/collect_global_status.go b/src/go/plugin/go.d/modules/mysql/collect_global_status.go index c6dff9e93..c6dff9e93 100644 --- a/src/go/collectors/go.d.plugin/modules/mysql/collect_global_status.go +++ b/src/go/plugin/go.d/modules/mysql/collect_global_status.go diff --git a/src/go/collectors/go.d.plugin/modules/mysql/collect_global_vars.go b/src/go/plugin/go.d/modules/mysql/collect_global_vars.go index ae6278088..ae6278088 100644 --- a/src/go/collectors/go.d.plugin/modules/mysql/collect_global_vars.go +++ b/src/go/plugin/go.d/modules/mysql/collect_global_vars.go diff --git a/src/go/collectors/go.d.plugin/modules/mysql/collect_process_list.go b/src/go/plugin/go.d/modules/mysql/collect_process_list.go index 08c08c6d5..08c08c6d5 100644 --- a/src/go/collectors/go.d.plugin/modules/mysql/collect_process_list.go +++ b/src/go/plugin/go.d/modules/mysql/collect_process_list.go diff --git a/src/go/collectors/go.d.plugin/modules/mysql/collect_slave_status.go b/src/go/plugin/go.d/modules/mysql/collect_slave_status.go index 37d4bf59b..37d4bf59b 100644 --- a/src/go/collectors/go.d.plugin/modules/mysql/collect_slave_status.go +++ b/src/go/plugin/go.d/modules/mysql/collect_slave_status.go diff --git a/src/go/collectors/go.d.plugin/modules/mysql/collect_user_statistics.go b/src/go/plugin/go.d/modules/mysql/collect_user_statistics.go index b00703a46..b00703a46 100644 --- a/src/go/collectors/go.d.plugin/modules/mysql/collect_user_statistics.go +++ b/src/go/plugin/go.d/modules/mysql/collect_user_statistics.go diff --git a/src/go/collectors/go.d.plugin/modules/mysql/collect_version.go b/src/go/plugin/go.d/modules/mysql/collect_version.go index b85922e2c..b85922e2c 100644 --- a/src/go/collectors/go.d.plugin/modules/mysql/collect_version.go +++ b/src/go/plugin/go.d/modules/mysql/collect_version.go diff --git a/src/go/collectors/go.d.plugin/modules/mysql/config_schema.json b/src/go/plugin/go.d/modules/mysql/config_schema.json index 20bb265c0..20bb265c0 100644 --- a/src/go/collectors/go.d.plugin/modules/mysql/config_schema.json +++ b/src/go/plugin/go.d/modules/mysql/config_schema.json diff --git a/src/go/collectors/go.d.plugin/modules/mysql/disable_logging.go b/src/go/plugin/go.d/modules/mysql/disable_logging.go index 3a2eea6a1..3a2eea6a1 100644 --- a/src/go/collectors/go.d.plugin/modules/mysql/disable_logging.go +++ b/src/go/plugin/go.d/modules/mysql/disable_logging.go diff --git a/src/go/collectors/go.d.plugin/modules/mysql/integrations/mariadb.md b/src/go/plugin/go.d/modules/mysql/integrations/mariadb.md index 8bd6b151c..b10e84b2a 100644 --- a/src/go/collectors/go.d.plugin/modules/mysql/integrations/mariadb.md +++ b/src/go/plugin/go.d/modules/mysql/integrations/mariadb.md @@ -1,6 +1,6 @@ <!--startmeta -custom_edit_url: "https://github.com/netdata/netdata/edit/master/src/go/collectors/go.d.plugin/modules/mysql/integrations/mariadb.md" -meta_yaml: "https://github.com/netdata/netdata/edit/master/src/go/collectors/go.d.plugin/modules/mysql/metadata.yaml" +custom_edit_url: "https://github.com/netdata/netdata/edit/master/src/go/plugin/go.d/modules/mysql/integrations/mariadb.md" +meta_yaml: "https://github.com/netdata/netdata/edit/master/src/go/plugin/go.d/modules/mysql/metadata.yaml" sidebar_label: "MariaDB" learn_status: "Published" learn_rel_path: "Collecting Metrics/Databases" @@ -45,12 +45,8 @@ This collector supports collecting metrics from multiple instances of this integ #### Auto-Detection -By default, it detects instances running on localhost by trying to connect as root and netdata using known MySQL TCP and UNIX sockets: +By default, it detects instances running on localhost by trying to connect as root and netdata using known MySQL TCP sockets: -- /var/run/mysqld/mysqld.sock -- /var/run/mysqld/mysql.sock -- /var/lib/mysql/mysql.sock -- /tmp/mysql.sock - 127.0.0.1:3306 - "[::1]:3306" @@ -345,6 +341,8 @@ jobs: ### Debug Mode +**Important**: Debug mode is not supported for data collection jobs created via the UI using the Dyncfg feature. + To troubleshoot issues with the `mysql` collector, run the `go.d.plugin` with the debug option enabled. The output should give you clues as to why the collector isn't working. @@ -367,4 +365,37 @@ should give you clues as to why the collector isn't working. ./go.d.plugin -d -m mysql ``` +### Getting Logs + +If you're encountering problems with the `mysql` collector, follow these steps to retrieve logs and identify potential issues: + +- **Run the command** specific to your system (systemd, non-systemd, or Docker container). +- **Examine the output** for any warnings or error messages that might indicate issues. These messages should provide clues about the root cause of the problem. + +#### System with systemd + +Use the following command to view logs generated since the last Netdata service restart: + +```bash +journalctl _SYSTEMD_INVOCATION_ID="$(systemctl show --value --property=InvocationID netdata)" --namespace=netdata --grep mysql +``` + +#### System without systemd + +Locate the collector log file, typically at `/var/log/netdata/collector.log`, and use `grep` to filter for collector's name: + +```bash +grep mysql /var/log/netdata/collector.log +``` + +**Note**: This method shows logs from all restarts. Focus on the **latest entries** for troubleshooting current issues. + +#### Docker Container + +If your Netdata runs in a Docker container named "netdata" (replace if different), use this command: + +```bash +docker logs netdata 2>&1 | grep mysql +``` + diff --git a/src/go/collectors/go.d.plugin/modules/mysql/integrations/mysql.md b/src/go/plugin/go.d/modules/mysql/integrations/mysql.md index 0acf6f881..f4f8a423a 100644 --- a/src/go/collectors/go.d.plugin/modules/mysql/integrations/mysql.md +++ b/src/go/plugin/go.d/modules/mysql/integrations/mysql.md @@ -1,6 +1,6 @@ <!--startmeta -custom_edit_url: "https://github.com/netdata/netdata/edit/master/src/go/collectors/go.d.plugin/modules/mysql/integrations/mysql.md" -meta_yaml: "https://github.com/netdata/netdata/edit/master/src/go/collectors/go.d.plugin/modules/mysql/metadata.yaml" +custom_edit_url: "https://github.com/netdata/netdata/edit/master/src/go/plugin/go.d/modules/mysql/integrations/mysql.md" +meta_yaml: "https://github.com/netdata/netdata/edit/master/src/go/plugin/go.d/modules/mysql/metadata.yaml" sidebar_label: "MySQL" learn_status: "Published" learn_rel_path: "Collecting Metrics/Databases" @@ -45,12 +45,8 @@ This collector supports collecting metrics from multiple instances of this integ #### Auto-Detection -By default, it detects instances running on localhost by trying to connect as root and netdata using known MySQL TCP and UNIX sockets: +By default, it detects instances running on localhost by trying to connect as root and netdata using known MySQL TCP sockets: -- /var/run/mysqld/mysqld.sock -- /var/run/mysqld/mysql.sock -- /var/lib/mysql/mysql.sock -- /tmp/mysql.sock - 127.0.0.1:3306 - "[::1]:3306" @@ -345,6 +341,8 @@ jobs: ### Debug Mode +**Important**: Debug mode is not supported for data collection jobs created via the UI using the Dyncfg feature. + To troubleshoot issues with the `mysql` collector, run the `go.d.plugin` with the debug option enabled. The output should give you clues as to why the collector isn't working. @@ -367,4 +365,37 @@ should give you clues as to why the collector isn't working. ./go.d.plugin -d -m mysql ``` +### Getting Logs + +If you're encountering problems with the `mysql` collector, follow these steps to retrieve logs and identify potential issues: + +- **Run the command** specific to your system (systemd, non-systemd, or Docker container). +- **Examine the output** for any warnings or error messages that might indicate issues. These messages should provide clues about the root cause of the problem. + +#### System with systemd + +Use the following command to view logs generated since the last Netdata service restart: + +```bash +journalctl _SYSTEMD_INVOCATION_ID="$(systemctl show --value --property=InvocationID netdata)" --namespace=netdata --grep mysql +``` + +#### System without systemd + +Locate the collector log file, typically at `/var/log/netdata/collector.log`, and use `grep` to filter for collector's name: + +```bash +grep mysql /var/log/netdata/collector.log +``` + +**Note**: This method shows logs from all restarts. Focus on the **latest entries** for troubleshooting current issues. + +#### Docker Container + +If your Netdata runs in a Docker container named "netdata" (replace if different), use this command: + +```bash +docker logs netdata 2>&1 | grep mysql +``` + diff --git a/src/go/collectors/go.d.plugin/modules/mysql/integrations/percona_mysql.md b/src/go/plugin/go.d/modules/mysql/integrations/percona_mysql.md index 1ea2ab21f..2c967e229 100644 --- a/src/go/collectors/go.d.plugin/modules/mysql/integrations/percona_mysql.md +++ b/src/go/plugin/go.d/modules/mysql/integrations/percona_mysql.md @@ -1,6 +1,6 @@ <!--startmeta -custom_edit_url: "https://github.com/netdata/netdata/edit/master/src/go/collectors/go.d.plugin/modules/mysql/integrations/percona_mysql.md" -meta_yaml: "https://github.com/netdata/netdata/edit/master/src/go/collectors/go.d.plugin/modules/mysql/metadata.yaml" +custom_edit_url: "https://github.com/netdata/netdata/edit/master/src/go/plugin/go.d/modules/mysql/integrations/percona_mysql.md" +meta_yaml: "https://github.com/netdata/netdata/edit/master/src/go/plugin/go.d/modules/mysql/metadata.yaml" sidebar_label: "Percona MySQL" learn_status: "Published" learn_rel_path: "Collecting Metrics/Databases" @@ -45,12 +45,8 @@ This collector supports collecting metrics from multiple instances of this integ #### Auto-Detection -By default, it detects instances running on localhost by trying to connect as root and netdata using known MySQL TCP and UNIX sockets: +By default, it detects instances running on localhost by trying to connect as root and netdata using known MySQL TCP sockets: -- /var/run/mysqld/mysqld.sock -- /var/run/mysqld/mysql.sock -- /var/lib/mysql/mysql.sock -- /tmp/mysql.sock - 127.0.0.1:3306 - "[::1]:3306" @@ -345,6 +341,8 @@ jobs: ### Debug Mode +**Important**: Debug mode is not supported for data collection jobs created via the UI using the Dyncfg feature. + To troubleshoot issues with the `mysql` collector, run the `go.d.plugin` with the debug option enabled. The output should give you clues as to why the collector isn't working. @@ -367,4 +365,37 @@ should give you clues as to why the collector isn't working. ./go.d.plugin -d -m mysql ``` +### Getting Logs + +If you're encountering problems with the `mysql` collector, follow these steps to retrieve logs and identify potential issues: + +- **Run the command** specific to your system (systemd, non-systemd, or Docker container). +- **Examine the output** for any warnings or error messages that might indicate issues. These messages should provide clues about the root cause of the problem. + +#### System with systemd + +Use the following command to view logs generated since the last Netdata service restart: + +```bash +journalctl _SYSTEMD_INVOCATION_ID="$(systemctl show --value --property=InvocationID netdata)" --namespace=netdata --grep mysql +``` + +#### System without systemd + +Locate the collector log file, typically at `/var/log/netdata/collector.log`, and use `grep` to filter for collector's name: + +```bash +grep mysql /var/log/netdata/collector.log +``` + +**Note**: This method shows logs from all restarts. Focus on the **latest entries** for troubleshooting current issues. + +#### Docker Container + +If your Netdata runs in a Docker container named "netdata" (replace if different), use this command: + +```bash +docker logs netdata 2>&1 | grep mysql +``` + diff --git a/src/go/collectors/go.d.plugin/modules/mysql/metadata.yaml b/src/go/plugin/go.d/modules/mysql/metadata.yaml index 1bc133238..6e0d1b6b7 100644 --- a/src/go/collectors/go.d.plugin/modules/mysql/metadata.yaml +++ b/src/go/plugin/go.d/modules/mysql/metadata.yaml @@ -47,12 +47,8 @@ modules: default_behavior: auto_detection: description: | - By default, it detects instances running on localhost by trying to connect as root and netdata using known MySQL TCP and UNIX sockets: - - - /var/run/mysqld/mysqld.sock - - /var/run/mysqld/mysql.sock - - /var/lib/mysql/mysql.sock - - /tmp/mysql.sock + By default, it detects instances running on localhost by trying to connect as root and netdata using known MySQL TCP sockets: + - 127.0.0.1:3306 - "[::1]:3306" limits: diff --git a/src/go/collectors/go.d.plugin/modules/mysql/mycnf.go b/src/go/plugin/go.d/modules/mysql/mycnf.go index 2069af80d..2069af80d 100644 --- a/src/go/collectors/go.d.plugin/modules/mysql/mycnf.go +++ b/src/go/plugin/go.d/modules/mysql/mycnf.go diff --git a/src/go/collectors/go.d.plugin/modules/mysql/mycnf_test.go b/src/go/plugin/go.d/modules/mysql/mycnf_test.go index f68680272..f68680272 100644 --- a/src/go/collectors/go.d.plugin/modules/mysql/mycnf_test.go +++ b/src/go/plugin/go.d/modules/mysql/mycnf_test.go diff --git a/src/go/collectors/go.d.plugin/modules/mysql/mysql.go b/src/go/plugin/go.d/modules/mysql/mysql.go index f970395e2..1e11de39e 100644 --- a/src/go/collectors/go.d.plugin/modules/mysql/mysql.go +++ b/src/go/plugin/go.d/modules/mysql/mysql.go @@ -10,8 +10,8 @@ import ( "sync" "time" - "github.com/netdata/netdata/go/go.d.plugin/agent/module" - "github.com/netdata/netdata/go/go.d.plugin/pkg/web" + "github.com/netdata/netdata/go/plugins/plugin/go.d/agent/module" + "github.com/netdata/netdata/go/plugins/plugin/go.d/pkg/web" "github.com/blang/semver/v4" "github.com/go-sql-driver/mysql" diff --git a/src/go/collectors/go.d.plugin/modules/mysql/mysql_test.go b/src/go/plugin/go.d/modules/mysql/mysql_test.go index da64507e4..300f8dabe 100644 --- a/src/go/collectors/go.d.plugin/modules/mysql/mysql_test.go +++ b/src/go/plugin/go.d/modules/mysql/mysql_test.go @@ -12,7 +12,7 @@ import ( "strings" "testing" - "github.com/netdata/netdata/go/go.d.plugin/agent/module" + "github.com/netdata/netdata/go/plugins/plugin/go.d/agent/module" "github.com/DATA-DOG/go-sqlmock" "github.com/blang/semver/v4" diff --git a/src/go/collectors/go.d.plugin/modules/mysql/testdata/config.json b/src/go/plugin/go.d/modules/mysql/testdata/config.json index 92a65cb5c..92a65cb5c 100644 --- a/src/go/collectors/go.d.plugin/modules/mysql/testdata/config.json +++ b/src/go/plugin/go.d/modules/mysql/testdata/config.json diff --git a/src/go/collectors/go.d.plugin/modules/mysql/testdata/config.yaml b/src/go/plugin/go.d/modules/mysql/testdata/config.yaml index 9bb474b94..9bb474b94 100644 --- a/src/go/collectors/go.d.plugin/modules/mysql/testdata/config.yaml +++ b/src/go/plugin/go.d/modules/mysql/testdata/config.yaml diff --git a/src/go/collectors/go.d.plugin/modules/mysql/testdata/mariadb/v10.8.4-galera-cluster/global_status.txt b/src/go/plugin/go.d/modules/mysql/testdata/mariadb/v10.8.4-galera-cluster/global_status.txt index 8a6b691cd..8a6b691cd 100644 --- a/src/go/collectors/go.d.plugin/modules/mysql/testdata/mariadb/v10.8.4-galera-cluster/global_status.txt +++ b/src/go/plugin/go.d/modules/mysql/testdata/mariadb/v10.8.4-galera-cluster/global_status.txt diff --git a/src/go/collectors/go.d.plugin/modules/mysql/testdata/mariadb/v10.8.4-galera-cluster/global_variables.txt b/src/go/plugin/go.d/modules/mysql/testdata/mariadb/v10.8.4-galera-cluster/global_variables.txt index 96591afdf..96591afdf 100644 --- a/src/go/collectors/go.d.plugin/modules/mysql/testdata/mariadb/v10.8.4-galera-cluster/global_variables.txt +++ b/src/go/plugin/go.d/modules/mysql/testdata/mariadb/v10.8.4-galera-cluster/global_variables.txt diff --git a/src/go/collectors/go.d.plugin/modules/mysql/testdata/mariadb/v10.8.4-galera-cluster/process_list.txt b/src/go/plugin/go.d/modules/mysql/testdata/mariadb/v10.8.4-galera-cluster/process_list.txt index a44ce5e70..a44ce5e70 100644 --- a/src/go/collectors/go.d.plugin/modules/mysql/testdata/mariadb/v10.8.4-galera-cluster/process_list.txt +++ b/src/go/plugin/go.d/modules/mysql/testdata/mariadb/v10.8.4-galera-cluster/process_list.txt diff --git a/src/go/collectors/go.d.plugin/modules/mysql/testdata/mariadb/v10.8.4-galera-cluster/user_statistics.txt b/src/go/plugin/go.d/modules/mysql/testdata/mariadb/v10.8.4-galera-cluster/user_statistics.txt index 7a44b8b5a..7a44b8b5a 100644 --- a/src/go/collectors/go.d.plugin/modules/mysql/testdata/mariadb/v10.8.4-galera-cluster/user_statistics.txt +++ b/src/go/plugin/go.d/modules/mysql/testdata/mariadb/v10.8.4-galera-cluster/user_statistics.txt diff --git a/src/go/collectors/go.d.plugin/modules/mysql/testdata/mariadb/v10.8.4-galera-cluster/version.txt b/src/go/plugin/go.d/modules/mysql/testdata/mariadb/v10.8.4-galera-cluster/version.txt index ee5e77d9a..ee5e77d9a 100644 --- a/src/go/collectors/go.d.plugin/modules/mysql/testdata/mariadb/v10.8.4-galera-cluster/version.txt +++ b/src/go/plugin/go.d/modules/mysql/testdata/mariadb/v10.8.4-galera-cluster/version.txt diff --git a/src/go/collectors/go.d.plugin/modules/mysql/testdata/mariadb/v10.8.4/all_slaves_status_multi_source.txt b/src/go/plugin/go.d/modules/mysql/testdata/mariadb/v10.8.4/all_slaves_status_multi_source.txt index b117cb6c7..b117cb6c7 100644 --- a/src/go/collectors/go.d.plugin/modules/mysql/testdata/mariadb/v10.8.4/all_slaves_status_multi_source.txt +++ b/src/go/plugin/go.d/modules/mysql/testdata/mariadb/v10.8.4/all_slaves_status_multi_source.txt diff --git a/src/go/collectors/go.d.plugin/modules/mysql/testdata/mariadb/v10.8.4/all_slaves_status_single_source.txt b/src/go/plugin/go.d/modules/mysql/testdata/mariadb/v10.8.4/all_slaves_status_single_source.txt index 61428f084..61428f084 100644 --- a/src/go/collectors/go.d.plugin/modules/mysql/testdata/mariadb/v10.8.4/all_slaves_status_single_source.txt +++ b/src/go/plugin/go.d/modules/mysql/testdata/mariadb/v10.8.4/all_slaves_status_single_source.txt diff --git a/src/go/collectors/go.d.plugin/modules/mysql/testdata/mariadb/v10.8.4/global_status.txt b/src/go/plugin/go.d/modules/mysql/testdata/mariadb/v10.8.4/global_status.txt index c82531c74..c82531c74 100644 --- a/src/go/collectors/go.d.plugin/modules/mysql/testdata/mariadb/v10.8.4/global_status.txt +++ b/src/go/plugin/go.d/modules/mysql/testdata/mariadb/v10.8.4/global_status.txt diff --git a/src/go/collectors/go.d.plugin/modules/mysql/testdata/mariadb/v10.8.4/global_variables.txt b/src/go/plugin/go.d/modules/mysql/testdata/mariadb/v10.8.4/global_variables.txt index 96591afdf..96591afdf 100644 --- a/src/go/collectors/go.d.plugin/modules/mysql/testdata/mariadb/v10.8.4/global_variables.txt +++ b/src/go/plugin/go.d/modules/mysql/testdata/mariadb/v10.8.4/global_variables.txt diff --git a/src/go/collectors/go.d.plugin/modules/mysql/testdata/mariadb/v10.8.4/process_list.txt b/src/go/plugin/go.d/modules/mysql/testdata/mariadb/v10.8.4/process_list.txt index a44ce5e70..a44ce5e70 100644 --- a/src/go/collectors/go.d.plugin/modules/mysql/testdata/mariadb/v10.8.4/process_list.txt +++ b/src/go/plugin/go.d/modules/mysql/testdata/mariadb/v10.8.4/process_list.txt diff --git a/src/go/collectors/go.d.plugin/modules/mysql/testdata/mariadb/v10.8.4/user_statistics.txt b/src/go/plugin/go.d/modules/mysql/testdata/mariadb/v10.8.4/user_statistics.txt index 7a44b8b5a..7a44b8b5a 100644 --- a/src/go/collectors/go.d.plugin/modules/mysql/testdata/mariadb/v10.8.4/user_statistics.txt +++ b/src/go/plugin/go.d/modules/mysql/testdata/mariadb/v10.8.4/user_statistics.txt diff --git a/src/go/collectors/go.d.plugin/modules/mysql/testdata/mariadb/v10.8.4/version.txt b/src/go/plugin/go.d/modules/mysql/testdata/mariadb/v10.8.4/version.txt index 2e7ca5b02..2e7ca5b02 100644 --- a/src/go/collectors/go.d.plugin/modules/mysql/testdata/mariadb/v10.8.4/version.txt +++ b/src/go/plugin/go.d/modules/mysql/testdata/mariadb/v10.8.4/version.txt diff --git a/src/go/collectors/go.d.plugin/modules/mysql/testdata/mariadb/v5.5.64/global_status.txt b/src/go/plugin/go.d/modules/mysql/testdata/mariadb/v5.5.64/global_status.txt index 7c75f0619..7c75f0619 100644 --- a/src/go/collectors/go.d.plugin/modules/mysql/testdata/mariadb/v5.5.64/global_status.txt +++ b/src/go/plugin/go.d/modules/mysql/testdata/mariadb/v5.5.64/global_status.txt diff --git a/src/go/collectors/go.d.plugin/modules/mysql/testdata/mariadb/v5.5.64/global_variables.txt b/src/go/plugin/go.d/modules/mysql/testdata/mariadb/v5.5.64/global_variables.txt index 5f0906eed..5f0906eed 100644 --- a/src/go/collectors/go.d.plugin/modules/mysql/testdata/mariadb/v5.5.64/global_variables.txt +++ b/src/go/plugin/go.d/modules/mysql/testdata/mariadb/v5.5.64/global_variables.txt diff --git a/src/go/collectors/go.d.plugin/modules/mysql/testdata/mariadb/v5.5.64/process_list.txt b/src/go/plugin/go.d/modules/mysql/testdata/mariadb/v5.5.64/process_list.txt index a44ce5e70..a44ce5e70 100644 --- a/src/go/collectors/go.d.plugin/modules/mysql/testdata/mariadb/v5.5.64/process_list.txt +++ b/src/go/plugin/go.d/modules/mysql/testdata/mariadb/v5.5.64/process_list.txt diff --git a/src/go/collectors/go.d.plugin/modules/mysql/testdata/mariadb/v5.5.64/version.txt b/src/go/plugin/go.d/modules/mysql/testdata/mariadb/v5.5.64/version.txt index de684279d..de684279d 100644 --- a/src/go/collectors/go.d.plugin/modules/mysql/testdata/mariadb/v5.5.64/version.txt +++ b/src/go/plugin/go.d/modules/mysql/testdata/mariadb/v5.5.64/version.txt diff --git a/src/go/collectors/go.d.plugin/modules/mysql/testdata/mysql/v8.0.30/global_status.txt b/src/go/plugin/go.d/modules/mysql/testdata/mysql/v8.0.30/global_status.txt index a4b2f2f93..a4b2f2f93 100644 --- a/src/go/collectors/go.d.plugin/modules/mysql/testdata/mysql/v8.0.30/global_status.txt +++ b/src/go/plugin/go.d/modules/mysql/testdata/mysql/v8.0.30/global_status.txt diff --git a/src/go/collectors/go.d.plugin/modules/mysql/testdata/mysql/v8.0.30/global_variables.txt b/src/go/plugin/go.d/modules/mysql/testdata/mysql/v8.0.30/global_variables.txt index 02be0ae8e..02be0ae8e 100644 --- a/src/go/collectors/go.d.plugin/modules/mysql/testdata/mysql/v8.0.30/global_variables.txt +++ b/src/go/plugin/go.d/modules/mysql/testdata/mysql/v8.0.30/global_variables.txt diff --git a/src/go/collectors/go.d.plugin/modules/mysql/testdata/mysql/v8.0.30/process_list.txt b/src/go/plugin/go.d/modules/mysql/testdata/mysql/v8.0.30/process_list.txt index a44ce5e70..a44ce5e70 100644 --- a/src/go/collectors/go.d.plugin/modules/mysql/testdata/mysql/v8.0.30/process_list.txt +++ b/src/go/plugin/go.d/modules/mysql/testdata/mysql/v8.0.30/process_list.txt diff --git a/src/go/collectors/go.d.plugin/modules/mysql/testdata/mysql/v8.0.30/replica_status_multi_source.txt b/src/go/plugin/go.d/modules/mysql/testdata/mysql/v8.0.30/replica_status_multi_source.txt index 8a5e06836..8a5e06836 100644 --- a/src/go/collectors/go.d.plugin/modules/mysql/testdata/mysql/v8.0.30/replica_status_multi_source.txt +++ b/src/go/plugin/go.d/modules/mysql/testdata/mysql/v8.0.30/replica_status_multi_source.txt diff --git a/src/go/collectors/go.d.plugin/modules/mysql/testdata/mysql/v8.0.30/version.txt b/src/go/plugin/go.d/modules/mysql/testdata/mysql/v8.0.30/version.txt index 5c553b1ad..5c553b1ad 100644 --- a/src/go/collectors/go.d.plugin/modules/mysql/testdata/mysql/v8.0.30/version.txt +++ b/src/go/plugin/go.d/modules/mysql/testdata/mysql/v8.0.30/version.txt diff --git a/src/go/collectors/go.d.plugin/modules/mysql/testdata/percona/v8.0.29/global_status.txt b/src/go/plugin/go.d/modules/mysql/testdata/percona/v8.0.29/global_status.txt index d7ee5741a..d7ee5741a 100644 --- a/src/go/collectors/go.d.plugin/modules/mysql/testdata/percona/v8.0.29/global_status.txt +++ b/src/go/plugin/go.d/modules/mysql/testdata/percona/v8.0.29/global_status.txt diff --git a/src/go/collectors/go.d.plugin/modules/mysql/testdata/percona/v8.0.29/global_variables.txt b/src/go/plugin/go.d/modules/mysql/testdata/percona/v8.0.29/global_variables.txt index 02be0ae8e..02be0ae8e 100644 --- a/src/go/collectors/go.d.plugin/modules/mysql/testdata/percona/v8.0.29/global_variables.txt +++ b/src/go/plugin/go.d/modules/mysql/testdata/percona/v8.0.29/global_variables.txt diff --git a/src/go/collectors/go.d.plugin/modules/mysql/testdata/percona/v8.0.29/process_list.txt b/src/go/plugin/go.d/modules/mysql/testdata/percona/v8.0.29/process_list.txt index a44ce5e70..a44ce5e70 100644 --- a/src/go/collectors/go.d.plugin/modules/mysql/testdata/percona/v8.0.29/process_list.txt +++ b/src/go/plugin/go.d/modules/mysql/testdata/percona/v8.0.29/process_list.txt diff --git a/src/go/collectors/go.d.plugin/modules/mysql/testdata/percona/v8.0.29/user_statistics.txt b/src/go/plugin/go.d/modules/mysql/testdata/percona/v8.0.29/user_statistics.txt index d7c206e47..d7c206e47 100644 --- a/src/go/collectors/go.d.plugin/modules/mysql/testdata/percona/v8.0.29/user_statistics.txt +++ b/src/go/plugin/go.d/modules/mysql/testdata/percona/v8.0.29/user_statistics.txt diff --git a/src/go/collectors/go.d.plugin/modules/mysql/testdata/percona/v8.0.29/version.txt b/src/go/plugin/go.d/modules/mysql/testdata/percona/v8.0.29/version.txt index dede361ef..dede361ef 100644 --- a/src/go/collectors/go.d.plugin/modules/mysql/testdata/percona/v8.0.29/version.txt +++ b/src/go/plugin/go.d/modules/mysql/testdata/percona/v8.0.29/version.txt diff --git a/src/go/collectors/go.d.plugin/modules/mysql/testdata/session_variables.txt b/src/go/plugin/go.d/modules/mysql/testdata/session_variables.txt index 358750607..358750607 100644 --- a/src/go/collectors/go.d.plugin/modules/mysql/testdata/session_variables.txt +++ b/src/go/plugin/go.d/modules/mysql/testdata/session_variables.txt diff --git a/src/go/collectors/go.d.plugin/modules/nginx/README.md b/src/go/plugin/go.d/modules/nginx/README.md index 7b19fe44f..7b19fe44f 120000 --- a/src/go/collectors/go.d.plugin/modules/nginx/README.md +++ b/src/go/plugin/go.d/modules/nginx/README.md diff --git a/src/go/collectors/go.d.plugin/modules/nginx/apiclient.go b/src/go/plugin/go.d/modules/nginx/apiclient.go index 8e1003b44..53d9f2245 100644 --- a/src/go/collectors/go.d.plugin/modules/nginx/apiclient.go +++ b/src/go/plugin/go.d/modules/nginx/apiclient.go @@ -11,7 +11,7 @@ import ( "strconv" "strings" - "github.com/netdata/netdata/go/go.d.plugin/pkg/web" + "github.com/netdata/netdata/go/plugins/plugin/go.d/pkg/web" ) const ( diff --git a/src/go/collectors/go.d.plugin/modules/nginx/charts.go b/src/go/plugin/go.d/modules/nginx/charts.go index 95f9d8aaf..3415fbae8 100644 --- a/src/go/collectors/go.d.plugin/modules/nginx/charts.go +++ b/src/go/plugin/go.d/modules/nginx/charts.go @@ -2,7 +2,7 @@ package nginx -import "github.com/netdata/netdata/go/go.d.plugin/agent/module" +import "github.com/netdata/netdata/go/plugins/plugin/go.d/agent/module" type ( // Charts is an alias for module.Charts diff --git a/src/go/collectors/go.d.plugin/modules/nginx/collect.go b/src/go/plugin/go.d/modules/nginx/collect.go index 533f98808..459570ae5 100644 --- a/src/go/collectors/go.d.plugin/modules/nginx/collect.go +++ b/src/go/plugin/go.d/modules/nginx/collect.go @@ -3,7 +3,7 @@ package nginx import ( - "github.com/netdata/netdata/go/go.d.plugin/pkg/stm" + "github.com/netdata/netdata/go/plugins/plugin/go.d/pkg/stm" ) func (n *Nginx) collect() (map[string]int64, error) { diff --git a/src/go/collectors/go.d.plugin/modules/nginx/config_schema.json b/src/go/plugin/go.d/modules/nginx/config_schema.json index ed361b420..25fead781 100644 --- a/src/go/collectors/go.d.plugin/modules/nginx/config_schema.json +++ b/src/go/plugin/go.d/modules/nginx/config_schema.json @@ -167,6 +167,12 @@ "timeout": { "ui:help": "Accepts decimals for precise control (e.g., type 1.5 for 1.5 seconds)." }, + "username": { + "ui:widget": "password" + }, + "proxy_username": { + "ui:widget": "password" + }, "password": { "ui:widget": "password" }, diff --git a/src/go/collectors/go.d.plugin/modules/nginx/integrations/nginx.md b/src/go/plugin/go.d/modules/nginx/integrations/nginx.md index 63b580992..6d8338a10 100644 --- a/src/go/collectors/go.d.plugin/modules/nginx/integrations/nginx.md +++ b/src/go/plugin/go.d/modules/nginx/integrations/nginx.md @@ -1,6 +1,6 @@ <!--startmeta -custom_edit_url: "https://github.com/netdata/netdata/edit/master/src/go/collectors/go.d.plugin/modules/nginx/README.md" -meta_yaml: "https://github.com/netdata/netdata/edit/master/src/go/collectors/go.d.plugin/modules/nginx/metadata.yaml" +custom_edit_url: "https://github.com/netdata/netdata/edit/master/src/go/plugin/go.d/modules/nginx/README.md" +meta_yaml: "https://github.com/netdata/netdata/edit/master/src/go/plugin/go.d/modules/nginx/metadata.yaml" sidebar_label: "NGINX" learn_status: "Published" learn_rel_path: "Collecting Metrics/Web Servers and Web Proxies" @@ -207,6 +207,8 @@ jobs: ### Debug Mode +**Important**: Debug mode is not supported for data collection jobs created via the UI using the Dyncfg feature. + To troubleshoot issues with the `nginx` collector, run the `go.d.plugin` with the debug option enabled. The output should give you clues as to why the collector isn't working. @@ -229,4 +231,37 @@ should give you clues as to why the collector isn't working. ./go.d.plugin -d -m nginx ``` +### Getting Logs + +If you're encountering problems with the `nginx` collector, follow these steps to retrieve logs and identify potential issues: + +- **Run the command** specific to your system (systemd, non-systemd, or Docker container). +- **Examine the output** for any warnings or error messages that might indicate issues. These messages should provide clues about the root cause of the problem. + +#### System with systemd + +Use the following command to view logs generated since the last Netdata service restart: + +```bash +journalctl _SYSTEMD_INVOCATION_ID="$(systemctl show --value --property=InvocationID netdata)" --namespace=netdata --grep nginx +``` + +#### System without systemd + +Locate the collector log file, typically at `/var/log/netdata/collector.log`, and use `grep` to filter for collector's name: + +```bash +grep nginx /var/log/netdata/collector.log +``` + +**Note**: This method shows logs from all restarts. Focus on the **latest entries** for troubleshooting current issues. + +#### Docker Container + +If your Netdata runs in a Docker container named "netdata" (replace if different), use this command: + +```bash +docker logs netdata 2>&1 | grep nginx +``` + diff --git a/src/go/collectors/go.d.plugin/modules/nginx/metadata.yaml b/src/go/plugin/go.d/modules/nginx/metadata.yaml index 49b12c4ec..49b12c4ec 100644 --- a/src/go/collectors/go.d.plugin/modules/nginx/metadata.yaml +++ b/src/go/plugin/go.d/modules/nginx/metadata.yaml diff --git a/src/go/collectors/go.d.plugin/modules/nginx/metrics.go b/src/go/plugin/go.d/modules/nginx/metrics.go index 66e6a160e..66e6a160e 100644 --- a/src/go/collectors/go.d.plugin/modules/nginx/metrics.go +++ b/src/go/plugin/go.d/modules/nginx/metrics.go diff --git a/src/go/collectors/go.d.plugin/modules/nginx/nginx.go b/src/go/plugin/go.d/modules/nginx/nginx.go index 2feb6bb0b..4a8e77439 100644 --- a/src/go/collectors/go.d.plugin/modules/nginx/nginx.go +++ b/src/go/plugin/go.d/modules/nginx/nginx.go @@ -7,8 +7,8 @@ import ( "errors" "time" - "github.com/netdata/netdata/go/go.d.plugin/agent/module" - "github.com/netdata/netdata/go/go.d.plugin/pkg/web" + "github.com/netdata/netdata/go/plugins/plugin/go.d/agent/module" + "github.com/netdata/netdata/go/plugins/plugin/go.d/pkg/web" ) //go:embed "config_schema.json" diff --git a/src/go/collectors/go.d.plugin/modules/nginx/nginx_test.go b/src/go/plugin/go.d/modules/nginx/nginx_test.go index 68308d141..255ea384c 100644 --- a/src/go/collectors/go.d.plugin/modules/nginx/nginx_test.go +++ b/src/go/plugin/go.d/modules/nginx/nginx_test.go @@ -8,7 +8,7 @@ import ( "os" "testing" - "github.com/netdata/netdata/go/go.d.plugin/agent/module" + "github.com/netdata/netdata/go/plugins/plugin/go.d/agent/module" "github.com/stretchr/testify/assert" "github.com/stretchr/testify/require" diff --git a/src/go/collectors/go.d.plugin/modules/nginxvts/testdata/config.json b/src/go/plugin/go.d/modules/nginx/testdata/config.json index 984c3ed6e..984c3ed6e 100644 --- a/src/go/collectors/go.d.plugin/modules/nginxvts/testdata/config.json +++ b/src/go/plugin/go.d/modules/nginx/testdata/config.json diff --git a/src/go/collectors/go.d.plugin/modules/nginxvts/testdata/config.yaml b/src/go/plugin/go.d/modules/nginx/testdata/config.yaml index 8558b61cc..8558b61cc 100644 --- a/src/go/collectors/go.d.plugin/modules/nginxvts/testdata/config.yaml +++ b/src/go/plugin/go.d/modules/nginx/testdata/config.yaml diff --git a/src/go/collectors/go.d.plugin/modules/nginx/testdata/status.txt b/src/go/plugin/go.d/modules/nginx/testdata/status.txt index f4835bef4..f4835bef4 100644 --- a/src/go/collectors/go.d.plugin/modules/nginx/testdata/status.txt +++ b/src/go/plugin/go.d/modules/nginx/testdata/status.txt diff --git a/src/go/collectors/go.d.plugin/modules/nginx/testdata/tengine-status.txt b/src/go/plugin/go.d/modules/nginx/testdata/tengine-status.txt index 1e6a62c21..1e6a62c21 100644 --- a/src/go/collectors/go.d.plugin/modules/nginx/testdata/tengine-status.txt +++ b/src/go/plugin/go.d/modules/nginx/testdata/tengine-status.txt diff --git a/src/go/collectors/go.d.plugin/modules/nginxplus/README.md b/src/go/plugin/go.d/modules/nginxplus/README.md index 16cb6c1b7..16cb6c1b7 120000 --- a/src/go/collectors/go.d.plugin/modules/nginxplus/README.md +++ b/src/go/plugin/go.d/modules/nginxplus/README.md diff --git a/src/go/collectors/go.d.plugin/modules/nginxplus/cache.go b/src/go/plugin/go.d/modules/nginxplus/cache.go index af58f3a55..af58f3a55 100644 --- a/src/go/collectors/go.d.plugin/modules/nginxplus/cache.go +++ b/src/go/plugin/go.d/modules/nginxplus/cache.go diff --git a/src/go/collectors/go.d.plugin/modules/nginxplus/charts.go b/src/go/plugin/go.d/modules/nginxplus/charts.go index c50390984..6070ee03b 100644 --- a/src/go/collectors/go.d.plugin/modules/nginxplus/charts.go +++ b/src/go/plugin/go.d/modules/nginxplus/charts.go @@ -6,7 +6,7 @@ import ( "fmt" "strings" - "github.com/netdata/netdata/go/go.d.plugin/agent/module" + "github.com/netdata/netdata/go/plugins/plugin/go.d/agent/module" ) const ( diff --git a/src/go/collectors/go.d.plugin/modules/nginxplus/collect.go b/src/go/plugin/go.d/modules/nginxplus/collect.go index f986778ba..f986778ba 100644 --- a/src/go/collectors/go.d.plugin/modules/nginxplus/collect.go +++ b/src/go/plugin/go.d/modules/nginxplus/collect.go diff --git a/src/go/collectors/go.d.plugin/modules/nginxplus/config_schema.json b/src/go/plugin/go.d/modules/nginxplus/config_schema.json index 937c528d1..fd4c38ef1 100644 --- a/src/go/collectors/go.d.plugin/modules/nginxplus/config_schema.json +++ b/src/go/plugin/go.d/modules/nginxplus/config_schema.json @@ -167,6 +167,12 @@ "timeout": { "ui:help": "Accepts decimals for precise control (e.g., type 1.5 for 1.5 seconds)." }, + "username": { + "ui:widget": "password" + }, + "proxy_username": { + "ui:widget": "password" + }, "password": { "ui:widget": "password" }, diff --git a/src/go/collectors/go.d.plugin/modules/nginxplus/integrations/nginx_plus.md b/src/go/plugin/go.d/modules/nginxplus/integrations/nginx_plus.md index f0593c212..9ebb4b195 100644 --- a/src/go/collectors/go.d.plugin/modules/nginxplus/integrations/nginx_plus.md +++ b/src/go/plugin/go.d/modules/nginxplus/integrations/nginx_plus.md @@ -1,6 +1,6 @@ <!--startmeta -custom_edit_url: "https://github.com/netdata/netdata/edit/master/src/go/collectors/go.d.plugin/modules/nginxplus/README.md" -meta_yaml: "https://github.com/netdata/netdata/edit/master/src/go/collectors/go.d.plugin/modules/nginxplus/metadata.yaml" +custom_edit_url: "https://github.com/netdata/netdata/edit/master/src/go/plugin/go.d/modules/nginxplus/README.md" +meta_yaml: "https://github.com/netdata/netdata/edit/master/src/go/plugin/go.d/modules/nginxplus/metadata.yaml" sidebar_label: "NGINX Plus" learn_status: "Published" learn_rel_path: "Collecting Metrics/Web Servers and Web Proxies" @@ -388,6 +388,8 @@ jobs: ### Debug Mode +**Important**: Debug mode is not supported for data collection jobs created via the UI using the Dyncfg feature. + To troubleshoot issues with the `nginxplus` collector, run the `go.d.plugin` with the debug option enabled. The output should give you clues as to why the collector isn't working. @@ -410,4 +412,37 @@ should give you clues as to why the collector isn't working. ./go.d.plugin -d -m nginxplus ``` +### Getting Logs + +If you're encountering problems with the `nginxplus` collector, follow these steps to retrieve logs and identify potential issues: + +- **Run the command** specific to your system (systemd, non-systemd, or Docker container). +- **Examine the output** for any warnings or error messages that might indicate issues. These messages should provide clues about the root cause of the problem. + +#### System with systemd + +Use the following command to view logs generated since the last Netdata service restart: + +```bash +journalctl _SYSTEMD_INVOCATION_ID="$(systemctl show --value --property=InvocationID netdata)" --namespace=netdata --grep nginxplus +``` + +#### System without systemd + +Locate the collector log file, typically at `/var/log/netdata/collector.log`, and use `grep` to filter for collector's name: + +```bash +grep nginxplus /var/log/netdata/collector.log +``` + +**Note**: This method shows logs from all restarts. Focus on the **latest entries** for troubleshooting current issues. + +#### Docker Container + +If your Netdata runs in a Docker container named "netdata" (replace if different), use this command: + +```bash +docker logs netdata 2>&1 | grep nginxplus +``` + diff --git a/src/go/collectors/go.d.plugin/modules/nginxplus/metadata.yaml b/src/go/plugin/go.d/modules/nginxplus/metadata.yaml index 6bc3a29bd..6bc3a29bd 100644 --- a/src/go/collectors/go.d.plugin/modules/nginxplus/metadata.yaml +++ b/src/go/plugin/go.d/modules/nginxplus/metadata.yaml diff --git a/src/go/collectors/go.d.plugin/modules/nginxplus/nginx_http_api.go b/src/go/plugin/go.d/modules/nginxplus/nginx_http_api.go index 0f7999ac5..0f7999ac5 100644 --- a/src/go/collectors/go.d.plugin/modules/nginxplus/nginx_http_api.go +++ b/src/go/plugin/go.d/modules/nginxplus/nginx_http_api.go diff --git a/src/go/collectors/go.d.plugin/modules/nginxplus/nginx_http_api_query.go b/src/go/plugin/go.d/modules/nginxplus/nginx_http_api_query.go index b05ce1d7b..b54cd142a 100644 --- a/src/go/collectors/go.d.plugin/modules/nginxplus/nginx_http_api_query.go +++ b/src/go/plugin/go.d/modules/nginxplus/nginx_http_api_query.go @@ -10,7 +10,7 @@ import ( "net/http" "sync" - "github.com/netdata/netdata/go/go.d.plugin/pkg/web" + "github.com/netdata/netdata/go/plugins/plugin/go.d/pkg/web" ) const ( @@ -46,8 +46,7 @@ type nginxMetrics struct { } func (n *NginxPlus) queryAPIVersion() (int64, error) { - req, _ := web.NewHTTPRequest(n.Request.Copy()) - req.URL.Path = urlPathAPIVersions + req, _ := web.NewHTTPRequestWithPath(n.Request, urlPathAPIVersions) var versions nginxAPIVersions if err := n.doWithDecode(&versions, req); err != nil { @@ -62,8 +61,7 @@ func (n *NginxPlus) queryAPIVersion() (int64, error) { } func (n *NginxPlus) queryAvailableEndpoints() error { - req, _ := web.NewHTTPRequest(n.Request.Copy()) - req.URL.Path = fmt.Sprintf(urlPathAPIEndpointsRoot, n.apiVersion) + req, _ := web.NewHTTPRequestWithPath(n.Request, fmt.Sprintf(urlPathAPIEndpointsRoot, n.apiVersion)) var endpoints []string if err := n.doWithDecode(&endpoints, req); err != nil { @@ -91,8 +89,7 @@ func (n *NginxPlus) queryAvailableEndpoints() error { if hasHTTP { endpoints = endpoints[:0] - req, _ = web.NewHTTPRequest(n.Request.Copy()) - req.URL.Path = fmt.Sprintf(urlPathAPIEndpointsHTTP, n.apiVersion) + req, _ = web.NewHTTPRequestWithPath(n.Request, fmt.Sprintf(urlPathAPIEndpointsHTTP, n.apiVersion)) if err := n.doWithDecode(&endpoints, req); err != nil { return err @@ -117,8 +114,7 @@ func (n *NginxPlus) queryAvailableEndpoints() error { if hasStream { endpoints = endpoints[:0] - req, _ = web.NewHTTPRequest(n.Request.Copy()) - req.URL.Path = fmt.Sprintf(urlPathAPIEndpointsStream, n.apiVersion) + req, _ = web.NewHTTPRequestWithPath(n.Request, fmt.Sprintf(urlPathAPIEndpointsStream, n.apiVersion)) if err := n.doWithDecode(&endpoints, req); err != nil { return err @@ -171,8 +167,7 @@ func (n *NginxPlus) queryMetrics() *nginxMetrics { } func (n *NginxPlus) queryNginxInfo(ms *nginxMetrics) { - req, _ := web.NewHTTPRequest(n.Request.Copy()) - req.URL.Path = fmt.Sprintf(urlPathAPINginx, n.apiVersion) + req, _ := web.NewHTTPRequestWithPath(n.Request, fmt.Sprintf(urlPathAPINginx, n.apiVersion)) var v nginxInfo @@ -186,8 +181,7 @@ func (n *NginxPlus) queryNginxInfo(ms *nginxMetrics) { } func (n *NginxPlus) queryConnections(ms *nginxMetrics) { - req, _ := web.NewHTTPRequest(n.Request.Copy()) - req.URL.Path = fmt.Sprintf(urlPathAPIConnections, n.apiVersion) + req, _ := web.NewHTTPRequestWithPath(n.Request, fmt.Sprintf(urlPathAPIConnections, n.apiVersion)) var v nginxConnections @@ -201,8 +195,7 @@ func (n *NginxPlus) queryConnections(ms *nginxMetrics) { } func (n *NginxPlus) querySSL(ms *nginxMetrics) { - req, _ := web.NewHTTPRequest(n.Request.Copy()) - req.URL.Path = fmt.Sprintf(urlPathAPISSL, n.apiVersion) + req, _ := web.NewHTTPRequestWithPath(n.Request, fmt.Sprintf(urlPathAPISSL, n.apiVersion)) var v nginxSSL @@ -216,8 +209,7 @@ func (n *NginxPlus) querySSL(ms *nginxMetrics) { } func (n *NginxPlus) queryHTTPRequests(ms *nginxMetrics) { - req, _ := web.NewHTTPRequest(n.Request.Copy()) - req.URL.Path = fmt.Sprintf(urlPathAPIHTTPRequests, n.apiVersion) + req, _ := web.NewHTTPRequestWithPath(n.Request, fmt.Sprintf(urlPathAPIHTTPRequests, n.apiVersion)) var v nginxHTTPRequests @@ -231,8 +223,7 @@ func (n *NginxPlus) queryHTTPRequests(ms *nginxMetrics) { } func (n *NginxPlus) queryHTTPServerZones(ms *nginxMetrics) { - req, _ := web.NewHTTPRequest(n.Request.Copy()) - req.URL.Path = fmt.Sprintf(urlPathAPIHTTPServerZones, n.apiVersion) + req, _ := web.NewHTTPRequestWithPath(n.Request, fmt.Sprintf(urlPathAPIHTTPServerZones, n.apiVersion)) var v nginxHTTPServerZones @@ -246,8 +237,7 @@ func (n *NginxPlus) queryHTTPServerZones(ms *nginxMetrics) { } func (n *NginxPlus) queryHTTPLocationZones(ms *nginxMetrics) { - req, _ := web.NewHTTPRequest(n.Request.Copy()) - req.URL.Path = fmt.Sprintf(urlPathAPIHTTPLocationZones, n.apiVersion) + req, _ := web.NewHTTPRequestWithPath(n.Request, fmt.Sprintf(urlPathAPIHTTPLocationZones, n.apiVersion)) var v nginxHTTPLocationZones @@ -261,8 +251,7 @@ func (n *NginxPlus) queryHTTPLocationZones(ms *nginxMetrics) { } func (n *NginxPlus) queryHTTPUpstreams(ms *nginxMetrics) { - req, _ := web.NewHTTPRequest(n.Request.Copy()) - req.URL.Path = fmt.Sprintf(urlPathAPIHTTPUpstreams, n.apiVersion) + req, _ := web.NewHTTPRequestWithPath(n.Request, fmt.Sprintf(urlPathAPIHTTPUpstreams, n.apiVersion)) var v nginxHTTPUpstreams @@ -276,8 +265,7 @@ func (n *NginxPlus) queryHTTPUpstreams(ms *nginxMetrics) { } func (n *NginxPlus) queryHTTPCaches(ms *nginxMetrics) { - req, _ := web.NewHTTPRequest(n.Request.Copy()) - req.URL.Path = fmt.Sprintf(urlPathAPIHTTPCaches, n.apiVersion) + req, _ := web.NewHTTPRequestWithPath(n.Request, fmt.Sprintf(urlPathAPIHTTPCaches, n.apiVersion)) var v nginxHTTPCaches @@ -291,8 +279,7 @@ func (n *NginxPlus) queryHTTPCaches(ms *nginxMetrics) { } func (n *NginxPlus) queryStreamServerZones(ms *nginxMetrics) { - req, _ := web.NewHTTPRequest(n.Request.Copy()) - req.URL.Path = fmt.Sprintf(urlPathAPIStreamServerZones, n.apiVersion) + req, _ := web.NewHTTPRequestWithPath(n.Request, fmt.Sprintf(urlPathAPIStreamServerZones, n.apiVersion)) var v nginxStreamServerZones @@ -306,8 +293,7 @@ func (n *NginxPlus) queryStreamServerZones(ms *nginxMetrics) { } func (n *NginxPlus) queryStreamUpstreams(ms *nginxMetrics) { - req, _ := web.NewHTTPRequest(n.Request.Copy()) - req.URL.Path = fmt.Sprintf(urlPathAPIStreamUpstreams, n.apiVersion) + req, _ := web.NewHTTPRequestWithPath(n.Request, fmt.Sprintf(urlPathAPIStreamUpstreams, n.apiVersion)) var v nginxStreamUpstreams @@ -321,8 +307,7 @@ func (n *NginxPlus) queryStreamUpstreams(ms *nginxMetrics) { } func (n *NginxPlus) queryResolvers(ms *nginxMetrics) { - req, _ := web.NewHTTPRequest(n.Request.Copy()) - req.URL.Path = fmt.Sprintf(urlPathAPIResolvers, n.apiVersion) + req, _ := web.NewHTTPRequestWithPath(n.Request, fmt.Sprintf(urlPathAPIResolvers, n.apiVersion)) var v nginxResolvers diff --git a/src/go/collectors/go.d.plugin/modules/nginxplus/nginxplus.go b/src/go/plugin/go.d/modules/nginxplus/nginxplus.go index 3a0c2f97c..f737e6819 100644 --- a/src/go/collectors/go.d.plugin/modules/nginxplus/nginxplus.go +++ b/src/go/plugin/go.d/modules/nginxplus/nginxplus.go @@ -8,8 +8,8 @@ import ( "net/http" "time" - "github.com/netdata/netdata/go/go.d.plugin/agent/module" - "github.com/netdata/netdata/go/go.d.plugin/pkg/web" + "github.com/netdata/netdata/go/plugins/plugin/go.d/agent/module" + "github.com/netdata/netdata/go/plugins/plugin/go.d/pkg/web" ) //go:embed "config_schema.json" diff --git a/src/go/collectors/go.d.plugin/modules/nginxplus/nginxplus_test.go b/src/go/plugin/go.d/modules/nginxplus/nginxplus_test.go index 7c6f4fc76..2628cc688 100644 --- a/src/go/collectors/go.d.plugin/modules/nginxplus/nginxplus_test.go +++ b/src/go/plugin/go.d/modules/nginxplus/nginxplus_test.go @@ -9,8 +9,8 @@ import ( "os" "testing" - "github.com/netdata/netdata/go/go.d.plugin/agent/module" - "github.com/netdata/netdata/go/go.d.plugin/pkg/web" + "github.com/netdata/netdata/go/plugins/plugin/go.d/agent/module" + "github.com/netdata/netdata/go/plugins/plugin/go.d/pkg/web" "github.com/stretchr/testify/assert" "github.com/stretchr/testify/require" diff --git a/src/go/collectors/go.d.plugin/modules/nginxplus/testdata/404.json b/src/go/plugin/go.d/modules/nginxplus/testdata/404.json index d2ed8c9a8..d2ed8c9a8 100644 --- a/src/go/collectors/go.d.plugin/modules/nginxplus/testdata/404.json +++ b/src/go/plugin/go.d/modules/nginxplus/testdata/404.json diff --git a/src/go/collectors/go.d.plugin/modules/nginxplus/testdata/api-8/api_versions.json b/src/go/plugin/go.d/modules/nginxplus/testdata/api-8/api_versions.json index 9ffc33973..9ffc33973 100644 --- a/src/go/collectors/go.d.plugin/modules/nginxplus/testdata/api-8/api_versions.json +++ b/src/go/plugin/go.d/modules/nginxplus/testdata/api-8/api_versions.json diff --git a/src/go/collectors/go.d.plugin/modules/nginxplus/testdata/api-8/connections.json b/src/go/plugin/go.d/modules/nginxplus/testdata/api-8/connections.json index 490ca13fc..490ca13fc 100644 --- a/src/go/collectors/go.d.plugin/modules/nginxplus/testdata/api-8/connections.json +++ b/src/go/plugin/go.d/modules/nginxplus/testdata/api-8/connections.json diff --git a/src/go/collectors/go.d.plugin/modules/nginxplus/testdata/api-8/endpoints_http.json b/src/go/plugin/go.d/modules/nginxplus/testdata/api-8/endpoints_http.json index 57c4e4aa2..57c4e4aa2 100644 --- a/src/go/collectors/go.d.plugin/modules/nginxplus/testdata/api-8/endpoints_http.json +++ b/src/go/plugin/go.d/modules/nginxplus/testdata/api-8/endpoints_http.json diff --git a/src/go/collectors/go.d.plugin/modules/nginxplus/testdata/api-8/endpoints_root.json b/src/go/plugin/go.d/modules/nginxplus/testdata/api-8/endpoints_root.json index b185c55f2..b185c55f2 100644 --- a/src/go/collectors/go.d.plugin/modules/nginxplus/testdata/api-8/endpoints_root.json +++ b/src/go/plugin/go.d/modules/nginxplus/testdata/api-8/endpoints_root.json diff --git a/src/go/collectors/go.d.plugin/modules/nginxplus/testdata/api-8/endpoints_stream.json b/src/go/plugin/go.d/modules/nginxplus/testdata/api-8/endpoints_stream.json index 0da092376..0da092376 100644 --- a/src/go/collectors/go.d.plugin/modules/nginxplus/testdata/api-8/endpoints_stream.json +++ b/src/go/plugin/go.d/modules/nginxplus/testdata/api-8/endpoints_stream.json diff --git a/src/go/collectors/go.d.plugin/modules/nginxplus/testdata/api-8/http_caches.json b/src/go/plugin/go.d/modules/nginxplus/testdata/api-8/http_caches.json index dd2d03adf..dd2d03adf 100644 --- a/src/go/collectors/go.d.plugin/modules/nginxplus/testdata/api-8/http_caches.json +++ b/src/go/plugin/go.d/modules/nginxplus/testdata/api-8/http_caches.json diff --git a/src/go/collectors/go.d.plugin/modules/nginxplus/testdata/api-8/http_location_zones.json b/src/go/plugin/go.d/modules/nginxplus/testdata/api-8/http_location_zones.json index 8812e6dff..8812e6dff 100644 --- a/src/go/collectors/go.d.plugin/modules/nginxplus/testdata/api-8/http_location_zones.json +++ b/src/go/plugin/go.d/modules/nginxplus/testdata/api-8/http_location_zones.json diff --git a/src/go/collectors/go.d.plugin/modules/nginxplus/testdata/api-8/http_requests.json b/src/go/plugin/go.d/modules/nginxplus/testdata/api-8/http_requests.json index 0c2a17503..0c2a17503 100644 --- a/src/go/collectors/go.d.plugin/modules/nginxplus/testdata/api-8/http_requests.json +++ b/src/go/plugin/go.d/modules/nginxplus/testdata/api-8/http_requests.json diff --git a/src/go/collectors/go.d.plugin/modules/nginxplus/testdata/api-8/http_server_zones.json b/src/go/plugin/go.d/modules/nginxplus/testdata/api-8/http_server_zones.json index c25389210..c25389210 100644 --- a/src/go/collectors/go.d.plugin/modules/nginxplus/testdata/api-8/http_server_zones.json +++ b/src/go/plugin/go.d/modules/nginxplus/testdata/api-8/http_server_zones.json diff --git a/src/go/collectors/go.d.plugin/modules/nginxplus/testdata/api-8/http_upstreams.json b/src/go/plugin/go.d/modules/nginxplus/testdata/api-8/http_upstreams.json index 0f7ba7135..0f7ba7135 100644 --- a/src/go/collectors/go.d.plugin/modules/nginxplus/testdata/api-8/http_upstreams.json +++ b/src/go/plugin/go.d/modules/nginxplus/testdata/api-8/http_upstreams.json diff --git a/src/go/collectors/go.d.plugin/modules/nginxplus/testdata/api-8/nginx.json b/src/go/plugin/go.d/modules/nginxplus/testdata/api-8/nginx.json index 4480c2bcc..4480c2bcc 100644 --- a/src/go/collectors/go.d.plugin/modules/nginxplus/testdata/api-8/nginx.json +++ b/src/go/plugin/go.d/modules/nginxplus/testdata/api-8/nginx.json diff --git a/src/go/collectors/go.d.plugin/modules/nginxplus/testdata/api-8/resolvers.json b/src/go/plugin/go.d/modules/nginxplus/testdata/api-8/resolvers.json index ad66f5584..ad66f5584 100644 --- a/src/go/collectors/go.d.plugin/modules/nginxplus/testdata/api-8/resolvers.json +++ b/src/go/plugin/go.d/modules/nginxplus/testdata/api-8/resolvers.json diff --git a/src/go/collectors/go.d.plugin/modules/nginxplus/testdata/api-8/ssl.json b/src/go/plugin/go.d/modules/nginxplus/testdata/api-8/ssl.json index 2ca8a6a3e..2ca8a6a3e 100644 --- a/src/go/collectors/go.d.plugin/modules/nginxplus/testdata/api-8/ssl.json +++ b/src/go/plugin/go.d/modules/nginxplus/testdata/api-8/ssl.json diff --git a/src/go/collectors/go.d.plugin/modules/nginxplus/testdata/api-8/stream_server_zones.json b/src/go/plugin/go.d/modules/nginxplus/testdata/api-8/stream_server_zones.json index 0c7df7873..0c7df7873 100644 --- a/src/go/collectors/go.d.plugin/modules/nginxplus/testdata/api-8/stream_server_zones.json +++ b/src/go/plugin/go.d/modules/nginxplus/testdata/api-8/stream_server_zones.json diff --git a/src/go/collectors/go.d.plugin/modules/nginxplus/testdata/api-8/stream_upstreams.json b/src/go/plugin/go.d/modules/nginxplus/testdata/api-8/stream_upstreams.json index 707ad4db7..707ad4db7 100644 --- a/src/go/collectors/go.d.plugin/modules/nginxplus/testdata/api-8/stream_upstreams.json +++ b/src/go/plugin/go.d/modules/nginxplus/testdata/api-8/stream_upstreams.json diff --git a/src/go/collectors/go.d.plugin/modules/phpdaemon/testdata/config.json b/src/go/plugin/go.d/modules/nginxplus/testdata/config.json index 984c3ed6e..984c3ed6e 100644 --- a/src/go/collectors/go.d.plugin/modules/phpdaemon/testdata/config.json +++ b/src/go/plugin/go.d/modules/nginxplus/testdata/config.json diff --git a/src/go/collectors/go.d.plugin/modules/phpdaemon/testdata/config.yaml b/src/go/plugin/go.d/modules/nginxplus/testdata/config.yaml index 8558b61cc..8558b61cc 100644 --- a/src/go/collectors/go.d.plugin/modules/phpdaemon/testdata/config.yaml +++ b/src/go/plugin/go.d/modules/nginxplus/testdata/config.yaml diff --git a/src/go/collectors/go.d.plugin/modules/nginxvts/README.md b/src/go/plugin/go.d/modules/nginxvts/README.md index e185fa81b..e185fa81b 120000 --- a/src/go/collectors/go.d.plugin/modules/nginxvts/README.md +++ b/src/go/plugin/go.d/modules/nginxvts/README.md diff --git a/src/go/collectors/go.d.plugin/modules/nginxvts/charts.go b/src/go/plugin/go.d/modules/nginxvts/charts.go index 6fc859ed5..8dad7910f 100644 --- a/src/go/collectors/go.d.plugin/modules/nginxvts/charts.go +++ b/src/go/plugin/go.d/modules/nginxvts/charts.go @@ -2,7 +2,7 @@ package nginxvts -import "github.com/netdata/netdata/go/go.d.plugin/agent/module" +import "github.com/netdata/netdata/go/plugins/plugin/go.d/agent/module" var mainCharts = module.Charts{ { diff --git a/src/go/collectors/go.d.plugin/modules/nginxvts/collect.go b/src/go/plugin/go.d/modules/nginxvts/collect.go index c4c389682..02fe7cb65 100644 --- a/src/go/collectors/go.d.plugin/modules/nginxvts/collect.go +++ b/src/go/plugin/go.d/modules/nginxvts/collect.go @@ -8,8 +8,8 @@ import ( "io" "net/http" - "github.com/netdata/netdata/go/go.d.plugin/pkg/stm" - "github.com/netdata/netdata/go/go.d.plugin/pkg/web" + "github.com/netdata/netdata/go/plugins/plugin/go.d/pkg/stm" + "github.com/netdata/netdata/go/plugins/plugin/go.d/pkg/web" ) func (vts *NginxVTS) collect() (map[string]int64, error) { diff --git a/src/go/collectors/go.d.plugin/modules/nginxvts/config_schema.json b/src/go/plugin/go.d/modules/nginxvts/config_schema.json index 1abcdb658..ef6a1d237 100644 --- a/src/go/collectors/go.d.plugin/modules/nginxvts/config_schema.json +++ b/src/go/plugin/go.d/modules/nginxvts/config_schema.json @@ -166,6 +166,12 @@ "timeout": { "ui:help": "Accepts decimals for precise control (e.g., type 1.5 for 1.5 seconds)." }, + "username": { + "ui:widget": "password" + }, + "proxy_username": { + "ui:widget": "password" + }, "password": { "ui:widget": "password" }, diff --git a/src/go/collectors/go.d.plugin/modules/nginxvts/init.go b/src/go/plugin/go.d/modules/nginxvts/init.go index 17ff63020..2e738e4d1 100644 --- a/src/go/collectors/go.d.plugin/modules/nginxvts/init.go +++ b/src/go/plugin/go.d/modules/nginxvts/init.go @@ -6,8 +6,8 @@ import ( "errors" "net/http" - "github.com/netdata/netdata/go/go.d.plugin/agent/module" - "github.com/netdata/netdata/go/go.d.plugin/pkg/web" + "github.com/netdata/netdata/go/plugins/plugin/go.d/agent/module" + "github.com/netdata/netdata/go/plugins/plugin/go.d/pkg/web" ) func (vts *NginxVTS) validateConfig() error { diff --git a/src/go/collectors/go.d.plugin/modules/nginxvts/integrations/nginx_vts.md b/src/go/plugin/go.d/modules/nginxvts/integrations/nginx_vts.md index cc1f30475..59918b39e 100644 --- a/src/go/collectors/go.d.plugin/modules/nginxvts/integrations/nginx_vts.md +++ b/src/go/plugin/go.d/modules/nginxvts/integrations/nginx_vts.md @@ -1,6 +1,6 @@ <!--startmeta -custom_edit_url: "https://github.com/netdata/netdata/edit/master/src/go/collectors/go.d.plugin/modules/nginxvts/README.md" -meta_yaml: "https://github.com/netdata/netdata/edit/master/src/go/collectors/go.d.plugin/modules/nginxvts/metadata.yaml" +custom_edit_url: "https://github.com/netdata/netdata/edit/master/src/go/plugin/go.d/modules/nginxvts/README.md" +meta_yaml: "https://github.com/netdata/netdata/edit/master/src/go/plugin/go.d/modules/nginxvts/metadata.yaml" sidebar_label: "NGINX VTS" learn_status: "Published" learn_rel_path: "Collecting Metrics/Web Servers and Web Proxies" @@ -208,6 +208,8 @@ jobs: ### Debug Mode +**Important**: Debug mode is not supported for data collection jobs created via the UI using the Dyncfg feature. + To troubleshoot issues with the `nginxvts` collector, run the `go.d.plugin` with the debug option enabled. The output should give you clues as to why the collector isn't working. @@ -230,4 +232,37 @@ should give you clues as to why the collector isn't working. ./go.d.plugin -d -m nginxvts ``` +### Getting Logs + +If you're encountering problems with the `nginxvts` collector, follow these steps to retrieve logs and identify potential issues: + +- **Run the command** specific to your system (systemd, non-systemd, or Docker container). +- **Examine the output** for any warnings or error messages that might indicate issues. These messages should provide clues about the root cause of the problem. + +#### System with systemd + +Use the following command to view logs generated since the last Netdata service restart: + +```bash +journalctl _SYSTEMD_INVOCATION_ID="$(systemctl show --value --property=InvocationID netdata)" --namespace=netdata --grep nginxvts +``` + +#### System without systemd + +Locate the collector log file, typically at `/var/log/netdata/collector.log`, and use `grep` to filter for collector's name: + +```bash +grep nginxvts /var/log/netdata/collector.log +``` + +**Note**: This method shows logs from all restarts. Focus on the **latest entries** for troubleshooting current issues. + +#### Docker Container + +If your Netdata runs in a Docker container named "netdata" (replace if different), use this command: + +```bash +docker logs netdata 2>&1 | grep nginxvts +``` + diff --git a/src/go/collectors/go.d.plugin/modules/nginxvts/metadata.yaml b/src/go/plugin/go.d/modules/nginxvts/metadata.yaml index bb602863b..bb602863b 100644 --- a/src/go/collectors/go.d.plugin/modules/nginxvts/metadata.yaml +++ b/src/go/plugin/go.d/modules/nginxvts/metadata.yaml diff --git a/src/go/collectors/go.d.plugin/modules/nginxvts/metrics.go b/src/go/plugin/go.d/modules/nginxvts/metrics.go index 2674d4bbe..2674d4bbe 100644 --- a/src/go/collectors/go.d.plugin/modules/nginxvts/metrics.go +++ b/src/go/plugin/go.d/modules/nginxvts/metrics.go diff --git a/src/go/collectors/go.d.plugin/modules/nginxvts/nginxvts.go b/src/go/plugin/go.d/modules/nginxvts/nginxvts.go index ad3aaf1e7..56868ff0a 100644 --- a/src/go/collectors/go.d.plugin/modules/nginxvts/nginxvts.go +++ b/src/go/plugin/go.d/modules/nginxvts/nginxvts.go @@ -8,8 +8,8 @@ import ( "net/http" "time" - "github.com/netdata/netdata/go/go.d.plugin/agent/module" - "github.com/netdata/netdata/go/go.d.plugin/pkg/web" + "github.com/netdata/netdata/go/plugins/plugin/go.d/agent/module" + "github.com/netdata/netdata/go/plugins/plugin/go.d/pkg/web" ) //go:embed "config_schema.json" diff --git a/src/go/collectors/go.d.plugin/modules/nginxvts/nginxvts_test.go b/src/go/plugin/go.d/modules/nginxvts/nginxvts_test.go index b9140c069..f4c110372 100644 --- a/src/go/collectors/go.d.plugin/modules/nginxvts/nginxvts_test.go +++ b/src/go/plugin/go.d/modules/nginxvts/nginxvts_test.go @@ -8,9 +8,9 @@ import ( "os" "testing" - "github.com/netdata/netdata/go/go.d.plugin/agent/module" - "github.com/netdata/netdata/go/go.d.plugin/pkg/tlscfg" - "github.com/netdata/netdata/go/go.d.plugin/pkg/web" + "github.com/netdata/netdata/go/plugins/plugin/go.d/agent/module" + "github.com/netdata/netdata/go/plugins/plugin/go.d/pkg/tlscfg" + "github.com/netdata/netdata/go/plugins/plugin/go.d/pkg/web" "github.com/stretchr/testify/assert" "github.com/stretchr/testify/require" diff --git a/src/go/collectors/go.d.plugin/modules/powerdns/testdata/config.json b/src/go/plugin/go.d/modules/nginxvts/testdata/config.json index 984c3ed6e..984c3ed6e 100644 --- a/src/go/collectors/go.d.plugin/modules/powerdns/testdata/config.json +++ b/src/go/plugin/go.d/modules/nginxvts/testdata/config.json diff --git a/src/go/collectors/go.d.plugin/modules/powerdns/testdata/config.yaml b/src/go/plugin/go.d/modules/nginxvts/testdata/config.yaml index 8558b61cc..8558b61cc 100644 --- a/src/go/collectors/go.d.plugin/modules/powerdns/testdata/config.yaml +++ b/src/go/plugin/go.d/modules/nginxvts/testdata/config.yaml diff --git a/src/go/collectors/go.d.plugin/modules/nginxvts/testdata/vts-v0.1.18.json b/src/go/plugin/go.d/modules/nginxvts/testdata/vts-v0.1.18.json index cdc331d5f..cdc331d5f 100644 --- a/src/go/collectors/go.d.plugin/modules/nginxvts/testdata/vts-v0.1.18.json +++ b/src/go/plugin/go.d/modules/nginxvts/testdata/vts-v0.1.18.json diff --git a/src/go/plugin/go.d/modules/nsd/README.md b/src/go/plugin/go.d/modules/nsd/README.md new file mode 120000 index 000000000..a5cb8c98b --- /dev/null +++ b/src/go/plugin/go.d/modules/nsd/README.md @@ -0,0 +1 @@ +integrations/nsd.md
\ No newline at end of file diff --git a/src/go/plugin/go.d/modules/nsd/charts.go b/src/go/plugin/go.d/modules/nsd/charts.go new file mode 100644 index 000000000..aed4f3098 --- /dev/null +++ b/src/go/plugin/go.d/modules/nsd/charts.go @@ -0,0 +1,249 @@ +// SPDX-License-Identifier: GPL-3.0-or-later + +package nsd + +import ( + "github.com/netdata/netdata/go/plugins/plugin/go.d/agent/module" +) + +const ( + prioQueries = module.Priority + iota + prioQueriesByType + prioQueriesByOpcode + prioQueriesByClass + prioQueriesByProtocol + + prioAnswersByRcode + + prioErrors + + prioDrops + + prioZones + prioZoneTransfersRequests + prioZoneTransferMemory + + prioDatabaseSize + + prioUptime +) + +var charts = module.Charts{ + queriesChart.Copy(), + queriesByTypeChart.Copy(), + queriesByOpcodeChart.Copy(), + queriesByClassChart.Copy(), + queriesByProtocolChart.Copy(), + + answersByRcodeChart.Copy(), + + zonesChart.Copy(), + zoneTransfersRequestsChart.Copy(), + zoneTransferMemoryChart.Copy(), + + databaseSizeChart.Copy(), + + errorsChart.Copy(), + + dropsChart.Copy(), + + uptimeChart.Copy(), +} + +var ( + queriesChart = module.Chart{ + ID: "queries", + Title: "Queries", + Units: "queries/s", + Fam: "queries", + Ctx: "nsd.queries", + Priority: prioQueries, + Dims: module.Dims{ + {ID: "num.queries", Name: "queries", Algo: module.Incremental}, + }, + } + queriesByTypeChart = func() module.Chart { + chart := module.Chart{ + ID: "queries_by_type", + Title: "Queries Type", + Units: "queries/s", + Fam: "queries", + Ctx: "nsd.queries_by_type", + Priority: prioQueriesByType, + Type: module.Stacked, + } + for _, v := range queryTypes { + name := v + if s, ok := queryTypeNumberMap[v]; ok { + name = s + } + chart.Dims = append(chart.Dims, &module.Dim{ + ID: "num.type." + v, + Name: name, + Algo: module.Incremental, + }) + } + return chart + }() + queriesByOpcodeChart = func() module.Chart { + chart := module.Chart{ + ID: "queries_by_opcode", + Title: "Queries Opcode", + Units: "queries/s", + Fam: "queries", + Ctx: "nsd.queries_by_opcode", + Priority: prioQueriesByOpcode, + Type: module.Stacked, + } + for _, v := range queryOpcodes { + chart.Dims = append(chart.Dims, &module.Dim{ + ID: "num.opcode." + v, + Name: v, + Algo: module.Incremental, + }) + } + return chart + }() + queriesByClassChart = func() module.Chart { + chart := module.Chart{ + ID: "queries_by_class", + Title: "Queries Class", + Units: "queries/s", + Fam: "queries", + Ctx: "nsd.queries_by_class", + Priority: prioQueriesByClass, + Type: module.Stacked, + } + for _, v := range queryClasses { + chart.Dims = append(chart.Dims, &module.Dim{ + ID: "num.class." + v, + Name: v, + Algo: module.Incremental, + }) + } + return chart + }() + queriesByProtocolChart = module.Chart{ + ID: "queries_by_protocol", + Title: "Queries Protocol", + Units: "queries/s", + Fam: "queries", + Ctx: "nsd.queries_by_protocol", + Priority: prioQueriesByProtocol, + Type: module.Stacked, + Dims: module.Dims{ + {ID: "num.udp", Name: "udp", Algo: module.Incremental}, + {ID: "num.udp6", Name: "udp6", Algo: module.Incremental}, + {ID: "num.tcp", Name: "tcp", Algo: module.Incremental}, + {ID: "num.tcp6", Name: "tcp6", Algo: module.Incremental}, + {ID: "num.tls", Name: "tls", Algo: module.Incremental}, + {ID: "num.tls6", Name: "tls6", Algo: module.Incremental}, + }, + } + + answersByRcodeChart = func() module.Chart { + chart := module.Chart{ + ID: "answers_by_rcode", + Title: "Answers Rcode", + Units: "answers/s", + Fam: "answers", + Ctx: "nsd.answers_by_rcode", + Priority: prioAnswersByRcode, + Type: module.Stacked, + } + for _, v := range answerRcodes { + chart.Dims = append(chart.Dims, &module.Dim{ + ID: "num.rcode." + v, + Name: v, + Algo: module.Incremental, + }) + } + return chart + }() + + errorsChart = module.Chart{ + ID: "errors", + Title: "Errors", + Units: "errors/s", + Fam: "errors", + Ctx: "nsd.errors", + Priority: prioErrors, + Dims: module.Dims{ + {ID: "num.rxerr", Name: "query", Algo: module.Incremental}, + {ID: "num.txerr", Name: "answer", Mul: -1, Algo: module.Incremental}, + }, + } + + dropsChart = module.Chart{ + ID: "drops", + Title: "Drops", + Units: "drops/s", + Fam: "drops", + Ctx: "nsd.drops", + Priority: prioDrops, + Dims: module.Dims{ + {ID: "num.dropped", Name: "query", Algo: module.Incremental}, + }, + } + + zonesChart = module.Chart{ + ID: "zones", + Title: "Zones", + Units: "zones", + Fam: "zones", + Ctx: "nsd.zones", + Priority: prioZones, + Dims: module.Dims{ + {ID: "zone.master", Name: "master"}, + {ID: "zone.slave", Name: "slave"}, + }, + } + zoneTransfersRequestsChart = module.Chart{ + ID: "zone_transfers_requests", + Title: "Zone Transfers", + Units: "requests/s", + Fam: "zones", + Ctx: "nsd.zone_transfers_requests", + Priority: prioZoneTransfersRequests, + Dims: module.Dims{ + {ID: "num.raxfr", Name: "AXFR", Algo: module.Incremental}, + {ID: "num.rixfr", Name: "IXFR", Algo: module.Incremental}, + }, + } + zoneTransferMemoryChart = module.Chart{ + ID: "zone_transfer_memory", + Title: "Zone Transfer Memory", + Units: "bytes", + Fam: "zones", + Ctx: "nsd.zone_transfer_memory", + Priority: prioZoneTransferMemory, + Dims: module.Dims{ + {ID: "size.xfrd.mem", Name: "used"}, + }, + } + + databaseSizeChart = module.Chart{ + ID: "database_size", + Title: "Database Size", + Units: "bytes", + Fam: "database", + Ctx: "nsd.database_size", + Priority: prioDatabaseSize, + Dims: module.Dims{ + {ID: "size.db.disk", Name: "disk"}, + {ID: "size.db.mem", Name: "mem"}, + }, + } + + uptimeChart = module.Chart{ + ID: "uptime", + Title: "Uptime", + Units: "seconds", + Fam: "uptime", + Ctx: "nsd.uptime", + Priority: prioUptime, + Dims: module.Dims{ + {ID: "time.boot", Name: "uptime"}, + }, + } +) diff --git a/src/go/plugin/go.d/modules/nsd/collect.go b/src/go/plugin/go.d/modules/nsd/collect.go new file mode 100644 index 000000000..d07341df3 --- /dev/null +++ b/src/go/plugin/go.d/modules/nsd/collect.go @@ -0,0 +1,81 @@ +// SPDX-License-Identifier: GPL-3.0-or-later + +package nsd + +import ( + "bufio" + "bytes" + "errors" + "strconv" + "strings" +) + +func (n *Nsd) collect() (map[string]int64, error) { + stats, err := n.exec.stats() + if err != nil { + return nil, err + } + + if len(stats) == 0 { + return nil, errors.New("empty stats response") + } + + mx := make(map[string]int64) + + sc := bufio.NewScanner(bytes.NewReader(stats)) + + for sc.Scan() { + n.collectStatsLine(mx, sc.Text()) + } + + if len(mx) == 0 { + return nil, errors.New("unexpected stats response: no metrics found") + } + + addMissingMetrics(mx, "num.rcode.", answerRcodes) + addMissingMetrics(mx, "num.opcode.", queryOpcodes) + addMissingMetrics(mx, "num.class.", queryClasses) + addMissingMetrics(mx, "num.type.", queryTypes) + + return mx, nil +} + +func (n *Nsd) collectStatsLine(mx map[string]int64, line string) { + if line = strings.TrimSpace(line); line == "" { + return + } + + key, value, ok := strings.Cut(line, "=") + if !ok { + n.Debugf("invalid line in stats: '%s'", line) + return + } + + var v int64 + var f float64 + var err error + + switch key { + case "time.boot": + f, err = strconv.ParseFloat(value, 64) + v = int64(f) + default: + v, err = strconv.ParseInt(value, 10, 64) + } + + if err != nil { + n.Debugf("invalid value in stats line '%s': '%s'", line, value) + return + } + + mx[key] = v +} + +func addMissingMetrics(mx map[string]int64, prefix string, values []string) { + for _, v := range values { + k := prefix + v + if _, ok := mx[k]; !ok { + mx[k] = 0 + } + } +} diff --git a/src/go/plugin/go.d/modules/nsd/config_schema.json b/src/go/plugin/go.d/modules/nsd/config_schema.json new file mode 100644 index 000000000..d49107c71 --- /dev/null +++ b/src/go/plugin/go.d/modules/nsd/config_schema.json @@ -0,0 +1,35 @@ +{ + "jsonSchema": { + "$schema": "http://json-schema.org/draft-07/schema#", + "title": "NSD collector configuration.", + "type": "object", + "properties": { + "update_every": { + "title": "Update every", + "description": "Data collection interval, measured in seconds.", + "type": "integer", + "minimum": 1, + "default": 10 + }, + "timeout": { + "title": "Timeout", + "description": "Timeout for executing the binary, specified in seconds.", + "type": "number", + "minimum": 0.5, + "default": 2 + } + }, + "additionalProperties": false, + "patternProperties": { + "^name$": {} + } + }, + "uiSchema": { + "uiOptions": { + "fullPage": true + }, + "timeout": { + "ui:help": "Accepts decimals for precise control (e.g., type 1.5 for 1.5 seconds)." + } + } +} diff --git a/src/go/plugin/go.d/modules/nsd/exec.go b/src/go/plugin/go.d/modules/nsd/exec.go new file mode 100644 index 000000000..b05082f3c --- /dev/null +++ b/src/go/plugin/go.d/modules/nsd/exec.go @@ -0,0 +1,47 @@ +// SPDX-License-Identifier: GPL-3.0-or-later + +package nsd + +import ( + "context" + "fmt" + "os/exec" + "time" + + "github.com/netdata/netdata/go/plugins/logger" +) + +type nsdControlBinary interface { + stats() ([]byte, error) +} + +func newNsdControlExec(ndsudoPath string, timeout time.Duration, log *logger.Logger) *nsdControlExec { + return &nsdControlExec{ + Logger: log, + ndsudoPath: ndsudoPath, + timeout: timeout, + } +} + +type nsdControlExec struct { + *logger.Logger + + ndsudoPath string + timeout time.Duration +} + +func (e *nsdControlExec) stats() ([]byte, error) { + ctx, cancel := context.WithTimeout(context.Background(), e.timeout) + defer cancel() + + cmd := exec.CommandContext(ctx, e.ndsudoPath, "nsd-control-stats") + + e.Debugf("executing '%s'", cmd) + + bs, err := cmd.Output() + if err != nil { + return nil, fmt.Errorf("error on '%s': %v", cmd, err) + } + + return bs, nil +} diff --git a/src/go/plugin/go.d/modules/nsd/init.go b/src/go/plugin/go.d/modules/nsd/init.go new file mode 100644 index 000000000..63843caba --- /dev/null +++ b/src/go/plugin/go.d/modules/nsd/init.go @@ -0,0 +1,23 @@ +// SPDX-License-Identifier: GPL-3.0-or-later + +package nsd + +import ( + "fmt" + "os" + "path/filepath" + + "github.com/netdata/netdata/go/plugins/pkg/executable" +) + +func (n *Nsd) initNsdControlExec() (nsdControlBinary, error) { + ndsudoPath := filepath.Join(executable.Directory, "ndsudo") + if _, err := os.Stat(ndsudoPath); err != nil { + return nil, fmt.Errorf("ndsudo executable not found: %v", err) + + } + + nsdControl := newNsdControlExec(ndsudoPath, n.Timeout.Duration(), n.Logger) + + return nsdControl, nil +} diff --git a/src/go/plugin/go.d/modules/nsd/integrations/nsd.md b/src/go/plugin/go.d/modules/nsd/integrations/nsd.md new file mode 100644 index 000000000..745b872d7 --- /dev/null +++ b/src/go/plugin/go.d/modules/nsd/integrations/nsd.md @@ -0,0 +1,203 @@ +<!--startmeta +custom_edit_url: "https://github.com/netdata/netdata/edit/master/src/go/plugin/go.d/modules/nsd/README.md" +meta_yaml: "https://github.com/netdata/netdata/edit/master/src/go/plugin/go.d/modules/nsd/metadata.yaml" +sidebar_label: "NSD" +learn_status: "Published" +learn_rel_path: "Collecting Metrics/DNS and DHCP Servers" +most_popular: False +message: "DO NOT EDIT THIS FILE DIRECTLY, IT IS GENERATED BY THE COLLECTOR'S metadata.yaml FILE" +endmeta--> + +# NSD + + +<img src="https://netdata.cloud/img/nsd.svg" width="150"/> + + +Plugin: go.d.plugin +Module: nsd + +<img src="https://img.shields.io/badge/maintained%20by-Netdata-%2300ab44" /> + +## Overview + +This collector monitors NSD statistics like queries, zones, protocols, query types and more. It relies on the [`nsd-control`](https://nsd.docs.nlnetlabs.nl/en/latest/manpages/nsd-control.html) CLI tool but avoids directly executing the binary. Instead, it utilizes `ndsudo`, a Netdata helper specifically designed to run privileged commands securely within the Netdata environment. This approach eliminates the need to use `sudo`, improving security and potentially simplifying permission management. +Executed commands: +- `nsd-control stats_noreset` + + + + +This collector is supported on all platforms. + +This collector only supports collecting metrics from a single instance of this integration. + + +### Default Behavior + +#### Auto-Detection + +This integration doesn't support auto-detection. + +#### Limits + +The default configuration for this integration does not impose any limits on data collection. + +#### Performance Impact + +The default configuration for this integration is not expected to impose a significant performance impact on the system. + + +## Metrics + +Metrics grouped by *scope*. + +The scope defines the instance that the metric belongs to. An instance is uniquely identified by a set of labels. + + + +### Per NSD instance + +These metrics refer to the the entire monitored application. + +This scope has no labels. + +Metrics: + +| Metric | Dimensions | Unit | +|:------|:----------|:----| +| nsd.queries | queries | queries/s | +| nsd.queries_by_type | A, NS, MD, MF, CNAME, SOA, MB, MG, MR, NULL, WKS, PTR, HINFO, MINFO, MX, TXT, RP, AFSDB, X25, ISDN, RT, NSAP, SIG, KEY, PX, AAAA, LOC, NXT, SRV, NAPTR, KX, CERT, DNAME, OPT, APL, DS, SSHFP, IPSECKEY, RRSIG, NSEC, DNSKEY, DHCID, NSEC3, NSEC3PARAM, TLSA, SMIMEA, CDS, CDNSKEY, OPENPGPKEY, CSYNC, ZONEMD, SVCB, HTTPS, SPF, NID, L32, L64, LP, EUI48, EUI64, URI, CAA, AVC, DLV, IXFR, AXFR, MAILB, MAILA, ANY | queries/s | +| nsd.queries_by_opcode | QUERY, IQUERY, STATUS, NOTIFY, UPDATE, OTHER | queries/s | +| nsd.queries_by_class | IN, CS, CH, HS | queries/s | +| nsd.queries_by_protocol | udp, udp6, tcp, tcp6, tls, tls6 | queries/s | +| nsd.answers_by_rcode | NOERROR, FORMERR, SERVFAIL, NXDOMAIN, NOTIMP, REFUSED, YXDOMAIN, YXRRSET, NXRRSET, NOTAUTH, NOTZONE, RCODE11, RCODE12, RCODE13, RCODE14, RCODE15, BADVERS | answers/s | +| nsd.errors | query, answer | errors/s | +| nsd.drops | query | drops/s | +| nsd.zones | master, slave | zones | +| nsd.zone_transfers_requests | AXFR, IXFR | requests/s | +| nsd.zone_transfer_memory | used | bytes | +| nsd.database_size | disk, mem | bytes | +| nsd.uptime | uptime | seconds | + + + +## Alerts + +There are no alerts configured by default for this integration. + + +## Setup + +### Prerequisites + +No action required. + +### Configuration + +#### File + +The configuration file name for this integration is `go.d/nsd.conf`. + + +You can edit the configuration file using the `edit-config` script from the +Netdata [config directory](/docs/netdata-agent/configuration/README.md#the-netdata-config-directory). + +```bash +cd /etc/netdata 2>/dev/null || cd /opt/netdata/etc/netdata +sudo ./edit-config go.d/nsd.conf +``` +#### Options + +The following options can be defined globally: update_every. + + +<details open><summary>Config options</summary> + +| Name | Description | Default | Required | +|:----|:-----------|:-------|:--------:| +| update_every | Data collection frequency. | 10 | no | +| timeout | nsd-control binary execution timeout. | 2 | no | + +</details> + +#### Examples + +##### Custom update_every + +Allows you to override the default data collection interval. + +<details open><summary>Config</summary> + +```yaml +jobs: + - name: nsd + update_every: 5 # Collect logical volume statistics every 5 seconds + +``` +</details> + + + +## Troubleshooting + +### Debug Mode + +**Important**: Debug mode is not supported for data collection jobs created via the UI using the Dyncfg feature. + +To troubleshoot issues with the `nsd` collector, run the `go.d.plugin` with the debug option enabled. The output +should give you clues as to why the collector isn't working. + +- Navigate to the `plugins.d` directory, usually at `/usr/libexec/netdata/plugins.d/`. If that's not the case on + your system, open `netdata.conf` and look for the `plugins` setting under `[directories]`. + + ```bash + cd /usr/libexec/netdata/plugins.d/ + ``` + +- Switch to the `netdata` user. + + ```bash + sudo -u netdata -s + ``` + +- Run the `go.d.plugin` to debug the collector: + + ```bash + ./go.d.plugin -d -m nsd + ``` + +### Getting Logs + +If you're encountering problems with the `nsd` collector, follow these steps to retrieve logs and identify potential issues: + +- **Run the command** specific to your system (systemd, non-systemd, or Docker container). +- **Examine the output** for any warnings or error messages that might indicate issues. These messages should provide clues about the root cause of the problem. + +#### System with systemd + +Use the following command to view logs generated since the last Netdata service restart: + +```bash +journalctl _SYSTEMD_INVOCATION_ID="$(systemctl show --value --property=InvocationID netdata)" --namespace=netdata --grep nsd +``` + +#### System without systemd + +Locate the collector log file, typically at `/var/log/netdata/collector.log`, and use `grep` to filter for collector's name: + +```bash +grep nsd /var/log/netdata/collector.log +``` + +**Note**: This method shows logs from all restarts. Focus on the **latest entries** for troubleshooting current issues. + +#### Docker Container + +If your Netdata runs in a Docker container named "netdata" (replace if different), use this command: + +```bash +docker logs netdata 2>&1 | grep nsd +``` + + diff --git a/src/go/plugin/go.d/modules/nsd/metadata.yaml b/src/go/plugin/go.d/modules/nsd/metadata.yaml new file mode 100644 index 000000000..a31aa38af --- /dev/null +++ b/src/go/plugin/go.d/modules/nsd/metadata.yaml @@ -0,0 +1,272 @@ +plugin_name: go.d.plugin +modules: + - meta: + id: collector-go.d.plugin-nsd + plugin_name: go.d.plugin + module_name: nsd + monitored_instance: + name: NSD + link: "https://nsd.docs.nlnetlabs.nl/en/latest" + icon_filename: 'nsd.svg' + categories: + - data-collection.dns-and-dhcp-servers + keywords: + - nsd + - dns + related_resources: + integrations: + list: [] + info_provided_to_referring_integrations: + description: "" + most_popular: false + overview: + data_collection: + metrics_description: > + This collector monitors NSD statistics like queries, zones, protocols, query types and more. + It relies on the [`nsd-control`](https://nsd.docs.nlnetlabs.nl/en/latest/manpages/nsd-control.html) CLI tool but avoids directly executing the binary. + Instead, it utilizes `ndsudo`, a Netdata helper specifically designed to run privileged commands securely within the Netdata environment. + This approach eliminates the need to use `sudo`, improving security and potentially simplifying permission management. + + Executed commands: + + - `nsd-control stats_noreset` + method_description: "" + supported_platforms: + include: [] + exclude: [] + multi_instance: false + additional_permissions: + description: "" + default_behavior: + auto_detection: + description: "" + limits: + description: "" + performance_impact: + description: "" + setup: + prerequisites: + list: [] + configuration: + file: + name: go.d/nsd.conf + options: + description: | + The following options can be defined globally: update_every. + folding: + title: Config options + enabled: true + list: + - name: update_every + description: Data collection frequency. + default_value: 10 + required: false + - name: timeout + description: nsd-control binary execution timeout. + default_value: 2 + required: false + examples: + folding: + title: Config + enabled: true + list: + - name: Custom update_every + description: Allows you to override the default data collection interval. + config: | + jobs: + - name: nsd + update_every: 5 # Collect logical volume statistics every 5 seconds + troubleshooting: + problems: + list: [] + alerts: [] + metrics: + folding: + title: Metrics + enabled: false + description: "" + availability: [] + scopes: + - name: global + description: These metrics refer to the the entire monitored application. + labels: [] + metrics: + - name: nsd.queries + description: Queries + unit: 'queries/s' + chart_type: line + dimensions: + - name: queries + - name: nsd.queries_by_type + description: Queries Type + unit: 'queries/s' + chart_type: stacked + dimensions: + - name: "A" + - name: "NS" + - name: "MD" + - name: "MF" + - name: "CNAME" + - name: "SOA" + - name: "MB" + - name: "MG" + - name: "MR" + - name: "NULL" + - name: "WKS" + - name: "PTR" + - name: "HINFO" + - name: "MINFO" + - name: "MX" + - name: "TXT" + - name: "RP" + - name: "AFSDB" + - name: "X25" + - name: "ISDN" + - name: "RT" + - name: "NSAP" + - name: "SIG" + - name: "KEY" + - name: "PX" + - name: "AAAA" + - name: "LOC" + - name: "NXT" + - name: "SRV" + - name: "NAPTR" + - name: "KX" + - name: "CERT" + - name: "DNAME" + - name: "OPT" + - name: "APL" + - name: "DS" + - name: "SSHFP" + - name: "IPSECKEY" + - name: "RRSIG" + - name: "NSEC" + - name: "DNSKEY" + - name: "DHCID" + - name: "NSEC3" + - name: "NSEC3PARAM" + - name: "TLSA" + - name: "SMIMEA" + - name: "CDS" + - name: "CDNSKEY" + - name: "OPENPGPKEY" + - name: "CSYNC" + - name: "ZONEMD" + - name: "SVCB" + - name: "HTTPS" + - name: "SPF" + - name: "NID" + - name: "L32" + - name: "L64" + - name: "LP" + - name: "EUI48" + - name: "EUI64" + - name: "URI" + - name: "CAA" + - name: "AVC" + - name: "DLV" + - name: "IXFR" + - name: "AXFR" + - name: "MAILB" + - name: "MAILA" + - name: "ANY" + - name: nsd.queries_by_opcode + description: Queries Opcode + unit: 'queries/s' + chart_type: stacked + dimensions: + - name: "QUERY" + - name: "IQUERY" + - name: "STATUS" + - name: "NOTIFY" + - name: "UPDATE" + - name: "OTHER" + - name: nsd.queries_by_class + description: Queries Class + unit: 'queries/s' + chart_type: stacked + dimensions: + - name: "IN" + - name: "CS" + - name: "CH" + - name: "HS" + - name: nsd.queries_by_protocol + description: Queries Protocol + unit: 'queries/s' + chart_type: stacked + dimensions: + - name: "udp" + - name: "udp6" + - name: "tcp" + - name: "tcp6" + - name: "tls" + - name: "tls6" + - name: nsd.answers_by_rcode + description: Answers Rcode + unit: 'answers/s' + chart_type: stacked + dimensions: + - name: "NOERROR" + - name: "FORMERR" + - name: "SERVFAIL" + - name: "NXDOMAIN" + - name: "NOTIMP" + - name: "REFUSED" + - name: "YXDOMAIN" + - name: "YXRRSET" + - name: "NXRRSET" + - name: "NOTAUTH" + - name: "NOTZONE" + - name: "RCODE11" + - name: "RCODE12" + - name: "RCODE13" + - name: "RCODE14" + - name: "RCODE15" + - name: "BADVERS" + - name: nsd.errors + description: Errors + unit: 'errors/s' + chart_type: line + dimensions: + - name: "query" + - name: "answer" + - name: nsd.drops + description: Drops + unit: 'drops/s' + chart_type: line + dimensions: + - name: "query" + - name: nsd.zones + description: Zones + unit: 'zones' + chart_type: line + dimensions: + - name: "master" + - name: "slave" + - name: nsd.zone_transfers_requests + description: Zone Transfers + unit: 'requests/s' + chart_type: line + dimensions: + - name: "AXFR" + - name: "IXFR" + - name: nsd.zone_transfer_memory + description: Zone Transfer Memory + unit: 'bytes' + chart_type: line + dimensions: + - name: "used" + - name: nsd.database_size + description: Database Size + unit: 'bytes' + chart_type: line + dimensions: + - name: "disk" + - name: "mem" + - name: nsd.uptime + description: Uptime + unit: 'seconds' + chart_type: line + dimensions: + - name: "uptime" diff --git a/src/go/plugin/go.d/modules/nsd/nsd.go b/src/go/plugin/go.d/modules/nsd/nsd.go new file mode 100644 index 000000000..fae0f67f3 --- /dev/null +++ b/src/go/plugin/go.d/modules/nsd/nsd.go @@ -0,0 +1,97 @@ +// SPDX-License-Identifier: GPL-3.0-or-later + +package nsd + +import ( + _ "embed" + "errors" + "time" + + "github.com/netdata/netdata/go/plugins/plugin/go.d/agent/module" + "github.com/netdata/netdata/go/plugins/plugin/go.d/pkg/web" +) + +//go:embed "config_schema.json" +var configSchema string + +func init() { + module.Register("nsd", module.Creator{ + JobConfigSchema: configSchema, + Defaults: module.Defaults{ + UpdateEvery: 10, + }, + Create: func() module.Module { return New() }, + Config: func() any { return &Config{} }, + }) +} + +func New() *Nsd { + return &Nsd{ + Config: Config{ + Timeout: web.Duration(time.Second * 2), + }, + charts: charts.Copy(), + } +} + +type Config struct { + UpdateEvery int `yaml:"update_every,omitempty" json:"update_every"` + Timeout web.Duration `yaml:"timeout,omitempty" json:"timeout"` +} + +type Nsd struct { + module.Base + Config `yaml:",inline" json:""` + + charts *module.Charts + + exec nsdControlBinary +} + +func (n *Nsd) Configuration() any { + return n.Config +} + +func (n *Nsd) Init() error { + nsdControl, err := n.initNsdControlExec() + if err != nil { + n.Errorf("nsd-control exec initialization: %v", err) + return err + } + n.exec = nsdControl + + return nil +} + +func (n *Nsd) Check() error { + mx, err := n.collect() + if err != nil { + n.Error(err) + return err + } + + if len(mx) == 0 { + return errors.New("no metrics collected") + } + + return nil +} + +func (n *Nsd) Charts() *module.Charts { + return n.charts +} + +func (n *Nsd) Collect() map[string]int64 { + mx, err := n.collect() + if err != nil { + n.Error(err) + } + + if len(mx) == 0 { + return nil + } + + return mx +} + +func (n *Nsd) Cleanup() {} diff --git a/src/go/plugin/go.d/modules/nsd/nsd_test.go b/src/go/plugin/go.d/modules/nsd/nsd_test.go new file mode 100644 index 000000000..24f38b512 --- /dev/null +++ b/src/go/plugin/go.d/modules/nsd/nsd_test.go @@ -0,0 +1,337 @@ +// SPDX-License-Identifier: GPL-3.0-or-later + +package nsd + +import ( + "errors" + "os" + "testing" + + "github.com/netdata/netdata/go/plugins/plugin/go.d/agent/module" + + "github.com/stretchr/testify/assert" + "github.com/stretchr/testify/require" +) + +var ( + dataConfigJSON, _ = os.ReadFile("testdata/config.json") + dataConfigYAML, _ = os.ReadFile("testdata/config.yaml") + + dataStats, _ = os.ReadFile("testdata/stats.txt") +) + +func Test_testDataIsValid(t *testing.T) { + for name, data := range map[string][]byte{ + "dataConfigJSON": dataConfigJSON, + "dataConfigYAML": dataConfigYAML, + "dataStats": dataStats, + } { + require.NotNil(t, data, name) + + } +} + +func TestNsd_Configuration(t *testing.T) { + module.TestConfigurationSerialize(t, &Nsd{}, dataConfigJSON, dataConfigYAML) +} + +func TestNsd_Init(t *testing.T) { + tests := map[string]struct { + config Config + wantFail bool + }{ + "fails if failed to locate ndsudo": { + wantFail: true, + config: New().Config, + }, + } + + for name, test := range tests { + t.Run(name, func(t *testing.T) { + nsd := New() + nsd.Config = test.config + + if test.wantFail { + assert.Error(t, nsd.Init()) + } else { + assert.NoError(t, nsd.Init()) + } + }) + } +} + +func TestNsd_Cleanup(t *testing.T) { + tests := map[string]struct { + prepare func() *Nsd + }{ + "not initialized exec": { + prepare: func() *Nsd { + return New() + }, + }, + "after check": { + prepare: func() *Nsd { + nsd := New() + nsd.exec = prepareMockOK() + _ = nsd.Check() + return nsd + }, + }, + "after collect": { + prepare: func() *Nsd { + nsd := New() + nsd.exec = prepareMockOK() + _ = nsd.Collect() + return nsd + }, + }, + } + + for name, test := range tests { + t.Run(name, func(t *testing.T) { + nsd := test.prepare() + + assert.NotPanics(t, nsd.Cleanup) + }) + } +} + +func TestNsd_Charts(t *testing.T) { + assert.NotNil(t, New().Charts()) +} + +func TestNsd_Check(t *testing.T) { + tests := map[string]struct { + prepareMock func() *mockNsdControl + wantFail bool + }{ + "success case": { + prepareMock: prepareMockOK, + wantFail: false, + }, + "error on stats call": { + prepareMock: prepareMockErrOnStats, + wantFail: true, + }, + "empty response": { + prepareMock: prepareMockEmptyResponse, + wantFail: true, + }, + "unexpected response": { + prepareMock: prepareMockUnexpectedResponse, + wantFail: true, + }, + } + + for name, test := range tests { + t.Run(name, func(t *testing.T) { + nsd := New() + mock := test.prepareMock() + nsd.exec = mock + + if test.wantFail { + assert.Error(t, nsd.Check()) + } else { + assert.NoError(t, nsd.Check()) + } + }) + } +} + +func TestNsd_Collect(t *testing.T) { + tests := map[string]struct { + prepareMock func() *mockNsdControl + wantMetrics map[string]int64 + }{ + "success case": { + prepareMock: prepareMockOK, + wantMetrics: map[string]int64{ + "num.answer_wo_aa": 1, + "num.class.CH": 0, + "num.class.CS": 0, + "num.class.HS": 0, + "num.class.IN": 1, + "num.dropped": 1, + "num.edns": 1, + "num.ednserr": 1, + "num.opcode.IQUERY": 0, + "num.opcode.NOTIFY": 0, + "num.opcode.OTHER": 0, + "num.opcode.QUERY": 1, + "num.opcode.STATUS": 0, + "num.opcode.UPDATE": 0, + "num.queries": 1, + "num.raxfr": 1, + "num.rcode.BADVERS": 0, + "num.rcode.FORMERR": 1, + "num.rcode.NOERROR": 1, + "num.rcode.NOTAUTH": 0, + "num.rcode.NOTIMP": 1, + "num.rcode.NOTZONE": 0, + "num.rcode.NXDOMAIN": 1, + "num.rcode.NXRRSET": 0, + "num.rcode.RCODE11": 0, + "num.rcode.RCODE12": 0, + "num.rcode.RCODE13": 0, + "num.rcode.RCODE14": 0, + "num.rcode.RCODE15": 0, + "num.rcode.REFUSED": 1, + "num.rcode.SERVFAIL": 1, + "num.rcode.YXDOMAIN": 1, + "num.rcode.YXRRSET": 0, + "num.rixfr": 1, + "num.rxerr": 1, + "num.tcp": 1, + "num.tcp6": 1, + "num.tls": 1, + "num.tls6": 1, + "num.truncated": 1, + "num.txerr": 1, + "num.type.A": 1, + "num.type.AAAA": 1, + "num.type.AFSDB": 1, + "num.type.APL": 1, + "num.type.AVC": 0, + "num.type.CAA": 0, + "num.type.CDNSKEY": 1, + "num.type.CDS": 1, + "num.type.CERT": 1, + "num.type.CNAME": 1, + "num.type.CSYNC": 1, + "num.type.DHCID": 1, + "num.type.DLV": 0, + "num.type.DNAME": 1, + "num.type.DNSKEY": 1, + "num.type.DS": 1, + "num.type.EUI48": 1, + "num.type.EUI64": 1, + "num.type.HINFO": 1, + "num.type.HTTPS": 1, + "num.type.IPSECKEY": 1, + "num.type.ISDN": 1, + "num.type.KEY": 1, + "num.type.KX": 1, + "num.type.L32": 1, + "num.type.L64": 1, + "num.type.LOC": 1, + "num.type.LP": 1, + "num.type.MB": 1, + "num.type.MD": 1, + "num.type.MF": 1, + "num.type.MG": 1, + "num.type.MINFO": 1, + "num.type.MR": 1, + "num.type.MX": 1, + "num.type.NAPTR": 1, + "num.type.NID": 1, + "num.type.NS": 1, + "num.type.NSAP": 1, + "num.type.NSEC": 1, + "num.type.NSEC3": 1, + "num.type.NSEC3PARAM": 1, + "num.type.NULL": 1, + "num.type.NXT": 1, + "num.type.OPENPGPKEY": 1, + "num.type.OPT": 1, + "num.type.PTR": 1, + "num.type.PX": 1, + "num.type.RP": 1, + "num.type.RRSIG": 1, + "num.type.RT": 1, + "num.type.SIG": 1, + "num.type.SMIMEA": 1, + "num.type.SOA": 1, + "num.type.SPF": 1, + "num.type.SRV": 1, + "num.type.SSHFP": 1, + "num.type.SVCB": 1, + "num.type.TLSA": 1, + "num.type.TXT": 1, + "num.type.TYPE252": 0, + "num.type.TYPE255": 0, + "num.type.URI": 0, + "num.type.WKS": 1, + "num.type.X25": 1, + "num.type.ZONEMD": 1, + "num.udp": 1, + "num.udp6": 1, + "server0.queries": 1, + "size.config.disk": 1, + "size.config.mem": 1064, + "size.db.disk": 576, + "size.db.mem": 920, + "size.xfrd.mem": 1160464, + "time.boot": 556, + "zone.master": 1, + "zone.slave": 1, + }, + }, + "error on lvs report call": { + prepareMock: prepareMockErrOnStats, + wantMetrics: nil, + }, + "empty response": { + prepareMock: prepareMockEmptyResponse, + wantMetrics: nil, + }, + "unexpected response": { + prepareMock: prepareMockUnexpectedResponse, + wantMetrics: nil, + }, + } + + for name, test := range tests { + t.Run(name, func(t *testing.T) { + nsd := New() + mock := test.prepareMock() + nsd.exec = mock + + mx := nsd.Collect() + + assert.Equal(t, test.wantMetrics, mx) + + if len(test.wantMetrics) > 0 { + assert.Len(t, *nsd.Charts(), len(charts)) + module.TestMetricsHasAllChartsDims(t, nsd.Charts(), mx) + } + }) + } +} + +func prepareMockOK() *mockNsdControl { + return &mockNsdControl{ + dataStats: dataStats, + } +} + +func prepareMockErrOnStats() *mockNsdControl { + return &mockNsdControl{ + errOnStatus: true, + } +} + +func prepareMockEmptyResponse() *mockNsdControl { + return &mockNsdControl{} +} + +func prepareMockUnexpectedResponse() *mockNsdControl { + return &mockNsdControl{ + dataStats: []byte(` +Lorem ipsum dolor sit amet, consectetur adipiscing elit. +Nulla malesuada erat id magna mattis, eu viverra tellus rhoncus. +Fusce et felis pulvinar, posuere sem non, porttitor eros. +`), + } +} + +type mockNsdControl struct { + errOnStatus bool + dataStats []byte +} + +func (m *mockNsdControl) stats() ([]byte, error) { + if m.errOnStatus { + return nil, errors.New("mock.status() error") + } + return m.dataStats, nil +} diff --git a/src/go/plugin/go.d/modules/nsd/stats_counters.go b/src/go/plugin/go.d/modules/nsd/stats_counters.go new file mode 100644 index 000000000..8ebe706a5 --- /dev/null +++ b/src/go/plugin/go.d/modules/nsd/stats_counters.go @@ -0,0 +1,123 @@ +// SPDX-License-Identifier: GPL-3.0-or-later + +package nsd + +// Docs: https://nsd.docs.nlnetlabs.nl/en/latest/manpages/nsd-control.html?highlight=elapsed#statistics-counters +// Source: https://github.com/NLnetLabs/nsd/blob/b4a5ccd2235a1f8f71f7c640390e409bf123c963/remote.c#L2735 + +// https://github.com/NLnetLabs/nsd/blob/b4a5ccd2235a1f8f71f7c640390e409bf123c963/remote.c#L2737 +var answerRcodes = []string{ + "NOERROR", + "FORMERR", + "SERVFAIL", + "NXDOMAIN", + "NOTIMP", + "REFUSED", + "YXDOMAIN", + "YXRRSET", + "NXRRSET", + "NOTAUTH", + "NOTZONE", + "RCODE11", + "RCODE12", + "RCODE13", + "RCODE14", + "RCODE15", + "BADVERS", +} + +// https://github.com/NLnetLabs/nsd/blob/b4a5ccd2235a1f8f71f7c640390e409bf123c963/remote.c#L2706 +var queryOpcodes = []string{ + "QUERY", + "IQUERY", + "STATUS", + "NOTIFY", + "UPDATE", + "OTHER", +} + +// https://github.com/NLnetLabs/nsd/blob/b4a5ccd2235a1f8f71f7c640390e409bf123c963/dns.c#L27 +var queryClasses = []string{ + "IN", + "CS", + "CH", + "HS", +} + +// https://github.com/NLnetLabs/nsd/blob/b4a5ccd2235a1f8f71f7c640390e409bf123c963/dns.c#L35 +var queryTypes = []string{ + "A", + "NS", + "MD", + "MF", + "CNAME", + "SOA", + "MB", + "MG", + "MR", + "NULL", + "WKS", + "PTR", + "HINFO", + "MINFO", + "MX", + "TXT", + "RP", + "AFSDB", + "X25", + "ISDN", + "RT", + "NSAP", + "SIG", + "KEY", + "PX", + "AAAA", + "LOC", + "NXT", + "SRV", + "NAPTR", + "KX", + "CERT", + "DNAME", + "OPT", + "APL", + "DS", + "SSHFP", + "IPSECKEY", + "RRSIG", + "NSEC", + "DNSKEY", + "DHCID", + "NSEC3", + "NSEC3PARAM", + "TLSA", + "SMIMEA", + "CDS", + "CDNSKEY", + "OPENPGPKEY", + "CSYNC", + "ZONEMD", + "SVCB", + "HTTPS", + "SPF", + "NID", + "L32", + "L64", + "LP", + "EUI48", + "EUI64", + "URI", + "CAA", + "AVC", + "DLV", + "TYPE252", + "TYPE255", +} + +var queryTypeNumberMap = map[string]string{ + "TYPE251": "IXFR", + "TYPE252": "AXFR", + "TYPE253": "MAILB", + "TYPE254": "MAILA", + "TYPE255": "ANY", +} diff --git a/src/go/collectors/go.d.plugin/modules/storcli/testdata/config.json b/src/go/plugin/go.d/modules/nsd/testdata/config.json index 291ecee3d..291ecee3d 100644 --- a/src/go/collectors/go.d.plugin/modules/storcli/testdata/config.json +++ b/src/go/plugin/go.d/modules/nsd/testdata/config.json diff --git a/src/go/collectors/go.d.plugin/modules/storcli/testdata/config.yaml b/src/go/plugin/go.d/modules/nsd/testdata/config.yaml index 25b0b4c78..25b0b4c78 100644 --- a/src/go/collectors/go.d.plugin/modules/storcli/testdata/config.yaml +++ b/src/go/plugin/go.d/modules/nsd/testdata/config.yaml diff --git a/src/go/plugin/go.d/modules/nsd/testdata/stats.txt b/src/go/plugin/go.d/modules/nsd/testdata/stats.txt new file mode 100644 index 000000000..cb6d8b829 --- /dev/null +++ b/src/go/plugin/go.d/modules/nsd/testdata/stats.txt @@ -0,0 +1,95 @@ +server0.queries=1 +num.queries=1 +time.boot=556.488415 +time.elapsed=556.488415 +size.db.disk=576 +size.db.mem=920 +size.xfrd.mem=1160464 +size.config.disk=1 +size.config.mem=1064 +num.type.A=1 +num.type.NS=1 +num.type.MD=1 +num.type.MF=1 +num.type.CNAME=1 +num.type.SOA=1 +num.type.MB=1 +num.type.MG=1 +num.type.MR=1 +num.type.NULL=1 +num.type.WKS=1 +num.type.PTR=1 +num.type.HINFO=1 +num.type.MINFO=1 +num.type.MX=1 +num.type.TXT=1 +num.type.RP=1 +num.type.AFSDB=1 +num.type.X25=1 +num.type.ISDN=1 +num.type.RT=1 +num.type.NSAP=1 +num.type.SIG=1 +num.type.KEY=1 +num.type.PX=1 +num.type.AAAA=1 +num.type.LOC=1 +num.type.NXT=1 +num.type.SRV=1 +num.type.NAPTR=1 +num.type.KX=1 +num.type.CERT=1 +num.type.DNAME=1 +num.type.OPT=1 +num.type.APL=1 +num.type.DS=1 +num.type.SSHFP=1 +num.type.IPSECKEY=1 +num.type.RRSIG=1 +num.type.NSEC=1 +num.type.DNSKEY=1 +num.type.DHCID=1 +num.type.NSEC3=1 +num.type.NSEC3PARAM=1 +num.type.TLSA=1 +num.type.SMIMEA=1 +num.type.CDS=1 +num.type.CDNSKEY=1 +num.type.OPENPGPKEY=1 +num.type.CSYNC=1 +num.type.ZONEMD=1 +num.type.SVCB=1 +num.type.HTTPS=1 +num.type.SPF=1 +num.type.NID=1 +num.type.L32=1 +num.type.L64=1 +num.type.LP=1 +num.type.EUI48=1 +num.type.EUI64=1 +num.opcode.QUERY=1 +num.class.IN=1 +num.rcode.NOERROR=1 +num.rcode.FORMERR=1 +num.rcode.SERVFAIL=1 +num.rcode.NXDOMAIN=1 +num.rcode.NOTIMP=1 +num.rcode.REFUSED=1 +num.rcode.YXDOMAIN=1 +num.edns=1 +num.ednserr=1 +num.udp=1 +num.udp6=1 +num.tcp=1 +num.tcp6=1 +num.tls=1 +num.tls6=1 +num.answer_wo_aa=1 +num.rxerr=1 +num.txerr=1 +num.raxfr=1 +num.rixfr=1 +num.truncated=1 +num.dropped=1 +zone.master=1 +zone.slave=1 diff --git a/src/go/collectors/go.d.plugin/modules/ntpd/README.md b/src/go/plugin/go.d/modules/ntpd/README.md index bad92b03a..bad92b03a 120000 --- a/src/go/collectors/go.d.plugin/modules/ntpd/README.md +++ b/src/go/plugin/go.d/modules/ntpd/README.md diff --git a/src/go/collectors/go.d.plugin/modules/ntpd/charts.go b/src/go/plugin/go.d/modules/ntpd/charts.go index 5726d05a3..95baea471 100644 --- a/src/go/collectors/go.d.plugin/modules/ntpd/charts.go +++ b/src/go/plugin/go.d/modules/ntpd/charts.go @@ -6,7 +6,7 @@ import ( "fmt" "strings" - "github.com/netdata/netdata/go/go.d.plugin/agent/module" + "github.com/netdata/netdata/go/plugins/plugin/go.d/agent/module" ) const ( diff --git a/src/go/collectors/go.d.plugin/modules/ntpd/client.go b/src/go/plugin/go.d/modules/ntpd/client.go index 8e111cd76..8e111cd76 100644 --- a/src/go/collectors/go.d.plugin/modules/ntpd/client.go +++ b/src/go/plugin/go.d/modules/ntpd/client.go diff --git a/src/go/collectors/go.d.plugin/modules/ntpd/collect.go b/src/go/plugin/go.d/modules/ntpd/collect.go index 09553a65c..09553a65c 100644 --- a/src/go/collectors/go.d.plugin/modules/ntpd/collect.go +++ b/src/go/plugin/go.d/modules/ntpd/collect.go diff --git a/src/go/collectors/go.d.plugin/modules/ntpd/config_schema.json b/src/go/plugin/go.d/modules/ntpd/config_schema.json index f4d763b82..f4d763b82 100644 --- a/src/go/collectors/go.d.plugin/modules/ntpd/config_schema.json +++ b/src/go/plugin/go.d/modules/ntpd/config_schema.json diff --git a/src/go/collectors/go.d.plugin/modules/ntpd/integrations/ntpd.md b/src/go/plugin/go.d/modules/ntpd/integrations/ntpd.md index f75cb7875..c0094c524 100644 --- a/src/go/collectors/go.d.plugin/modules/ntpd/integrations/ntpd.md +++ b/src/go/plugin/go.d/modules/ntpd/integrations/ntpd.md @@ -1,6 +1,6 @@ <!--startmeta -custom_edit_url: "https://github.com/netdata/netdata/edit/master/src/go/collectors/go.d.plugin/modules/ntpd/README.md" -meta_yaml: "https://github.com/netdata/netdata/edit/master/src/go/collectors/go.d.plugin/modules/ntpd/metadata.yaml" +custom_edit_url: "https://github.com/netdata/netdata/edit/master/src/go/plugin/go.d/modules/ntpd/README.md" +meta_yaml: "https://github.com/netdata/netdata/edit/master/src/go/plugin/go.d/modules/ntpd/metadata.yaml" sidebar_label: "NTPd" learn_status: "Published" learn_rel_path: "Collecting Metrics/System Clock and NTP" @@ -203,6 +203,8 @@ jobs: ### Debug Mode +**Important**: Debug mode is not supported for data collection jobs created via the UI using the Dyncfg feature. + To troubleshoot issues with the `ntpd` collector, run the `go.d.plugin` with the debug option enabled. The output should give you clues as to why the collector isn't working. @@ -225,4 +227,37 @@ should give you clues as to why the collector isn't working. ./go.d.plugin -d -m ntpd ``` +### Getting Logs + +If you're encountering problems with the `ntpd` collector, follow these steps to retrieve logs and identify potential issues: + +- **Run the command** specific to your system (systemd, non-systemd, or Docker container). +- **Examine the output** for any warnings or error messages that might indicate issues. These messages should provide clues about the root cause of the problem. + +#### System with systemd + +Use the following command to view logs generated since the last Netdata service restart: + +```bash +journalctl _SYSTEMD_INVOCATION_ID="$(systemctl show --value --property=InvocationID netdata)" --namespace=netdata --grep ntpd +``` + +#### System without systemd + +Locate the collector log file, typically at `/var/log/netdata/collector.log`, and use `grep` to filter for collector's name: + +```bash +grep ntpd /var/log/netdata/collector.log +``` + +**Note**: This method shows logs from all restarts. Focus on the **latest entries** for troubleshooting current issues. + +#### Docker Container + +If your Netdata runs in a Docker container named "netdata" (replace if different), use this command: + +```bash +docker logs netdata 2>&1 | grep ntpd +``` + diff --git a/src/go/collectors/go.d.plugin/modules/ntpd/metadata.yaml b/src/go/plugin/go.d/modules/ntpd/metadata.yaml index 46178b031..46178b031 100644 --- a/src/go/collectors/go.d.plugin/modules/ntpd/metadata.yaml +++ b/src/go/plugin/go.d/modules/ntpd/metadata.yaml diff --git a/src/go/collectors/go.d.plugin/modules/ntpd/ntpd.go b/src/go/plugin/go.d/modules/ntpd/ntpd.go index 062bb14fd..011624681 100644 --- a/src/go/collectors/go.d.plugin/modules/ntpd/ntpd.go +++ b/src/go/plugin/go.d/modules/ntpd/ntpd.go @@ -8,9 +8,9 @@ import ( "fmt" "time" - "github.com/netdata/netdata/go/go.d.plugin/agent/module" - "github.com/netdata/netdata/go/go.d.plugin/pkg/iprange" - "github.com/netdata/netdata/go/go.d.plugin/pkg/web" + "github.com/netdata/netdata/go/plugins/plugin/go.d/agent/module" + "github.com/netdata/netdata/go/plugins/plugin/go.d/pkg/iprange" + "github.com/netdata/netdata/go/plugins/plugin/go.d/pkg/web" ) //go:embed "config_schema.json" diff --git a/src/go/collectors/go.d.plugin/modules/ntpd/ntpd_test.go b/src/go/plugin/go.d/modules/ntpd/ntpd_test.go index 9435485da..99c0519c8 100644 --- a/src/go/collectors/go.d.plugin/modules/ntpd/ntpd_test.go +++ b/src/go/plugin/go.d/modules/ntpd/ntpd_test.go @@ -8,7 +8,7 @@ import ( "os" "testing" - "github.com/netdata/netdata/go/go.d.plugin/agent/module" + "github.com/netdata/netdata/go/plugins/plugin/go.d/agent/module" "github.com/stretchr/testify/assert" "github.com/stretchr/testify/require" diff --git a/src/go/collectors/go.d.plugin/modules/ntpd/testdata/config.json b/src/go/plugin/go.d/modules/ntpd/testdata/config.json index fc8d6844f..fc8d6844f 100644 --- a/src/go/collectors/go.d.plugin/modules/ntpd/testdata/config.json +++ b/src/go/plugin/go.d/modules/ntpd/testdata/config.json diff --git a/src/go/collectors/go.d.plugin/modules/ntpd/testdata/config.yaml b/src/go/plugin/go.d/modules/ntpd/testdata/config.yaml index 94cee8526..94cee8526 100644 --- a/src/go/collectors/go.d.plugin/modules/ntpd/testdata/config.yaml +++ b/src/go/plugin/go.d/modules/ntpd/testdata/config.yaml diff --git a/src/go/collectors/go.d.plugin/modules/nvidia_smi/README.md b/src/go/plugin/go.d/modules/nvidia_smi/README.md index 3527bdb4b..3527bdb4b 120000 --- a/src/go/collectors/go.d.plugin/modules/nvidia_smi/README.md +++ b/src/go/plugin/go.d/modules/nvidia_smi/README.md diff --git a/src/go/collectors/go.d.plugin/modules/nvidia_smi/charts.go b/src/go/plugin/go.d/modules/nvidia_smi/charts.go index 4ffdb47b1..746c8eed3 100644 --- a/src/go/collectors/go.d.plugin/modules/nvidia_smi/charts.go +++ b/src/go/plugin/go.d/modules/nvidia_smi/charts.go @@ -6,7 +6,7 @@ import ( "fmt" "strings" - "github.com/netdata/netdata/go/go.d.plugin/agent/module" + "github.com/netdata/netdata/go/plugins/plugin/go.d/agent/module" ) const ( @@ -53,16 +53,6 @@ var ( migDeviceFrameBufferMemoryUsageChartTmpl.Copy(), migDeviceBAR1MemoryUsageChartTmpl.Copy(), } - gpuCSVCharts = module.Charts{ - gpuFanSpeedPercChartTmpl.Copy(), - gpuUtilizationChartTmpl.Copy(), - gpuMemUtilizationChartTmpl.Copy(), - gpuFrameBufferMemoryUsageChartTmpl.Copy(), - gpuTemperatureChartTmpl.Copy(), - gpuClockFreqChartTmpl.Copy(), - gpuPowerDrawChartTmpl.Copy(), - gpuPerformanceStateChartTmpl.Copy(), - } ) var ( @@ -271,7 +261,7 @@ var ( } ) -func (nv *NvidiaSMI) addGPUXMLCharts(gpu xmlGPUInfo) { +func (nv *NvidiaSmi) addGPUXMLCharts(gpu gpuInfo) { charts := gpuXMLCharts.Copy() if !isValidValue(gpu.Utilization.GpuUtil) { @@ -318,37 +308,6 @@ func (nv *NvidiaSMI) addGPUXMLCharts(gpu xmlGPUInfo) { } } -func (nv *NvidiaSMI) addGPUCSVCharts(gpu csvGPUInfo) { - charts := gpuCSVCharts.Copy() - - if !isValidValue(gpu.utilizationGPU) { - _ = charts.Remove(gpuUtilizationChartTmpl.ID) - } - if !isValidValue(gpu.utilizationMemory) { - _ = charts.Remove(gpuMemUtilizationChartTmpl.ID) - } - if !isValidValue(gpu.fanSpeed) { - _ = charts.Remove(gpuFanSpeedPercChartTmpl.ID) - } - if !isValidValue(gpu.powerDraw) { - _ = charts.Remove(gpuPowerDrawChartTmpl.ID) - } - - for _, c := range *charts { - c.ID = fmt.Sprintf(c.ID, strings.ToLower(gpu.uuid)) - c.Labels = []module.Label{ - {Key: "product_name", Value: gpu.name}, - } - for _, d := range c.Dims { - d.ID = fmt.Sprintf(d.ID, gpu.uuid) - } - } - - if err := nv.Charts().Add(*charts...); err != nil { - nv.Warning(err) - } -} - var ( migDeviceFrameBufferMemoryUsageChartTmpl = module.Chart{ ID: "mig_instance_%s_gpu_%s_frame_buffer_memory_usage", @@ -379,7 +338,7 @@ var ( } ) -func (nv *NvidiaSMI) addMIGDeviceXMLCharts(gpu xmlGPUInfo, mig xmlMIGDeviceInfo) { +func (nv *NvidiaSmi) addMIGDeviceCharts(gpu gpuInfo, mig gpuMIGDeviceInfo) { charts := migDeviceXMLCharts.Copy() for _, c := range *charts { @@ -399,7 +358,7 @@ func (nv *NvidiaSMI) addMIGDeviceXMLCharts(gpu xmlGPUInfo, mig xmlMIGDeviceInfo) } } -func (nv *NvidiaSMI) removeCharts(prefix string) { +func (nv *NvidiaSmi) removeCharts(prefix string) { prefix = strings.ToLower(prefix) for _, c := range *nv.Charts() { diff --git a/src/go/collectors/go.d.plugin/modules/nvidia_smi/collect_xml.go b/src/go/plugin/go.d/modules/nvidia_smi/collect.go index 2ab3180a8..f621d191b 100644 --- a/src/go/collectors/go.d.plugin/modules/nvidia_smi/collect_xml.go +++ b/src/go/plugin/go.d/modules/nvidia_smi/collect.go @@ -4,18 +4,33 @@ package nvidia_smi import ( "encoding/xml" + "errors" "fmt" "strconv" "strings" ) -func (nv *NvidiaSMI) collectGPUInfoXML(mx map[string]int64) error { - bs, err := nv.exec.queryGPUInfoXML() +func (nv *NvidiaSmi) collect() (map[string]int64, error) { + if nv.exec == nil { + return nil, errors.New("nvidia-smi exec is not initialized") + } + + mx := make(map[string]int64) + + if err := nv.collectGPUInfo(mx); err != nil { + return nil, err + } + + return mx, nil +} + +func (nv *NvidiaSmi) collectGPUInfo(mx map[string]int64) error { + bs, err := nv.exec.queryGPUInfo() if err != nil { return fmt.Errorf("error on quering XML GPU info: %v", err) } - info := &xmlInfo{} + info := &gpusInfo{} if err := xml.Unmarshal(bs, info); err != nil { return fmt.Errorf("error on unmarshaling XML GPU info response: %v", err) } @@ -39,11 +54,11 @@ func (nv *NvidiaSMI) collectGPUInfoXML(mx map[string]int64) error { addMetric(mx, px+"pcie_bandwidth_usage_rx", gpu.PCI.RxUtil, 1024) // KB => bytes addMetric(mx, px+"pcie_bandwidth_usage_tx", gpu.PCI.TxUtil, 1024) // KB => bytes - if max := calcMaxPCIEBandwidth(gpu); max > 0 { + if maxBw := calcMaxPCIEBandwidth(gpu); maxBw > 0 { rx := parseFloat(gpu.PCI.RxUtil) * 1024 // KB => bytes tx := parseFloat(gpu.PCI.TxUtil) * 1024 // KB => bytes - mx[px+"pcie_bandwidth_utilization_rx"] = int64((rx * 100 / max) * 100) - mx[px+"pcie_bandwidth_utilization_tx"] = int64((tx * 100 / max) * 100) + mx[px+"pcie_bandwidth_utilization_rx"] = int64((rx * 100 / maxBw) * 100) + mx[px+"pcie_bandwidth_utilization_tx"] = int64((tx * 100 / maxBw) * 100) } addMetric(mx, px+"fan_speed_perc", gpu.FanSpeed, 0) addMetric(mx, px+"gpu_utilization", gpu.Utilization.GpuUtil, 0) @@ -88,7 +103,7 @@ func (nv *NvidiaSMI) collectGPUInfoXML(mx map[string]int64) error { if !nv.migs[px] { nv.migs[px] = true - nv.addMIGDeviceXMLCharts(gpu, mig) + nv.addMIGDeviceCharts(gpu, mig) } addMetric(mx, px+"ecc_error_sram_uncorrectable", mig.ECCErrorCount.VolatileCount.SRAMUncorrectable, 0) @@ -117,7 +132,7 @@ func (nv *NvidiaSMI) collectGPUInfoXML(mx map[string]int64) error { return nil } -func calcMaxPCIEBandwidth(gpu xmlGPUInfo) float64 { +func calcMaxPCIEBandwidth(gpu gpuInfo) float64 { gen := gpu.PCI.PCIGPULinkInfo.PCIEGen.MaxLinkGen width := strings.TrimSuffix(gpu.PCI.PCIGPULinkInfo.LinkWidths.MaxLinkWidth, "x") @@ -146,120 +161,44 @@ func calcMaxPCIEBandwidth(gpu xmlGPUInfo) float64 { return (speed*parseFloat(width)*(1-enc) - 1) * 1e9 / 8 // Gb/s => bytes } -type ( - xmlInfo struct { - GPUs []xmlGPUInfo `xml:"gpu"` +func addMetric(mx map[string]int64, key, value string, mul int) { + if !isValidValue(value) { + return } - xmlGPUInfo struct { - ID string `xml:"id,attr"` - ProductName string `xml:"product_name"` - ProductBrand string `xml:"product_brand"` - ProductArchitecture string `xml:"product_architecture"` - UUID string `xml:"uuid"` - FanSpeed string `xml:"fan_speed"` - PerformanceState string `xml:"performance_state"` - MIGMode struct { - CurrentMIG string `xml:"current_mig"` - } `xml:"mig_mode"` - MIGDevices struct { - MIGDevice []xmlMIGDeviceInfo `xml:"mig_device"` - } `xml:"mig_devices"` - PCI struct { - TxUtil string `xml:"tx_util"` - RxUtil string `xml:"rx_util"` - PCIGPULinkInfo struct { - PCIEGen struct { - MaxLinkGen string `xml:"max_link_gen"` - } `xml:"pcie_gen"` - LinkWidths struct { - MaxLinkWidth string `xml:"max_link_width"` - } `xml:"link_widths"` - } `xml:"pci_gpu_link_info"` - } `xml:"pci"` - Utilization struct { - GpuUtil string `xml:"gpu_util"` - MemoryUtil string `xml:"memory_util"` - EncoderUtil string `xml:"encoder_util"` - DecoderUtil string `xml:"decoder_util"` - } `xml:"utilization"` - FBMemoryUsage struct { - Total string `xml:"total"` - Reserved string `xml:"reserved"` - Used string `xml:"used"` - Free string `xml:"free"` - } `xml:"fb_memory_usage"` - Bar1MemoryUsage struct { - Total string `xml:"total"` - Used string `xml:"used"` - Free string `xml:"free"` - } `xml:"bar1_memory_usage"` - Temperature struct { - GpuTemp string `xml:"gpu_temp"` - GpuTempMaxThreshold string `xml:"gpu_temp_max_threshold"` - GpuTempSlowThreshold string `xml:"gpu_temp_slow_threshold"` - GpuTempMaxGpuThreshold string `xml:"gpu_temp_max_gpu_threshold"` - GpuTargetTemperature string `xml:"gpu_target_temperature"` - MemoryTemp string `xml:"memory_temp"` - GpuTempMaxMemThreshold string `xml:"gpu_temp_max_mem_threshold"` - } `xml:"temperature"` - Clocks struct { - GraphicsClock string `xml:"graphics_clock"` - SmClock string `xml:"sm_clock"` - MemClock string `xml:"mem_clock"` - VideoClock string `xml:"video_clock"` - } `xml:"clocks"` - PowerReadings *xmlPowerReadings `xml:"power_readings"` - GPUPowerReadings *xmlPowerReadings `xml:"gpu_power_readings"` - Voltage struct { - GraphicsVolt string `xml:"graphics_volt"` - } `xml:"voltage"` - Processes struct { - ProcessInfo []struct { - PID string `xml:"pid"` - ProcessName string `xml:"process_name"` - UsedMemory string `xml:"used_memory"` - } `sml:"process_info"` - } `xml:"processes"` + + value = removeUnits(value) + + v, err := strconv.ParseFloat(value, 64) + if err != nil { + return } - xmlPowerReadings struct { - //PowerState string `xml:"power_state"` - //PowerManagement string `xml:"power_management"` - PowerDraw string `xml:"power_draw"` - //PowerLimit string `xml:"power_limit"` - //DefaultPowerLimit string `xml:"default_power_limit"` - //EnforcedPowerLimit string `xml:"enforced_power_limit"` - //MinPowerLimit string `xml:"min_power_limit"` - //MaxPowerLimit string `xml:"max_power_limit"` + if mul > 0 { + v *= float64(mul) } - xmlMIGDeviceInfo struct { - Index string `xml:"index"` - GPUInstanceID string `xml:"gpu_instance_id"` - ComputeInstanceID string `xml:"compute_instance_id"` - DeviceAttributes struct { - Shared struct { - MultiprocessorCount string `xml:"multiprocessor_count"` - CopyEngineCount string `xml:"copy_engine_count"` - EncoderCount string `xml:"encoder_count"` - DecoderCount string `xml:"decoder_count"` - OFACount string `xml:"ofa_count"` - JPGCount string `xml:"jpg_count"` - } `xml:"shared"` - } `xml:"device_attributes"` - ECCErrorCount struct { - VolatileCount struct { - SRAMUncorrectable string `xml:"sram_uncorrectable"` - } `xml:"volatile_count"` - } `xml:"ecc_error_count"` - FBMemoryUsage struct { - Free string `xml:"free"` - Used string `xml:"used"` - Reserved string `xml:"reserved"` - } `xml:"fb_memory_usage"` - BAR1MemoryUsage struct { - Free string `xml:"free"` - Used string `xml:"used"` - } `xml:"bar1_memory_usage"` + mx[key] = int64(v) +} + +func isValidValue(v string) bool { + return v != "" && v != "N/A" && v != "[N/A]" +} + +func parseFloat(s string) float64 { + v, _ := strconv.ParseFloat(removeUnits(s), 64) + return v +} + +func removeUnits(s string) string { + if i := strings.IndexByte(s, ' '); i != -1 { + s = s[:i] } -) + return s +} + +func boolToInt(v bool) int64 { + if v { + return 1 + } + return 0 +} diff --git a/src/go/plugin/go.d/modules/nvidia_smi/config_schema.json b/src/go/plugin/go.d/modules/nvidia_smi/config_schema.json new file mode 100644 index 000000000..3f93badc2 --- /dev/null +++ b/src/go/plugin/go.d/modules/nvidia_smi/config_schema.json @@ -0,0 +1,56 @@ +{ + "jsonSchema": { + "$schema": "http://json-schema.org/draft-07/schema#", + "title": "NVIDIA SMI collector configuration.", + "type": "object", + "properties": { + "update_every": { + "title": "Update every", + "description": "Data collection interval, measured in seconds.", + "type": "integer", + "minimum": 1, + "default": 10 + }, + "binary_path": { + "title": "Binary path", + "description": "Path to the `nvidia-smi` binary.", + "type": "string", + "default": "nvidia-smi" + }, + "timeout": { + "title": "Timeout", + "description": "Timeout for executing the binary, specified in seconds.", + "type": "number", + "minimum": 0.5, + "default": 10 + }, + "loop_mode": { + "title": "Loop Mode", + "description": "When enabled, `nvidia-smi` is executed continuously in a separate thread using the `-l` option.", + "type": "boolean", + "default": true + } + }, + "required": [ + "binary_path" + ], + "additionalProperties": false, + "patternProperties": { + "^name$": {} + } + }, + "uiSchema": { + "uiOptions": { + "fullPage": true + }, + "binary_path": { + "ui:help": "If an absolute path is provided, the collector will use it directly; otherwise, it will search for the binary in directories specified in the PATH environment variable." + }, + "timeout": { + "ui:help": "Accepts decimals for precise control (e.g., type 1.5 for 1.5 seconds)." + }, + "loop_mode": { + "ui:help": "In loop mode, `nvidia-smi` will repeatedly query GPU data at specified intervals, defined by the `-l SEC` or `--loop=SEC` parameter, rather than just running the query once. This enables ongoing performance tracking by putting the application to sleep between queries." + } + } +} diff --git a/src/go/plugin/go.d/modules/nvidia_smi/exec.go b/src/go/plugin/go.d/modules/nvidia_smi/exec.go new file mode 100644 index 000000000..11a26131f --- /dev/null +++ b/src/go/plugin/go.d/modules/nvidia_smi/exec.go @@ -0,0 +1,213 @@ +// SPDX-License-Identifier: GPL-3.0-or-later + +package nvidia_smi + +import ( + "bufio" + "bytes" + "context" + "errors" + "fmt" + "os/exec" + "strconv" + "sync" + "time" + + "github.com/netdata/netdata/go/plugins/logger" +) + +type nvidiaSmiBinary interface { + queryGPUInfo() ([]byte, error) + stop() error +} + +func newNvidiaSmiBinary(path string, cfg Config, log *logger.Logger) (nvidiaSmiBinary, error) { + if !cfg.LoopMode { + return &nvidiaSmiExec{ + Logger: log, + binPath: path, + timeout: cfg.Timeout.Duration(), + }, nil + } + + smi := &nvidiaSmiLoopExec{ + Logger: log, + binPath: path, + updateEvery: cfg.UpdateEvery, + firstSampleTimeout: time.Second * 3, + } + + if err := smi.run(); err != nil { + return nil, err + } + + return smi, nil +} + +type nvidiaSmiExec struct { + *logger.Logger + + binPath string + timeout time.Duration +} + +func (e *nvidiaSmiExec) queryGPUInfo() ([]byte, error) { + ctx, cancel := context.WithTimeout(context.Background(), e.timeout) + defer cancel() + + cmd := exec.CommandContext(ctx, e.binPath, "-q", "-x") + + e.Debugf("executing '%s'", cmd) + bs, err := cmd.Output() + if err != nil { + return nil, fmt.Errorf("error on '%s': %v", cmd, err) + } + + return bs, nil +} + +func (e *nvidiaSmiExec) stop() error { return nil } + +type nvidiaSmiLoopExec struct { + *logger.Logger + + binPath string + + updateEvery int + firstSampleTimeout time.Duration + + cmd *exec.Cmd + done chan struct{} + + mux sync.Mutex + lastSample string +} + +func (e *nvidiaSmiLoopExec) queryGPUInfo() ([]byte, error) { + select { + case <-e.done: + return nil, errors.New("process has already exited") + default: + } + + e.mux.Lock() + defer e.mux.Unlock() + + return []byte(e.lastSample), nil +} + +func (e *nvidiaSmiLoopExec) run() error { + secs := 5 + if e.updateEvery < secs { + secs = e.updateEvery + } + + cmd := exec.Command(e.binPath, "-q", "-x", "-l", strconv.Itoa(secs)) + + e.Debugf("executing '%s'", cmd) + + r, err := cmd.StdoutPipe() + if err != nil { + return err + } + + if err := cmd.Start(); err != nil { + return err + } + + firstSample := make(chan struct{}, 1) + done := make(chan struct{}) + e.cmd = cmd + e.done = done + + go func() { + defer close(done) + + var buf bytes.Buffer + var insideLog bool + var emptyRows int64 + var outsideLogRows int64 + + const unexpectedRowsLimit = 500 + + sc := bufio.NewScanner(r) + + for sc.Scan() { + line := sc.Text() + + if !insideLog { + outsideLogRows++ + } else { + outsideLogRows = 0 + } + + if line == "" { + emptyRows++ + } else { + emptyRows = 0 + } + + if outsideLogRows >= unexpectedRowsLimit || emptyRows >= unexpectedRowsLimit { + e.Errorf("unexpected output from nvidia-smi loop: outside log rows %d, empty rows %d", outsideLogRows, emptyRows) + break + } + + switch { + case line == "<nvidia_smi_log>": + insideLog = true + buf.Reset() + + buf.WriteString(line) + buf.WriteByte('\n') + case line == "</nvidia_smi_log>": + insideLog = false + + buf.WriteString(line) + + e.mux.Lock() + e.lastSample = buf.String() + e.mux.Unlock() + + buf.Reset() + + select { + case firstSample <- struct{}{}: + default: + } + case insideLog: + buf.WriteString(line) + buf.WriteByte('\n') + default: + continue + } + } + }() + + select { + case <-e.done: + _ = e.stop() + return errors.New("process exited before the first sample was collected") + case <-time.After(e.firstSampleTimeout): + _ = e.stop() + return errors.New("timed out waiting for first sample") + case <-firstSample: + return nil + } +} + +func (e *nvidiaSmiLoopExec) stop() error { + if e.cmd == nil || e.cmd.Process == nil { + return nil + } + + _ = e.cmd.Process.Kill() + _ = e.cmd.Wait() + e.cmd = nil + + select { + case <-e.done: + return nil + case <-time.After(time.Second * 2): + return errors.New("timed out waiting for process to exit") + } +} diff --git a/src/go/plugin/go.d/modules/nvidia_smi/gpu_info.go b/src/go/plugin/go.d/modules/nvidia_smi/gpu_info.go new file mode 100644 index 000000000..506d36f6e --- /dev/null +++ b/src/go/plugin/go.d/modules/nvidia_smi/gpu_info.go @@ -0,0 +1,121 @@ +// SPDX-License-Identifier: GPL-3.0-or-later + +package nvidia_smi + +type gpusInfo struct { + GPUs []gpuInfo `xml:"gpu"` +} + +type ( + gpuInfo struct { + ID string `xml:"id,attr"` + ProductName string `xml:"product_name"` + ProductBrand string `xml:"product_brand"` + ProductArchitecture string `xml:"product_architecture"` + UUID string `xml:"uuid"` + FanSpeed string `xml:"fan_speed"` + PerformanceState string `xml:"performance_state"` + MIGMode struct { + CurrentMIG string `xml:"current_mig"` + } `xml:"mig_mode"` + MIGDevices struct { + MIGDevice []gpuMIGDeviceInfo `xml:"mig_device"` + } `xml:"mig_devices"` + PCI struct { + TxUtil string `xml:"tx_util"` + RxUtil string `xml:"rx_util"` + PCIGPULinkInfo struct { + PCIEGen struct { + MaxLinkGen string `xml:"max_link_gen"` + } `xml:"pcie_gen"` + LinkWidths struct { + MaxLinkWidth string `xml:"max_link_width"` + } `xml:"link_widths"` + } `xml:"pci_gpu_link_info"` + } `xml:"pci"` + Utilization struct { + GpuUtil string `xml:"gpu_util"` + MemoryUtil string `xml:"memory_util"` + EncoderUtil string `xml:"encoder_util"` + DecoderUtil string `xml:"decoder_util"` + } `xml:"utilization"` + FBMemoryUsage struct { + Total string `xml:"total"` + Reserved string `xml:"reserved"` + Used string `xml:"used"` + Free string `xml:"free"` + } `xml:"fb_memory_usage"` + Bar1MemoryUsage struct { + Total string `xml:"total"` + Used string `xml:"used"` + Free string `xml:"free"` + } `xml:"bar1_memory_usage"` + Temperature struct { + GpuTemp string `xml:"gpu_temp"` + GpuTempMaxThreshold string `xml:"gpu_temp_max_threshold"` + GpuTempSlowThreshold string `xml:"gpu_temp_slow_threshold"` + GpuTempMaxGpuThreshold string `xml:"gpu_temp_max_gpu_threshold"` + GpuTargetTemperature string `xml:"gpu_target_temperature"` + MemoryTemp string `xml:"memory_temp"` + GpuTempMaxMemThreshold string `xml:"gpu_temp_max_mem_threshold"` + } `xml:"temperature"` + Clocks struct { + GraphicsClock string `xml:"graphics_clock"` + SmClock string `xml:"sm_clock"` + MemClock string `xml:"mem_clock"` + VideoClock string `xml:"video_clock"` + } `xml:"clocks"` + PowerReadings *gpuPowerReadings `xml:"power_readings"` + GPUPowerReadings *gpuPowerReadings `xml:"gpu_power_readings"` + Voltage struct { + GraphicsVolt string `xml:"graphics_volt"` + } `xml:"voltage"` + Processes struct { + ProcessInfo []struct { + PID string `xml:"pid"` + ProcessName string `xml:"process_name"` + UsedMemory string `xml:"used_memory"` + } `sml:"process_info"` + } `xml:"processes"` + } + gpuPowerReadings struct { + //PowerState string `xml:"power_state"` + //PowerManagement string `xml:"power_management"` + PowerDraw string `xml:"power_draw"` + //PowerLimit string `xml:"power_limit"` + //DefaultPowerLimit string `xml:"default_power_limit"` + //EnforcedPowerLimit string `xml:"enforced_power_limit"` + //MinPowerLimit string `xml:"min_power_limit"` + //MaxPowerLimit string `xml:"max_power_limit"` + } + + gpuMIGDeviceInfo struct { + Index string `xml:"index"` + GPUInstanceID string `xml:"gpu_instance_id"` + ComputeInstanceID string `xml:"compute_instance_id"` + DeviceAttributes struct { + Shared struct { + MultiprocessorCount string `xml:"multiprocessor_count"` + CopyEngineCount string `xml:"copy_engine_count"` + EncoderCount string `xml:"encoder_count"` + DecoderCount string `xml:"decoder_count"` + OFACount string `xml:"ofa_count"` + JPGCount string `xml:"jpg_count"` + } `xml:"shared"` + } `xml:"device_attributes"` + ECCErrorCount struct { + VolatileCount struct { + SRAMUncorrectable string `xml:"sram_uncorrectable"` + } `xml:"volatile_count"` + } `xml:"ecc_error_count"` + FBMemoryUsage struct { + Free string `xml:"free"` + Used string `xml:"used"` + Reserved string `xml:"reserved"` + } `xml:"fb_memory_usage"` + BAR1MemoryUsage struct { + Free string `xml:"free"` + Used string `xml:"used"` + } `xml:"bar1_memory_usage"` + } +) diff --git a/src/go/collectors/go.d.plugin/modules/nvidia_smi/init.go b/src/go/plugin/go.d/modules/nvidia_smi/init.go index d8a815bb4..c13b2fffd 100644 --- a/src/go/collectors/go.d.plugin/modules/nvidia_smi/init.go +++ b/src/go/plugin/go.d/modules/nvidia_smi/init.go @@ -8,7 +8,7 @@ import ( "os/exec" ) -func (nv *NvidiaSMI) initNvidiaSMIExec() (nvidiaSMI, error) { +func (nv *NvidiaSmi) initNvidiaSmiExec() (nvidiaSmiBinary, error) { binPath := nv.BinaryPath if _, err := os.Stat(binPath); os.IsNotExist(err) { path, err := exec.LookPath(nv.binName) @@ -18,5 +18,5 @@ func (nv *NvidiaSMI) initNvidiaSMIExec() (nvidiaSMI, error) { binPath = path } - return newNvidiaSMIExec(binPath, nv.Config, nv.Logger) + return newNvidiaSmiBinary(binPath, nv.Config, nv.Logger) } diff --git a/src/go/collectors/go.d.plugin/modules/nvidia_smi/integrations/nvidia_gpu.md b/src/go/plugin/go.d/modules/nvidia_smi/integrations/nvidia_gpu.md index 28016cfbd..620c09639 100644 --- a/src/go/collectors/go.d.plugin/modules/nvidia_smi/integrations/nvidia_gpu.md +++ b/src/go/plugin/go.d/modules/nvidia_smi/integrations/nvidia_gpu.md @@ -1,6 +1,6 @@ <!--startmeta -custom_edit_url: "https://github.com/netdata/netdata/edit/master/src/go/collectors/go.d.plugin/modules/nvidia_smi/README.md" -meta_yaml: "https://github.com/netdata/netdata/edit/master/src/go/collectors/go.d.plugin/modules/nvidia_smi/metadata.yaml" +custom_edit_url: "https://github.com/netdata/netdata/edit/master/src/go/plugin/go.d/modules/nvidia_smi/README.md" +meta_yaml: "https://github.com/netdata/netdata/edit/master/src/go/plugin/go.d/modules/nvidia_smi/metadata.yaml" sidebar_label: "Nvidia GPU" learn_status: "Published" learn_rel_path: "Collecting Metrics/Hardware Devices and Sensors" @@ -24,8 +24,6 @@ Module: nvidia_smi This collector monitors GPUs performance metrics using the [nvidia-smi](https://developer.nvidia.com/nvidia-system-management-interface) CLI tool. -> **Warning**: under development, [loop mode](https://github.com/netdata/netdata/issues/14522) not implemented yet. - @@ -70,24 +68,24 @@ Labels: Metrics: -| Metric | Dimensions | Unit | XML | CSV | -|:------|:----------|:----|:---:|:---:| -| nvidia_smi.gpu_pcie_bandwidth_usage | rx, tx | B/s | • | | -| nvidia_smi.gpu_pcie_bandwidth_utilization | rx, tx | % | • | | -| nvidia_smi.gpu_fan_speed_perc | fan_speed | % | • | • | -| nvidia_smi.gpu_utilization | gpu | % | • | • | -| nvidia_smi.gpu_memory_utilization | memory | % | • | • | -| nvidia_smi.gpu_decoder_utilization | decoder | % | • | | -| nvidia_smi.gpu_encoder_utilization | encoder | % | • | | -| nvidia_smi.gpu_frame_buffer_memory_usage | free, used, reserved | B | • | • | -| nvidia_smi.gpu_bar1_memory_usage | free, used | B | • | | -| nvidia_smi.gpu_temperature | temperature | Celsius | • | • | -| nvidia_smi.gpu_voltage | voltage | V | • | | -| nvidia_smi.gpu_clock_freq | graphics, video, sm, mem | MHz | • | • | -| nvidia_smi.gpu_power_draw | power_draw | Watts | • | • | -| nvidia_smi.gpu_performance_state | P0-P15 | state | • | • | -| nvidia_smi.gpu_mig_mode_current_status | enabled, disabled | status | • | | -| nvidia_smi.gpu_mig_devices_count | mig | devices | • | | +| Metric | Dimensions | Unit | +|:------|:----------|:----| +| nvidia_smi.gpu_pcie_bandwidth_usage | rx, tx | B/s | +| nvidia_smi.gpu_pcie_bandwidth_utilization | rx, tx | % | +| nvidia_smi.gpu_fan_speed_perc | fan_speed | % | +| nvidia_smi.gpu_utilization | gpu | % | +| nvidia_smi.gpu_memory_utilization | memory | % | +| nvidia_smi.gpu_decoder_utilization | decoder | % | +| nvidia_smi.gpu_encoder_utilization | encoder | % | +| nvidia_smi.gpu_frame_buffer_memory_usage | free, used, reserved | B | +| nvidia_smi.gpu_bar1_memory_usage | free, used | B | +| nvidia_smi.gpu_temperature | temperature | Celsius | +| nvidia_smi.gpu_voltage | voltage | V | +| nvidia_smi.gpu_clock_freq | graphics, video, sm, mem | MHz | +| nvidia_smi.gpu_power_draw | power_draw | Watts | +| nvidia_smi.gpu_performance_state | P0-P15 | state | +| nvidia_smi.gpu_mig_mode_current_status | enabled, disabled | status | +| nvidia_smi.gpu_mig_devices_count | mig | devices | ### Per mig @@ -103,10 +101,10 @@ Labels: Metrics: -| Metric | Dimensions | Unit | XML | CSV | -|:------|:----------|:----|:---:|:---:| -| nvidia_smi.gpu_mig_frame_buffer_memory_usage | free, used, reserved | B | • | | -| nvidia_smi.gpu_mig_bar1_memory_usage | free, used | B | • | | +| Metric | Dimensions | Unit | +|:------|:----------|:----| +| nvidia_smi.gpu_mig_frame_buffer_memory_usage | free, used, reserved | B | +| nvidia_smi.gpu_mig_bar1_memory_usage | free, used | B | @@ -119,11 +117,7 @@ There are no alerts configured by default for this integration. ### Prerequisites -#### Enable in go.d.conf. - -This collector is disabled by default. You need to explicitly enable it in the `go.d.conf` file. - - +No action required. ### Configuration @@ -152,26 +146,12 @@ The following options can be defined globally: update_every, autodetection_retry | autodetection_retry | Recheck interval in seconds. Zero means no recheck will be scheduled. | 0 | no | | binary_path | Path to nvidia_smi binary. The default is "nvidia_smi" and the executable is looked for in the directories specified in the PATH environment variable. | nvidia_smi | no | | timeout | nvidia_smi binary execution timeout. | 2 | no | -| use_csv_format | Used format when requesting GPU information. XML is used if set to 'no'. | no | no | +| loop_mode | When enabled, `nvidia-smi` is executed continuously in a separate thread using the `-l` option. | yes | no | </details> #### Examples -##### CSV format - -Use CSV format when requesting GPU information. - -<details open><summary>Config</summary> - -```yaml -jobs: - - name: nvidia_smi - use_csv_format: yes - -``` -</details> - ##### Custom binary path The executable is not in the directories specified in the PATH environment variable. @@ -192,6 +172,8 @@ jobs: ### Debug Mode +**Important**: Debug mode is not supported for data collection jobs created via the UI using the Dyncfg feature. + To troubleshoot issues with the `nvidia_smi` collector, run the `go.d.plugin` with the debug option enabled. The output should give you clues as to why the collector isn't working. @@ -214,4 +196,37 @@ should give you clues as to why the collector isn't working. ./go.d.plugin -d -m nvidia_smi ``` +### Getting Logs + +If you're encountering problems with the `nvidia_smi` collector, follow these steps to retrieve logs and identify potential issues: + +- **Run the command** specific to your system (systemd, non-systemd, or Docker container). +- **Examine the output** for any warnings or error messages that might indicate issues. These messages should provide clues about the root cause of the problem. + +#### System with systemd + +Use the following command to view logs generated since the last Netdata service restart: + +```bash +journalctl _SYSTEMD_INVOCATION_ID="$(systemctl show --value --property=InvocationID netdata)" --namespace=netdata --grep nvidia_smi +``` + +#### System without systemd + +Locate the collector log file, typically at `/var/log/netdata/collector.log`, and use `grep` to filter for collector's name: + +```bash +grep nvidia_smi /var/log/netdata/collector.log +``` + +**Note**: This method shows logs from all restarts. Focus on the **latest entries** for troubleshooting current issues. + +#### Docker Container + +If your Netdata runs in a Docker container named "netdata" (replace if different), use this command: + +```bash +docker logs netdata 2>&1 | grep nvidia_smi +``` + diff --git a/src/go/collectors/go.d.plugin/modules/nvidia_smi/metadata.yaml b/src/go/plugin/go.d/modules/nvidia_smi/metadata.yaml index 630037d72..2a79b5ac1 100644 --- a/src/go/collectors/go.d.plugin/modules/nvidia_smi/metadata.yaml +++ b/src/go/plugin/go.d/modules/nvidia_smi/metadata.yaml @@ -25,8 +25,6 @@ modules: metrics_description: | This collector monitors GPUs performance metrics using the [nvidia-smi](https://developer.nvidia.com/nvidia-system-management-interface) CLI tool. - - > **Warning**: under development, [loop mode](https://github.com/netdata/netdata/issues/14522) not implemented yet. method_description: "" supported_platforms: include: [] @@ -43,10 +41,7 @@ modules: description: "" setup: prerequisites: - list: - - title: Enable in go.d.conf. - description: | - This collector is disabled by default. You need to explicitly enable it in the `go.d.conf` file. + list: [] configuration: file: name: go.d/nvidia_smi.conf @@ -73,26 +68,15 @@ modules: description: nvidia_smi binary execution timeout. default_value: 2 required: false - - name: use_csv_format - description: Used format when requesting GPU information. XML is used if set to 'no'. - default_value: false + - name: loop_mode + description: "When enabled, `nvidia-smi` is executed continuously in a separate thread using the `-l` option." + default_value: true required: false - details: | - This module supports data collection in CSV and XML formats. The default is XML. - - - XML provides more metrics, but requesting GPU information consumes more CPU, especially if there are multiple GPUs in the system. - - CSV provides fewer metrics, but is much lighter than XML in terms of CPU usage. examples: folding: title: Config enabled: true list: - - name: CSV format - description: Use CSV format when requesting GPU information. - config: | - jobs: - - name: nvidia_smi - use_csv_format: yes - name: Custom binary path description: The executable is not in the directories specified in the PATH environment variable. config: | @@ -108,9 +92,7 @@ modules: title: Metrics enabled: false description: "" - availability: - - XML - - CSV + availability: [] scopes: - name: gpu description: These metrics refer to the GPU. @@ -121,8 +103,6 @@ modules: description: GPU product name (e.g. NVIDIA A100-SXM4-40GB) metrics: - name: nvidia_smi.gpu_pcie_bandwidth_usage - availability: - - XML description: PCI Express Bandwidth Usage unit: B/s chart_type: line @@ -130,8 +110,6 @@ modules: - name: rx - name: tx - name: nvidia_smi.gpu_pcie_bandwidth_utilization - availability: - - XML description: PCI Express Bandwidth Utilization unit: '%' chart_type: line @@ -139,52 +117,36 @@ modules: - name: rx - name: tx - name: nvidia_smi.gpu_fan_speed_perc - availability: - - XML - - CSV description: Fan speed unit: '%' chart_type: line dimensions: - name: fan_speed - name: nvidia_smi.gpu_utilization - availability: - - XML - - CSV description: GPU utilization unit: '%' chart_type: line dimensions: - name: gpu - name: nvidia_smi.gpu_memory_utilization - availability: - - XML - - CSV description: Memory utilization unit: '%' chart_type: line dimensions: - name: memory - name: nvidia_smi.gpu_decoder_utilization - availability: - - XML description: Decoder utilization unit: '%' chart_type: line dimensions: - name: decoder - name: nvidia_smi.gpu_encoder_utilization - availability: - - XML description: Encoder utilization unit: '%' chart_type: line dimensions: - name: encoder - name: nvidia_smi.gpu_frame_buffer_memory_usage - availability: - - XML - - CSV description: Frame buffer memory usage unit: B chart_type: stacked @@ -193,8 +155,6 @@ modules: - name: used - name: reserved - name: nvidia_smi.gpu_bar1_memory_usage - availability: - - XML description: BAR1 memory usage unit: B chart_type: stacked @@ -202,26 +162,18 @@ modules: - name: free - name: used - name: nvidia_smi.gpu_temperature - availability: - - XML - - CSV description: Temperature unit: Celsius chart_type: line dimensions: - name: temperature - name: nvidia_smi.gpu_voltage - availability: - - XML description: Voltage unit: V chart_type: line dimensions: - name: voltage - name: nvidia_smi.gpu_clock_freq - availability: - - XML - - CSV description: Clock current frequency unit: MHz chart_type: line @@ -231,26 +183,18 @@ modules: - name: sm - name: mem - name: nvidia_smi.gpu_power_draw - availability: - - XML - - CSV description: Power draw unit: Watts chart_type: line dimensions: - name: power_draw - name: nvidia_smi.gpu_performance_state - availability: - - XML - - CSV description: Performance state unit: state chart_type: line dimensions: - name: P0-P15 - name: nvidia_smi.gpu_mig_mode_current_status - availability: - - XML description: MIG current mode unit: status chart_type: line @@ -258,8 +202,6 @@ modules: - name: enabled - name: disabled - name: nvidia_smi.gpu_mig_devices_count - availability: - - XML description: MIG devices unit: devices chart_type: line @@ -276,8 +218,6 @@ modules: description: GPU instance id (e.g. 1) metrics: - name: nvidia_smi.gpu_mig_frame_buffer_memory_usage - availability: - - XML description: Frame buffer memory usage unit: B chart_type: stacked @@ -286,8 +226,6 @@ modules: - name: used - name: reserved - name: nvidia_smi.gpu_mig_bar1_memory_usage - availability: - - XML description: BAR1 memory usage unit: B chart_type: stacked diff --git a/src/go/plugin/go.d/modules/nvidia_smi/nvidia_smi.go b/src/go/plugin/go.d/modules/nvidia_smi/nvidia_smi.go new file mode 100644 index 000000000..3f89df05a --- /dev/null +++ b/src/go/plugin/go.d/modules/nvidia_smi/nvidia_smi.go @@ -0,0 +1,114 @@ +// SPDX-License-Identifier: GPL-3.0-or-later + +package nvidia_smi + +import ( + _ "embed" + "errors" + "time" + + "github.com/netdata/netdata/go/plugins/plugin/go.d/agent/module" + "github.com/netdata/netdata/go/plugins/plugin/go.d/pkg/web" +) + +//go:embed "config_schema.json" +var configSchema string + +func init() { + module.Register("nvidia_smi", module.Creator{ + JobConfigSchema: configSchema, + Defaults: module.Defaults{ + UpdateEvery: 10, + }, + Create: func() module.Module { return New() }, + Config: func() any { return &Config{} }, + }) +} + +func New() *NvidiaSmi { + return &NvidiaSmi{ + Config: Config{ + Timeout: web.Duration(time.Second * 10), + LoopMode: true, + }, + binName: "nvidia-smi", + charts: &module.Charts{}, + gpus: make(map[string]bool), + migs: make(map[string]bool), + } + +} + +type Config struct { + UpdateEvery int `yaml:"update_every,omitempty" json:"update_every"` + Timeout web.Duration `yaml:"timeout,omitempty" json:"timeout"` + BinaryPath string `yaml:"binary_path" json:"binary_path"` + LoopMode bool `yaml:"loop_mode,omitempty" json:"loop_mode"` +} + +type NvidiaSmi struct { + module.Base + Config `yaml:",inline" json:""` + + charts *module.Charts + + exec nvidiaSmiBinary + binName string + + gpus map[string]bool + migs map[string]bool +} + +func (nv *NvidiaSmi) Configuration() any { + return nv.Config +} + +func (nv *NvidiaSmi) Init() error { + if nv.exec == nil { + smi, err := nv.initNvidiaSmiExec() + if err != nil { + nv.Error(err) + return err + } + nv.exec = smi + } + + return nil +} + +func (nv *NvidiaSmi) Check() error { + mx, err := nv.collect() + if err != nil { + nv.Error(err) + return err + } + if len(mx) == 0 { + return errors.New("no metrics collected") + } + return nil +} + +func (nv *NvidiaSmi) Charts() *module.Charts { + return nv.charts +} + +func (nv *NvidiaSmi) Collect() map[string]int64 { + mx, err := nv.collect() + if err != nil { + nv.Error(err) + } + + if len(mx) == 0 { + return nil + } + return mx +} + +func (nv *NvidiaSmi) Cleanup() { + if nv.exec != nil { + if err := nv.exec.stop(); err != nil { + nv.Errorf("cleanup: %v", err) + } + nv.exec = nil + } +} diff --git a/src/go/collectors/go.d.plugin/modules/nvidia_smi/nvidia_smi_test.go b/src/go/plugin/go.d/modules/nvidia_smi/nvidia_smi_test.go index af2d3a159..d2070b069 100644 --- a/src/go/collectors/go.d.plugin/modules/nvidia_smi/nvidia_smi_test.go +++ b/src/go/plugin/go.d/modules/nvidia_smi/nvidia_smi_test.go @@ -8,7 +8,7 @@ import ( "os" "testing" - "github.com/netdata/netdata/go/go.d.plugin/agent/module" + "github.com/netdata/netdata/go/plugins/plugin/go.d/agent/module" "github.com/stretchr/testify/assert" "github.com/stretchr/testify/require" @@ -24,9 +24,6 @@ var ( dataXMLTeslaP100, _ = os.ReadFile("testdata/tesla-p100.xml") dataXMLA100SXM4MIG, _ = os.ReadFile("testdata/a100-sxm4-mig.xml") - - dataHelpQueryGPU, _ = os.ReadFile("testdata/help-query-gpu.txt") - dataCSVTeslaP100, _ = os.ReadFile("testdata/tesla-p100.csv") ) func Test_testDataIsValid(t *testing.T) { @@ -38,25 +35,23 @@ func Test_testDataIsValid(t *testing.T) { "dataXMLRTX3060": dataXMLRTX3060, "dataXMLTeslaP100": dataXMLTeslaP100, "dataXMLA100SXM4MIG": dataXMLA100SXM4MIG, - "dataHelpQueryGPU": dataHelpQueryGPU, - "dataCSVTeslaP100": dataCSVTeslaP100, } { require.NotNil(t, data, name) } } -func TestNvidiaSMI_ConfigurationSerialize(t *testing.T) { - module.TestConfigurationSerialize(t, &NvidiaSMI{}, dataConfigJSON, dataConfigYAML) +func TestNvidiaSmi_ConfigurationSerialize(t *testing.T) { + module.TestConfigurationSerialize(t, &NvidiaSmi{}, dataConfigJSON, dataConfigYAML) } -func TestNvidiaSMI_Init(t *testing.T) { +func TestNvidiaSmi_Init(t *testing.T) { tests := map[string]struct { - prepare func(nv *NvidiaSMI) + prepare func(nv *NvidiaSmi) wantFail bool }{ "fails if can't local nvidia-smi": { wantFail: true, - prepare: func(nv *NvidiaSMI) { + prepare: func(nv *NvidiaSmi) { nv.binName += "!!!" }, }, @@ -77,46 +72,34 @@ func TestNvidiaSMI_Init(t *testing.T) { } } -func TestNvidiaSMI_Charts(t *testing.T) { +func TestNvidiaSmi_Charts(t *testing.T) { assert.NotNil(t, New().Charts()) } -func TestNvidiaSMI_Check(t *testing.T) { +func TestNvidiaSmi_Check(t *testing.T) { tests := map[string]struct { - prepare func(nv *NvidiaSMI) + prepare func(nv *NvidiaSmi) wantFail bool }{ - "success A100-SXM4 MIG [XML]": { - wantFail: false, - prepare: prepareCaseMIGA100formatXML, - }, - "success RTX 3060 [XML]": { + "success A100-SXM4 MIG": { wantFail: false, - prepare: prepareCaseRTX3060formatXML, + prepare: prepareCaseMIGA100, }, - "success Tesla P100 [XML]": { + "success RTX 3060": { wantFail: false, - prepare: prepareCaseTeslaP100formatXML, + prepare: prepareCaseRTX3060, }, - "success Tesla P100 [CSV]": { + "success Tesla P100": { wantFail: false, - prepare: prepareCaseTeslaP100formatCSV, + prepare: prepareCaseTeslaP100, }, - "success RTX 2080 Win [XML]": { + "success RTX 2080 Win": { wantFail: false, - prepare: prepareCaseRTX2080WinFormatXML, + prepare: prepareCaseRTX2080Win, }, - "fail on queryGPUInfoXML error": { + "fail on queryGPUInfo error": { wantFail: true, - prepare: prepareCaseErrOnQueryGPUInfoXML, - }, - "fail on queryGPUInfoCSV error": { - wantFail: true, - prepare: prepareCaseErrOnQueryGPUInfoCSV, - }, - "fail on queryHelpQueryGPU error": { - wantFail: true, - prepare: prepareCaseErrOnQueryHelpQueryGPU, + prepare: prepareCaseErrOnQueryGPUInfo, }, } @@ -135,16 +118,16 @@ func TestNvidiaSMI_Check(t *testing.T) { } } -func TestNvidiaSMI_Collect(t *testing.T) { +func TestNvidiaSmi_Collect(t *testing.T) { type testCaseStep struct { - prepare func(nv *NvidiaSMI) - check func(t *testing.T, nv *NvidiaSMI) + prepare func(nv *NvidiaSmi) + check func(t *testing.T, nv *NvidiaSmi) } tests := map[string][]testCaseStep{ - "success A100-SXM4 MIG [XML]": { + "success A100-SXM4 MIG": { { - prepare: prepareCaseMIGA100formatXML, - check: func(t *testing.T, nv *NvidiaSMI) { + prepare: prepareCaseMIGA100, + check: func(t *testing.T, nv *NvidiaSmi) { mx := nv.Collect() expected := map[string]int64{ @@ -201,10 +184,10 @@ func TestNvidiaSMI_Collect(t *testing.T) { }, }, }, - "success RTX 4090 Driver 535 [XML]": { + "success RTX 4090 Driver 535": { { - prepare: prepareCaseRTX4090Driver535formatXML, - check: func(t *testing.T, nv *NvidiaSMI) { + prepare: prepareCaseRTX4090Driver535, + check: func(t *testing.T, nv *NvidiaSmi) { mx := nv.Collect() expected := map[string]int64{ @@ -251,10 +234,10 @@ func TestNvidiaSMI_Collect(t *testing.T) { }, }, }, - "success RTX 3060 [XML]": { + "success RTX 3060": { { - prepare: prepareCaseRTX3060formatXML, - check: func(t *testing.T, nv *NvidiaSMI) { + prepare: prepareCaseRTX3060, + check: func(t *testing.T, nv *NvidiaSmi) { mx := nv.Collect() expected := map[string]int64{ @@ -300,10 +283,10 @@ func TestNvidiaSMI_Collect(t *testing.T) { }, }, }, - "success Tesla P100 [XML]": { + "success Tesla P100": { { - prepare: prepareCaseTeslaP100formatXML, - check: func(t *testing.T, nv *NvidiaSMI) { + prepare: prepareCaseTeslaP100, + check: func(t *testing.T, nv *NvidiaSmi) { mx := nv.Collect() expected := map[string]int64{ @@ -348,50 +331,10 @@ func TestNvidiaSMI_Collect(t *testing.T) { }, }, }, - "success Tesla P100 [CSV]": { - { - prepare: prepareCaseTeslaP100formatCSV, - check: func(t *testing.T, nv *NvidiaSMI) { - mx := nv.Collect() - - expected := map[string]int64{ - "gpu_GPU-ef1b2c9b-38d8-2090-2bd1-f567a3eb42a6_frame_buffer_memory_usage_free": 17070817280, - "gpu_GPU-ef1b2c9b-38d8-2090-2bd1-f567a3eb42a6_frame_buffer_memory_usage_reserved": 108003328, - "gpu_GPU-ef1b2c9b-38d8-2090-2bd1-f567a3eb42a6_frame_buffer_memory_usage_used": 0, - "gpu_GPU-ef1b2c9b-38d8-2090-2bd1-f567a3eb42a6_gpu_utilization": 0, - "gpu_GPU-ef1b2c9b-38d8-2090-2bd1-f567a3eb42a6_graphics_clock": 405, - "gpu_GPU-ef1b2c9b-38d8-2090-2bd1-f567a3eb42a6_mem_clock": 715, - "gpu_GPU-ef1b2c9b-38d8-2090-2bd1-f567a3eb42a6_mem_utilization": 0, - "gpu_GPU-ef1b2c9b-38d8-2090-2bd1-f567a3eb42a6_performance_state_P0": 1, - "gpu_GPU-ef1b2c9b-38d8-2090-2bd1-f567a3eb42a6_performance_state_P1": 0, - "gpu_GPU-ef1b2c9b-38d8-2090-2bd1-f567a3eb42a6_performance_state_P10": 0, - "gpu_GPU-ef1b2c9b-38d8-2090-2bd1-f567a3eb42a6_performance_state_P11": 0, - "gpu_GPU-ef1b2c9b-38d8-2090-2bd1-f567a3eb42a6_performance_state_P12": 0, - "gpu_GPU-ef1b2c9b-38d8-2090-2bd1-f567a3eb42a6_performance_state_P13": 0, - "gpu_GPU-ef1b2c9b-38d8-2090-2bd1-f567a3eb42a6_performance_state_P14": 0, - "gpu_GPU-ef1b2c9b-38d8-2090-2bd1-f567a3eb42a6_performance_state_P15": 0, - "gpu_GPU-ef1b2c9b-38d8-2090-2bd1-f567a3eb42a6_performance_state_P2": 0, - "gpu_GPU-ef1b2c9b-38d8-2090-2bd1-f567a3eb42a6_performance_state_P3": 0, - "gpu_GPU-ef1b2c9b-38d8-2090-2bd1-f567a3eb42a6_performance_state_P4": 0, - "gpu_GPU-ef1b2c9b-38d8-2090-2bd1-f567a3eb42a6_performance_state_P5": 0, - "gpu_GPU-ef1b2c9b-38d8-2090-2bd1-f567a3eb42a6_performance_state_P6": 0, - "gpu_GPU-ef1b2c9b-38d8-2090-2bd1-f567a3eb42a6_performance_state_P7": 0, - "gpu_GPU-ef1b2c9b-38d8-2090-2bd1-f567a3eb42a6_performance_state_P8": 0, - "gpu_GPU-ef1b2c9b-38d8-2090-2bd1-f567a3eb42a6_performance_state_P9": 0, - "gpu_GPU-ef1b2c9b-38d8-2090-2bd1-f567a3eb42a6_power_draw": 28, - "gpu_GPU-ef1b2c9b-38d8-2090-2bd1-f567a3eb42a6_sm_clock": 405, - "gpu_GPU-ef1b2c9b-38d8-2090-2bd1-f567a3eb42a6_temperature": 37, - "gpu_GPU-ef1b2c9b-38d8-2090-2bd1-f567a3eb42a6_video_clock": 835, - } - - assert.Equal(t, expected, mx) - }, - }, - }, - "success RTX 2080 Win [XML]": { + "success RTX 2080 Win": { { - prepare: prepareCaseRTX2080WinFormatXML, - check: func(t *testing.T, nv *NvidiaSMI) { + prepare: prepareCaseRTX2080Win, + check: func(t *testing.T, nv *NvidiaSmi) { mx := nv.Collect() expected := map[string]int64{ @@ -437,30 +380,10 @@ func TestNvidiaSMI_Collect(t *testing.T) { }, }, }, - "fail on queryGPUInfoXML error [XML]": { + "fails on queryGPUInfo error": { { - prepare: prepareCaseErrOnQueryGPUInfoXML, - check: func(t *testing.T, nv *NvidiaSMI) { - mx := nv.Collect() - - assert.Equal(t, map[string]int64(nil), mx) - }, - }, - }, - "fail on queryGPUInfoCSV error [CSV]": { - { - prepare: prepareCaseErrOnQueryGPUInfoCSV, - check: func(t *testing.T, nv *NvidiaSMI) { - mx := nv.Collect() - - assert.Equal(t, map[string]int64(nil), mx) - }, - }, - }, - "fail on queryHelpQueryGPU error": { - { - prepare: prepareCaseErrOnQueryHelpQueryGPU, - check: func(t *testing.T, nv *NvidiaSMI) { + prepare: prepareCaseErrOnQueryGPUInfo, + check: func(t *testing.T, nv *NvidiaSmi) { mx := nv.Collect() assert.Equal(t, map[string]int64(nil), mx) @@ -483,79 +406,42 @@ func TestNvidiaSMI_Collect(t *testing.T) { } } -type mockNvidiaSMI struct { - gpuInfoXML []byte - errOnQueryGPUInfoXML bool - - gpuInfoCSV []byte - errOnQueryGPUInfoCSV bool - - helpQueryGPU []byte - errOnQueryHelpQueryGPU bool +type mockNvidiaSmi struct { + gpuInfo []byte + errOnQueryGPUInfo bool } -func (m *mockNvidiaSMI) queryGPUInfoXML() ([]byte, error) { - if m.errOnQueryGPUInfoXML { - return nil, errors.New("error on mock.queryGPUInfoXML()") +func (m *mockNvidiaSmi) queryGPUInfo() ([]byte, error) { + if m.errOnQueryGPUInfo { + return nil, errors.New("error on mock.queryGPUInfo()") } - return m.gpuInfoXML, nil -} - -func (m *mockNvidiaSMI) queryGPUInfoCSV(_ []string) ([]byte, error) { - if m.errOnQueryGPUInfoCSV { - return nil, errors.New("error on mock.queryGPUInfoCSV()") - } - return m.gpuInfoCSV, nil -} - -func (m *mockNvidiaSMI) queryHelpQueryGPU() ([]byte, error) { - if m.errOnQueryHelpQueryGPU { - return nil, errors.New("error on mock.queryHelpQueryGPU()") - } - return m.helpQueryGPU, nil -} - -func prepareCaseMIGA100formatXML(nv *NvidiaSMI) { - nv.UseCSVFormat = false - nv.exec = &mockNvidiaSMI{gpuInfoXML: dataXMLA100SXM4MIG} -} - -func prepareCaseRTX3060formatXML(nv *NvidiaSMI) { - nv.UseCSVFormat = false - nv.exec = &mockNvidiaSMI{gpuInfoXML: dataXMLRTX3060} + return m.gpuInfo, nil } -func prepareCaseRTX4090Driver535formatXML(nv *NvidiaSMI) { - nv.UseCSVFormat = false - nv.exec = &mockNvidiaSMI{gpuInfoXML: dataXMLRTX4090Driver535} +func (m *mockNvidiaSmi) stop() error { + return nil } -func prepareCaseTeslaP100formatXML(nv *NvidiaSMI) { - nv.UseCSVFormat = false - nv.exec = &mockNvidiaSMI{gpuInfoXML: dataXMLTeslaP100} +func prepareCaseMIGA100(nv *NvidiaSmi) { + nv.exec = &mockNvidiaSmi{gpuInfo: dataXMLA100SXM4MIG} } -func prepareCaseRTX2080WinFormatXML(nv *NvidiaSMI) { - nv.UseCSVFormat = false - nv.exec = &mockNvidiaSMI{gpuInfoXML: dataXMLRTX2080Win} +func prepareCaseRTX3060(nv *NvidiaSmi) { + nv.exec = &mockNvidiaSmi{gpuInfo: dataXMLRTX3060} } -func prepareCaseErrOnQueryGPUInfoXML(nv *NvidiaSMI) { - nv.UseCSVFormat = false - nv.exec = &mockNvidiaSMI{errOnQueryGPUInfoXML: true} +func prepareCaseRTX4090Driver535(nv *NvidiaSmi) { + nv.exec = &mockNvidiaSmi{gpuInfo: dataXMLRTX4090Driver535} } -func prepareCaseTeslaP100formatCSV(nv *NvidiaSMI) { - nv.UseCSVFormat = true - nv.exec = &mockNvidiaSMI{helpQueryGPU: dataHelpQueryGPU, gpuInfoCSV: dataCSVTeslaP100} +func prepareCaseTeslaP100(nv *NvidiaSmi) { + nv.exec = &mockNvidiaSmi{gpuInfo: dataXMLTeslaP100} } -func prepareCaseErrOnQueryHelpQueryGPU(nv *NvidiaSMI) { - nv.UseCSVFormat = true - nv.exec = &mockNvidiaSMI{errOnQueryHelpQueryGPU: true} +func prepareCaseRTX2080Win(nv *NvidiaSmi) { + nv.exec = &mockNvidiaSmi{gpuInfo: dataXMLRTX2080Win} } -func prepareCaseErrOnQueryGPUInfoCSV(nv *NvidiaSMI) { - nv.UseCSVFormat = true - nv.exec = &mockNvidiaSMI{helpQueryGPU: dataHelpQueryGPU, errOnQueryGPUInfoCSV: true} +func prepareCaseErrOnQueryGPUInfo(nv *NvidiaSmi) { + nv.exec = &mockNvidiaSmi{errOnQueryGPUInfo: true} } diff --git a/src/go/collectors/go.d.plugin/modules/nvidia_smi/testdata/a100-sxm4-mig.xml b/src/go/plugin/go.d/modules/nvidia_smi/testdata/a100-sxm4-mig.xml index 74146ac78..74146ac78 100644 --- a/src/go/collectors/go.d.plugin/modules/nvidia_smi/testdata/a100-sxm4-mig.xml +++ b/src/go/plugin/go.d/modules/nvidia_smi/testdata/a100-sxm4-mig.xml diff --git a/src/go/collectors/go.d.plugin/modules/nvidia_smi/testdata/config.json b/src/go/plugin/go.d/modules/nvidia_smi/testdata/config.json index a251e326a..6ff795390 100644 --- a/src/go/collectors/go.d.plugin/modules/nvidia_smi/testdata/config.json +++ b/src/go/plugin/go.d/modules/nvidia_smi/testdata/config.json @@ -2,5 +2,5 @@ "update_every": 123, "timeout": 123.123, "binary_path": "ok", - "use_csv_format": true + "loop_mode": true } diff --git a/src/go/collectors/go.d.plugin/modules/nvidia_smi/testdata/config.yaml b/src/go/plugin/go.d/modules/nvidia_smi/testdata/config.yaml index 0b580dbcb..1f2fedef5 100644 --- a/src/go/collectors/go.d.plugin/modules/nvidia_smi/testdata/config.yaml +++ b/src/go/plugin/go.d/modules/nvidia_smi/testdata/config.yaml @@ -1,4 +1,4 @@ update_every: 123 timeout: 123.123 binary_path: "ok" -use_csv_format: yes +loop_mode: true diff --git a/src/go/collectors/go.d.plugin/modules/nvidia_smi/testdata/rtx-2080-win.xml b/src/go/plugin/go.d/modules/nvidia_smi/testdata/rtx-2080-win.xml index 9bc0d2220..9bc0d2220 100644 --- a/src/go/collectors/go.d.plugin/modules/nvidia_smi/testdata/rtx-2080-win.xml +++ b/src/go/plugin/go.d/modules/nvidia_smi/testdata/rtx-2080-win.xml diff --git a/src/go/collectors/go.d.plugin/modules/nvidia_smi/testdata/rtx-3060.xml b/src/go/plugin/go.d/modules/nvidia_smi/testdata/rtx-3060.xml index ad63fd51b..ad63fd51b 100644 --- a/src/go/collectors/go.d.plugin/modules/nvidia_smi/testdata/rtx-3060.xml +++ b/src/go/plugin/go.d/modules/nvidia_smi/testdata/rtx-3060.xml diff --git a/src/go/collectors/go.d.plugin/modules/nvidia_smi/testdata/rtx-4090-driver-535.xml b/src/go/plugin/go.d/modules/nvidia_smi/testdata/rtx-4090-driver-535.xml index c3c253ffa..c3c253ffa 100644 --- a/src/go/collectors/go.d.plugin/modules/nvidia_smi/testdata/rtx-4090-driver-535.xml +++ b/src/go/plugin/go.d/modules/nvidia_smi/testdata/rtx-4090-driver-535.xml diff --git a/src/go/collectors/go.d.plugin/modules/nvidia_smi/testdata/tesla-p100.xml b/src/go/plugin/go.d/modules/nvidia_smi/testdata/tesla-p100.xml index 4c43125f9..4c43125f9 100644 --- a/src/go/collectors/go.d.plugin/modules/nvidia_smi/testdata/tesla-p100.xml +++ b/src/go/plugin/go.d/modules/nvidia_smi/testdata/tesla-p100.xml diff --git a/src/go/collectors/go.d.plugin/modules/nvme/README.md b/src/go/plugin/go.d/modules/nvme/README.md index ca657b905..ca657b905 120000 --- a/src/go/collectors/go.d.plugin/modules/nvme/README.md +++ b/src/go/plugin/go.d/modules/nvme/README.md diff --git a/src/go/collectors/go.d.plugin/modules/nvme/charts.go b/src/go/plugin/go.d/modules/nvme/charts.go index 8404d2dcc..08e215ec8 100644 --- a/src/go/collectors/go.d.plugin/modules/nvme/charts.go +++ b/src/go/plugin/go.d/modules/nvme/charts.go @@ -6,7 +6,7 @@ import ( "fmt" "strings" - "github.com/netdata/netdata/go/go.d.plugin/agent/module" + "github.com/netdata/netdata/go/plugins/plugin/go.d/agent/module" ) const ( diff --git a/src/go/collectors/go.d.plugin/modules/nvme/collect.go b/src/go/plugin/go.d/modules/nvme/collect.go index 1cc942395..1cc942395 100644 --- a/src/go/collectors/go.d.plugin/modules/nvme/collect.go +++ b/src/go/plugin/go.d/modules/nvme/collect.go diff --git a/src/go/collectors/go.d.plugin/modules/nvme/config_schema.json b/src/go/plugin/go.d/modules/nvme/config_schema.json index 179a24ab1..179a24ab1 100644 --- a/src/go/collectors/go.d.plugin/modules/nvme/config_schema.json +++ b/src/go/plugin/go.d/modules/nvme/config_schema.json diff --git a/src/go/collectors/go.d.plugin/modules/nvme/exec.go b/src/go/plugin/go.d/modules/nvme/exec.go index 8c1281a2f..8c1281a2f 100644 --- a/src/go/collectors/go.d.plugin/modules/nvme/exec.go +++ b/src/go/plugin/go.d/modules/nvme/exec.go diff --git a/src/go/collectors/go.d.plugin/modules/nvme/init.go b/src/go/plugin/go.d/modules/nvme/init.go index 51f1400a0..7196208e8 100644 --- a/src/go/collectors/go.d.plugin/modules/nvme/init.go +++ b/src/go/plugin/go.d/modules/nvme/init.go @@ -7,7 +7,7 @@ import ( "os" "path/filepath" - "github.com/netdata/netdata/go/go.d.plugin/agent/executable" + "github.com/netdata/netdata/go/plugins/pkg/executable" ) func (n *NVMe) initNVMeCLIExec() (nvmeCLI, error) { diff --git a/src/go/collectors/go.d.plugin/modules/nvme/integrations/nvme_devices.md b/src/go/plugin/go.d/modules/nvme/integrations/nvme_devices.md index fd18c1fd2..9a93c11d0 100644 --- a/src/go/collectors/go.d.plugin/modules/nvme/integrations/nvme_devices.md +++ b/src/go/plugin/go.d/modules/nvme/integrations/nvme_devices.md @@ -1,6 +1,6 @@ <!--startmeta -custom_edit_url: "https://github.com/netdata/netdata/edit/master/src/go/collectors/go.d.plugin/modules/nvme/README.md" -meta_yaml: "https://github.com/netdata/netdata/edit/master/src/go/collectors/go.d.plugin/modules/nvme/metadata.yaml" +custom_edit_url: "https://github.com/netdata/netdata/edit/master/src/go/plugin/go.d/modules/nvme/README.md" +meta_yaml: "https://github.com/netdata/netdata/edit/master/src/go/plugin/go.d/modules/nvme/metadata.yaml" sidebar_label: "NVMe devices" learn_status: "Published" learn_rel_path: "Collecting Metrics/Storage, Mount Points and Filesystems" @@ -182,6 +182,8 @@ jobs: ### Debug Mode +**Important**: Debug mode is not supported for data collection jobs created via the UI using the Dyncfg feature. + To troubleshoot issues with the `nvme` collector, run the `go.d.plugin` with the debug option enabled. The output should give you clues as to why the collector isn't working. @@ -204,4 +206,37 @@ should give you clues as to why the collector isn't working. ./go.d.plugin -d -m nvme ``` +### Getting Logs + +If you're encountering problems with the `nvme` collector, follow these steps to retrieve logs and identify potential issues: + +- **Run the command** specific to your system (systemd, non-systemd, or Docker container). +- **Examine the output** for any warnings or error messages that might indicate issues. These messages should provide clues about the root cause of the problem. + +#### System with systemd + +Use the following command to view logs generated since the last Netdata service restart: + +```bash +journalctl _SYSTEMD_INVOCATION_ID="$(systemctl show --value --property=InvocationID netdata)" --namespace=netdata --grep nvme +``` + +#### System without systemd + +Locate the collector log file, typically at `/var/log/netdata/collector.log`, and use `grep` to filter for collector's name: + +```bash +grep nvme /var/log/netdata/collector.log +``` + +**Note**: This method shows logs from all restarts. Focus on the **latest entries** for troubleshooting current issues. + +#### Docker Container + +If your Netdata runs in a Docker container named "netdata" (replace if different), use this command: + +```bash +docker logs netdata 2>&1 | grep nvme +``` + diff --git a/src/go/collectors/go.d.plugin/modules/nvme/metadata.yaml b/src/go/plugin/go.d/modules/nvme/metadata.yaml index 98f35af65..98f35af65 100644 --- a/src/go/collectors/go.d.plugin/modules/nvme/metadata.yaml +++ b/src/go/plugin/go.d/modules/nvme/metadata.yaml diff --git a/src/go/collectors/go.d.plugin/modules/nvme/nvme.go b/src/go/plugin/go.d/modules/nvme/nvme.go index 76b6445b3..b1b22f594 100644 --- a/src/go/collectors/go.d.plugin/modules/nvme/nvme.go +++ b/src/go/plugin/go.d/modules/nvme/nvme.go @@ -7,8 +7,8 @@ import ( "errors" "time" - "github.com/netdata/netdata/go/go.d.plugin/agent/module" - "github.com/netdata/netdata/go/go.d.plugin/pkg/web" + "github.com/netdata/netdata/go/plugins/plugin/go.d/agent/module" + "github.com/netdata/netdata/go/plugins/plugin/go.d/pkg/web" ) //go:embed "config_schema.json" diff --git a/src/go/collectors/go.d.plugin/modules/nvme/nvme_test.go b/src/go/plugin/go.d/modules/nvme/nvme_test.go index ab814442d..2009f789c 100644 --- a/src/go/collectors/go.d.plugin/modules/nvme/nvme_test.go +++ b/src/go/plugin/go.d/modules/nvme/nvme_test.go @@ -9,7 +9,7 @@ import ( "os" "testing" - "github.com/netdata/netdata/go/go.d.plugin/agent/module" + "github.com/netdata/netdata/go/plugins/plugin/go.d/agent/module" "github.com/stretchr/testify/assert" "github.com/stretchr/testify/require" diff --git a/src/go/plugin/go.d/modules/nvme/testdata/config.json b/src/go/plugin/go.d/modules/nvme/testdata/config.json new file mode 100644 index 000000000..291ecee3d --- /dev/null +++ b/src/go/plugin/go.d/modules/nvme/testdata/config.json @@ -0,0 +1,4 @@ +{ + "update_every": 123, + "timeout": 123.123 +} diff --git a/src/go/plugin/go.d/modules/nvme/testdata/config.yaml b/src/go/plugin/go.d/modules/nvme/testdata/config.yaml new file mode 100644 index 000000000..25b0b4c78 --- /dev/null +++ b/src/go/plugin/go.d/modules/nvme/testdata/config.yaml @@ -0,0 +1,2 @@ +update_every: 123 +timeout: 123.123 diff --git a/src/go/collectors/go.d.plugin/modules/nvme/testdata/nvme-list-empty.json b/src/go/plugin/go.d/modules/nvme/testdata/nvme-list-empty.json index e8da2407f..e8da2407f 100644 --- a/src/go/collectors/go.d.plugin/modules/nvme/testdata/nvme-list-empty.json +++ b/src/go/plugin/go.d/modules/nvme/testdata/nvme-list-empty.json diff --git a/src/go/collectors/go.d.plugin/modules/nvme/testdata/nvme-list.json b/src/go/plugin/go.d/modules/nvme/testdata/nvme-list.json index 6bf159c4f..6bf159c4f 100644 --- a/src/go/collectors/go.d.plugin/modules/nvme/testdata/nvme-list.json +++ b/src/go/plugin/go.d/modules/nvme/testdata/nvme-list.json diff --git a/src/go/collectors/go.d.plugin/modules/nvme/testdata/nvme-smart-log-float.json b/src/go/plugin/go.d/modules/nvme/testdata/nvme-smart-log-float.json index f63dd9772..f63dd9772 100644 --- a/src/go/collectors/go.d.plugin/modules/nvme/testdata/nvme-smart-log-float.json +++ b/src/go/plugin/go.d/modules/nvme/testdata/nvme-smart-log-float.json diff --git a/src/go/collectors/go.d.plugin/modules/nvme/testdata/nvme-smart-log-string.json b/src/go/plugin/go.d/modules/nvme/testdata/nvme-smart-log-string.json index f582e7485..f582e7485 100644 --- a/src/go/collectors/go.d.plugin/modules/nvme/testdata/nvme-smart-log-string.json +++ b/src/go/plugin/go.d/modules/nvme/testdata/nvme-smart-log-string.json diff --git a/src/go/collectors/go.d.plugin/modules/nvme/testdata/nvme-smart-log.json b/src/go/plugin/go.d/modules/nvme/testdata/nvme-smart-log.json index cbd0e4c7d..cbd0e4c7d 100644 --- a/src/go/collectors/go.d.plugin/modules/nvme/testdata/nvme-smart-log.json +++ b/src/go/plugin/go.d/modules/nvme/testdata/nvme-smart-log.json diff --git a/src/go/collectors/go.d.plugin/modules/openvpn/README.md b/src/go/plugin/go.d/modules/openvpn/README.md index 020da3ac6..020da3ac6 120000 --- a/src/go/collectors/go.d.plugin/modules/openvpn/README.md +++ b/src/go/plugin/go.d/modules/openvpn/README.md diff --git a/src/go/collectors/go.d.plugin/modules/openvpn/charts.go b/src/go/plugin/go.d/modules/openvpn/charts.go index 435c2151a..5874eced8 100644 --- a/src/go/collectors/go.d.plugin/modules/openvpn/charts.go +++ b/src/go/plugin/go.d/modules/openvpn/charts.go @@ -2,7 +2,7 @@ package openvpn -import "github.com/netdata/netdata/go/go.d.plugin/agent/module" +import "github.com/netdata/netdata/go/plugins/plugin/go.d/agent/module" type ( // Charts is an alias for module.Charts diff --git a/src/go/collectors/go.d.plugin/modules/openvpn/client/client.go b/src/go/plugin/go.d/modules/openvpn/client/client.go index ddbfdeafb..23ceb18d8 100644 --- a/src/go/collectors/go.d.plugin/modules/openvpn/client/client.go +++ b/src/go/plugin/go.d/modules/openvpn/client/client.go @@ -8,7 +8,7 @@ import ( "strconv" "strings" - "github.com/netdata/netdata/go/go.d.plugin/pkg/socket" + "github.com/netdata/netdata/go/plugins/plugin/go.d/pkg/socket" ) var ( diff --git a/src/go/collectors/go.d.plugin/modules/openvpn/client/client_test.go b/src/go/plugin/go.d/modules/openvpn/client/client_test.go index a21672e0b..d40f6ea1b 100644 --- a/src/go/collectors/go.d.plugin/modules/openvpn/client/client_test.go +++ b/src/go/plugin/go.d/modules/openvpn/client/client_test.go @@ -10,7 +10,7 @@ import ( "strings" "testing" - "github.com/netdata/netdata/go/go.d.plugin/pkg/socket" + "github.com/netdata/netdata/go/plugins/plugin/go.d/pkg/socket" "github.com/stretchr/testify/assert" ) diff --git a/src/go/collectors/go.d.plugin/modules/openvpn/client/commands.go b/src/go/plugin/go.d/modules/openvpn/client/commands.go index f06b05c90..f06b05c90 100644 --- a/src/go/collectors/go.d.plugin/modules/openvpn/client/commands.go +++ b/src/go/plugin/go.d/modules/openvpn/client/commands.go diff --git a/src/go/collectors/go.d.plugin/modules/openvpn/client/testdata/load-stats.txt b/src/go/plugin/go.d/modules/openvpn/client/testdata/load-stats.txt index 39c19ac5b..39c19ac5b 100644 --- a/src/go/collectors/go.d.plugin/modules/openvpn/client/testdata/load-stats.txt +++ b/src/go/plugin/go.d/modules/openvpn/client/testdata/load-stats.txt diff --git a/src/go/collectors/go.d.plugin/modules/openvpn/client/testdata/status3.txt b/src/go/plugin/go.d/modules/openvpn/client/testdata/status3.txt index 1986703d2..1986703d2 100644 --- a/src/go/collectors/go.d.plugin/modules/openvpn/client/testdata/status3.txt +++ b/src/go/plugin/go.d/modules/openvpn/client/testdata/status3.txt diff --git a/src/go/collectors/go.d.plugin/modules/openvpn/client/testdata/version.txt b/src/go/plugin/go.d/modules/openvpn/client/testdata/version.txt index e525876d8..e525876d8 100644 --- a/src/go/collectors/go.d.plugin/modules/openvpn/client/testdata/version.txt +++ b/src/go/plugin/go.d/modules/openvpn/client/testdata/version.txt diff --git a/src/go/collectors/go.d.plugin/modules/openvpn/client/types.go b/src/go/plugin/go.d/modules/openvpn/client/types.go index a0a283028..a0a283028 100644 --- a/src/go/collectors/go.d.plugin/modules/openvpn/client/types.go +++ b/src/go/plugin/go.d/modules/openvpn/client/types.go diff --git a/src/go/collectors/go.d.plugin/modules/openvpn/collect.go b/src/go/plugin/go.d/modules/openvpn/collect.go index 180fae3bd..180fae3bd 100644 --- a/src/go/collectors/go.d.plugin/modules/openvpn/collect.go +++ b/src/go/plugin/go.d/modules/openvpn/collect.go diff --git a/src/go/collectors/go.d.plugin/modules/openvpn/config_schema.json b/src/go/plugin/go.d/modules/openvpn/config_schema.json index 527a06abe..8bbda1fd4 100644 --- a/src/go/collectors/go.d.plugin/modules/openvpn/config_schema.json +++ b/src/go/plugin/go.d/modules/openvpn/config_schema.json @@ -15,7 +15,7 @@ "title": "Address", "description": "The IP address and port where the OpenVPN [Management Interface](https://openvpn.net/community-resources/management-interface/) listens for connections.", "type": "string", - "default": "127.0.0.1:123" + "default": "127.0.0.1:7505" }, "timeout": { "title": "Timeout", @@ -34,7 +34,7 @@ "properties": { "includes": { "title": "Include", - "description": "Include users whose usernames match any of the specified inclusion [patterns](https://github.com/netdata/netdata/tree/master/src/go/collectors/go.d.plugin/pkg/matcher#readme).", + "description": "Include users whose usernames match any of the specified inclusion [patterns](https://github.com/netdata/netdata/tree/master/src/go/plugin/go.d/pkg/matcher#readme).", "type": [ "array", "null" @@ -47,7 +47,7 @@ }, "excludes": { "title": "Exclude", - "description": "Exclude users whose usernames match any of the specified exclusion [patterns](https://github.com/netdata/netdata/tree/master/src/go/collectors/go.d.plugin/pkg/matcher#readme).", + "description": "Exclude users whose usernames match any of the specified exclusion [patterns](https://github.com/netdata/netdata/tree/master/src/go/plugin/go.d/pkg/matcher#readme).", "type": [ "array", "null" diff --git a/src/go/collectors/go.d.plugin/modules/openvpn/init.go b/src/go/plugin/go.d/modules/openvpn/init.go index cba0c86e2..563edbaa6 100644 --- a/src/go/collectors/go.d.plugin/modules/openvpn/init.go +++ b/src/go/plugin/go.d/modules/openvpn/init.go @@ -3,9 +3,9 @@ package openvpn import ( - "github.com/netdata/netdata/go/go.d.plugin/modules/openvpn/client" - "github.com/netdata/netdata/go/go.d.plugin/pkg/matcher" - "github.com/netdata/netdata/go/go.d.plugin/pkg/socket" + "github.com/netdata/netdata/go/plugins/plugin/go.d/modules/openvpn/client" + "github.com/netdata/netdata/go/plugins/plugin/go.d/pkg/matcher" + "github.com/netdata/netdata/go/plugins/plugin/go.d/pkg/socket" ) func (o *OpenVPN) validateConfig() error { diff --git a/src/go/collectors/go.d.plugin/modules/openvpn/integrations/openvpn.md b/src/go/plugin/go.d/modules/openvpn/integrations/openvpn.md index 04cd1f50a..612d5eaab 100644 --- a/src/go/collectors/go.d.plugin/modules/openvpn/integrations/openvpn.md +++ b/src/go/plugin/go.d/modules/openvpn/integrations/openvpn.md @@ -1,6 +1,6 @@ <!--startmeta -custom_edit_url: "https://github.com/netdata/netdata/edit/master/src/go/collectors/go.d.plugin/modules/openvpn/README.md" -meta_yaml: "https://github.com/netdata/netdata/edit/master/src/go/collectors/go.d.plugin/modules/openvpn/metadata.yaml" +custom_edit_url: "https://github.com/netdata/netdata/edit/master/src/go/plugin/go.d/modules/openvpn/README.md" +meta_yaml: "https://github.com/netdata/netdata/edit/master/src/go/plugin/go.d/modules/openvpn/metadata.yaml" sidebar_label: "OpenVPN" learn_status: "Published" learn_rel_path: "Collecting Metrics/VPNs" @@ -99,7 +99,7 @@ There are no alerts configured by default for this integration. #### Enable in go.d.conf. -This collector is disabled by default. You need to explicitly enable it in [go.d.conf](https://github.com/netdata/netdata/blob/master/src/go/collectors/go.d.plugin/config/go.d.conf). +This collector is disabled by default. You need to explicitly enable it in [go.d.conf](https://github.com/netdata/netdata/blob/master/src/go/plugin/go.d/config/go.d.conf). From the documentation for the OpenVPN Management Interface: > Currently, the OpenVPN daemon can at most support a single management client any one time. @@ -198,6 +198,8 @@ jobs: ### Debug Mode +**Important**: Debug mode is not supported for data collection jobs created via the UI using the Dyncfg feature. + To troubleshoot issues with the `openvpn` collector, run the `go.d.plugin` with the debug option enabled. The output should give you clues as to why the collector isn't working. @@ -220,4 +222,37 @@ should give you clues as to why the collector isn't working. ./go.d.plugin -d -m openvpn ``` +### Getting Logs + +If you're encountering problems with the `openvpn` collector, follow these steps to retrieve logs and identify potential issues: + +- **Run the command** specific to your system (systemd, non-systemd, or Docker container). +- **Examine the output** for any warnings or error messages that might indicate issues. These messages should provide clues about the root cause of the problem. + +#### System with systemd + +Use the following command to view logs generated since the last Netdata service restart: + +```bash +journalctl _SYSTEMD_INVOCATION_ID="$(systemctl show --value --property=InvocationID netdata)" --namespace=netdata --grep openvpn +``` + +#### System without systemd + +Locate the collector log file, typically at `/var/log/netdata/collector.log`, and use `grep` to filter for collector's name: + +```bash +grep openvpn /var/log/netdata/collector.log +``` + +**Note**: This method shows logs from all restarts. Focus on the **latest entries** for troubleshooting current issues. + +#### Docker Container + +If your Netdata runs in a Docker container named "netdata" (replace if different), use this command: + +```bash +docker logs netdata 2>&1 | grep openvpn +``` + diff --git a/src/go/collectors/go.d.plugin/modules/openvpn/metadata.yaml b/src/go/plugin/go.d/modules/openvpn/metadata.yaml index b1f583c9b..49360b2fd 100644 --- a/src/go/collectors/go.d.plugin/modules/openvpn/metadata.yaml +++ b/src/go/plugin/go.d/modules/openvpn/metadata.yaml @@ -44,7 +44,7 @@ modules: list: - title: Enable in go.d.conf. description: | - This collector is disabled by default. You need to explicitly enable it in [go.d.conf](https://github.com/netdata/netdata/blob/master/src/go/collectors/go.d.plugin/config/go.d.conf). + This collector is disabled by default. You need to explicitly enable it in [go.d.conf](https://github.com/netdata/netdata/blob/master/src/go/plugin/go.d/config/go.d.conf). From the documentation for the OpenVPN Management Interface: > Currently, the OpenVPN daemon can at most support a single management client any one time. @@ -84,7 +84,7 @@ modules: Metrics of users matching the selector will be collected. - Logic: (pattern1 OR pattern2) AND !(pattern3 or pattern4) - - Pattern syntax: [matcher](https://github.com/netdata/netdata/tree/master/src/go/collectors/go.d.plugin/pkg/matcher#supported-format). + - Pattern syntax: [matcher](https://github.com/netdata/netdata/tree/master/src/go/plugin/go.d/pkg/matcher#supported-format). - Syntax: ```yaml diff --git a/src/go/collectors/go.d.plugin/modules/openvpn/openvpn.go b/src/go/plugin/go.d/modules/openvpn/openvpn.go index 0a5edef06..52bada3ee 100644 --- a/src/go/collectors/go.d.plugin/modules/openvpn/openvpn.go +++ b/src/go/plugin/go.d/modules/openvpn/openvpn.go @@ -6,11 +6,11 @@ import ( _ "embed" "time" - "github.com/netdata/netdata/go/go.d.plugin/agent/module" - "github.com/netdata/netdata/go/go.d.plugin/modules/openvpn/client" - "github.com/netdata/netdata/go/go.d.plugin/pkg/matcher" - "github.com/netdata/netdata/go/go.d.plugin/pkg/socket" - "github.com/netdata/netdata/go/go.d.plugin/pkg/web" + "github.com/netdata/netdata/go/plugins/plugin/go.d/agent/module" + "github.com/netdata/netdata/go/plugins/plugin/go.d/modules/openvpn/client" + "github.com/netdata/netdata/go/plugins/plugin/go.d/pkg/matcher" + "github.com/netdata/netdata/go/plugins/plugin/go.d/pkg/socket" + "github.com/netdata/netdata/go/plugins/plugin/go.d/pkg/web" ) //go:embed "config_schema.json" diff --git a/src/go/collectors/go.d.plugin/modules/openvpn/openvpn_test.go b/src/go/plugin/go.d/modules/openvpn/openvpn_test.go index 267713b68..d81747ceb 100644 --- a/src/go/collectors/go.d.plugin/modules/openvpn/openvpn_test.go +++ b/src/go/plugin/go.d/modules/openvpn/openvpn_test.go @@ -6,10 +6,10 @@ import ( "os" "testing" - "github.com/netdata/netdata/go/go.d.plugin/agent/module" - "github.com/netdata/netdata/go/go.d.plugin/modules/openvpn/client" - "github.com/netdata/netdata/go/go.d.plugin/pkg/matcher" - "github.com/netdata/netdata/go/go.d.plugin/pkg/socket" + "github.com/netdata/netdata/go/plugins/plugin/go.d/agent/module" + "github.com/netdata/netdata/go/plugins/plugin/go.d/modules/openvpn/client" + "github.com/netdata/netdata/go/plugins/plugin/go.d/pkg/matcher" + "github.com/netdata/netdata/go/plugins/plugin/go.d/pkg/socket" "github.com/stretchr/testify/assert" "github.com/stretchr/testify/require" diff --git a/src/go/collectors/go.d.plugin/modules/openvpn/testdata/config.json b/src/go/plugin/go.d/modules/openvpn/testdata/config.json index 30411ebf3..30411ebf3 100644 --- a/src/go/collectors/go.d.plugin/modules/openvpn/testdata/config.json +++ b/src/go/plugin/go.d/modules/openvpn/testdata/config.json diff --git a/src/go/collectors/go.d.plugin/modules/openvpn/testdata/config.yaml b/src/go/plugin/go.d/modules/openvpn/testdata/config.yaml index 22296ce56..22296ce56 100644 --- a/src/go/collectors/go.d.plugin/modules/openvpn/testdata/config.yaml +++ b/src/go/plugin/go.d/modules/openvpn/testdata/config.yaml diff --git a/src/go/collectors/go.d.plugin/modules/openvpn_status_log/README.md b/src/go/plugin/go.d/modules/openvpn_status_log/README.md index 603c8249b..603c8249b 120000 --- a/src/go/collectors/go.d.plugin/modules/openvpn_status_log/README.md +++ b/src/go/plugin/go.d/modules/openvpn_status_log/README.md diff --git a/src/go/collectors/go.d.plugin/modules/openvpn_status_log/charts.go b/src/go/plugin/go.d/modules/openvpn_status_log/charts.go index cb8d7c89b..56716d294 100644 --- a/src/go/collectors/go.d.plugin/modules/openvpn_status_log/charts.go +++ b/src/go/plugin/go.d/modules/openvpn_status_log/charts.go @@ -5,7 +5,7 @@ package openvpn_status_log import ( "fmt" - "github.com/netdata/netdata/go/go.d.plugin/agent/module" + "github.com/netdata/netdata/go/plugins/plugin/go.d/agent/module" ) var charts = module.Charts{ diff --git a/src/go/collectors/go.d.plugin/modules/openvpn_status_log/collect.go b/src/go/plugin/go.d/modules/openvpn_status_log/collect.go index f6a442fd5..f6a442fd5 100644 --- a/src/go/collectors/go.d.plugin/modules/openvpn_status_log/collect.go +++ b/src/go/plugin/go.d/modules/openvpn_status_log/collect.go diff --git a/src/go/collectors/go.d.plugin/modules/openvpn_status_log/config_schema.json b/src/go/plugin/go.d/modules/openvpn_status_log/config_schema.json index 5a31078d0..db3af2cc8 100644 --- a/src/go/collectors/go.d.plugin/modules/openvpn_status_log/config_schema.json +++ b/src/go/plugin/go.d/modules/openvpn_status_log/config_schema.json @@ -28,7 +28,7 @@ "properties": { "includes": { "title": "Include", - "description": "Include users whose usernames match any of the specified inclusion [patterns](https://github.com/netdata/netdata/tree/master/src/go/collectors/go.d.plugin/pkg/matcher#readme).", + "description": "Include users whose usernames match any of the specified inclusion [patterns](https://github.com/netdata/netdata/tree/master/src/go/plugin/go.d/pkg/matcher#readme).", "type": [ "array", "null" @@ -41,7 +41,7 @@ }, "excludes": { "title": "Exclude", - "description": "Exclude users whose usernames match any of the specified exclusion [patterns](https://github.com/netdata/netdata/tree/master/src/go/collectors/go.d.plugin/pkg/matcher#readme).", + "description": "Exclude users whose usernames match any of the specified exclusion [patterns](https://github.com/netdata/netdata/tree/master/src/go/plugin/go.d/pkg/matcher#readme).", "type": [ "array", "null" diff --git a/src/go/collectors/go.d.plugin/modules/openvpn_status_log/init.go b/src/go/plugin/go.d/modules/openvpn_status_log/init.go index de75d096a..f2e6bee37 100644 --- a/src/go/collectors/go.d.plugin/modules/openvpn_status_log/init.go +++ b/src/go/plugin/go.d/modules/openvpn_status_log/init.go @@ -4,7 +4,7 @@ package openvpn_status_log import ( "errors" - "github.com/netdata/netdata/go/go.d.plugin/pkg/matcher" + "github.com/netdata/netdata/go/plugins/plugin/go.d/pkg/matcher" ) func (o *OpenVPNStatusLog) validateConfig() error { diff --git a/src/go/collectors/go.d.plugin/modules/openvpn_status_log/integrations/openvpn_status_log.md b/src/go/plugin/go.d/modules/openvpn_status_log/integrations/openvpn_status_log.md index fdbf54e87..9a5b56663 100644 --- a/src/go/collectors/go.d.plugin/modules/openvpn_status_log/integrations/openvpn_status_log.md +++ b/src/go/plugin/go.d/modules/openvpn_status_log/integrations/openvpn_status_log.md @@ -1,6 +1,6 @@ <!--startmeta -custom_edit_url: "https://github.com/netdata/netdata/edit/master/src/go/collectors/go.d.plugin/modules/openvpn_status_log/README.md" -meta_yaml: "https://github.com/netdata/netdata/edit/master/src/go/collectors/go.d.plugin/modules/openvpn_status_log/metadata.yaml" +custom_edit_url: "https://github.com/netdata/netdata/edit/master/src/go/plugin/go.d/modules/openvpn_status_log/README.md" +meta_yaml: "https://github.com/netdata/netdata/edit/master/src/go/plugin/go.d/modules/openvpn_status_log/metadata.yaml" sidebar_label: "OpenVPN status log" learn_status: "Published" learn_rel_path: "Collecting Metrics/VPNs" @@ -153,6 +153,8 @@ jobs: ### Debug Mode +**Important**: Debug mode is not supported for data collection jobs created via the UI using the Dyncfg feature. + To troubleshoot issues with the `openvpn_status_log` collector, run the `go.d.plugin` with the debug option enabled. The output should give you clues as to why the collector isn't working. @@ -175,4 +177,37 @@ should give you clues as to why the collector isn't working. ./go.d.plugin -d -m openvpn_status_log ``` +### Getting Logs + +If you're encountering problems with the `openvpn_status_log` collector, follow these steps to retrieve logs and identify potential issues: + +- **Run the command** specific to your system (systemd, non-systemd, or Docker container). +- **Examine the output** for any warnings or error messages that might indicate issues. These messages should provide clues about the root cause of the problem. + +#### System with systemd + +Use the following command to view logs generated since the last Netdata service restart: + +```bash +journalctl _SYSTEMD_INVOCATION_ID="$(systemctl show --value --property=InvocationID netdata)" --namespace=netdata --grep openvpn_status_log +``` + +#### System without systemd + +Locate the collector log file, typically at `/var/log/netdata/collector.log`, and use `grep` to filter for collector's name: + +```bash +grep openvpn_status_log /var/log/netdata/collector.log +``` + +**Note**: This method shows logs from all restarts. Focus on the **latest entries** for troubleshooting current issues. + +#### Docker Container + +If your Netdata runs in a Docker container named "netdata" (replace if different), use this command: + +```bash +docker logs netdata 2>&1 | grep openvpn_status_log +``` + diff --git a/src/go/collectors/go.d.plugin/modules/openvpn_status_log/metadata.yaml b/src/go/plugin/go.d/modules/openvpn_status_log/metadata.yaml index fbe3ff610..8636de63b 100644 --- a/src/go/collectors/go.d.plugin/modules/openvpn_status_log/metadata.yaml +++ b/src/go/plugin/go.d/modules/openvpn_status_log/metadata.yaml @@ -71,7 +71,7 @@ modules: details: | Metrics of users matching the selector will be collected. - Logic: (pattern1 OR pattern2) AND !(pattern3 or pattern4) - - Pattern syntax: [matcher](https://github.com/netdata/netdata/tree/master/src/go/collectors/go.d.plugin/pkg/matcher#supported-format). + - Pattern syntax: [matcher](https://github.com/netdata/netdata/tree/master/src/go/plugin/go.d/pkg/matcher#supported-format). - Syntax: ```yaml per_user_stats: diff --git a/src/go/collectors/go.d.plugin/modules/openvpn_status_log/openvpn.go b/src/go/plugin/go.d/modules/openvpn_status_log/openvpn.go index 975da02f3..7b2914df9 100644 --- a/src/go/collectors/go.d.plugin/modules/openvpn_status_log/openvpn.go +++ b/src/go/plugin/go.d/modules/openvpn_status_log/openvpn.go @@ -6,8 +6,8 @@ import ( _ "embed" "errors" - "github.com/netdata/netdata/go/go.d.plugin/agent/module" - "github.com/netdata/netdata/go/go.d.plugin/pkg/matcher" + "github.com/netdata/netdata/go/plugins/plugin/go.d/agent/module" + "github.com/netdata/netdata/go/plugins/plugin/go.d/pkg/matcher" ) //go:embed "config_schema.json" diff --git a/src/go/collectors/go.d.plugin/modules/openvpn_status_log/openvpn_test.go b/src/go/plugin/go.d/modules/openvpn_status_log/openvpn_test.go index 1e6071e01..f3d852d5a 100644 --- a/src/go/collectors/go.d.plugin/modules/openvpn_status_log/openvpn_test.go +++ b/src/go/plugin/go.d/modules/openvpn_status_log/openvpn_test.go @@ -7,8 +7,8 @@ import ( "strings" "testing" - "github.com/netdata/netdata/go/go.d.plugin/agent/module" - "github.com/netdata/netdata/go/go.d.plugin/pkg/matcher" + "github.com/netdata/netdata/go/plugins/plugin/go.d/agent/module" + "github.com/netdata/netdata/go/plugins/plugin/go.d/pkg/matcher" "github.com/stretchr/testify/assert" "github.com/stretchr/testify/require" diff --git a/src/go/collectors/go.d.plugin/modules/openvpn_status_log/parser.go b/src/go/plugin/go.d/modules/openvpn_status_log/parser.go index c734fd5fb..c734fd5fb 100644 --- a/src/go/collectors/go.d.plugin/modules/openvpn_status_log/parser.go +++ b/src/go/plugin/go.d/modules/openvpn_status_log/parser.go diff --git a/src/go/collectors/go.d.plugin/modules/openvpn_status_log/testdata/config.json b/src/go/plugin/go.d/modules/openvpn_status_log/testdata/config.json index 078a1ae56..078a1ae56 100644 --- a/src/go/collectors/go.d.plugin/modules/openvpn_status_log/testdata/config.json +++ b/src/go/plugin/go.d/modules/openvpn_status_log/testdata/config.json diff --git a/src/go/collectors/go.d.plugin/modules/openvpn_status_log/testdata/config.yaml b/src/go/plugin/go.d/modules/openvpn_status_log/testdata/config.yaml index 1a27ab974..1a27ab974 100644 --- a/src/go/collectors/go.d.plugin/modules/openvpn_status_log/testdata/config.yaml +++ b/src/go/plugin/go.d/modules/openvpn_status_log/testdata/config.yaml diff --git a/src/go/collectors/go.d.plugin/modules/openvpn_status_log/testdata/empty.txt b/src/go/plugin/go.d/modules/openvpn_status_log/testdata/empty.txt index e69de29bb..e69de29bb 100644 --- a/src/go/collectors/go.d.plugin/modules/openvpn_status_log/testdata/empty.txt +++ b/src/go/plugin/go.d/modules/openvpn_status_log/testdata/empty.txt diff --git a/src/go/collectors/go.d.plugin/modules/openvpn_status_log/testdata/v2.5.1/static-key.txt b/src/go/plugin/go.d/modules/openvpn_status_log/testdata/v2.5.1/static-key.txt index 64b691fcd..64b691fcd 100644 --- a/src/go/collectors/go.d.plugin/modules/openvpn_status_log/testdata/v2.5.1/static-key.txt +++ b/src/go/plugin/go.d/modules/openvpn_status_log/testdata/v2.5.1/static-key.txt diff --git a/src/go/collectors/go.d.plugin/modules/openvpn_status_log/testdata/v2.5.1/version1-no-clients.txt b/src/go/plugin/go.d/modules/openvpn_status_log/testdata/v2.5.1/version1-no-clients.txt index 34d7a748f..34d7a748f 100644 --- a/src/go/collectors/go.d.plugin/modules/openvpn_status_log/testdata/v2.5.1/version1-no-clients.txt +++ b/src/go/plugin/go.d/modules/openvpn_status_log/testdata/v2.5.1/version1-no-clients.txt diff --git a/src/go/collectors/go.d.plugin/modules/openvpn_status_log/testdata/v2.5.1/version1.txt b/src/go/plugin/go.d/modules/openvpn_status_log/testdata/v2.5.1/version1.txt index 0d2f33ba5..0d2f33ba5 100644 --- a/src/go/collectors/go.d.plugin/modules/openvpn_status_log/testdata/v2.5.1/version1.txt +++ b/src/go/plugin/go.d/modules/openvpn_status_log/testdata/v2.5.1/version1.txt diff --git a/src/go/collectors/go.d.plugin/modules/openvpn_status_log/testdata/v2.5.1/version2-no-clients.txt b/src/go/plugin/go.d/modules/openvpn_status_log/testdata/v2.5.1/version2-no-clients.txt index 6d1ea1e32..6d1ea1e32 100644 --- a/src/go/collectors/go.d.plugin/modules/openvpn_status_log/testdata/v2.5.1/version2-no-clients.txt +++ b/src/go/plugin/go.d/modules/openvpn_status_log/testdata/v2.5.1/version2-no-clients.txt diff --git a/src/go/collectors/go.d.plugin/modules/openvpn_status_log/testdata/v2.5.1/version2.txt b/src/go/plugin/go.d/modules/openvpn_status_log/testdata/v2.5.1/version2.txt index d0f4ac8e3..d0f4ac8e3 100644 --- a/src/go/collectors/go.d.plugin/modules/openvpn_status_log/testdata/v2.5.1/version2.txt +++ b/src/go/plugin/go.d/modules/openvpn_status_log/testdata/v2.5.1/version2.txt diff --git a/src/go/collectors/go.d.plugin/modules/openvpn_status_log/testdata/v2.5.1/version3-no-clients.txt b/src/go/plugin/go.d/modules/openvpn_status_log/testdata/v2.5.1/version3-no-clients.txt index 6ab671f20..6ab671f20 100644 --- a/src/go/collectors/go.d.plugin/modules/openvpn_status_log/testdata/v2.5.1/version3-no-clients.txt +++ b/src/go/plugin/go.d/modules/openvpn_status_log/testdata/v2.5.1/version3-no-clients.txt diff --git a/src/go/collectors/go.d.plugin/modules/openvpn_status_log/testdata/v2.5.1/version3.txt b/src/go/plugin/go.d/modules/openvpn_status_log/testdata/v2.5.1/version3.txt index 7d732042e..7d732042e 100644 --- a/src/go/collectors/go.d.plugin/modules/openvpn_status_log/testdata/v2.5.1/version3.txt +++ b/src/go/plugin/go.d/modules/openvpn_status_log/testdata/v2.5.1/version3.txt diff --git a/src/go/collectors/go.d.plugin/modules/pgbouncer/README.md b/src/go/plugin/go.d/modules/pgbouncer/README.md index 3bfcaba0b..3bfcaba0b 120000 --- a/src/go/collectors/go.d.plugin/modules/pgbouncer/README.md +++ b/src/go/plugin/go.d/modules/pgbouncer/README.md diff --git a/src/go/collectors/go.d.plugin/modules/pgbouncer/charts.go b/src/go/plugin/go.d/modules/pgbouncer/charts.go index bd94f0fd5..4ee7b2bc5 100644 --- a/src/go/collectors/go.d.plugin/modules/pgbouncer/charts.go +++ b/src/go/plugin/go.d/modules/pgbouncer/charts.go @@ -6,7 +6,7 @@ import ( "fmt" "strings" - "github.com/netdata/netdata/go/go.d.plugin/agent/module" + "github.com/netdata/netdata/go/plugins/plugin/go.d/agent/module" ) const ( diff --git a/src/go/collectors/go.d.plugin/modules/pgbouncer/collect.go b/src/go/plugin/go.d/modules/pgbouncer/collect.go index c0e4bf2da..c0e4bf2da 100644 --- a/src/go/collectors/go.d.plugin/modules/pgbouncer/collect.go +++ b/src/go/plugin/go.d/modules/pgbouncer/collect.go diff --git a/src/go/collectors/go.d.plugin/modules/pgbouncer/config_schema.json b/src/go/plugin/go.d/modules/pgbouncer/config_schema.json index d8d08bc51..d8d08bc51 100644 --- a/src/go/collectors/go.d.plugin/modules/pgbouncer/config_schema.json +++ b/src/go/plugin/go.d/modules/pgbouncer/config_schema.json diff --git a/src/go/collectors/go.d.plugin/modules/pgbouncer/init.go b/src/go/plugin/go.d/modules/pgbouncer/init.go index 146335085..146335085 100644 --- a/src/go/collectors/go.d.plugin/modules/pgbouncer/init.go +++ b/src/go/plugin/go.d/modules/pgbouncer/init.go diff --git a/src/go/collectors/go.d.plugin/modules/pgbouncer/integrations/pgbouncer.md b/src/go/plugin/go.d/modules/pgbouncer/integrations/pgbouncer.md index ca8e020ee..1b5e6e719 100644 --- a/src/go/collectors/go.d.plugin/modules/pgbouncer/integrations/pgbouncer.md +++ b/src/go/plugin/go.d/modules/pgbouncer/integrations/pgbouncer.md @@ -1,6 +1,6 @@ <!--startmeta -custom_edit_url: "https://github.com/netdata/netdata/edit/master/src/go/collectors/go.d.plugin/modules/pgbouncer/README.md" -meta_yaml: "https://github.com/netdata/netdata/edit/master/src/go/collectors/go.d.plugin/modules/pgbouncer/metadata.yaml" +custom_edit_url: "https://github.com/netdata/netdata/edit/master/src/go/plugin/go.d/modules/pgbouncer/README.md" +meta_yaml: "https://github.com/netdata/netdata/edit/master/src/go/plugin/go.d/modules/pgbouncer/metadata.yaml" sidebar_label: "PgBouncer" learn_status: "Published" learn_rel_path: "Collecting Metrics/Databases" @@ -229,6 +229,8 @@ jobs: ### Debug Mode +**Important**: Debug mode is not supported for data collection jobs created via the UI using the Dyncfg feature. + To troubleshoot issues with the `pgbouncer` collector, run the `go.d.plugin` with the debug option enabled. The output should give you clues as to why the collector isn't working. @@ -251,4 +253,37 @@ should give you clues as to why the collector isn't working. ./go.d.plugin -d -m pgbouncer ``` +### Getting Logs + +If you're encountering problems with the `pgbouncer` collector, follow these steps to retrieve logs and identify potential issues: + +- **Run the command** specific to your system (systemd, non-systemd, or Docker container). +- **Examine the output** for any warnings or error messages that might indicate issues. These messages should provide clues about the root cause of the problem. + +#### System with systemd + +Use the following command to view logs generated since the last Netdata service restart: + +```bash +journalctl _SYSTEMD_INVOCATION_ID="$(systemctl show --value --property=InvocationID netdata)" --namespace=netdata --grep pgbouncer +``` + +#### System without systemd + +Locate the collector log file, typically at `/var/log/netdata/collector.log`, and use `grep` to filter for collector's name: + +```bash +grep pgbouncer /var/log/netdata/collector.log +``` + +**Note**: This method shows logs from all restarts. Focus on the **latest entries** for troubleshooting current issues. + +#### Docker Container + +If your Netdata runs in a Docker container named "netdata" (replace if different), use this command: + +```bash +docker logs netdata 2>&1 | grep pgbouncer +``` + diff --git a/src/go/collectors/go.d.plugin/modules/pgbouncer/metadata.yaml b/src/go/plugin/go.d/modules/pgbouncer/metadata.yaml index e4a098bc2..e4a098bc2 100644 --- a/src/go/collectors/go.d.plugin/modules/pgbouncer/metadata.yaml +++ b/src/go/plugin/go.d/modules/pgbouncer/metadata.yaml diff --git a/src/go/collectors/go.d.plugin/modules/pgbouncer/metrics.go b/src/go/plugin/go.d/modules/pgbouncer/metrics.go index eaac52771..eaac52771 100644 --- a/src/go/collectors/go.d.plugin/modules/pgbouncer/metrics.go +++ b/src/go/plugin/go.d/modules/pgbouncer/metrics.go diff --git a/src/go/collectors/go.d.plugin/modules/pgbouncer/pgbouncer.go b/src/go/plugin/go.d/modules/pgbouncer/pgbouncer.go index a77b35a35..fbe554dc3 100644 --- a/src/go/collectors/go.d.plugin/modules/pgbouncer/pgbouncer.go +++ b/src/go/plugin/go.d/modules/pgbouncer/pgbouncer.go @@ -8,8 +8,8 @@ import ( "errors" "time" - "github.com/netdata/netdata/go/go.d.plugin/agent/module" - "github.com/netdata/netdata/go/go.d.plugin/pkg/web" + "github.com/netdata/netdata/go/plugins/plugin/go.d/agent/module" + "github.com/netdata/netdata/go/plugins/plugin/go.d/pkg/web" "github.com/blang/semver/v4" _ "github.com/jackc/pgx/v4/stdlib" diff --git a/src/go/collectors/go.d.plugin/modules/pgbouncer/pgbouncer_test.go b/src/go/plugin/go.d/modules/pgbouncer/pgbouncer_test.go index 988d406c1..51c838aca 100644 --- a/src/go/collectors/go.d.plugin/modules/pgbouncer/pgbouncer_test.go +++ b/src/go/plugin/go.d/modules/pgbouncer/pgbouncer_test.go @@ -12,7 +12,7 @@ import ( "strings" "testing" - "github.com/netdata/netdata/go/go.d.plugin/agent/module" + "github.com/netdata/netdata/go/plugins/plugin/go.d/agent/module" "github.com/DATA-DOG/go-sqlmock" "github.com/stretchr/testify/assert" diff --git a/src/go/collectors/go.d.plugin/modules/pgbouncer/testdata/config.json b/src/go/plugin/go.d/modules/pgbouncer/testdata/config.json index ed8b72dcb..ed8b72dcb 100644 --- a/src/go/collectors/go.d.plugin/modules/pgbouncer/testdata/config.json +++ b/src/go/plugin/go.d/modules/pgbouncer/testdata/config.json diff --git a/src/go/collectors/go.d.plugin/modules/pgbouncer/testdata/config.yaml b/src/go/plugin/go.d/modules/pgbouncer/testdata/config.yaml index caff49039..caff49039 100644 --- a/src/go/collectors/go.d.plugin/modules/pgbouncer/testdata/config.yaml +++ b/src/go/plugin/go.d/modules/pgbouncer/testdata/config.yaml diff --git a/src/go/collectors/go.d.plugin/modules/pgbouncer/testdata/v1.17.0/config.txt b/src/go/plugin/go.d/modules/pgbouncer/testdata/v1.17.0/config.txt index da1aba609..da1aba609 100644 --- a/src/go/collectors/go.d.plugin/modules/pgbouncer/testdata/v1.17.0/config.txt +++ b/src/go/plugin/go.d/modules/pgbouncer/testdata/v1.17.0/config.txt diff --git a/src/go/collectors/go.d.plugin/modules/pgbouncer/testdata/v1.17.0/databases.txt b/src/go/plugin/go.d/modules/pgbouncer/testdata/v1.17.0/databases.txt index 9e8f14695..9e8f14695 100644 --- a/src/go/collectors/go.d.plugin/modules/pgbouncer/testdata/v1.17.0/databases.txt +++ b/src/go/plugin/go.d/modules/pgbouncer/testdata/v1.17.0/databases.txt diff --git a/src/go/collectors/go.d.plugin/modules/pgbouncer/testdata/v1.17.0/pools.txt b/src/go/plugin/go.d/modules/pgbouncer/testdata/v1.17.0/pools.txt index dec3326ad..dec3326ad 100644 --- a/src/go/collectors/go.d.plugin/modules/pgbouncer/testdata/v1.17.0/pools.txt +++ b/src/go/plugin/go.d/modules/pgbouncer/testdata/v1.17.0/pools.txt diff --git a/src/go/collectors/go.d.plugin/modules/pgbouncer/testdata/v1.17.0/stats.txt b/src/go/plugin/go.d/modules/pgbouncer/testdata/v1.17.0/stats.txt index 3b66fc323..3b66fc323 100644 --- a/src/go/collectors/go.d.plugin/modules/pgbouncer/testdata/v1.17.0/stats.txt +++ b/src/go/plugin/go.d/modules/pgbouncer/testdata/v1.17.0/stats.txt diff --git a/src/go/collectors/go.d.plugin/modules/pgbouncer/testdata/v1.17.0/version.txt b/src/go/plugin/go.d/modules/pgbouncer/testdata/v1.17.0/version.txt index fa2c806a2..fa2c806a2 100644 --- a/src/go/collectors/go.d.plugin/modules/pgbouncer/testdata/v1.17.0/version.txt +++ b/src/go/plugin/go.d/modules/pgbouncer/testdata/v1.17.0/version.txt diff --git a/src/go/collectors/go.d.plugin/modules/pgbouncer/testdata/v1.7.0/version.txt b/src/go/plugin/go.d/modules/pgbouncer/testdata/v1.7.0/version.txt index ff0fd70a8..ff0fd70a8 100644 --- a/src/go/collectors/go.d.plugin/modules/pgbouncer/testdata/v1.7.0/version.txt +++ b/src/go/plugin/go.d/modules/pgbouncer/testdata/v1.7.0/version.txt diff --git a/src/go/collectors/go.d.plugin/modules/phpdaemon/README.md b/src/go/plugin/go.d/modules/phpdaemon/README.md index 2f2fca9f1..2f2fca9f1 120000 --- a/src/go/collectors/go.d.plugin/modules/phpdaemon/README.md +++ b/src/go/plugin/go.d/modules/phpdaemon/README.md diff --git a/src/go/collectors/go.d.plugin/modules/phpdaemon/charts.go b/src/go/plugin/go.d/modules/phpdaemon/charts.go index 8d414b1a5..e96a209bb 100644 --- a/src/go/collectors/go.d.plugin/modules/phpdaemon/charts.go +++ b/src/go/plugin/go.d/modules/phpdaemon/charts.go @@ -2,7 +2,7 @@ package phpdaemon -import "github.com/netdata/netdata/go/go.d.plugin/agent/module" +import "github.com/netdata/netdata/go/plugins/plugin/go.d/agent/module" type ( // Charts is an alias for module.Charts diff --git a/src/go/collectors/go.d.plugin/modules/phpdaemon/client.go b/src/go/plugin/go.d/modules/phpdaemon/client.go index e860ec408..bc54265d3 100644 --- a/src/go/collectors/go.d.plugin/modules/phpdaemon/client.go +++ b/src/go/plugin/go.d/modules/phpdaemon/client.go @@ -8,7 +8,7 @@ import ( "io" "net/http" - "github.com/netdata/netdata/go/go.d.plugin/pkg/web" + "github.com/netdata/netdata/go/plugins/plugin/go.d/pkg/web" ) type decodeFunc func(dst interface{}, reader io.Reader) error diff --git a/src/go/collectors/go.d.plugin/modules/phpdaemon/collect.go b/src/go/plugin/go.d/modules/phpdaemon/collect.go index 901c12684..9be718ea9 100644 --- a/src/go/collectors/go.d.plugin/modules/phpdaemon/collect.go +++ b/src/go/plugin/go.d/modules/phpdaemon/collect.go @@ -2,7 +2,7 @@ package phpdaemon -import "github.com/netdata/netdata/go/go.d.plugin/pkg/stm" +import "github.com/netdata/netdata/go/plugins/plugin/go.d/pkg/stm" func (p *PHPDaemon) collect() (map[string]int64, error) { s, err := p.client.queryFullStatus() diff --git a/src/go/collectors/go.d.plugin/modules/phpdaemon/config_schema.json b/src/go/plugin/go.d/modules/phpdaemon/config_schema.json index 572925d74..a154aaa59 100644 --- a/src/go/collectors/go.d.plugin/modules/phpdaemon/config_schema.json +++ b/src/go/plugin/go.d/modules/phpdaemon/config_schema.json @@ -167,6 +167,12 @@ "timeout": { "ui:help": "Accepts decimals for precise control (e.g., type 1.5 for 1.5 seconds)." }, + "username": { + "ui:widget": "password" + }, + "proxy_username": { + "ui:widget": "password" + }, "password": { "ui:widget": "password" }, diff --git a/src/go/collectors/go.d.plugin/modules/phpdaemon/init.go b/src/go/plugin/go.d/modules/phpdaemon/init.go index 0f05d01ee..ec9925b7a 100644 --- a/src/go/collectors/go.d.plugin/modules/phpdaemon/init.go +++ b/src/go/plugin/go.d/modules/phpdaemon/init.go @@ -5,7 +5,7 @@ package phpdaemon import ( "errors" - "github.com/netdata/netdata/go/go.d.plugin/pkg/web" + "github.com/netdata/netdata/go/plugins/plugin/go.d/pkg/web" ) func (p *PHPDaemon) validateConfig() error { diff --git a/src/go/collectors/go.d.plugin/modules/phpdaemon/integrations/phpdaemon.md b/src/go/plugin/go.d/modules/phpdaemon/integrations/phpdaemon.md index cb9682cee..11445455f 100644 --- a/src/go/collectors/go.d.plugin/modules/phpdaemon/integrations/phpdaemon.md +++ b/src/go/plugin/go.d/modules/phpdaemon/integrations/phpdaemon.md @@ -1,6 +1,6 @@ <!--startmeta -custom_edit_url: "https://github.com/netdata/netdata/edit/master/src/go/collectors/go.d.plugin/modules/phpdaemon/README.md" -meta_yaml: "https://github.com/netdata/netdata/edit/master/src/go/collectors/go.d.plugin/modules/phpdaemon/metadata.yaml" +custom_edit_url: "https://github.com/netdata/netdata/edit/master/src/go/plugin/go.d/modules/phpdaemon/README.md" +meta_yaml: "https://github.com/netdata/netdata/edit/master/src/go/plugin/go.d/modules/phpdaemon/metadata.yaml" sidebar_label: "phpDaemon" learn_status: "Published" learn_rel_path: "Collecting Metrics/APM" @@ -273,6 +273,8 @@ jobs: ### Debug Mode +**Important**: Debug mode is not supported for data collection jobs created via the UI using the Dyncfg feature. + To troubleshoot issues with the `phpdaemon` collector, run the `go.d.plugin` with the debug option enabled. The output should give you clues as to why the collector isn't working. @@ -295,4 +297,37 @@ should give you clues as to why the collector isn't working. ./go.d.plugin -d -m phpdaemon ``` +### Getting Logs + +If you're encountering problems with the `phpdaemon` collector, follow these steps to retrieve logs and identify potential issues: + +- **Run the command** specific to your system (systemd, non-systemd, or Docker container). +- **Examine the output** for any warnings or error messages that might indicate issues. These messages should provide clues about the root cause of the problem. + +#### System with systemd + +Use the following command to view logs generated since the last Netdata service restart: + +```bash +journalctl _SYSTEMD_INVOCATION_ID="$(systemctl show --value --property=InvocationID netdata)" --namespace=netdata --grep phpdaemon +``` + +#### System without systemd + +Locate the collector log file, typically at `/var/log/netdata/collector.log`, and use `grep` to filter for collector's name: + +```bash +grep phpdaemon /var/log/netdata/collector.log +``` + +**Note**: This method shows logs from all restarts. Focus on the **latest entries** for troubleshooting current issues. + +#### Docker Container + +If your Netdata runs in a Docker container named "netdata" (replace if different), use this command: + +```bash +docker logs netdata 2>&1 | grep phpdaemon +``` + diff --git a/src/go/collectors/go.d.plugin/modules/phpdaemon/metadata.yaml b/src/go/plugin/go.d/modules/phpdaemon/metadata.yaml index bd3ae8e57..bd3ae8e57 100644 --- a/src/go/collectors/go.d.plugin/modules/phpdaemon/metadata.yaml +++ b/src/go/plugin/go.d/modules/phpdaemon/metadata.yaml diff --git a/src/go/collectors/go.d.plugin/modules/phpdaemon/metrics.go b/src/go/plugin/go.d/modules/phpdaemon/metrics.go index 1be3c0be3..1be3c0be3 100644 --- a/src/go/collectors/go.d.plugin/modules/phpdaemon/metrics.go +++ b/src/go/plugin/go.d/modules/phpdaemon/metrics.go diff --git a/src/go/collectors/go.d.plugin/modules/phpdaemon/phpdaemon.go b/src/go/plugin/go.d/modules/phpdaemon/phpdaemon.go index 8272b6bec..d9af10591 100644 --- a/src/go/collectors/go.d.plugin/modules/phpdaemon/phpdaemon.go +++ b/src/go/plugin/go.d/modules/phpdaemon/phpdaemon.go @@ -7,8 +7,8 @@ import ( "errors" "time" - "github.com/netdata/netdata/go/go.d.plugin/agent/module" - "github.com/netdata/netdata/go/go.d.plugin/pkg/web" + "github.com/netdata/netdata/go/plugins/plugin/go.d/agent/module" + "github.com/netdata/netdata/go/plugins/plugin/go.d/pkg/web" ) //go:embed "config_schema.json" diff --git a/src/go/collectors/go.d.plugin/modules/phpdaemon/phpdaemon_test.go b/src/go/plugin/go.d/modules/phpdaemon/phpdaemon_test.go index 70cf4743d..e9e35af6d 100644 --- a/src/go/collectors/go.d.plugin/modules/phpdaemon/phpdaemon_test.go +++ b/src/go/plugin/go.d/modules/phpdaemon/phpdaemon_test.go @@ -8,7 +8,7 @@ import ( "os" "testing" - "github.com/netdata/netdata/go/go.d.plugin/agent/module" + "github.com/netdata/netdata/go/plugins/plugin/go.d/agent/module" "github.com/stretchr/testify/assert" "github.com/stretchr/testify/require" diff --git a/src/go/collectors/go.d.plugin/modules/powerdns_recursor/testdata/config.json b/src/go/plugin/go.d/modules/phpdaemon/testdata/config.json index 984c3ed6e..984c3ed6e 100644 --- a/src/go/collectors/go.d.plugin/modules/powerdns_recursor/testdata/config.json +++ b/src/go/plugin/go.d/modules/phpdaemon/testdata/config.json diff --git a/src/go/collectors/go.d.plugin/modules/powerdns_recursor/testdata/config.yaml b/src/go/plugin/go.d/modules/phpdaemon/testdata/config.yaml index 8558b61cc..8558b61cc 100644 --- a/src/go/collectors/go.d.plugin/modules/powerdns_recursor/testdata/config.yaml +++ b/src/go/plugin/go.d/modules/phpdaemon/testdata/config.yaml diff --git a/src/go/collectors/go.d.plugin/modules/phpdaemon/testdata/fullstatus.json b/src/go/plugin/go.d/modules/phpdaemon/testdata/fullstatus.json index b7d2a5e77..b7d2a5e77 100644 --- a/src/go/collectors/go.d.plugin/modules/phpdaemon/testdata/fullstatus.json +++ b/src/go/plugin/go.d/modules/phpdaemon/testdata/fullstatus.json diff --git a/src/go/collectors/go.d.plugin/modules/phpfpm/README.md b/src/go/plugin/go.d/modules/phpfpm/README.md index 2953ff4df..2953ff4df 120000 --- a/src/go/collectors/go.d.plugin/modules/phpfpm/README.md +++ b/src/go/plugin/go.d/modules/phpfpm/README.md diff --git a/src/go/collectors/go.d.plugin/modules/phpfpm/charts.go b/src/go/plugin/go.d/modules/phpfpm/charts.go index 6b69d4c78..2e1e35cf3 100644 --- a/src/go/collectors/go.d.plugin/modules/phpfpm/charts.go +++ b/src/go/plugin/go.d/modules/phpfpm/charts.go @@ -2,7 +2,7 @@ package phpfpm -import "github.com/netdata/netdata/go/go.d.plugin/agent/module" +import "github.com/netdata/netdata/go/plugins/plugin/go.d/agent/module" type ( // Charts is an alias for module.Charts diff --git a/src/go/collectors/go.d.plugin/modules/phpfpm/client.go b/src/go/plugin/go.d/modules/phpfpm/client.go index 5d72041ed..4e8e8cec8 100644 --- a/src/go/collectors/go.d.plugin/modules/phpfpm/client.go +++ b/src/go/plugin/go.d/modules/phpfpm/client.go @@ -11,8 +11,8 @@ import ( "strconv" "time" - "github.com/netdata/netdata/go/go.d.plugin/logger" - "github.com/netdata/netdata/go/go.d.plugin/pkg/web" + "github.com/netdata/netdata/go/plugins/logger" + "github.com/netdata/netdata/go/plugins/plugin/go.d/pkg/web" fcgiclient "github.com/kanocz/fcgi_client" ) diff --git a/src/go/collectors/go.d.plugin/modules/phpfpm/collect.go b/src/go/plugin/go.d/modules/phpfpm/collect.go index f720252a8..08a3b9f61 100644 --- a/src/go/collectors/go.d.plugin/modules/phpfpm/collect.go +++ b/src/go/plugin/go.d/modules/phpfpm/collect.go @@ -5,7 +5,7 @@ package phpfpm import ( "math" - "github.com/netdata/netdata/go/go.d.plugin/pkg/stm" + "github.com/netdata/netdata/go/plugins/plugin/go.d/pkg/stm" ) func (p *Phpfpm) collect() (map[string]int64, error) { diff --git a/src/go/collectors/go.d.plugin/modules/phpfpm/config_schema.json b/src/go/plugin/go.d/modules/phpfpm/config_schema.json index 252d8a083..81b4005af 100644 --- a/src/go/collectors/go.d.plugin/modules/phpfpm/config_schema.json +++ b/src/go/plugin/go.d/modules/phpfpm/config_schema.json @@ -149,6 +149,12 @@ "timeout": { "ui:help": "Accepts decimals for precise control (e.g., type 1.5 for 1.5 seconds)." }, + "username": { + "ui:widget": "password" + }, + "proxy_username": { + "ui:widget": "password" + }, "password": { "ui:widget": "password" }, diff --git a/src/go/collectors/go.d.plugin/modules/phpfpm/decode.go b/src/go/plugin/go.d/modules/phpfpm/decode.go index 021e1fb4c..021e1fb4c 100644 --- a/src/go/collectors/go.d.plugin/modules/phpfpm/decode.go +++ b/src/go/plugin/go.d/modules/phpfpm/decode.go diff --git a/src/go/collectors/go.d.plugin/modules/phpfpm/init.go b/src/go/plugin/go.d/modules/phpfpm/init.go index 33fbc540d..5615012f0 100644 --- a/src/go/collectors/go.d.plugin/modules/phpfpm/init.go +++ b/src/go/plugin/go.d/modules/phpfpm/init.go @@ -7,7 +7,7 @@ import ( "fmt" "os" - "github.com/netdata/netdata/go/go.d.plugin/pkg/web" + "github.com/netdata/netdata/go/plugins/plugin/go.d/pkg/web" ) func (p *Phpfpm) initClient() (client, error) { diff --git a/src/go/collectors/go.d.plugin/modules/phpfpm/integrations/php-fpm.md b/src/go/plugin/go.d/modules/phpfpm/integrations/php-fpm.md index 33e0d7a93..1839d00d6 100644 --- a/src/go/collectors/go.d.plugin/modules/phpfpm/integrations/php-fpm.md +++ b/src/go/plugin/go.d/modules/phpfpm/integrations/php-fpm.md @@ -1,6 +1,6 @@ <!--startmeta -custom_edit_url: "https://github.com/netdata/netdata/edit/master/src/go/collectors/go.d.plugin/modules/phpfpm/README.md" -meta_yaml: "https://github.com/netdata/netdata/edit/master/src/go/collectors/go.d.plugin/modules/phpfpm/metadata.yaml" +custom_edit_url: "https://github.com/netdata/netdata/edit/master/src/go/plugin/go.d/modules/phpfpm/README.md" +meta_yaml: "https://github.com/netdata/netdata/edit/master/src/go/plugin/go.d/modules/phpfpm/metadata.yaml" sidebar_label: "PHP-FPM" learn_status: "Published" learn_rel_path: "Collecting Metrics/Web Servers and Web Proxies" @@ -204,6 +204,8 @@ jobs: ### Debug Mode +**Important**: Debug mode is not supported for data collection jobs created via the UI using the Dyncfg feature. + To troubleshoot issues with the `phpfpm` collector, run the `go.d.plugin` with the debug option enabled. The output should give you clues as to why the collector isn't working. @@ -226,4 +228,37 @@ should give you clues as to why the collector isn't working. ./go.d.plugin -d -m phpfpm ``` +### Getting Logs + +If you're encountering problems with the `phpfpm` collector, follow these steps to retrieve logs and identify potential issues: + +- **Run the command** specific to your system (systemd, non-systemd, or Docker container). +- **Examine the output** for any warnings or error messages that might indicate issues. These messages should provide clues about the root cause of the problem. + +#### System with systemd + +Use the following command to view logs generated since the last Netdata service restart: + +```bash +journalctl _SYSTEMD_INVOCATION_ID="$(systemctl show --value --property=InvocationID netdata)" --namespace=netdata --grep phpfpm +``` + +#### System without systemd + +Locate the collector log file, typically at `/var/log/netdata/collector.log`, and use `grep` to filter for collector's name: + +```bash +grep phpfpm /var/log/netdata/collector.log +``` + +**Note**: This method shows logs from all restarts. Focus on the **latest entries** for troubleshooting current issues. + +#### Docker Container + +If your Netdata runs in a Docker container named "netdata" (replace if different), use this command: + +```bash +docker logs netdata 2>&1 | grep phpfpm +``` + diff --git a/src/go/collectors/go.d.plugin/modules/phpfpm/metadata.yaml b/src/go/plugin/go.d/modules/phpfpm/metadata.yaml index 739e7b7b8..739e7b7b8 100644 --- a/src/go/collectors/go.d.plugin/modules/phpfpm/metadata.yaml +++ b/src/go/plugin/go.d/modules/phpfpm/metadata.yaml diff --git a/src/go/collectors/go.d.plugin/modules/phpfpm/phpfpm.go b/src/go/plugin/go.d/modules/phpfpm/phpfpm.go index bff4d06c1..76057c8f9 100644 --- a/src/go/collectors/go.d.plugin/modules/phpfpm/phpfpm.go +++ b/src/go/plugin/go.d/modules/phpfpm/phpfpm.go @@ -7,8 +7,8 @@ import ( "errors" "time" - "github.com/netdata/netdata/go/go.d.plugin/agent/module" - "github.com/netdata/netdata/go/go.d.plugin/pkg/web" + "github.com/netdata/netdata/go/plugins/plugin/go.d/agent/module" + "github.com/netdata/netdata/go/plugins/plugin/go.d/pkg/web" ) //go:embed "config_schema.json" diff --git a/src/go/collectors/go.d.plugin/modules/phpfpm/phpfpm_test.go b/src/go/plugin/go.d/modules/phpfpm/phpfpm_test.go index 8b44c64af..b089c1ef8 100644 --- a/src/go/collectors/go.d.plugin/modules/phpfpm/phpfpm_test.go +++ b/src/go/plugin/go.d/modules/phpfpm/phpfpm_test.go @@ -8,7 +8,7 @@ import ( "os" "testing" - "github.com/netdata/netdata/go/go.d.plugin/agent/module" + "github.com/netdata/netdata/go/plugins/plugin/go.d/agent/module" "github.com/stretchr/testify/assert" "github.com/stretchr/testify/require" diff --git a/src/go/collectors/go.d.plugin/modules/phpfpm/testdata/config.json b/src/go/plugin/go.d/modules/phpfpm/testdata/config.json index 458343f74..458343f74 100644 --- a/src/go/collectors/go.d.plugin/modules/phpfpm/testdata/config.json +++ b/src/go/plugin/go.d/modules/phpfpm/testdata/config.json diff --git a/src/go/collectors/go.d.plugin/modules/phpfpm/testdata/config.yaml b/src/go/plugin/go.d/modules/phpfpm/testdata/config.yaml index 6c7bea094..6c7bea094 100644 --- a/src/go/collectors/go.d.plugin/modules/phpfpm/testdata/config.yaml +++ b/src/go/plugin/go.d/modules/phpfpm/testdata/config.yaml diff --git a/src/go/collectors/go.d.plugin/modules/phpfpm/testdata/status-full-no-idle.json b/src/go/plugin/go.d/modules/phpfpm/testdata/status-full-no-idle.json index e5b63accd..e5b63accd 100644 --- a/src/go/collectors/go.d.plugin/modules/phpfpm/testdata/status-full-no-idle.json +++ b/src/go/plugin/go.d/modules/phpfpm/testdata/status-full-no-idle.json diff --git a/src/go/collectors/go.d.plugin/modules/phpfpm/testdata/status-full.json b/src/go/plugin/go.d/modules/phpfpm/testdata/status-full.json index 456f6253e..456f6253e 100644 --- a/src/go/collectors/go.d.plugin/modules/phpfpm/testdata/status-full.json +++ b/src/go/plugin/go.d/modules/phpfpm/testdata/status-full.json diff --git a/src/go/collectors/go.d.plugin/modules/phpfpm/testdata/status-full.txt b/src/go/plugin/go.d/modules/phpfpm/testdata/status-full.txt index a5e90987c..a5e90987c 100644 --- a/src/go/collectors/go.d.plugin/modules/phpfpm/testdata/status-full.txt +++ b/src/go/plugin/go.d/modules/phpfpm/testdata/status-full.txt diff --git a/src/go/collectors/go.d.plugin/modules/phpfpm/testdata/status.json b/src/go/plugin/go.d/modules/phpfpm/testdata/status.json index 80af3e0bc..80af3e0bc 100644 --- a/src/go/collectors/go.d.plugin/modules/phpfpm/testdata/status.json +++ b/src/go/plugin/go.d/modules/phpfpm/testdata/status.json diff --git a/src/go/collectors/go.d.plugin/modules/phpfpm/testdata/status.txt b/src/go/plugin/go.d/modules/phpfpm/testdata/status.txt index 08dc158fb..08dc158fb 100644 --- a/src/go/collectors/go.d.plugin/modules/phpfpm/testdata/status.txt +++ b/src/go/plugin/go.d/modules/phpfpm/testdata/status.txt diff --git a/src/go/collectors/go.d.plugin/modules/pihole/README.md b/src/go/plugin/go.d/modules/pihole/README.md index b8d3a7b40..b8d3a7b40 120000 --- a/src/go/collectors/go.d.plugin/modules/pihole/README.md +++ b/src/go/plugin/go.d/modules/pihole/README.md diff --git a/src/go/collectors/go.d.plugin/modules/pihole/charts.go b/src/go/plugin/go.d/modules/pihole/charts.go index d8e0bd00a..862a2544f 100644 --- a/src/go/collectors/go.d.plugin/modules/pihole/charts.go +++ b/src/go/plugin/go.d/modules/pihole/charts.go @@ -3,7 +3,7 @@ package pihole import ( - "github.com/netdata/netdata/go/go.d.plugin/agent/module" + "github.com/netdata/netdata/go/plugins/plugin/go.d/agent/module" ) const ( diff --git a/src/go/collectors/go.d.plugin/modules/pihole/collect.go b/src/go/plugin/go.d/modules/pihole/collect.go index ab0e48ff0..c9e6d8451 100644 --- a/src/go/collectors/go.d.plugin/modules/pihole/collect.go +++ b/src/go/plugin/go.d/modules/pihole/collect.go @@ -12,7 +12,7 @@ import ( "sync" "time" - "github.com/netdata/netdata/go/go.d.plugin/pkg/web" + "github.com/netdata/netdata/go/plugins/plugin/go.d/pkg/web" ) const wantAPIVersion = 3 @@ -131,13 +131,12 @@ func (p *Pihole) queryMetrics(pmx *piholeMetrics, doConcurrently bool) { } func (p *Pihole) querySummary(pmx *piholeMetrics) { - req, err := web.NewHTTPRequest(p.Request) + req, err := web.NewHTTPRequestWithPath(p.Request, urlPathAPI) if err != nil { p.Error(err) return } - req.URL.Path = urlPathAPI req.URL.RawQuery = url.Values{ urlQueryKeyAuth: []string{p.Password}, urlQueryKeySummaryRaw: []string{"true"}, @@ -153,13 +152,12 @@ func (p *Pihole) querySummary(pmx *piholeMetrics) { } func (p *Pihole) queryQueryTypes(pmx *piholeMetrics) { - req, err := web.NewHTTPRequest(p.Request) + req, err := web.NewHTTPRequestWithPath(p.Request, urlPathAPI) if err != nil { p.Error(err) return } - req.URL.Path = urlPathAPI req.URL.RawQuery = url.Values{ urlQueryKeyAuth: []string{p.Password}, urlQueryKeyGetQueryTypes: []string{"true"}, @@ -176,13 +174,12 @@ func (p *Pihole) queryQueryTypes(pmx *piholeMetrics) { } func (p *Pihole) queryForwardedDestinations(pmx *piholeMetrics) { - req, err := web.NewHTTPRequest(p.Request) + req, err := web.NewHTTPRequestWithPath(p.Request, urlPathAPI) if err != nil { p.Error(err) return } - req.URL.Path = urlPathAPI req.URL.RawQuery = url.Values{ urlQueryKeyAuth: []string{p.Password}, urlQueryKeyGetForwardDestinations: []string{"true"}, @@ -199,12 +196,11 @@ func (p *Pihole) queryForwardedDestinations(pmx *piholeMetrics) { } func (p *Pihole) queryAPIVersion() (int, error) { - req, err := web.NewHTTPRequest(p.Request) + req, err := web.NewHTTPRequestWithPath(p.Request, urlPathAPI) if err != nil { return 0, err } - req.URL.Path = urlPathAPI req.URL.RawQuery = url.Values{ urlQueryKeyAuth: []string{p.Password}, urlQueryKeyAPIVersion: []string{"true"}, diff --git a/src/go/collectors/go.d.plugin/modules/pihole/config_schema.json b/src/go/plugin/go.d/modules/pihole/config_schema.json index d33e35833..14523a2e8 100644 --- a/src/go/collectors/go.d.plugin/modules/pihole/config_schema.json +++ b/src/go/plugin/go.d/modules/pihole/config_schema.json @@ -174,6 +174,12 @@ "timeout": { "ui:help": "Accepts decimals for precise control (e.g., type 1.5 for 1.5 seconds)." }, + "username": { + "ui:widget": "password" + }, + "proxy_username": { + "ui:widget": "password" + }, "password": { "ui:widget": "password" }, diff --git a/src/go/collectors/go.d.plugin/modules/pihole/init.go b/src/go/plugin/go.d/modules/pihole/init.go index 982849452..bd5d952cc 100644 --- a/src/go/collectors/go.d.plugin/modules/pihole/init.go +++ b/src/go/plugin/go.d/modules/pihole/init.go @@ -10,7 +10,7 @@ import ( "os" "strings" - "github.com/netdata/netdata/go/go.d.plugin/pkg/web" + "github.com/netdata/netdata/go/plugins/plugin/go.d/pkg/web" ) func (p *Pihole) validateConfig() error { diff --git a/src/go/collectors/go.d.plugin/modules/pihole/integrations/pi-hole.md b/src/go/plugin/go.d/modules/pihole/integrations/pi-hole.md index e50bbe92a..290dfcb03 100644 --- a/src/go/collectors/go.d.plugin/modules/pihole/integrations/pi-hole.md +++ b/src/go/plugin/go.d/modules/pihole/integrations/pi-hole.md @@ -1,6 +1,6 @@ <!--startmeta -custom_edit_url: "https://github.com/netdata/netdata/edit/master/src/go/collectors/go.d.plugin/modules/pihole/README.md" -meta_yaml: "https://github.com/netdata/netdata/edit/master/src/go/collectors/go.d.plugin/modules/pihole/metadata.yaml" +custom_edit_url: "https://github.com/netdata/netdata/edit/master/src/go/plugin/go.d/modules/pihole/README.md" +meta_yaml: "https://github.com/netdata/netdata/edit/master/src/go/plugin/go.d/modules/pihole/metadata.yaml" sidebar_label: "Pi-hole" learn_status: "Published" learn_rel_path: "Collecting Metrics/DNS and DHCP Servers" @@ -199,6 +199,8 @@ jobs: ### Debug Mode +**Important**: Debug mode is not supported for data collection jobs created via the UI using the Dyncfg feature. + To troubleshoot issues with the `pihole` collector, run the `go.d.plugin` with the debug option enabled. The output should give you clues as to why the collector isn't working. @@ -221,4 +223,37 @@ should give you clues as to why the collector isn't working. ./go.d.plugin -d -m pihole ``` +### Getting Logs + +If you're encountering problems with the `pihole` collector, follow these steps to retrieve logs and identify potential issues: + +- **Run the command** specific to your system (systemd, non-systemd, or Docker container). +- **Examine the output** for any warnings or error messages that might indicate issues. These messages should provide clues about the root cause of the problem. + +#### System with systemd + +Use the following command to view logs generated since the last Netdata service restart: + +```bash +journalctl _SYSTEMD_INVOCATION_ID="$(systemctl show --value --property=InvocationID netdata)" --namespace=netdata --grep pihole +``` + +#### System without systemd + +Locate the collector log file, typically at `/var/log/netdata/collector.log`, and use `grep` to filter for collector's name: + +```bash +grep pihole /var/log/netdata/collector.log +``` + +**Note**: This method shows logs from all restarts. Focus on the **latest entries** for troubleshooting current issues. + +#### Docker Container + +If your Netdata runs in a Docker container named "netdata" (replace if different), use this command: + +```bash +docker logs netdata 2>&1 | grep pihole +``` + diff --git a/src/go/collectors/go.d.plugin/modules/pihole/metadata.yaml b/src/go/plugin/go.d/modules/pihole/metadata.yaml index b6ef9656f..b6ef9656f 100644 --- a/src/go/collectors/go.d.plugin/modules/pihole/metadata.yaml +++ b/src/go/plugin/go.d/modules/pihole/metadata.yaml diff --git a/src/go/collectors/go.d.plugin/modules/pihole/metrics.go b/src/go/plugin/go.d/modules/pihole/metrics.go index dd4b3b644..dd4b3b644 100644 --- a/src/go/collectors/go.d.plugin/modules/pihole/metrics.go +++ b/src/go/plugin/go.d/modules/pihole/metrics.go diff --git a/src/go/collectors/go.d.plugin/modules/pihole/pihole.go b/src/go/plugin/go.d/modules/pihole/pihole.go index 818feddc1..9c93d0512 100644 --- a/src/go/collectors/go.d.plugin/modules/pihole/pihole.go +++ b/src/go/plugin/go.d/modules/pihole/pihole.go @@ -9,8 +9,8 @@ import ( "sync" "time" - "github.com/netdata/netdata/go/go.d.plugin/agent/module" - "github.com/netdata/netdata/go/go.d.plugin/pkg/web" + "github.com/netdata/netdata/go/plugins/plugin/go.d/agent/module" + "github.com/netdata/netdata/go/plugins/plugin/go.d/pkg/web" ) //go:embed "config_schema.json" diff --git a/src/go/collectors/go.d.plugin/modules/pihole/pihole_test.go b/src/go/plugin/go.d/modules/pihole/pihole_test.go index 6af8267f1..86b17b623 100644 --- a/src/go/collectors/go.d.plugin/modules/pihole/pihole_test.go +++ b/src/go/plugin/go.d/modules/pihole/pihole_test.go @@ -9,8 +9,8 @@ import ( "os" "testing" - "github.com/netdata/netdata/go/go.d.plugin/agent/module" - "github.com/netdata/netdata/go/go.d.plugin/pkg/web" + "github.com/netdata/netdata/go/plugins/plugin/go.d/agent/module" + "github.com/netdata/netdata/go/plugins/plugin/go.d/pkg/web" "github.com/stretchr/testify/assert" "github.com/stretchr/testify/require" diff --git a/src/go/collectors/go.d.plugin/modules/pihole/testdata/config.json b/src/go/plugin/go.d/modules/pihole/testdata/config.json index 2d82443b0..2d82443b0 100644 --- a/src/go/collectors/go.d.plugin/modules/pihole/testdata/config.json +++ b/src/go/plugin/go.d/modules/pihole/testdata/config.json diff --git a/src/go/collectors/go.d.plugin/modules/pihole/testdata/config.yaml b/src/go/plugin/go.d/modules/pihole/testdata/config.yaml index a9361246a..a9361246a 100644 --- a/src/go/collectors/go.d.plugin/modules/pihole/testdata/config.yaml +++ b/src/go/plugin/go.d/modules/pihole/testdata/config.yaml diff --git a/src/go/collectors/go.d.plugin/modules/pihole/testdata/getForwardDestinations.json b/src/go/plugin/go.d/modules/pihole/testdata/getForwardDestinations.json index 3bfc646d0..3bfc646d0 100644 --- a/src/go/collectors/go.d.plugin/modules/pihole/testdata/getForwardDestinations.json +++ b/src/go/plugin/go.d/modules/pihole/testdata/getForwardDestinations.json diff --git a/src/go/collectors/go.d.plugin/modules/pihole/testdata/getQueryTypes.json b/src/go/plugin/go.d/modules/pihole/testdata/getQueryTypes.json index cf7f19f95..cf7f19f95 100644 --- a/src/go/collectors/go.d.plugin/modules/pihole/testdata/getQueryTypes.json +++ b/src/go/plugin/go.d/modules/pihole/testdata/getQueryTypes.json diff --git a/src/go/collectors/go.d.plugin/modules/pihole/testdata/setupVars.conf b/src/go/plugin/go.d/modules/pihole/testdata/setupVars.conf index 97f260297..97f260297 100644 --- a/src/go/collectors/go.d.plugin/modules/pihole/testdata/setupVars.conf +++ b/src/go/plugin/go.d/modules/pihole/testdata/setupVars.conf diff --git a/src/go/collectors/go.d.plugin/modules/pihole/testdata/summaryRaw.json b/src/go/plugin/go.d/modules/pihole/testdata/summaryRaw.json index 8a4e59c16..8a4e59c16 100644 --- a/src/go/collectors/go.d.plugin/modules/pihole/testdata/summaryRaw.json +++ b/src/go/plugin/go.d/modules/pihole/testdata/summaryRaw.json diff --git a/src/go/collectors/go.d.plugin/modules/pika/README.md b/src/go/plugin/go.d/modules/pika/README.md index 5e3a8da77..5e3a8da77 120000 --- a/src/go/collectors/go.d.plugin/modules/pika/README.md +++ b/src/go/plugin/go.d/modules/pika/README.md diff --git a/src/go/collectors/go.d.plugin/modules/pika/charts.go b/src/go/plugin/go.d/modules/pika/charts.go index cdaa68f6e..6ba0e5d4d 100644 --- a/src/go/collectors/go.d.plugin/modules/pika/charts.go +++ b/src/go/plugin/go.d/modules/pika/charts.go @@ -2,7 +2,7 @@ package pika -import "github.com/netdata/netdata/go/go.d.plugin/agent/module" +import "github.com/netdata/netdata/go/plugins/plugin/go.d/agent/module" var pikaCharts = module.Charts{ chartConnections.Copy(), diff --git a/src/go/collectors/go.d.plugin/modules/pika/collect.go b/src/go/plugin/go.d/modules/pika/collect.go index 72a4961dd..72a4961dd 100644 --- a/src/go/collectors/go.d.plugin/modules/pika/collect.go +++ b/src/go/plugin/go.d/modules/pika/collect.go diff --git a/src/go/collectors/go.d.plugin/modules/pika/collect_info.go b/src/go/plugin/go.d/modules/pika/collect_info.go index 2dc68f529..0494ae576 100644 --- a/src/go/collectors/go.d.plugin/modules/pika/collect_info.go +++ b/src/go/plugin/go.d/modules/pika/collect_info.go @@ -8,7 +8,7 @@ import ( "strconv" "strings" - "github.com/netdata/netdata/go/go.d.plugin/agent/module" + "github.com/netdata/netdata/go/plugins/plugin/go.d/agent/module" ) // https://github.com/Qihoo360/pika/blob/master/src/pika_admin.cc diff --git a/src/go/collectors/go.d.plugin/modules/pika/config_schema.json b/src/go/plugin/go.d/modules/pika/config_schema.json index 885cbed0f..885cbed0f 100644 --- a/src/go/collectors/go.d.plugin/modules/pika/config_schema.json +++ b/src/go/plugin/go.d/modules/pika/config_schema.json diff --git a/src/go/collectors/go.d.plugin/modules/pika/init.go b/src/go/plugin/go.d/modules/pika/init.go index 8cb62aa52..b51152952 100644 --- a/src/go/collectors/go.d.plugin/modules/pika/init.go +++ b/src/go/plugin/go.d/modules/pika/init.go @@ -5,8 +5,8 @@ package pika import ( "errors" - "github.com/netdata/netdata/go/go.d.plugin/agent/module" - "github.com/netdata/netdata/go/go.d.plugin/pkg/tlscfg" + "github.com/netdata/netdata/go/plugins/plugin/go.d/agent/module" + "github.com/netdata/netdata/go/plugins/plugin/go.d/pkg/tlscfg" "github.com/go-redis/redis/v8" ) diff --git a/src/go/collectors/go.d.plugin/modules/pika/integrations/pika.md b/src/go/plugin/go.d/modules/pika/integrations/pika.md index 1214dcad7..04a2b329c 100644 --- a/src/go/collectors/go.d.plugin/modules/pika/integrations/pika.md +++ b/src/go/plugin/go.d/modules/pika/integrations/pika.md @@ -1,6 +1,6 @@ <!--startmeta -custom_edit_url: "https://github.com/netdata/netdata/edit/master/src/go/collectors/go.d.plugin/modules/pika/README.md" -meta_yaml: "https://github.com/netdata/netdata/edit/master/src/go/collectors/go.d.plugin/modules/pika/metadata.yaml" +custom_edit_url: "https://github.com/netdata/netdata/edit/master/src/go/plugin/go.d/modules/pika/README.md" +meta_yaml: "https://github.com/netdata/netdata/edit/master/src/go/plugin/go.d/modules/pika/metadata.yaml" sidebar_label: "Pika" learn_status: "Published" learn_rel_path: "Collecting Metrics/Databases" @@ -196,6 +196,8 @@ jobs: ### Debug Mode +**Important**: Debug mode is not supported for data collection jobs created via the UI using the Dyncfg feature. + To troubleshoot issues with the `pika` collector, run the `go.d.plugin` with the debug option enabled. The output should give you clues as to why the collector isn't working. @@ -218,4 +220,37 @@ should give you clues as to why the collector isn't working. ./go.d.plugin -d -m pika ``` +### Getting Logs + +If you're encountering problems with the `pika` collector, follow these steps to retrieve logs and identify potential issues: + +- **Run the command** specific to your system (systemd, non-systemd, or Docker container). +- **Examine the output** for any warnings or error messages that might indicate issues. These messages should provide clues about the root cause of the problem. + +#### System with systemd + +Use the following command to view logs generated since the last Netdata service restart: + +```bash +journalctl _SYSTEMD_INVOCATION_ID="$(systemctl show --value --property=InvocationID netdata)" --namespace=netdata --grep pika +``` + +#### System without systemd + +Locate the collector log file, typically at `/var/log/netdata/collector.log`, and use `grep` to filter for collector's name: + +```bash +grep pika /var/log/netdata/collector.log +``` + +**Note**: This method shows logs from all restarts. Focus on the **latest entries** for troubleshooting current issues. + +#### Docker Container + +If your Netdata runs in a Docker container named "netdata" (replace if different), use this command: + +```bash +docker logs netdata 2>&1 | grep pika +``` + diff --git a/src/go/collectors/go.d.plugin/modules/pika/metadata.yaml b/src/go/plugin/go.d/modules/pika/metadata.yaml index c87cd9b27..c87cd9b27 100644 --- a/src/go/collectors/go.d.plugin/modules/pika/metadata.yaml +++ b/src/go/plugin/go.d/modules/pika/metadata.yaml diff --git a/src/go/collectors/go.d.plugin/modules/pika/pika.go b/src/go/plugin/go.d/modules/pika/pika.go index c7cbd019a..705c3db49 100644 --- a/src/go/collectors/go.d.plugin/modules/pika/pika.go +++ b/src/go/plugin/go.d/modules/pika/pika.go @@ -8,9 +8,9 @@ import ( "errors" "time" - "github.com/netdata/netdata/go/go.d.plugin/agent/module" - "github.com/netdata/netdata/go/go.d.plugin/pkg/tlscfg" - "github.com/netdata/netdata/go/go.d.plugin/pkg/web" + "github.com/netdata/netdata/go/plugins/plugin/go.d/agent/module" + "github.com/netdata/netdata/go/plugins/plugin/go.d/pkg/tlscfg" + "github.com/netdata/netdata/go/plugins/plugin/go.d/pkg/web" "github.com/blang/semver/v4" "github.com/go-redis/redis/v8" diff --git a/src/go/collectors/go.d.plugin/modules/pika/pika_test.go b/src/go/plugin/go.d/modules/pika/pika_test.go index 5a4e460d7..940619255 100644 --- a/src/go/collectors/go.d.plugin/modules/pika/pika_test.go +++ b/src/go/plugin/go.d/modules/pika/pika_test.go @@ -8,8 +8,8 @@ import ( "os" "testing" - "github.com/netdata/netdata/go/go.d.plugin/agent/module" - "github.com/netdata/netdata/go/go.d.plugin/pkg/tlscfg" + "github.com/netdata/netdata/go/plugins/plugin/go.d/agent/module" + "github.com/netdata/netdata/go/plugins/plugin/go.d/pkg/tlscfg" "github.com/go-redis/redis/v8" "github.com/stretchr/testify/assert" diff --git a/src/go/collectors/go.d.plugin/modules/pika/testdata/config.json b/src/go/plugin/go.d/modules/pika/testdata/config.json index d8ba812ab..d8ba812ab 100644 --- a/src/go/collectors/go.d.plugin/modules/pika/testdata/config.json +++ b/src/go/plugin/go.d/modules/pika/testdata/config.json diff --git a/src/go/collectors/go.d.plugin/modules/pika/testdata/config.yaml b/src/go/plugin/go.d/modules/pika/testdata/config.yaml index 6a6f6ae69..6a6f6ae69 100644 --- a/src/go/collectors/go.d.plugin/modules/pika/testdata/config.yaml +++ b/src/go/plugin/go.d/modules/pika/testdata/config.yaml diff --git a/src/go/collectors/go.d.plugin/modules/pika/testdata/redis/info_all.txt b/src/go/plugin/go.d/modules/pika/testdata/redis/info_all.txt index 8ab381620..8ab381620 100644 --- a/src/go/collectors/go.d.plugin/modules/pika/testdata/redis/info_all.txt +++ b/src/go/plugin/go.d/modules/pika/testdata/redis/info_all.txt diff --git a/src/go/collectors/go.d.plugin/modules/pika/testdata/v3.4.0/info_all.txt b/src/go/plugin/go.d/modules/pika/testdata/v3.4.0/info_all.txt index ec58524ce..ec58524ce 100644 --- a/src/go/collectors/go.d.plugin/modules/pika/testdata/v3.4.0/info_all.txt +++ b/src/go/plugin/go.d/modules/pika/testdata/v3.4.0/info_all.txt diff --git a/src/go/collectors/go.d.plugin/modules/ping/README.md b/src/go/plugin/go.d/modules/ping/README.md index a1381e57b..a1381e57b 120000 --- a/src/go/collectors/go.d.plugin/modules/ping/README.md +++ b/src/go/plugin/go.d/modules/ping/README.md diff --git a/src/go/collectors/go.d.plugin/modules/ping/charts.go b/src/go/plugin/go.d/modules/ping/charts.go index e117a18d5..04dfc17d5 100644 --- a/src/go/collectors/go.d.plugin/modules/ping/charts.go +++ b/src/go/plugin/go.d/modules/ping/charts.go @@ -6,7 +6,7 @@ import ( "fmt" "strings" - "github.com/netdata/netdata/go/go.d.plugin/agent/module" + "github.com/netdata/netdata/go/plugins/plugin/go.d/agent/module" ) const ( diff --git a/src/go/collectors/go.d.plugin/modules/ping/collect.go b/src/go/plugin/go.d/modules/ping/collect.go index c162a2b15..c162a2b15 100644 --- a/src/go/collectors/go.d.plugin/modules/ping/collect.go +++ b/src/go/plugin/go.d/modules/ping/collect.go diff --git a/src/go/collectors/go.d.plugin/modules/ping/config_schema.json b/src/go/plugin/go.d/modules/ping/config_schema.json index 007dd45b0..1168e3388 100644 --- a/src/go/collectors/go.d.plugin/modules/ping/config_schema.json +++ b/src/go/plugin/go.d/modules/ping/config_schema.json @@ -13,7 +13,7 @@ }, "privileged": { "title": "Privileged mode", - "description": "If unset, sends unprivileged UDP ping packets (require [additional configuration](https://github.com/netdata/netdata/tree/master/src/go/collectors/go.d.plugin/modules/ping#overview)); otherwise, sends raw ICMP ping packets ([not recommended](https://github.com/netdata/netdata/issues/15410)).", + "description": "If unset, sends unprivileged UDP ping packets (require [additional configuration](https://github.com/netdata/netdata/tree/master/src/go/plugin/go.d/modules/ping#overview)); otherwise, sends raw ICMP ping packets ([not recommended](https://github.com/netdata/netdata/issues/15410)).", "type": "boolean", "default": false }, diff --git a/src/go/collectors/go.d.plugin/modules/ping/init.go b/src/go/plugin/go.d/modules/ping/init.go index 62d78c8e6..62d78c8e6 100644 --- a/src/go/collectors/go.d.plugin/modules/ping/init.go +++ b/src/go/plugin/go.d/modules/ping/init.go diff --git a/src/go/collectors/go.d.plugin/modules/ping/integrations/ping.md b/src/go/plugin/go.d/modules/ping/integrations/ping.md index 4b073050d..db97288b0 100644 --- a/src/go/collectors/go.d.plugin/modules/ping/integrations/ping.md +++ b/src/go/plugin/go.d/modules/ping/integrations/ping.md @@ -1,6 +1,6 @@ <!--startmeta -custom_edit_url: "https://github.com/netdata/netdata/edit/master/src/go/collectors/go.d.plugin/modules/ping/README.md" -meta_yaml: "https://github.com/netdata/netdata/edit/master/src/go/collectors/go.d.plugin/modules/ping/metadata.yaml" +custom_edit_url: "https://github.com/netdata/netdata/edit/master/src/go/plugin/go.d/modules/ping/README.md" +meta_yaml: "https://github.com/netdata/netdata/edit/master/src/go/plugin/go.d/modules/ping/metadata.yaml" sidebar_label: "Ping" learn_status: "Published" learn_rel_path: "Collecting Metrics/Synthetic Checks" @@ -39,7 +39,7 @@ There are two operational modes: ```bash sudo sysctl -w net.ipv4.ping_group_range="0 2147483647" ``` - To persist the change add `net.ipv4.ping_group_range="0 2147483647"` to `/etc/sysctl.conf` and + To persist the change add `net.ipv4.ping_group_range=0 2147483647` to `/etc/sysctl.conf` and execute `sudo sysctl -p`. @@ -211,6 +211,8 @@ jobs: ### Debug Mode +**Important**: Debug mode is not supported for data collection jobs created via the UI using the Dyncfg feature. + To troubleshoot issues with the `ping` collector, run the `go.d.plugin` with the debug option enabled. The output should give you clues as to why the collector isn't working. @@ -233,4 +235,37 @@ should give you clues as to why the collector isn't working. ./go.d.plugin -d -m ping ``` +### Getting Logs + +If you're encountering problems with the `ping` collector, follow these steps to retrieve logs and identify potential issues: + +- **Run the command** specific to your system (systemd, non-systemd, or Docker container). +- **Examine the output** for any warnings or error messages that might indicate issues. These messages should provide clues about the root cause of the problem. + +#### System with systemd + +Use the following command to view logs generated since the last Netdata service restart: + +```bash +journalctl _SYSTEMD_INVOCATION_ID="$(systemctl show --value --property=InvocationID netdata)" --namespace=netdata --grep ping +``` + +#### System without systemd + +Locate the collector log file, typically at `/var/log/netdata/collector.log`, and use `grep` to filter for collector's name: + +```bash +grep ping /var/log/netdata/collector.log +``` + +**Note**: This method shows logs from all restarts. Focus on the **latest entries** for troubleshooting current issues. + +#### Docker Container + +If your Netdata runs in a Docker container named "netdata" (replace if different), use this command: + +```bash +docker logs netdata 2>&1 | grep ping +``` + diff --git a/src/go/collectors/go.d.plugin/modules/ping/metadata.yaml b/src/go/plugin/go.d/modules/ping/metadata.yaml index d70c8a3f4..8686d103b 100644 --- a/src/go/collectors/go.d.plugin/modules/ping/metadata.yaml +++ b/src/go/plugin/go.d/modules/ping/metadata.yaml @@ -39,7 +39,7 @@ modules: ```bash sudo sysctl -w net.ipv4.ping_group_range="0 2147483647" ``` - To persist the change add `net.ipv4.ping_group_range="0 2147483647"` to `/etc/sysctl.conf` and + To persist the change add `net.ipv4.ping_group_range=0 2147483647` to `/etc/sysctl.conf` and execute `sudo sysctl -p`. method_description: "" supported_platforms: diff --git a/src/go/collectors/go.d.plugin/modules/ping/ping.go b/src/go/plugin/go.d/modules/ping/ping.go index 5171afc04..9d1ef929f 100644 --- a/src/go/collectors/go.d.plugin/modules/ping/ping.go +++ b/src/go/plugin/go.d/modules/ping/ping.go @@ -7,9 +7,9 @@ import ( "errors" "time" - "github.com/netdata/netdata/go/go.d.plugin/agent/module" - "github.com/netdata/netdata/go/go.d.plugin/logger" - "github.com/netdata/netdata/go/go.d.plugin/pkg/web" + "github.com/netdata/netdata/go/plugins/logger" + "github.com/netdata/netdata/go/plugins/plugin/go.d/agent/module" + "github.com/netdata/netdata/go/plugins/plugin/go.d/pkg/web" probing "github.com/prometheus-community/pro-bing" ) diff --git a/src/go/collectors/go.d.plugin/modules/ping/ping_test.go b/src/go/plugin/go.d/modules/ping/ping_test.go index 856449d33..52d16dd3e 100644 --- a/src/go/collectors/go.d.plugin/modules/ping/ping_test.go +++ b/src/go/plugin/go.d/modules/ping/ping_test.go @@ -8,8 +8,8 @@ import ( "testing" "time" - "github.com/netdata/netdata/go/go.d.plugin/agent/module" - "github.com/netdata/netdata/go/go.d.plugin/logger" + "github.com/netdata/netdata/go/plugins/logger" + "github.com/netdata/netdata/go/plugins/plugin/go.d/agent/module" probing "github.com/prometheus-community/pro-bing" "github.com/stretchr/testify/assert" diff --git a/src/go/collectors/go.d.plugin/modules/ping/prober.go b/src/go/plugin/go.d/modules/ping/prober.go index e0d9925b4..70c31dcde 100644 --- a/src/go/collectors/go.d.plugin/modules/ping/prober.go +++ b/src/go/plugin/go.d/modules/ping/prober.go @@ -8,7 +8,7 @@ import ( "net" "time" - "github.com/netdata/netdata/go/go.d.plugin/logger" + "github.com/netdata/netdata/go/plugins/logger" probing "github.com/prometheus-community/pro-bing" ) diff --git a/src/go/collectors/go.d.plugin/modules/ping/testdata/config.json b/src/go/plugin/go.d/modules/ping/testdata/config.json index 18df64529..18df64529 100644 --- a/src/go/collectors/go.d.plugin/modules/ping/testdata/config.json +++ b/src/go/plugin/go.d/modules/ping/testdata/config.json diff --git a/src/go/collectors/go.d.plugin/modules/ping/testdata/config.yaml b/src/go/plugin/go.d/modules/ping/testdata/config.yaml index 5eacb9413..5eacb9413 100644 --- a/src/go/collectors/go.d.plugin/modules/ping/testdata/config.yaml +++ b/src/go/plugin/go.d/modules/ping/testdata/config.yaml diff --git a/src/go/collectors/go.d.plugin/modules/portcheck/README.md b/src/go/plugin/go.d/modules/portcheck/README.md index 4bee556ef..4bee556ef 120000 --- a/src/go/collectors/go.d.plugin/modules/portcheck/README.md +++ b/src/go/plugin/go.d/modules/portcheck/README.md diff --git a/src/go/collectors/go.d.plugin/modules/portcheck/charts.go b/src/go/plugin/go.d/modules/portcheck/charts.go index 6b88f7a8f..6797f00a6 100644 --- a/src/go/collectors/go.d.plugin/modules/portcheck/charts.go +++ b/src/go/plugin/go.d/modules/portcheck/charts.go @@ -6,7 +6,7 @@ import ( "fmt" "strconv" - "github.com/netdata/netdata/go/go.d.plugin/agent/module" + "github.com/netdata/netdata/go/plugins/plugin/go.d/agent/module" ) const ( diff --git a/src/go/collectors/go.d.plugin/modules/portcheck/collect.go b/src/go/plugin/go.d/modules/portcheck/collect.go index dab45ec41..dab45ec41 100644 --- a/src/go/collectors/go.d.plugin/modules/portcheck/collect.go +++ b/src/go/plugin/go.d/modules/portcheck/collect.go diff --git a/src/go/collectors/go.d.plugin/modules/portcheck/config_schema.json b/src/go/plugin/go.d/modules/portcheck/config_schema.json index 025b78f85..025b78f85 100644 --- a/src/go/collectors/go.d.plugin/modules/portcheck/config_schema.json +++ b/src/go/plugin/go.d/modules/portcheck/config_schema.json diff --git a/src/go/collectors/go.d.plugin/modules/portcheck/init.go b/src/go/plugin/go.d/modules/portcheck/init.go index 29c0e43a0..17b402340 100644 --- a/src/go/collectors/go.d.plugin/modules/portcheck/init.go +++ b/src/go/plugin/go.d/modules/portcheck/init.go @@ -7,7 +7,7 @@ import ( "net" "time" - "github.com/netdata/netdata/go/go.d.plugin/agent/module" + "github.com/netdata/netdata/go/plugins/plugin/go.d/agent/module" ) type dialFunc func(network, address string, timeout time.Duration) (net.Conn, error) diff --git a/src/go/collectors/go.d.plugin/modules/portcheck/integrations/tcp_endpoints.md b/src/go/plugin/go.d/modules/portcheck/integrations/tcp_endpoints.md index d64342732..9259afd3b 100644 --- a/src/go/collectors/go.d.plugin/modules/portcheck/integrations/tcp_endpoints.md +++ b/src/go/plugin/go.d/modules/portcheck/integrations/tcp_endpoints.md @@ -1,6 +1,6 @@ <!--startmeta -custom_edit_url: "https://github.com/netdata/netdata/edit/master/src/go/collectors/go.d.plugin/modules/portcheck/README.md" -meta_yaml: "https://github.com/netdata/netdata/edit/master/src/go/collectors/go.d.plugin/modules/portcheck/metadata.yaml" +custom_edit_url: "https://github.com/netdata/netdata/edit/master/src/go/plugin/go.d/modules/portcheck/README.md" +meta_yaml: "https://github.com/netdata/netdata/edit/master/src/go/plugin/go.d/modules/portcheck/metadata.yaml" sidebar_label: "TCP Endpoints" learn_status: "Published" learn_rel_path: "Collecting Metrics/Synthetic Checks" @@ -192,6 +192,8 @@ jobs: ### Debug Mode +**Important**: Debug mode is not supported for data collection jobs created via the UI using the Dyncfg feature. + To troubleshoot issues with the `portcheck` collector, run the `go.d.plugin` with the debug option enabled. The output should give you clues as to why the collector isn't working. @@ -214,4 +216,37 @@ should give you clues as to why the collector isn't working. ./go.d.plugin -d -m portcheck ``` +### Getting Logs + +If you're encountering problems with the `portcheck` collector, follow these steps to retrieve logs and identify potential issues: + +- **Run the command** specific to your system (systemd, non-systemd, or Docker container). +- **Examine the output** for any warnings or error messages that might indicate issues. These messages should provide clues about the root cause of the problem. + +#### System with systemd + +Use the following command to view logs generated since the last Netdata service restart: + +```bash +journalctl _SYSTEMD_INVOCATION_ID="$(systemctl show --value --property=InvocationID netdata)" --namespace=netdata --grep portcheck +``` + +#### System without systemd + +Locate the collector log file, typically at `/var/log/netdata/collector.log`, and use `grep` to filter for collector's name: + +```bash +grep portcheck /var/log/netdata/collector.log +``` + +**Note**: This method shows logs from all restarts. Focus on the **latest entries** for troubleshooting current issues. + +#### Docker Container + +If your Netdata runs in a Docker container named "netdata" (replace if different), use this command: + +```bash +docker logs netdata 2>&1 | grep portcheck +``` + diff --git a/src/go/collectors/go.d.plugin/modules/portcheck/metadata.yaml b/src/go/plugin/go.d/modules/portcheck/metadata.yaml index c0ccfde1d..c0ccfde1d 100644 --- a/src/go/collectors/go.d.plugin/modules/portcheck/metadata.yaml +++ b/src/go/plugin/go.d/modules/portcheck/metadata.yaml diff --git a/src/go/collectors/go.d.plugin/modules/portcheck/portcheck.go b/src/go/plugin/go.d/modules/portcheck/portcheck.go index 68f275a2c..3a6da78ac 100644 --- a/src/go/collectors/go.d.plugin/modules/portcheck/portcheck.go +++ b/src/go/plugin/go.d/modules/portcheck/portcheck.go @@ -7,8 +7,8 @@ import ( "net" "time" - "github.com/netdata/netdata/go/go.d.plugin/agent/module" - "github.com/netdata/netdata/go/go.d.plugin/pkg/web" + "github.com/netdata/netdata/go/plugins/plugin/go.d/agent/module" + "github.com/netdata/netdata/go/plugins/plugin/go.d/pkg/web" ) //go:embed "config_schema.json" diff --git a/src/go/collectors/go.d.plugin/modules/portcheck/portcheck_test.go b/src/go/plugin/go.d/modules/portcheck/portcheck_test.go index 01ed9f16d..86a2c9679 100644 --- a/src/go/collectors/go.d.plugin/modules/portcheck/portcheck_test.go +++ b/src/go/plugin/go.d/modules/portcheck/portcheck_test.go @@ -10,7 +10,7 @@ import ( "testing" "time" - "github.com/netdata/netdata/go/go.d.plugin/agent/module" + "github.com/netdata/netdata/go/plugins/plugin/go.d/agent/module" "github.com/stretchr/testify/assert" "github.com/stretchr/testify/require" diff --git a/src/go/collectors/go.d.plugin/modules/portcheck/testdata/config.json b/src/go/plugin/go.d/modules/portcheck/testdata/config.json index a69a6ac38..a69a6ac38 100644 --- a/src/go/collectors/go.d.plugin/modules/portcheck/testdata/config.json +++ b/src/go/plugin/go.d/modules/portcheck/testdata/config.json diff --git a/src/go/collectors/go.d.plugin/modules/portcheck/testdata/config.yaml b/src/go/plugin/go.d/modules/portcheck/testdata/config.yaml index 72bdfd549..72bdfd549 100644 --- a/src/go/collectors/go.d.plugin/modules/portcheck/testdata/config.yaml +++ b/src/go/plugin/go.d/modules/portcheck/testdata/config.yaml diff --git a/src/collectors/python.d.plugin/postfix/README.md b/src/go/plugin/go.d/modules/postfix/README.md index c62eb5c24..c62eb5c24 120000 --- a/src/collectors/python.d.plugin/postfix/README.md +++ b/src/go/plugin/go.d/modules/postfix/README.md diff --git a/src/go/plugin/go.d/modules/postfix/charts.go b/src/go/plugin/go.d/modules/postfix/charts.go new file mode 100644 index 000000000..69c672460 --- /dev/null +++ b/src/go/plugin/go.d/modules/postfix/charts.go @@ -0,0 +1,44 @@ +// SPDX-License-Identifier: GPL-3.0-or-later + +package postfix + +import ( + "github.com/netdata/netdata/go/plugins/plugin/go.d/agent/module" +) + +const ( + prioPostfixQueueEmailsCount = module.Priority + iota + prioPostfixQueueSize +) + +var charts = module.Charts{ + queueEmailsCountChart.Copy(), + queueSizeChart.Copy(), +} + +var ( + queueEmailsCountChart = module.Chart{ + ID: "postfix_queue_emails", + Title: "Postfix Queue Emails", + Units: "emails", + Fam: "queue", + Ctx: "postfix.qemails", + Type: module.Line, + Priority: prioPostfixQueueEmailsCount, + Dims: module.Dims{ + {ID: "emails"}, + }, + } + queueSizeChart = module.Chart{ + ID: "postfix_queue_size", + Title: "Postfix Queue Size", + Units: "KiB", + Fam: "queue", + Ctx: "postfix.qsize", + Type: module.Area, + Priority: prioPostfixQueueSize, + Dims: module.Dims{ + {ID: "size"}, + }, + } +) diff --git a/src/go/plugin/go.d/modules/postfix/collect.go b/src/go/plugin/go.d/modules/postfix/collect.go new file mode 100644 index 000000000..7afcd769d --- /dev/null +++ b/src/go/plugin/go.d/modules/postfix/collect.go @@ -0,0 +1,71 @@ +// SPDX-License-Identifier: GPL-3.0-or-later + +package postfix + +import ( + "bufio" + "bytes" + "errors" + "fmt" + "strconv" + "strings" +) + +type postqueueStats struct { + sizeKbyte int64 + requests int64 +} + +func (p *Postfix) collect() (map[string]int64, error) { + bs, err := p.exec.list() + if err != nil { + return nil, err + } + + stats, err := parsePostqueueOutput(bs) + if err != nil { + return nil, err + } + + mx := make(map[string]int64) + + mx["emails"] = stats.requests + mx["size"] = stats.sizeKbyte + + return mx, nil +} + +func parsePostqueueOutput(bs []byte) (*postqueueStats, error) { + if len(bs) == 0 { + return nil, errors.New("empty postqueue output") + } + + var lastLine string + sc := bufio.NewScanner(bytes.NewReader(bs)) + for sc.Scan() { + if line := strings.TrimSpace(sc.Text()); line != "" { + lastLine = strings.TrimSpace(sc.Text()) + } + } + + if lastLine == "Mail queue is empty" { + return &postqueueStats{}, nil + } + + // -- 3 Kbytes in 3 Requests. + parts := strings.Fields(lastLine) + if len(parts) < 5 { + return nil, fmt.Errorf("unexpected postqueue output ('%s')", lastLine) + } + + size, err := strconv.ParseInt(parts[1], 10, 64) + if err != nil { + return nil, fmt.Errorf("unexpected postqueue output ('%s')", lastLine) + } + requests, err := strconv.ParseInt(parts[4], 10, 64) + if err != nil { + return nil, fmt.Errorf("unexpected postqueue output ('%s')", lastLine) + } + + return &postqueueStats{sizeKbyte: size, requests: requests}, nil +} diff --git a/src/go/plugin/go.d/modules/postfix/config_schema.json b/src/go/plugin/go.d/modules/postfix/config_schema.json new file mode 100644 index 000000000..da416f14b --- /dev/null +++ b/src/go/plugin/go.d/modules/postfix/config_schema.json @@ -0,0 +1,47 @@ +{ + "jsonSchema": { + "$schema": "http://json-schema.org/draft-07/schema#", + "title": "Postfix collector configuration", + "type": "object", + "properties": { + "update_every": { + "title": "Update every", + "description": "Data collection interval, measured in seconds.", + "type": "integer", + "minimum": 1, + "default": 10 + }, + "binary_path": { + "title": "Binary path", + "description": "Path to the `postqueue` binary.", + "type": "string", + "default": "/usr/sbin/postqueue" + }, + "timeout": { + "title": "Timeout", + "description": "Timeout for executing the binary, specified in seconds.", + "type": "number", + "minimum": 0.5, + "default": 2 + } + }, + "required": [ + "binary_path" + ], + "additionalProperties": false, + "patternProperties": { + "^name$": {} + } + }, + "uiSchema": { + "uiOptions": { + "fullPage": true + }, + "binary_path": { + "ui:help": "If an absolute path is provided, the collector will use it directly; otherwise, it will search for the binary in directories specified in the PATH environment variable." + }, + "timeout": { + "ui:help": "Accepts decimals for precise control (e.g., type 1.5 for 1.5 seconds)." + } + } +}
\ No newline at end of file diff --git a/src/go/plugin/go.d/modules/postfix/exec.go b/src/go/plugin/go.d/modules/postfix/exec.go new file mode 100644 index 000000000..1ca29331a --- /dev/null +++ b/src/go/plugin/go.d/modules/postfix/exec.go @@ -0,0 +1,41 @@ +// SPDX-License-Identifier: GPL-3.0-or-later + +package postfix + +import ( + "context" + "fmt" + "os/exec" + "time" + + "github.com/netdata/netdata/go/plugins/logger" +) + +func newPostqueueExec(binPath string, timeout time.Duration) *postqueueExec { + return &postqueueExec{ + binPath: binPath, + timeout: timeout, + } +} + +type postqueueExec struct { + *logger.Logger + + binPath string + timeout time.Duration +} + +func (p *postqueueExec) list() ([]byte, error) { + ctx, cancel := context.WithTimeout(context.Background(), p.timeout) + defer cancel() + + cmd := exec.CommandContext(ctx, p.binPath, "-p") + p.Debugf("executing '%s'", cmd) + + bs, err := cmd.Output() + if err != nil { + return nil, fmt.Errorf("error on '%s': %v", cmd, err) + } + + return bs, nil +} diff --git a/src/go/plugin/go.d/modules/postfix/init.go b/src/go/plugin/go.d/modules/postfix/init.go new file mode 100644 index 000000000..ffa50af8d --- /dev/null +++ b/src/go/plugin/go.d/modules/postfix/init.go @@ -0,0 +1,38 @@ +// SPDX-License-Identifier: GPL-3.0-or-later + +package postfix + +import ( + "errors" + "os" + "os/exec" + "strings" +) + +func (p *Postfix) validateConfig() error { + if p.BinaryPath == "" { + return errors.New("no postqueue binary path specified") + } + return nil +} + +func (p *Postfix) initPostqueueExec() (postqueueBinary, error) { + binPath := p.BinaryPath + + if !strings.HasPrefix(binPath, "/") { + path, err := exec.LookPath(binPath) + if err != nil { + return nil, err + } + binPath = path + } + + if _, err := os.Stat(binPath); err != nil { + return nil, err + } + + pq := newPostqueueExec(binPath, p.Timeout.Duration()) + pq.Logger = p.Logger + + return pq, nil +} diff --git a/src/go/plugin/go.d/modules/postfix/integrations/postfix.md b/src/go/plugin/go.d/modules/postfix/integrations/postfix.md new file mode 100644 index 000000000..503a8c66d --- /dev/null +++ b/src/go/plugin/go.d/modules/postfix/integrations/postfix.md @@ -0,0 +1,195 @@ +<!--startmeta +custom_edit_url: "https://github.com/netdata/netdata/edit/master/src/go/plugin/go.d/modules/postfix/README.md" +meta_yaml: "https://github.com/netdata/netdata/edit/master/src/go/plugin/go.d/modules/postfix/metadata.yaml" +sidebar_label: "Postfix" +learn_status: "Published" +learn_rel_path: "Collecting Metrics/Mail Servers" +most_popular: False +message: "DO NOT EDIT THIS FILE DIRECTLY, IT IS GENERATED BY THE COLLECTOR'S metadata.yaml FILE" +endmeta--> + +# Postfix + + +<img src="https://netdata.cloud/img/postfix.svg" width="150"/> + + +Plugin: go.d.plugin +Module: postfix + +<img src="https://img.shields.io/badge/maintained%20by-Netdata-%2300ab44" /> + +## Overview + +This collector retrieves statistics about the Postfix mail queue using the [postqueue](https://www.postfix.org/postqueue.1.html) command-line tool. + + +It periodically executes the `postqueue -p` command. The collection interval is set to 10 seconds by default, but this can be configurable. + + +This collector is supported on all platforms. + +This collector only supports collecting metrics from a single instance of this integration. + +Postfix has internal access controls for the mail queue. By default, all users can view the queue. If your system has stricter controls, grant the `netdata` user access by adding it to `authorized_mailq_users` in the `/etc/postfix/main.cf `file. For more details, refer to the `authorized_mailq_users` setting in the [Postfix documentation](https://www.postfix.org/postconf.5.html). + + +### Default Behavior + +#### Auto-Detection + +The collector executes `postqueue -p` to get Postfix queue statistics. + +#### Limits + +The default configuration for this integration does not impose any limits on data collection. + +#### Performance Impact + +The default configuration for this integration is not expected to impose a significant performance impact on the system. + + +## Metrics + +Metrics grouped by *scope*. + +The scope defines the instance that the metric belongs to. An instance is uniquely identified by a set of labels. + + + +### Per Postfix instance + +These metrics refer to the entire monitored application. + + +This scope has no labels. + +Metrics: + +| Metric | Dimensions | Unit | +|:------|:----------|:----| +| postfix.qemails | emails | emails | +| postfix.qsize | size | KiB | + + + +## Alerts + +There are no alerts configured by default for this integration. + + +## Setup + +### Prerequisites + +No action required. + +### Configuration + +#### File + +The configuration file name for this integration is `go.d/postfix.conf`. + + +You can edit the configuration file using the `edit-config` script from the +Netdata [config directory](/docs/netdata-agent/configuration/README.md#the-netdata-config-directory). + +```bash +cd /etc/netdata 2>/dev/null || cd /opt/netdata/etc/netdata +sudo ./edit-config go.d/postfix.conf +``` +#### Options + +The following options can be defined globally: update_every. + + +<details open><summary>Config options</summary> + +| Name | Description | Default | Required | +|:----|:-----------|:-------|:--------:| +| update_every | Data collection frequency. | 10 | no | +| binary_path | Path to the `postqueue` binary. If an absolute path is provided, the collector will use it directly; otherwise, it will search for the binary in directories specified in the PATH environment variable. | /usr/sbin/postqueue | yes | +| timeout | Timeout for executing the binary, specified in seconds. | 2 | no | + +</details> + +#### Examples + +##### Custom binary path + +The executable is not in the directories specified in the PATH environment variable. + +<details open><summary></summary> + +```yaml +jobs: + - name: custom_path + binary_path: /usr/local/sbin/postqueue + +``` +</details> + + + +## Troubleshooting + +### Debug Mode + +**Important**: Debug mode is not supported for data collection jobs created via the UI using the Dyncfg feature. + +To troubleshoot issues with the `postfix` collector, run the `go.d.plugin` with the debug option enabled. The output +should give you clues as to why the collector isn't working. + +- Navigate to the `plugins.d` directory, usually at `/usr/libexec/netdata/plugins.d/`. If that's not the case on + your system, open `netdata.conf` and look for the `plugins` setting under `[directories]`. + + ```bash + cd /usr/libexec/netdata/plugins.d/ + ``` + +- Switch to the `netdata` user. + + ```bash + sudo -u netdata -s + ``` + +- Run the `go.d.plugin` to debug the collector: + + ```bash + ./go.d.plugin -d -m postfix + ``` + +### Getting Logs + +If you're encountering problems with the `postfix` collector, follow these steps to retrieve logs and identify potential issues: + +- **Run the command** specific to your system (systemd, non-systemd, or Docker container). +- **Examine the output** for any warnings or error messages that might indicate issues. These messages should provide clues about the root cause of the problem. + +#### System with systemd + +Use the following command to view logs generated since the last Netdata service restart: + +```bash +journalctl _SYSTEMD_INVOCATION_ID="$(systemctl show --value --property=InvocationID netdata)" --namespace=netdata --grep postfix +``` + +#### System without systemd + +Locate the collector log file, typically at `/var/log/netdata/collector.log`, and use `grep` to filter for collector's name: + +```bash +grep postfix /var/log/netdata/collector.log +``` + +**Note**: This method shows logs from all restarts. Focus on the **latest entries** for troubleshooting current issues. + +#### Docker Container + +If your Netdata runs in a Docker container named "netdata" (replace if different), use this command: + +```bash +docker logs netdata 2>&1 | grep postfix +``` + + diff --git a/src/go/plugin/go.d/modules/postfix/metadata.yaml b/src/go/plugin/go.d/modules/postfix/metadata.yaml new file mode 100644 index 000000000..3407ebb32 --- /dev/null +++ b/src/go/plugin/go.d/modules/postfix/metadata.yaml @@ -0,0 +1,106 @@ +plugin_name: go.d.plugin +modules: + - meta: + plugin_name: go.d.plugin + module_name: postfix + monitored_instance: + name: Postfix + link: https://www.postfix.org/ + categories: + - data-collection.mail-servers + icon_filename: "postfix.svg" + related_resources: + integrations: + list: [] + info_provided_to_referring_integrations: + description: "" + keywords: + - postfix + - mail + - mail server + most_popular: false + overview: + data_collection: + metrics_description: > + This collector retrieves statistics about the Postfix mail queue using the [postqueue](https://www.postfix.org/postqueue.1.html) command-line tool. + method_description: > + It periodically executes the `postqueue -p` command. The collection interval is set to 10 seconds by default, but this can be configurable. + supported_platforms: + include: [] + exclude: [] + multi_instance: false + additional_permissions: + description: > + Postfix has internal access controls for the mail queue. By default, all users can view the queue. If your system has stricter controls, grant the `netdata` user access by adding it to `authorized_mailq_users` in the `/etc/postfix/main.cf `file. + For more details, refer to the `authorized_mailq_users` setting in the [Postfix documentation](https://www.postfix.org/postconf.5.html). + default_behavior: + auto_detection: + description: "The collector executes `postqueue -p` to get Postfix queue statistics." + limits: + description: "" + performance_impact: + description: "" + setup: + prerequisites: + list: [] + configuration: + file: + name: "go.d/postfix.conf" + options: + description: | + The following options can be defined globally: update_every. + folding: + title: Config options + enabled: true + list: + - name: update_every + description: Data collection frequency. + default_value: 10 + required: false + - name: binary_path + description: Path to the `postqueue` binary. If an absolute path is provided, the collector will use it directly; otherwise, it will search for the binary in directories specified in the PATH environment variable. + default_value: /usr/sbin/postqueue + required: true + - name: timeout + description: Timeout for executing the binary, specified in seconds. + default_value: 2 + required: false + examples: + folding: + enabled: true + title: "" + list: + - name: Custom binary path + description: The executable is not in the directories specified in the PATH environment variable. + config: | + jobs: + - name: custom_path + binary_path: /usr/local/sbin/postqueue + troubleshooting: + problems: + list: [] + alerts: [] + metrics: + folding: + title: Metrics + enabled: false + description: "" + availability: [] + scopes: + - name: global + description: | + These metrics refer to the entire monitored application. + labels: [] + metrics: + - name: postfix.qemails + description: Postfix Queue Emails + unit: emails + chart_type: line + dimensions: + - name: emails + - name: postfix.qsize + description: Postfix Queue Emails Size + unit: KiB + chart_type: area + dimensions: + - name: size diff --git a/src/go/plugin/go.d/modules/postfix/postfix.go b/src/go/plugin/go.d/modules/postfix/postfix.go new file mode 100644 index 000000000..3622811ee --- /dev/null +++ b/src/go/plugin/go.d/modules/postfix/postfix.go @@ -0,0 +1,109 @@ +// SPDX-License-Identifier: GPL-3.0-or-later + +package postfix + +import ( + _ "embed" + "errors" + "time" + + "github.com/netdata/netdata/go/plugins/plugin/go.d/agent/module" + "github.com/netdata/netdata/go/plugins/plugin/go.d/pkg/web" +) + +//go:embed "config_schema.json" +var configSchema string + +func init() { + module.Register("postfix", module.Creator{ + JobConfigSchema: configSchema, + Defaults: module.Defaults{ + UpdateEvery: 10, + }, + Create: func() module.Module { return New() }, + Config: func() any { return &Config{} }, + }) +} + +func New() *Postfix { + return &Postfix{ + Config: Config{ + BinaryPath: "/usr/sbin/postqueue", + Timeout: web.Duration(time.Second * 2), + }, + charts: charts.Copy(), + } +} + +type Config struct { + UpdateEvery int `yaml:"update_every,omitempty" json:"update_every"` + Timeout web.Duration `yaml:"timeout,omitempty" json:"timeout"` + BinaryPath string `yaml:"binary_path,omitempty" json:"binary_path"` +} + +type ( + Postfix struct { + module.Base + Config `yaml:",inline" json:""` + + charts *module.Charts + + exec postqueueBinary + } + postqueueBinary interface { + list() ([]byte, error) + } +) + +func (p *Postfix) Configuration() any { + return p.Config +} + +func (p *Postfix) Init() error { + if err := p.validateConfig(); err != nil { + p.Errorf("config validation: %s", err) + return err + } + + pq, err := p.initPostqueueExec() + if err != nil { + p.Errorf("postqueue exec initialization: %v", err) + return err + } + p.exec = pq + + return nil +} + +func (p *Postfix) Check() error { + mx, err := p.collect() + if err != nil { + p.Error(err) + return err + } + + if len(mx) == 0 { + return errors.New("no metrics collected") + } + + return nil +} + +func (p *Postfix) Charts() *module.Charts { + return p.charts +} + +func (p *Postfix) Collect() map[string]int64 { + mx, err := p.collect() + if err != nil { + p.Error(err) + } + + if len(mx) == 0 { + return nil + } + + return mx +} + +func (p *Postfix) Cleanup() {} diff --git a/src/go/collectors/go.d.plugin/modules/zfspool/zfspool_test.go b/src/go/plugin/go.d/modules/postfix/postfix_test.go index ea40aa06d..daccaaa6f 100644 --- a/src/go/collectors/go.d.plugin/modules/zfspool/zfspool_test.go +++ b/src/go/plugin/go.d/modules/postfix/postfix_test.go @@ -1,13 +1,13 @@ // SPDX-License-Identifier: GPL-3.0-or-later -package zfspool +package postfix import ( "errors" "os" "testing" - "github.com/netdata/netdata/go/go.d.plugin/agent/module" + "github.com/netdata/netdata/go/plugins/plugin/go.d/agent/module" "github.com/stretchr/testify/assert" "github.com/stretchr/testify/require" @@ -17,26 +17,24 @@ var ( dataConfigJSON, _ = os.ReadFile("testdata/config.json") dataConfigYAML, _ = os.ReadFile("testdata/config.yaml") - dataZpoolList, _ = os.ReadFile("testdata/zpool-list.txt") + dataPostqueue, _ = os.ReadFile("testdata/postqueue.txt") ) func Test_testDataIsValid(t *testing.T) { for name, data := range map[string][]byte{ "dataConfigJSON": dataConfigJSON, "dataConfigYAML": dataConfigYAML, - - "dataZpoolList": dataZpoolList, + "dataPostqueue": dataPostqueue, } { require.NotNil(t, data, name) - } } -func TestZFSPool_Configuration(t *testing.T) { - module.TestConfigurationSerialize(t, &ZFSPool{}, dataConfigJSON, dataConfigYAML) +func TestPostfix_Configuration(t *testing.T) { + module.TestConfigurationSerialize(t, &Postfix{}, dataConfigJSON, dataConfigYAML) } -func TestZFSPool_Init(t *testing.T) { +func TestPostfix_Init(t *testing.T) { tests := map[string]struct { config Config wantFail bool @@ -50,130 +48,124 @@ func TestZFSPool_Init(t *testing.T) { "fails if failed to find binary": { wantFail: true, config: Config{ - BinaryPath: "zpool!!!", + BinaryPath: "postqueue!!!", }, }, } for name, test := range tests { t.Run(name, func(t *testing.T) { - zp := New() - zp.Config = test.config + pf := New() + pf.Config = test.config if test.wantFail { - assert.Error(t, zp.Init()) + assert.Error(t, pf.Init()) } else { - assert.NoError(t, zp.Init()) + assert.NoError(t, pf.Init()) } }) } } -func TestZFSPool_Cleanup(t *testing.T) { +func TestPostfix_Cleanup(t *testing.T) { tests := map[string]struct { - prepare func() *ZFSPool + prepare func() *Postfix }{ "not initialized exec": { - prepare: func() *ZFSPool { + prepare: func() *Postfix { return New() }, }, "after check": { - prepare: func() *ZFSPool { - zp := New() - zp.exec = prepareMockOK() - _ = zp.Check() - return zp + prepare: func() *Postfix { + pf := New() + pf.exec = prepareMockOK() + _ = pf.Check() + return pf }, }, "after collect": { - prepare: func() *ZFSPool { - zp := New() - zp.exec = prepareMockOK() - _ = zp.Collect() - return zp + prepare: func() *Postfix { + pf := New() + pf.exec = prepareMockOK() + _ = pf.Collect() + return pf }, }, } for name, test := range tests { t.Run(name, func(t *testing.T) { - zp := test.prepare() + pf := test.prepare() - assert.NotPanics(t, zp.Cleanup) + assert.NotPanics(t, pf.Cleanup) }) } } -func TestZFSPool_Charts(t *testing.T) { +func TestPostfix_Charts(t *testing.T) { assert.NotNil(t, New().Charts()) } -func TestZFSPool_Check(t *testing.T) { +func TestPostfix_Check(t *testing.T) { tests := map[string]struct { - prepareMock func() *mockZpoolCLIExec + prepareMock func() *mockPostqueueExec wantFail bool }{ "success case": { + wantFail: false, prepareMock: prepareMockOK, + }, + "mail queue is empty": { wantFail: false, + prepareMock: prepareMockEmptyMailQueue, }, "error on list call": { - prepareMock: prepareMockErrOnList, wantFail: true, + prepareMock: prepareMockErrOnList, }, "empty response": { - prepareMock: prepareMockEmptyResponse, wantFail: true, + prepareMock: prepareMockEmptyResponse, }, "unexpected response": { - prepareMock: prepareMockUnexpectedResponse, wantFail: true, + prepareMock: prepareMockUnexpectedResponse, }, } for name, test := range tests { t.Run(name, func(t *testing.T) { - zp := New() + pf := New() mock := test.prepareMock() - zp.exec = mock + pf.exec = mock if test.wantFail { - assert.Error(t, zp.Check()) + assert.Error(t, pf.Check()) } else { - assert.NoError(t, zp.Check()) + assert.NoError(t, pf.Check()) } }) } } -func TestZFSPool_Collect(t *testing.T) { +func TestPostfix_Collect(t *testing.T) { tests := map[string]struct { - prepareMock func() *mockZpoolCLIExec + prepareMock func() *mockPostqueueExec wantMetrics map[string]int64 }{ "success case": { prepareMock: prepareMockOK, wantMetrics: map[string]int64{ - "zpool_rpool_alloc": 9051643576, - "zpool_rpool_cap": 42, - "zpool_rpool_frag": 33, - "zpool_rpool_free": 12240656794, - "zpool_rpool_health_state_degraded": 0, - "zpool_rpool_health_state_faulted": 0, - "zpool_rpool_health_state_offline": 0, - "zpool_rpool_health_state_online": 1, - "zpool_rpool_health_state_removed": 0, - "zpool_rpool_health_state_suspended": 0, - "zpool_rpool_health_state_unavail": 0, - "zpool_rpool_size": 21367462298, - "zpool_zion_health_state_degraded": 0, - "zpool_zion_health_state_faulted": 1, - "zpool_zion_health_state_offline": 0, - "zpool_zion_health_state_online": 0, - "zpool_zion_health_state_removed": 0, - "zpool_zion_health_state_suspended": 0, - "zpool_zion_health_state_unavail": 0, + "emails": 12991, + "size": 132422, + }, + }, + "mail queue is empty": { + prepareMock: prepareMockEmptyMailQueue, + wantMetrics: map[string]int64{ + "emails": 0, + "size": 0, }, }, "error on list call": { @@ -192,38 +184,41 @@ func TestZFSPool_Collect(t *testing.T) { for name, test := range tests { t.Run(name, func(t *testing.T) { - zp := New() + pf := New() mock := test.prepareMock() - zp.exec = mock + pf.exec = mock - mx := zp.Collect() + mx := pf.Collect() assert.Equal(t, test.wantMetrics, mx) - if len(test.wantMetrics) > 0 { - assert.Len(t, *zp.Charts(), len(zpoolChartsTmpl)*len(zp.zpools)) - } }) } } -func prepareMockOK() *mockZpoolCLIExec { - return &mockZpoolCLIExec{ - listData: dataZpoolList, +func prepareMockOK() *mockPostqueueExec { + return &mockPostqueueExec{ + listData: dataPostqueue, + } +} + +func prepareMockEmptyMailQueue() *mockPostqueueExec { + return &mockPostqueueExec{ + listData: []byte("Mail queue is empty"), } } -func prepareMockErrOnList() *mockZpoolCLIExec { - return &mockZpoolCLIExec{ +func prepareMockErrOnList() *mockPostqueueExec { + return &mockPostqueueExec{ errOnList: true, } } -func prepareMockEmptyResponse() *mockZpoolCLIExec { - return &mockZpoolCLIExec{} +func prepareMockEmptyResponse() *mockPostqueueExec { + return &mockPostqueueExec{} } -func prepareMockUnexpectedResponse() *mockZpoolCLIExec { - return &mockZpoolCLIExec{ +func prepareMockUnexpectedResponse() *mockPostqueueExec { + return &mockPostqueueExec{ listData: []byte(` Lorem ipsum dolor sit amet, consectetur adipiscing elit. Nulla malesuada erat id magna mattis, eu viverra tellus rhoncus. @@ -232,12 +227,12 @@ Fusce et felis pulvinar, posuere sem non, porttitor eros. } } -type mockZpoolCLIExec struct { +type mockPostqueueExec struct { errOnList bool listData []byte } -func (m *mockZpoolCLIExec) list() ([]byte, error) { +func (m *mockPostqueueExec) list() ([]byte, error) { if m.errOnList { return nil, errors.New("mock.list() error") } diff --git a/src/go/plugin/go.d/modules/postfix/testdata/config.json b/src/go/plugin/go.d/modules/postfix/testdata/config.json new file mode 100644 index 000000000..d13d2cc1d --- /dev/null +++ b/src/go/plugin/go.d/modules/postfix/testdata/config.json @@ -0,0 +1,5 @@ +{ + "update_every": 123, + "timeout": 123.123, + "binary_path": "/usr/sbin/postqueue" +}
\ No newline at end of file diff --git a/src/go/plugin/go.d/modules/postfix/testdata/config.yaml b/src/go/plugin/go.d/modules/postfix/testdata/config.yaml new file mode 100644 index 000000000..0ea793d30 --- /dev/null +++ b/src/go/plugin/go.d/modules/postfix/testdata/config.yaml @@ -0,0 +1,3 @@ +update_every: 123 +timeout: 123.123 +binary_path: "/usr/sbin/postqueue" diff --git a/src/go/plugin/go.d/modules/postfix/testdata/postqueue.txt b/src/go/plugin/go.d/modules/postfix/testdata/postqueue.txt new file mode 100644 index 000000000..5a4b822cc --- /dev/null +++ b/src/go/plugin/go.d/modules/postfix/testdata/postqueue.txt @@ -0,0 +1,34 @@ +1FC3A100A1FF* 10438 Wed Jun 26 13:39:27 root@localhost.test + fotis@localhost.test + +D4BBA10097DF* 10438 Wed Jun 26 13:39:25 root@localhost.test + fotis@localhost.test + +078D8100A90D* 10438 Wed Jun 26 13:39:28 root@localhost.test + fotis@localhost.test + +A23BB100961F* 10438 Wed Jun 26 13:39:25 root@localhost.test + fotis@localhost.test + +CCF1D1009798* 10438 Wed Jun 26 13:39:25 root@localhost.test + fotis@localhost.test + +58897100885C* 10438 Wed Jun 26 13:39:24 root@localhost.test + fotis@localhost.test + +F1A951003C07* 10438 Wed Jun 26 13:39:23 root@localhost.test + fotis@localhost.test + +3A24A1003239* 10438 Wed Jun 26 13:39:23 root@localhost.test + fotis@localhost.test + +CAF5E1009FCC* 10438 Wed Jun 26 13:39:26 root@localhost.test + fotis@localhost.test + +752741009D2A* 10438 Wed Jun 26 13:39:26 root@localhost.test + fotis@localhost.test + +6B5FA10033D4* 10438 Wed Jun 26 13:39:23 root@localhost.test + fotis@localhost.test + +-- 132422 Kbytes in 12991 Requests. diff --git a/src/go/collectors/go.d.plugin/modules/postgres/README.md b/src/go/plugin/go.d/modules/postgres/README.md index 73b67b984..73b67b984 120000 --- a/src/go/collectors/go.d.plugin/modules/postgres/README.md +++ b/src/go/plugin/go.d/modules/postgres/README.md diff --git a/src/go/collectors/go.d.plugin/modules/postgres/charts.go b/src/go/plugin/go.d/modules/postgres/charts.go index 8003ab9f8..da9b04af0 100644 --- a/src/go/collectors/go.d.plugin/modules/postgres/charts.go +++ b/src/go/plugin/go.d/modules/postgres/charts.go @@ -7,7 +7,7 @@ import ( "strings" "time" - "github.com/netdata/netdata/go/go.d.plugin/agent/module" + "github.com/netdata/netdata/go/plugins/plugin/go.d/agent/module" ) const ( diff --git a/src/go/collectors/go.d.plugin/modules/postgres/collect.go b/src/go/plugin/go.d/modules/postgres/collect.go index b43e2806e..6186932c0 100644 --- a/src/go/collectors/go.d.plugin/modules/postgres/collect.go +++ b/src/go/plugin/go.d/modules/postgres/collect.go @@ -6,11 +6,12 @@ import ( "context" "database/sql" "fmt" + "regexp" "strconv" "time" - "github.com/jackc/pgx/v4" - "github.com/jackc/pgx/v4/stdlib" + "github.com/jackc/pgx/v5" + "github.com/jackc/pgx/v5/stdlib" ) const ( @@ -264,3 +265,9 @@ func calcPercentage(value, total int64) (v int64) { func calcDeltaPercentage(a, b incDelta) int64 { return calcPercentage(a.delta(), a.delta()+b.delta()) } + +func removeSpaces(s string) string { + return reSpace.ReplaceAllString(s, "_") +} + +var reSpace = regexp.MustCompile(`\s+`) diff --git a/src/go/collectors/go.d.plugin/modules/postgres/collect_metrics.go b/src/go/plugin/go.d/modules/postgres/collect_metrics.go index 84f9abbc7..84f9abbc7 100644 --- a/src/go/collectors/go.d.plugin/modules/postgres/collect_metrics.go +++ b/src/go/plugin/go.d/modules/postgres/collect_metrics.go diff --git a/src/go/collectors/go.d.plugin/modules/postgres/config_schema.json b/src/go/plugin/go.d/modules/postgres/config_schema.json index 42bff329b..42bff329b 100644 --- a/src/go/collectors/go.d.plugin/modules/postgres/config_schema.json +++ b/src/go/plugin/go.d/modules/postgres/config_schema.json diff --git a/src/go/collectors/go.d.plugin/modules/postgres/do_query.go b/src/go/plugin/go.d/modules/postgres/do_query.go index 3b90be0d7..3b90be0d7 100644 --- a/src/go/collectors/go.d.plugin/modules/postgres/do_query.go +++ b/src/go/plugin/go.d/modules/postgres/do_query.go diff --git a/src/go/collectors/go.d.plugin/modules/postgres/do_query_bloat.go b/src/go/plugin/go.d/modules/postgres/do_query_bloat.go index ae1add4ac..484bfdd96 100644 --- a/src/go/collectors/go.d.plugin/modules/postgres/do_query_bloat.go +++ b/src/go/plugin/go.d/modules/postgres/do_query_bloat.go @@ -52,7 +52,7 @@ func (p *Postgres) doDBQueryBloat(db *sql.DB) error { case "wastedbytes": tableWasted = parseFloat(value) case "iname": - iname = value + iname = removeSpaces(value) case "wastedibytes": idxWasted = parseFloat(value) } diff --git a/src/go/collectors/go.d.plugin/modules/postgres/do_query_columns.go b/src/go/plugin/go.d/modules/postgres/do_query_columns.go index 1da655aaf..1da655aaf 100644 --- a/src/go/collectors/go.d.plugin/modules/postgres/do_query_columns.go +++ b/src/go/plugin/go.d/modules/postgres/do_query_columns.go diff --git a/src/go/collectors/go.d.plugin/modules/postgres/do_query_databases.go b/src/go/plugin/go.d/modules/postgres/do_query_databases.go index 0cee7a0cd..0cee7a0cd 100644 --- a/src/go/collectors/go.d.plugin/modules/postgres/do_query_databases.go +++ b/src/go/plugin/go.d/modules/postgres/do_query_databases.go diff --git a/src/go/collectors/go.d.plugin/modules/postgres/do_query_global.go b/src/go/plugin/go.d/modules/postgres/do_query_global.go index c70772a23..c70772a23 100644 --- a/src/go/collectors/go.d.plugin/modules/postgres/do_query_global.go +++ b/src/go/plugin/go.d/modules/postgres/do_query_global.go diff --git a/src/go/collectors/go.d.plugin/modules/postgres/do_query_indexes.go b/src/go/plugin/go.d/modules/postgres/do_query_indexes.go index f5eb15bb3..309b4d104 100644 --- a/src/go/collectors/go.d.plugin/modules/postgres/do_query_indexes.go +++ b/src/go/plugin/go.d/modules/postgres/do_query_indexes.go @@ -42,7 +42,7 @@ func (p *Postgres) doDBQueryStatUserIndexes(db *sql.DB) error { case "relname": table = value case "indexrelname": - name = value + name = removeSpaces(value) p.getIndexMetrics(name, table, dbname, schema).updated = true case "parent_relname": p.getIndexMetrics(name, table, dbname, schema).parentTable = value diff --git a/src/go/collectors/go.d.plugin/modules/postgres/do_query_misc.go b/src/go/plugin/go.d/modules/postgres/do_query_misc.go index a2299c8b4..2877650cd 100644 --- a/src/go/collectors/go.d.plugin/modules/postgres/do_query_misc.go +++ b/src/go/plugin/go.d/modules/postgres/do_query_misc.go @@ -6,7 +6,7 @@ import ( "database/sql" "strconv" - "github.com/jackc/pgx/v4/stdlib" + "github.com/jackc/pgx/v5/stdlib" ) func (p *Postgres) doQueryServerVersion() (int, error) { diff --git a/src/go/collectors/go.d.plugin/modules/postgres/do_query_replication.go b/src/go/plugin/go.d/modules/postgres/do_query_replication.go index 22ff47003..e60287e61 100644 --- a/src/go/collectors/go.d.plugin/modules/postgres/do_query_replication.go +++ b/src/go/plugin/go.d/modules/postgres/do_query_replication.go @@ -36,7 +36,7 @@ func (p *Postgres) doQueryReplStandbyAppWALDelta() error { app = value p.getReplAppMetrics(app).updated = true default: - // TODO: delta calculation was changed in https://github.com/netdata/netdata/go/go.d.plugin/pull/1039 + // TODO: delta calculation was changed in https://github.com/netdata/netdata/go/plugins/plugin/go.d/pull/1039 // - 'replay_delta' (probably other deltas too?) can be negative // - Also, WAL delta != WAL lag after that PR v := parseInt(value) diff --git a/src/go/collectors/go.d.plugin/modules/postgres/do_query_tables.go b/src/go/plugin/go.d/modules/postgres/do_query_tables.go index 5b3e2c71d..5b3e2c71d 100644 --- a/src/go/collectors/go.d.plugin/modules/postgres/do_query_tables.go +++ b/src/go/plugin/go.d/modules/postgres/do_query_tables.go diff --git a/src/go/collectors/go.d.plugin/modules/postgres/init.go b/src/go/plugin/go.d/modules/postgres/init.go index 315a876a7..e2bbecc16 100644 --- a/src/go/collectors/go.d.plugin/modules/postgres/init.go +++ b/src/go/plugin/go.d/modules/postgres/init.go @@ -5,7 +5,7 @@ package postgres import ( "errors" - "github.com/netdata/netdata/go/go.d.plugin/pkg/matcher" + "github.com/netdata/netdata/go/plugins/plugin/go.d/pkg/matcher" ) func (p *Postgres) validateConfig() error { diff --git a/src/go/collectors/go.d.plugin/modules/postgres/integrations/postgresql.md b/src/go/plugin/go.d/modules/postgres/integrations/postgresql.md index 2122f3d61..4f2a91101 100644 --- a/src/go/collectors/go.d.plugin/modules/postgres/integrations/postgresql.md +++ b/src/go/plugin/go.d/modules/postgres/integrations/postgresql.md @@ -1,6 +1,6 @@ <!--startmeta -custom_edit_url: "https://github.com/netdata/netdata/edit/master/src/go/collectors/go.d.plugin/modules/postgres/README.md" -meta_yaml: "https://github.com/netdata/netdata/edit/master/src/go/collectors/go.d.plugin/modules/postgres/metadata.yaml" +custom_edit_url: "https://github.com/netdata/netdata/edit/master/src/go/plugin/go.d/modules/postgres/README.md" +meta_yaml: "https://github.com/netdata/netdata/edit/master/src/go/plugin/go.d/modules/postgres/metadata.yaml" sidebar_label: "PostgreSQL" learn_status: "Published" learn_rel_path: "Collecting Metrics/Databases" @@ -299,7 +299,7 @@ The following options can be defined globally: update_every, autodetection_retry | autodetection_retry | Recheck interval in seconds. Zero means no recheck will be scheduled. | 0 | no | | dsn | Postgres server DSN (Data Source Name). See [DSN syntax](https://www.postgresql.org/docs/current/libpq-connect.html#LIBPQ-CONNSTRING). | postgres://postgres:postgres@127.0.0.1:5432/postgres | yes | | timeout | Query timeout in seconds. | 2 | no | -| collect_databases_matching | Databases selector. Determines which database metrics will be collected. Syntax is [simple patterns](https://github.com/netdata/netdata/tree/master/src/go/collectors/go.d.plugin/pkg/matcher#simple-patterns-matcher). | | no | +| collect_databases_matching | Databases selector. Determines which database metrics will be collected. Syntax is [simple patterns](https://github.com/netdata/netdata/tree/master/src/go/plugin/go.d/pkg/matcher#simple-patterns-matcher). | | no | | max_db_tables | Maximum number of tables in the database. Table metrics will not be collected for databases that have more tables than max_db_tables. 0 means no limit. | 50 | no | | max_db_indexes | Maximum number of indexes in the database. Index metrics will not be collected for databases that have more indexes than max_db_indexes. 0 means no limit. | 250 | no | @@ -357,6 +357,8 @@ jobs: ### Debug Mode +**Important**: Debug mode is not supported for data collection jobs created via the UI using the Dyncfg feature. + To troubleshoot issues with the `postgres` collector, run the `go.d.plugin` with the debug option enabled. The output should give you clues as to why the collector isn't working. @@ -379,4 +381,37 @@ should give you clues as to why the collector isn't working. ./go.d.plugin -d -m postgres ``` +### Getting Logs + +If you're encountering problems with the `postgres` collector, follow these steps to retrieve logs and identify potential issues: + +- **Run the command** specific to your system (systemd, non-systemd, or Docker container). +- **Examine the output** for any warnings or error messages that might indicate issues. These messages should provide clues about the root cause of the problem. + +#### System with systemd + +Use the following command to view logs generated since the last Netdata service restart: + +```bash +journalctl _SYSTEMD_INVOCATION_ID="$(systemctl show --value --property=InvocationID netdata)" --namespace=netdata --grep postgres +``` + +#### System without systemd + +Locate the collector log file, typically at `/var/log/netdata/collector.log`, and use `grep` to filter for collector's name: + +```bash +grep postgres /var/log/netdata/collector.log +``` + +**Note**: This method shows logs from all restarts. Focus on the **latest entries** for troubleshooting current issues. + +#### Docker Container + +If your Netdata runs in a Docker container named "netdata" (replace if different), use this command: + +```bash +docker logs netdata 2>&1 | grep postgres +``` + diff --git a/src/go/collectors/go.d.plugin/modules/postgres/metadata.yaml b/src/go/plugin/go.d/modules/postgres/metadata.yaml index 799dd6d0e..aacd19adb 100644 --- a/src/go/collectors/go.d.plugin/modules/postgres/metadata.yaml +++ b/src/go/plugin/go.d/modules/postgres/metadata.yaml @@ -98,7 +98,7 @@ modules: default_value: 2 required: false - name: collect_databases_matching - description: Databases selector. Determines which database metrics will be collected. Syntax is [simple patterns](https://github.com/netdata/netdata/tree/master/src/go/collectors/go.d.plugin/pkg/matcher#simple-patterns-matcher). + description: Databases selector. Determines which database metrics will be collected. Syntax is [simple patterns](https://github.com/netdata/netdata/tree/master/src/go/plugin/go.d/pkg/matcher#simple-patterns-matcher). default_value: "" required: false - name: max_db_tables diff --git a/src/go/collectors/go.d.plugin/modules/postgres/metrics.go b/src/go/plugin/go.d/modules/postgres/metrics.go index b60fbdf8a..a42ccba13 100644 --- a/src/go/collectors/go.d.plugin/modules/postgres/metrics.go +++ b/src/go/plugin/go.d/modules/postgres/metrics.go @@ -2,7 +2,7 @@ package postgres -import "github.com/netdata/netdata/go/go.d.plugin/pkg/metrics" +import "github.com/netdata/netdata/go/plugins/plugin/go.d/pkg/metrics" type pgMetrics struct { srvMetrics diff --git a/src/go/collectors/go.d.plugin/modules/postgres/postgres.go b/src/go/plugin/go.d/modules/postgres/postgres.go index 7928c0b6d..57491039a 100644 --- a/src/go/collectors/go.d.plugin/modules/postgres/postgres.go +++ b/src/go/plugin/go.d/modules/postgres/postgres.go @@ -9,13 +9,13 @@ import ( "sync" "time" - "github.com/netdata/netdata/go/go.d.plugin/agent/module" - "github.com/netdata/netdata/go/go.d.plugin/pkg/matcher" - "github.com/netdata/netdata/go/go.d.plugin/pkg/metrics" - "github.com/netdata/netdata/go/go.d.plugin/pkg/web" + "github.com/netdata/netdata/go/plugins/plugin/go.d/agent/module" + "github.com/netdata/netdata/go/plugins/plugin/go.d/pkg/matcher" + "github.com/netdata/netdata/go/plugins/plugin/go.d/pkg/metrics" + "github.com/netdata/netdata/go/plugins/plugin/go.d/pkg/web" - "github.com/jackc/pgx/v4/stdlib" - _ "github.com/jackc/pgx/v4/stdlib" + "github.com/jackc/pgx/v5/stdlib" + _ "github.com/jackc/pgx/v5/stdlib" ) //go:embed "config_schema.json" diff --git a/src/go/collectors/go.d.plugin/modules/postgres/postgres_test.go b/src/go/plugin/go.d/modules/postgres/postgres_test.go index 051f9c38d..7e91b288f 100644 --- a/src/go/collectors/go.d.plugin/modules/postgres/postgres_test.go +++ b/src/go/plugin/go.d/modules/postgres/postgres_test.go @@ -12,8 +12,8 @@ import ( "strings" "testing" - "github.com/netdata/netdata/go/go.d.plugin/agent/module" - "github.com/netdata/netdata/go/go.d.plugin/pkg/matcher" + "github.com/netdata/netdata/go/plugins/plugin/go.d/agent/module" + "github.com/netdata/netdata/go/plugins/plugin/go.d/pkg/matcher" "github.com/DATA-DOG/go-sqlmock" "github.com/stretchr/testify/assert" diff --git a/src/go/collectors/go.d.plugin/modules/postgres/queries.go b/src/go/plugin/go.d/modules/postgres/queries.go index f6afc9342..f6afc9342 100644 --- a/src/go/collectors/go.d.plugin/modules/postgres/queries.go +++ b/src/go/plugin/go.d/modules/postgres/queries.go diff --git a/src/go/collectors/go.d.plugin/modules/postgres/testdata/config.json b/src/go/plugin/go.d/modules/postgres/testdata/config.json index 6b39278c5..6b39278c5 100644 --- a/src/go/collectors/go.d.plugin/modules/postgres/testdata/config.json +++ b/src/go/plugin/go.d/modules/postgres/testdata/config.json diff --git a/src/go/collectors/go.d.plugin/modules/postgres/testdata/config.yaml b/src/go/plugin/go.d/modules/postgres/testdata/config.yaml index 36ff5f0b1..36ff5f0b1 100644 --- a/src/go/collectors/go.d.plugin/modules/postgres/testdata/config.yaml +++ b/src/go/plugin/go.d/modules/postgres/testdata/config.yaml diff --git a/src/go/collectors/go.d.plugin/modules/postgres/testdata/v14.4/autovacuum_workers.txt b/src/go/plugin/go.d/modules/postgres/testdata/v14.4/autovacuum_workers.txt index 7adc787bc..7adc787bc 100644 --- a/src/go/collectors/go.d.plugin/modules/postgres/testdata/v14.4/autovacuum_workers.txt +++ b/src/go/plugin/go.d/modules/postgres/testdata/v14.4/autovacuum_workers.txt diff --git a/src/go/collectors/go.d.plugin/modules/postgres/testdata/v14.4/bloat_tables.txt b/src/go/plugin/go.d/modules/postgres/testdata/v14.4/bloat_tables.txt index 307695363..307695363 100644 --- a/src/go/collectors/go.d.plugin/modules/postgres/testdata/v14.4/bloat_tables.txt +++ b/src/go/plugin/go.d/modules/postgres/testdata/v14.4/bloat_tables.txt diff --git a/src/go/collectors/go.d.plugin/modules/postgres/testdata/v14.4/catalog_relations.txt b/src/go/plugin/go.d/modules/postgres/testdata/v14.4/catalog_relations.txt index cd05e89af..cd05e89af 100644 --- a/src/go/collectors/go.d.plugin/modules/postgres/testdata/v14.4/catalog_relations.txt +++ b/src/go/plugin/go.d/modules/postgres/testdata/v14.4/catalog_relations.txt diff --git a/src/go/collectors/go.d.plugin/modules/postgres/testdata/v14.4/checkpoints.txt b/src/go/plugin/go.d/modules/postgres/testdata/v14.4/checkpoints.txt index 851ff1320..851ff1320 100644 --- a/src/go/collectors/go.d.plugin/modules/postgres/testdata/v14.4/checkpoints.txt +++ b/src/go/plugin/go.d/modules/postgres/testdata/v14.4/checkpoints.txt diff --git a/src/go/collectors/go.d.plugin/modules/postgres/testdata/v14.4/database_conflicts.txt b/src/go/plugin/go.d/modules/postgres/testdata/v14.4/database_conflicts.txt index 34229182a..34229182a 100644 --- a/src/go/collectors/go.d.plugin/modules/postgres/testdata/v14.4/database_conflicts.txt +++ b/src/go/plugin/go.d/modules/postgres/testdata/v14.4/database_conflicts.txt diff --git a/src/go/collectors/go.d.plugin/modules/postgres/testdata/v14.4/database_locks.txt b/src/go/plugin/go.d/modules/postgres/testdata/v14.4/database_locks.txt index 8d92f314d..8d92f314d 100644 --- a/src/go/collectors/go.d.plugin/modules/postgres/testdata/v14.4/database_locks.txt +++ b/src/go/plugin/go.d/modules/postgres/testdata/v14.4/database_locks.txt diff --git a/src/go/collectors/go.d.plugin/modules/postgres/testdata/v14.4/database_size.txt b/src/go/plugin/go.d/modules/postgres/testdata/v14.4/database_size.txt index 367cb6f20..367cb6f20 100644 --- a/src/go/collectors/go.d.plugin/modules/postgres/testdata/v14.4/database_size.txt +++ b/src/go/plugin/go.d/modules/postgres/testdata/v14.4/database_size.txt diff --git a/src/go/collectors/go.d.plugin/modules/postgres/testdata/v14.4/database_stats.txt b/src/go/plugin/go.d/modules/postgres/testdata/v14.4/database_stats.txt index d3ce24c6e..d3ce24c6e 100644 --- a/src/go/collectors/go.d.plugin/modules/postgres/testdata/v14.4/database_stats.txt +++ b/src/go/plugin/go.d/modules/postgres/testdata/v14.4/database_stats.txt diff --git a/src/go/collectors/go.d.plugin/modules/postgres/testdata/v14.4/is_super_user-false.txt b/src/go/plugin/go.d/modules/postgres/testdata/v14.4/is_super_user-false.txt index 6cb2222d3..6cb2222d3 100644 --- a/src/go/collectors/go.d.plugin/modules/postgres/testdata/v14.4/is_super_user-false.txt +++ b/src/go/plugin/go.d/modules/postgres/testdata/v14.4/is_super_user-false.txt diff --git a/src/go/collectors/go.d.plugin/modules/postgres/testdata/v14.4/is_super_user-true.txt b/src/go/plugin/go.d/modules/postgres/testdata/v14.4/is_super_user-true.txt index 84cd8088e..84cd8088e 100644 --- a/src/go/collectors/go.d.plugin/modules/postgres/testdata/v14.4/is_super_user-true.txt +++ b/src/go/plugin/go.d/modules/postgres/testdata/v14.4/is_super_user-true.txt diff --git a/src/go/collectors/go.d.plugin/modules/postgres/testdata/v14.4/pg_is_in_recovery-true.txt b/src/go/plugin/go.d/modules/postgres/testdata/v14.4/pg_is_in_recovery-true.txt index b684948e3..b684948e3 100644 --- a/src/go/collectors/go.d.plugin/modules/postgres/testdata/v14.4/pg_is_in_recovery-true.txt +++ b/src/go/plugin/go.d/modules/postgres/testdata/v14.4/pg_is_in_recovery-true.txt diff --git a/src/go/collectors/go.d.plugin/modules/postgres/testdata/v14.4/queryable_database_list.txt b/src/go/plugin/go.d/modules/postgres/testdata/v14.4/queryable_database_list.txt index b3f2af4f1..b3f2af4f1 100644 --- a/src/go/collectors/go.d.plugin/modules/postgres/testdata/v14.4/queryable_database_list.txt +++ b/src/go/plugin/go.d/modules/postgres/testdata/v14.4/queryable_database_list.txt diff --git a/src/go/collectors/go.d.plugin/modules/postgres/testdata/v14.4/replication_slot_files.txt b/src/go/plugin/go.d/modules/postgres/testdata/v14.4/replication_slot_files.txt index 59fcd8fe4..59fcd8fe4 100644 --- a/src/go/collectors/go.d.plugin/modules/postgres/testdata/v14.4/replication_slot_files.txt +++ b/src/go/plugin/go.d/modules/postgres/testdata/v14.4/replication_slot_files.txt diff --git a/src/go/collectors/go.d.plugin/modules/postgres/testdata/v14.4/replication_standby_app_wal_delta.txt b/src/go/plugin/go.d/modules/postgres/testdata/v14.4/replication_standby_app_wal_delta.txt index 98c3cd99e..98c3cd99e 100644 --- a/src/go/collectors/go.d.plugin/modules/postgres/testdata/v14.4/replication_standby_app_wal_delta.txt +++ b/src/go/plugin/go.d/modules/postgres/testdata/v14.4/replication_standby_app_wal_delta.txt diff --git a/src/go/collectors/go.d.plugin/modules/postgres/testdata/v14.4/replication_standby_app_wal_lag.txt b/src/go/plugin/go.d/modules/postgres/testdata/v14.4/replication_standby_app_wal_lag.txt index c2e253790..c2e253790 100644 --- a/src/go/collectors/go.d.plugin/modules/postgres/testdata/v14.4/replication_standby_app_wal_lag.txt +++ b/src/go/plugin/go.d/modules/postgres/testdata/v14.4/replication_standby_app_wal_lag.txt diff --git a/src/go/collectors/go.d.plugin/modules/postgres/testdata/v14.4/server_connections_state.txt b/src/go/plugin/go.d/modules/postgres/testdata/v14.4/server_connections_state.txt index 7387f4dfb..7387f4dfb 100644 --- a/src/go/collectors/go.d.plugin/modules/postgres/testdata/v14.4/server_connections_state.txt +++ b/src/go/plugin/go.d/modules/postgres/testdata/v14.4/server_connections_state.txt diff --git a/src/go/collectors/go.d.plugin/modules/postgres/testdata/v14.4/server_current_connections.txt b/src/go/plugin/go.d/modules/postgres/testdata/v14.4/server_current_connections.txt index 065188d97..065188d97 100644 --- a/src/go/collectors/go.d.plugin/modules/postgres/testdata/v14.4/server_current_connections.txt +++ b/src/go/plugin/go.d/modules/postgres/testdata/v14.4/server_current_connections.txt diff --git a/src/go/collectors/go.d.plugin/modules/postgres/testdata/v14.4/server_version_num.txt b/src/go/plugin/go.d/modules/postgres/testdata/v14.4/server_version_num.txt index 18d769b32..18d769b32 100644 --- a/src/go/collectors/go.d.plugin/modules/postgres/testdata/v14.4/server_version_num.txt +++ b/src/go/plugin/go.d/modules/postgres/testdata/v14.4/server_version_num.txt diff --git a/src/go/collectors/go.d.plugin/modules/postgres/testdata/v14.4/settings_max_connections.txt b/src/go/plugin/go.d/modules/postgres/testdata/v14.4/settings_max_connections.txt index 4d59df214..4d59df214 100644 --- a/src/go/collectors/go.d.plugin/modules/postgres/testdata/v14.4/settings_max_connections.txt +++ b/src/go/plugin/go.d/modules/postgres/testdata/v14.4/settings_max_connections.txt diff --git a/src/go/collectors/go.d.plugin/modules/postgres/testdata/v14.4/settings_max_locks_held.txt b/src/go/plugin/go.d/modules/postgres/testdata/v14.4/settings_max_locks_held.txt index e72bd71aa..e72bd71aa 100644 --- a/src/go/collectors/go.d.plugin/modules/postgres/testdata/v14.4/settings_max_locks_held.txt +++ b/src/go/plugin/go.d/modules/postgres/testdata/v14.4/settings_max_locks_held.txt diff --git a/src/go/collectors/go.d.plugin/modules/postgres/testdata/v14.4/stat_user_indexes_db_postgres.txt b/src/go/plugin/go.d/modules/postgres/testdata/v14.4/stat_user_indexes_db_postgres.txt index db73fa4e6..db73fa4e6 100644 --- a/src/go/collectors/go.d.plugin/modules/postgres/testdata/v14.4/stat_user_indexes_db_postgres.txt +++ b/src/go/plugin/go.d/modules/postgres/testdata/v14.4/stat_user_indexes_db_postgres.txt diff --git a/src/go/collectors/go.d.plugin/modules/postgres/testdata/v14.4/stat_user_tables_db_postgres.txt b/src/go/plugin/go.d/modules/postgres/testdata/v14.4/stat_user_tables_db_postgres.txt index f6f9edb04..f6f9edb04 100644 --- a/src/go/collectors/go.d.plugin/modules/postgres/testdata/v14.4/stat_user_tables_db_postgres.txt +++ b/src/go/plugin/go.d/modules/postgres/testdata/v14.4/stat_user_tables_db_postgres.txt diff --git a/src/go/collectors/go.d.plugin/modules/postgres/testdata/v14.4/statio_user_tables_db_postgres.txt b/src/go/plugin/go.d/modules/postgres/testdata/v14.4/statio_user_tables_db_postgres.txt index f52b1806b..f52b1806b 100644 --- a/src/go/collectors/go.d.plugin/modules/postgres/testdata/v14.4/statio_user_tables_db_postgres.txt +++ b/src/go/plugin/go.d/modules/postgres/testdata/v14.4/statio_user_tables_db_postgres.txt diff --git a/src/go/collectors/go.d.plugin/modules/postgres/testdata/v14.4/table_columns_stats.txt b/src/go/plugin/go.d/modules/postgres/testdata/v14.4/table_columns_stats.txt index 645d847d0..645d847d0 100644 --- a/src/go/collectors/go.d.plugin/modules/postgres/testdata/v14.4/table_columns_stats.txt +++ b/src/go/plugin/go.d/modules/postgres/testdata/v14.4/table_columns_stats.txt diff --git a/src/go/collectors/go.d.plugin/modules/postgres/testdata/v14.4/txid_wraparound.txt b/src/go/plugin/go.d/modules/postgres/testdata/v14.4/txid_wraparound.txt index 9e05f12ab..9e05f12ab 100644 --- a/src/go/collectors/go.d.plugin/modules/postgres/testdata/v14.4/txid_wraparound.txt +++ b/src/go/plugin/go.d/modules/postgres/testdata/v14.4/txid_wraparound.txt diff --git a/src/go/collectors/go.d.plugin/modules/postgres/testdata/v14.4/uptime.txt b/src/go/plugin/go.d/modules/postgres/testdata/v14.4/uptime.txt index 95464bc3c..95464bc3c 100644 --- a/src/go/collectors/go.d.plugin/modules/postgres/testdata/v14.4/uptime.txt +++ b/src/go/plugin/go.d/modules/postgres/testdata/v14.4/uptime.txt diff --git a/src/go/collectors/go.d.plugin/modules/postgres/testdata/v14.4/wal_archive_files.txt b/src/go/plugin/go.d/modules/postgres/testdata/v14.4/wal_archive_files.txt index 8b7a86261..8b7a86261 100644 --- a/src/go/collectors/go.d.plugin/modules/postgres/testdata/v14.4/wal_archive_files.txt +++ b/src/go/plugin/go.d/modules/postgres/testdata/v14.4/wal_archive_files.txt diff --git a/src/go/collectors/go.d.plugin/modules/postgres/testdata/v14.4/wal_files.txt b/src/go/plugin/go.d/modules/postgres/testdata/v14.4/wal_files.txt index f18aefdcd..f18aefdcd 100644 --- a/src/go/collectors/go.d.plugin/modules/postgres/testdata/v14.4/wal_files.txt +++ b/src/go/plugin/go.d/modules/postgres/testdata/v14.4/wal_files.txt diff --git a/src/go/collectors/go.d.plugin/modules/postgres/testdata/v14.4/wal_writes.txt b/src/go/plugin/go.d/modules/postgres/testdata/v14.4/wal_writes.txt index 3bb8f9e95..3bb8f9e95 100644 --- a/src/go/collectors/go.d.plugin/modules/postgres/testdata/v14.4/wal_writes.txt +++ b/src/go/plugin/go.d/modules/postgres/testdata/v14.4/wal_writes.txt diff --git a/src/go/collectors/go.d.plugin/modules/postgres/testdata/v14.4/xact_query_running_time.txt b/src/go/plugin/go.d/modules/postgres/testdata/v14.4/xact_query_running_time.txt index 52617f748..52617f748 100644 --- a/src/go/collectors/go.d.plugin/modules/postgres/testdata/v14.4/xact_query_running_time.txt +++ b/src/go/plugin/go.d/modules/postgres/testdata/v14.4/xact_query_running_time.txt diff --git a/src/go/collectors/go.d.plugin/modules/powerdns/README.md b/src/go/plugin/go.d/modules/powerdns/README.md index 3e5989715..3e5989715 120000 --- a/src/go/collectors/go.d.plugin/modules/powerdns/README.md +++ b/src/go/plugin/go.d/modules/powerdns/README.md diff --git a/src/go/collectors/go.d.plugin/modules/powerdns/authoritativens.go b/src/go/plugin/go.d/modules/powerdns/authoritativens.go index 55b5b8113..b9c02b86f 100644 --- a/src/go/collectors/go.d.plugin/modules/powerdns/authoritativens.go +++ b/src/go/plugin/go.d/modules/powerdns/authoritativens.go @@ -8,8 +8,8 @@ import ( "net/http" "time" - "github.com/netdata/netdata/go/go.d.plugin/agent/module" - "github.com/netdata/netdata/go/go.d.plugin/pkg/web" + "github.com/netdata/netdata/go/plugins/plugin/go.d/agent/module" + "github.com/netdata/netdata/go/plugins/plugin/go.d/pkg/web" ) //go:embed "config_schema.json" diff --git a/src/go/collectors/go.d.plugin/modules/powerdns/authoritativens_test.go b/src/go/plugin/go.d/modules/powerdns/authoritativens_test.go index ddf68467c..d506c9778 100644 --- a/src/go/collectors/go.d.plugin/modules/powerdns/authoritativens_test.go +++ b/src/go/plugin/go.d/modules/powerdns/authoritativens_test.go @@ -8,9 +8,9 @@ import ( "os" "testing" - "github.com/netdata/netdata/go/go.d.plugin/agent/module" - "github.com/netdata/netdata/go/go.d.plugin/pkg/tlscfg" - "github.com/netdata/netdata/go/go.d.plugin/pkg/web" + "github.com/netdata/netdata/go/plugins/plugin/go.d/agent/module" + "github.com/netdata/netdata/go/plugins/plugin/go.d/pkg/tlscfg" + "github.com/netdata/netdata/go/plugins/plugin/go.d/pkg/web" "github.com/stretchr/testify/assert" "github.com/stretchr/testify/require" diff --git a/src/go/collectors/go.d.plugin/modules/powerdns/charts.go b/src/go/plugin/go.d/modules/powerdns/charts.go index 119ca4a2e..331a94a21 100644 --- a/src/go/collectors/go.d.plugin/modules/powerdns/charts.go +++ b/src/go/plugin/go.d/modules/powerdns/charts.go @@ -2,7 +2,7 @@ package powerdns -import "github.com/netdata/netdata/go/go.d.plugin/agent/module" +import "github.com/netdata/netdata/go/plugins/plugin/go.d/agent/module" var charts = module.Charts{ { diff --git a/src/go/collectors/go.d.plugin/modules/powerdns/collect.go b/src/go/plugin/go.d/modules/powerdns/collect.go index 359d41980..c2831e0f2 100644 --- a/src/go/collectors/go.d.plugin/modules/powerdns/collect.go +++ b/src/go/plugin/go.d/modules/powerdns/collect.go @@ -10,7 +10,7 @@ import ( "net/http" "strconv" - "github.com/netdata/netdata/go/go.d.plugin/pkg/web" + "github.com/netdata/netdata/go/plugins/plugin/go.d/pkg/web" ) const ( @@ -65,8 +65,7 @@ func (ns *AuthoritativeNS) collectStatistics(collected map[string]int64, statist } func (ns *AuthoritativeNS) scrapeStatistics() ([]statisticMetric, error) { - req, _ := web.NewHTTPRequest(ns.Request) - req.URL.Path = urlPathLocalStatistics + req, _ := web.NewHTTPRequestWithPath(ns.Request, urlPathLocalStatistics) var statistics statisticMetrics if err := ns.doOKDecode(req, &statistics); err != nil { diff --git a/src/go/collectors/go.d.plugin/modules/powerdns/config_schema.json b/src/go/plugin/go.d/modules/powerdns/config_schema.json index 53c1c3137..2ec6565c1 100644 --- a/src/go/collectors/go.d.plugin/modules/powerdns/config_schema.json +++ b/src/go/plugin/go.d/modules/powerdns/config_schema.json @@ -167,6 +167,12 @@ "timeout": { "ui:help": "Accepts decimals for precise control (e.g., type 1.5 for 1.5 seconds)." }, + "username": { + "ui:widget": "password" + }, + "proxy_username": { + "ui:widget": "password" + }, "password": { "ui:widget": "password" }, diff --git a/src/go/collectors/go.d.plugin/modules/powerdns/init.go b/src/go/plugin/go.d/modules/powerdns/init.go index 9190f7e41..0819459fe 100644 --- a/src/go/collectors/go.d.plugin/modules/powerdns/init.go +++ b/src/go/plugin/go.d/modules/powerdns/init.go @@ -6,8 +6,8 @@ import ( "errors" "net/http" - "github.com/netdata/netdata/go/go.d.plugin/agent/module" - "github.com/netdata/netdata/go/go.d.plugin/pkg/web" + "github.com/netdata/netdata/go/plugins/plugin/go.d/agent/module" + "github.com/netdata/netdata/go/plugins/plugin/go.d/pkg/web" ) func (ns *AuthoritativeNS) validateConfig() error { diff --git a/src/go/collectors/go.d.plugin/modules/powerdns/integrations/powerdns_authoritative_server.md b/src/go/plugin/go.d/modules/powerdns/integrations/powerdns_authoritative_server.md index f768dec50..b4060a613 100644 --- a/src/go/collectors/go.d.plugin/modules/powerdns/integrations/powerdns_authoritative_server.md +++ b/src/go/plugin/go.d/modules/powerdns/integrations/powerdns_authoritative_server.md @@ -1,6 +1,6 @@ <!--startmeta -custom_edit_url: "https://github.com/netdata/netdata/edit/master/src/go/collectors/go.d.plugin/modules/powerdns/README.md" -meta_yaml: "https://github.com/netdata/netdata/edit/master/src/go/collectors/go.d.plugin/modules/powerdns/metadata.yaml" +custom_edit_url: "https://github.com/netdata/netdata/edit/master/src/go/plugin/go.d/modules/powerdns/README.md" +meta_yaml: "https://github.com/netdata/netdata/edit/master/src/go/plugin/go.d/modules/powerdns/metadata.yaml" sidebar_label: "PowerDNS Authoritative Server" learn_status: "Published" learn_rel_path: "Collecting Metrics/DNS and DHCP Servers" @@ -198,6 +198,8 @@ jobs: ### Debug Mode +**Important**: Debug mode is not supported for data collection jobs created via the UI using the Dyncfg feature. + To troubleshoot issues with the `powerdns` collector, run the `go.d.plugin` with the debug option enabled. The output should give you clues as to why the collector isn't working. @@ -220,4 +222,37 @@ should give you clues as to why the collector isn't working. ./go.d.plugin -d -m powerdns ``` +### Getting Logs + +If you're encountering problems with the `powerdns` collector, follow these steps to retrieve logs and identify potential issues: + +- **Run the command** specific to your system (systemd, non-systemd, or Docker container). +- **Examine the output** for any warnings or error messages that might indicate issues. These messages should provide clues about the root cause of the problem. + +#### System with systemd + +Use the following command to view logs generated since the last Netdata service restart: + +```bash +journalctl _SYSTEMD_INVOCATION_ID="$(systemctl show --value --property=InvocationID netdata)" --namespace=netdata --grep powerdns +``` + +#### System without systemd + +Locate the collector log file, typically at `/var/log/netdata/collector.log`, and use `grep` to filter for collector's name: + +```bash +grep powerdns /var/log/netdata/collector.log +``` + +**Note**: This method shows logs from all restarts. Focus on the **latest entries** for troubleshooting current issues. + +#### Docker Container + +If your Netdata runs in a Docker container named "netdata" (replace if different), use this command: + +```bash +docker logs netdata 2>&1 | grep powerdns +``` + diff --git a/src/go/collectors/go.d.plugin/modules/powerdns/metadata.yaml b/src/go/plugin/go.d/modules/powerdns/metadata.yaml index ea4dec0b5..ea4dec0b5 100644 --- a/src/go/collectors/go.d.plugin/modules/powerdns/metadata.yaml +++ b/src/go/plugin/go.d/modules/powerdns/metadata.yaml diff --git a/src/go/collectors/go.d.plugin/modules/powerdns/metrics.go b/src/go/plugin/go.d/modules/powerdns/metrics.go index 3efa2c980..3efa2c980 100644 --- a/src/go/collectors/go.d.plugin/modules/powerdns/metrics.go +++ b/src/go/plugin/go.d/modules/powerdns/metrics.go diff --git a/src/go/collectors/go.d.plugin/modules/rspamd/testdata/config.json b/src/go/plugin/go.d/modules/powerdns/testdata/config.json index 984c3ed6e..984c3ed6e 100644 --- a/src/go/collectors/go.d.plugin/modules/rspamd/testdata/config.json +++ b/src/go/plugin/go.d/modules/powerdns/testdata/config.json diff --git a/src/go/collectors/go.d.plugin/modules/rspamd/testdata/config.yaml b/src/go/plugin/go.d/modules/powerdns/testdata/config.yaml index 8558b61cc..8558b61cc 100644 --- a/src/go/collectors/go.d.plugin/modules/rspamd/testdata/config.yaml +++ b/src/go/plugin/go.d/modules/powerdns/testdata/config.yaml diff --git a/src/go/collectors/go.d.plugin/modules/powerdns/testdata/recursor/statistics.json b/src/go/plugin/go.d/modules/powerdns/testdata/recursor/statistics.json index a31477959..a31477959 100644 --- a/src/go/collectors/go.d.plugin/modules/powerdns/testdata/recursor/statistics.json +++ b/src/go/plugin/go.d/modules/powerdns/testdata/recursor/statistics.json diff --git a/src/go/collectors/go.d.plugin/modules/powerdns/testdata/v4.3.0/statistics.json b/src/go/plugin/go.d/modules/powerdns/testdata/v4.3.0/statistics.json index 30813d3d8..30813d3d8 100644 --- a/src/go/collectors/go.d.plugin/modules/powerdns/testdata/v4.3.0/statistics.json +++ b/src/go/plugin/go.d/modules/powerdns/testdata/v4.3.0/statistics.json diff --git a/src/go/collectors/go.d.plugin/modules/powerdns_recursor/README.md b/src/go/plugin/go.d/modules/powerdns_recursor/README.md index 810e63308..810e63308 120000 --- a/src/go/collectors/go.d.plugin/modules/powerdns_recursor/README.md +++ b/src/go/plugin/go.d/modules/powerdns_recursor/README.md diff --git a/src/go/collectors/go.d.plugin/modules/powerdns_recursor/charts.go b/src/go/plugin/go.d/modules/powerdns_recursor/charts.go index d0bd7c36e..ea63fd1c3 100644 --- a/src/go/collectors/go.d.plugin/modules/powerdns_recursor/charts.go +++ b/src/go/plugin/go.d/modules/powerdns_recursor/charts.go @@ -2,7 +2,7 @@ package powerdns_recursor -import "github.com/netdata/netdata/go/go.d.plugin/agent/module" +import "github.com/netdata/netdata/go/plugins/plugin/go.d/agent/module" var charts = module.Charts{ { diff --git a/src/go/collectors/go.d.plugin/modules/powerdns_recursor/collect.go b/src/go/plugin/go.d/modules/powerdns_recursor/collect.go index ec2e99c90..784093ccf 100644 --- a/src/go/collectors/go.d.plugin/modules/powerdns_recursor/collect.go +++ b/src/go/plugin/go.d/modules/powerdns_recursor/collect.go @@ -10,7 +10,7 @@ import ( "net/http" "strconv" - "github.com/netdata/netdata/go/go.d.plugin/pkg/web" + "github.com/netdata/netdata/go/plugins/plugin/go.d/pkg/web" ) const ( @@ -65,8 +65,7 @@ func (r *Recursor) collectStatistics(collected map[string]int64, statistics stat } func (r *Recursor) scrapeStatistics() ([]statisticMetric, error) { - req, _ := web.NewHTTPRequest(r.Request) - req.URL.Path = urlPathLocalStatistics + req, _ := web.NewHTTPRequestWithPath(r.Request, urlPathLocalStatistics) var statistics statisticMetrics if err := r.doOKDecode(req, &statistics); err != nil { diff --git a/src/go/collectors/go.d.plugin/modules/powerdns_recursor/config_schema.json b/src/go/plugin/go.d/modules/powerdns_recursor/config_schema.json index f175548ba..1b76938ce 100644 --- a/src/go/collectors/go.d.plugin/modules/powerdns_recursor/config_schema.json +++ b/src/go/plugin/go.d/modules/powerdns_recursor/config_schema.json @@ -167,6 +167,12 @@ "timeout": { "ui:help": "Accepts decimals for precise control (e.g., type 1.5 for 1.5 seconds)." }, + "username": { + "ui:widget": "password" + }, + "proxy_username": { + "ui:widget": "password" + }, "password": { "ui:widget": "password" }, diff --git a/src/go/collectors/go.d.plugin/modules/powerdns_recursor/init.go b/src/go/plugin/go.d/modules/powerdns_recursor/init.go index d242950f5..cadc6d2c2 100644 --- a/src/go/collectors/go.d.plugin/modules/powerdns_recursor/init.go +++ b/src/go/plugin/go.d/modules/powerdns_recursor/init.go @@ -6,8 +6,8 @@ import ( "errors" "net/http" - "github.com/netdata/netdata/go/go.d.plugin/agent/module" - "github.com/netdata/netdata/go/go.d.plugin/pkg/web" + "github.com/netdata/netdata/go/plugins/plugin/go.d/agent/module" + "github.com/netdata/netdata/go/plugins/plugin/go.d/pkg/web" ) func (r *Recursor) validateConfig() error { diff --git a/src/go/collectors/go.d.plugin/modules/powerdns_recursor/integrations/powerdns_recursor.md b/src/go/plugin/go.d/modules/powerdns_recursor/integrations/powerdns_recursor.md index 4821aac5d..68a3da0a9 100644 --- a/src/go/collectors/go.d.plugin/modules/powerdns_recursor/integrations/powerdns_recursor.md +++ b/src/go/plugin/go.d/modules/powerdns_recursor/integrations/powerdns_recursor.md @@ -1,6 +1,6 @@ <!--startmeta -custom_edit_url: "https://github.com/netdata/netdata/edit/master/src/go/collectors/go.d.plugin/modules/powerdns_recursor/README.md" -meta_yaml: "https://github.com/netdata/netdata/edit/master/src/go/collectors/go.d.plugin/modules/powerdns_recursor/metadata.yaml" +custom_edit_url: "https://github.com/netdata/netdata/edit/master/src/go/plugin/go.d/modules/powerdns_recursor/README.md" +meta_yaml: "https://github.com/netdata/netdata/edit/master/src/go/plugin/go.d/modules/powerdns_recursor/metadata.yaml" sidebar_label: "PowerDNS Recursor" learn_status: "Published" learn_rel_path: "Collecting Metrics/DNS and DHCP Servers" @@ -201,6 +201,8 @@ jobs: ### Debug Mode +**Important**: Debug mode is not supported for data collection jobs created via the UI using the Dyncfg feature. + To troubleshoot issues with the `powerdns_recursor` collector, run the `go.d.plugin` with the debug option enabled. The output should give you clues as to why the collector isn't working. @@ -223,4 +225,37 @@ should give you clues as to why the collector isn't working. ./go.d.plugin -d -m powerdns_recursor ``` +### Getting Logs + +If you're encountering problems with the `powerdns_recursor` collector, follow these steps to retrieve logs and identify potential issues: + +- **Run the command** specific to your system (systemd, non-systemd, or Docker container). +- **Examine the output** for any warnings or error messages that might indicate issues. These messages should provide clues about the root cause of the problem. + +#### System with systemd + +Use the following command to view logs generated since the last Netdata service restart: + +```bash +journalctl _SYSTEMD_INVOCATION_ID="$(systemctl show --value --property=InvocationID netdata)" --namespace=netdata --grep powerdns_recursor +``` + +#### System without systemd + +Locate the collector log file, typically at `/var/log/netdata/collector.log`, and use `grep` to filter for collector's name: + +```bash +grep powerdns_recursor /var/log/netdata/collector.log +``` + +**Note**: This method shows logs from all restarts. Focus on the **latest entries** for troubleshooting current issues. + +#### Docker Container + +If your Netdata runs in a Docker container named "netdata" (replace if different), use this command: + +```bash +docker logs netdata 2>&1 | grep powerdns_recursor +``` + diff --git a/src/go/collectors/go.d.plugin/modules/powerdns_recursor/metadata.yaml b/src/go/plugin/go.d/modules/powerdns_recursor/metadata.yaml index 82cb99127..82cb99127 100644 --- a/src/go/collectors/go.d.plugin/modules/powerdns_recursor/metadata.yaml +++ b/src/go/plugin/go.d/modules/powerdns_recursor/metadata.yaml diff --git a/src/go/collectors/go.d.plugin/modules/powerdns_recursor/metrics.go b/src/go/plugin/go.d/modules/powerdns_recursor/metrics.go index a7fbd63c1..a7fbd63c1 100644 --- a/src/go/collectors/go.d.plugin/modules/powerdns_recursor/metrics.go +++ b/src/go/plugin/go.d/modules/powerdns_recursor/metrics.go diff --git a/src/go/collectors/go.d.plugin/modules/powerdns_recursor/recursor.go b/src/go/plugin/go.d/modules/powerdns_recursor/recursor.go index ec5d8da6d..4b9c3e72f 100644 --- a/src/go/collectors/go.d.plugin/modules/powerdns_recursor/recursor.go +++ b/src/go/plugin/go.d/modules/powerdns_recursor/recursor.go @@ -8,8 +8,8 @@ import ( "net/http" "time" - "github.com/netdata/netdata/go/go.d.plugin/agent/module" - "github.com/netdata/netdata/go/go.d.plugin/pkg/web" + "github.com/netdata/netdata/go/plugins/plugin/go.d/agent/module" + "github.com/netdata/netdata/go/plugins/plugin/go.d/pkg/web" ) //go:embed "config_schema.json" diff --git a/src/go/collectors/go.d.plugin/modules/powerdns_recursor/recursor_test.go b/src/go/plugin/go.d/modules/powerdns_recursor/recursor_test.go index f4ab0535f..09475e223 100644 --- a/src/go/collectors/go.d.plugin/modules/powerdns_recursor/recursor_test.go +++ b/src/go/plugin/go.d/modules/powerdns_recursor/recursor_test.go @@ -8,9 +8,9 @@ import ( "os" "testing" - "github.com/netdata/netdata/go/go.d.plugin/agent/module" - "github.com/netdata/netdata/go/go.d.plugin/pkg/tlscfg" - "github.com/netdata/netdata/go/go.d.plugin/pkg/web" + "github.com/netdata/netdata/go/plugins/plugin/go.d/agent/module" + "github.com/netdata/netdata/go/plugins/plugin/go.d/pkg/tlscfg" + "github.com/netdata/netdata/go/plugins/plugin/go.d/pkg/web" "github.com/stretchr/testify/assert" "github.com/stretchr/testify/require" diff --git a/src/go/collectors/go.d.plugin/modules/powerdns_recursor/testdata/authoritative/statistics.json b/src/go/plugin/go.d/modules/powerdns_recursor/testdata/authoritative/statistics.json index 72bb2f0a2..72bb2f0a2 100644 --- a/src/go/collectors/go.d.plugin/modules/powerdns_recursor/testdata/authoritative/statistics.json +++ b/src/go/plugin/go.d/modules/powerdns_recursor/testdata/authoritative/statistics.json diff --git a/src/go/collectors/go.d.plugin/modules/scaleio/testdata/config.json b/src/go/plugin/go.d/modules/powerdns_recursor/testdata/config.json index 984c3ed6e..984c3ed6e 100644 --- a/src/go/collectors/go.d.plugin/modules/scaleio/testdata/config.json +++ b/src/go/plugin/go.d/modules/powerdns_recursor/testdata/config.json diff --git a/src/go/collectors/go.d.plugin/modules/scaleio/testdata/config.yaml b/src/go/plugin/go.d/modules/powerdns_recursor/testdata/config.yaml index 8558b61cc..8558b61cc 100644 --- a/src/go/collectors/go.d.plugin/modules/scaleio/testdata/config.yaml +++ b/src/go/plugin/go.d/modules/powerdns_recursor/testdata/config.yaml diff --git a/src/go/collectors/go.d.plugin/modules/powerdns_recursor/testdata/v4.3.1/statistics.json b/src/go/plugin/go.d/modules/powerdns_recursor/testdata/v4.3.1/statistics.json index a31477959..a31477959 100644 --- a/src/go/collectors/go.d.plugin/modules/powerdns_recursor/testdata/v4.3.1/statistics.json +++ b/src/go/plugin/go.d/modules/powerdns_recursor/testdata/v4.3.1/statistics.json diff --git a/src/go/collectors/go.d.plugin/modules/prometheus/README.md b/src/go/plugin/go.d/modules/prometheus/README.md index 13e59d14d..13e59d14d 120000 --- a/src/go/collectors/go.d.plugin/modules/prometheus/README.md +++ b/src/go/plugin/go.d/modules/prometheus/README.md diff --git a/src/go/collectors/go.d.plugin/modules/prometheus/cache.go b/src/go/plugin/go.d/modules/prometheus/cache.go index 7fc34f8c6..12a4d24f9 100644 --- a/src/go/collectors/go.d.plugin/modules/prometheus/cache.go +++ b/src/go/plugin/go.d/modules/prometheus/cache.go @@ -3,7 +3,7 @@ package prometheus import ( - "github.com/netdata/netdata/go/go.d.plugin/agent/module" + "github.com/netdata/netdata/go/plugins/plugin/go.d/agent/module" ) func newCache() *cache { diff --git a/src/go/collectors/go.d.plugin/modules/prometheus/charts.go b/src/go/plugin/go.d/modules/prometheus/charts.go index f0e7226bb..c78f9b1b0 100644 --- a/src/go/collectors/go.d.plugin/modules/prometheus/charts.go +++ b/src/go/plugin/go.d/modules/prometheus/charts.go @@ -6,8 +6,8 @@ import ( "fmt" "strings" - "github.com/netdata/netdata/go/go.d.plugin/agent/module" - "github.com/netdata/netdata/go/go.d.plugin/pkg/prometheus" + "github.com/netdata/netdata/go/plugins/plugin/go.d/agent/module" + "github.com/netdata/netdata/go/plugins/plugin/go.d/pkg/prometheus" "github.com/prometheus/prometheus/model/labels" ) diff --git a/src/go/collectors/go.d.plugin/modules/prometheus/collect.go b/src/go/plugin/go.d/modules/prometheus/collect.go index a6df302fa..8711745c9 100644 --- a/src/go/collectors/go.d.plugin/modules/prometheus/collect.go +++ b/src/go/plugin/go.d/modules/prometheus/collect.go @@ -8,7 +8,7 @@ import ( "strconv" "strings" - "github.com/netdata/netdata/go/go.d.plugin/pkg/prometheus" + "github.com/netdata/netdata/go/plugins/plugin/go.d/pkg/prometheus" "github.com/prometheus/common/model" "github.com/prometheus/prometheus/model/labels" diff --git a/src/go/collectors/go.d.plugin/modules/prometheus/config_schema.json b/src/go/plugin/go.d/modules/prometheus/config_schema.json index 10d1a2bea..2df96b049 100644 --- a/src/go/collectors/go.d.plugin/modules/prometheus/config_schema.json +++ b/src/go/plugin/go.d/modules/prometheus/config_schema.json @@ -49,7 +49,7 @@ "properties": { "allow": { "title": "Allow", - "description": "Allow time series that match any of the specified [selectors](https://github.com/netdata/netdata/tree/master/src/go/collectors/go.d.plugin/pkg/prometheus/selector#readme).", + "description": "Allow time series that match any of the specified [selectors](https://github.com/netdata/netdata/tree/master/src/go/plugin/go.d/pkg/prometheus/selector#readme).", "type": [ "array", "null" @@ -62,7 +62,7 @@ }, "deny": { "title": "Deny", - "description": "Deny time series that match any of the specified [selectors](https://github.com/netdata/netdata/tree/master/src/go/collectors/go.d.plugin/pkg/prometheus/selector#readme).", + "description": "Deny time series that match any of the specified [selectors](https://github.com/netdata/netdata/tree/master/src/go/plugin/go.d/pkg/prometheus/selector#readme).", "type": [ "array", "null" @@ -289,6 +289,12 @@ "selector": { "ui:help": "The logic is as follows: `(allow1 OR allow2) AND !(deny1 OR deny2)`." }, + "username": { + "ui:widget": "password" + }, + "proxy_username": { + "ui:widget": "password" + }, "password": { "ui:widget": "password" }, diff --git a/src/go/collectors/go.d.plugin/modules/prometheus/init.go b/src/go/plugin/go.d/modules/prometheus/init.go index f5cc8bca9..afb92af32 100644 --- a/src/go/collectors/go.d.plugin/modules/prometheus/init.go +++ b/src/go/plugin/go.d/modules/prometheus/init.go @@ -7,9 +7,9 @@ import ( "fmt" "os" - "github.com/netdata/netdata/go/go.d.plugin/pkg/matcher" - "github.com/netdata/netdata/go/go.d.plugin/pkg/prometheus" - "github.com/netdata/netdata/go/go.d.plugin/pkg/web" + "github.com/netdata/netdata/go/plugins/plugin/go.d/pkg/matcher" + "github.com/netdata/netdata/go/plugins/plugin/go.d/pkg/prometheus" + "github.com/netdata/netdata/go/plugins/plugin/go.d/pkg/web" ) func (p *Prometheus) validateConfig() error { diff --git a/src/go/collectors/go.d.plugin/modules/prometheus/integrations/4d_server.md b/src/go/plugin/go.d/modules/prometheus/integrations/4d_server.md index ce9241546..479fbe132 100644 --- a/src/go/collectors/go.d.plugin/modules/prometheus/integrations/4d_server.md +++ b/src/go/plugin/go.d/modules/prometheus/integrations/4d_server.md @@ -1,6 +1,6 @@ <!--startmeta -custom_edit_url: "https://github.com/netdata/netdata/edit/master/src/go/collectors/go.d.plugin/modules/prometheus/integrations/4d_server.md" -meta_yaml: "https://github.com/netdata/netdata/edit/master/src/go/collectors/go.d.plugin/modules/prometheus/metadata.yaml" +custom_edit_url: "https://github.com/netdata/netdata/edit/master/src/go/plugin/go.d/modules/prometheus/integrations/4d_server.md" +meta_yaml: "https://github.com/netdata/netdata/edit/master/src/go/plugin/go.d/modules/prometheus/metadata.yaml" sidebar_label: "4D Server" learn_status: "Published" learn_rel_path: "Collecting Metrics/Databases" @@ -37,7 +37,6 @@ This collector supports collecting metrics from multiple instances of this integ #### Auto-Detection By default, it detects instances running on the local host by trying to connect to known ports that are [allocated to exporters](https://github.com/prometheus/prometheus/wiki/Default-port-allocations). -The full list of endpoints is available in the collector's [configuration file](https://github.com/netdata/netdata/blob/master/src/go/collectors/go.d.plugin/config/go.d/prometheus.conf). #### Limits @@ -138,7 +137,7 @@ The following options can be defined globally: update_every, autodetection_retry This option allows you to filter out unwanted time series. Only metrics matching the selector will be collected. - Logic: (pattern1 OR pattern2) AND !(pattern3 or pattern4) -- Pattern syntax: [selector](/src/go/collectors/go.d.plugin/pkg/prometheus/selector/README.md). +- Pattern syntax: [selector](/src/go/plugin/go.d/pkg/prometheus/selector/README.md). - Option syntax: ```yaml @@ -266,6 +265,8 @@ jobs: ### Debug Mode +**Important**: Debug mode is not supported for data collection jobs created via the UI using the Dyncfg feature. + To troubleshoot issues with the `prometheus` collector, run the `go.d.plugin` with the debug option enabled. The output should give you clues as to why the collector isn't working. @@ -288,4 +289,37 @@ should give you clues as to why the collector isn't working. ./go.d.plugin -d -m prometheus ``` +### Getting Logs + +If you're encountering problems with the `prometheus` collector, follow these steps to retrieve logs and identify potential issues: + +- **Run the command** specific to your system (systemd, non-systemd, or Docker container). +- **Examine the output** for any warnings or error messages that might indicate issues. These messages should provide clues about the root cause of the problem. + +#### System with systemd + +Use the following command to view logs generated since the last Netdata service restart: + +```bash +journalctl _SYSTEMD_INVOCATION_ID="$(systemctl show --value --property=InvocationID netdata)" --namespace=netdata --grep prometheus +``` + +#### System without systemd + +Locate the collector log file, typically at `/var/log/netdata/collector.log`, and use `grep` to filter for collector's name: + +```bash +grep prometheus /var/log/netdata/collector.log +``` + +**Note**: This method shows logs from all restarts. Focus on the **latest entries** for troubleshooting current issues. + +#### Docker Container + +If your Netdata runs in a Docker container named "netdata" (replace if different), use this command: + +```bash +docker logs netdata 2>&1 | grep prometheus +``` + diff --git a/src/go/collectors/go.d.plugin/modules/prometheus/integrations/8430ft_modem.md b/src/go/plugin/go.d/modules/prometheus/integrations/8430ft_modem.md index 9e419e180..d5087d8c1 100644 --- a/src/go/collectors/go.d.plugin/modules/prometheus/integrations/8430ft_modem.md +++ b/src/go/plugin/go.d/modules/prometheus/integrations/8430ft_modem.md @@ -1,6 +1,6 @@ <!--startmeta -custom_edit_url: "https://github.com/netdata/netdata/edit/master/src/go/collectors/go.d.plugin/modules/prometheus/integrations/8430ft_modem.md" -meta_yaml: "https://github.com/netdata/netdata/edit/master/src/go/collectors/go.d.plugin/modules/prometheus/metadata.yaml" +custom_edit_url: "https://github.com/netdata/netdata/edit/master/src/go/plugin/go.d/modules/prometheus/integrations/8430ft_modem.md" +meta_yaml: "https://github.com/netdata/netdata/edit/master/src/go/plugin/go.d/modules/prometheus/metadata.yaml" sidebar_label: "8430FT modem" learn_status: "Published" learn_rel_path: "Collecting Metrics/Networking Stack and Network Interfaces" @@ -37,7 +37,6 @@ This collector supports collecting metrics from multiple instances of this integ #### Auto-Detection By default, it detects instances running on the local host by trying to connect to known ports that are [allocated to exporters](https://github.com/prometheus/prometheus/wiki/Default-port-allocations). -The full list of endpoints is available in the collector's [configuration file](https://github.com/netdata/netdata/blob/master/src/go/collectors/go.d.plugin/config/go.d/prometheus.conf). #### Limits @@ -138,7 +137,7 @@ The following options can be defined globally: update_every, autodetection_retry This option allows you to filter out unwanted time series. Only metrics matching the selector will be collected. - Logic: (pattern1 OR pattern2) AND !(pattern3 or pattern4) -- Pattern syntax: [selector](/src/go/collectors/go.d.plugin/pkg/prometheus/selector/README.md). +- Pattern syntax: [selector](/src/go/plugin/go.d/pkg/prometheus/selector/README.md). - Option syntax: ```yaml @@ -266,6 +265,8 @@ jobs: ### Debug Mode +**Important**: Debug mode is not supported for data collection jobs created via the UI using the Dyncfg feature. + To troubleshoot issues with the `prometheus` collector, run the `go.d.plugin` with the debug option enabled. The output should give you clues as to why the collector isn't working. @@ -288,4 +289,37 @@ should give you clues as to why the collector isn't working. ./go.d.plugin -d -m prometheus ``` +### Getting Logs + +If you're encountering problems with the `prometheus` collector, follow these steps to retrieve logs and identify potential issues: + +- **Run the command** specific to your system (systemd, non-systemd, or Docker container). +- **Examine the output** for any warnings or error messages that might indicate issues. These messages should provide clues about the root cause of the problem. + +#### System with systemd + +Use the following command to view logs generated since the last Netdata service restart: + +```bash +journalctl _SYSTEMD_INVOCATION_ID="$(systemctl show --value --property=InvocationID netdata)" --namespace=netdata --grep prometheus +``` + +#### System without systemd + +Locate the collector log file, typically at `/var/log/netdata/collector.log`, and use `grep` to filter for collector's name: + +```bash +grep prometheus /var/log/netdata/collector.log +``` + +**Note**: This method shows logs from all restarts. Focus on the **latest entries** for troubleshooting current issues. + +#### Docker Container + +If your Netdata runs in a Docker container named "netdata" (replace if different), use this command: + +```bash +docker logs netdata 2>&1 | grep prometheus +``` + diff --git a/src/go/collectors/go.d.plugin/modules/prometheus/integrations/a10_acos_network_devices.md b/src/go/plugin/go.d/modules/prometheus/integrations/a10_acos_network_devices.md index e08fffa28..886572d83 100644 --- a/src/go/collectors/go.d.plugin/modules/prometheus/integrations/a10_acos_network_devices.md +++ b/src/go/plugin/go.d/modules/prometheus/integrations/a10_acos_network_devices.md @@ -1,6 +1,6 @@ <!--startmeta -custom_edit_url: "https://github.com/netdata/netdata/edit/master/src/go/collectors/go.d.plugin/modules/prometheus/integrations/a10_acos_network_devices.md" -meta_yaml: "https://github.com/netdata/netdata/edit/master/src/go/collectors/go.d.plugin/modules/prometheus/metadata.yaml" +custom_edit_url: "https://github.com/netdata/netdata/edit/master/src/go/plugin/go.d/modules/prometheus/integrations/a10_acos_network_devices.md" +meta_yaml: "https://github.com/netdata/netdata/edit/master/src/go/plugin/go.d/modules/prometheus/metadata.yaml" sidebar_label: "A10 ACOS network devices" learn_status: "Published" learn_rel_path: "Collecting Metrics/Networking Stack and Network Interfaces" @@ -37,7 +37,6 @@ This collector supports collecting metrics from multiple instances of this integ #### Auto-Detection By default, it detects instances running on the local host by trying to connect to known ports that are [allocated to exporters](https://github.com/prometheus/prometheus/wiki/Default-port-allocations). -The full list of endpoints is available in the collector's [configuration file](https://github.com/netdata/netdata/blob/master/src/go/collectors/go.d.plugin/config/go.d/prometheus.conf). #### Limits @@ -138,7 +137,7 @@ The following options can be defined globally: update_every, autodetection_retry This option allows you to filter out unwanted time series. Only metrics matching the selector will be collected. - Logic: (pattern1 OR pattern2) AND !(pattern3 or pattern4) -- Pattern syntax: [selector](/src/go/collectors/go.d.plugin/pkg/prometheus/selector/README.md). +- Pattern syntax: [selector](/src/go/plugin/go.d/pkg/prometheus/selector/README.md). - Option syntax: ```yaml @@ -266,6 +265,8 @@ jobs: ### Debug Mode +**Important**: Debug mode is not supported for data collection jobs created via the UI using the Dyncfg feature. + To troubleshoot issues with the `prometheus` collector, run the `go.d.plugin` with the debug option enabled. The output should give you clues as to why the collector isn't working. @@ -288,4 +289,37 @@ should give you clues as to why the collector isn't working. ./go.d.plugin -d -m prometheus ``` +### Getting Logs + +If you're encountering problems with the `prometheus` collector, follow these steps to retrieve logs and identify potential issues: + +- **Run the command** specific to your system (systemd, non-systemd, or Docker container). +- **Examine the output** for any warnings or error messages that might indicate issues. These messages should provide clues about the root cause of the problem. + +#### System with systemd + +Use the following command to view logs generated since the last Netdata service restart: + +```bash +journalctl _SYSTEMD_INVOCATION_ID="$(systemctl show --value --property=InvocationID netdata)" --namespace=netdata --grep prometheus +``` + +#### System without systemd + +Locate the collector log file, typically at `/var/log/netdata/collector.log`, and use `grep` to filter for collector's name: + +```bash +grep prometheus /var/log/netdata/collector.log +``` + +**Note**: This method shows logs from all restarts. Focus on the **latest entries** for troubleshooting current issues. + +#### Docker Container + +If your Netdata runs in a Docker container named "netdata" (replace if different), use this command: + +```bash +docker logs netdata 2>&1 | grep prometheus +``` + diff --git a/src/go/collectors/go.d.plugin/modules/prometheus/integrations/airthings_waveplus_air_sensor.md b/src/go/plugin/go.d/modules/prometheus/integrations/airthings_waveplus_air_sensor.md index 275b8ccaf..d6353d5c4 100644 --- a/src/go/collectors/go.d.plugin/modules/prometheus/integrations/airthings_waveplus_air_sensor.md +++ b/src/go/plugin/go.d/modules/prometheus/integrations/airthings_waveplus_air_sensor.md @@ -1,6 +1,6 @@ <!--startmeta -custom_edit_url: "https://github.com/netdata/netdata/edit/master/src/go/collectors/go.d.plugin/modules/prometheus/integrations/airthings_waveplus_air_sensor.md" -meta_yaml: "https://github.com/netdata/netdata/edit/master/src/go/collectors/go.d.plugin/modules/prometheus/metadata.yaml" +custom_edit_url: "https://github.com/netdata/netdata/edit/master/src/go/plugin/go.d/modules/prometheus/integrations/airthings_waveplus_air_sensor.md" +meta_yaml: "https://github.com/netdata/netdata/edit/master/src/go/plugin/go.d/modules/prometheus/metadata.yaml" sidebar_label: "Airthings Waveplus air sensor" learn_status: "Published" learn_rel_path: "Collecting Metrics/IoT Devices" @@ -37,7 +37,6 @@ This collector supports collecting metrics from multiple instances of this integ #### Auto-Detection By default, it detects instances running on the local host by trying to connect to known ports that are [allocated to exporters](https://github.com/prometheus/prometheus/wiki/Default-port-allocations). -The full list of endpoints is available in the collector's [configuration file](https://github.com/netdata/netdata/blob/master/src/go/collectors/go.d.plugin/config/go.d/prometheus.conf). #### Limits @@ -138,7 +137,7 @@ The following options can be defined globally: update_every, autodetection_retry This option allows you to filter out unwanted time series. Only metrics matching the selector will be collected. - Logic: (pattern1 OR pattern2) AND !(pattern3 or pattern4) -- Pattern syntax: [selector](/src/go/collectors/go.d.plugin/pkg/prometheus/selector/README.md). +- Pattern syntax: [selector](/src/go/plugin/go.d/pkg/prometheus/selector/README.md). - Option syntax: ```yaml @@ -266,6 +265,8 @@ jobs: ### Debug Mode +**Important**: Debug mode is not supported for data collection jobs created via the UI using the Dyncfg feature. + To troubleshoot issues with the `prometheus` collector, run the `go.d.plugin` with the debug option enabled. The output should give you clues as to why the collector isn't working. @@ -288,4 +289,37 @@ should give you clues as to why the collector isn't working. ./go.d.plugin -d -m prometheus ``` +### Getting Logs + +If you're encountering problems with the `prometheus` collector, follow these steps to retrieve logs and identify potential issues: + +- **Run the command** specific to your system (systemd, non-systemd, or Docker container). +- **Examine the output** for any warnings or error messages that might indicate issues. These messages should provide clues about the root cause of the problem. + +#### System with systemd + +Use the following command to view logs generated since the last Netdata service restart: + +```bash +journalctl _SYSTEMD_INVOCATION_ID="$(systemctl show --value --property=InvocationID netdata)" --namespace=netdata --grep prometheus +``` + +#### System without systemd + +Locate the collector log file, typically at `/var/log/netdata/collector.log`, and use `grep` to filter for collector's name: + +```bash +grep prometheus /var/log/netdata/collector.log +``` + +**Note**: This method shows logs from all restarts. Focus on the **latest entries** for troubleshooting current issues. + +#### Docker Container + +If your Netdata runs in a Docker container named "netdata" (replace if different), use this command: + +```bash +docker logs netdata 2>&1 | grep prometheus +``` + diff --git a/src/go/collectors/go.d.plugin/modules/prometheus/integrations/akamai_edge_dns_traffic.md b/src/go/plugin/go.d/modules/prometheus/integrations/akamai_edge_dns_traffic.md index e8e8c8aba..d61275eb6 100644 --- a/src/go/collectors/go.d.plugin/modules/prometheus/integrations/akamai_edge_dns_traffic.md +++ b/src/go/plugin/go.d/modules/prometheus/integrations/akamai_edge_dns_traffic.md @@ -1,6 +1,6 @@ <!--startmeta -custom_edit_url: "https://github.com/netdata/netdata/edit/master/src/go/collectors/go.d.plugin/modules/prometheus/integrations/akamai_edge_dns_traffic.md" -meta_yaml: "https://github.com/netdata/netdata/edit/master/src/go/collectors/go.d.plugin/modules/prometheus/metadata.yaml" +custom_edit_url: "https://github.com/netdata/netdata/edit/master/src/go/plugin/go.d/modules/prometheus/integrations/akamai_edge_dns_traffic.md" +meta_yaml: "https://github.com/netdata/netdata/edit/master/src/go/plugin/go.d/modules/prometheus/metadata.yaml" sidebar_label: "Akamai Edge DNS Traffic" learn_status: "Published" learn_rel_path: "Collecting Metrics/DNS and DHCP Servers" @@ -37,7 +37,6 @@ This collector supports collecting metrics from multiple instances of this integ #### Auto-Detection By default, it detects instances running on the local host by trying to connect to known ports that are [allocated to exporters](https://github.com/prometheus/prometheus/wiki/Default-port-allocations). -The full list of endpoints is available in the collector's [configuration file](https://github.com/netdata/netdata/blob/master/src/go/collectors/go.d.plugin/config/go.d/prometheus.conf). #### Limits @@ -138,7 +137,7 @@ The following options can be defined globally: update_every, autodetection_retry This option allows you to filter out unwanted time series. Only metrics matching the selector will be collected. - Logic: (pattern1 OR pattern2) AND !(pattern3 or pattern4) -- Pattern syntax: [selector](/src/go/collectors/go.d.plugin/pkg/prometheus/selector/README.md). +- Pattern syntax: [selector](/src/go/plugin/go.d/pkg/prometheus/selector/README.md). - Option syntax: ```yaml @@ -266,6 +265,8 @@ jobs: ### Debug Mode +**Important**: Debug mode is not supported for data collection jobs created via the UI using the Dyncfg feature. + To troubleshoot issues with the `prometheus` collector, run the `go.d.plugin` with the debug option enabled. The output should give you clues as to why the collector isn't working. @@ -288,4 +289,37 @@ should give you clues as to why the collector isn't working. ./go.d.plugin -d -m prometheus ``` +### Getting Logs + +If you're encountering problems with the `prometheus` collector, follow these steps to retrieve logs and identify potential issues: + +- **Run the command** specific to your system (systemd, non-systemd, or Docker container). +- **Examine the output** for any warnings or error messages that might indicate issues. These messages should provide clues about the root cause of the problem. + +#### System with systemd + +Use the following command to view logs generated since the last Netdata service restart: + +```bash +journalctl _SYSTEMD_INVOCATION_ID="$(systemctl show --value --property=InvocationID netdata)" --namespace=netdata --grep prometheus +``` + +#### System without systemd + +Locate the collector log file, typically at `/var/log/netdata/collector.log`, and use `grep` to filter for collector's name: + +```bash +grep prometheus /var/log/netdata/collector.log +``` + +**Note**: This method shows logs from all restarts. Focus on the **latest entries** for troubleshooting current issues. + +#### Docker Container + +If your Netdata runs in a Docker container named "netdata" (replace if different), use this command: + +```bash +docker logs netdata 2>&1 | grep prometheus +``` + diff --git a/src/go/collectors/go.d.plugin/modules/prometheus/integrations/akamai_global_traffic_management.md b/src/go/plugin/go.d/modules/prometheus/integrations/akamai_global_traffic_management.md index 1fbd6bf23..6c1dbbf3a 100644 --- a/src/go/collectors/go.d.plugin/modules/prometheus/integrations/akamai_global_traffic_management.md +++ b/src/go/plugin/go.d/modules/prometheus/integrations/akamai_global_traffic_management.md @@ -1,6 +1,6 @@ <!--startmeta -custom_edit_url: "https://github.com/netdata/netdata/edit/master/src/go/collectors/go.d.plugin/modules/prometheus/integrations/akamai_global_traffic_management.md" -meta_yaml: "https://github.com/netdata/netdata/edit/master/src/go/collectors/go.d.plugin/modules/prometheus/metadata.yaml" +custom_edit_url: "https://github.com/netdata/netdata/edit/master/src/go/plugin/go.d/modules/prometheus/integrations/akamai_global_traffic_management.md" +meta_yaml: "https://github.com/netdata/netdata/edit/master/src/go/plugin/go.d/modules/prometheus/metadata.yaml" sidebar_label: "Akamai Global Traffic Management" learn_status: "Published" learn_rel_path: "Collecting Metrics/Cloud Provider Managed" @@ -37,7 +37,6 @@ This collector supports collecting metrics from multiple instances of this integ #### Auto-Detection By default, it detects instances running on the local host by trying to connect to known ports that are [allocated to exporters](https://github.com/prometheus/prometheus/wiki/Default-port-allocations). -The full list of endpoints is available in the collector's [configuration file](https://github.com/netdata/netdata/blob/master/src/go/collectors/go.d.plugin/config/go.d/prometheus.conf). #### Limits @@ -138,7 +137,7 @@ The following options can be defined globally: update_every, autodetection_retry This option allows you to filter out unwanted time series. Only metrics matching the selector will be collected. - Logic: (pattern1 OR pattern2) AND !(pattern3 or pattern4) -- Pattern syntax: [selector](/src/go/collectors/go.d.plugin/pkg/prometheus/selector/README.md). +- Pattern syntax: [selector](/src/go/plugin/go.d/pkg/prometheus/selector/README.md). - Option syntax: ```yaml @@ -266,6 +265,8 @@ jobs: ### Debug Mode +**Important**: Debug mode is not supported for data collection jobs created via the UI using the Dyncfg feature. + To troubleshoot issues with the `prometheus` collector, run the `go.d.plugin` with the debug option enabled. The output should give you clues as to why the collector isn't working. @@ -288,4 +289,37 @@ should give you clues as to why the collector isn't working. ./go.d.plugin -d -m prometheus ``` +### Getting Logs + +If you're encountering problems with the `prometheus` collector, follow these steps to retrieve logs and identify potential issues: + +- **Run the command** specific to your system (systemd, non-systemd, or Docker container). +- **Examine the output** for any warnings or error messages that might indicate issues. These messages should provide clues about the root cause of the problem. + +#### System with systemd + +Use the following command to view logs generated since the last Netdata service restart: + +```bash +journalctl _SYSTEMD_INVOCATION_ID="$(systemctl show --value --property=InvocationID netdata)" --namespace=netdata --grep prometheus +``` + +#### System without systemd + +Locate the collector log file, typically at `/var/log/netdata/collector.log`, and use `grep` to filter for collector's name: + +```bash +grep prometheus /var/log/netdata/collector.log +``` + +**Note**: This method shows logs from all restarts. Focus on the **latest entries** for troubleshooting current issues. + +#### Docker Container + +If your Netdata runs in a Docker container named "netdata" (replace if different), use this command: + +```bash +docker logs netdata 2>&1 | grep prometheus +``` + diff --git a/src/go/collectors/go.d.plugin/modules/prometheus/integrations/akami_cloudmonitor.md b/src/go/plugin/go.d/modules/prometheus/integrations/akami_cloudmonitor.md index 736cf25fa..480892401 100644 --- a/src/go/collectors/go.d.plugin/modules/prometheus/integrations/akami_cloudmonitor.md +++ b/src/go/plugin/go.d/modules/prometheus/integrations/akami_cloudmonitor.md @@ -1,6 +1,6 @@ <!--startmeta -custom_edit_url: "https://github.com/netdata/netdata/edit/master/src/go/collectors/go.d.plugin/modules/prometheus/integrations/akami_cloudmonitor.md" -meta_yaml: "https://github.com/netdata/netdata/edit/master/src/go/collectors/go.d.plugin/modules/prometheus/metadata.yaml" +custom_edit_url: "https://github.com/netdata/netdata/edit/master/src/go/plugin/go.d/modules/prometheus/integrations/akami_cloudmonitor.md" +meta_yaml: "https://github.com/netdata/netdata/edit/master/src/go/plugin/go.d/modules/prometheus/metadata.yaml" sidebar_label: "Akami Cloudmonitor" learn_status: "Published" learn_rel_path: "Collecting Metrics/Cloud Provider Managed" @@ -37,7 +37,6 @@ This collector supports collecting metrics from multiple instances of this integ #### Auto-Detection By default, it detects instances running on the local host by trying to connect to known ports that are [allocated to exporters](https://github.com/prometheus/prometheus/wiki/Default-port-allocations). -The full list of endpoints is available in the collector's [configuration file](https://github.com/netdata/netdata/blob/master/src/go/collectors/go.d.plugin/config/go.d/prometheus.conf). #### Limits @@ -138,7 +137,7 @@ The following options can be defined globally: update_every, autodetection_retry This option allows you to filter out unwanted time series. Only metrics matching the selector will be collected. - Logic: (pattern1 OR pattern2) AND !(pattern3 or pattern4) -- Pattern syntax: [selector](/src/go/collectors/go.d.plugin/pkg/prometheus/selector/README.md). +- Pattern syntax: [selector](/src/go/plugin/go.d/pkg/prometheus/selector/README.md). - Option syntax: ```yaml @@ -266,6 +265,8 @@ jobs: ### Debug Mode +**Important**: Debug mode is not supported for data collection jobs created via the UI using the Dyncfg feature. + To troubleshoot issues with the `prometheus` collector, run the `go.d.plugin` with the debug option enabled. The output should give you clues as to why the collector isn't working. @@ -288,4 +289,37 @@ should give you clues as to why the collector isn't working. ./go.d.plugin -d -m prometheus ``` +### Getting Logs + +If you're encountering problems with the `prometheus` collector, follow these steps to retrieve logs and identify potential issues: + +- **Run the command** specific to your system (systemd, non-systemd, or Docker container). +- **Examine the output** for any warnings or error messages that might indicate issues. These messages should provide clues about the root cause of the problem. + +#### System with systemd + +Use the following command to view logs generated since the last Netdata service restart: + +```bash +journalctl _SYSTEMD_INVOCATION_ID="$(systemctl show --value --property=InvocationID netdata)" --namespace=netdata --grep prometheus +``` + +#### System without systemd + +Locate the collector log file, typically at `/var/log/netdata/collector.log`, and use `grep` to filter for collector's name: + +```bash +grep prometheus /var/log/netdata/collector.log +``` + +**Note**: This method shows logs from all restarts. Focus on the **latest entries** for troubleshooting current issues. + +#### Docker Container + +If your Netdata runs in a Docker container named "netdata" (replace if different), use this command: + +```bash +docker logs netdata 2>&1 | grep prometheus +``` + diff --git a/src/go/collectors/go.d.plugin/modules/prometheus/integrations/alamos_fe2_server.md b/src/go/plugin/go.d/modules/prometheus/integrations/alamos_fe2_server.md index b29363d15..1f5552ac6 100644 --- a/src/go/collectors/go.d.plugin/modules/prometheus/integrations/alamos_fe2_server.md +++ b/src/go/plugin/go.d/modules/prometheus/integrations/alamos_fe2_server.md @@ -1,6 +1,6 @@ <!--startmeta -custom_edit_url: "https://github.com/netdata/netdata/edit/master/src/go/collectors/go.d.plugin/modules/prometheus/integrations/alamos_fe2_server.md" -meta_yaml: "https://github.com/netdata/netdata/edit/master/src/go/collectors/go.d.plugin/modules/prometheus/metadata.yaml" +custom_edit_url: "https://github.com/netdata/netdata/edit/master/src/go/plugin/go.d/modules/prometheus/integrations/alamos_fe2_server.md" +meta_yaml: "https://github.com/netdata/netdata/edit/master/src/go/plugin/go.d/modules/prometheus/metadata.yaml" sidebar_label: "Alamos FE2 server" learn_status: "Published" learn_rel_path: "Collecting Metrics/APM" @@ -37,7 +37,6 @@ This collector supports collecting metrics from multiple instances of this integ #### Auto-Detection By default, it detects instances running on the local host by trying to connect to known ports that are [allocated to exporters](https://github.com/prometheus/prometheus/wiki/Default-port-allocations). -The full list of endpoints is available in the collector's [configuration file](https://github.com/netdata/netdata/blob/master/src/go/collectors/go.d.plugin/config/go.d/prometheus.conf). #### Limits @@ -138,7 +137,7 @@ The following options can be defined globally: update_every, autodetection_retry This option allows you to filter out unwanted time series. Only metrics matching the selector will be collected. - Logic: (pattern1 OR pattern2) AND !(pattern3 or pattern4) -- Pattern syntax: [selector](/src/go/collectors/go.d.plugin/pkg/prometheus/selector/README.md). +- Pattern syntax: [selector](/src/go/plugin/go.d/pkg/prometheus/selector/README.md). - Option syntax: ```yaml @@ -266,6 +265,8 @@ jobs: ### Debug Mode +**Important**: Debug mode is not supported for data collection jobs created via the UI using the Dyncfg feature. + To troubleshoot issues with the `prometheus` collector, run the `go.d.plugin` with the debug option enabled. The output should give you clues as to why the collector isn't working. @@ -288,4 +289,37 @@ should give you clues as to why the collector isn't working. ./go.d.plugin -d -m prometheus ``` +### Getting Logs + +If you're encountering problems with the `prometheus` collector, follow these steps to retrieve logs and identify potential issues: + +- **Run the command** specific to your system (systemd, non-systemd, or Docker container). +- **Examine the output** for any warnings or error messages that might indicate issues. These messages should provide clues about the root cause of the problem. + +#### System with systemd + +Use the following command to view logs generated since the last Netdata service restart: + +```bash +journalctl _SYSTEMD_INVOCATION_ID="$(systemctl show --value --property=InvocationID netdata)" --namespace=netdata --grep prometheus +``` + +#### System without systemd + +Locate the collector log file, typically at `/var/log/netdata/collector.log`, and use `grep` to filter for collector's name: + +```bash +grep prometheus /var/log/netdata/collector.log +``` + +**Note**: This method shows logs from all restarts. Focus on the **latest entries** for troubleshooting current issues. + +#### Docker Container + +If your Netdata runs in a Docker container named "netdata" (replace if different), use this command: + +```bash +docker logs netdata 2>&1 | grep prometheus +``` + diff --git a/src/go/collectors/go.d.plugin/modules/prometheus/integrations/alibaba_cloud.md b/src/go/plugin/go.d/modules/prometheus/integrations/alibaba_cloud.md index ec11ff2fe..51a5203fe 100644 --- a/src/go/collectors/go.d.plugin/modules/prometheus/integrations/alibaba_cloud.md +++ b/src/go/plugin/go.d/modules/prometheus/integrations/alibaba_cloud.md @@ -1,6 +1,6 @@ <!--startmeta -custom_edit_url: "https://github.com/netdata/netdata/edit/master/src/go/collectors/go.d.plugin/modules/prometheus/integrations/alibaba_cloud.md" -meta_yaml: "https://github.com/netdata/netdata/edit/master/src/go/collectors/go.d.plugin/modules/prometheus/metadata.yaml" +custom_edit_url: "https://github.com/netdata/netdata/edit/master/src/go/plugin/go.d/modules/prometheus/integrations/alibaba_cloud.md" +meta_yaml: "https://github.com/netdata/netdata/edit/master/src/go/plugin/go.d/modules/prometheus/metadata.yaml" sidebar_label: "Alibaba Cloud" learn_status: "Published" learn_rel_path: "Collecting Metrics/Cloud Provider Managed" @@ -37,7 +37,6 @@ This collector supports collecting metrics from multiple instances of this integ #### Auto-Detection By default, it detects instances running on the local host by trying to connect to known ports that are [allocated to exporters](https://github.com/prometheus/prometheus/wiki/Default-port-allocations). -The full list of endpoints is available in the collector's [configuration file](https://github.com/netdata/netdata/blob/master/src/go/collectors/go.d.plugin/config/go.d/prometheus.conf). #### Limits @@ -138,7 +137,7 @@ The following options can be defined globally: update_every, autodetection_retry This option allows you to filter out unwanted time series. Only metrics matching the selector will be collected. - Logic: (pattern1 OR pattern2) AND !(pattern3 or pattern4) -- Pattern syntax: [selector](/src/go/collectors/go.d.plugin/pkg/prometheus/selector/README.md). +- Pattern syntax: [selector](/src/go/plugin/go.d/pkg/prometheus/selector/README.md). - Option syntax: ```yaml @@ -266,6 +265,8 @@ jobs: ### Debug Mode +**Important**: Debug mode is not supported for data collection jobs created via the UI using the Dyncfg feature. + To troubleshoot issues with the `prometheus` collector, run the `go.d.plugin` with the debug option enabled. The output should give you clues as to why the collector isn't working. @@ -288,4 +289,37 @@ should give you clues as to why the collector isn't working. ./go.d.plugin -d -m prometheus ``` +### Getting Logs + +If you're encountering problems with the `prometheus` collector, follow these steps to retrieve logs and identify potential issues: + +- **Run the command** specific to your system (systemd, non-systemd, or Docker container). +- **Examine the output** for any warnings or error messages that might indicate issues. These messages should provide clues about the root cause of the problem. + +#### System with systemd + +Use the following command to view logs generated since the last Netdata service restart: + +```bash +journalctl _SYSTEMD_INVOCATION_ID="$(systemctl show --value --property=InvocationID netdata)" --namespace=netdata --grep prometheus +``` + +#### System without systemd + +Locate the collector log file, typically at `/var/log/netdata/collector.log`, and use `grep` to filter for collector's name: + +```bash +grep prometheus /var/log/netdata/collector.log +``` + +**Note**: This method shows logs from all restarts. Focus on the **latest entries** for troubleshooting current issues. + +#### Docker Container + +If your Netdata runs in a Docker container named "netdata" (replace if different), use this command: + +```bash +docker logs netdata 2>&1 | grep prometheus +``` + diff --git a/src/go/collectors/go.d.plugin/modules/prometheus/integrations/altaro_backup.md b/src/go/plugin/go.d/modules/prometheus/integrations/altaro_backup.md index 8f2509ffd..c5200c889 100644 --- a/src/go/collectors/go.d.plugin/modules/prometheus/integrations/altaro_backup.md +++ b/src/go/plugin/go.d/modules/prometheus/integrations/altaro_backup.md @@ -1,6 +1,6 @@ <!--startmeta -custom_edit_url: "https://github.com/netdata/netdata/edit/master/src/go/collectors/go.d.plugin/modules/prometheus/integrations/altaro_backup.md" -meta_yaml: "https://github.com/netdata/netdata/edit/master/src/go/collectors/go.d.plugin/modules/prometheus/metadata.yaml" +custom_edit_url: "https://github.com/netdata/netdata/edit/master/src/go/plugin/go.d/modules/prometheus/integrations/altaro_backup.md" +meta_yaml: "https://github.com/netdata/netdata/edit/master/src/go/plugin/go.d/modules/prometheus/metadata.yaml" sidebar_label: "Altaro Backup" learn_status: "Published" learn_rel_path: "Collecting Metrics/Storage, Mount Points and Filesystems" @@ -37,7 +37,6 @@ This collector supports collecting metrics from multiple instances of this integ #### Auto-Detection By default, it detects instances running on the local host by trying to connect to known ports that are [allocated to exporters](https://github.com/prometheus/prometheus/wiki/Default-port-allocations). -The full list of endpoints is available in the collector's [configuration file](https://github.com/netdata/netdata/blob/master/src/go/collectors/go.d.plugin/config/go.d/prometheus.conf). #### Limits @@ -138,7 +137,7 @@ The following options can be defined globally: update_every, autodetection_retry This option allows you to filter out unwanted time series. Only metrics matching the selector will be collected. - Logic: (pattern1 OR pattern2) AND !(pattern3 or pattern4) -- Pattern syntax: [selector](/src/go/collectors/go.d.plugin/pkg/prometheus/selector/README.md). +- Pattern syntax: [selector](/src/go/plugin/go.d/pkg/prometheus/selector/README.md). - Option syntax: ```yaml @@ -266,6 +265,8 @@ jobs: ### Debug Mode +**Important**: Debug mode is not supported for data collection jobs created via the UI using the Dyncfg feature. + To troubleshoot issues with the `prometheus` collector, run the `go.d.plugin` with the debug option enabled. The output should give you clues as to why the collector isn't working. @@ -288,4 +289,37 @@ should give you clues as to why the collector isn't working. ./go.d.plugin -d -m prometheus ``` +### Getting Logs + +If you're encountering problems with the `prometheus` collector, follow these steps to retrieve logs and identify potential issues: + +- **Run the command** specific to your system (systemd, non-systemd, or Docker container). +- **Examine the output** for any warnings or error messages that might indicate issues. These messages should provide clues about the root cause of the problem. + +#### System with systemd + +Use the following command to view logs generated since the last Netdata service restart: + +```bash +journalctl _SYSTEMD_INVOCATION_ID="$(systemctl show --value --property=InvocationID netdata)" --namespace=netdata --grep prometheus +``` + +#### System without systemd + +Locate the collector log file, typically at `/var/log/netdata/collector.log`, and use `grep` to filter for collector's name: + +```bash +grep prometheus /var/log/netdata/collector.log +``` + +**Note**: This method shows logs from all restarts. Focus on the **latest entries** for troubleshooting current issues. + +#### Docker Container + +If your Netdata runs in a Docker container named "netdata" (replace if different), use this command: + +```bash +docker logs netdata 2>&1 | grep prometheus +``` + diff --git a/src/go/collectors/go.d.plugin/modules/prometheus/integrations/amd_cpu_&_gpu.md b/src/go/plugin/go.d/modules/prometheus/integrations/amd_cpu_&_gpu.md index 5e9b84488..0eb582743 100644 --- a/src/go/collectors/go.d.plugin/modules/prometheus/integrations/amd_cpu_&_gpu.md +++ b/src/go/plugin/go.d/modules/prometheus/integrations/amd_cpu_&_gpu.md @@ -1,6 +1,6 @@ <!--startmeta -custom_edit_url: "https://github.com/netdata/netdata/edit/master/src/go/collectors/go.d.plugin/modules/prometheus/integrations/amd_cpu_&_gpu.md" -meta_yaml: "https://github.com/netdata/netdata/edit/master/src/go/collectors/go.d.plugin/modules/prometheus/metadata.yaml" +custom_edit_url: "https://github.com/netdata/netdata/edit/master/src/go/plugin/go.d/modules/prometheus/integrations/amd_cpu_&_gpu.md" +meta_yaml: "https://github.com/netdata/netdata/edit/master/src/go/plugin/go.d/modules/prometheus/metadata.yaml" sidebar_label: "AMD CPU & GPU" learn_status: "Published" learn_rel_path: "Collecting Metrics/Hardware Devices and Sensors" @@ -37,7 +37,6 @@ This collector supports collecting metrics from multiple instances of this integ #### Auto-Detection By default, it detects instances running on the local host by trying to connect to known ports that are [allocated to exporters](https://github.com/prometheus/prometheus/wiki/Default-port-allocations). -The full list of endpoints is available in the collector's [configuration file](https://github.com/netdata/netdata/blob/master/src/go/collectors/go.d.plugin/config/go.d/prometheus.conf). #### Limits @@ -138,7 +137,7 @@ The following options can be defined globally: update_every, autodetection_retry This option allows you to filter out unwanted time series. Only metrics matching the selector will be collected. - Logic: (pattern1 OR pattern2) AND !(pattern3 or pattern4) -- Pattern syntax: [selector](/src/go/collectors/go.d.plugin/pkg/prometheus/selector/README.md). +- Pattern syntax: [selector](/src/go/plugin/go.d/pkg/prometheus/selector/README.md). - Option syntax: ```yaml @@ -266,6 +265,8 @@ jobs: ### Debug Mode +**Important**: Debug mode is not supported for data collection jobs created via the UI using the Dyncfg feature. + To troubleshoot issues with the `prometheus` collector, run the `go.d.plugin` with the debug option enabled. The output should give you clues as to why the collector isn't working. @@ -288,4 +289,37 @@ should give you clues as to why the collector isn't working. ./go.d.plugin -d -m prometheus ``` +### Getting Logs + +If you're encountering problems with the `prometheus` collector, follow these steps to retrieve logs and identify potential issues: + +- **Run the command** specific to your system (systemd, non-systemd, or Docker container). +- **Examine the output** for any warnings or error messages that might indicate issues. These messages should provide clues about the root cause of the problem. + +#### System with systemd + +Use the following command to view logs generated since the last Netdata service restart: + +```bash +journalctl _SYSTEMD_INVOCATION_ID="$(systemctl show --value --property=InvocationID netdata)" --namespace=netdata --grep prometheus +``` + +#### System without systemd + +Locate the collector log file, typically at `/var/log/netdata/collector.log`, and use `grep` to filter for collector's name: + +```bash +grep prometheus /var/log/netdata/collector.log +``` + +**Note**: This method shows logs from all restarts. Focus on the **latest entries** for troubleshooting current issues. + +#### Docker Container + +If your Netdata runs in a Docker container named "netdata" (replace if different), use this command: + +```bash +docker logs netdata 2>&1 | grep prometheus +``` + diff --git a/src/go/collectors/go.d.plugin/modules/prometheus/integrations/andrews_&_arnold_line_status.md b/src/go/plugin/go.d/modules/prometheus/integrations/andrews_&_arnold_line_status.md index 85c1cc1de..52d282bab 100644 --- a/src/go/collectors/go.d.plugin/modules/prometheus/integrations/andrews_&_arnold_line_status.md +++ b/src/go/plugin/go.d/modules/prometheus/integrations/andrews_&_arnold_line_status.md @@ -1,6 +1,6 @@ <!--startmeta -custom_edit_url: "https://github.com/netdata/netdata/edit/master/src/go/collectors/go.d.plugin/modules/prometheus/integrations/andrews_&_arnold_line_status.md" -meta_yaml: "https://github.com/netdata/netdata/edit/master/src/go/collectors/go.d.plugin/modules/prometheus/metadata.yaml" +custom_edit_url: "https://github.com/netdata/netdata/edit/master/src/go/plugin/go.d/modules/prometheus/integrations/andrews_&_arnold_line_status.md" +meta_yaml: "https://github.com/netdata/netdata/edit/master/src/go/plugin/go.d/modules/prometheus/metadata.yaml" sidebar_label: "Andrews & Arnold line status" learn_status: "Published" learn_rel_path: "Collecting Metrics/Networking Stack and Network Interfaces" @@ -37,7 +37,6 @@ This collector supports collecting metrics from multiple instances of this integ #### Auto-Detection By default, it detects instances running on the local host by trying to connect to known ports that are [allocated to exporters](https://github.com/prometheus/prometheus/wiki/Default-port-allocations). -The full list of endpoints is available in the collector's [configuration file](https://github.com/netdata/netdata/blob/master/src/go/collectors/go.d.plugin/config/go.d/prometheus.conf). #### Limits @@ -138,7 +137,7 @@ The following options can be defined globally: update_every, autodetection_retry This option allows you to filter out unwanted time series. Only metrics matching the selector will be collected. - Logic: (pattern1 OR pattern2) AND !(pattern3 or pattern4) -- Pattern syntax: [selector](/src/go/collectors/go.d.plugin/pkg/prometheus/selector/README.md). +- Pattern syntax: [selector](/src/go/plugin/go.d/pkg/prometheus/selector/README.md). - Option syntax: ```yaml @@ -266,6 +265,8 @@ jobs: ### Debug Mode +**Important**: Debug mode is not supported for data collection jobs created via the UI using the Dyncfg feature. + To troubleshoot issues with the `prometheus` collector, run the `go.d.plugin` with the debug option enabled. The output should give you clues as to why the collector isn't working. @@ -288,4 +289,37 @@ should give you clues as to why the collector isn't working. ./go.d.plugin -d -m prometheus ``` +### Getting Logs + +If you're encountering problems with the `prometheus` collector, follow these steps to retrieve logs and identify potential issues: + +- **Run the command** specific to your system (systemd, non-systemd, or Docker container). +- **Examine the output** for any warnings or error messages that might indicate issues. These messages should provide clues about the root cause of the problem. + +#### System with systemd + +Use the following command to view logs generated since the last Netdata service restart: + +```bash +journalctl _SYSTEMD_INVOCATION_ID="$(systemctl show --value --property=InvocationID netdata)" --namespace=netdata --grep prometheus +``` + +#### System without systemd + +Locate the collector log file, typically at `/var/log/netdata/collector.log`, and use `grep` to filter for collector's name: + +```bash +grep prometheus /var/log/netdata/collector.log +``` + +**Note**: This method shows logs from all restarts. Focus on the **latest entries** for troubleshooting current issues. + +#### Docker Container + +If your Netdata runs in a Docker container named "netdata" (replace if different), use this command: + +```bash +docker logs netdata 2>&1 | grep prometheus +``` + diff --git a/src/go/collectors/go.d.plugin/modules/prometheus/integrations/apache_airflow.md b/src/go/plugin/go.d/modules/prometheus/integrations/apache_airflow.md index 139d0f6e5..5a5d15074 100644 --- a/src/go/collectors/go.d.plugin/modules/prometheus/integrations/apache_airflow.md +++ b/src/go/plugin/go.d/modules/prometheus/integrations/apache_airflow.md @@ -1,6 +1,6 @@ <!--startmeta -custom_edit_url: "https://github.com/netdata/netdata/edit/master/src/go/collectors/go.d.plugin/modules/prometheus/integrations/apache_airflow.md" -meta_yaml: "https://github.com/netdata/netdata/edit/master/src/go/collectors/go.d.plugin/modules/prometheus/metadata.yaml" +custom_edit_url: "https://github.com/netdata/netdata/edit/master/src/go/plugin/go.d/modules/prometheus/integrations/apache_airflow.md" +meta_yaml: "https://github.com/netdata/netdata/edit/master/src/go/plugin/go.d/modules/prometheus/metadata.yaml" sidebar_label: "Apache Airflow" learn_status: "Published" learn_rel_path: "Collecting Metrics/APM" @@ -37,7 +37,6 @@ This collector supports collecting metrics from multiple instances of this integ #### Auto-Detection By default, it detects instances running on the local host by trying to connect to known ports that are [allocated to exporters](https://github.com/prometheus/prometheus/wiki/Default-port-allocations). -The full list of endpoints is available in the collector's [configuration file](https://github.com/netdata/netdata/blob/master/src/go/collectors/go.d.plugin/config/go.d/prometheus.conf). #### Limits @@ -138,7 +137,7 @@ The following options can be defined globally: update_every, autodetection_retry This option allows you to filter out unwanted time series. Only metrics matching the selector will be collected. - Logic: (pattern1 OR pattern2) AND !(pattern3 or pattern4) -- Pattern syntax: [selector](/src/go/collectors/go.d.plugin/pkg/prometheus/selector/README.md). +- Pattern syntax: [selector](/src/go/plugin/go.d/pkg/prometheus/selector/README.md). - Option syntax: ```yaml @@ -266,6 +265,8 @@ jobs: ### Debug Mode +**Important**: Debug mode is not supported for data collection jobs created via the UI using the Dyncfg feature. + To troubleshoot issues with the `prometheus` collector, run the `go.d.plugin` with the debug option enabled. The output should give you clues as to why the collector isn't working. @@ -288,4 +289,37 @@ should give you clues as to why the collector isn't working. ./go.d.plugin -d -m prometheus ``` +### Getting Logs + +If you're encountering problems with the `prometheus` collector, follow these steps to retrieve logs and identify potential issues: + +- **Run the command** specific to your system (systemd, non-systemd, or Docker container). +- **Examine the output** for any warnings or error messages that might indicate issues. These messages should provide clues about the root cause of the problem. + +#### System with systemd + +Use the following command to view logs generated since the last Netdata service restart: + +```bash +journalctl _SYSTEMD_INVOCATION_ID="$(systemctl show --value --property=InvocationID netdata)" --namespace=netdata --grep prometheus +``` + +#### System without systemd + +Locate the collector log file, typically at `/var/log/netdata/collector.log`, and use `grep` to filter for collector's name: + +```bash +grep prometheus /var/log/netdata/collector.log +``` + +**Note**: This method shows logs from all restarts. Focus on the **latest entries** for troubleshooting current issues. + +#### Docker Container + +If your Netdata runs in a Docker container named "netdata" (replace if different), use this command: + +```bash +docker logs netdata 2>&1 | grep prometheus +``` + diff --git a/src/go/collectors/go.d.plugin/modules/prometheus/integrations/apache_flink.md b/src/go/plugin/go.d/modules/prometheus/integrations/apache_flink.md index 90560fa80..325b15d67 100644 --- a/src/go/collectors/go.d.plugin/modules/prometheus/integrations/apache_flink.md +++ b/src/go/plugin/go.d/modules/prometheus/integrations/apache_flink.md @@ -1,6 +1,6 @@ <!--startmeta -custom_edit_url: "https://github.com/netdata/netdata/edit/master/src/go/collectors/go.d.plugin/modules/prometheus/integrations/apache_flink.md" -meta_yaml: "https://github.com/netdata/netdata/edit/master/src/go/collectors/go.d.plugin/modules/prometheus/metadata.yaml" +custom_edit_url: "https://github.com/netdata/netdata/edit/master/src/go/plugin/go.d/modules/prometheus/integrations/apache_flink.md" +meta_yaml: "https://github.com/netdata/netdata/edit/master/src/go/plugin/go.d/modules/prometheus/metadata.yaml" sidebar_label: "Apache Flink" learn_status: "Published" learn_rel_path: "Collecting Metrics/APM" @@ -37,7 +37,6 @@ This collector supports collecting metrics from multiple instances of this integ #### Auto-Detection By default, it detects instances running on the local host by trying to connect to known ports that are [allocated to exporters](https://github.com/prometheus/prometheus/wiki/Default-port-allocations). -The full list of endpoints is available in the collector's [configuration file](https://github.com/netdata/netdata/blob/master/src/go/collectors/go.d.plugin/config/go.d/prometheus.conf). #### Limits @@ -138,7 +137,7 @@ The following options can be defined globally: update_every, autodetection_retry This option allows you to filter out unwanted time series. Only metrics matching the selector will be collected. - Logic: (pattern1 OR pattern2) AND !(pattern3 or pattern4) -- Pattern syntax: [selector](/src/go/collectors/go.d.plugin/pkg/prometheus/selector/README.md). +- Pattern syntax: [selector](/src/go/plugin/go.d/pkg/prometheus/selector/README.md). - Option syntax: ```yaml @@ -266,6 +265,8 @@ jobs: ### Debug Mode +**Important**: Debug mode is not supported for data collection jobs created via the UI using the Dyncfg feature. + To troubleshoot issues with the `prometheus` collector, run the `go.d.plugin` with the debug option enabled. The output should give you clues as to why the collector isn't working. @@ -288,4 +289,37 @@ should give you clues as to why the collector isn't working. ./go.d.plugin -d -m prometheus ``` +### Getting Logs + +If you're encountering problems with the `prometheus` collector, follow these steps to retrieve logs and identify potential issues: + +- **Run the command** specific to your system (systemd, non-systemd, or Docker container). +- **Examine the output** for any warnings or error messages that might indicate issues. These messages should provide clues about the root cause of the problem. + +#### System with systemd + +Use the following command to view logs generated since the last Netdata service restart: + +```bash +journalctl _SYSTEMD_INVOCATION_ID="$(systemctl show --value --property=InvocationID netdata)" --namespace=netdata --grep prometheus +``` + +#### System without systemd + +Locate the collector log file, typically at `/var/log/netdata/collector.log`, and use `grep` to filter for collector's name: + +```bash +grep prometheus /var/log/netdata/collector.log +``` + +**Note**: This method shows logs from all restarts. Focus on the **latest entries** for troubleshooting current issues. + +#### Docker Container + +If your Netdata runs in a Docker container named "netdata" (replace if different), use this command: + +```bash +docker logs netdata 2>&1 | grep prometheus +``` + diff --git a/src/go/collectors/go.d.plugin/modules/prometheus/integrations/apicast.md b/src/go/plugin/go.d/modules/prometheus/integrations/apicast.md index ed4b089df..7c36df053 100644 --- a/src/go/collectors/go.d.plugin/modules/prometheus/integrations/apicast.md +++ b/src/go/plugin/go.d/modules/prometheus/integrations/apicast.md @@ -1,6 +1,6 @@ <!--startmeta -custom_edit_url: "https://github.com/netdata/netdata/edit/master/src/go/collectors/go.d.plugin/modules/prometheus/integrations/apicast.md" -meta_yaml: "https://github.com/netdata/netdata/edit/master/src/go/collectors/go.d.plugin/modules/prometheus/metadata.yaml" +custom_edit_url: "https://github.com/netdata/netdata/edit/master/src/go/plugin/go.d/modules/prometheus/integrations/apicast.md" +meta_yaml: "https://github.com/netdata/netdata/edit/master/src/go/plugin/go.d/modules/prometheus/metadata.yaml" sidebar_label: "APIcast" learn_status: "Published" learn_rel_path: "Collecting Metrics/Web Servers and Web Proxies" @@ -37,7 +37,6 @@ This collector supports collecting metrics from multiple instances of this integ #### Auto-Detection By default, it detects instances running on the local host by trying to connect to known ports that are [allocated to exporters](https://github.com/prometheus/prometheus/wiki/Default-port-allocations). -The full list of endpoints is available in the collector's [configuration file](https://github.com/netdata/netdata/blob/master/src/go/collectors/go.d.plugin/config/go.d/prometheus.conf). #### Limits @@ -138,7 +137,7 @@ The following options can be defined globally: update_every, autodetection_retry This option allows you to filter out unwanted time series. Only metrics matching the selector will be collected. - Logic: (pattern1 OR pattern2) AND !(pattern3 or pattern4) -- Pattern syntax: [selector](/src/go/collectors/go.d.plugin/pkg/prometheus/selector/README.md). +- Pattern syntax: [selector](/src/go/plugin/go.d/pkg/prometheus/selector/README.md). - Option syntax: ```yaml @@ -266,6 +265,8 @@ jobs: ### Debug Mode +**Important**: Debug mode is not supported for data collection jobs created via the UI using the Dyncfg feature. + To troubleshoot issues with the `prometheus` collector, run the `go.d.plugin` with the debug option enabled. The output should give you clues as to why the collector isn't working. @@ -288,4 +289,37 @@ should give you clues as to why the collector isn't working. ./go.d.plugin -d -m prometheus ``` +### Getting Logs + +If you're encountering problems with the `prometheus` collector, follow these steps to retrieve logs and identify potential issues: + +- **Run the command** specific to your system (systemd, non-systemd, or Docker container). +- **Examine the output** for any warnings or error messages that might indicate issues. These messages should provide clues about the root cause of the problem. + +#### System with systemd + +Use the following command to view logs generated since the last Netdata service restart: + +```bash +journalctl _SYSTEMD_INVOCATION_ID="$(systemctl show --value --property=InvocationID netdata)" --namespace=netdata --grep prometheus +``` + +#### System without systemd + +Locate the collector log file, typically at `/var/log/netdata/collector.log`, and use `grep` to filter for collector's name: + +```bash +grep prometheus /var/log/netdata/collector.log +``` + +**Note**: This method shows logs from all restarts. Focus on the **latest entries** for troubleshooting current issues. + +#### Docker Container + +If your Netdata runs in a Docker container named "netdata" (replace if different), use this command: + +```bash +docker logs netdata 2>&1 | grep prometheus +``` + diff --git a/src/go/collectors/go.d.plugin/modules/prometheus/integrations/apple_time_machine.md b/src/go/plugin/go.d/modules/prometheus/integrations/apple_time_machine.md index e42d25a2e..e3a916ebc 100644 --- a/src/go/collectors/go.d.plugin/modules/prometheus/integrations/apple_time_machine.md +++ b/src/go/plugin/go.d/modules/prometheus/integrations/apple_time_machine.md @@ -1,6 +1,6 @@ <!--startmeta -custom_edit_url: "https://github.com/netdata/netdata/edit/master/src/go/collectors/go.d.plugin/modules/prometheus/integrations/apple_time_machine.md" -meta_yaml: "https://github.com/netdata/netdata/edit/master/src/go/collectors/go.d.plugin/modules/prometheus/metadata.yaml" +custom_edit_url: "https://github.com/netdata/netdata/edit/master/src/go/plugin/go.d/modules/prometheus/integrations/apple_time_machine.md" +meta_yaml: "https://github.com/netdata/netdata/edit/master/src/go/plugin/go.d/modules/prometheus/metadata.yaml" sidebar_label: "Apple Time Machine" learn_status: "Published" learn_rel_path: "Collecting Metrics/macOS Systems" @@ -37,7 +37,6 @@ This collector supports collecting metrics from multiple instances of this integ #### Auto-Detection By default, it detects instances running on the local host by trying to connect to known ports that are [allocated to exporters](https://github.com/prometheus/prometheus/wiki/Default-port-allocations). -The full list of endpoints is available in the collector's [configuration file](https://github.com/netdata/netdata/blob/master/src/go/collectors/go.d.plugin/config/go.d/prometheus.conf). #### Limits @@ -138,7 +137,7 @@ The following options can be defined globally: update_every, autodetection_retry This option allows you to filter out unwanted time series. Only metrics matching the selector will be collected. - Logic: (pattern1 OR pattern2) AND !(pattern3 or pattern4) -- Pattern syntax: [selector](/src/go/collectors/go.d.plugin/pkg/prometheus/selector/README.md). +- Pattern syntax: [selector](/src/go/plugin/go.d/pkg/prometheus/selector/README.md). - Option syntax: ```yaml @@ -266,6 +265,8 @@ jobs: ### Debug Mode +**Important**: Debug mode is not supported for data collection jobs created via the UI using the Dyncfg feature. + To troubleshoot issues with the `prometheus` collector, run the `go.d.plugin` with the debug option enabled. The output should give you clues as to why the collector isn't working. @@ -288,4 +289,37 @@ should give you clues as to why the collector isn't working. ./go.d.plugin -d -m prometheus ``` +### Getting Logs + +If you're encountering problems with the `prometheus` collector, follow these steps to retrieve logs and identify potential issues: + +- **Run the command** specific to your system (systemd, non-systemd, or Docker container). +- **Examine the output** for any warnings or error messages that might indicate issues. These messages should provide clues about the root cause of the problem. + +#### System with systemd + +Use the following command to view logs generated since the last Netdata service restart: + +```bash +journalctl _SYSTEMD_INVOCATION_ID="$(systemctl show --value --property=InvocationID netdata)" --namespace=netdata --grep prometheus +``` + +#### System without systemd + +Locate the collector log file, typically at `/var/log/netdata/collector.log`, and use `grep` to filter for collector's name: + +```bash +grep prometheus /var/log/netdata/collector.log +``` + +**Note**: This method shows logs from all restarts. Focus on the **latest entries** for troubleshooting current issues. + +#### Docker Container + +If your Netdata runs in a Docker container named "netdata" (replace if different), use this command: + +```bash +docker logs netdata 2>&1 | grep prometheus +``` + diff --git a/src/go/collectors/go.d.plugin/modules/prometheus/integrations/arm_hwcpipe.md b/src/go/plugin/go.d/modules/prometheus/integrations/arm_hwcpipe.md index 9cbb3b505..14a4386f4 100644 --- a/src/go/collectors/go.d.plugin/modules/prometheus/integrations/arm_hwcpipe.md +++ b/src/go/plugin/go.d/modules/prometheus/integrations/arm_hwcpipe.md @@ -1,6 +1,6 @@ <!--startmeta -custom_edit_url: "https://github.com/netdata/netdata/edit/master/src/go/collectors/go.d.plugin/modules/prometheus/integrations/arm_hwcpipe.md" -meta_yaml: "https://github.com/netdata/netdata/edit/master/src/go/collectors/go.d.plugin/modules/prometheus/metadata.yaml" +custom_edit_url: "https://github.com/netdata/netdata/edit/master/src/go/plugin/go.d/modules/prometheus/integrations/arm_hwcpipe.md" +meta_yaml: "https://github.com/netdata/netdata/edit/master/src/go/plugin/go.d/modules/prometheus/metadata.yaml" sidebar_label: "ARM HWCPipe" learn_status: "Published" learn_rel_path: "Collecting Metrics/Hardware Devices and Sensors" @@ -37,7 +37,6 @@ This collector supports collecting metrics from multiple instances of this integ #### Auto-Detection By default, it detects instances running on the local host by trying to connect to known ports that are [allocated to exporters](https://github.com/prometheus/prometheus/wiki/Default-port-allocations). -The full list of endpoints is available in the collector's [configuration file](https://github.com/netdata/netdata/blob/master/src/go/collectors/go.d.plugin/config/go.d/prometheus.conf). #### Limits @@ -138,7 +137,7 @@ The following options can be defined globally: update_every, autodetection_retry This option allows you to filter out unwanted time series. Only metrics matching the selector will be collected. - Logic: (pattern1 OR pattern2) AND !(pattern3 or pattern4) -- Pattern syntax: [selector](/src/go/collectors/go.d.plugin/pkg/prometheus/selector/README.md). +- Pattern syntax: [selector](/src/go/plugin/go.d/pkg/prometheus/selector/README.md). - Option syntax: ```yaml @@ -266,6 +265,8 @@ jobs: ### Debug Mode +**Important**: Debug mode is not supported for data collection jobs created via the UI using the Dyncfg feature. + To troubleshoot issues with the `prometheus` collector, run the `go.d.plugin` with the debug option enabled. The output should give you clues as to why the collector isn't working. @@ -288,4 +289,37 @@ should give you clues as to why the collector isn't working. ./go.d.plugin -d -m prometheus ``` +### Getting Logs + +If you're encountering problems with the `prometheus` collector, follow these steps to retrieve logs and identify potential issues: + +- **Run the command** specific to your system (systemd, non-systemd, or Docker container). +- **Examine the output** for any warnings or error messages that might indicate issues. These messages should provide clues about the root cause of the problem. + +#### System with systemd + +Use the following command to view logs generated since the last Netdata service restart: + +```bash +journalctl _SYSTEMD_INVOCATION_ID="$(systemctl show --value --property=InvocationID netdata)" --namespace=netdata --grep prometheus +``` + +#### System without systemd + +Locate the collector log file, typically at `/var/log/netdata/collector.log`, and use `grep` to filter for collector's name: + +```bash +grep prometheus /var/log/netdata/collector.log +``` + +**Note**: This method shows logs from all restarts. Focus on the **latest entries** for troubleshooting current issues. + +#### Docker Container + +If your Netdata runs in a Docker container named "netdata" (replace if different), use this command: + +```bash +docker logs netdata 2>&1 | grep prometheus +``` + diff --git a/src/go/collectors/go.d.plugin/modules/prometheus/integrations/aruba_devices.md b/src/go/plugin/go.d/modules/prometheus/integrations/aruba_devices.md index d11a520ea..c848873b2 100644 --- a/src/go/collectors/go.d.plugin/modules/prometheus/integrations/aruba_devices.md +++ b/src/go/plugin/go.d/modules/prometheus/integrations/aruba_devices.md @@ -1,6 +1,6 @@ <!--startmeta -custom_edit_url: "https://github.com/netdata/netdata/edit/master/src/go/collectors/go.d.plugin/modules/prometheus/integrations/aruba_devices.md" -meta_yaml: "https://github.com/netdata/netdata/edit/master/src/go/collectors/go.d.plugin/modules/prometheus/metadata.yaml" +custom_edit_url: "https://github.com/netdata/netdata/edit/master/src/go/plugin/go.d/modules/prometheus/integrations/aruba_devices.md" +meta_yaml: "https://github.com/netdata/netdata/edit/master/src/go/plugin/go.d/modules/prometheus/metadata.yaml" sidebar_label: "Aruba devices" learn_status: "Published" learn_rel_path: "Collecting Metrics/Networking Stack and Network Interfaces" @@ -37,7 +37,6 @@ This collector supports collecting metrics from multiple instances of this integ #### Auto-Detection By default, it detects instances running on the local host by trying to connect to known ports that are [allocated to exporters](https://github.com/prometheus/prometheus/wiki/Default-port-allocations). -The full list of endpoints is available in the collector's [configuration file](https://github.com/netdata/netdata/blob/master/src/go/collectors/go.d.plugin/config/go.d/prometheus.conf). #### Limits @@ -138,7 +137,7 @@ The following options can be defined globally: update_every, autodetection_retry This option allows you to filter out unwanted time series. Only metrics matching the selector will be collected. - Logic: (pattern1 OR pattern2) AND !(pattern3 or pattern4) -- Pattern syntax: [selector](/src/go/collectors/go.d.plugin/pkg/prometheus/selector/README.md). +- Pattern syntax: [selector](/src/go/plugin/go.d/pkg/prometheus/selector/README.md). - Option syntax: ```yaml @@ -266,6 +265,8 @@ jobs: ### Debug Mode +**Important**: Debug mode is not supported for data collection jobs created via the UI using the Dyncfg feature. + To troubleshoot issues with the `prometheus` collector, run the `go.d.plugin` with the debug option enabled. The output should give you clues as to why the collector isn't working. @@ -288,4 +289,37 @@ should give you clues as to why the collector isn't working. ./go.d.plugin -d -m prometheus ``` +### Getting Logs + +If you're encountering problems with the `prometheus` collector, follow these steps to retrieve logs and identify potential issues: + +- **Run the command** specific to your system (systemd, non-systemd, or Docker container). +- **Examine the output** for any warnings or error messages that might indicate issues. These messages should provide clues about the root cause of the problem. + +#### System with systemd + +Use the following command to view logs generated since the last Netdata service restart: + +```bash +journalctl _SYSTEMD_INVOCATION_ID="$(systemctl show --value --property=InvocationID netdata)" --namespace=netdata --grep prometheus +``` + +#### System without systemd + +Locate the collector log file, typically at `/var/log/netdata/collector.log`, and use `grep` to filter for collector's name: + +```bash +grep prometheus /var/log/netdata/collector.log +``` + +**Note**: This method shows logs from all restarts. Focus on the **latest entries** for troubleshooting current issues. + +#### Docker Container + +If your Netdata runs in a Docker container named "netdata" (replace if different), use this command: + +```bash +docker logs netdata 2>&1 | grep prometheus +``` + diff --git a/src/go/collectors/go.d.plugin/modules/prometheus/integrations/arvancloud_cdn.md b/src/go/plugin/go.d/modules/prometheus/integrations/arvancloud_cdn.md index e8c31e4ff..81bcbd70a 100644 --- a/src/go/collectors/go.d.plugin/modules/prometheus/integrations/arvancloud_cdn.md +++ b/src/go/plugin/go.d/modules/prometheus/integrations/arvancloud_cdn.md @@ -1,6 +1,6 @@ <!--startmeta -custom_edit_url: "https://github.com/netdata/netdata/edit/master/src/go/collectors/go.d.plugin/modules/prometheus/integrations/arvancloud_cdn.md" -meta_yaml: "https://github.com/netdata/netdata/edit/master/src/go/collectors/go.d.plugin/modules/prometheus/metadata.yaml" +custom_edit_url: "https://github.com/netdata/netdata/edit/master/src/go/plugin/go.d/modules/prometheus/integrations/arvancloud_cdn.md" +meta_yaml: "https://github.com/netdata/netdata/edit/master/src/go/plugin/go.d/modules/prometheus/metadata.yaml" sidebar_label: "ArvanCloud CDN" learn_status: "Published" learn_rel_path: "Collecting Metrics/Cloud Provider Managed" @@ -37,7 +37,6 @@ This collector supports collecting metrics from multiple instances of this integ #### Auto-Detection By default, it detects instances running on the local host by trying to connect to known ports that are [allocated to exporters](https://github.com/prometheus/prometheus/wiki/Default-port-allocations). -The full list of endpoints is available in the collector's [configuration file](https://github.com/netdata/netdata/blob/master/src/go/collectors/go.d.plugin/config/go.d/prometheus.conf). #### Limits @@ -138,7 +137,7 @@ The following options can be defined globally: update_every, autodetection_retry This option allows you to filter out unwanted time series. Only metrics matching the selector will be collected. - Logic: (pattern1 OR pattern2) AND !(pattern3 or pattern4) -- Pattern syntax: [selector](/src/go/collectors/go.d.plugin/pkg/prometheus/selector/README.md). +- Pattern syntax: [selector](/src/go/plugin/go.d/pkg/prometheus/selector/README.md). - Option syntax: ```yaml @@ -266,6 +265,8 @@ jobs: ### Debug Mode +**Important**: Debug mode is not supported for data collection jobs created via the UI using the Dyncfg feature. + To troubleshoot issues with the `prometheus` collector, run the `go.d.plugin` with the debug option enabled. The output should give you clues as to why the collector isn't working. @@ -288,4 +289,37 @@ should give you clues as to why the collector isn't working. ./go.d.plugin -d -m prometheus ``` +### Getting Logs + +If you're encountering problems with the `prometheus` collector, follow these steps to retrieve logs and identify potential issues: + +- **Run the command** specific to your system (systemd, non-systemd, or Docker container). +- **Examine the output** for any warnings or error messages that might indicate issues. These messages should provide clues about the root cause of the problem. + +#### System with systemd + +Use the following command to view logs generated since the last Netdata service restart: + +```bash +journalctl _SYSTEMD_INVOCATION_ID="$(systemctl show --value --property=InvocationID netdata)" --namespace=netdata --grep prometheus +``` + +#### System without systemd + +Locate the collector log file, typically at `/var/log/netdata/collector.log`, and use `grep` to filter for collector's name: + +```bash +grep prometheus /var/log/netdata/collector.log +``` + +**Note**: This method shows logs from all restarts. Focus on the **latest entries** for troubleshooting current issues. + +#### Docker Container + +If your Netdata runs in a Docker container named "netdata" (replace if different), use this command: + +```bash +docker logs netdata 2>&1 | grep prometheus +``` + diff --git a/src/go/collectors/go.d.plugin/modules/prometheus/integrations/audisto.md b/src/go/plugin/go.d/modules/prometheus/integrations/audisto.md index 51e27fa2e..81c450889 100644 --- a/src/go/collectors/go.d.plugin/modules/prometheus/integrations/audisto.md +++ b/src/go/plugin/go.d/modules/prometheus/integrations/audisto.md @@ -1,6 +1,6 @@ <!--startmeta -custom_edit_url: "https://github.com/netdata/netdata/edit/master/src/go/collectors/go.d.plugin/modules/prometheus/integrations/audisto.md" -meta_yaml: "https://github.com/netdata/netdata/edit/master/src/go/collectors/go.d.plugin/modules/prometheus/metadata.yaml" +custom_edit_url: "https://github.com/netdata/netdata/edit/master/src/go/plugin/go.d/modules/prometheus/integrations/audisto.md" +meta_yaml: "https://github.com/netdata/netdata/edit/master/src/go/plugin/go.d/modules/prometheus/metadata.yaml" sidebar_label: "Audisto" learn_status: "Published" learn_rel_path: "Collecting Metrics/APM" @@ -37,7 +37,6 @@ This collector supports collecting metrics from multiple instances of this integ #### Auto-Detection By default, it detects instances running on the local host by trying to connect to known ports that are [allocated to exporters](https://github.com/prometheus/prometheus/wiki/Default-port-allocations). -The full list of endpoints is available in the collector's [configuration file](https://github.com/netdata/netdata/blob/master/src/go/collectors/go.d.plugin/config/go.d/prometheus.conf). #### Limits @@ -138,7 +137,7 @@ The following options can be defined globally: update_every, autodetection_retry This option allows you to filter out unwanted time series. Only metrics matching the selector will be collected. - Logic: (pattern1 OR pattern2) AND !(pattern3 or pattern4) -- Pattern syntax: [selector](/src/go/collectors/go.d.plugin/pkg/prometheus/selector/README.md). +- Pattern syntax: [selector](/src/go/plugin/go.d/pkg/prometheus/selector/README.md). - Option syntax: ```yaml @@ -266,6 +265,8 @@ jobs: ### Debug Mode +**Important**: Debug mode is not supported for data collection jobs created via the UI using the Dyncfg feature. + To troubleshoot issues with the `prometheus` collector, run the `go.d.plugin` with the debug option enabled. The output should give you clues as to why the collector isn't working. @@ -288,4 +289,37 @@ should give you clues as to why the collector isn't working. ./go.d.plugin -d -m prometheus ``` +### Getting Logs + +If you're encountering problems with the `prometheus` collector, follow these steps to retrieve logs and identify potential issues: + +- **Run the command** specific to your system (systemd, non-systemd, or Docker container). +- **Examine the output** for any warnings or error messages that might indicate issues. These messages should provide clues about the root cause of the problem. + +#### System with systemd + +Use the following command to view logs generated since the last Netdata service restart: + +```bash +journalctl _SYSTEMD_INVOCATION_ID="$(systemctl show --value --property=InvocationID netdata)" --namespace=netdata --grep prometheus +``` + +#### System without systemd + +Locate the collector log file, typically at `/var/log/netdata/collector.log`, and use `grep` to filter for collector's name: + +```bash +grep prometheus /var/log/netdata/collector.log +``` + +**Note**: This method shows logs from all restarts. Focus on the **latest entries** for troubleshooting current issues. + +#### Docker Container + +If your Netdata runs in a Docker container named "netdata" (replace if different), use this command: + +```bash +docker logs netdata 2>&1 | grep prometheus +``` + diff --git a/src/go/collectors/go.d.plugin/modules/prometheus/integrations/authlog.md b/src/go/plugin/go.d/modules/prometheus/integrations/authlog.md index 4c3e86e78..86f20e30b 100644 --- a/src/go/collectors/go.d.plugin/modules/prometheus/integrations/authlog.md +++ b/src/go/plugin/go.d/modules/prometheus/integrations/authlog.md @@ -1,6 +1,6 @@ <!--startmeta -custom_edit_url: "https://github.com/netdata/netdata/edit/master/src/go/collectors/go.d.plugin/modules/prometheus/integrations/authlog.md" -meta_yaml: "https://github.com/netdata/netdata/edit/master/src/go/collectors/go.d.plugin/modules/prometheus/metadata.yaml" +custom_edit_url: "https://github.com/netdata/netdata/edit/master/src/go/plugin/go.d/modules/prometheus/integrations/authlog.md" +meta_yaml: "https://github.com/netdata/netdata/edit/master/src/go/plugin/go.d/modules/prometheus/metadata.yaml" sidebar_label: "AuthLog" learn_status: "Published" learn_rel_path: "Collecting Metrics/Logs Servers" @@ -37,7 +37,6 @@ This collector supports collecting metrics from multiple instances of this integ #### Auto-Detection By default, it detects instances running on the local host by trying to connect to known ports that are [allocated to exporters](https://github.com/prometheus/prometheus/wiki/Default-port-allocations). -The full list of endpoints is available in the collector's [configuration file](https://github.com/netdata/netdata/blob/master/src/go/collectors/go.d.plugin/config/go.d/prometheus.conf). #### Limits @@ -138,7 +137,7 @@ The following options can be defined globally: update_every, autodetection_retry This option allows you to filter out unwanted time series. Only metrics matching the selector will be collected. - Logic: (pattern1 OR pattern2) AND !(pattern3 or pattern4) -- Pattern syntax: [selector](/src/go/collectors/go.d.plugin/pkg/prometheus/selector/README.md). +- Pattern syntax: [selector](/src/go/plugin/go.d/pkg/prometheus/selector/README.md). - Option syntax: ```yaml @@ -266,6 +265,8 @@ jobs: ### Debug Mode +**Important**: Debug mode is not supported for data collection jobs created via the UI using the Dyncfg feature. + To troubleshoot issues with the `prometheus` collector, run the `go.d.plugin` with the debug option enabled. The output should give you clues as to why the collector isn't working. @@ -288,4 +289,37 @@ should give you clues as to why the collector isn't working. ./go.d.plugin -d -m prometheus ``` +### Getting Logs + +If you're encountering problems with the `prometheus` collector, follow these steps to retrieve logs and identify potential issues: + +- **Run the command** specific to your system (systemd, non-systemd, or Docker container). +- **Examine the output** for any warnings or error messages that might indicate issues. These messages should provide clues about the root cause of the problem. + +#### System with systemd + +Use the following command to view logs generated since the last Netdata service restart: + +```bash +journalctl _SYSTEMD_INVOCATION_ID="$(systemctl show --value --property=InvocationID netdata)" --namespace=netdata --grep prometheus +``` + +#### System without systemd + +Locate the collector log file, typically at `/var/log/netdata/collector.log`, and use `grep` to filter for collector's name: + +```bash +grep prometheus /var/log/netdata/collector.log +``` + +**Note**: This method shows logs from all restarts. Focus on the **latest entries** for troubleshooting current issues. + +#### Docker Container + +If your Netdata runs in a Docker container named "netdata" (replace if different), use this command: + +```bash +docker logs netdata 2>&1 | grep prometheus +``` + diff --git a/src/go/collectors/go.d.plugin/modules/prometheus/integrations/aws_ec2_compute_instances.md b/src/go/plugin/go.d/modules/prometheus/integrations/aws_ec2_compute_instances.md index 11f1bea81..c31b72dc1 100644 --- a/src/go/collectors/go.d.plugin/modules/prometheus/integrations/aws_ec2_compute_instances.md +++ b/src/go/plugin/go.d/modules/prometheus/integrations/aws_ec2_compute_instances.md @@ -1,6 +1,6 @@ <!--startmeta -custom_edit_url: "https://github.com/netdata/netdata/edit/master/src/go/collectors/go.d.plugin/modules/prometheus/integrations/aws_ec2_compute_instances.md" -meta_yaml: "https://github.com/netdata/netdata/edit/master/src/go/collectors/go.d.plugin/modules/prometheus/metadata.yaml" +custom_edit_url: "https://github.com/netdata/netdata/edit/master/src/go/plugin/go.d/modules/prometheus/integrations/aws_ec2_compute_instances.md" +meta_yaml: "https://github.com/netdata/netdata/edit/master/src/go/plugin/go.d/modules/prometheus/metadata.yaml" sidebar_label: "AWS EC2 Compute instances" learn_status: "Published" learn_rel_path: "Collecting Metrics/Cloud Provider Managed" @@ -37,7 +37,6 @@ This collector supports collecting metrics from multiple instances of this integ #### Auto-Detection By default, it detects instances running on the local host by trying to connect to known ports that are [allocated to exporters](https://github.com/prometheus/prometheus/wiki/Default-port-allocations). -The full list of endpoints is available in the collector's [configuration file](https://github.com/netdata/netdata/blob/master/src/go/collectors/go.d.plugin/config/go.d/prometheus.conf). #### Limits @@ -138,7 +137,7 @@ The following options can be defined globally: update_every, autodetection_retry This option allows you to filter out unwanted time series. Only metrics matching the selector will be collected. - Logic: (pattern1 OR pattern2) AND !(pattern3 or pattern4) -- Pattern syntax: [selector](/src/go/collectors/go.d.plugin/pkg/prometheus/selector/README.md). +- Pattern syntax: [selector](/src/go/plugin/go.d/pkg/prometheus/selector/README.md). - Option syntax: ```yaml @@ -266,6 +265,8 @@ jobs: ### Debug Mode +**Important**: Debug mode is not supported for data collection jobs created via the UI using the Dyncfg feature. + To troubleshoot issues with the `prometheus` collector, run the `go.d.plugin` with the debug option enabled. The output should give you clues as to why the collector isn't working. @@ -288,4 +289,37 @@ should give you clues as to why the collector isn't working. ./go.d.plugin -d -m prometheus ``` +### Getting Logs + +If you're encountering problems with the `prometheus` collector, follow these steps to retrieve logs and identify potential issues: + +- **Run the command** specific to your system (systemd, non-systemd, or Docker container). +- **Examine the output** for any warnings or error messages that might indicate issues. These messages should provide clues about the root cause of the problem. + +#### System with systemd + +Use the following command to view logs generated since the last Netdata service restart: + +```bash +journalctl _SYSTEMD_INVOCATION_ID="$(systemctl show --value --property=InvocationID netdata)" --namespace=netdata --grep prometheus +``` + +#### System without systemd + +Locate the collector log file, typically at `/var/log/netdata/collector.log`, and use `grep` to filter for collector's name: + +```bash +grep prometheus /var/log/netdata/collector.log +``` + +**Note**: This method shows logs from all restarts. Focus on the **latest entries** for troubleshooting current issues. + +#### Docker Container + +If your Netdata runs in a Docker container named "netdata" (replace if different), use this command: + +```bash +docker logs netdata 2>&1 | grep prometheus +``` + diff --git a/src/go/collectors/go.d.plugin/modules/prometheus/integrations/aws_ec2_spot_instance.md b/src/go/plugin/go.d/modules/prometheus/integrations/aws_ec2_spot_instance.md index ad8b625eb..908624b4c 100644 --- a/src/go/collectors/go.d.plugin/modules/prometheus/integrations/aws_ec2_spot_instance.md +++ b/src/go/plugin/go.d/modules/prometheus/integrations/aws_ec2_spot_instance.md @@ -1,6 +1,6 @@ <!--startmeta -custom_edit_url: "https://github.com/netdata/netdata/edit/master/src/go/collectors/go.d.plugin/modules/prometheus/integrations/aws_ec2_spot_instance.md" -meta_yaml: "https://github.com/netdata/netdata/edit/master/src/go/collectors/go.d.plugin/modules/prometheus/metadata.yaml" +custom_edit_url: "https://github.com/netdata/netdata/edit/master/src/go/plugin/go.d/modules/prometheus/integrations/aws_ec2_spot_instance.md" +meta_yaml: "https://github.com/netdata/netdata/edit/master/src/go/plugin/go.d/modules/prometheus/metadata.yaml" sidebar_label: "AWS EC2 Spot Instance" learn_status: "Published" learn_rel_path: "Collecting Metrics/Cloud Provider Managed" @@ -37,7 +37,6 @@ This collector supports collecting metrics from multiple instances of this integ #### Auto-Detection By default, it detects instances running on the local host by trying to connect to known ports that are [allocated to exporters](https://github.com/prometheus/prometheus/wiki/Default-port-allocations). -The full list of endpoints is available in the collector's [configuration file](https://github.com/netdata/netdata/blob/master/src/go/collectors/go.d.plugin/config/go.d/prometheus.conf). #### Limits @@ -138,7 +137,7 @@ The following options can be defined globally: update_every, autodetection_retry This option allows you to filter out unwanted time series. Only metrics matching the selector will be collected. - Logic: (pattern1 OR pattern2) AND !(pattern3 or pattern4) -- Pattern syntax: [selector](/src/go/collectors/go.d.plugin/pkg/prometheus/selector/README.md). +- Pattern syntax: [selector](/src/go/plugin/go.d/pkg/prometheus/selector/README.md). - Option syntax: ```yaml @@ -266,6 +265,8 @@ jobs: ### Debug Mode +**Important**: Debug mode is not supported for data collection jobs created via the UI using the Dyncfg feature. + To troubleshoot issues with the `prometheus` collector, run the `go.d.plugin` with the debug option enabled. The output should give you clues as to why the collector isn't working. @@ -288,4 +289,37 @@ should give you clues as to why the collector isn't working. ./go.d.plugin -d -m prometheus ``` +### Getting Logs + +If you're encountering problems with the `prometheus` collector, follow these steps to retrieve logs and identify potential issues: + +- **Run the command** specific to your system (systemd, non-systemd, or Docker container). +- **Examine the output** for any warnings or error messages that might indicate issues. These messages should provide clues about the root cause of the problem. + +#### System with systemd + +Use the following command to view logs generated since the last Netdata service restart: + +```bash +journalctl _SYSTEMD_INVOCATION_ID="$(systemctl show --value --property=InvocationID netdata)" --namespace=netdata --grep prometheus +``` + +#### System without systemd + +Locate the collector log file, typically at `/var/log/netdata/collector.log`, and use `grep` to filter for collector's name: + +```bash +grep prometheus /var/log/netdata/collector.log +``` + +**Note**: This method shows logs from all restarts. Focus on the **latest entries** for troubleshooting current issues. + +#### Docker Container + +If your Netdata runs in a Docker container named "netdata" (replace if different), use this command: + +```bash +docker logs netdata 2>&1 | grep prometheus +``` + diff --git a/src/go/collectors/go.d.plugin/modules/prometheus/integrations/aws_ecs.md b/src/go/plugin/go.d/modules/prometheus/integrations/aws_ecs.md index 8192a4f19..aed1877b8 100644 --- a/src/go/collectors/go.d.plugin/modules/prometheus/integrations/aws_ecs.md +++ b/src/go/plugin/go.d/modules/prometheus/integrations/aws_ecs.md @@ -1,6 +1,6 @@ <!--startmeta -custom_edit_url: "https://github.com/netdata/netdata/edit/master/src/go/collectors/go.d.plugin/modules/prometheus/integrations/aws_ecs.md" -meta_yaml: "https://github.com/netdata/netdata/edit/master/src/go/collectors/go.d.plugin/modules/prometheus/metadata.yaml" +custom_edit_url: "https://github.com/netdata/netdata/edit/master/src/go/plugin/go.d/modules/prometheus/integrations/aws_ecs.md" +meta_yaml: "https://github.com/netdata/netdata/edit/master/src/go/plugin/go.d/modules/prometheus/metadata.yaml" sidebar_label: "AWS ECS" learn_status: "Published" learn_rel_path: "Collecting Metrics/Cloud Provider Managed" @@ -37,7 +37,6 @@ This collector supports collecting metrics from multiple instances of this integ #### Auto-Detection By default, it detects instances running on the local host by trying to connect to known ports that are [allocated to exporters](https://github.com/prometheus/prometheus/wiki/Default-port-allocations). -The full list of endpoints is available in the collector's [configuration file](https://github.com/netdata/netdata/blob/master/src/go/collectors/go.d.plugin/config/go.d/prometheus.conf). #### Limits @@ -138,7 +137,7 @@ The following options can be defined globally: update_every, autodetection_retry This option allows you to filter out unwanted time series. Only metrics matching the selector will be collected. - Logic: (pattern1 OR pattern2) AND !(pattern3 or pattern4) -- Pattern syntax: [selector](/src/go/collectors/go.d.plugin/pkg/prometheus/selector/README.md). +- Pattern syntax: [selector](/src/go/plugin/go.d/pkg/prometheus/selector/README.md). - Option syntax: ```yaml @@ -266,6 +265,8 @@ jobs: ### Debug Mode +**Important**: Debug mode is not supported for data collection jobs created via the UI using the Dyncfg feature. + To troubleshoot issues with the `prometheus` collector, run the `go.d.plugin` with the debug option enabled. The output should give you clues as to why the collector isn't working. @@ -288,4 +289,37 @@ should give you clues as to why the collector isn't working. ./go.d.plugin -d -m prometheus ``` +### Getting Logs + +If you're encountering problems with the `prometheus` collector, follow these steps to retrieve logs and identify potential issues: + +- **Run the command** specific to your system (systemd, non-systemd, or Docker container). +- **Examine the output** for any warnings or error messages that might indicate issues. These messages should provide clues about the root cause of the problem. + +#### System with systemd + +Use the following command to view logs generated since the last Netdata service restart: + +```bash +journalctl _SYSTEMD_INVOCATION_ID="$(systemctl show --value --property=InvocationID netdata)" --namespace=netdata --grep prometheus +``` + +#### System without systemd + +Locate the collector log file, typically at `/var/log/netdata/collector.log`, and use `grep` to filter for collector's name: + +```bash +grep prometheus /var/log/netdata/collector.log +``` + +**Note**: This method shows logs from all restarts. Focus on the **latest entries** for troubleshooting current issues. + +#### Docker Container + +If your Netdata runs in a Docker container named "netdata" (replace if different), use this command: + +```bash +docker logs netdata 2>&1 | grep prometheus +``` + diff --git a/src/go/collectors/go.d.plugin/modules/prometheus/integrations/aws_health_events.md b/src/go/plugin/go.d/modules/prometheus/integrations/aws_health_events.md index 531159d0c..dd1d4bc6a 100644 --- a/src/go/collectors/go.d.plugin/modules/prometheus/integrations/aws_health_events.md +++ b/src/go/plugin/go.d/modules/prometheus/integrations/aws_health_events.md @@ -1,6 +1,6 @@ <!--startmeta -custom_edit_url: "https://github.com/netdata/netdata/edit/master/src/go/collectors/go.d.plugin/modules/prometheus/integrations/aws_health_events.md" -meta_yaml: "https://github.com/netdata/netdata/edit/master/src/go/collectors/go.d.plugin/modules/prometheus/metadata.yaml" +custom_edit_url: "https://github.com/netdata/netdata/edit/master/src/go/plugin/go.d/modules/prometheus/integrations/aws_health_events.md" +meta_yaml: "https://github.com/netdata/netdata/edit/master/src/go/plugin/go.d/modules/prometheus/metadata.yaml" sidebar_label: "AWS Health events" learn_status: "Published" learn_rel_path: "Collecting Metrics/Cloud Provider Managed" @@ -37,7 +37,6 @@ This collector supports collecting metrics from multiple instances of this integ #### Auto-Detection By default, it detects instances running on the local host by trying to connect to known ports that are [allocated to exporters](https://github.com/prometheus/prometheus/wiki/Default-port-allocations). -The full list of endpoints is available in the collector's [configuration file](https://github.com/netdata/netdata/blob/master/src/go/collectors/go.d.plugin/config/go.d/prometheus.conf). #### Limits @@ -138,7 +137,7 @@ The following options can be defined globally: update_every, autodetection_retry This option allows you to filter out unwanted time series. Only metrics matching the selector will be collected. - Logic: (pattern1 OR pattern2) AND !(pattern3 or pattern4) -- Pattern syntax: [selector](/src/go/collectors/go.d.plugin/pkg/prometheus/selector/README.md). +- Pattern syntax: [selector](/src/go/plugin/go.d/pkg/prometheus/selector/README.md). - Option syntax: ```yaml @@ -266,6 +265,8 @@ jobs: ### Debug Mode +**Important**: Debug mode is not supported for data collection jobs created via the UI using the Dyncfg feature. + To troubleshoot issues with the `prometheus` collector, run the `go.d.plugin` with the debug option enabled. The output should give you clues as to why the collector isn't working. @@ -288,4 +289,37 @@ should give you clues as to why the collector isn't working. ./go.d.plugin -d -m prometheus ``` +### Getting Logs + +If you're encountering problems with the `prometheus` collector, follow these steps to retrieve logs and identify potential issues: + +- **Run the command** specific to your system (systemd, non-systemd, or Docker container). +- **Examine the output** for any warnings or error messages that might indicate issues. These messages should provide clues about the root cause of the problem. + +#### System with systemd + +Use the following command to view logs generated since the last Netdata service restart: + +```bash +journalctl _SYSTEMD_INVOCATION_ID="$(systemctl show --value --property=InvocationID netdata)" --namespace=netdata --grep prometheus +``` + +#### System without systemd + +Locate the collector log file, typically at `/var/log/netdata/collector.log`, and use `grep` to filter for collector's name: + +```bash +grep prometheus /var/log/netdata/collector.log +``` + +**Note**: This method shows logs from all restarts. Focus on the **latest entries** for troubleshooting current issues. + +#### Docker Container + +If your Netdata runs in a Docker container named "netdata" (replace if different), use this command: + +```bash +docker logs netdata 2>&1 | grep prometheus +``` + diff --git a/src/go/collectors/go.d.plugin/modules/prometheus/integrations/aws_instance_health.md b/src/go/plugin/go.d/modules/prometheus/integrations/aws_instance_health.md index 39d44f056..82da72d23 100644 --- a/src/go/collectors/go.d.plugin/modules/prometheus/integrations/aws_instance_health.md +++ b/src/go/plugin/go.d/modules/prometheus/integrations/aws_instance_health.md @@ -1,6 +1,6 @@ <!--startmeta -custom_edit_url: "https://github.com/netdata/netdata/edit/master/src/go/collectors/go.d.plugin/modules/prometheus/integrations/aws_instance_health.md" -meta_yaml: "https://github.com/netdata/netdata/edit/master/src/go/collectors/go.d.plugin/modules/prometheus/metadata.yaml" +custom_edit_url: "https://github.com/netdata/netdata/edit/master/src/go/plugin/go.d/modules/prometheus/integrations/aws_instance_health.md" +meta_yaml: "https://github.com/netdata/netdata/edit/master/src/go/plugin/go.d/modules/prometheus/metadata.yaml" sidebar_label: "AWS instance health" learn_status: "Published" learn_rel_path: "Collecting Metrics/Cloud Provider Managed" @@ -37,7 +37,6 @@ This collector supports collecting metrics from multiple instances of this integ #### Auto-Detection By default, it detects instances running on the local host by trying to connect to known ports that are [allocated to exporters](https://github.com/prometheus/prometheus/wiki/Default-port-allocations). -The full list of endpoints is available in the collector's [configuration file](https://github.com/netdata/netdata/blob/master/src/go/collectors/go.d.plugin/config/go.d/prometheus.conf). #### Limits @@ -138,7 +137,7 @@ The following options can be defined globally: update_every, autodetection_retry This option allows you to filter out unwanted time series. Only metrics matching the selector will be collected. - Logic: (pattern1 OR pattern2) AND !(pattern3 or pattern4) -- Pattern syntax: [selector](/src/go/collectors/go.d.plugin/pkg/prometheus/selector/README.md). +- Pattern syntax: [selector](/src/go/plugin/go.d/pkg/prometheus/selector/README.md). - Option syntax: ```yaml @@ -266,6 +265,8 @@ jobs: ### Debug Mode +**Important**: Debug mode is not supported for data collection jobs created via the UI using the Dyncfg feature. + To troubleshoot issues with the `prometheus` collector, run the `go.d.plugin` with the debug option enabled. The output should give you clues as to why the collector isn't working. @@ -288,4 +289,37 @@ should give you clues as to why the collector isn't working. ./go.d.plugin -d -m prometheus ``` +### Getting Logs + +If you're encountering problems with the `prometheus` collector, follow these steps to retrieve logs and identify potential issues: + +- **Run the command** specific to your system (systemd, non-systemd, or Docker container). +- **Examine the output** for any warnings or error messages that might indicate issues. These messages should provide clues about the root cause of the problem. + +#### System with systemd + +Use the following command to view logs generated since the last Netdata service restart: + +```bash +journalctl _SYSTEMD_INVOCATION_ID="$(systemctl show --value --property=InvocationID netdata)" --namespace=netdata --grep prometheus +``` + +#### System without systemd + +Locate the collector log file, typically at `/var/log/netdata/collector.log`, and use `grep` to filter for collector's name: + +```bash +grep prometheus /var/log/netdata/collector.log +``` + +**Note**: This method shows logs from all restarts. Focus on the **latest entries** for troubleshooting current issues. + +#### Docker Container + +If your Netdata runs in a Docker container named "netdata" (replace if different), use this command: + +```bash +docker logs netdata 2>&1 | grep prometheus +``` + diff --git a/src/go/collectors/go.d.plugin/modules/prometheus/integrations/aws_quota.md b/src/go/plugin/go.d/modules/prometheus/integrations/aws_quota.md index 45f8e46c2..67970fdf8 100644 --- a/src/go/collectors/go.d.plugin/modules/prometheus/integrations/aws_quota.md +++ b/src/go/plugin/go.d/modules/prometheus/integrations/aws_quota.md @@ -1,6 +1,6 @@ <!--startmeta -custom_edit_url: "https://github.com/netdata/netdata/edit/master/src/go/collectors/go.d.plugin/modules/prometheus/integrations/aws_quota.md" -meta_yaml: "https://github.com/netdata/netdata/edit/master/src/go/collectors/go.d.plugin/modules/prometheus/metadata.yaml" +custom_edit_url: "https://github.com/netdata/netdata/edit/master/src/go/plugin/go.d/modules/prometheus/integrations/aws_quota.md" +meta_yaml: "https://github.com/netdata/netdata/edit/master/src/go/plugin/go.d/modules/prometheus/metadata.yaml" sidebar_label: "AWS Quota" learn_status: "Published" learn_rel_path: "Collecting Metrics/Cloud Provider Managed" @@ -37,7 +37,6 @@ This collector supports collecting metrics from multiple instances of this integ #### Auto-Detection By default, it detects instances running on the local host by trying to connect to known ports that are [allocated to exporters](https://github.com/prometheus/prometheus/wiki/Default-port-allocations). -The full list of endpoints is available in the collector's [configuration file](https://github.com/netdata/netdata/blob/master/src/go/collectors/go.d.plugin/config/go.d/prometheus.conf). #### Limits @@ -138,7 +137,7 @@ The following options can be defined globally: update_every, autodetection_retry This option allows you to filter out unwanted time series. Only metrics matching the selector will be collected. - Logic: (pattern1 OR pattern2) AND !(pattern3 or pattern4) -- Pattern syntax: [selector](/src/go/collectors/go.d.plugin/pkg/prometheus/selector/README.md). +- Pattern syntax: [selector](/src/go/plugin/go.d/pkg/prometheus/selector/README.md). - Option syntax: ```yaml @@ -266,6 +265,8 @@ jobs: ### Debug Mode +**Important**: Debug mode is not supported for data collection jobs created via the UI using the Dyncfg feature. + To troubleshoot issues with the `prometheus` collector, run the `go.d.plugin` with the debug option enabled. The output should give you clues as to why the collector isn't working. @@ -288,4 +289,37 @@ should give you clues as to why the collector isn't working. ./go.d.plugin -d -m prometheus ``` +### Getting Logs + +If you're encountering problems with the `prometheus` collector, follow these steps to retrieve logs and identify potential issues: + +- **Run the command** specific to your system (systemd, non-systemd, or Docker container). +- **Examine the output** for any warnings or error messages that might indicate issues. These messages should provide clues about the root cause of the problem. + +#### System with systemd + +Use the following command to view logs generated since the last Netdata service restart: + +```bash +journalctl _SYSTEMD_INVOCATION_ID="$(systemctl show --value --property=InvocationID netdata)" --namespace=netdata --grep prometheus +``` + +#### System without systemd + +Locate the collector log file, typically at `/var/log/netdata/collector.log`, and use `grep` to filter for collector's name: + +```bash +grep prometheus /var/log/netdata/collector.log +``` + +**Note**: This method shows logs from all restarts. Focus on the **latest entries** for troubleshooting current issues. + +#### Docker Container + +If your Netdata runs in a Docker container named "netdata" (replace if different), use this command: + +```bash +docker logs netdata 2>&1 | grep prometheus +``` + diff --git a/src/go/collectors/go.d.plugin/modules/prometheus/integrations/aws_rds.md b/src/go/plugin/go.d/modules/prometheus/integrations/aws_rds.md index aa41d233b..acd1e7101 100644 --- a/src/go/collectors/go.d.plugin/modules/prometheus/integrations/aws_rds.md +++ b/src/go/plugin/go.d/modules/prometheus/integrations/aws_rds.md @@ -1,6 +1,6 @@ <!--startmeta -custom_edit_url: "https://github.com/netdata/netdata/edit/master/src/go/collectors/go.d.plugin/modules/prometheus/integrations/aws_rds.md" -meta_yaml: "https://github.com/netdata/netdata/edit/master/src/go/collectors/go.d.plugin/modules/prometheus/metadata.yaml" +custom_edit_url: "https://github.com/netdata/netdata/edit/master/src/go/plugin/go.d/modules/prometheus/integrations/aws_rds.md" +meta_yaml: "https://github.com/netdata/netdata/edit/master/src/go/plugin/go.d/modules/prometheus/metadata.yaml" sidebar_label: "AWS RDS" learn_status: "Published" learn_rel_path: "Collecting Metrics/Databases" @@ -37,7 +37,6 @@ This collector supports collecting metrics from multiple instances of this integ #### Auto-Detection By default, it detects instances running on the local host by trying to connect to known ports that are [allocated to exporters](https://github.com/prometheus/prometheus/wiki/Default-port-allocations). -The full list of endpoints is available in the collector's [configuration file](https://github.com/netdata/netdata/blob/master/src/go/collectors/go.d.plugin/config/go.d/prometheus.conf). #### Limits @@ -138,7 +137,7 @@ The following options can be defined globally: update_every, autodetection_retry This option allows you to filter out unwanted time series. Only metrics matching the selector will be collected. - Logic: (pattern1 OR pattern2) AND !(pattern3 or pattern4) -- Pattern syntax: [selector](/src/go/collectors/go.d.plugin/pkg/prometheus/selector/README.md). +- Pattern syntax: [selector](/src/go/plugin/go.d/pkg/prometheus/selector/README.md). - Option syntax: ```yaml @@ -266,6 +265,8 @@ jobs: ### Debug Mode +**Important**: Debug mode is not supported for data collection jobs created via the UI using the Dyncfg feature. + To troubleshoot issues with the `prometheus` collector, run the `go.d.plugin` with the debug option enabled. The output should give you clues as to why the collector isn't working. @@ -288,4 +289,37 @@ should give you clues as to why the collector isn't working. ./go.d.plugin -d -m prometheus ``` +### Getting Logs + +If you're encountering problems with the `prometheus` collector, follow these steps to retrieve logs and identify potential issues: + +- **Run the command** specific to your system (systemd, non-systemd, or Docker container). +- **Examine the output** for any warnings or error messages that might indicate issues. These messages should provide clues about the root cause of the problem. + +#### System with systemd + +Use the following command to view logs generated since the last Netdata service restart: + +```bash +journalctl _SYSTEMD_INVOCATION_ID="$(systemctl show --value --property=InvocationID netdata)" --namespace=netdata --grep prometheus +``` + +#### System without systemd + +Locate the collector log file, typically at `/var/log/netdata/collector.log`, and use `grep` to filter for collector's name: + +```bash +grep prometheus /var/log/netdata/collector.log +``` + +**Note**: This method shows logs from all restarts. Focus on the **latest entries** for troubleshooting current issues. + +#### Docker Container + +If your Netdata runs in a Docker container named "netdata" (replace if different), use this command: + +```bash +docker logs netdata 2>&1 | grep prometheus +``` + diff --git a/src/go/collectors/go.d.plugin/modules/prometheus/integrations/aws_s3_buckets.md b/src/go/plugin/go.d/modules/prometheus/integrations/aws_s3_buckets.md index e60ccc95f..e4628d718 100644 --- a/src/go/collectors/go.d.plugin/modules/prometheus/integrations/aws_s3_buckets.md +++ b/src/go/plugin/go.d/modules/prometheus/integrations/aws_s3_buckets.md @@ -1,6 +1,6 @@ <!--startmeta -custom_edit_url: "https://github.com/netdata/netdata/edit/master/src/go/collectors/go.d.plugin/modules/prometheus/integrations/aws_s3_buckets.md" -meta_yaml: "https://github.com/netdata/netdata/edit/master/src/go/collectors/go.d.plugin/modules/prometheus/metadata.yaml" +custom_edit_url: "https://github.com/netdata/netdata/edit/master/src/go/plugin/go.d/modules/prometheus/integrations/aws_s3_buckets.md" +meta_yaml: "https://github.com/netdata/netdata/edit/master/src/go/plugin/go.d/modules/prometheus/metadata.yaml" sidebar_label: "AWS S3 buckets" learn_status: "Published" learn_rel_path: "Collecting Metrics/Cloud Provider Managed" @@ -37,7 +37,6 @@ This collector supports collecting metrics from multiple instances of this integ #### Auto-Detection By default, it detects instances running on the local host by trying to connect to known ports that are [allocated to exporters](https://github.com/prometheus/prometheus/wiki/Default-port-allocations). -The full list of endpoints is available in the collector's [configuration file](https://github.com/netdata/netdata/blob/master/src/go/collectors/go.d.plugin/config/go.d/prometheus.conf). #### Limits @@ -138,7 +137,7 @@ The following options can be defined globally: update_every, autodetection_retry This option allows you to filter out unwanted time series. Only metrics matching the selector will be collected. - Logic: (pattern1 OR pattern2) AND !(pattern3 or pattern4) -- Pattern syntax: [selector](/src/go/collectors/go.d.plugin/pkg/prometheus/selector/README.md). +- Pattern syntax: [selector](/src/go/plugin/go.d/pkg/prometheus/selector/README.md). - Option syntax: ```yaml @@ -266,6 +265,8 @@ jobs: ### Debug Mode +**Important**: Debug mode is not supported for data collection jobs created via the UI using the Dyncfg feature. + To troubleshoot issues with the `prometheus` collector, run the `go.d.plugin` with the debug option enabled. The output should give you clues as to why the collector isn't working. @@ -288,4 +289,37 @@ should give you clues as to why the collector isn't working. ./go.d.plugin -d -m prometheus ``` +### Getting Logs + +If you're encountering problems with the `prometheus` collector, follow these steps to retrieve logs and identify potential issues: + +- **Run the command** specific to your system (systemd, non-systemd, or Docker container). +- **Examine the output** for any warnings or error messages that might indicate issues. These messages should provide clues about the root cause of the problem. + +#### System with systemd + +Use the following command to view logs generated since the last Netdata service restart: + +```bash +journalctl _SYSTEMD_INVOCATION_ID="$(systemctl show --value --property=InvocationID netdata)" --namespace=netdata --grep prometheus +``` + +#### System without systemd + +Locate the collector log file, typically at `/var/log/netdata/collector.log`, and use `grep` to filter for collector's name: + +```bash +grep prometheus /var/log/netdata/collector.log +``` + +**Note**: This method shows logs from all restarts. Focus on the **latest entries** for troubleshooting current issues. + +#### Docker Container + +If your Netdata runs in a Docker container named "netdata" (replace if different), use this command: + +```bash +docker logs netdata 2>&1 | grep prometheus +``` + diff --git a/src/go/collectors/go.d.plugin/modules/prometheus/integrations/aws_sqs.md b/src/go/plugin/go.d/modules/prometheus/integrations/aws_sqs.md index c47c9ab5d..b2760e205 100644 --- a/src/go/collectors/go.d.plugin/modules/prometheus/integrations/aws_sqs.md +++ b/src/go/plugin/go.d/modules/prometheus/integrations/aws_sqs.md @@ -1,6 +1,6 @@ <!--startmeta -custom_edit_url: "https://github.com/netdata/netdata/edit/master/src/go/collectors/go.d.plugin/modules/prometheus/integrations/aws_sqs.md" -meta_yaml: "https://github.com/netdata/netdata/edit/master/src/go/collectors/go.d.plugin/modules/prometheus/metadata.yaml" +custom_edit_url: "https://github.com/netdata/netdata/edit/master/src/go/plugin/go.d/modules/prometheus/integrations/aws_sqs.md" +meta_yaml: "https://github.com/netdata/netdata/edit/master/src/go/plugin/go.d/modules/prometheus/metadata.yaml" sidebar_label: "AWS SQS" learn_status: "Published" learn_rel_path: "Collecting Metrics/Cloud Provider Managed" @@ -37,7 +37,6 @@ This collector supports collecting metrics from multiple instances of this integ #### Auto-Detection By default, it detects instances running on the local host by trying to connect to known ports that are [allocated to exporters](https://github.com/prometheus/prometheus/wiki/Default-port-allocations). -The full list of endpoints is available in the collector's [configuration file](https://github.com/netdata/netdata/blob/master/src/go/collectors/go.d.plugin/config/go.d/prometheus.conf). #### Limits @@ -138,7 +137,7 @@ The following options can be defined globally: update_every, autodetection_retry This option allows you to filter out unwanted time series. Only metrics matching the selector will be collected. - Logic: (pattern1 OR pattern2) AND !(pattern3 or pattern4) -- Pattern syntax: [selector](/src/go/collectors/go.d.plugin/pkg/prometheus/selector/README.md). +- Pattern syntax: [selector](/src/go/plugin/go.d/pkg/prometheus/selector/README.md). - Option syntax: ```yaml @@ -266,6 +265,8 @@ jobs: ### Debug Mode +**Important**: Debug mode is not supported for data collection jobs created via the UI using the Dyncfg feature. + To troubleshoot issues with the `prometheus` collector, run the `go.d.plugin` with the debug option enabled. The output should give you clues as to why the collector isn't working. @@ -288,4 +289,37 @@ should give you clues as to why the collector isn't working. ./go.d.plugin -d -m prometheus ``` +### Getting Logs + +If you're encountering problems with the `prometheus` collector, follow these steps to retrieve logs and identify potential issues: + +- **Run the command** specific to your system (systemd, non-systemd, or Docker container). +- **Examine the output** for any warnings or error messages that might indicate issues. These messages should provide clues about the root cause of the problem. + +#### System with systemd + +Use the following command to view logs generated since the last Netdata service restart: + +```bash +journalctl _SYSTEMD_INVOCATION_ID="$(systemctl show --value --property=InvocationID netdata)" --namespace=netdata --grep prometheus +``` + +#### System without systemd + +Locate the collector log file, typically at `/var/log/netdata/collector.log`, and use `grep` to filter for collector's name: + +```bash +grep prometheus /var/log/netdata/collector.log +``` + +**Note**: This method shows logs from all restarts. Focus on the **latest entries** for troubleshooting current issues. + +#### Docker Container + +If your Netdata runs in a Docker container named "netdata" (replace if different), use this command: + +```bash +docker logs netdata 2>&1 | grep prometheus +``` + diff --git a/src/go/collectors/go.d.plugin/modules/prometheus/integrations/azure_ad_app_passwords.md b/src/go/plugin/go.d/modules/prometheus/integrations/azure_ad_app_passwords.md index 7cc470b5f..1f1ce0a85 100644 --- a/src/go/collectors/go.d.plugin/modules/prometheus/integrations/azure_ad_app_passwords.md +++ b/src/go/plugin/go.d/modules/prometheus/integrations/azure_ad_app_passwords.md @@ -1,6 +1,6 @@ <!--startmeta -custom_edit_url: "https://github.com/netdata/netdata/edit/master/src/go/collectors/go.d.plugin/modules/prometheus/integrations/azure_ad_app_passwords.md" -meta_yaml: "https://github.com/netdata/netdata/edit/master/src/go/collectors/go.d.plugin/modules/prometheus/metadata.yaml" +custom_edit_url: "https://github.com/netdata/netdata/edit/master/src/go/plugin/go.d/modules/prometheus/integrations/azure_ad_app_passwords.md" +meta_yaml: "https://github.com/netdata/netdata/edit/master/src/go/plugin/go.d/modules/prometheus/metadata.yaml" sidebar_label: "Azure AD App passwords" learn_status: "Published" learn_rel_path: "Collecting Metrics/Cloud Provider Managed" @@ -37,7 +37,6 @@ This collector supports collecting metrics from multiple instances of this integ #### Auto-Detection By default, it detects instances running on the local host by trying to connect to known ports that are [allocated to exporters](https://github.com/prometheus/prometheus/wiki/Default-port-allocations). -The full list of endpoints is available in the collector's [configuration file](https://github.com/netdata/netdata/blob/master/src/go/collectors/go.d.plugin/config/go.d/prometheus.conf). #### Limits @@ -138,7 +137,7 @@ The following options can be defined globally: update_every, autodetection_retry This option allows you to filter out unwanted time series. Only metrics matching the selector will be collected. - Logic: (pattern1 OR pattern2) AND !(pattern3 or pattern4) -- Pattern syntax: [selector](/src/go/collectors/go.d.plugin/pkg/prometheus/selector/README.md). +- Pattern syntax: [selector](/src/go/plugin/go.d/pkg/prometheus/selector/README.md). - Option syntax: ```yaml @@ -266,6 +265,8 @@ jobs: ### Debug Mode +**Important**: Debug mode is not supported for data collection jobs created via the UI using the Dyncfg feature. + To troubleshoot issues with the `prometheus` collector, run the `go.d.plugin` with the debug option enabled. The output should give you clues as to why the collector isn't working. @@ -288,4 +289,37 @@ should give you clues as to why the collector isn't working. ./go.d.plugin -d -m prometheus ``` +### Getting Logs + +If you're encountering problems with the `prometheus` collector, follow these steps to retrieve logs and identify potential issues: + +- **Run the command** specific to your system (systemd, non-systemd, or Docker container). +- **Examine the output** for any warnings or error messages that might indicate issues. These messages should provide clues about the root cause of the problem. + +#### System with systemd + +Use the following command to view logs generated since the last Netdata service restart: + +```bash +journalctl _SYSTEMD_INVOCATION_ID="$(systemctl show --value --property=InvocationID netdata)" --namespace=netdata --grep prometheus +``` + +#### System without systemd + +Locate the collector log file, typically at `/var/log/netdata/collector.log`, and use `grep` to filter for collector's name: + +```bash +grep prometheus /var/log/netdata/collector.log +``` + +**Note**: This method shows logs from all restarts. Focus on the **latest entries** for troubleshooting current issues. + +#### Docker Container + +If your Netdata runs in a Docker container named "netdata" (replace if different), use this command: + +```bash +docker logs netdata 2>&1 | grep prometheus +``` + diff --git a/src/go/collectors/go.d.plugin/modules/prometheus/integrations/azure_application.md b/src/go/plugin/go.d/modules/prometheus/integrations/azure_application.md index 0506121dd..55f124658 100644 --- a/src/go/collectors/go.d.plugin/modules/prometheus/integrations/azure_application.md +++ b/src/go/plugin/go.d/modules/prometheus/integrations/azure_application.md @@ -1,6 +1,6 @@ <!--startmeta -custom_edit_url: "https://github.com/netdata/netdata/edit/master/src/go/collectors/go.d.plugin/modules/prometheus/integrations/azure_application.md" -meta_yaml: "https://github.com/netdata/netdata/edit/master/src/go/collectors/go.d.plugin/modules/prometheus/metadata.yaml" +custom_edit_url: "https://github.com/netdata/netdata/edit/master/src/go/plugin/go.d/modules/prometheus/integrations/azure_application.md" +meta_yaml: "https://github.com/netdata/netdata/edit/master/src/go/plugin/go.d/modules/prometheus/metadata.yaml" sidebar_label: "Azure application" learn_status: "Published" learn_rel_path: "Collecting Metrics/Cloud Provider Managed" @@ -37,7 +37,6 @@ This collector supports collecting metrics from multiple instances of this integ #### Auto-Detection By default, it detects instances running on the local host by trying to connect to known ports that are [allocated to exporters](https://github.com/prometheus/prometheus/wiki/Default-port-allocations). -The full list of endpoints is available in the collector's [configuration file](https://github.com/netdata/netdata/blob/master/src/go/collectors/go.d.plugin/config/go.d/prometheus.conf). #### Limits @@ -138,7 +137,7 @@ The following options can be defined globally: update_every, autodetection_retry This option allows you to filter out unwanted time series. Only metrics matching the selector will be collected. - Logic: (pattern1 OR pattern2) AND !(pattern3 or pattern4) -- Pattern syntax: [selector](/src/go/collectors/go.d.plugin/pkg/prometheus/selector/README.md). +- Pattern syntax: [selector](/src/go/plugin/go.d/pkg/prometheus/selector/README.md). - Option syntax: ```yaml @@ -266,6 +265,8 @@ jobs: ### Debug Mode +**Important**: Debug mode is not supported for data collection jobs created via the UI using the Dyncfg feature. + To troubleshoot issues with the `prometheus` collector, run the `go.d.plugin` with the debug option enabled. The output should give you clues as to why the collector isn't working. @@ -288,4 +289,37 @@ should give you clues as to why the collector isn't working. ./go.d.plugin -d -m prometheus ``` +### Getting Logs + +If you're encountering problems with the `prometheus` collector, follow these steps to retrieve logs and identify potential issues: + +- **Run the command** specific to your system (systemd, non-systemd, or Docker container). +- **Examine the output** for any warnings or error messages that might indicate issues. These messages should provide clues about the root cause of the problem. + +#### System with systemd + +Use the following command to view logs generated since the last Netdata service restart: + +```bash +journalctl _SYSTEMD_INVOCATION_ID="$(systemctl show --value --property=InvocationID netdata)" --namespace=netdata --grep prometheus +``` + +#### System without systemd + +Locate the collector log file, typically at `/var/log/netdata/collector.log`, and use `grep` to filter for collector's name: + +```bash +grep prometheus /var/log/netdata/collector.log +``` + +**Note**: This method shows logs from all restarts. Focus on the **latest entries** for troubleshooting current issues. + +#### Docker Container + +If your Netdata runs in a Docker container named "netdata" (replace if different), use this command: + +```bash +docker logs netdata 2>&1 | grep prometheus +``` + diff --git a/src/go/collectors/go.d.plugin/modules/prometheus/integrations/azure_elastic_pool_sql.md b/src/go/plugin/go.d/modules/prometheus/integrations/azure_elastic_pool_sql.md index 9b4fa439f..0fa89bff2 100644 --- a/src/go/collectors/go.d.plugin/modules/prometheus/integrations/azure_elastic_pool_sql.md +++ b/src/go/plugin/go.d/modules/prometheus/integrations/azure_elastic_pool_sql.md @@ -1,6 +1,6 @@ <!--startmeta -custom_edit_url: "https://github.com/netdata/netdata/edit/master/src/go/collectors/go.d.plugin/modules/prometheus/integrations/azure_elastic_pool_sql.md" -meta_yaml: "https://github.com/netdata/netdata/edit/master/src/go/collectors/go.d.plugin/modules/prometheus/metadata.yaml" +custom_edit_url: "https://github.com/netdata/netdata/edit/master/src/go/plugin/go.d/modules/prometheus/integrations/azure_elastic_pool_sql.md" +meta_yaml: "https://github.com/netdata/netdata/edit/master/src/go/plugin/go.d/modules/prometheus/metadata.yaml" sidebar_label: "Azure Elastic Pool SQL" learn_status: "Published" learn_rel_path: "Collecting Metrics/Cloud Provider Managed" @@ -37,7 +37,6 @@ This collector supports collecting metrics from multiple instances of this integ #### Auto-Detection By default, it detects instances running on the local host by trying to connect to known ports that are [allocated to exporters](https://github.com/prometheus/prometheus/wiki/Default-port-allocations). -The full list of endpoints is available in the collector's [configuration file](https://github.com/netdata/netdata/blob/master/src/go/collectors/go.d.plugin/config/go.d/prometheus.conf). #### Limits @@ -138,7 +137,7 @@ The following options can be defined globally: update_every, autodetection_retry This option allows you to filter out unwanted time series. Only metrics matching the selector will be collected. - Logic: (pattern1 OR pattern2) AND !(pattern3 or pattern4) -- Pattern syntax: [selector](/src/go/collectors/go.d.plugin/pkg/prometheus/selector/README.md). +- Pattern syntax: [selector](/src/go/plugin/go.d/pkg/prometheus/selector/README.md). - Option syntax: ```yaml @@ -266,6 +265,8 @@ jobs: ### Debug Mode +**Important**: Debug mode is not supported for data collection jobs created via the UI using the Dyncfg feature. + To troubleshoot issues with the `prometheus` collector, run the `go.d.plugin` with the debug option enabled. The output should give you clues as to why the collector isn't working. @@ -288,4 +289,37 @@ should give you clues as to why the collector isn't working. ./go.d.plugin -d -m prometheus ``` +### Getting Logs + +If you're encountering problems with the `prometheus` collector, follow these steps to retrieve logs and identify potential issues: + +- **Run the command** specific to your system (systemd, non-systemd, or Docker container). +- **Examine the output** for any warnings or error messages that might indicate issues. These messages should provide clues about the root cause of the problem. + +#### System with systemd + +Use the following command to view logs generated since the last Netdata service restart: + +```bash +journalctl _SYSTEMD_INVOCATION_ID="$(systemctl show --value --property=InvocationID netdata)" --namespace=netdata --grep prometheus +``` + +#### System without systemd + +Locate the collector log file, typically at `/var/log/netdata/collector.log`, and use `grep` to filter for collector's name: + +```bash +grep prometheus /var/log/netdata/collector.log +``` + +**Note**: This method shows logs from all restarts. Focus on the **latest entries** for troubleshooting current issues. + +#### Docker Container + +If your Netdata runs in a Docker container named "netdata" (replace if different), use this command: + +```bash +docker logs netdata 2>&1 | grep prometheus +``` + diff --git a/src/go/collectors/go.d.plugin/modules/prometheus/integrations/azure_resources.md b/src/go/plugin/go.d/modules/prometheus/integrations/azure_resources.md index f4bf49a24..c63e0ad1d 100644 --- a/src/go/collectors/go.d.plugin/modules/prometheus/integrations/azure_resources.md +++ b/src/go/plugin/go.d/modules/prometheus/integrations/azure_resources.md @@ -1,6 +1,6 @@ <!--startmeta -custom_edit_url: "https://github.com/netdata/netdata/edit/master/src/go/collectors/go.d.plugin/modules/prometheus/integrations/azure_resources.md" -meta_yaml: "https://github.com/netdata/netdata/edit/master/src/go/collectors/go.d.plugin/modules/prometheus/metadata.yaml" +custom_edit_url: "https://github.com/netdata/netdata/edit/master/src/go/plugin/go.d/modules/prometheus/integrations/azure_resources.md" +meta_yaml: "https://github.com/netdata/netdata/edit/master/src/go/plugin/go.d/modules/prometheus/metadata.yaml" sidebar_label: "Azure Resources" learn_status: "Published" learn_rel_path: "Collecting Metrics/Cloud Provider Managed" @@ -37,7 +37,6 @@ This collector supports collecting metrics from multiple instances of this integ #### Auto-Detection By default, it detects instances running on the local host by trying to connect to known ports that are [allocated to exporters](https://github.com/prometheus/prometheus/wiki/Default-port-allocations). -The full list of endpoints is available in the collector's [configuration file](https://github.com/netdata/netdata/blob/master/src/go/collectors/go.d.plugin/config/go.d/prometheus.conf). #### Limits @@ -138,7 +137,7 @@ The following options can be defined globally: update_every, autodetection_retry This option allows you to filter out unwanted time series. Only metrics matching the selector will be collected. - Logic: (pattern1 OR pattern2) AND !(pattern3 or pattern4) -- Pattern syntax: [selector](/src/go/collectors/go.d.plugin/pkg/prometheus/selector/README.md). +- Pattern syntax: [selector](/src/go/plugin/go.d/pkg/prometheus/selector/README.md). - Option syntax: ```yaml @@ -266,6 +265,8 @@ jobs: ### Debug Mode +**Important**: Debug mode is not supported for data collection jobs created via the UI using the Dyncfg feature. + To troubleshoot issues with the `prometheus` collector, run the `go.d.plugin` with the debug option enabled. The output should give you clues as to why the collector isn't working. @@ -288,4 +289,37 @@ should give you clues as to why the collector isn't working. ./go.d.plugin -d -m prometheus ``` +### Getting Logs + +If you're encountering problems with the `prometheus` collector, follow these steps to retrieve logs and identify potential issues: + +- **Run the command** specific to your system (systemd, non-systemd, or Docker container). +- **Examine the output** for any warnings or error messages that might indicate issues. These messages should provide clues about the root cause of the problem. + +#### System with systemd + +Use the following command to view logs generated since the last Netdata service restart: + +```bash +journalctl _SYSTEMD_INVOCATION_ID="$(systemctl show --value --property=InvocationID netdata)" --namespace=netdata --grep prometheus +``` + +#### System without systemd + +Locate the collector log file, typically at `/var/log/netdata/collector.log`, and use `grep` to filter for collector's name: + +```bash +grep prometheus /var/log/netdata/collector.log +``` + +**Note**: This method shows logs from all restarts. Focus on the **latest entries** for troubleshooting current issues. + +#### Docker Container + +If your Netdata runs in a Docker container named "netdata" (replace if different), use this command: + +```bash +docker logs netdata 2>&1 | grep prometheus +``` + diff --git a/src/go/collectors/go.d.plugin/modules/prometheus/integrations/azure_service_bus.md b/src/go/plugin/go.d/modules/prometheus/integrations/azure_service_bus.md index 98ea56cd1..c1a641aaa 100644 --- a/src/go/collectors/go.d.plugin/modules/prometheus/integrations/azure_service_bus.md +++ b/src/go/plugin/go.d/modules/prometheus/integrations/azure_service_bus.md @@ -1,6 +1,6 @@ <!--startmeta -custom_edit_url: "https://github.com/netdata/netdata/edit/master/src/go/collectors/go.d.plugin/modules/prometheus/integrations/azure_service_bus.md" -meta_yaml: "https://github.com/netdata/netdata/edit/master/src/go/collectors/go.d.plugin/modules/prometheus/metadata.yaml" +custom_edit_url: "https://github.com/netdata/netdata/edit/master/src/go/plugin/go.d/modules/prometheus/integrations/azure_service_bus.md" +meta_yaml: "https://github.com/netdata/netdata/edit/master/src/go/plugin/go.d/modules/prometheus/metadata.yaml" sidebar_label: "Azure Service Bus" learn_status: "Published" learn_rel_path: "Collecting Metrics/Cloud Provider Managed" @@ -37,7 +37,6 @@ This collector supports collecting metrics from multiple instances of this integ #### Auto-Detection By default, it detects instances running on the local host by trying to connect to known ports that are [allocated to exporters](https://github.com/prometheus/prometheus/wiki/Default-port-allocations). -The full list of endpoints is available in the collector's [configuration file](https://github.com/netdata/netdata/blob/master/src/go/collectors/go.d.plugin/config/go.d/prometheus.conf). #### Limits @@ -138,7 +137,7 @@ The following options can be defined globally: update_every, autodetection_retry This option allows you to filter out unwanted time series. Only metrics matching the selector will be collected. - Logic: (pattern1 OR pattern2) AND !(pattern3 or pattern4) -- Pattern syntax: [selector](/src/go/collectors/go.d.plugin/pkg/prometheus/selector/README.md). +- Pattern syntax: [selector](/src/go/plugin/go.d/pkg/prometheus/selector/README.md). - Option syntax: ```yaml @@ -266,6 +265,8 @@ jobs: ### Debug Mode +**Important**: Debug mode is not supported for data collection jobs created via the UI using the Dyncfg feature. + To troubleshoot issues with the `prometheus` collector, run the `go.d.plugin` with the debug option enabled. The output should give you clues as to why the collector isn't working. @@ -288,4 +289,37 @@ should give you clues as to why the collector isn't working. ./go.d.plugin -d -m prometheus ``` +### Getting Logs + +If you're encountering problems with the `prometheus` collector, follow these steps to retrieve logs and identify potential issues: + +- **Run the command** specific to your system (systemd, non-systemd, or Docker container). +- **Examine the output** for any warnings or error messages that might indicate issues. These messages should provide clues about the root cause of the problem. + +#### System with systemd + +Use the following command to view logs generated since the last Netdata service restart: + +```bash +journalctl _SYSTEMD_INVOCATION_ID="$(systemctl show --value --property=InvocationID netdata)" --namespace=netdata --grep prometheus +``` + +#### System without systemd + +Locate the collector log file, typically at `/var/log/netdata/collector.log`, and use `grep` to filter for collector's name: + +```bash +grep prometheus /var/log/netdata/collector.log +``` + +**Note**: This method shows logs from all restarts. Focus on the **latest entries** for troubleshooting current issues. + +#### Docker Container + +If your Netdata runs in a Docker container named "netdata" (replace if different), use this command: + +```bash +docker logs netdata 2>&1 | grep prometheus +``` + diff --git a/src/go/collectors/go.d.plugin/modules/prometheus/integrations/azure_sql.md b/src/go/plugin/go.d/modules/prometheus/integrations/azure_sql.md index 84519f1f6..98a933eb6 100644 --- a/src/go/collectors/go.d.plugin/modules/prometheus/integrations/azure_sql.md +++ b/src/go/plugin/go.d/modules/prometheus/integrations/azure_sql.md @@ -1,6 +1,6 @@ <!--startmeta -custom_edit_url: "https://github.com/netdata/netdata/edit/master/src/go/collectors/go.d.plugin/modules/prometheus/integrations/azure_sql.md" -meta_yaml: "https://github.com/netdata/netdata/edit/master/src/go/collectors/go.d.plugin/modules/prometheus/metadata.yaml" +custom_edit_url: "https://github.com/netdata/netdata/edit/master/src/go/plugin/go.d/modules/prometheus/integrations/azure_sql.md" +meta_yaml: "https://github.com/netdata/netdata/edit/master/src/go/plugin/go.d/modules/prometheus/metadata.yaml" sidebar_label: "Azure SQL" learn_status: "Published" learn_rel_path: "Collecting Metrics/Cloud Provider Managed" @@ -37,7 +37,6 @@ This collector supports collecting metrics from multiple instances of this integ #### Auto-Detection By default, it detects instances running on the local host by trying to connect to known ports that are [allocated to exporters](https://github.com/prometheus/prometheus/wiki/Default-port-allocations). -The full list of endpoints is available in the collector's [configuration file](https://github.com/netdata/netdata/blob/master/src/go/collectors/go.d.plugin/config/go.d/prometheus.conf). #### Limits @@ -138,7 +137,7 @@ The following options can be defined globally: update_every, autodetection_retry This option allows you to filter out unwanted time series. Only metrics matching the selector will be collected. - Logic: (pattern1 OR pattern2) AND !(pattern3 or pattern4) -- Pattern syntax: [selector](/src/go/collectors/go.d.plugin/pkg/prometheus/selector/README.md). +- Pattern syntax: [selector](/src/go/plugin/go.d/pkg/prometheus/selector/README.md). - Option syntax: ```yaml @@ -266,6 +265,8 @@ jobs: ### Debug Mode +**Important**: Debug mode is not supported for data collection jobs created via the UI using the Dyncfg feature. + To troubleshoot issues with the `prometheus` collector, run the `go.d.plugin` with the debug option enabled. The output should give you clues as to why the collector isn't working. @@ -288,4 +289,37 @@ should give you clues as to why the collector isn't working. ./go.d.plugin -d -m prometheus ``` +### Getting Logs + +If you're encountering problems with the `prometheus` collector, follow these steps to retrieve logs and identify potential issues: + +- **Run the command** specific to your system (systemd, non-systemd, or Docker container). +- **Examine the output** for any warnings or error messages that might indicate issues. These messages should provide clues about the root cause of the problem. + +#### System with systemd + +Use the following command to view logs generated since the last Netdata service restart: + +```bash +journalctl _SYSTEMD_INVOCATION_ID="$(systemctl show --value --property=InvocationID netdata)" --namespace=netdata --grep prometheus +``` + +#### System without systemd + +Locate the collector log file, typically at `/var/log/netdata/collector.log`, and use `grep` to filter for collector's name: + +```bash +grep prometheus /var/log/netdata/collector.log +``` + +**Note**: This method shows logs from all restarts. Focus on the **latest entries** for troubleshooting current issues. + +#### Docker Container + +If your Netdata runs in a Docker container named "netdata" (replace if different), use this command: + +```bash +docker logs netdata 2>&1 | grep prometheus +``` + diff --git a/src/go/collectors/go.d.plugin/modules/prometheus/integrations/bigquery.md b/src/go/plugin/go.d/modules/prometheus/integrations/bigquery.md index dd3803557..a76ff8fb3 100644 --- a/src/go/collectors/go.d.plugin/modules/prometheus/integrations/bigquery.md +++ b/src/go/plugin/go.d/modules/prometheus/integrations/bigquery.md @@ -1,6 +1,6 @@ <!--startmeta -custom_edit_url: "https://github.com/netdata/netdata/edit/master/src/go/collectors/go.d.plugin/modules/prometheus/integrations/bigquery.md" -meta_yaml: "https://github.com/netdata/netdata/edit/master/src/go/collectors/go.d.plugin/modules/prometheus/metadata.yaml" +custom_edit_url: "https://github.com/netdata/netdata/edit/master/src/go/plugin/go.d/modules/prometheus/integrations/bigquery.md" +meta_yaml: "https://github.com/netdata/netdata/edit/master/src/go/plugin/go.d/modules/prometheus/metadata.yaml" sidebar_label: "BigQuery" learn_status: "Published" learn_rel_path: "Collecting Metrics/Cloud Provider Managed" @@ -37,7 +37,6 @@ This collector supports collecting metrics from multiple instances of this integ #### Auto-Detection By default, it detects instances running on the local host by trying to connect to known ports that are [allocated to exporters](https://github.com/prometheus/prometheus/wiki/Default-port-allocations). -The full list of endpoints is available in the collector's [configuration file](https://github.com/netdata/netdata/blob/master/src/go/collectors/go.d.plugin/config/go.d/prometheus.conf). #### Limits @@ -138,7 +137,7 @@ The following options can be defined globally: update_every, autodetection_retry This option allows you to filter out unwanted time series. Only metrics matching the selector will be collected. - Logic: (pattern1 OR pattern2) AND !(pattern3 or pattern4) -- Pattern syntax: [selector](/src/go/collectors/go.d.plugin/pkg/prometheus/selector/README.md). +- Pattern syntax: [selector](/src/go/plugin/go.d/pkg/prometheus/selector/README.md). - Option syntax: ```yaml @@ -266,6 +265,8 @@ jobs: ### Debug Mode +**Important**: Debug mode is not supported for data collection jobs created via the UI using the Dyncfg feature. + To troubleshoot issues with the `prometheus` collector, run the `go.d.plugin` with the debug option enabled. The output should give you clues as to why the collector isn't working. @@ -288,4 +289,37 @@ should give you clues as to why the collector isn't working. ./go.d.plugin -d -m prometheus ``` +### Getting Logs + +If you're encountering problems with the `prometheus` collector, follow these steps to retrieve logs and identify potential issues: + +- **Run the command** specific to your system (systemd, non-systemd, or Docker container). +- **Examine the output** for any warnings or error messages that might indicate issues. These messages should provide clues about the root cause of the problem. + +#### System with systemd + +Use the following command to view logs generated since the last Netdata service restart: + +```bash +journalctl _SYSTEMD_INVOCATION_ID="$(systemctl show --value --property=InvocationID netdata)" --namespace=netdata --grep prometheus +``` + +#### System without systemd + +Locate the collector log file, typically at `/var/log/netdata/collector.log`, and use `grep` to filter for collector's name: + +```bash +grep prometheus /var/log/netdata/collector.log +``` + +**Note**: This method shows logs from all restarts. Focus on the **latest entries** for troubleshooting current issues. + +#### Docker Container + +If your Netdata runs in a Docker container named "netdata" (replace if different), use this command: + +```bash +docker logs netdata 2>&1 | grep prometheus +``` + diff --git a/src/go/collectors/go.d.plugin/modules/prometheus/integrations/bird_routing_daemon.md b/src/go/plugin/go.d/modules/prometheus/integrations/bird_routing_daemon.md index 5b54fe191..43318c4c5 100644 --- a/src/go/collectors/go.d.plugin/modules/prometheus/integrations/bird_routing_daemon.md +++ b/src/go/plugin/go.d/modules/prometheus/integrations/bird_routing_daemon.md @@ -1,6 +1,6 @@ <!--startmeta -custom_edit_url: "https://github.com/netdata/netdata/edit/master/src/go/collectors/go.d.plugin/modules/prometheus/integrations/bird_routing_daemon.md" -meta_yaml: "https://github.com/netdata/netdata/edit/master/src/go/collectors/go.d.plugin/modules/prometheus/metadata.yaml" +custom_edit_url: "https://github.com/netdata/netdata/edit/master/src/go/plugin/go.d/modules/prometheus/integrations/bird_routing_daemon.md" +meta_yaml: "https://github.com/netdata/netdata/edit/master/src/go/plugin/go.d/modules/prometheus/metadata.yaml" sidebar_label: "Bird Routing Daemon" learn_status: "Published" learn_rel_path: "Collecting Metrics/Networking Stack and Network Interfaces" @@ -37,7 +37,6 @@ This collector supports collecting metrics from multiple instances of this integ #### Auto-Detection By default, it detects instances running on the local host by trying to connect to known ports that are [allocated to exporters](https://github.com/prometheus/prometheus/wiki/Default-port-allocations). -The full list of endpoints is available in the collector's [configuration file](https://github.com/netdata/netdata/blob/master/src/go/collectors/go.d.plugin/config/go.d/prometheus.conf). #### Limits @@ -138,7 +137,7 @@ The following options can be defined globally: update_every, autodetection_retry This option allows you to filter out unwanted time series. Only metrics matching the selector will be collected. - Logic: (pattern1 OR pattern2) AND !(pattern3 or pattern4) -- Pattern syntax: [selector](/src/go/collectors/go.d.plugin/pkg/prometheus/selector/README.md). +- Pattern syntax: [selector](/src/go/plugin/go.d/pkg/prometheus/selector/README.md). - Option syntax: ```yaml @@ -266,6 +265,8 @@ jobs: ### Debug Mode +**Important**: Debug mode is not supported for data collection jobs created via the UI using the Dyncfg feature. + To troubleshoot issues with the `prometheus` collector, run the `go.d.plugin` with the debug option enabled. The output should give you clues as to why the collector isn't working. @@ -288,4 +289,37 @@ should give you clues as to why the collector isn't working. ./go.d.plugin -d -m prometheus ``` +### Getting Logs + +If you're encountering problems with the `prometheus` collector, follow these steps to retrieve logs and identify potential issues: + +- **Run the command** specific to your system (systemd, non-systemd, or Docker container). +- **Examine the output** for any warnings or error messages that might indicate issues. These messages should provide clues about the root cause of the problem. + +#### System with systemd + +Use the following command to view logs generated since the last Netdata service restart: + +```bash +journalctl _SYSTEMD_INVOCATION_ID="$(systemctl show --value --property=InvocationID netdata)" --namespace=netdata --grep prometheus +``` + +#### System without systemd + +Locate the collector log file, typically at `/var/log/netdata/collector.log`, and use `grep` to filter for collector's name: + +```bash +grep prometheus /var/log/netdata/collector.log +``` + +**Note**: This method shows logs from all restarts. Focus on the **latest entries** for troubleshooting current issues. + +#### Docker Container + +If your Netdata runs in a Docker container named "netdata" (replace if different), use this command: + +```bash +docker logs netdata 2>&1 | grep prometheus +``` + diff --git a/src/go/collectors/go.d.plugin/modules/prometheus/integrations/blackbox.md b/src/go/plugin/go.d/modules/prometheus/integrations/blackbox.md index d46e0f72e..d37019b6d 100644 --- a/src/go/collectors/go.d.plugin/modules/prometheus/integrations/blackbox.md +++ b/src/go/plugin/go.d/modules/prometheus/integrations/blackbox.md @@ -1,6 +1,6 @@ <!--startmeta -custom_edit_url: "https://github.com/netdata/netdata/edit/master/src/go/collectors/go.d.plugin/modules/prometheus/integrations/blackbox.md" -meta_yaml: "https://github.com/netdata/netdata/edit/master/src/go/collectors/go.d.plugin/modules/prometheus/metadata.yaml" +custom_edit_url: "https://github.com/netdata/netdata/edit/master/src/go/plugin/go.d/modules/prometheus/integrations/blackbox.md" +meta_yaml: "https://github.com/netdata/netdata/edit/master/src/go/plugin/go.d/modules/prometheus/metadata.yaml" sidebar_label: "Blackbox" learn_status: "Published" learn_rel_path: "Collecting Metrics/Synthetic Checks" @@ -37,7 +37,6 @@ This collector supports collecting metrics from multiple instances of this integ #### Auto-Detection By default, it detects instances running on the local host by trying to connect to known ports that are [allocated to exporters](https://github.com/prometheus/prometheus/wiki/Default-port-allocations). -The full list of endpoints is available in the collector's [configuration file](https://github.com/netdata/netdata/blob/master/src/go/collectors/go.d.plugin/config/go.d/prometheus.conf). #### Limits @@ -138,7 +137,7 @@ The following options can be defined globally: update_every, autodetection_retry This option allows you to filter out unwanted time series. Only metrics matching the selector will be collected. - Logic: (pattern1 OR pattern2) AND !(pattern3 or pattern4) -- Pattern syntax: [selector](/src/go/collectors/go.d.plugin/pkg/prometheus/selector/README.md). +- Pattern syntax: [selector](/src/go/plugin/go.d/pkg/prometheus/selector/README.md). - Option syntax: ```yaml @@ -266,6 +265,8 @@ jobs: ### Debug Mode +**Important**: Debug mode is not supported for data collection jobs created via the UI using the Dyncfg feature. + To troubleshoot issues with the `prometheus` collector, run the `go.d.plugin` with the debug option enabled. The output should give you clues as to why the collector isn't working. @@ -288,4 +289,37 @@ should give you clues as to why the collector isn't working. ./go.d.plugin -d -m prometheus ``` +### Getting Logs + +If you're encountering problems with the `prometheus` collector, follow these steps to retrieve logs and identify potential issues: + +- **Run the command** specific to your system (systemd, non-systemd, or Docker container). +- **Examine the output** for any warnings or error messages that might indicate issues. These messages should provide clues about the root cause of the problem. + +#### System with systemd + +Use the following command to view logs generated since the last Netdata service restart: + +```bash +journalctl _SYSTEMD_INVOCATION_ID="$(systemctl show --value --property=InvocationID netdata)" --namespace=netdata --grep prometheus +``` + +#### System without systemd + +Locate the collector log file, typically at `/var/log/netdata/collector.log`, and use `grep` to filter for collector's name: + +```bash +grep prometheus /var/log/netdata/collector.log +``` + +**Note**: This method shows logs from all restarts. Focus on the **latest entries** for troubleshooting current issues. + +#### Docker Container + +If your Netdata runs in a Docker container named "netdata" (replace if different), use this command: + +```bash +docker logs netdata 2>&1 | grep prometheus +``` + diff --git a/src/go/collectors/go.d.plugin/modules/prometheus/integrations/bobcat_miner_300.md b/src/go/plugin/go.d/modules/prometheus/integrations/bobcat_miner_300.md index 66038390f..c00ccaa7d 100644 --- a/src/go/collectors/go.d.plugin/modules/prometheus/integrations/bobcat_miner_300.md +++ b/src/go/plugin/go.d/modules/prometheus/integrations/bobcat_miner_300.md @@ -1,6 +1,6 @@ <!--startmeta -custom_edit_url: "https://github.com/netdata/netdata/edit/master/src/go/collectors/go.d.plugin/modules/prometheus/integrations/bobcat_miner_300.md" -meta_yaml: "https://github.com/netdata/netdata/edit/master/src/go/collectors/go.d.plugin/modules/prometheus/metadata.yaml" +custom_edit_url: "https://github.com/netdata/netdata/edit/master/src/go/plugin/go.d/modules/prometheus/integrations/bobcat_miner_300.md" +meta_yaml: "https://github.com/netdata/netdata/edit/master/src/go/plugin/go.d/modules/prometheus/metadata.yaml" sidebar_label: "Bobcat Miner 300" learn_status: "Published" learn_rel_path: "Collecting Metrics/IoT Devices" @@ -37,7 +37,6 @@ This collector supports collecting metrics from multiple instances of this integ #### Auto-Detection By default, it detects instances running on the local host by trying to connect to known ports that are [allocated to exporters](https://github.com/prometheus/prometheus/wiki/Default-port-allocations). -The full list of endpoints is available in the collector's [configuration file](https://github.com/netdata/netdata/blob/master/src/go/collectors/go.d.plugin/config/go.d/prometheus.conf). #### Limits @@ -138,7 +137,7 @@ The following options can be defined globally: update_every, autodetection_retry This option allows you to filter out unwanted time series. Only metrics matching the selector will be collected. - Logic: (pattern1 OR pattern2) AND !(pattern3 or pattern4) -- Pattern syntax: [selector](/src/go/collectors/go.d.plugin/pkg/prometheus/selector/README.md). +- Pattern syntax: [selector](/src/go/plugin/go.d/pkg/prometheus/selector/README.md). - Option syntax: ```yaml @@ -266,6 +265,8 @@ jobs: ### Debug Mode +**Important**: Debug mode is not supported for data collection jobs created via the UI using the Dyncfg feature. + To troubleshoot issues with the `prometheus` collector, run the `go.d.plugin` with the debug option enabled. The output should give you clues as to why the collector isn't working. @@ -288,4 +289,37 @@ should give you clues as to why the collector isn't working. ./go.d.plugin -d -m prometheus ``` +### Getting Logs + +If you're encountering problems with the `prometheus` collector, follow these steps to retrieve logs and identify potential issues: + +- **Run the command** specific to your system (systemd, non-systemd, or Docker container). +- **Examine the output** for any warnings or error messages that might indicate issues. These messages should provide clues about the root cause of the problem. + +#### System with systemd + +Use the following command to view logs generated since the last Netdata service restart: + +```bash +journalctl _SYSTEMD_INVOCATION_ID="$(systemctl show --value --property=InvocationID netdata)" --namespace=netdata --grep prometheus +``` + +#### System without systemd + +Locate the collector log file, typically at `/var/log/netdata/collector.log`, and use `grep` to filter for collector's name: + +```bash +grep prometheus /var/log/netdata/collector.log +``` + +**Note**: This method shows logs from all restarts. Focus on the **latest entries** for troubleshooting current issues. + +#### Docker Container + +If your Netdata runs in a Docker container named "netdata" (replace if different), use this command: + +```bash +docker logs netdata 2>&1 | grep prometheus +``` + diff --git a/src/go/collectors/go.d.plugin/modules/prometheus/integrations/borg_backup.md b/src/go/plugin/go.d/modules/prometheus/integrations/borg_backup.md index 073178281..67a175340 100644 --- a/src/go/collectors/go.d.plugin/modules/prometheus/integrations/borg_backup.md +++ b/src/go/plugin/go.d/modules/prometheus/integrations/borg_backup.md @@ -1,6 +1,6 @@ <!--startmeta -custom_edit_url: "https://github.com/netdata/netdata/edit/master/src/go/collectors/go.d.plugin/modules/prometheus/integrations/borg_backup.md" -meta_yaml: "https://github.com/netdata/netdata/edit/master/src/go/collectors/go.d.plugin/modules/prometheus/metadata.yaml" +custom_edit_url: "https://github.com/netdata/netdata/edit/master/src/go/plugin/go.d/modules/prometheus/integrations/borg_backup.md" +meta_yaml: "https://github.com/netdata/netdata/edit/master/src/go/plugin/go.d/modules/prometheus/metadata.yaml" sidebar_label: "Borg backup" learn_status: "Published" learn_rel_path: "Collecting Metrics/Storage, Mount Points and Filesystems" @@ -37,7 +37,6 @@ This collector supports collecting metrics from multiple instances of this integ #### Auto-Detection By default, it detects instances running on the local host by trying to connect to known ports that are [allocated to exporters](https://github.com/prometheus/prometheus/wiki/Default-port-allocations). -The full list of endpoints is available in the collector's [configuration file](https://github.com/netdata/netdata/blob/master/src/go/collectors/go.d.plugin/config/go.d/prometheus.conf). #### Limits @@ -138,7 +137,7 @@ The following options can be defined globally: update_every, autodetection_retry This option allows you to filter out unwanted time series. Only metrics matching the selector will be collected. - Logic: (pattern1 OR pattern2) AND !(pattern3 or pattern4) -- Pattern syntax: [selector](/src/go/collectors/go.d.plugin/pkg/prometheus/selector/README.md). +- Pattern syntax: [selector](/src/go/plugin/go.d/pkg/prometheus/selector/README.md). - Option syntax: ```yaml @@ -266,6 +265,8 @@ jobs: ### Debug Mode +**Important**: Debug mode is not supported for data collection jobs created via the UI using the Dyncfg feature. + To troubleshoot issues with the `prometheus` collector, run the `go.d.plugin` with the debug option enabled. The output should give you clues as to why the collector isn't working. @@ -288,4 +289,37 @@ should give you clues as to why the collector isn't working. ./go.d.plugin -d -m prometheus ``` +### Getting Logs + +If you're encountering problems with the `prometheus` collector, follow these steps to retrieve logs and identify potential issues: + +- **Run the command** specific to your system (systemd, non-systemd, or Docker container). +- **Examine the output** for any warnings or error messages that might indicate issues. These messages should provide clues about the root cause of the problem. + +#### System with systemd + +Use the following command to view logs generated since the last Netdata service restart: + +```bash +journalctl _SYSTEMD_INVOCATION_ID="$(systemctl show --value --property=InvocationID netdata)" --namespace=netdata --grep prometheus +``` + +#### System without systemd + +Locate the collector log file, typically at `/var/log/netdata/collector.log`, and use `grep` to filter for collector's name: + +```bash +grep prometheus /var/log/netdata/collector.log +``` + +**Note**: This method shows logs from all restarts. Focus on the **latest entries** for troubleshooting current issues. + +#### Docker Container + +If your Netdata runs in a Docker container named "netdata" (replace if different), use this command: + +```bash +docker logs netdata 2>&1 | grep prometheus +``` + diff --git a/src/go/collectors/go.d.plugin/modules/prometheus/integrations/bosh.md b/src/go/plugin/go.d/modules/prometheus/integrations/bosh.md index b7a170278..c8fc354f3 100644 --- a/src/go/collectors/go.d.plugin/modules/prometheus/integrations/bosh.md +++ b/src/go/plugin/go.d/modules/prometheus/integrations/bosh.md @@ -1,6 +1,6 @@ <!--startmeta -custom_edit_url: "https://github.com/netdata/netdata/edit/master/src/go/collectors/go.d.plugin/modules/prometheus/integrations/bosh.md" -meta_yaml: "https://github.com/netdata/netdata/edit/master/src/go/collectors/go.d.plugin/modules/prometheus/metadata.yaml" +custom_edit_url: "https://github.com/netdata/netdata/edit/master/src/go/plugin/go.d/modules/prometheus/integrations/bosh.md" +meta_yaml: "https://github.com/netdata/netdata/edit/master/src/go/plugin/go.d/modules/prometheus/metadata.yaml" sidebar_label: "BOSH" learn_status: "Published" learn_rel_path: "Collecting Metrics/Provisioning Systems" @@ -37,7 +37,6 @@ This collector supports collecting metrics from multiple instances of this integ #### Auto-Detection By default, it detects instances running on the local host by trying to connect to known ports that are [allocated to exporters](https://github.com/prometheus/prometheus/wiki/Default-port-allocations). -The full list of endpoints is available in the collector's [configuration file](https://github.com/netdata/netdata/blob/master/src/go/collectors/go.d.plugin/config/go.d/prometheus.conf). #### Limits @@ -138,7 +137,7 @@ The following options can be defined globally: update_every, autodetection_retry This option allows you to filter out unwanted time series. Only metrics matching the selector will be collected. - Logic: (pattern1 OR pattern2) AND !(pattern3 or pattern4) -- Pattern syntax: [selector](/src/go/collectors/go.d.plugin/pkg/prometheus/selector/README.md). +- Pattern syntax: [selector](/src/go/plugin/go.d/pkg/prometheus/selector/README.md). - Option syntax: ```yaml @@ -266,6 +265,8 @@ jobs: ### Debug Mode +**Important**: Debug mode is not supported for data collection jobs created via the UI using the Dyncfg feature. + To troubleshoot issues with the `prometheus` collector, run the `go.d.plugin` with the debug option enabled. The output should give you clues as to why the collector isn't working. @@ -288,4 +289,37 @@ should give you clues as to why the collector isn't working. ./go.d.plugin -d -m prometheus ``` +### Getting Logs + +If you're encountering problems with the `prometheus` collector, follow these steps to retrieve logs and identify potential issues: + +- **Run the command** specific to your system (systemd, non-systemd, or Docker container). +- **Examine the output** for any warnings or error messages that might indicate issues. These messages should provide clues about the root cause of the problem. + +#### System with systemd + +Use the following command to view logs generated since the last Netdata service restart: + +```bash +journalctl _SYSTEMD_INVOCATION_ID="$(systemctl show --value --property=InvocationID netdata)" --namespace=netdata --grep prometheus +``` + +#### System without systemd + +Locate the collector log file, typically at `/var/log/netdata/collector.log`, and use `grep` to filter for collector's name: + +```bash +grep prometheus /var/log/netdata/collector.log +``` + +**Note**: This method shows logs from all restarts. Focus on the **latest entries** for troubleshooting current issues. + +#### Docker Container + +If your Netdata runs in a Docker container named "netdata" (replace if different), use this command: + +```bash +docker logs netdata 2>&1 | grep prometheus +``` + diff --git a/src/go/collectors/go.d.plugin/modules/prometheus/integrations/bpftrace_variables.md b/src/go/plugin/go.d/modules/prometheus/integrations/bpftrace_variables.md index fc29c2451..76ed9a2f0 100644 --- a/src/go/collectors/go.d.plugin/modules/prometheus/integrations/bpftrace_variables.md +++ b/src/go/plugin/go.d/modules/prometheus/integrations/bpftrace_variables.md @@ -1,6 +1,6 @@ <!--startmeta -custom_edit_url: "https://github.com/netdata/netdata/edit/master/src/go/collectors/go.d.plugin/modules/prometheus/integrations/bpftrace_variables.md" -meta_yaml: "https://github.com/netdata/netdata/edit/master/src/go/collectors/go.d.plugin/modules/prometheus/metadata.yaml" +custom_edit_url: "https://github.com/netdata/netdata/edit/master/src/go/plugin/go.d/modules/prometheus/integrations/bpftrace_variables.md" +meta_yaml: "https://github.com/netdata/netdata/edit/master/src/go/plugin/go.d/modules/prometheus/metadata.yaml" sidebar_label: "bpftrace variables" learn_status: "Published" learn_rel_path: "Collecting Metrics/APM" @@ -37,7 +37,6 @@ This collector supports collecting metrics from multiple instances of this integ #### Auto-Detection By default, it detects instances running on the local host by trying to connect to known ports that are [allocated to exporters](https://github.com/prometheus/prometheus/wiki/Default-port-allocations). -The full list of endpoints is available in the collector's [configuration file](https://github.com/netdata/netdata/blob/master/src/go/collectors/go.d.plugin/config/go.d/prometheus.conf). #### Limits @@ -138,7 +137,7 @@ The following options can be defined globally: update_every, autodetection_retry This option allows you to filter out unwanted time series. Only metrics matching the selector will be collected. - Logic: (pattern1 OR pattern2) AND !(pattern3 or pattern4) -- Pattern syntax: [selector](/src/go/collectors/go.d.plugin/pkg/prometheus/selector/README.md). +- Pattern syntax: [selector](/src/go/plugin/go.d/pkg/prometheus/selector/README.md). - Option syntax: ```yaml @@ -266,6 +265,8 @@ jobs: ### Debug Mode +**Important**: Debug mode is not supported for data collection jobs created via the UI using the Dyncfg feature. + To troubleshoot issues with the `prometheus` collector, run the `go.d.plugin` with the debug option enabled. The output should give you clues as to why the collector isn't working. @@ -288,4 +289,37 @@ should give you clues as to why the collector isn't working. ./go.d.plugin -d -m prometheus ``` +### Getting Logs + +If you're encountering problems with the `prometheus` collector, follow these steps to retrieve logs and identify potential issues: + +- **Run the command** specific to your system (systemd, non-systemd, or Docker container). +- **Examine the output** for any warnings or error messages that might indicate issues. These messages should provide clues about the root cause of the problem. + +#### System with systemd + +Use the following command to view logs generated since the last Netdata service restart: + +```bash +journalctl _SYSTEMD_INVOCATION_ID="$(systemctl show --value --property=InvocationID netdata)" --namespace=netdata --grep prometheus +``` + +#### System without systemd + +Locate the collector log file, typically at `/var/log/netdata/collector.log`, and use `grep` to filter for collector's name: + +```bash +grep prometheus /var/log/netdata/collector.log +``` + +**Note**: This method shows logs from all restarts. Focus on the **latest entries** for troubleshooting current issues. + +#### Docker Container + +If your Netdata runs in a Docker container named "netdata" (replace if different), use this command: + +```bash +docker logs netdata 2>&1 | grep prometheus +``` + diff --git a/src/go/collectors/go.d.plugin/modules/prometheus/integrations/bungeecord.md b/src/go/plugin/go.d/modules/prometheus/integrations/bungeecord.md index 5412b4314..cebba3d2f 100644 --- a/src/go/collectors/go.d.plugin/modules/prometheus/integrations/bungeecord.md +++ b/src/go/plugin/go.d/modules/prometheus/integrations/bungeecord.md @@ -1,6 +1,6 @@ <!--startmeta -custom_edit_url: "https://github.com/netdata/netdata/edit/master/src/go/collectors/go.d.plugin/modules/prometheus/integrations/bungeecord.md" -meta_yaml: "https://github.com/netdata/netdata/edit/master/src/go/collectors/go.d.plugin/modules/prometheus/metadata.yaml" +custom_edit_url: "https://github.com/netdata/netdata/edit/master/src/go/plugin/go.d/modules/prometheus/integrations/bungeecord.md" +meta_yaml: "https://github.com/netdata/netdata/edit/master/src/go/plugin/go.d/modules/prometheus/metadata.yaml" sidebar_label: "BungeeCord" learn_status: "Published" learn_rel_path: "Collecting Metrics/Gaming" @@ -37,7 +37,6 @@ This collector supports collecting metrics from multiple instances of this integ #### Auto-Detection By default, it detects instances running on the local host by trying to connect to known ports that are [allocated to exporters](https://github.com/prometheus/prometheus/wiki/Default-port-allocations). -The full list of endpoints is available in the collector's [configuration file](https://github.com/netdata/netdata/blob/master/src/go/collectors/go.d.plugin/config/go.d/prometheus.conf). #### Limits @@ -138,7 +137,7 @@ The following options can be defined globally: update_every, autodetection_retry This option allows you to filter out unwanted time series. Only metrics matching the selector will be collected. - Logic: (pattern1 OR pattern2) AND !(pattern3 or pattern4) -- Pattern syntax: [selector](/src/go/collectors/go.d.plugin/pkg/prometheus/selector/README.md). +- Pattern syntax: [selector](/src/go/plugin/go.d/pkg/prometheus/selector/README.md). - Option syntax: ```yaml @@ -266,6 +265,8 @@ jobs: ### Debug Mode +**Important**: Debug mode is not supported for data collection jobs created via the UI using the Dyncfg feature. + To troubleshoot issues with the `prometheus` collector, run the `go.d.plugin` with the debug option enabled. The output should give you clues as to why the collector isn't working. @@ -288,4 +289,37 @@ should give you clues as to why the collector isn't working. ./go.d.plugin -d -m prometheus ``` +### Getting Logs + +If you're encountering problems with the `prometheus` collector, follow these steps to retrieve logs and identify potential issues: + +- **Run the command** specific to your system (systemd, non-systemd, or Docker container). +- **Examine the output** for any warnings or error messages that might indicate issues. These messages should provide clues about the root cause of the problem. + +#### System with systemd + +Use the following command to view logs generated since the last Netdata service restart: + +```bash +journalctl _SYSTEMD_INVOCATION_ID="$(systemctl show --value --property=InvocationID netdata)" --namespace=netdata --grep prometheus +``` + +#### System without systemd + +Locate the collector log file, typically at `/var/log/netdata/collector.log`, and use `grep` to filter for collector's name: + +```bash +grep prometheus /var/log/netdata/collector.log +``` + +**Note**: This method shows logs from all restarts. Focus on the **latest entries** for troubleshooting current issues. + +#### Docker Container + +If your Netdata runs in a Docker container named "netdata" (replace if different), use this command: + +```bash +docker logs netdata 2>&1 | grep prometheus +``` + diff --git a/src/go/collectors/go.d.plugin/modules/prometheus/integrations/cadvisor.md b/src/go/plugin/go.d/modules/prometheus/integrations/cadvisor.md index 549311c3d..a40221af5 100644 --- a/src/go/collectors/go.d.plugin/modules/prometheus/integrations/cadvisor.md +++ b/src/go/plugin/go.d/modules/prometheus/integrations/cadvisor.md @@ -1,6 +1,6 @@ <!--startmeta -custom_edit_url: "https://github.com/netdata/netdata/edit/master/src/go/collectors/go.d.plugin/modules/prometheus/integrations/cadvisor.md" -meta_yaml: "https://github.com/netdata/netdata/edit/master/src/go/collectors/go.d.plugin/modules/prometheus/metadata.yaml" +custom_edit_url: "https://github.com/netdata/netdata/edit/master/src/go/plugin/go.d/modules/prometheus/integrations/cadvisor.md" +meta_yaml: "https://github.com/netdata/netdata/edit/master/src/go/plugin/go.d/modules/prometheus/metadata.yaml" sidebar_label: "cAdvisor" learn_status: "Published" learn_rel_path: "Collecting Metrics/Containers and VMs" @@ -37,7 +37,6 @@ This collector supports collecting metrics from multiple instances of this integ #### Auto-Detection By default, it detects instances running on the local host by trying to connect to known ports that are [allocated to exporters](https://github.com/prometheus/prometheus/wiki/Default-port-allocations). -The full list of endpoints is available in the collector's [configuration file](https://github.com/netdata/netdata/blob/master/src/go/collectors/go.d.plugin/config/go.d/prometheus.conf). #### Limits @@ -138,7 +137,7 @@ The following options can be defined globally: update_every, autodetection_retry This option allows you to filter out unwanted time series. Only metrics matching the selector will be collected. - Logic: (pattern1 OR pattern2) AND !(pattern3 or pattern4) -- Pattern syntax: [selector](/src/go/collectors/go.d.plugin/pkg/prometheus/selector/README.md). +- Pattern syntax: [selector](/src/go/plugin/go.d/pkg/prometheus/selector/README.md). - Option syntax: ```yaml @@ -266,6 +265,8 @@ jobs: ### Debug Mode +**Important**: Debug mode is not supported for data collection jobs created via the UI using the Dyncfg feature. + To troubleshoot issues with the `prometheus` collector, run the `go.d.plugin` with the debug option enabled. The output should give you clues as to why the collector isn't working. @@ -288,4 +289,37 @@ should give you clues as to why the collector isn't working. ./go.d.plugin -d -m prometheus ``` +### Getting Logs + +If you're encountering problems with the `prometheus` collector, follow these steps to retrieve logs and identify potential issues: + +- **Run the command** specific to your system (systemd, non-systemd, or Docker container). +- **Examine the output** for any warnings or error messages that might indicate issues. These messages should provide clues about the root cause of the problem. + +#### System with systemd + +Use the following command to view logs generated since the last Netdata service restart: + +```bash +journalctl _SYSTEMD_INVOCATION_ID="$(systemctl show --value --property=InvocationID netdata)" --namespace=netdata --grep prometheus +``` + +#### System without systemd + +Locate the collector log file, typically at `/var/log/netdata/collector.log`, and use `grep` to filter for collector's name: + +```bash +grep prometheus /var/log/netdata/collector.log +``` + +**Note**: This method shows logs from all restarts. Focus on the **latest entries** for troubleshooting current issues. + +#### Docker Container + +If your Netdata runs in a Docker container named "netdata" (replace if different), use this command: + +```bash +docker logs netdata 2>&1 | grep prometheus +``` + diff --git a/src/go/collectors/go.d.plugin/modules/prometheus/integrations/celery.md b/src/go/plugin/go.d/modules/prometheus/integrations/celery.md index b8d72eaa4..2cb4e8219 100644 --- a/src/go/collectors/go.d.plugin/modules/prometheus/integrations/celery.md +++ b/src/go/plugin/go.d/modules/prometheus/integrations/celery.md @@ -1,6 +1,6 @@ <!--startmeta -custom_edit_url: "https://github.com/netdata/netdata/edit/master/src/go/collectors/go.d.plugin/modules/prometheus/integrations/celery.md" -meta_yaml: "https://github.com/netdata/netdata/edit/master/src/go/collectors/go.d.plugin/modules/prometheus/metadata.yaml" +custom_edit_url: "https://github.com/netdata/netdata/edit/master/src/go/plugin/go.d/modules/prometheus/integrations/celery.md" +meta_yaml: "https://github.com/netdata/netdata/edit/master/src/go/plugin/go.d/modules/prometheus/metadata.yaml" sidebar_label: "Celery" learn_status: "Published" learn_rel_path: "Collecting Metrics/Task Queues" @@ -37,7 +37,6 @@ This collector supports collecting metrics from multiple instances of this integ #### Auto-Detection By default, it detects instances running on the local host by trying to connect to known ports that are [allocated to exporters](https://github.com/prometheus/prometheus/wiki/Default-port-allocations). -The full list of endpoints is available in the collector's [configuration file](https://github.com/netdata/netdata/blob/master/src/go/collectors/go.d.plugin/config/go.d/prometheus.conf). #### Limits @@ -138,7 +137,7 @@ The following options can be defined globally: update_every, autodetection_retry This option allows you to filter out unwanted time series. Only metrics matching the selector will be collected. - Logic: (pattern1 OR pattern2) AND !(pattern3 or pattern4) -- Pattern syntax: [selector](/src/go/collectors/go.d.plugin/pkg/prometheus/selector/README.md). +- Pattern syntax: [selector](/src/go/plugin/go.d/pkg/prometheus/selector/README.md). - Option syntax: ```yaml @@ -266,6 +265,8 @@ jobs: ### Debug Mode +**Important**: Debug mode is not supported for data collection jobs created via the UI using the Dyncfg feature. + To troubleshoot issues with the `prometheus` collector, run the `go.d.plugin` with the debug option enabled. The output should give you clues as to why the collector isn't working. @@ -288,4 +289,37 @@ should give you clues as to why the collector isn't working. ./go.d.plugin -d -m prometheus ``` +### Getting Logs + +If you're encountering problems with the `prometheus` collector, follow these steps to retrieve logs and identify potential issues: + +- **Run the command** specific to your system (systemd, non-systemd, or Docker container). +- **Examine the output** for any warnings or error messages that might indicate issues. These messages should provide clues about the root cause of the problem. + +#### System with systemd + +Use the following command to view logs generated since the last Netdata service restart: + +```bash +journalctl _SYSTEMD_INVOCATION_ID="$(systemctl show --value --property=InvocationID netdata)" --namespace=netdata --grep prometheus +``` + +#### System without systemd + +Locate the collector log file, typically at `/var/log/netdata/collector.log`, and use `grep` to filter for collector's name: + +```bash +grep prometheus /var/log/netdata/collector.log +``` + +**Note**: This method shows logs from all restarts. Focus on the **latest entries** for troubleshooting current issues. + +#### Docker Container + +If your Netdata runs in a Docker container named "netdata" (replace if different), use this command: + +```bash +docker logs netdata 2>&1 | grep prometheus +``` + diff --git a/src/go/collectors/go.d.plugin/modules/prometheus/integrations/certificate_transparency.md b/src/go/plugin/go.d/modules/prometheus/integrations/certificate_transparency.md index 9f541e8e5..b741f95ff 100644 --- a/src/go/collectors/go.d.plugin/modules/prometheus/integrations/certificate_transparency.md +++ b/src/go/plugin/go.d/modules/prometheus/integrations/certificate_transparency.md @@ -1,6 +1,6 @@ <!--startmeta -custom_edit_url: "https://github.com/netdata/netdata/edit/master/src/go/collectors/go.d.plugin/modules/prometheus/integrations/certificate_transparency.md" -meta_yaml: "https://github.com/netdata/netdata/edit/master/src/go/collectors/go.d.plugin/modules/prometheus/metadata.yaml" +custom_edit_url: "https://github.com/netdata/netdata/edit/master/src/go/plugin/go.d/modules/prometheus/integrations/certificate_transparency.md" +meta_yaml: "https://github.com/netdata/netdata/edit/master/src/go/plugin/go.d/modules/prometheus/metadata.yaml" sidebar_label: "Certificate Transparency" learn_status: "Published" learn_rel_path: "Collecting Metrics/Security Systems" @@ -38,7 +38,6 @@ This collector supports collecting metrics from multiple instances of this integ #### Auto-Detection By default, it detects instances running on the local host by trying to connect to known ports that are [allocated to exporters](https://github.com/prometheus/prometheus/wiki/Default-port-allocations). -The full list of endpoints is available in the collector's [configuration file](https://github.com/netdata/netdata/blob/master/src/go/collectors/go.d.plugin/config/go.d/prometheus.conf). #### Limits @@ -139,7 +138,7 @@ The following options can be defined globally: update_every, autodetection_retry This option allows you to filter out unwanted time series. Only metrics matching the selector will be collected. - Logic: (pattern1 OR pattern2) AND !(pattern3 or pattern4) -- Pattern syntax: [selector](/src/go/collectors/go.d.plugin/pkg/prometheus/selector/README.md). +- Pattern syntax: [selector](/src/go/plugin/go.d/pkg/prometheus/selector/README.md). - Option syntax: ```yaml @@ -267,6 +266,8 @@ jobs: ### Debug Mode +**Important**: Debug mode is not supported for data collection jobs created via the UI using the Dyncfg feature. + To troubleshoot issues with the `prometheus` collector, run the `go.d.plugin` with the debug option enabled. The output should give you clues as to why the collector isn't working. @@ -289,4 +290,37 @@ should give you clues as to why the collector isn't working. ./go.d.plugin -d -m prometheus ``` +### Getting Logs + +If you're encountering problems with the `prometheus` collector, follow these steps to retrieve logs and identify potential issues: + +- **Run the command** specific to your system (systemd, non-systemd, or Docker container). +- **Examine the output** for any warnings or error messages that might indicate issues. These messages should provide clues about the root cause of the problem. + +#### System with systemd + +Use the following command to view logs generated since the last Netdata service restart: + +```bash +journalctl _SYSTEMD_INVOCATION_ID="$(systemctl show --value --property=InvocationID netdata)" --namespace=netdata --grep prometheus +``` + +#### System without systemd + +Locate the collector log file, typically at `/var/log/netdata/collector.log`, and use `grep` to filter for collector's name: + +```bash +grep prometheus /var/log/netdata/collector.log +``` + +**Note**: This method shows logs from all restarts. Focus on the **latest entries** for troubleshooting current issues. + +#### Docker Container + +If your Netdata runs in a Docker container named "netdata" (replace if different), use this command: + +```bash +docker logs netdata 2>&1 | grep prometheus +``` + diff --git a/src/go/collectors/go.d.plugin/modules/prometheus/integrations/checkpoint_device.md b/src/go/plugin/go.d/modules/prometheus/integrations/checkpoint_device.md index a84fae415..4d63f806e 100644 --- a/src/go/collectors/go.d.plugin/modules/prometheus/integrations/checkpoint_device.md +++ b/src/go/plugin/go.d/modules/prometheus/integrations/checkpoint_device.md @@ -1,6 +1,6 @@ <!--startmeta -custom_edit_url: "https://github.com/netdata/netdata/edit/master/src/go/collectors/go.d.plugin/modules/prometheus/integrations/checkpoint_device.md" -meta_yaml: "https://github.com/netdata/netdata/edit/master/src/go/collectors/go.d.plugin/modules/prometheus/metadata.yaml" +custom_edit_url: "https://github.com/netdata/netdata/edit/master/src/go/plugin/go.d/modules/prometheus/integrations/checkpoint_device.md" +meta_yaml: "https://github.com/netdata/netdata/edit/master/src/go/plugin/go.d/modules/prometheus/metadata.yaml" sidebar_label: "Checkpoint device" learn_status: "Published" learn_rel_path: "Collecting Metrics/Networking Stack and Network Interfaces" @@ -37,7 +37,6 @@ This collector supports collecting metrics from multiple instances of this integ #### Auto-Detection By default, it detects instances running on the local host by trying to connect to known ports that are [allocated to exporters](https://github.com/prometheus/prometheus/wiki/Default-port-allocations). -The full list of endpoints is available in the collector's [configuration file](https://github.com/netdata/netdata/blob/master/src/go/collectors/go.d.plugin/config/go.d/prometheus.conf). #### Limits @@ -138,7 +137,7 @@ The following options can be defined globally: update_every, autodetection_retry This option allows you to filter out unwanted time series. Only metrics matching the selector will be collected. - Logic: (pattern1 OR pattern2) AND !(pattern3 or pattern4) -- Pattern syntax: [selector](/src/go/collectors/go.d.plugin/pkg/prometheus/selector/README.md). +- Pattern syntax: [selector](/src/go/plugin/go.d/pkg/prometheus/selector/README.md). - Option syntax: ```yaml @@ -266,6 +265,8 @@ jobs: ### Debug Mode +**Important**: Debug mode is not supported for data collection jobs created via the UI using the Dyncfg feature. + To troubleshoot issues with the `prometheus` collector, run the `go.d.plugin` with the debug option enabled. The output should give you clues as to why the collector isn't working. @@ -288,4 +289,37 @@ should give you clues as to why the collector isn't working. ./go.d.plugin -d -m prometheus ``` +### Getting Logs + +If you're encountering problems with the `prometheus` collector, follow these steps to retrieve logs and identify potential issues: + +- **Run the command** specific to your system (systemd, non-systemd, or Docker container). +- **Examine the output** for any warnings or error messages that might indicate issues. These messages should provide clues about the root cause of the problem. + +#### System with systemd + +Use the following command to view logs generated since the last Netdata service restart: + +```bash +journalctl _SYSTEMD_INVOCATION_ID="$(systemctl show --value --property=InvocationID netdata)" --namespace=netdata --grep prometheus +``` + +#### System without systemd + +Locate the collector log file, typically at `/var/log/netdata/collector.log`, and use `grep` to filter for collector's name: + +```bash +grep prometheus /var/log/netdata/collector.log +``` + +**Note**: This method shows logs from all restarts. Focus on the **latest entries** for troubleshooting current issues. + +#### Docker Container + +If your Netdata runs in a Docker container named "netdata" (replace if different), use this command: + +```bash +docker logs netdata 2>&1 | grep prometheus +``` + diff --git a/src/go/collectors/go.d.plugin/modules/prometheus/integrations/chia.md b/src/go/plugin/go.d/modules/prometheus/integrations/chia.md index 45755773e..158b6990e 100644 --- a/src/go/collectors/go.d.plugin/modules/prometheus/integrations/chia.md +++ b/src/go/plugin/go.d/modules/prometheus/integrations/chia.md @@ -1,6 +1,6 @@ <!--startmeta -custom_edit_url: "https://github.com/netdata/netdata/edit/master/src/go/collectors/go.d.plugin/modules/prometheus/integrations/chia.md" -meta_yaml: "https://github.com/netdata/netdata/edit/master/src/go/collectors/go.d.plugin/modules/prometheus/metadata.yaml" +custom_edit_url: "https://github.com/netdata/netdata/edit/master/src/go/plugin/go.d/modules/prometheus/integrations/chia.md" +meta_yaml: "https://github.com/netdata/netdata/edit/master/src/go/plugin/go.d/modules/prometheus/metadata.yaml" sidebar_label: "Chia" learn_status: "Published" learn_rel_path: "Collecting Metrics/Blockchain Servers" @@ -37,7 +37,6 @@ This collector supports collecting metrics from multiple instances of this integ #### Auto-Detection By default, it detects instances running on the local host by trying to connect to known ports that are [allocated to exporters](https://github.com/prometheus/prometheus/wiki/Default-port-allocations). -The full list of endpoints is available in the collector's [configuration file](https://github.com/netdata/netdata/blob/master/src/go/collectors/go.d.plugin/config/go.d/prometheus.conf). #### Limits @@ -138,7 +137,7 @@ The following options can be defined globally: update_every, autodetection_retry This option allows you to filter out unwanted time series. Only metrics matching the selector will be collected. - Logic: (pattern1 OR pattern2) AND !(pattern3 or pattern4) -- Pattern syntax: [selector](/src/go/collectors/go.d.plugin/pkg/prometheus/selector/README.md). +- Pattern syntax: [selector](/src/go/plugin/go.d/pkg/prometheus/selector/README.md). - Option syntax: ```yaml @@ -266,6 +265,8 @@ jobs: ### Debug Mode +**Important**: Debug mode is not supported for data collection jobs created via the UI using the Dyncfg feature. + To troubleshoot issues with the `prometheus` collector, run the `go.d.plugin` with the debug option enabled. The output should give you clues as to why the collector isn't working. @@ -288,4 +289,37 @@ should give you clues as to why the collector isn't working. ./go.d.plugin -d -m prometheus ``` +### Getting Logs + +If you're encountering problems with the `prometheus` collector, follow these steps to retrieve logs and identify potential issues: + +- **Run the command** specific to your system (systemd, non-systemd, or Docker container). +- **Examine the output** for any warnings or error messages that might indicate issues. These messages should provide clues about the root cause of the problem. + +#### System with systemd + +Use the following command to view logs generated since the last Netdata service restart: + +```bash +journalctl _SYSTEMD_INVOCATION_ID="$(systemctl show --value --property=InvocationID netdata)" --namespace=netdata --grep prometheus +``` + +#### System without systemd + +Locate the collector log file, typically at `/var/log/netdata/collector.log`, and use `grep` to filter for collector's name: + +```bash +grep prometheus /var/log/netdata/collector.log +``` + +**Note**: This method shows logs from all restarts. Focus on the **latest entries** for troubleshooting current issues. + +#### Docker Container + +If your Netdata runs in a Docker container named "netdata" (replace if different), use this command: + +```bash +docker logs netdata 2>&1 | grep prometheus +``` + diff --git a/src/go/collectors/go.d.plugin/modules/prometheus/integrations/christ_elektronik_clm5ip_power_panel.md b/src/go/plugin/go.d/modules/prometheus/integrations/christ_elektronik_clm5ip_power_panel.md index d315fbe4b..71f6460f3 100644 --- a/src/go/collectors/go.d.plugin/modules/prometheus/integrations/christ_elektronik_clm5ip_power_panel.md +++ b/src/go/plugin/go.d/modules/prometheus/integrations/christ_elektronik_clm5ip_power_panel.md @@ -1,6 +1,6 @@ <!--startmeta -custom_edit_url: "https://github.com/netdata/netdata/edit/master/src/go/collectors/go.d.plugin/modules/prometheus/integrations/christ_elektronik_clm5ip_power_panel.md" -meta_yaml: "https://github.com/netdata/netdata/edit/master/src/go/collectors/go.d.plugin/modules/prometheus/metadata.yaml" +custom_edit_url: "https://github.com/netdata/netdata/edit/master/src/go/plugin/go.d/modules/prometheus/integrations/christ_elektronik_clm5ip_power_panel.md" +meta_yaml: "https://github.com/netdata/netdata/edit/master/src/go/plugin/go.d/modules/prometheus/metadata.yaml" sidebar_label: "Christ Elektronik CLM5IP power panel" learn_status: "Published" learn_rel_path: "Collecting Metrics/IoT Devices" @@ -37,7 +37,6 @@ This collector supports collecting metrics from multiple instances of this integ #### Auto-Detection By default, it detects instances running on the local host by trying to connect to known ports that are [allocated to exporters](https://github.com/prometheus/prometheus/wiki/Default-port-allocations). -The full list of endpoints is available in the collector's [configuration file](https://github.com/netdata/netdata/blob/master/src/go/collectors/go.d.plugin/config/go.d/prometheus.conf). #### Limits @@ -138,7 +137,7 @@ The following options can be defined globally: update_every, autodetection_retry This option allows you to filter out unwanted time series. Only metrics matching the selector will be collected. - Logic: (pattern1 OR pattern2) AND !(pattern3 or pattern4) -- Pattern syntax: [selector](/src/go/collectors/go.d.plugin/pkg/prometheus/selector/README.md). +- Pattern syntax: [selector](/src/go/plugin/go.d/pkg/prometheus/selector/README.md). - Option syntax: ```yaml @@ -266,6 +265,8 @@ jobs: ### Debug Mode +**Important**: Debug mode is not supported for data collection jobs created via the UI using the Dyncfg feature. + To troubleshoot issues with the `prometheus` collector, run the `go.d.plugin` with the debug option enabled. The output should give you clues as to why the collector isn't working. @@ -288,4 +289,37 @@ should give you clues as to why the collector isn't working. ./go.d.plugin -d -m prometheus ``` +### Getting Logs + +If you're encountering problems with the `prometheus` collector, follow these steps to retrieve logs and identify potential issues: + +- **Run the command** specific to your system (systemd, non-systemd, or Docker container). +- **Examine the output** for any warnings or error messages that might indicate issues. These messages should provide clues about the root cause of the problem. + +#### System with systemd + +Use the following command to view logs generated since the last Netdata service restart: + +```bash +journalctl _SYSTEMD_INVOCATION_ID="$(systemctl show --value --property=InvocationID netdata)" --namespace=netdata --grep prometheus +``` + +#### System without systemd + +Locate the collector log file, typically at `/var/log/netdata/collector.log`, and use `grep` to filter for collector's name: + +```bash +grep prometheus /var/log/netdata/collector.log +``` + +**Note**: This method shows logs from all restarts. Focus on the **latest entries** for troubleshooting current issues. + +#### Docker Container + +If your Netdata runs in a Docker container named "netdata" (replace if different), use this command: + +```bash +docker logs netdata 2>&1 | grep prometheus +``` + diff --git a/src/go/collectors/go.d.plugin/modules/prometheus/integrations/cilium_agent.md b/src/go/plugin/go.d/modules/prometheus/integrations/cilium_agent.md index d2285aa32..77369adaa 100644 --- a/src/go/collectors/go.d.plugin/modules/prometheus/integrations/cilium_agent.md +++ b/src/go/plugin/go.d/modules/prometheus/integrations/cilium_agent.md @@ -1,6 +1,6 @@ <!--startmeta -custom_edit_url: "https://github.com/netdata/netdata/edit/master/src/go/collectors/go.d.plugin/modules/prometheus/integrations/cilium_agent.md" -meta_yaml: "https://github.com/netdata/netdata/edit/master/src/go/collectors/go.d.plugin/modules/prometheus/metadata.yaml" +custom_edit_url: "https://github.com/netdata/netdata/edit/master/src/go/plugin/go.d/modules/prometheus/integrations/cilium_agent.md" +meta_yaml: "https://github.com/netdata/netdata/edit/master/src/go/plugin/go.d/modules/prometheus/metadata.yaml" sidebar_label: "Cilium Agent" learn_status: "Published" learn_rel_path: "Collecting Metrics/Kubernetes" @@ -37,7 +37,6 @@ This collector supports collecting metrics from multiple instances of this integ #### Auto-Detection By default, it detects instances running on the local host by trying to connect to known ports that are [allocated to exporters](https://github.com/prometheus/prometheus/wiki/Default-port-allocations). -The full list of endpoints is available in the collector's [configuration file](https://github.com/netdata/netdata/blob/master/src/go/collectors/go.d.plugin/config/go.d/prometheus.conf). #### Limits @@ -138,7 +137,7 @@ The following options can be defined globally: update_every, autodetection_retry This option allows you to filter out unwanted time series. Only metrics matching the selector will be collected. - Logic: (pattern1 OR pattern2) AND !(pattern3 or pattern4) -- Pattern syntax: [selector](/src/go/collectors/go.d.plugin/pkg/prometheus/selector/README.md). +- Pattern syntax: [selector](/src/go/plugin/go.d/pkg/prometheus/selector/README.md). - Option syntax: ```yaml @@ -266,6 +265,8 @@ jobs: ### Debug Mode +**Important**: Debug mode is not supported for data collection jobs created via the UI using the Dyncfg feature. + To troubleshoot issues with the `prometheus` collector, run the `go.d.plugin` with the debug option enabled. The output should give you clues as to why the collector isn't working. @@ -288,4 +289,37 @@ should give you clues as to why the collector isn't working. ./go.d.plugin -d -m prometheus ``` +### Getting Logs + +If you're encountering problems with the `prometheus` collector, follow these steps to retrieve logs and identify potential issues: + +- **Run the command** specific to your system (systemd, non-systemd, or Docker container). +- **Examine the output** for any warnings or error messages that might indicate issues. These messages should provide clues about the root cause of the problem. + +#### System with systemd + +Use the following command to view logs generated since the last Netdata service restart: + +```bash +journalctl _SYSTEMD_INVOCATION_ID="$(systemctl show --value --property=InvocationID netdata)" --namespace=netdata --grep prometheus +``` + +#### System without systemd + +Locate the collector log file, typically at `/var/log/netdata/collector.log`, and use `grep` to filter for collector's name: + +```bash +grep prometheus /var/log/netdata/collector.log +``` + +**Note**: This method shows logs from all restarts. Focus on the **latest entries** for troubleshooting current issues. + +#### Docker Container + +If your Netdata runs in a Docker container named "netdata" (replace if different), use this command: + +```bash +docker logs netdata 2>&1 | grep prometheus +``` + diff --git a/src/go/collectors/go.d.plugin/modules/prometheus/integrations/cilium_operator.md b/src/go/plugin/go.d/modules/prometheus/integrations/cilium_operator.md index b1bb16cfa..4083f7b0b 100644 --- a/src/go/collectors/go.d.plugin/modules/prometheus/integrations/cilium_operator.md +++ b/src/go/plugin/go.d/modules/prometheus/integrations/cilium_operator.md @@ -1,6 +1,6 @@ <!--startmeta -custom_edit_url: "https://github.com/netdata/netdata/edit/master/src/go/collectors/go.d.plugin/modules/prometheus/integrations/cilium_operator.md" -meta_yaml: "https://github.com/netdata/netdata/edit/master/src/go/collectors/go.d.plugin/modules/prometheus/metadata.yaml" +custom_edit_url: "https://github.com/netdata/netdata/edit/master/src/go/plugin/go.d/modules/prometheus/integrations/cilium_operator.md" +meta_yaml: "https://github.com/netdata/netdata/edit/master/src/go/plugin/go.d/modules/prometheus/metadata.yaml" sidebar_label: "Cilium Operator" learn_status: "Published" learn_rel_path: "Collecting Metrics/Kubernetes" @@ -37,7 +37,6 @@ This collector supports collecting metrics from multiple instances of this integ #### Auto-Detection By default, it detects instances running on the local host by trying to connect to known ports that are [allocated to exporters](https://github.com/prometheus/prometheus/wiki/Default-port-allocations). -The full list of endpoints is available in the collector's [configuration file](https://github.com/netdata/netdata/blob/master/src/go/collectors/go.d.plugin/config/go.d/prometheus.conf). #### Limits @@ -138,7 +137,7 @@ The following options can be defined globally: update_every, autodetection_retry This option allows you to filter out unwanted time series. Only metrics matching the selector will be collected. - Logic: (pattern1 OR pattern2) AND !(pattern3 or pattern4) -- Pattern syntax: [selector](/src/go/collectors/go.d.plugin/pkg/prometheus/selector/README.md). +- Pattern syntax: [selector](/src/go/plugin/go.d/pkg/prometheus/selector/README.md). - Option syntax: ```yaml @@ -266,6 +265,8 @@ jobs: ### Debug Mode +**Important**: Debug mode is not supported for data collection jobs created via the UI using the Dyncfg feature. + To troubleshoot issues with the `prometheus` collector, run the `go.d.plugin` with the debug option enabled. The output should give you clues as to why the collector isn't working. @@ -288,4 +289,37 @@ should give you clues as to why the collector isn't working. ./go.d.plugin -d -m prometheus ``` +### Getting Logs + +If you're encountering problems with the `prometheus` collector, follow these steps to retrieve logs and identify potential issues: + +- **Run the command** specific to your system (systemd, non-systemd, or Docker container). +- **Examine the output** for any warnings or error messages that might indicate issues. These messages should provide clues about the root cause of the problem. + +#### System with systemd + +Use the following command to view logs generated since the last Netdata service restart: + +```bash +journalctl _SYSTEMD_INVOCATION_ID="$(systemctl show --value --property=InvocationID netdata)" --namespace=netdata --grep prometheus +``` + +#### System without systemd + +Locate the collector log file, typically at `/var/log/netdata/collector.log`, and use `grep` to filter for collector's name: + +```bash +grep prometheus /var/log/netdata/collector.log +``` + +**Note**: This method shows logs from all restarts. Focus on the **latest entries** for troubleshooting current issues. + +#### Docker Container + +If your Netdata runs in a Docker container named "netdata" (replace if different), use this command: + +```bash +docker logs netdata 2>&1 | grep prometheus +``` + diff --git a/src/go/collectors/go.d.plugin/modules/prometheus/integrations/cilium_proxy.md b/src/go/plugin/go.d/modules/prometheus/integrations/cilium_proxy.md index 685c32291..cfffa6299 100644 --- a/src/go/collectors/go.d.plugin/modules/prometheus/integrations/cilium_proxy.md +++ b/src/go/plugin/go.d/modules/prometheus/integrations/cilium_proxy.md @@ -1,6 +1,6 @@ <!--startmeta -custom_edit_url: "https://github.com/netdata/netdata/edit/master/src/go/collectors/go.d.plugin/modules/prometheus/integrations/cilium_proxy.md" -meta_yaml: "https://github.com/netdata/netdata/edit/master/src/go/collectors/go.d.plugin/modules/prometheus/metadata.yaml" +custom_edit_url: "https://github.com/netdata/netdata/edit/master/src/go/plugin/go.d/modules/prometheus/integrations/cilium_proxy.md" +meta_yaml: "https://github.com/netdata/netdata/edit/master/src/go/plugin/go.d/modules/prometheus/metadata.yaml" sidebar_label: "Cilium Proxy" learn_status: "Published" learn_rel_path: "Collecting Metrics/Kubernetes" @@ -37,7 +37,6 @@ This collector supports collecting metrics from multiple instances of this integ #### Auto-Detection By default, it detects instances running on the local host by trying to connect to known ports that are [allocated to exporters](https://github.com/prometheus/prometheus/wiki/Default-port-allocations). -The full list of endpoints is available in the collector's [configuration file](https://github.com/netdata/netdata/blob/master/src/go/collectors/go.d.plugin/config/go.d/prometheus.conf). #### Limits @@ -138,7 +137,7 @@ The following options can be defined globally: update_every, autodetection_retry This option allows you to filter out unwanted time series. Only metrics matching the selector will be collected. - Logic: (pattern1 OR pattern2) AND !(pattern3 or pattern4) -- Pattern syntax: [selector](/src/go/collectors/go.d.plugin/pkg/prometheus/selector/README.md). +- Pattern syntax: [selector](/src/go/plugin/go.d/pkg/prometheus/selector/README.md). - Option syntax: ```yaml @@ -266,6 +265,8 @@ jobs: ### Debug Mode +**Important**: Debug mode is not supported for data collection jobs created via the UI using the Dyncfg feature. + To troubleshoot issues with the `prometheus` collector, run the `go.d.plugin` with the debug option enabled. The output should give you clues as to why the collector isn't working. @@ -288,4 +289,37 @@ should give you clues as to why the collector isn't working. ./go.d.plugin -d -m prometheus ``` +### Getting Logs + +If you're encountering problems with the `prometheus` collector, follow these steps to retrieve logs and identify potential issues: + +- **Run the command** specific to your system (systemd, non-systemd, or Docker container). +- **Examine the output** for any warnings or error messages that might indicate issues. These messages should provide clues about the root cause of the problem. + +#### System with systemd + +Use the following command to view logs generated since the last Netdata service restart: + +```bash +journalctl _SYSTEMD_INVOCATION_ID="$(systemctl show --value --property=InvocationID netdata)" --namespace=netdata --grep prometheus +``` + +#### System without systemd + +Locate the collector log file, typically at `/var/log/netdata/collector.log`, and use `grep` to filter for collector's name: + +```bash +grep prometheus /var/log/netdata/collector.log +``` + +**Note**: This method shows logs from all restarts. Focus on the **latest entries** for troubleshooting current issues. + +#### Docker Container + +If your Netdata runs in a Docker container named "netdata" (replace if different), use this command: + +```bash +docker logs netdata 2>&1 | grep prometheus +``` + diff --git a/src/go/collectors/go.d.plugin/modules/prometheus/integrations/cisco_aci.md b/src/go/plugin/go.d/modules/prometheus/integrations/cisco_aci.md index b452a6ccc..9766e88d1 100644 --- a/src/go/collectors/go.d.plugin/modules/prometheus/integrations/cisco_aci.md +++ b/src/go/plugin/go.d/modules/prometheus/integrations/cisco_aci.md @@ -1,6 +1,6 @@ <!--startmeta -custom_edit_url: "https://github.com/netdata/netdata/edit/master/src/go/collectors/go.d.plugin/modules/prometheus/integrations/cisco_aci.md" -meta_yaml: "https://github.com/netdata/netdata/edit/master/src/go/collectors/go.d.plugin/modules/prometheus/metadata.yaml" +custom_edit_url: "https://github.com/netdata/netdata/edit/master/src/go/plugin/go.d/modules/prometheus/integrations/cisco_aci.md" +meta_yaml: "https://github.com/netdata/netdata/edit/master/src/go/plugin/go.d/modules/prometheus/metadata.yaml" sidebar_label: "Cisco ACI" learn_status: "Published" learn_rel_path: "Collecting Metrics/Networking Stack and Network Interfaces" @@ -37,7 +37,6 @@ This collector supports collecting metrics from multiple instances of this integ #### Auto-Detection By default, it detects instances running on the local host by trying to connect to known ports that are [allocated to exporters](https://github.com/prometheus/prometheus/wiki/Default-port-allocations). -The full list of endpoints is available in the collector's [configuration file](https://github.com/netdata/netdata/blob/master/src/go/collectors/go.d.plugin/config/go.d/prometheus.conf). #### Limits @@ -138,7 +137,7 @@ The following options can be defined globally: update_every, autodetection_retry This option allows you to filter out unwanted time series. Only metrics matching the selector will be collected. - Logic: (pattern1 OR pattern2) AND !(pattern3 or pattern4) -- Pattern syntax: [selector](/src/go/collectors/go.d.plugin/pkg/prometheus/selector/README.md). +- Pattern syntax: [selector](/src/go/plugin/go.d/pkg/prometheus/selector/README.md). - Option syntax: ```yaml @@ -266,6 +265,8 @@ jobs: ### Debug Mode +**Important**: Debug mode is not supported for data collection jobs created via the UI using the Dyncfg feature. + To troubleshoot issues with the `prometheus` collector, run the `go.d.plugin` with the debug option enabled. The output should give you clues as to why the collector isn't working. @@ -288,4 +289,37 @@ should give you clues as to why the collector isn't working. ./go.d.plugin -d -m prometheus ``` +### Getting Logs + +If you're encountering problems with the `prometheus` collector, follow these steps to retrieve logs and identify potential issues: + +- **Run the command** specific to your system (systemd, non-systemd, or Docker container). +- **Examine the output** for any warnings or error messages that might indicate issues. These messages should provide clues about the root cause of the problem. + +#### System with systemd + +Use the following command to view logs generated since the last Netdata service restart: + +```bash +journalctl _SYSTEMD_INVOCATION_ID="$(systemctl show --value --property=InvocationID netdata)" --namespace=netdata --grep prometheus +``` + +#### System without systemd + +Locate the collector log file, typically at `/var/log/netdata/collector.log`, and use `grep` to filter for collector's name: + +```bash +grep prometheus /var/log/netdata/collector.log +``` + +**Note**: This method shows logs from all restarts. Focus on the **latest entries** for troubleshooting current issues. + +#### Docker Container + +If your Netdata runs in a Docker container named "netdata" (replace if different), use this command: + +```bash +docker logs netdata 2>&1 | grep prometheus +``` + diff --git a/src/go/collectors/go.d.plugin/modules/prometheus/integrations/citrix_netscaler.md b/src/go/plugin/go.d/modules/prometheus/integrations/citrix_netscaler.md index 5a1d47cca..e6b704031 100644 --- a/src/go/collectors/go.d.plugin/modules/prometheus/integrations/citrix_netscaler.md +++ b/src/go/plugin/go.d/modules/prometheus/integrations/citrix_netscaler.md @@ -1,6 +1,6 @@ <!--startmeta -custom_edit_url: "https://github.com/netdata/netdata/edit/master/src/go/collectors/go.d.plugin/modules/prometheus/integrations/citrix_netscaler.md" -meta_yaml: "https://github.com/netdata/netdata/edit/master/src/go/collectors/go.d.plugin/modules/prometheus/metadata.yaml" +custom_edit_url: "https://github.com/netdata/netdata/edit/master/src/go/plugin/go.d/modules/prometheus/integrations/citrix_netscaler.md" +meta_yaml: "https://github.com/netdata/netdata/edit/master/src/go/plugin/go.d/modules/prometheus/metadata.yaml" sidebar_label: "Citrix NetScaler" learn_status: "Published" learn_rel_path: "Collecting Metrics/Networking Stack and Network Interfaces" @@ -37,7 +37,6 @@ This collector supports collecting metrics from multiple instances of this integ #### Auto-Detection By default, it detects instances running on the local host by trying to connect to known ports that are [allocated to exporters](https://github.com/prometheus/prometheus/wiki/Default-port-allocations). -The full list of endpoints is available in the collector's [configuration file](https://github.com/netdata/netdata/blob/master/src/go/collectors/go.d.plugin/config/go.d/prometheus.conf). #### Limits @@ -138,7 +137,7 @@ The following options can be defined globally: update_every, autodetection_retry This option allows you to filter out unwanted time series. Only metrics matching the selector will be collected. - Logic: (pattern1 OR pattern2) AND !(pattern3 or pattern4) -- Pattern syntax: [selector](/src/go/collectors/go.d.plugin/pkg/prometheus/selector/README.md). +- Pattern syntax: [selector](/src/go/plugin/go.d/pkg/prometheus/selector/README.md). - Option syntax: ```yaml @@ -266,6 +265,8 @@ jobs: ### Debug Mode +**Important**: Debug mode is not supported for data collection jobs created via the UI using the Dyncfg feature. + To troubleshoot issues with the `prometheus` collector, run the `go.d.plugin` with the debug option enabled. The output should give you clues as to why the collector isn't working. @@ -288,4 +289,37 @@ should give you clues as to why the collector isn't working. ./go.d.plugin -d -m prometheus ``` +### Getting Logs + +If you're encountering problems with the `prometheus` collector, follow these steps to retrieve logs and identify potential issues: + +- **Run the command** specific to your system (systemd, non-systemd, or Docker container). +- **Examine the output** for any warnings or error messages that might indicate issues. These messages should provide clues about the root cause of the problem. + +#### System with systemd + +Use the following command to view logs generated since the last Netdata service restart: + +```bash +journalctl _SYSTEMD_INVOCATION_ID="$(systemctl show --value --property=InvocationID netdata)" --namespace=netdata --grep prometheus +``` + +#### System without systemd + +Locate the collector log file, typically at `/var/log/netdata/collector.log`, and use `grep` to filter for collector's name: + +```bash +grep prometheus /var/log/netdata/collector.log +``` + +**Note**: This method shows logs from all restarts. Focus on the **latest entries** for troubleshooting current issues. + +#### Docker Container + +If your Netdata runs in a Docker container named "netdata" (replace if different), use this command: + +```bash +docker logs netdata 2>&1 | grep prometheus +``` + diff --git a/src/go/collectors/go.d.plugin/modules/prometheus/integrations/clamav_daemon.md b/src/go/plugin/go.d/modules/prometheus/integrations/clamav_daemon.md index abe4e2058..ea0398be5 100644 --- a/src/go/collectors/go.d.plugin/modules/prometheus/integrations/clamav_daemon.md +++ b/src/go/plugin/go.d/modules/prometheus/integrations/clamav_daemon.md @@ -1,6 +1,6 @@ <!--startmeta -custom_edit_url: "https://github.com/netdata/netdata/edit/master/src/go/collectors/go.d.plugin/modules/prometheus/integrations/clamav_daemon.md" -meta_yaml: "https://github.com/netdata/netdata/edit/master/src/go/collectors/go.d.plugin/modules/prometheus/metadata.yaml" +custom_edit_url: "https://github.com/netdata/netdata/edit/master/src/go/plugin/go.d/modules/prometheus/integrations/clamav_daemon.md" +meta_yaml: "https://github.com/netdata/netdata/edit/master/src/go/plugin/go.d/modules/prometheus/metadata.yaml" sidebar_label: "ClamAV daemon" learn_status: "Published" learn_rel_path: "Collecting Metrics/Security Systems" @@ -37,7 +37,6 @@ This collector supports collecting metrics from multiple instances of this integ #### Auto-Detection By default, it detects instances running on the local host by trying to connect to known ports that are [allocated to exporters](https://github.com/prometheus/prometheus/wiki/Default-port-allocations). -The full list of endpoints is available in the collector's [configuration file](https://github.com/netdata/netdata/blob/master/src/go/collectors/go.d.plugin/config/go.d/prometheus.conf). #### Limits @@ -138,7 +137,7 @@ The following options can be defined globally: update_every, autodetection_retry This option allows you to filter out unwanted time series. Only metrics matching the selector will be collected. - Logic: (pattern1 OR pattern2) AND !(pattern3 or pattern4) -- Pattern syntax: [selector](/src/go/collectors/go.d.plugin/pkg/prometheus/selector/README.md). +- Pattern syntax: [selector](/src/go/plugin/go.d/pkg/prometheus/selector/README.md). - Option syntax: ```yaml @@ -266,6 +265,8 @@ jobs: ### Debug Mode +**Important**: Debug mode is not supported for data collection jobs created via the UI using the Dyncfg feature. + To troubleshoot issues with the `prometheus` collector, run the `go.d.plugin` with the debug option enabled. The output should give you clues as to why the collector isn't working. @@ -288,4 +289,37 @@ should give you clues as to why the collector isn't working. ./go.d.plugin -d -m prometheus ``` +### Getting Logs + +If you're encountering problems with the `prometheus` collector, follow these steps to retrieve logs and identify potential issues: + +- **Run the command** specific to your system (systemd, non-systemd, or Docker container). +- **Examine the output** for any warnings or error messages that might indicate issues. These messages should provide clues about the root cause of the problem. + +#### System with systemd + +Use the following command to view logs generated since the last Netdata service restart: + +```bash +journalctl _SYSTEMD_INVOCATION_ID="$(systemctl show --value --property=InvocationID netdata)" --namespace=netdata --grep prometheus +``` + +#### System without systemd + +Locate the collector log file, typically at `/var/log/netdata/collector.log`, and use `grep` to filter for collector's name: + +```bash +grep prometheus /var/log/netdata/collector.log +``` + +**Note**: This method shows logs from all restarts. Focus on the **latest entries** for troubleshooting current issues. + +#### Docker Container + +If your Netdata runs in a Docker container named "netdata" (replace if different), use this command: + +```bash +docker logs netdata 2>&1 | grep prometheus +``` + diff --git a/src/go/collectors/go.d.plugin/modules/prometheus/integrations/clamscan_results.md b/src/go/plugin/go.d/modules/prometheus/integrations/clamscan_results.md index 48910ea66..4cc488b1c 100644 --- a/src/go/collectors/go.d.plugin/modules/prometheus/integrations/clamscan_results.md +++ b/src/go/plugin/go.d/modules/prometheus/integrations/clamscan_results.md @@ -1,6 +1,6 @@ <!--startmeta -custom_edit_url: "https://github.com/netdata/netdata/edit/master/src/go/collectors/go.d.plugin/modules/prometheus/integrations/clamscan_results.md" -meta_yaml: "https://github.com/netdata/netdata/edit/master/src/go/collectors/go.d.plugin/modules/prometheus/metadata.yaml" +custom_edit_url: "https://github.com/netdata/netdata/edit/master/src/go/plugin/go.d/modules/prometheus/integrations/clamscan_results.md" +meta_yaml: "https://github.com/netdata/netdata/edit/master/src/go/plugin/go.d/modules/prometheus/metadata.yaml" sidebar_label: "Clamscan results" learn_status: "Published" learn_rel_path: "Collecting Metrics/Security Systems" @@ -37,7 +37,6 @@ This collector supports collecting metrics from multiple instances of this integ #### Auto-Detection By default, it detects instances running on the local host by trying to connect to known ports that are [allocated to exporters](https://github.com/prometheus/prometheus/wiki/Default-port-allocations). -The full list of endpoints is available in the collector's [configuration file](https://github.com/netdata/netdata/blob/master/src/go/collectors/go.d.plugin/config/go.d/prometheus.conf). #### Limits @@ -138,7 +137,7 @@ The following options can be defined globally: update_every, autodetection_retry This option allows you to filter out unwanted time series. Only metrics matching the selector will be collected. - Logic: (pattern1 OR pattern2) AND !(pattern3 or pattern4) -- Pattern syntax: [selector](/src/go/collectors/go.d.plugin/pkg/prometheus/selector/README.md). +- Pattern syntax: [selector](/src/go/plugin/go.d/pkg/prometheus/selector/README.md). - Option syntax: ```yaml @@ -266,6 +265,8 @@ jobs: ### Debug Mode +**Important**: Debug mode is not supported for data collection jobs created via the UI using the Dyncfg feature. + To troubleshoot issues with the `prometheus` collector, run the `go.d.plugin` with the debug option enabled. The output should give you clues as to why the collector isn't working. @@ -288,4 +289,37 @@ should give you clues as to why the collector isn't working. ./go.d.plugin -d -m prometheus ``` +### Getting Logs + +If you're encountering problems with the `prometheus` collector, follow these steps to retrieve logs and identify potential issues: + +- **Run the command** specific to your system (systemd, non-systemd, or Docker container). +- **Examine the output** for any warnings or error messages that might indicate issues. These messages should provide clues about the root cause of the problem. + +#### System with systemd + +Use the following command to view logs generated since the last Netdata service restart: + +```bash +journalctl _SYSTEMD_INVOCATION_ID="$(systemctl show --value --property=InvocationID netdata)" --namespace=netdata --grep prometheus +``` + +#### System without systemd + +Locate the collector log file, typically at `/var/log/netdata/collector.log`, and use `grep` to filter for collector's name: + +```bash +grep prometheus /var/log/netdata/collector.log +``` + +**Note**: This method shows logs from all restarts. Focus on the **latest entries** for troubleshooting current issues. + +#### Docker Container + +If your Netdata runs in a Docker container named "netdata" (replace if different), use this command: + +```bash +docker logs netdata 2>&1 | grep prometheus +``` + diff --git a/src/go/collectors/go.d.plugin/modules/prometheus/integrations/clash.md b/src/go/plugin/go.d/modules/prometheus/integrations/clash.md index 76d092e1f..23b80bd30 100644 --- a/src/go/collectors/go.d.plugin/modules/prometheus/integrations/clash.md +++ b/src/go/plugin/go.d/modules/prometheus/integrations/clash.md @@ -1,6 +1,6 @@ <!--startmeta -custom_edit_url: "https://github.com/netdata/netdata/edit/master/src/go/collectors/go.d.plugin/modules/prometheus/integrations/clash.md" -meta_yaml: "https://github.com/netdata/netdata/edit/master/src/go/collectors/go.d.plugin/modules/prometheus/metadata.yaml" +custom_edit_url: "https://github.com/netdata/netdata/edit/master/src/go/plugin/go.d/modules/prometheus/integrations/clash.md" +meta_yaml: "https://github.com/netdata/netdata/edit/master/src/go/plugin/go.d/modules/prometheus/metadata.yaml" sidebar_label: "Clash" learn_status: "Published" learn_rel_path: "Collecting Metrics/Web Servers and Web Proxies" @@ -37,7 +37,6 @@ This collector supports collecting metrics from multiple instances of this integ #### Auto-Detection By default, it detects instances running on the local host by trying to connect to known ports that are [allocated to exporters](https://github.com/prometheus/prometheus/wiki/Default-port-allocations). -The full list of endpoints is available in the collector's [configuration file](https://github.com/netdata/netdata/blob/master/src/go/collectors/go.d.plugin/config/go.d/prometheus.conf). #### Limits @@ -138,7 +137,7 @@ The following options can be defined globally: update_every, autodetection_retry This option allows you to filter out unwanted time series. Only metrics matching the selector will be collected. - Logic: (pattern1 OR pattern2) AND !(pattern3 or pattern4) -- Pattern syntax: [selector](/src/go/collectors/go.d.plugin/pkg/prometheus/selector/README.md). +- Pattern syntax: [selector](/src/go/plugin/go.d/pkg/prometheus/selector/README.md). - Option syntax: ```yaml @@ -266,6 +265,8 @@ jobs: ### Debug Mode +**Important**: Debug mode is not supported for data collection jobs created via the UI using the Dyncfg feature. + To troubleshoot issues with the `prometheus` collector, run the `go.d.plugin` with the debug option enabled. The output should give you clues as to why the collector isn't working. @@ -288,4 +289,37 @@ should give you clues as to why the collector isn't working. ./go.d.plugin -d -m prometheus ``` +### Getting Logs + +If you're encountering problems with the `prometheus` collector, follow these steps to retrieve logs and identify potential issues: + +- **Run the command** specific to your system (systemd, non-systemd, or Docker container). +- **Examine the output** for any warnings or error messages that might indicate issues. These messages should provide clues about the root cause of the problem. + +#### System with systemd + +Use the following command to view logs generated since the last Netdata service restart: + +```bash +journalctl _SYSTEMD_INVOCATION_ID="$(systemctl show --value --property=InvocationID netdata)" --namespace=netdata --grep prometheus +``` + +#### System without systemd + +Locate the collector log file, typically at `/var/log/netdata/collector.log`, and use `grep` to filter for collector's name: + +```bash +grep prometheus /var/log/netdata/collector.log +``` + +**Note**: This method shows logs from all restarts. Focus on the **latest entries** for troubleshooting current issues. + +#### Docker Container + +If your Netdata runs in a Docker container named "netdata" (replace if different), use this command: + +```bash +docker logs netdata 2>&1 | grep prometheus +``` + diff --git a/src/go/collectors/go.d.plugin/modules/prometheus/integrations/cloud_foundry.md b/src/go/plugin/go.d/modules/prometheus/integrations/cloud_foundry.md index ea3136e9c..2d1b36c25 100644 --- a/src/go/collectors/go.d.plugin/modules/prometheus/integrations/cloud_foundry.md +++ b/src/go/plugin/go.d/modules/prometheus/integrations/cloud_foundry.md @@ -1,6 +1,6 @@ <!--startmeta -custom_edit_url: "https://github.com/netdata/netdata/edit/master/src/go/collectors/go.d.plugin/modules/prometheus/integrations/cloud_foundry.md" -meta_yaml: "https://github.com/netdata/netdata/edit/master/src/go/collectors/go.d.plugin/modules/prometheus/metadata.yaml" +custom_edit_url: "https://github.com/netdata/netdata/edit/master/src/go/plugin/go.d/modules/prometheus/integrations/cloud_foundry.md" +meta_yaml: "https://github.com/netdata/netdata/edit/master/src/go/plugin/go.d/modules/prometheus/metadata.yaml" sidebar_label: "Cloud Foundry" learn_status: "Published" learn_rel_path: "Collecting Metrics/Provisioning Systems" @@ -37,7 +37,6 @@ This collector supports collecting metrics from multiple instances of this integ #### Auto-Detection By default, it detects instances running on the local host by trying to connect to known ports that are [allocated to exporters](https://github.com/prometheus/prometheus/wiki/Default-port-allocations). -The full list of endpoints is available in the collector's [configuration file](https://github.com/netdata/netdata/blob/master/src/go/collectors/go.d.plugin/config/go.d/prometheus.conf). #### Limits @@ -138,7 +137,7 @@ The following options can be defined globally: update_every, autodetection_retry This option allows you to filter out unwanted time series. Only metrics matching the selector will be collected. - Logic: (pattern1 OR pattern2) AND !(pattern3 or pattern4) -- Pattern syntax: [selector](/src/go/collectors/go.d.plugin/pkg/prometheus/selector/README.md). +- Pattern syntax: [selector](/src/go/plugin/go.d/pkg/prometheus/selector/README.md). - Option syntax: ```yaml @@ -266,6 +265,8 @@ jobs: ### Debug Mode +**Important**: Debug mode is not supported for data collection jobs created via the UI using the Dyncfg feature. + To troubleshoot issues with the `prometheus` collector, run the `go.d.plugin` with the debug option enabled. The output should give you clues as to why the collector isn't working. @@ -288,4 +289,37 @@ should give you clues as to why the collector isn't working. ./go.d.plugin -d -m prometheus ``` +### Getting Logs + +If you're encountering problems with the `prometheus` collector, follow these steps to retrieve logs and identify potential issues: + +- **Run the command** specific to your system (systemd, non-systemd, or Docker container). +- **Examine the output** for any warnings or error messages that might indicate issues. These messages should provide clues about the root cause of the problem. + +#### System with systemd + +Use the following command to view logs generated since the last Netdata service restart: + +```bash +journalctl _SYSTEMD_INVOCATION_ID="$(systemctl show --value --property=InvocationID netdata)" --namespace=netdata --grep prometheus +``` + +#### System without systemd + +Locate the collector log file, typically at `/var/log/netdata/collector.log`, and use `grep` to filter for collector's name: + +```bash +grep prometheus /var/log/netdata/collector.log +``` + +**Note**: This method shows logs from all restarts. Focus on the **latest entries** for troubleshooting current issues. + +#### Docker Container + +If your Netdata runs in a Docker container named "netdata" (replace if different), use this command: + +```bash +docker logs netdata 2>&1 | grep prometheus +``` + diff --git a/src/go/collectors/go.d.plugin/modules/prometheus/integrations/cloud_foundry_firehose.md b/src/go/plugin/go.d/modules/prometheus/integrations/cloud_foundry_firehose.md index 704613da5..d6405b416 100644 --- a/src/go/collectors/go.d.plugin/modules/prometheus/integrations/cloud_foundry_firehose.md +++ b/src/go/plugin/go.d/modules/prometheus/integrations/cloud_foundry_firehose.md @@ -1,6 +1,6 @@ <!--startmeta -custom_edit_url: "https://github.com/netdata/netdata/edit/master/src/go/collectors/go.d.plugin/modules/prometheus/integrations/cloud_foundry_firehose.md" -meta_yaml: "https://github.com/netdata/netdata/edit/master/src/go/collectors/go.d.plugin/modules/prometheus/metadata.yaml" +custom_edit_url: "https://github.com/netdata/netdata/edit/master/src/go/plugin/go.d/modules/prometheus/integrations/cloud_foundry_firehose.md" +meta_yaml: "https://github.com/netdata/netdata/edit/master/src/go/plugin/go.d/modules/prometheus/metadata.yaml" sidebar_label: "Cloud Foundry Firehose" learn_status: "Published" learn_rel_path: "Collecting Metrics/Provisioning Systems" @@ -37,7 +37,6 @@ This collector supports collecting metrics from multiple instances of this integ #### Auto-Detection By default, it detects instances running on the local host by trying to connect to known ports that are [allocated to exporters](https://github.com/prometheus/prometheus/wiki/Default-port-allocations). -The full list of endpoints is available in the collector's [configuration file](https://github.com/netdata/netdata/blob/master/src/go/collectors/go.d.plugin/config/go.d/prometheus.conf). #### Limits @@ -138,7 +137,7 @@ The following options can be defined globally: update_every, autodetection_retry This option allows you to filter out unwanted time series. Only metrics matching the selector will be collected. - Logic: (pattern1 OR pattern2) AND !(pattern3 or pattern4) -- Pattern syntax: [selector](/src/go/collectors/go.d.plugin/pkg/prometheus/selector/README.md). +- Pattern syntax: [selector](/src/go/plugin/go.d/pkg/prometheus/selector/README.md). - Option syntax: ```yaml @@ -266,6 +265,8 @@ jobs: ### Debug Mode +**Important**: Debug mode is not supported for data collection jobs created via the UI using the Dyncfg feature. + To troubleshoot issues with the `prometheus` collector, run the `go.d.plugin` with the debug option enabled. The output should give you clues as to why the collector isn't working. @@ -288,4 +289,37 @@ should give you clues as to why the collector isn't working. ./go.d.plugin -d -m prometheus ``` +### Getting Logs + +If you're encountering problems with the `prometheus` collector, follow these steps to retrieve logs and identify potential issues: + +- **Run the command** specific to your system (systemd, non-systemd, or Docker container). +- **Examine the output** for any warnings or error messages that might indicate issues. These messages should provide clues about the root cause of the problem. + +#### System with systemd + +Use the following command to view logs generated since the last Netdata service restart: + +```bash +journalctl _SYSTEMD_INVOCATION_ID="$(systemctl show --value --property=InvocationID netdata)" --namespace=netdata --grep prometheus +``` + +#### System without systemd + +Locate the collector log file, typically at `/var/log/netdata/collector.log`, and use `grep` to filter for collector's name: + +```bash +grep prometheus /var/log/netdata/collector.log +``` + +**Note**: This method shows logs from all restarts. Focus on the **latest entries** for troubleshooting current issues. + +#### Docker Container + +If your Netdata runs in a Docker container named "netdata" (replace if different), use this command: + +```bash +docker logs netdata 2>&1 | grep prometheus +``` + diff --git a/src/go/collectors/go.d.plugin/modules/prometheus/integrations/cloudflare_pcap.md b/src/go/plugin/go.d/modules/prometheus/integrations/cloudflare_pcap.md index fd2606685..2c1c479a4 100644 --- a/src/go/collectors/go.d.plugin/modules/prometheus/integrations/cloudflare_pcap.md +++ b/src/go/plugin/go.d/modules/prometheus/integrations/cloudflare_pcap.md @@ -1,6 +1,6 @@ <!--startmeta -custom_edit_url: "https://github.com/netdata/netdata/edit/master/src/go/collectors/go.d.plugin/modules/prometheus/integrations/cloudflare_pcap.md" -meta_yaml: "https://github.com/netdata/netdata/edit/master/src/go/collectors/go.d.plugin/modules/prometheus/metadata.yaml" +custom_edit_url: "https://github.com/netdata/netdata/edit/master/src/go/plugin/go.d/modules/prometheus/integrations/cloudflare_pcap.md" +meta_yaml: "https://github.com/netdata/netdata/edit/master/src/go/plugin/go.d/modules/prometheus/metadata.yaml" sidebar_label: "Cloudflare PCAP" learn_status: "Published" learn_rel_path: "Collecting Metrics/Web Servers and Web Proxies" @@ -37,7 +37,6 @@ This collector supports collecting metrics from multiple instances of this integ #### Auto-Detection By default, it detects instances running on the local host by trying to connect to known ports that are [allocated to exporters](https://github.com/prometheus/prometheus/wiki/Default-port-allocations). -The full list of endpoints is available in the collector's [configuration file](https://github.com/netdata/netdata/blob/master/src/go/collectors/go.d.plugin/config/go.d/prometheus.conf). #### Limits @@ -138,7 +137,7 @@ The following options can be defined globally: update_every, autodetection_retry This option allows you to filter out unwanted time series. Only metrics matching the selector will be collected. - Logic: (pattern1 OR pattern2) AND !(pattern3 or pattern4) -- Pattern syntax: [selector](/src/go/collectors/go.d.plugin/pkg/prometheus/selector/README.md). +- Pattern syntax: [selector](/src/go/plugin/go.d/pkg/prometheus/selector/README.md). - Option syntax: ```yaml @@ -266,6 +265,8 @@ jobs: ### Debug Mode +**Important**: Debug mode is not supported for data collection jobs created via the UI using the Dyncfg feature. + To troubleshoot issues with the `prometheus` collector, run the `go.d.plugin` with the debug option enabled. The output should give you clues as to why the collector isn't working. @@ -288,4 +289,37 @@ should give you clues as to why the collector isn't working. ./go.d.plugin -d -m prometheus ``` +### Getting Logs + +If you're encountering problems with the `prometheus` collector, follow these steps to retrieve logs and identify potential issues: + +- **Run the command** specific to your system (systemd, non-systemd, or Docker container). +- **Examine the output** for any warnings or error messages that might indicate issues. These messages should provide clues about the root cause of the problem. + +#### System with systemd + +Use the following command to view logs generated since the last Netdata service restart: + +```bash +journalctl _SYSTEMD_INVOCATION_ID="$(systemctl show --value --property=InvocationID netdata)" --namespace=netdata --grep prometheus +``` + +#### System without systemd + +Locate the collector log file, typically at `/var/log/netdata/collector.log`, and use `grep` to filter for collector's name: + +```bash +grep prometheus /var/log/netdata/collector.log +``` + +**Note**: This method shows logs from all restarts. Focus on the **latest entries** for troubleshooting current issues. + +#### Docker Container + +If your Netdata runs in a Docker container named "netdata" (replace if different), use this command: + +```bash +docker logs netdata 2>&1 | grep prometheus +``` + diff --git a/src/go/collectors/go.d.plugin/modules/prometheus/integrations/cloudwatch.md b/src/go/plugin/go.d/modules/prometheus/integrations/cloudwatch.md index 32a5eee3e..816c0450e 100644 --- a/src/go/collectors/go.d.plugin/modules/prometheus/integrations/cloudwatch.md +++ b/src/go/plugin/go.d/modules/prometheus/integrations/cloudwatch.md @@ -1,6 +1,6 @@ <!--startmeta -custom_edit_url: "https://github.com/netdata/netdata/edit/master/src/go/collectors/go.d.plugin/modules/prometheus/integrations/cloudwatch.md" -meta_yaml: "https://github.com/netdata/netdata/edit/master/src/go/collectors/go.d.plugin/modules/prometheus/metadata.yaml" +custom_edit_url: "https://github.com/netdata/netdata/edit/master/src/go/plugin/go.d/modules/prometheus/integrations/cloudwatch.md" +meta_yaml: "https://github.com/netdata/netdata/edit/master/src/go/plugin/go.d/modules/prometheus/metadata.yaml" sidebar_label: "CloudWatch" learn_status: "Published" learn_rel_path: "Collecting Metrics/Cloud Provider Managed" @@ -37,7 +37,6 @@ This collector supports collecting metrics from multiple instances of this integ #### Auto-Detection By default, it detects instances running on the local host by trying to connect to known ports that are [allocated to exporters](https://github.com/prometheus/prometheus/wiki/Default-port-allocations). -The full list of endpoints is available in the collector's [configuration file](https://github.com/netdata/netdata/blob/master/src/go/collectors/go.d.plugin/config/go.d/prometheus.conf). #### Limits @@ -138,7 +137,7 @@ The following options can be defined globally: update_every, autodetection_retry This option allows you to filter out unwanted time series. Only metrics matching the selector will be collected. - Logic: (pattern1 OR pattern2) AND !(pattern3 or pattern4) -- Pattern syntax: [selector](/src/go/collectors/go.d.plugin/pkg/prometheus/selector/README.md). +- Pattern syntax: [selector](/src/go/plugin/go.d/pkg/prometheus/selector/README.md). - Option syntax: ```yaml @@ -266,6 +265,8 @@ jobs: ### Debug Mode +**Important**: Debug mode is not supported for data collection jobs created via the UI using the Dyncfg feature. + To troubleshoot issues with the `prometheus` collector, run the `go.d.plugin` with the debug option enabled. The output should give you clues as to why the collector isn't working. @@ -288,4 +289,37 @@ should give you clues as to why the collector isn't working. ./go.d.plugin -d -m prometheus ``` +### Getting Logs + +If you're encountering problems with the `prometheus` collector, follow these steps to retrieve logs and identify potential issues: + +- **Run the command** specific to your system (systemd, non-systemd, or Docker container). +- **Examine the output** for any warnings or error messages that might indicate issues. These messages should provide clues about the root cause of the problem. + +#### System with systemd + +Use the following command to view logs generated since the last Netdata service restart: + +```bash +journalctl _SYSTEMD_INVOCATION_ID="$(systemctl show --value --property=InvocationID netdata)" --namespace=netdata --grep prometheus +``` + +#### System without systemd + +Locate the collector log file, typically at `/var/log/netdata/collector.log`, and use `grep` to filter for collector's name: + +```bash +grep prometheus /var/log/netdata/collector.log +``` + +**Note**: This method shows logs from all restarts. Focus on the **latest entries** for troubleshooting current issues. + +#### Docker Container + +If your Netdata runs in a Docker container named "netdata" (replace if different), use this command: + +```bash +docker logs netdata 2>&1 | grep prometheus +``` + diff --git a/src/go/collectors/go.d.plugin/modules/prometheus/integrations/clustercontrol_cmon.md b/src/go/plugin/go.d/modules/prometheus/integrations/clustercontrol_cmon.md index 82f853b8e..c69cb434c 100644 --- a/src/go/collectors/go.d.plugin/modules/prometheus/integrations/clustercontrol_cmon.md +++ b/src/go/plugin/go.d/modules/prometheus/integrations/clustercontrol_cmon.md @@ -1,6 +1,6 @@ <!--startmeta -custom_edit_url: "https://github.com/netdata/netdata/edit/master/src/go/collectors/go.d.plugin/modules/prometheus/integrations/clustercontrol_cmon.md" -meta_yaml: "https://github.com/netdata/netdata/edit/master/src/go/collectors/go.d.plugin/modules/prometheus/metadata.yaml" +custom_edit_url: "https://github.com/netdata/netdata/edit/master/src/go/plugin/go.d/modules/prometheus/integrations/clustercontrol_cmon.md" +meta_yaml: "https://github.com/netdata/netdata/edit/master/src/go/plugin/go.d/modules/prometheus/metadata.yaml" sidebar_label: "ClusterControl CMON" learn_status: "Published" learn_rel_path: "Collecting Metrics/Databases" @@ -37,7 +37,6 @@ This collector supports collecting metrics from multiple instances of this integ #### Auto-Detection By default, it detects instances running on the local host by trying to connect to known ports that are [allocated to exporters](https://github.com/prometheus/prometheus/wiki/Default-port-allocations). -The full list of endpoints is available in the collector's [configuration file](https://github.com/netdata/netdata/blob/master/src/go/collectors/go.d.plugin/config/go.d/prometheus.conf). #### Limits @@ -138,7 +137,7 @@ The following options can be defined globally: update_every, autodetection_retry This option allows you to filter out unwanted time series. Only metrics matching the selector will be collected. - Logic: (pattern1 OR pattern2) AND !(pattern3 or pattern4) -- Pattern syntax: [selector](/src/go/collectors/go.d.plugin/pkg/prometheus/selector/README.md). +- Pattern syntax: [selector](/src/go/plugin/go.d/pkg/prometheus/selector/README.md). - Option syntax: ```yaml @@ -266,6 +265,8 @@ jobs: ### Debug Mode +**Important**: Debug mode is not supported for data collection jobs created via the UI using the Dyncfg feature. + To troubleshoot issues with the `prometheus` collector, run the `go.d.plugin` with the debug option enabled. The output should give you clues as to why the collector isn't working. @@ -288,4 +289,37 @@ should give you clues as to why the collector isn't working. ./go.d.plugin -d -m prometheus ``` +### Getting Logs + +If you're encountering problems with the `prometheus` collector, follow these steps to retrieve logs and identify potential issues: + +- **Run the command** specific to your system (systemd, non-systemd, or Docker container). +- **Examine the output** for any warnings or error messages that might indicate issues. These messages should provide clues about the root cause of the problem. + +#### System with systemd + +Use the following command to view logs generated since the last Netdata service restart: + +```bash +journalctl _SYSTEMD_INVOCATION_ID="$(systemctl show --value --property=InvocationID netdata)" --namespace=netdata --grep prometheus +``` + +#### System without systemd + +Locate the collector log file, typically at `/var/log/netdata/collector.log`, and use `grep` to filter for collector's name: + +```bash +grep prometheus /var/log/netdata/collector.log +``` + +**Note**: This method shows logs from all restarts. Focus on the **latest entries** for troubleshooting current issues. + +#### Docker Container + +If your Netdata runs in a Docker container named "netdata" (replace if different), use this command: + +```bash +docker logs netdata 2>&1 | grep prometheus +``` + diff --git a/src/go/collectors/go.d.plugin/modules/prometheus/integrations/collectd.md b/src/go/plugin/go.d/modules/prometheus/integrations/collectd.md index 9f2def2b9..972146881 100644 --- a/src/go/collectors/go.d.plugin/modules/prometheus/integrations/collectd.md +++ b/src/go/plugin/go.d/modules/prometheus/integrations/collectd.md @@ -1,6 +1,6 @@ <!--startmeta -custom_edit_url: "https://github.com/netdata/netdata/edit/master/src/go/collectors/go.d.plugin/modules/prometheus/integrations/collectd.md" -meta_yaml: "https://github.com/netdata/netdata/edit/master/src/go/collectors/go.d.plugin/modules/prometheus/metadata.yaml" +custom_edit_url: "https://github.com/netdata/netdata/edit/master/src/go/plugin/go.d/modules/prometheus/integrations/collectd.md" +meta_yaml: "https://github.com/netdata/netdata/edit/master/src/go/plugin/go.d/modules/prometheus/metadata.yaml" sidebar_label: "Collectd" learn_status: "Published" learn_rel_path: "Collecting Metrics/Observability" @@ -37,7 +37,6 @@ This collector supports collecting metrics from multiple instances of this integ #### Auto-Detection By default, it detects instances running on the local host by trying to connect to known ports that are [allocated to exporters](https://github.com/prometheus/prometheus/wiki/Default-port-allocations). -The full list of endpoints is available in the collector's [configuration file](https://github.com/netdata/netdata/blob/master/src/go/collectors/go.d.plugin/config/go.d/prometheus.conf). #### Limits @@ -138,7 +137,7 @@ The following options can be defined globally: update_every, autodetection_retry This option allows you to filter out unwanted time series. Only metrics matching the selector will be collected. - Logic: (pattern1 OR pattern2) AND !(pattern3 or pattern4) -- Pattern syntax: [selector](/src/go/collectors/go.d.plugin/pkg/prometheus/selector/README.md). +- Pattern syntax: [selector](/src/go/plugin/go.d/pkg/prometheus/selector/README.md). - Option syntax: ```yaml @@ -266,6 +265,8 @@ jobs: ### Debug Mode +**Important**: Debug mode is not supported for data collection jobs created via the UI using the Dyncfg feature. + To troubleshoot issues with the `prometheus` collector, run the `go.d.plugin` with the debug option enabled. The output should give you clues as to why the collector isn't working. @@ -288,4 +289,37 @@ should give you clues as to why the collector isn't working. ./go.d.plugin -d -m prometheus ``` +### Getting Logs + +If you're encountering problems with the `prometheus` collector, follow these steps to retrieve logs and identify potential issues: + +- **Run the command** specific to your system (systemd, non-systemd, or Docker container). +- **Examine the output** for any warnings or error messages that might indicate issues. These messages should provide clues about the root cause of the problem. + +#### System with systemd + +Use the following command to view logs generated since the last Netdata service restart: + +```bash +journalctl _SYSTEMD_INVOCATION_ID="$(systemctl show --value --property=InvocationID netdata)" --namespace=netdata --grep prometheus +``` + +#### System without systemd + +Locate the collector log file, typically at `/var/log/netdata/collector.log`, and use `grep` to filter for collector's name: + +```bash +grep prometheus /var/log/netdata/collector.log +``` + +**Note**: This method shows logs from all restarts. Focus on the **latest entries** for troubleshooting current issues. + +#### Docker Container + +If your Netdata runs in a Docker container named "netdata" (replace if different), use this command: + +```bash +docker logs netdata 2>&1 | grep prometheus +``` + diff --git a/src/go/collectors/go.d.plugin/modules/prometheus/integrations/concourse.md b/src/go/plugin/go.d/modules/prometheus/integrations/concourse.md index d6c04ab3d..ce7baff4b 100644 --- a/src/go/collectors/go.d.plugin/modules/prometheus/integrations/concourse.md +++ b/src/go/plugin/go.d/modules/prometheus/integrations/concourse.md @@ -1,6 +1,6 @@ <!--startmeta -custom_edit_url: "https://github.com/netdata/netdata/edit/master/src/go/collectors/go.d.plugin/modules/prometheus/integrations/concourse.md" -meta_yaml: "https://github.com/netdata/netdata/edit/master/src/go/collectors/go.d.plugin/modules/prometheus/metadata.yaml" +custom_edit_url: "https://github.com/netdata/netdata/edit/master/src/go/plugin/go.d/modules/prometheus/integrations/concourse.md" +meta_yaml: "https://github.com/netdata/netdata/edit/master/src/go/plugin/go.d/modules/prometheus/metadata.yaml" sidebar_label: "Concourse" learn_status: "Published" learn_rel_path: "Collecting Metrics/CICD Platforms" @@ -37,7 +37,6 @@ This collector supports collecting metrics from multiple instances of this integ #### Auto-Detection By default, it detects instances running on the local host by trying to connect to known ports that are [allocated to exporters](https://github.com/prometheus/prometheus/wiki/Default-port-allocations). -The full list of endpoints is available in the collector's [configuration file](https://github.com/netdata/netdata/blob/master/src/go/collectors/go.d.plugin/config/go.d/prometheus.conf). #### Limits @@ -138,7 +137,7 @@ The following options can be defined globally: update_every, autodetection_retry This option allows you to filter out unwanted time series. Only metrics matching the selector will be collected. - Logic: (pattern1 OR pattern2) AND !(pattern3 or pattern4) -- Pattern syntax: [selector](/src/go/collectors/go.d.plugin/pkg/prometheus/selector/README.md). +- Pattern syntax: [selector](/src/go/plugin/go.d/pkg/prometheus/selector/README.md). - Option syntax: ```yaml @@ -266,6 +265,8 @@ jobs: ### Debug Mode +**Important**: Debug mode is not supported for data collection jobs created via the UI using the Dyncfg feature. + To troubleshoot issues with the `prometheus` collector, run the `go.d.plugin` with the debug option enabled. The output should give you clues as to why the collector isn't working. @@ -288,4 +289,37 @@ should give you clues as to why the collector isn't working. ./go.d.plugin -d -m prometheus ``` +### Getting Logs + +If you're encountering problems with the `prometheus` collector, follow these steps to retrieve logs and identify potential issues: + +- **Run the command** specific to your system (systemd, non-systemd, or Docker container). +- **Examine the output** for any warnings or error messages that might indicate issues. These messages should provide clues about the root cause of the problem. + +#### System with systemd + +Use the following command to view logs generated since the last Netdata service restart: + +```bash +journalctl _SYSTEMD_INVOCATION_ID="$(systemctl show --value --property=InvocationID netdata)" --namespace=netdata --grep prometheus +``` + +#### System without systemd + +Locate the collector log file, typically at `/var/log/netdata/collector.log`, and use `grep` to filter for collector's name: + +```bash +grep prometheus /var/log/netdata/collector.log +``` + +**Note**: This method shows logs from all restarts. Focus on the **latest entries** for troubleshooting current issues. + +#### Docker Container + +If your Netdata runs in a Docker container named "netdata" (replace if different), use this command: + +```bash +docker logs netdata 2>&1 | grep prometheus +``` + diff --git a/src/go/collectors/go.d.plugin/modules/prometheus/integrations/craftbeerpi.md b/src/go/plugin/go.d/modules/prometheus/integrations/craftbeerpi.md index 809750202..f4dae54c5 100644 --- a/src/go/collectors/go.d.plugin/modules/prometheus/integrations/craftbeerpi.md +++ b/src/go/plugin/go.d/modules/prometheus/integrations/craftbeerpi.md @@ -1,6 +1,6 @@ <!--startmeta -custom_edit_url: "https://github.com/netdata/netdata/edit/master/src/go/collectors/go.d.plugin/modules/prometheus/integrations/craftbeerpi.md" -meta_yaml: "https://github.com/netdata/netdata/edit/master/src/go/collectors/go.d.plugin/modules/prometheus/metadata.yaml" +custom_edit_url: "https://github.com/netdata/netdata/edit/master/src/go/plugin/go.d/modules/prometheus/integrations/craftbeerpi.md" +meta_yaml: "https://github.com/netdata/netdata/edit/master/src/go/plugin/go.d/modules/prometheus/metadata.yaml" sidebar_label: "CraftBeerPi" learn_status: "Published" learn_rel_path: "Collecting Metrics/IoT Devices" @@ -37,7 +37,6 @@ This collector supports collecting metrics from multiple instances of this integ #### Auto-Detection By default, it detects instances running on the local host by trying to connect to known ports that are [allocated to exporters](https://github.com/prometheus/prometheus/wiki/Default-port-allocations). -The full list of endpoints is available in the collector's [configuration file](https://github.com/netdata/netdata/blob/master/src/go/collectors/go.d.plugin/config/go.d/prometheus.conf). #### Limits @@ -138,7 +137,7 @@ The following options can be defined globally: update_every, autodetection_retry This option allows you to filter out unwanted time series. Only metrics matching the selector will be collected. - Logic: (pattern1 OR pattern2) AND !(pattern3 or pattern4) -- Pattern syntax: [selector](/src/go/collectors/go.d.plugin/pkg/prometheus/selector/README.md). +- Pattern syntax: [selector](/src/go/plugin/go.d/pkg/prometheus/selector/README.md). - Option syntax: ```yaml @@ -266,6 +265,8 @@ jobs: ### Debug Mode +**Important**: Debug mode is not supported for data collection jobs created via the UI using the Dyncfg feature. + To troubleshoot issues with the `prometheus` collector, run the `go.d.plugin` with the debug option enabled. The output should give you clues as to why the collector isn't working. @@ -288,4 +289,37 @@ should give you clues as to why the collector isn't working. ./go.d.plugin -d -m prometheus ``` +### Getting Logs + +If you're encountering problems with the `prometheus` collector, follow these steps to retrieve logs and identify potential issues: + +- **Run the command** specific to your system (systemd, non-systemd, or Docker container). +- **Examine the output** for any warnings or error messages that might indicate issues. These messages should provide clues about the root cause of the problem. + +#### System with systemd + +Use the following command to view logs generated since the last Netdata service restart: + +```bash +journalctl _SYSTEMD_INVOCATION_ID="$(systemctl show --value --property=InvocationID netdata)" --namespace=netdata --grep prometheus +``` + +#### System without systemd + +Locate the collector log file, typically at `/var/log/netdata/collector.log`, and use `grep` to filter for collector's name: + +```bash +grep prometheus /var/log/netdata/collector.log +``` + +**Note**: This method shows logs from all restarts. Focus on the **latest entries** for troubleshooting current issues. + +#### Docker Container + +If your Netdata runs in a Docker container named "netdata" (replace if different), use this command: + +```bash +docker logs netdata 2>&1 | grep prometheus +``` + diff --git a/src/go/collectors/go.d.plugin/modules/prometheus/integrations/crowdsec.md b/src/go/plugin/go.d/modules/prometheus/integrations/crowdsec.md index d7aebeb88..a59069dd3 100644 --- a/src/go/collectors/go.d.plugin/modules/prometheus/integrations/crowdsec.md +++ b/src/go/plugin/go.d/modules/prometheus/integrations/crowdsec.md @@ -1,6 +1,6 @@ <!--startmeta -custom_edit_url: "https://github.com/netdata/netdata/edit/master/src/go/collectors/go.d.plugin/modules/prometheus/integrations/crowdsec.md" -meta_yaml: "https://github.com/netdata/netdata/edit/master/src/go/collectors/go.d.plugin/modules/prometheus/metadata.yaml" +custom_edit_url: "https://github.com/netdata/netdata/edit/master/src/go/plugin/go.d/modules/prometheus/integrations/crowdsec.md" +meta_yaml: "https://github.com/netdata/netdata/edit/master/src/go/plugin/go.d/modules/prometheus/metadata.yaml" sidebar_label: "Crowdsec" learn_status: "Published" learn_rel_path: "Collecting Metrics/Security Systems" @@ -37,7 +37,6 @@ This collector supports collecting metrics from multiple instances of this integ #### Auto-Detection By default, it detects instances running on the local host by trying to connect to known ports that are [allocated to exporters](https://github.com/prometheus/prometheus/wiki/Default-port-allocations). -The full list of endpoints is available in the collector's [configuration file](https://github.com/netdata/netdata/blob/master/src/go/collectors/go.d.plugin/config/go.d/prometheus.conf). #### Limits @@ -138,7 +137,7 @@ The following options can be defined globally: update_every, autodetection_retry This option allows you to filter out unwanted time series. Only metrics matching the selector will be collected. - Logic: (pattern1 OR pattern2) AND !(pattern3 or pattern4) -- Pattern syntax: [selector](/src/go/collectors/go.d.plugin/pkg/prometheus/selector/README.md). +- Pattern syntax: [selector](/src/go/plugin/go.d/pkg/prometheus/selector/README.md). - Option syntax: ```yaml @@ -266,6 +265,8 @@ jobs: ### Debug Mode +**Important**: Debug mode is not supported for data collection jobs created via the UI using the Dyncfg feature. + To troubleshoot issues with the `prometheus` collector, run the `go.d.plugin` with the debug option enabled. The output should give you clues as to why the collector isn't working. @@ -288,4 +289,37 @@ should give you clues as to why the collector isn't working. ./go.d.plugin -d -m prometheus ``` +### Getting Logs + +If you're encountering problems with the `prometheus` collector, follow these steps to retrieve logs and identify potential issues: + +- **Run the command** specific to your system (systemd, non-systemd, or Docker container). +- **Examine the output** for any warnings or error messages that might indicate issues. These messages should provide clues about the root cause of the problem. + +#### System with systemd + +Use the following command to view logs generated since the last Netdata service restart: + +```bash +journalctl _SYSTEMD_INVOCATION_ID="$(systemctl show --value --property=InvocationID netdata)" --namespace=netdata --grep prometheus +``` + +#### System without systemd + +Locate the collector log file, typically at `/var/log/netdata/collector.log`, and use `grep` to filter for collector's name: + +```bash +grep prometheus /var/log/netdata/collector.log +``` + +**Note**: This method shows logs from all restarts. Focus on the **latest entries** for troubleshooting current issues. + +#### Docker Container + +If your Netdata runs in a Docker container named "netdata" (replace if different), use this command: + +```bash +docker logs netdata 2>&1 | grep prometheus +``` + diff --git a/src/go/collectors/go.d.plugin/modules/prometheus/integrations/crypto_exchanges.md b/src/go/plugin/go.d/modules/prometheus/integrations/crypto_exchanges.md index c6b4a9c87..a56ed0db5 100644 --- a/src/go/collectors/go.d.plugin/modules/prometheus/integrations/crypto_exchanges.md +++ b/src/go/plugin/go.d/modules/prometheus/integrations/crypto_exchanges.md @@ -1,6 +1,6 @@ <!--startmeta -custom_edit_url: "https://github.com/netdata/netdata/edit/master/src/go/collectors/go.d.plugin/modules/prometheus/integrations/crypto_exchanges.md" -meta_yaml: "https://github.com/netdata/netdata/edit/master/src/go/collectors/go.d.plugin/modules/prometheus/metadata.yaml" +custom_edit_url: "https://github.com/netdata/netdata/edit/master/src/go/plugin/go.d/modules/prometheus/integrations/crypto_exchanges.md" +meta_yaml: "https://github.com/netdata/netdata/edit/master/src/go/plugin/go.d/modules/prometheus/metadata.yaml" sidebar_label: "Crypto exchanges" learn_status: "Published" learn_rel_path: "Collecting Metrics/Blockchain Servers" @@ -37,7 +37,6 @@ This collector supports collecting metrics from multiple instances of this integ #### Auto-Detection By default, it detects instances running on the local host by trying to connect to known ports that are [allocated to exporters](https://github.com/prometheus/prometheus/wiki/Default-port-allocations). -The full list of endpoints is available in the collector's [configuration file](https://github.com/netdata/netdata/blob/master/src/go/collectors/go.d.plugin/config/go.d/prometheus.conf). #### Limits @@ -138,7 +137,7 @@ The following options can be defined globally: update_every, autodetection_retry This option allows you to filter out unwanted time series. Only metrics matching the selector will be collected. - Logic: (pattern1 OR pattern2) AND !(pattern3 or pattern4) -- Pattern syntax: [selector](/src/go/collectors/go.d.plugin/pkg/prometheus/selector/README.md). +- Pattern syntax: [selector](/src/go/plugin/go.d/pkg/prometheus/selector/README.md). - Option syntax: ```yaml @@ -266,6 +265,8 @@ jobs: ### Debug Mode +**Important**: Debug mode is not supported for data collection jobs created via the UI using the Dyncfg feature. + To troubleshoot issues with the `prometheus` collector, run the `go.d.plugin` with the debug option enabled. The output should give you clues as to why the collector isn't working. @@ -288,4 +289,37 @@ should give you clues as to why the collector isn't working. ./go.d.plugin -d -m prometheus ``` +### Getting Logs + +If you're encountering problems with the `prometheus` collector, follow these steps to retrieve logs and identify potential issues: + +- **Run the command** specific to your system (systemd, non-systemd, or Docker container). +- **Examine the output** for any warnings or error messages that might indicate issues. These messages should provide clues about the root cause of the problem. + +#### System with systemd + +Use the following command to view logs generated since the last Netdata service restart: + +```bash +journalctl _SYSTEMD_INVOCATION_ID="$(systemctl show --value --property=InvocationID netdata)" --namespace=netdata --grep prometheus +``` + +#### System without systemd + +Locate the collector log file, typically at `/var/log/netdata/collector.log`, and use `grep` to filter for collector's name: + +```bash +grep prometheus /var/log/netdata/collector.log +``` + +**Note**: This method shows logs from all restarts. Focus on the **latest entries** for troubleshooting current issues. + +#### Docker Container + +If your Netdata runs in a Docker container named "netdata" (replace if different), use this command: + +```bash +docker logs netdata 2>&1 | grep prometheus +``` + diff --git a/src/go/collectors/go.d.plugin/modules/prometheus/integrations/cryptowatch.md b/src/go/plugin/go.d/modules/prometheus/integrations/cryptowatch.md index 599c83b16..554910783 100644 --- a/src/go/collectors/go.d.plugin/modules/prometheus/integrations/cryptowatch.md +++ b/src/go/plugin/go.d/modules/prometheus/integrations/cryptowatch.md @@ -1,6 +1,6 @@ <!--startmeta -custom_edit_url: "https://github.com/netdata/netdata/edit/master/src/go/collectors/go.d.plugin/modules/prometheus/integrations/cryptowatch.md" -meta_yaml: "https://github.com/netdata/netdata/edit/master/src/go/collectors/go.d.plugin/modules/prometheus/metadata.yaml" +custom_edit_url: "https://github.com/netdata/netdata/edit/master/src/go/plugin/go.d/modules/prometheus/integrations/cryptowatch.md" +meta_yaml: "https://github.com/netdata/netdata/edit/master/src/go/plugin/go.d/modules/prometheus/metadata.yaml" sidebar_label: "Cryptowatch" learn_status: "Published" learn_rel_path: "Collecting Metrics/Blockchain Servers" @@ -37,7 +37,6 @@ This collector supports collecting metrics from multiple instances of this integ #### Auto-Detection By default, it detects instances running on the local host by trying to connect to known ports that are [allocated to exporters](https://github.com/prometheus/prometheus/wiki/Default-port-allocations). -The full list of endpoints is available in the collector's [configuration file](https://github.com/netdata/netdata/blob/master/src/go/collectors/go.d.plugin/config/go.d/prometheus.conf). #### Limits @@ -138,7 +137,7 @@ The following options can be defined globally: update_every, autodetection_retry This option allows you to filter out unwanted time series. Only metrics matching the selector will be collected. - Logic: (pattern1 OR pattern2) AND !(pattern3 or pattern4) -- Pattern syntax: [selector](/src/go/collectors/go.d.plugin/pkg/prometheus/selector/README.md). +- Pattern syntax: [selector](/src/go/plugin/go.d/pkg/prometheus/selector/README.md). - Option syntax: ```yaml @@ -266,6 +265,8 @@ jobs: ### Debug Mode +**Important**: Debug mode is not supported for data collection jobs created via the UI using the Dyncfg feature. + To troubleshoot issues with the `prometheus` collector, run the `go.d.plugin` with the debug option enabled. The output should give you clues as to why the collector isn't working. @@ -288,4 +289,37 @@ should give you clues as to why the collector isn't working. ./go.d.plugin -d -m prometheus ``` +### Getting Logs + +If you're encountering problems with the `prometheus` collector, follow these steps to retrieve logs and identify potential issues: + +- **Run the command** specific to your system (systemd, non-systemd, or Docker container). +- **Examine the output** for any warnings or error messages that might indicate issues. These messages should provide clues about the root cause of the problem. + +#### System with systemd + +Use the following command to view logs generated since the last Netdata service restart: + +```bash +journalctl _SYSTEMD_INVOCATION_ID="$(systemctl show --value --property=InvocationID netdata)" --namespace=netdata --grep prometheus +``` + +#### System without systemd + +Locate the collector log file, typically at `/var/log/netdata/collector.log`, and use `grep` to filter for collector's name: + +```bash +grep prometheus /var/log/netdata/collector.log +``` + +**Note**: This method shows logs from all restarts. Focus on the **latest entries** for troubleshooting current issues. + +#### Docker Container + +If your Netdata runs in a Docker container named "netdata" (replace if different), use this command: + +```bash +docker logs netdata 2>&1 | grep prometheus +``` + diff --git a/src/go/collectors/go.d.plugin/modules/prometheus/integrations/custom_exporter.md b/src/go/plugin/go.d/modules/prometheus/integrations/custom_exporter.md index 950baef8a..9d309e624 100644 --- a/src/go/collectors/go.d.plugin/modules/prometheus/integrations/custom_exporter.md +++ b/src/go/plugin/go.d/modules/prometheus/integrations/custom_exporter.md @@ -1,6 +1,6 @@ <!--startmeta -custom_edit_url: "https://github.com/netdata/netdata/edit/master/src/go/collectors/go.d.plugin/modules/prometheus/integrations/custom_exporter.md" -meta_yaml: "https://github.com/netdata/netdata/edit/master/src/go/collectors/go.d.plugin/modules/prometheus/metadata.yaml" +custom_edit_url: "https://github.com/netdata/netdata/edit/master/src/go/plugin/go.d/modules/prometheus/integrations/custom_exporter.md" +meta_yaml: "https://github.com/netdata/netdata/edit/master/src/go/plugin/go.d/modules/prometheus/metadata.yaml" sidebar_label: "Custom Exporter" learn_status: "Published" learn_rel_path: "Collecting Metrics/Generic Collecting Metrics" @@ -37,7 +37,6 @@ This collector supports collecting metrics from multiple instances of this integ #### Auto-Detection By default, it detects instances running on the local host by trying to connect to known ports that are [allocated to exporters](https://github.com/prometheus/prometheus/wiki/Default-port-allocations). -The full list of endpoints is available in the collector's [configuration file](https://github.com/netdata/netdata/blob/master/src/go/collectors/go.d.plugin/config/go.d/prometheus.conf). #### Limits @@ -138,7 +137,7 @@ The following options can be defined globally: update_every, autodetection_retry This option allows you to filter out unwanted time series. Only metrics matching the selector will be collected. - Logic: (pattern1 OR pattern2) AND !(pattern3 or pattern4) -- Pattern syntax: [selector](/src/go/collectors/go.d.plugin/pkg/prometheus/selector/README.md). +- Pattern syntax: [selector](/src/go/plugin/go.d/pkg/prometheus/selector/README.md). - Option syntax: ```yaml @@ -266,6 +265,8 @@ jobs: ### Debug Mode +**Important**: Debug mode is not supported for data collection jobs created via the UI using the Dyncfg feature. + To troubleshoot issues with the `prometheus` collector, run the `go.d.plugin` with the debug option enabled. The output should give you clues as to why the collector isn't working. @@ -288,4 +289,37 @@ should give you clues as to why the collector isn't working. ./go.d.plugin -d -m prometheus ``` +### Getting Logs + +If you're encountering problems with the `prometheus` collector, follow these steps to retrieve logs and identify potential issues: + +- **Run the command** specific to your system (systemd, non-systemd, or Docker container). +- **Examine the output** for any warnings or error messages that might indicate issues. These messages should provide clues about the root cause of the problem. + +#### System with systemd + +Use the following command to view logs generated since the last Netdata service restart: + +```bash +journalctl _SYSTEMD_INVOCATION_ID="$(systemctl show --value --property=InvocationID netdata)" --namespace=netdata --grep prometheus +``` + +#### System without systemd + +Locate the collector log file, typically at `/var/log/netdata/collector.log`, and use `grep` to filter for collector's name: + +```bash +grep prometheus /var/log/netdata/collector.log +``` + +**Note**: This method shows logs from all restarts. Focus on the **latest entries** for troubleshooting current issues. + +#### Docker Container + +If your Netdata runs in a Docker container named "netdata" (replace if different), use this command: + +```bash +docker logs netdata 2>&1 | grep prometheus +``` + diff --git a/src/go/collectors/go.d.plugin/modules/prometheus/integrations/cvmfs_clients.md b/src/go/plugin/go.d/modules/prometheus/integrations/cvmfs_clients.md index 6015b27e0..b283f220c 100644 --- a/src/go/collectors/go.d.plugin/modules/prometheus/integrations/cvmfs_clients.md +++ b/src/go/plugin/go.d/modules/prometheus/integrations/cvmfs_clients.md @@ -1,6 +1,6 @@ <!--startmeta -custom_edit_url: "https://github.com/netdata/netdata/edit/master/src/go/collectors/go.d.plugin/modules/prometheus/integrations/cvmfs_clients.md" -meta_yaml: "https://github.com/netdata/netdata/edit/master/src/go/collectors/go.d.plugin/modules/prometheus/metadata.yaml" +custom_edit_url: "https://github.com/netdata/netdata/edit/master/src/go/plugin/go.d/modules/prometheus/integrations/cvmfs_clients.md" +meta_yaml: "https://github.com/netdata/netdata/edit/master/src/go/plugin/go.d/modules/prometheus/metadata.yaml" sidebar_label: "CVMFS clients" learn_status: "Published" learn_rel_path: "Collecting Metrics/Storage, Mount Points and Filesystems" @@ -37,7 +37,6 @@ This collector supports collecting metrics from multiple instances of this integ #### Auto-Detection By default, it detects instances running on the local host by trying to connect to known ports that are [allocated to exporters](https://github.com/prometheus/prometheus/wiki/Default-port-allocations). -The full list of endpoints is available in the collector's [configuration file](https://github.com/netdata/netdata/blob/master/src/go/collectors/go.d.plugin/config/go.d/prometheus.conf). #### Limits @@ -138,7 +137,7 @@ The following options can be defined globally: update_every, autodetection_retry This option allows you to filter out unwanted time series. Only metrics matching the selector will be collected. - Logic: (pattern1 OR pattern2) AND !(pattern3 or pattern4) -- Pattern syntax: [selector](/src/go/collectors/go.d.plugin/pkg/prometheus/selector/README.md). +- Pattern syntax: [selector](/src/go/plugin/go.d/pkg/prometheus/selector/README.md). - Option syntax: ```yaml @@ -266,6 +265,8 @@ jobs: ### Debug Mode +**Important**: Debug mode is not supported for data collection jobs created via the UI using the Dyncfg feature. + To troubleshoot issues with the `prometheus` collector, run the `go.d.plugin` with the debug option enabled. The output should give you clues as to why the collector isn't working. @@ -288,4 +289,37 @@ should give you clues as to why the collector isn't working. ./go.d.plugin -d -m prometheus ``` +### Getting Logs + +If you're encountering problems with the `prometheus` collector, follow these steps to retrieve logs and identify potential issues: + +- **Run the command** specific to your system (systemd, non-systemd, or Docker container). +- **Examine the output** for any warnings or error messages that might indicate issues. These messages should provide clues about the root cause of the problem. + +#### System with systemd + +Use the following command to view logs generated since the last Netdata service restart: + +```bash +journalctl _SYSTEMD_INVOCATION_ID="$(systemctl show --value --property=InvocationID netdata)" --namespace=netdata --grep prometheus +``` + +#### System without systemd + +Locate the collector log file, typically at `/var/log/netdata/collector.log`, and use `grep` to filter for collector's name: + +```bash +grep prometheus /var/log/netdata/collector.log +``` + +**Note**: This method shows logs from all restarts. Focus on the **latest entries** for troubleshooting current issues. + +#### Docker Container + +If your Netdata runs in a Docker container named "netdata" (replace if different), use this command: + +```bash +docker logs netdata 2>&1 | grep prometheus +``` + diff --git a/src/go/collectors/go.d.plugin/modules/prometheus/integrations/ddwrt_routers.md b/src/go/plugin/go.d/modules/prometheus/integrations/ddwrt_routers.md index efff8ee21..e0b898fbf 100644 --- a/src/go/collectors/go.d.plugin/modules/prometheus/integrations/ddwrt_routers.md +++ b/src/go/plugin/go.d/modules/prometheus/integrations/ddwrt_routers.md @@ -1,6 +1,6 @@ <!--startmeta -custom_edit_url: "https://github.com/netdata/netdata/edit/master/src/go/collectors/go.d.plugin/modules/prometheus/integrations/ddwrt_routers.md" -meta_yaml: "https://github.com/netdata/netdata/edit/master/src/go/collectors/go.d.plugin/modules/prometheus/metadata.yaml" +custom_edit_url: "https://github.com/netdata/netdata/edit/master/src/go/plugin/go.d/modules/prometheus/integrations/ddwrt_routers.md" +meta_yaml: "https://github.com/netdata/netdata/edit/master/src/go/plugin/go.d/modules/prometheus/metadata.yaml" sidebar_label: "DDWRT Routers" learn_status: "Published" learn_rel_path: "Collecting Metrics/Networking Stack and Network Interfaces" @@ -37,7 +37,6 @@ This collector supports collecting metrics from multiple instances of this integ #### Auto-Detection By default, it detects instances running on the local host by trying to connect to known ports that are [allocated to exporters](https://github.com/prometheus/prometheus/wiki/Default-port-allocations). -The full list of endpoints is available in the collector's [configuration file](https://github.com/netdata/netdata/blob/master/src/go/collectors/go.d.plugin/config/go.d/prometheus.conf). #### Limits @@ -138,7 +137,7 @@ The following options can be defined globally: update_every, autodetection_retry This option allows you to filter out unwanted time series. Only metrics matching the selector will be collected. - Logic: (pattern1 OR pattern2) AND !(pattern3 or pattern4) -- Pattern syntax: [selector](/src/go/collectors/go.d.plugin/pkg/prometheus/selector/README.md). +- Pattern syntax: [selector](/src/go/plugin/go.d/pkg/prometheus/selector/README.md). - Option syntax: ```yaml @@ -266,6 +265,8 @@ jobs: ### Debug Mode +**Important**: Debug mode is not supported for data collection jobs created via the UI using the Dyncfg feature. + To troubleshoot issues with the `prometheus` collector, run the `go.d.plugin` with the debug option enabled. The output should give you clues as to why the collector isn't working. @@ -288,4 +289,37 @@ should give you clues as to why the collector isn't working. ./go.d.plugin -d -m prometheus ``` +### Getting Logs + +If you're encountering problems with the `prometheus` collector, follow these steps to retrieve logs and identify potential issues: + +- **Run the command** specific to your system (systemd, non-systemd, or Docker container). +- **Examine the output** for any warnings or error messages that might indicate issues. These messages should provide clues about the root cause of the problem. + +#### System with systemd + +Use the following command to view logs generated since the last Netdata service restart: + +```bash +journalctl _SYSTEMD_INVOCATION_ID="$(systemctl show --value --property=InvocationID netdata)" --namespace=netdata --grep prometheus +``` + +#### System without systemd + +Locate the collector log file, typically at `/var/log/netdata/collector.log`, and use `grep` to filter for collector's name: + +```bash +grep prometheus /var/log/netdata/collector.log +``` + +**Note**: This method shows logs from all restarts. Focus on the **latest entries** for troubleshooting current issues. + +#### Docker Container + +If your Netdata runs in a Docker container named "netdata" (replace if different), use this command: + +```bash +docker logs netdata 2>&1 | grep prometheus +``` + diff --git a/src/go/collectors/go.d.plugin/modules/prometheus/integrations/dell_emc_ecs_cluster.md b/src/go/plugin/go.d/modules/prometheus/integrations/dell_emc_ecs_cluster.md index ea1954dff..6d268ca64 100644 --- a/src/go/collectors/go.d.plugin/modules/prometheus/integrations/dell_emc_ecs_cluster.md +++ b/src/go/plugin/go.d/modules/prometheus/integrations/dell_emc_ecs_cluster.md @@ -1,6 +1,6 @@ <!--startmeta -custom_edit_url: "https://github.com/netdata/netdata/edit/master/src/go/collectors/go.d.plugin/modules/prometheus/integrations/dell_emc_ecs_cluster.md" -meta_yaml: "https://github.com/netdata/netdata/edit/master/src/go/collectors/go.d.plugin/modules/prometheus/metadata.yaml" +custom_edit_url: "https://github.com/netdata/netdata/edit/master/src/go/plugin/go.d/modules/prometheus/integrations/dell_emc_ecs_cluster.md" +meta_yaml: "https://github.com/netdata/netdata/edit/master/src/go/plugin/go.d/modules/prometheus/metadata.yaml" sidebar_label: "Dell EMC ECS cluster" learn_status: "Published" learn_rel_path: "Collecting Metrics/Cloud Provider Managed" @@ -37,7 +37,6 @@ This collector supports collecting metrics from multiple instances of this integ #### Auto-Detection By default, it detects instances running on the local host by trying to connect to known ports that are [allocated to exporters](https://github.com/prometheus/prometheus/wiki/Default-port-allocations). -The full list of endpoints is available in the collector's [configuration file](https://github.com/netdata/netdata/blob/master/src/go/collectors/go.d.plugin/config/go.d/prometheus.conf). #### Limits @@ -138,7 +137,7 @@ The following options can be defined globally: update_every, autodetection_retry This option allows you to filter out unwanted time series. Only metrics matching the selector will be collected. - Logic: (pattern1 OR pattern2) AND !(pattern3 or pattern4) -- Pattern syntax: [selector](/src/go/collectors/go.d.plugin/pkg/prometheus/selector/README.md). +- Pattern syntax: [selector](/src/go/plugin/go.d/pkg/prometheus/selector/README.md). - Option syntax: ```yaml @@ -266,6 +265,8 @@ jobs: ### Debug Mode +**Important**: Debug mode is not supported for data collection jobs created via the UI using the Dyncfg feature. + To troubleshoot issues with the `prometheus` collector, run the `go.d.plugin` with the debug option enabled. The output should give you clues as to why the collector isn't working. @@ -288,4 +289,37 @@ should give you clues as to why the collector isn't working. ./go.d.plugin -d -m prometheus ``` +### Getting Logs + +If you're encountering problems with the `prometheus` collector, follow these steps to retrieve logs and identify potential issues: + +- **Run the command** specific to your system (systemd, non-systemd, or Docker container). +- **Examine the output** for any warnings or error messages that might indicate issues. These messages should provide clues about the root cause of the problem. + +#### System with systemd + +Use the following command to view logs generated since the last Netdata service restart: + +```bash +journalctl _SYSTEMD_INVOCATION_ID="$(systemctl show --value --property=InvocationID netdata)" --namespace=netdata --grep prometheus +``` + +#### System without systemd + +Locate the collector log file, typically at `/var/log/netdata/collector.log`, and use `grep` to filter for collector's name: + +```bash +grep prometheus /var/log/netdata/collector.log +``` + +**Note**: This method shows logs from all restarts. Focus on the **latest entries** for troubleshooting current issues. + +#### Docker Container + +If your Netdata runs in a Docker container named "netdata" (replace if different), use this command: + +```bash +docker logs netdata 2>&1 | grep prometheus +``` + diff --git a/src/go/collectors/go.d.plugin/modules/prometheus/integrations/dell_emc_isilon_cluster.md b/src/go/plugin/go.d/modules/prometheus/integrations/dell_emc_isilon_cluster.md index 96be281d6..5f29528ad 100644 --- a/src/go/collectors/go.d.plugin/modules/prometheus/integrations/dell_emc_isilon_cluster.md +++ b/src/go/plugin/go.d/modules/prometheus/integrations/dell_emc_isilon_cluster.md @@ -1,6 +1,6 @@ <!--startmeta -custom_edit_url: "https://github.com/netdata/netdata/edit/master/src/go/collectors/go.d.plugin/modules/prometheus/integrations/dell_emc_isilon_cluster.md" -meta_yaml: "https://github.com/netdata/netdata/edit/master/src/go/collectors/go.d.plugin/modules/prometheus/metadata.yaml" +custom_edit_url: "https://github.com/netdata/netdata/edit/master/src/go/plugin/go.d/modules/prometheus/integrations/dell_emc_isilon_cluster.md" +meta_yaml: "https://github.com/netdata/netdata/edit/master/src/go/plugin/go.d/modules/prometheus/metadata.yaml" sidebar_label: "Dell EMC Isilon cluster" learn_status: "Published" learn_rel_path: "Collecting Metrics/Storage, Mount Points and Filesystems" @@ -37,7 +37,6 @@ This collector supports collecting metrics from multiple instances of this integ #### Auto-Detection By default, it detects instances running on the local host by trying to connect to known ports that are [allocated to exporters](https://github.com/prometheus/prometheus/wiki/Default-port-allocations). -The full list of endpoints is available in the collector's [configuration file](https://github.com/netdata/netdata/blob/master/src/go/collectors/go.d.plugin/config/go.d/prometheus.conf). #### Limits @@ -138,7 +137,7 @@ The following options can be defined globally: update_every, autodetection_retry This option allows you to filter out unwanted time series. Only metrics matching the selector will be collected. - Logic: (pattern1 OR pattern2) AND !(pattern3 or pattern4) -- Pattern syntax: [selector](/src/go/collectors/go.d.plugin/pkg/prometheus/selector/README.md). +- Pattern syntax: [selector](/src/go/plugin/go.d/pkg/prometheus/selector/README.md). - Option syntax: ```yaml @@ -266,6 +265,8 @@ jobs: ### Debug Mode +**Important**: Debug mode is not supported for data collection jobs created via the UI using the Dyncfg feature. + To troubleshoot issues with the `prometheus` collector, run the `go.d.plugin` with the debug option enabled. The output should give you clues as to why the collector isn't working. @@ -288,4 +289,37 @@ should give you clues as to why the collector isn't working. ./go.d.plugin -d -m prometheus ``` +### Getting Logs + +If you're encountering problems with the `prometheus` collector, follow these steps to retrieve logs and identify potential issues: + +- **Run the command** specific to your system (systemd, non-systemd, or Docker container). +- **Examine the output** for any warnings or error messages that might indicate issues. These messages should provide clues about the root cause of the problem. + +#### System with systemd + +Use the following command to view logs generated since the last Netdata service restart: + +```bash +journalctl _SYSTEMD_INVOCATION_ID="$(systemctl show --value --property=InvocationID netdata)" --namespace=netdata --grep prometheus +``` + +#### System without systemd + +Locate the collector log file, typically at `/var/log/netdata/collector.log`, and use `grep` to filter for collector's name: + +```bash +grep prometheus /var/log/netdata/collector.log +``` + +**Note**: This method shows logs from all restarts. Focus on the **latest entries** for troubleshooting current issues. + +#### Docker Container + +If your Netdata runs in a Docker container named "netdata" (replace if different), use this command: + +```bash +docker logs netdata 2>&1 | grep prometheus +``` + diff --git a/src/go/collectors/go.d.plugin/modules/prometheus/integrations/dell_emc_xtremio_cluster.md b/src/go/plugin/go.d/modules/prometheus/integrations/dell_emc_xtremio_cluster.md index cc658d4a9..fe7285234 100644 --- a/src/go/collectors/go.d.plugin/modules/prometheus/integrations/dell_emc_xtremio_cluster.md +++ b/src/go/plugin/go.d/modules/prometheus/integrations/dell_emc_xtremio_cluster.md @@ -1,6 +1,6 @@ <!--startmeta -custom_edit_url: "https://github.com/netdata/netdata/edit/master/src/go/collectors/go.d.plugin/modules/prometheus/integrations/dell_emc_xtremio_cluster.md" -meta_yaml: "https://github.com/netdata/netdata/edit/master/src/go/collectors/go.d.plugin/modules/prometheus/metadata.yaml" +custom_edit_url: "https://github.com/netdata/netdata/edit/master/src/go/plugin/go.d/modules/prometheus/integrations/dell_emc_xtremio_cluster.md" +meta_yaml: "https://github.com/netdata/netdata/edit/master/src/go/plugin/go.d/modules/prometheus/metadata.yaml" sidebar_label: "Dell EMC XtremIO cluster" learn_status: "Published" learn_rel_path: "Collecting Metrics/Storage, Mount Points and Filesystems" @@ -37,7 +37,6 @@ This collector supports collecting metrics from multiple instances of this integ #### Auto-Detection By default, it detects instances running on the local host by trying to connect to known ports that are [allocated to exporters](https://github.com/prometheus/prometheus/wiki/Default-port-allocations). -The full list of endpoints is available in the collector's [configuration file](https://github.com/netdata/netdata/blob/master/src/go/collectors/go.d.plugin/config/go.d/prometheus.conf). #### Limits @@ -138,7 +137,7 @@ The following options can be defined globally: update_every, autodetection_retry This option allows you to filter out unwanted time series. Only metrics matching the selector will be collected. - Logic: (pattern1 OR pattern2) AND !(pattern3 or pattern4) -- Pattern syntax: [selector](/src/go/collectors/go.d.plugin/pkg/prometheus/selector/README.md). +- Pattern syntax: [selector](/src/go/plugin/go.d/pkg/prometheus/selector/README.md). - Option syntax: ```yaml @@ -266,6 +265,8 @@ jobs: ### Debug Mode +**Important**: Debug mode is not supported for data collection jobs created via the UI using the Dyncfg feature. + To troubleshoot issues with the `prometheus` collector, run the `go.d.plugin` with the debug option enabled. The output should give you clues as to why the collector isn't working. @@ -288,4 +289,37 @@ should give you clues as to why the collector isn't working. ./go.d.plugin -d -m prometheus ``` +### Getting Logs + +If you're encountering problems with the `prometheus` collector, follow these steps to retrieve logs and identify potential issues: + +- **Run the command** specific to your system (systemd, non-systemd, or Docker container). +- **Examine the output** for any warnings or error messages that might indicate issues. These messages should provide clues about the root cause of the problem. + +#### System with systemd + +Use the following command to view logs generated since the last Netdata service restart: + +```bash +journalctl _SYSTEMD_INVOCATION_ID="$(systemctl show --value --property=InvocationID netdata)" --namespace=netdata --grep prometheus +``` + +#### System without systemd + +Locate the collector log file, typically at `/var/log/netdata/collector.log`, and use `grep` to filter for collector's name: + +```bash +grep prometheus /var/log/netdata/collector.log +``` + +**Note**: This method shows logs from all restarts. Focus on the **latest entries** for troubleshooting current issues. + +#### Docker Container + +If your Netdata runs in a Docker container named "netdata" (replace if different), use this command: + +```bash +docker logs netdata 2>&1 | grep prometheus +``` + diff --git a/src/go/collectors/go.d.plugin/modules/prometheus/integrations/dell_powermax.md b/src/go/plugin/go.d/modules/prometheus/integrations/dell_powermax.md index 87657569e..200e2f049 100644 --- a/src/go/collectors/go.d.plugin/modules/prometheus/integrations/dell_powermax.md +++ b/src/go/plugin/go.d/modules/prometheus/integrations/dell_powermax.md @@ -1,6 +1,6 @@ <!--startmeta -custom_edit_url: "https://github.com/netdata/netdata/edit/master/src/go/collectors/go.d.plugin/modules/prometheus/integrations/dell_powermax.md" -meta_yaml: "https://github.com/netdata/netdata/edit/master/src/go/collectors/go.d.plugin/modules/prometheus/metadata.yaml" +custom_edit_url: "https://github.com/netdata/netdata/edit/master/src/go/plugin/go.d/modules/prometheus/integrations/dell_powermax.md" +meta_yaml: "https://github.com/netdata/netdata/edit/master/src/go/plugin/go.d/modules/prometheus/metadata.yaml" sidebar_label: "Dell PowerMax" learn_status: "Published" learn_rel_path: "Collecting Metrics/Storage, Mount Points and Filesystems" @@ -37,7 +37,6 @@ This collector supports collecting metrics from multiple instances of this integ #### Auto-Detection By default, it detects instances running on the local host by trying to connect to known ports that are [allocated to exporters](https://github.com/prometheus/prometheus/wiki/Default-port-allocations). -The full list of endpoints is available in the collector's [configuration file](https://github.com/netdata/netdata/blob/master/src/go/collectors/go.d.plugin/config/go.d/prometheus.conf). #### Limits @@ -138,7 +137,7 @@ The following options can be defined globally: update_every, autodetection_retry This option allows you to filter out unwanted time series. Only metrics matching the selector will be collected. - Logic: (pattern1 OR pattern2) AND !(pattern3 or pattern4) -- Pattern syntax: [selector](/src/go/collectors/go.d.plugin/pkg/prometheus/selector/README.md). +- Pattern syntax: [selector](/src/go/plugin/go.d/pkg/prometheus/selector/README.md). - Option syntax: ```yaml @@ -266,6 +265,8 @@ jobs: ### Debug Mode +**Important**: Debug mode is not supported for data collection jobs created via the UI using the Dyncfg feature. + To troubleshoot issues with the `prometheus` collector, run the `go.d.plugin` with the debug option enabled. The output should give you clues as to why the collector isn't working. @@ -288,4 +289,37 @@ should give you clues as to why the collector isn't working. ./go.d.plugin -d -m prometheus ``` +### Getting Logs + +If you're encountering problems with the `prometheus` collector, follow these steps to retrieve logs and identify potential issues: + +- **Run the command** specific to your system (systemd, non-systemd, or Docker container). +- **Examine the output** for any warnings or error messages that might indicate issues. These messages should provide clues about the root cause of the problem. + +#### System with systemd + +Use the following command to view logs generated since the last Netdata service restart: + +```bash +journalctl _SYSTEMD_INVOCATION_ID="$(systemctl show --value --property=InvocationID netdata)" --namespace=netdata --grep prometheus +``` + +#### System without systemd + +Locate the collector log file, typically at `/var/log/netdata/collector.log`, and use `grep` to filter for collector's name: + +```bash +grep prometheus /var/log/netdata/collector.log +``` + +**Note**: This method shows logs from all restarts. Focus on the **latest entries** for troubleshooting current issues. + +#### Docker Container + +If your Netdata runs in a Docker container named "netdata" (replace if different), use this command: + +```bash +docker logs netdata 2>&1 | grep prometheus +``` + diff --git a/src/go/collectors/go.d.plugin/modules/prometheus/integrations/dependency-track.md b/src/go/plugin/go.d/modules/prometheus/integrations/dependency-track.md index 854d67a81..22d41e643 100644 --- a/src/go/collectors/go.d.plugin/modules/prometheus/integrations/dependency-track.md +++ b/src/go/plugin/go.d/modules/prometheus/integrations/dependency-track.md @@ -1,6 +1,6 @@ <!--startmeta -custom_edit_url: "https://github.com/netdata/netdata/edit/master/src/go/collectors/go.d.plugin/modules/prometheus/integrations/dependency-track.md" -meta_yaml: "https://github.com/netdata/netdata/edit/master/src/go/collectors/go.d.plugin/modules/prometheus/metadata.yaml" +custom_edit_url: "https://github.com/netdata/netdata/edit/master/src/go/plugin/go.d/modules/prometheus/integrations/dependency-track.md" +meta_yaml: "https://github.com/netdata/netdata/edit/master/src/go/plugin/go.d/modules/prometheus/metadata.yaml" sidebar_label: "Dependency-Track" learn_status: "Published" learn_rel_path: "Collecting Metrics/APM" @@ -37,7 +37,6 @@ This collector supports collecting metrics from multiple instances of this integ #### Auto-Detection By default, it detects instances running on the local host by trying to connect to known ports that are [allocated to exporters](https://github.com/prometheus/prometheus/wiki/Default-port-allocations). -The full list of endpoints is available in the collector's [configuration file](https://github.com/netdata/netdata/blob/master/src/go/collectors/go.d.plugin/config/go.d/prometheus.conf). #### Limits @@ -138,7 +137,7 @@ The following options can be defined globally: update_every, autodetection_retry This option allows you to filter out unwanted time series. Only metrics matching the selector will be collected. - Logic: (pattern1 OR pattern2) AND !(pattern3 or pattern4) -- Pattern syntax: [selector](/src/go/collectors/go.d.plugin/pkg/prometheus/selector/README.md). +- Pattern syntax: [selector](/src/go/plugin/go.d/pkg/prometheus/selector/README.md). - Option syntax: ```yaml @@ -266,6 +265,8 @@ jobs: ### Debug Mode +**Important**: Debug mode is not supported for data collection jobs created via the UI using the Dyncfg feature. + To troubleshoot issues with the `prometheus` collector, run the `go.d.plugin` with the debug option enabled. The output should give you clues as to why the collector isn't working. @@ -288,4 +289,37 @@ should give you clues as to why the collector isn't working. ./go.d.plugin -d -m prometheus ``` +### Getting Logs + +If you're encountering problems with the `prometheus` collector, follow these steps to retrieve logs and identify potential issues: + +- **Run the command** specific to your system (systemd, non-systemd, or Docker container). +- **Examine the output** for any warnings or error messages that might indicate issues. These messages should provide clues about the root cause of the problem. + +#### System with systemd + +Use the following command to view logs generated since the last Netdata service restart: + +```bash +journalctl _SYSTEMD_INVOCATION_ID="$(systemctl show --value --property=InvocationID netdata)" --namespace=netdata --grep prometheus +``` + +#### System without systemd + +Locate the collector log file, typically at `/var/log/netdata/collector.log`, and use `grep` to filter for collector's name: + +```bash +grep prometheus /var/log/netdata/collector.log +``` + +**Note**: This method shows logs from all restarts. Focus on the **latest entries** for troubleshooting current issues. + +#### Docker Container + +If your Netdata runs in a Docker container named "netdata" (replace if different), use this command: + +```bash +docker logs netdata 2>&1 | grep prometheus +``` + diff --git a/src/go/collectors/go.d.plugin/modules/prometheus/integrations/digitalocean.md b/src/go/plugin/go.d/modules/prometheus/integrations/digitalocean.md index 04ab3e766..8978434c2 100644 --- a/src/go/collectors/go.d.plugin/modules/prometheus/integrations/digitalocean.md +++ b/src/go/plugin/go.d/modules/prometheus/integrations/digitalocean.md @@ -1,6 +1,6 @@ <!--startmeta -custom_edit_url: "https://github.com/netdata/netdata/edit/master/src/go/collectors/go.d.plugin/modules/prometheus/integrations/digitalocean.md" -meta_yaml: "https://github.com/netdata/netdata/edit/master/src/go/collectors/go.d.plugin/modules/prometheus/metadata.yaml" +custom_edit_url: "https://github.com/netdata/netdata/edit/master/src/go/plugin/go.d/modules/prometheus/integrations/digitalocean.md" +meta_yaml: "https://github.com/netdata/netdata/edit/master/src/go/plugin/go.d/modules/prometheus/metadata.yaml" sidebar_label: "DigitalOcean" learn_status: "Published" learn_rel_path: "Collecting Metrics/Cloud Provider Managed" @@ -37,7 +37,6 @@ This collector supports collecting metrics from multiple instances of this integ #### Auto-Detection By default, it detects instances running on the local host by trying to connect to known ports that are [allocated to exporters](https://github.com/prometheus/prometheus/wiki/Default-port-allocations). -The full list of endpoints is available in the collector's [configuration file](https://github.com/netdata/netdata/blob/master/src/go/collectors/go.d.plugin/config/go.d/prometheus.conf). #### Limits @@ -138,7 +137,7 @@ The following options can be defined globally: update_every, autodetection_retry This option allows you to filter out unwanted time series. Only metrics matching the selector will be collected. - Logic: (pattern1 OR pattern2) AND !(pattern3 or pattern4) -- Pattern syntax: [selector](/src/go/collectors/go.d.plugin/pkg/prometheus/selector/README.md). +- Pattern syntax: [selector](/src/go/plugin/go.d/pkg/prometheus/selector/README.md). - Option syntax: ```yaml @@ -266,6 +265,8 @@ jobs: ### Debug Mode +**Important**: Debug mode is not supported for data collection jobs created via the UI using the Dyncfg feature. + To troubleshoot issues with the `prometheus` collector, run the `go.d.plugin` with the debug option enabled. The output should give you clues as to why the collector isn't working. @@ -288,4 +289,37 @@ should give you clues as to why the collector isn't working. ./go.d.plugin -d -m prometheus ``` +### Getting Logs + +If you're encountering problems with the `prometheus` collector, follow these steps to retrieve logs and identify potential issues: + +- **Run the command** specific to your system (systemd, non-systemd, or Docker container). +- **Examine the output** for any warnings or error messages that might indicate issues. These messages should provide clues about the root cause of the problem. + +#### System with systemd + +Use the following command to view logs generated since the last Netdata service restart: + +```bash +journalctl _SYSTEMD_INVOCATION_ID="$(systemctl show --value --property=InvocationID netdata)" --namespace=netdata --grep prometheus +``` + +#### System without systemd + +Locate the collector log file, typically at `/var/log/netdata/collector.log`, and use `grep` to filter for collector's name: + +```bash +grep prometheus /var/log/netdata/collector.log +``` + +**Note**: This method shows logs from all restarts. Focus on the **latest entries** for troubleshooting current issues. + +#### Docker Container + +If your Netdata runs in a Docker container named "netdata" (replace if different), use this command: + +```bash +docker logs netdata 2>&1 | grep prometheus +``` + diff --git a/src/go/collectors/go.d.plugin/modules/prometheus/integrations/discourse.md b/src/go/plugin/go.d/modules/prometheus/integrations/discourse.md index 68db69083..adffe3fc3 100644 --- a/src/go/collectors/go.d.plugin/modules/prometheus/integrations/discourse.md +++ b/src/go/plugin/go.d/modules/prometheus/integrations/discourse.md @@ -1,6 +1,6 @@ <!--startmeta -custom_edit_url: "https://github.com/netdata/netdata/edit/master/src/go/collectors/go.d.plugin/modules/prometheus/integrations/discourse.md" -meta_yaml: "https://github.com/netdata/netdata/edit/master/src/go/collectors/go.d.plugin/modules/prometheus/metadata.yaml" +custom_edit_url: "https://github.com/netdata/netdata/edit/master/src/go/plugin/go.d/modules/prometheus/integrations/discourse.md" +meta_yaml: "https://github.com/netdata/netdata/edit/master/src/go/plugin/go.d/modules/prometheus/metadata.yaml" sidebar_label: "Discourse" learn_status: "Published" learn_rel_path: "Collecting Metrics/Media Services" @@ -37,7 +37,6 @@ This collector supports collecting metrics from multiple instances of this integ #### Auto-Detection By default, it detects instances running on the local host by trying to connect to known ports that are [allocated to exporters](https://github.com/prometheus/prometheus/wiki/Default-port-allocations). -The full list of endpoints is available in the collector's [configuration file](https://github.com/netdata/netdata/blob/master/src/go/collectors/go.d.plugin/config/go.d/prometheus.conf). #### Limits @@ -138,7 +137,7 @@ The following options can be defined globally: update_every, autodetection_retry This option allows you to filter out unwanted time series. Only metrics matching the selector will be collected. - Logic: (pattern1 OR pattern2) AND !(pattern3 or pattern4) -- Pattern syntax: [selector](/src/go/collectors/go.d.plugin/pkg/prometheus/selector/README.md). +- Pattern syntax: [selector](/src/go/plugin/go.d/pkg/prometheus/selector/README.md). - Option syntax: ```yaml @@ -266,6 +265,8 @@ jobs: ### Debug Mode +**Important**: Debug mode is not supported for data collection jobs created via the UI using the Dyncfg feature. + To troubleshoot issues with the `prometheus` collector, run the `go.d.plugin` with the debug option enabled. The output should give you clues as to why the collector isn't working. @@ -288,4 +289,37 @@ should give you clues as to why the collector isn't working. ./go.d.plugin -d -m prometheus ``` +### Getting Logs + +If you're encountering problems with the `prometheus` collector, follow these steps to retrieve logs and identify potential issues: + +- **Run the command** specific to your system (systemd, non-systemd, or Docker container). +- **Examine the output** for any warnings or error messages that might indicate issues. These messages should provide clues about the root cause of the problem. + +#### System with systemd + +Use the following command to view logs generated since the last Netdata service restart: + +```bash +journalctl _SYSTEMD_INVOCATION_ID="$(systemctl show --value --property=InvocationID netdata)" --namespace=netdata --grep prometheus +``` + +#### System without systemd + +Locate the collector log file, typically at `/var/log/netdata/collector.log`, and use `grep` to filter for collector's name: + +```bash +grep prometheus /var/log/netdata/collector.log +``` + +**Note**: This method shows logs from all restarts. Focus on the **latest entries** for troubleshooting current issues. + +#### Docker Container + +If your Netdata runs in a Docker container named "netdata" (replace if different), use this command: + +```bash +docker logs netdata 2>&1 | grep prometheus +``` + diff --git a/src/go/collectors/go.d.plugin/modules/prometheus/integrations/dmarc.md b/src/go/plugin/go.d/modules/prometheus/integrations/dmarc.md index 6dc0bbedf..2d02e75a9 100644 --- a/src/go/collectors/go.d.plugin/modules/prometheus/integrations/dmarc.md +++ b/src/go/plugin/go.d/modules/prometheus/integrations/dmarc.md @@ -1,6 +1,6 @@ <!--startmeta -custom_edit_url: "https://github.com/netdata/netdata/edit/master/src/go/collectors/go.d.plugin/modules/prometheus/integrations/dmarc.md" -meta_yaml: "https://github.com/netdata/netdata/edit/master/src/go/collectors/go.d.plugin/modules/prometheus/metadata.yaml" +custom_edit_url: "https://github.com/netdata/netdata/edit/master/src/go/plugin/go.d/modules/prometheus/integrations/dmarc.md" +meta_yaml: "https://github.com/netdata/netdata/edit/master/src/go/plugin/go.d/modules/prometheus/metadata.yaml" sidebar_label: "DMARC" learn_status: "Published" learn_rel_path: "Collecting Metrics/Mail Servers" @@ -37,7 +37,6 @@ This collector supports collecting metrics from multiple instances of this integ #### Auto-Detection By default, it detects instances running on the local host by trying to connect to known ports that are [allocated to exporters](https://github.com/prometheus/prometheus/wiki/Default-port-allocations). -The full list of endpoints is available in the collector's [configuration file](https://github.com/netdata/netdata/blob/master/src/go/collectors/go.d.plugin/config/go.d/prometheus.conf). #### Limits @@ -138,7 +137,7 @@ The following options can be defined globally: update_every, autodetection_retry This option allows you to filter out unwanted time series. Only metrics matching the selector will be collected. - Logic: (pattern1 OR pattern2) AND !(pattern3 or pattern4) -- Pattern syntax: [selector](/src/go/collectors/go.d.plugin/pkg/prometheus/selector/README.md). +- Pattern syntax: [selector](/src/go/plugin/go.d/pkg/prometheus/selector/README.md). - Option syntax: ```yaml @@ -266,6 +265,8 @@ jobs: ### Debug Mode +**Important**: Debug mode is not supported for data collection jobs created via the UI using the Dyncfg feature. + To troubleshoot issues with the `prometheus` collector, run the `go.d.plugin` with the debug option enabled. The output should give you clues as to why the collector isn't working. @@ -288,4 +289,37 @@ should give you clues as to why the collector isn't working. ./go.d.plugin -d -m prometheus ``` +### Getting Logs + +If you're encountering problems with the `prometheus` collector, follow these steps to retrieve logs and identify potential issues: + +- **Run the command** specific to your system (systemd, non-systemd, or Docker container). +- **Examine the output** for any warnings or error messages that might indicate issues. These messages should provide clues about the root cause of the problem. + +#### System with systemd + +Use the following command to view logs generated since the last Netdata service restart: + +```bash +journalctl _SYSTEMD_INVOCATION_ID="$(systemctl show --value --property=InvocationID netdata)" --namespace=netdata --grep prometheus +``` + +#### System without systemd + +Locate the collector log file, typically at `/var/log/netdata/collector.log`, and use `grep` to filter for collector's name: + +```bash +grep prometheus /var/log/netdata/collector.log +``` + +**Note**: This method shows logs from all restarts. Focus on the **latest entries** for troubleshooting current issues. + +#### Docker Container + +If your Netdata runs in a Docker container named "netdata" (replace if different), use this command: + +```bash +docker logs netdata 2>&1 | grep prometheus +``` + diff --git a/src/go/collectors/go.d.plugin/modules/prometheus/integrations/dnsbl.md b/src/go/plugin/go.d/modules/prometheus/integrations/dnsbl.md index 05cdb983c..e79517968 100644 --- a/src/go/collectors/go.d.plugin/modules/prometheus/integrations/dnsbl.md +++ b/src/go/plugin/go.d/modules/prometheus/integrations/dnsbl.md @@ -1,6 +1,6 @@ <!--startmeta -custom_edit_url: "https://github.com/netdata/netdata/edit/master/src/go/collectors/go.d.plugin/modules/prometheus/integrations/dnsbl.md" -meta_yaml: "https://github.com/netdata/netdata/edit/master/src/go/collectors/go.d.plugin/modules/prometheus/metadata.yaml" +custom_edit_url: "https://github.com/netdata/netdata/edit/master/src/go/plugin/go.d/modules/prometheus/integrations/dnsbl.md" +meta_yaml: "https://github.com/netdata/netdata/edit/master/src/go/plugin/go.d/modules/prometheus/metadata.yaml" sidebar_label: "DNSBL" learn_status: "Published" learn_rel_path: "Collecting Metrics/DNS and DHCP Servers" @@ -37,7 +37,6 @@ This collector supports collecting metrics from multiple instances of this integ #### Auto-Detection By default, it detects instances running on the local host by trying to connect to known ports that are [allocated to exporters](https://github.com/prometheus/prometheus/wiki/Default-port-allocations). -The full list of endpoints is available in the collector's [configuration file](https://github.com/netdata/netdata/blob/master/src/go/collectors/go.d.plugin/config/go.d/prometheus.conf). #### Limits @@ -138,7 +137,7 @@ The following options can be defined globally: update_every, autodetection_retry This option allows you to filter out unwanted time series. Only metrics matching the selector will be collected. - Logic: (pattern1 OR pattern2) AND !(pattern3 or pattern4) -- Pattern syntax: [selector](/src/go/collectors/go.d.plugin/pkg/prometheus/selector/README.md). +- Pattern syntax: [selector](/src/go/plugin/go.d/pkg/prometheus/selector/README.md). - Option syntax: ```yaml @@ -266,6 +265,8 @@ jobs: ### Debug Mode +**Important**: Debug mode is not supported for data collection jobs created via the UI using the Dyncfg feature. + To troubleshoot issues with the `prometheus` collector, run the `go.d.plugin` with the debug option enabled. The output should give you clues as to why the collector isn't working. @@ -288,4 +289,37 @@ should give you clues as to why the collector isn't working. ./go.d.plugin -d -m prometheus ``` +### Getting Logs + +If you're encountering problems with the `prometheus` collector, follow these steps to retrieve logs and identify potential issues: + +- **Run the command** specific to your system (systemd, non-systemd, or Docker container). +- **Examine the output** for any warnings or error messages that might indicate issues. These messages should provide clues about the root cause of the problem. + +#### System with systemd + +Use the following command to view logs generated since the last Netdata service restart: + +```bash +journalctl _SYSTEMD_INVOCATION_ID="$(systemctl show --value --property=InvocationID netdata)" --namespace=netdata --grep prometheus +``` + +#### System without systemd + +Locate the collector log file, typically at `/var/log/netdata/collector.log`, and use `grep` to filter for collector's name: + +```bash +grep prometheus /var/log/netdata/collector.log +``` + +**Note**: This method shows logs from all restarts. Focus on the **latest entries** for troubleshooting current issues. + +#### Docker Container + +If your Netdata runs in a Docker container named "netdata" (replace if different), use this command: + +```bash +docker logs netdata 2>&1 | grep prometheus +``` + diff --git a/src/go/collectors/go.d.plugin/modules/prometheus/integrations/dutch_electricity_smart_meter.md b/src/go/plugin/go.d/modules/prometheus/integrations/dutch_electricity_smart_meter.md index d169be7d2..cf2dabd7b 100644 --- a/src/go/collectors/go.d.plugin/modules/prometheus/integrations/dutch_electricity_smart_meter.md +++ b/src/go/plugin/go.d/modules/prometheus/integrations/dutch_electricity_smart_meter.md @@ -1,6 +1,6 @@ <!--startmeta -custom_edit_url: "https://github.com/netdata/netdata/edit/master/src/go/collectors/go.d.plugin/modules/prometheus/integrations/dutch_electricity_smart_meter.md" -meta_yaml: "https://github.com/netdata/netdata/edit/master/src/go/collectors/go.d.plugin/modules/prometheus/metadata.yaml" +custom_edit_url: "https://github.com/netdata/netdata/edit/master/src/go/plugin/go.d/modules/prometheus/integrations/dutch_electricity_smart_meter.md" +meta_yaml: "https://github.com/netdata/netdata/edit/master/src/go/plugin/go.d/modules/prometheus/metadata.yaml" sidebar_label: "Dutch Electricity Smart Meter" learn_status: "Published" learn_rel_path: "Collecting Metrics/IoT Devices" @@ -37,7 +37,6 @@ This collector supports collecting metrics from multiple instances of this integ #### Auto-Detection By default, it detects instances running on the local host by trying to connect to known ports that are [allocated to exporters](https://github.com/prometheus/prometheus/wiki/Default-port-allocations). -The full list of endpoints is available in the collector's [configuration file](https://github.com/netdata/netdata/blob/master/src/go/collectors/go.d.plugin/config/go.d/prometheus.conf). #### Limits @@ -138,7 +137,7 @@ The following options can be defined globally: update_every, autodetection_retry This option allows you to filter out unwanted time series. Only metrics matching the selector will be collected. - Logic: (pattern1 OR pattern2) AND !(pattern3 or pattern4) -- Pattern syntax: [selector](/src/go/collectors/go.d.plugin/pkg/prometheus/selector/README.md). +- Pattern syntax: [selector](/src/go/plugin/go.d/pkg/prometheus/selector/README.md). - Option syntax: ```yaml @@ -266,6 +265,8 @@ jobs: ### Debug Mode +**Important**: Debug mode is not supported for data collection jobs created via the UI using the Dyncfg feature. + To troubleshoot issues with the `prometheus` collector, run the `go.d.plugin` with the debug option enabled. The output should give you clues as to why the collector isn't working. @@ -288,4 +289,37 @@ should give you clues as to why the collector isn't working. ./go.d.plugin -d -m prometheus ``` +### Getting Logs + +If you're encountering problems with the `prometheus` collector, follow these steps to retrieve logs and identify potential issues: + +- **Run the command** specific to your system (systemd, non-systemd, or Docker container). +- **Examine the output** for any warnings or error messages that might indicate issues. These messages should provide clues about the root cause of the problem. + +#### System with systemd + +Use the following command to view logs generated since the last Netdata service restart: + +```bash +journalctl _SYSTEMD_INVOCATION_ID="$(systemctl show --value --property=InvocationID netdata)" --namespace=netdata --grep prometheus +``` + +#### System without systemd + +Locate the collector log file, typically at `/var/log/netdata/collector.log`, and use `grep` to filter for collector's name: + +```bash +grep prometheus /var/log/netdata/collector.log +``` + +**Note**: This method shows logs from all restarts. Focus on the **latest entries** for troubleshooting current issues. + +#### Docker Container + +If your Netdata runs in a Docker container named "netdata" (replace if different), use this command: + +```bash +docker logs netdata 2>&1 | grep prometheus +``` + diff --git a/src/go/collectors/go.d.plugin/modules/prometheus/integrations/dynatrace.md b/src/go/plugin/go.d/modules/prometheus/integrations/dynatrace.md index ad8b25ad9..96e3969d6 100644 --- a/src/go/collectors/go.d.plugin/modules/prometheus/integrations/dynatrace.md +++ b/src/go/plugin/go.d/modules/prometheus/integrations/dynatrace.md @@ -1,6 +1,6 @@ <!--startmeta -custom_edit_url: "https://github.com/netdata/netdata/edit/master/src/go/collectors/go.d.plugin/modules/prometheus/integrations/dynatrace.md" -meta_yaml: "https://github.com/netdata/netdata/edit/master/src/go/collectors/go.d.plugin/modules/prometheus/metadata.yaml" +custom_edit_url: "https://github.com/netdata/netdata/edit/master/src/go/plugin/go.d/modules/prometheus/integrations/dynatrace.md" +meta_yaml: "https://github.com/netdata/netdata/edit/master/src/go/plugin/go.d/modules/prometheus/metadata.yaml" sidebar_label: "Dynatrace" learn_status: "Published" learn_rel_path: "Collecting Metrics/Observability" @@ -37,7 +37,6 @@ This collector supports collecting metrics from multiple instances of this integ #### Auto-Detection By default, it detects instances running on the local host by trying to connect to known ports that are [allocated to exporters](https://github.com/prometheus/prometheus/wiki/Default-port-allocations). -The full list of endpoints is available in the collector's [configuration file](https://github.com/netdata/netdata/blob/master/src/go/collectors/go.d.plugin/config/go.d/prometheus.conf). #### Limits @@ -138,7 +137,7 @@ The following options can be defined globally: update_every, autodetection_retry This option allows you to filter out unwanted time series. Only metrics matching the selector will be collected. - Logic: (pattern1 OR pattern2) AND !(pattern3 or pattern4) -- Pattern syntax: [selector](/src/go/collectors/go.d.plugin/pkg/prometheus/selector/README.md). +- Pattern syntax: [selector](/src/go/plugin/go.d/pkg/prometheus/selector/README.md). - Option syntax: ```yaml @@ -266,6 +265,8 @@ jobs: ### Debug Mode +**Important**: Debug mode is not supported for data collection jobs created via the UI using the Dyncfg feature. + To troubleshoot issues with the `prometheus` collector, run the `go.d.plugin` with the debug option enabled. The output should give you clues as to why the collector isn't working. @@ -288,4 +289,37 @@ should give you clues as to why the collector isn't working. ./go.d.plugin -d -m prometheus ``` +### Getting Logs + +If you're encountering problems with the `prometheus` collector, follow these steps to retrieve logs and identify potential issues: + +- **Run the command** specific to your system (systemd, non-systemd, or Docker container). +- **Examine the output** for any warnings or error messages that might indicate issues. These messages should provide clues about the root cause of the problem. + +#### System with systemd + +Use the following command to view logs generated since the last Netdata service restart: + +```bash +journalctl _SYSTEMD_INVOCATION_ID="$(systemctl show --value --property=InvocationID netdata)" --namespace=netdata --grep prometheus +``` + +#### System without systemd + +Locate the collector log file, typically at `/var/log/netdata/collector.log`, and use `grep` to filter for collector's name: + +```bash +grep prometheus /var/log/netdata/collector.log +``` + +**Note**: This method shows logs from all restarts. Focus on the **latest entries** for troubleshooting current issues. + +#### Docker Container + +If your Netdata runs in a Docker container named "netdata" (replace if different), use this command: + +```bash +docker logs netdata 2>&1 | grep prometheus +``` + diff --git a/src/go/collectors/go.d.plugin/modules/prometheus/integrations/eaton_ups.md b/src/go/plugin/go.d/modules/prometheus/integrations/eaton_ups.md index 0c161ec90..c6c1823c8 100644 --- a/src/go/collectors/go.d.plugin/modules/prometheus/integrations/eaton_ups.md +++ b/src/go/plugin/go.d/modules/prometheus/integrations/eaton_ups.md @@ -1,6 +1,6 @@ <!--startmeta -custom_edit_url: "https://github.com/netdata/netdata/edit/master/src/go/collectors/go.d.plugin/modules/prometheus/integrations/eaton_ups.md" -meta_yaml: "https://github.com/netdata/netdata/edit/master/src/go/collectors/go.d.plugin/modules/prometheus/metadata.yaml" +custom_edit_url: "https://github.com/netdata/netdata/edit/master/src/go/plugin/go.d/modules/prometheus/integrations/eaton_ups.md" +meta_yaml: "https://github.com/netdata/netdata/edit/master/src/go/plugin/go.d/modules/prometheus/metadata.yaml" sidebar_label: "Eaton UPS" learn_status: "Published" learn_rel_path: "Collecting Metrics/UPS" @@ -37,7 +37,6 @@ This collector supports collecting metrics from multiple instances of this integ #### Auto-Detection By default, it detects instances running on the local host by trying to connect to known ports that are [allocated to exporters](https://github.com/prometheus/prometheus/wiki/Default-port-allocations). -The full list of endpoints is available in the collector's [configuration file](https://github.com/netdata/netdata/blob/master/src/go/collectors/go.d.plugin/config/go.d/prometheus.conf). #### Limits @@ -138,7 +137,7 @@ The following options can be defined globally: update_every, autodetection_retry This option allows you to filter out unwanted time series. Only metrics matching the selector will be collected. - Logic: (pattern1 OR pattern2) AND !(pattern3 or pattern4) -- Pattern syntax: [selector](/src/go/collectors/go.d.plugin/pkg/prometheus/selector/README.md). +- Pattern syntax: [selector](/src/go/plugin/go.d/pkg/prometheus/selector/README.md). - Option syntax: ```yaml @@ -266,6 +265,8 @@ jobs: ### Debug Mode +**Important**: Debug mode is not supported for data collection jobs created via the UI using the Dyncfg feature. + To troubleshoot issues with the `prometheus` collector, run the `go.d.plugin` with the debug option enabled. The output should give you clues as to why the collector isn't working. @@ -288,4 +289,37 @@ should give you clues as to why the collector isn't working. ./go.d.plugin -d -m prometheus ``` +### Getting Logs + +If you're encountering problems with the `prometheus` collector, follow these steps to retrieve logs and identify potential issues: + +- **Run the command** specific to your system (systemd, non-systemd, or Docker container). +- **Examine the output** for any warnings or error messages that might indicate issues. These messages should provide clues about the root cause of the problem. + +#### System with systemd + +Use the following command to view logs generated since the last Netdata service restart: + +```bash +journalctl _SYSTEMD_INVOCATION_ID="$(systemctl show --value --property=InvocationID netdata)" --namespace=netdata --grep prometheus +``` + +#### System without systemd + +Locate the collector log file, typically at `/var/log/netdata/collector.log`, and use `grep` to filter for collector's name: + +```bash +grep prometheus /var/log/netdata/collector.log +``` + +**Note**: This method shows logs from all restarts. Focus on the **latest entries** for troubleshooting current issues. + +#### Docker Container + +If your Netdata runs in a Docker container named "netdata" (replace if different), use this command: + +```bash +docker logs netdata 2>&1 | grep prometheus +``` + diff --git a/src/go/collectors/go.d.plugin/modules/prometheus/integrations/elgato_key_light_devices..md b/src/go/plugin/go.d/modules/prometheus/integrations/elgato_key_light_devices..md index 1b374c1e7..b4bc8d5d6 100644 --- a/src/go/collectors/go.d.plugin/modules/prometheus/integrations/elgato_key_light_devices..md +++ b/src/go/plugin/go.d/modules/prometheus/integrations/elgato_key_light_devices..md @@ -1,6 +1,6 @@ <!--startmeta -custom_edit_url: "https://github.com/netdata/netdata/edit/master/src/go/collectors/go.d.plugin/modules/prometheus/integrations/elgato_key_light_devices..md" -meta_yaml: "https://github.com/netdata/netdata/edit/master/src/go/collectors/go.d.plugin/modules/prometheus/metadata.yaml" +custom_edit_url: "https://github.com/netdata/netdata/edit/master/src/go/plugin/go.d/modules/prometheus/integrations/elgato_key_light_devices..md" +meta_yaml: "https://github.com/netdata/netdata/edit/master/src/go/plugin/go.d/modules/prometheus/metadata.yaml" sidebar_label: "Elgato Key Light devices." learn_status: "Published" learn_rel_path: "Collecting Metrics/IoT Devices" @@ -37,7 +37,6 @@ This collector supports collecting metrics from multiple instances of this integ #### Auto-Detection By default, it detects instances running on the local host by trying to connect to known ports that are [allocated to exporters](https://github.com/prometheus/prometheus/wiki/Default-port-allocations). -The full list of endpoints is available in the collector's [configuration file](https://github.com/netdata/netdata/blob/master/src/go/collectors/go.d.plugin/config/go.d/prometheus.conf). #### Limits @@ -138,7 +137,7 @@ The following options can be defined globally: update_every, autodetection_retry This option allows you to filter out unwanted time series. Only metrics matching the selector will be collected. - Logic: (pattern1 OR pattern2) AND !(pattern3 or pattern4) -- Pattern syntax: [selector](/src/go/collectors/go.d.plugin/pkg/prometheus/selector/README.md). +- Pattern syntax: [selector](/src/go/plugin/go.d/pkg/prometheus/selector/README.md). - Option syntax: ```yaml @@ -266,6 +265,8 @@ jobs: ### Debug Mode +**Important**: Debug mode is not supported for data collection jobs created via the UI using the Dyncfg feature. + To troubleshoot issues with the `prometheus` collector, run the `go.d.plugin` with the debug option enabled. The output should give you clues as to why the collector isn't working. @@ -288,4 +289,37 @@ should give you clues as to why the collector isn't working. ./go.d.plugin -d -m prometheus ``` +### Getting Logs + +If you're encountering problems with the `prometheus` collector, follow these steps to retrieve logs and identify potential issues: + +- **Run the command** specific to your system (systemd, non-systemd, or Docker container). +- **Examine the output** for any warnings or error messages that might indicate issues. These messages should provide clues about the root cause of the problem. + +#### System with systemd + +Use the following command to view logs generated since the last Netdata service restart: + +```bash +journalctl _SYSTEMD_INVOCATION_ID="$(systemctl show --value --property=InvocationID netdata)" --namespace=netdata --grep prometheus +``` + +#### System without systemd + +Locate the collector log file, typically at `/var/log/netdata/collector.log`, and use `grep` to filter for collector's name: + +```bash +grep prometheus /var/log/netdata/collector.log +``` + +**Note**: This method shows logs from all restarts. Focus on the **latest entries** for troubleshooting current issues. + +#### Docker Container + +If your Netdata runs in a Docker container named "netdata" (replace if different), use this command: + +```bash +docker logs netdata 2>&1 | grep prometheus +``` + diff --git a/src/go/collectors/go.d.plugin/modules/prometheus/integrations/energomera_smart_power_meters.md b/src/go/plugin/go.d/modules/prometheus/integrations/energomera_smart_power_meters.md index 20d661765..74764ae52 100644 --- a/src/go/collectors/go.d.plugin/modules/prometheus/integrations/energomera_smart_power_meters.md +++ b/src/go/plugin/go.d/modules/prometheus/integrations/energomera_smart_power_meters.md @@ -1,6 +1,6 @@ <!--startmeta -custom_edit_url: "https://github.com/netdata/netdata/edit/master/src/go/collectors/go.d.plugin/modules/prometheus/integrations/energomera_smart_power_meters.md" -meta_yaml: "https://github.com/netdata/netdata/edit/master/src/go/collectors/go.d.plugin/modules/prometheus/metadata.yaml" +custom_edit_url: "https://github.com/netdata/netdata/edit/master/src/go/plugin/go.d/modules/prometheus/integrations/energomera_smart_power_meters.md" +meta_yaml: "https://github.com/netdata/netdata/edit/master/src/go/plugin/go.d/modules/prometheus/metadata.yaml" sidebar_label: "Energomera smart power meters" learn_status: "Published" learn_rel_path: "Collecting Metrics/IoT Devices" @@ -37,7 +37,6 @@ This collector supports collecting metrics from multiple instances of this integ #### Auto-Detection By default, it detects instances running on the local host by trying to connect to known ports that are [allocated to exporters](https://github.com/prometheus/prometheus/wiki/Default-port-allocations). -The full list of endpoints is available in the collector's [configuration file](https://github.com/netdata/netdata/blob/master/src/go/collectors/go.d.plugin/config/go.d/prometheus.conf). #### Limits @@ -138,7 +137,7 @@ The following options can be defined globally: update_every, autodetection_retry This option allows you to filter out unwanted time series. Only metrics matching the selector will be collected. - Logic: (pattern1 OR pattern2) AND !(pattern3 or pattern4) -- Pattern syntax: [selector](/src/go/collectors/go.d.plugin/pkg/prometheus/selector/README.md). +- Pattern syntax: [selector](/src/go/plugin/go.d/pkg/prometheus/selector/README.md). - Option syntax: ```yaml @@ -266,6 +265,8 @@ jobs: ### Debug Mode +**Important**: Debug mode is not supported for data collection jobs created via the UI using the Dyncfg feature. + To troubleshoot issues with the `prometheus` collector, run the `go.d.plugin` with the debug option enabled. The output should give you clues as to why the collector isn't working. @@ -288,4 +289,37 @@ should give you clues as to why the collector isn't working. ./go.d.plugin -d -m prometheus ``` +### Getting Logs + +If you're encountering problems with the `prometheus` collector, follow these steps to retrieve logs and identify potential issues: + +- **Run the command** specific to your system (systemd, non-systemd, or Docker container). +- **Examine the output** for any warnings or error messages that might indicate issues. These messages should provide clues about the root cause of the problem. + +#### System with systemd + +Use the following command to view logs generated since the last Netdata service restart: + +```bash +journalctl _SYSTEMD_INVOCATION_ID="$(systemctl show --value --property=InvocationID netdata)" --namespace=netdata --grep prometheus +``` + +#### System without systemd + +Locate the collector log file, typically at `/var/log/netdata/collector.log`, and use `grep` to filter for collector's name: + +```bash +grep prometheus /var/log/netdata/collector.log +``` + +**Note**: This method shows logs from all restarts. Focus on the **latest entries** for troubleshooting current issues. + +#### Docker Container + +If your Netdata runs in a Docker container named "netdata" (replace if different), use this command: + +```bash +docker logs netdata 2>&1 | grep prometheus +``` + diff --git a/src/go/collectors/go.d.plugin/modules/prometheus/integrations/eos.md b/src/go/plugin/go.d/modules/prometheus/integrations/eos.md index c60e269c9..b2e3d590a 100644 --- a/src/go/collectors/go.d.plugin/modules/prometheus/integrations/eos.md +++ b/src/go/plugin/go.d/modules/prometheus/integrations/eos.md @@ -1,6 +1,6 @@ <!--startmeta -custom_edit_url: "https://github.com/netdata/netdata/edit/master/src/go/collectors/go.d.plugin/modules/prometheus/integrations/eos.md" -meta_yaml: "https://github.com/netdata/netdata/edit/master/src/go/collectors/go.d.plugin/modules/prometheus/metadata.yaml" +custom_edit_url: "https://github.com/netdata/netdata/edit/master/src/go/plugin/go.d/modules/prometheus/integrations/eos.md" +meta_yaml: "https://github.com/netdata/netdata/edit/master/src/go/plugin/go.d/modules/prometheus/metadata.yaml" sidebar_label: "EOS" learn_status: "Published" learn_rel_path: "Collecting Metrics/Storage, Mount Points and Filesystems" @@ -37,7 +37,6 @@ This collector supports collecting metrics from multiple instances of this integ #### Auto-Detection By default, it detects instances running on the local host by trying to connect to known ports that are [allocated to exporters](https://github.com/prometheus/prometheus/wiki/Default-port-allocations). -The full list of endpoints is available in the collector's [configuration file](https://github.com/netdata/netdata/blob/master/src/go/collectors/go.d.plugin/config/go.d/prometheus.conf). #### Limits @@ -138,7 +137,7 @@ The following options can be defined globally: update_every, autodetection_retry This option allows you to filter out unwanted time series. Only metrics matching the selector will be collected. - Logic: (pattern1 OR pattern2) AND !(pattern3 or pattern4) -- Pattern syntax: [selector](/src/go/collectors/go.d.plugin/pkg/prometheus/selector/README.md). +- Pattern syntax: [selector](/src/go/plugin/go.d/pkg/prometheus/selector/README.md). - Option syntax: ```yaml @@ -266,6 +265,8 @@ jobs: ### Debug Mode +**Important**: Debug mode is not supported for data collection jobs created via the UI using the Dyncfg feature. + To troubleshoot issues with the `prometheus` collector, run the `go.d.plugin` with the debug option enabled. The output should give you clues as to why the collector isn't working. @@ -288,4 +289,37 @@ should give you clues as to why the collector isn't working. ./go.d.plugin -d -m prometheus ``` +### Getting Logs + +If you're encountering problems with the `prometheus` collector, follow these steps to retrieve logs and identify potential issues: + +- **Run the command** specific to your system (systemd, non-systemd, or Docker container). +- **Examine the output** for any warnings or error messages that might indicate issues. These messages should provide clues about the root cause of the problem. + +#### System with systemd + +Use the following command to view logs generated since the last Netdata service restart: + +```bash +journalctl _SYSTEMD_INVOCATION_ID="$(systemctl show --value --property=InvocationID netdata)" --namespace=netdata --grep prometheus +``` + +#### System without systemd + +Locate the collector log file, typically at `/var/log/netdata/collector.log`, and use `grep` to filter for collector's name: + +```bash +grep prometheus /var/log/netdata/collector.log +``` + +**Note**: This method shows logs from all restarts. Focus on the **latest entries** for troubleshooting current issues. + +#### Docker Container + +If your Netdata runs in a Docker container named "netdata" (replace if different), use this command: + +```bash +docker logs netdata 2>&1 | grep prometheus +``` + diff --git a/src/go/collectors/go.d.plugin/modules/prometheus/integrations/etcd.md b/src/go/plugin/go.d/modules/prometheus/integrations/etcd.md index acd763b37..b24d6b241 100644 --- a/src/go/collectors/go.d.plugin/modules/prometheus/integrations/etcd.md +++ b/src/go/plugin/go.d/modules/prometheus/integrations/etcd.md @@ -1,6 +1,6 @@ <!--startmeta -custom_edit_url: "https://github.com/netdata/netdata/edit/master/src/go/collectors/go.d.plugin/modules/prometheus/integrations/etcd.md" -meta_yaml: "https://github.com/netdata/netdata/edit/master/src/go/collectors/go.d.plugin/modules/prometheus/metadata.yaml" +custom_edit_url: "https://github.com/netdata/netdata/edit/master/src/go/plugin/go.d/modules/prometheus/integrations/etcd.md" +meta_yaml: "https://github.com/netdata/netdata/edit/master/src/go/plugin/go.d/modules/prometheus/metadata.yaml" sidebar_label: "etcd" learn_status: "Published" learn_rel_path: "Collecting Metrics/Service Discovery / Registry" @@ -37,7 +37,6 @@ This collector supports collecting metrics from multiple instances of this integ #### Auto-Detection By default, it detects instances running on the local host by trying to connect to known ports that are [allocated to exporters](https://github.com/prometheus/prometheus/wiki/Default-port-allocations). -The full list of endpoints is available in the collector's [configuration file](https://github.com/netdata/netdata/blob/master/src/go/collectors/go.d.plugin/config/go.d/prometheus.conf). #### Limits @@ -134,7 +133,7 @@ The following options can be defined globally: update_every, autodetection_retry This option allows you to filter out unwanted time series. Only metrics matching the selector will be collected. - Logic: (pattern1 OR pattern2) AND !(pattern3 or pattern4) -- Pattern syntax: [selector](/src/go/collectors/go.d.plugin/pkg/prometheus/selector/README.md). +- Pattern syntax: [selector](/src/go/plugin/go.d/pkg/prometheus/selector/README.md). - Option syntax: ```yaml @@ -262,6 +261,8 @@ jobs: ### Debug Mode +**Important**: Debug mode is not supported for data collection jobs created via the UI using the Dyncfg feature. + To troubleshoot issues with the `prometheus` collector, run the `go.d.plugin` with the debug option enabled. The output should give you clues as to why the collector isn't working. @@ -284,4 +285,37 @@ should give you clues as to why the collector isn't working. ./go.d.plugin -d -m prometheus ``` +### Getting Logs + +If you're encountering problems with the `prometheus` collector, follow these steps to retrieve logs and identify potential issues: + +- **Run the command** specific to your system (systemd, non-systemd, or Docker container). +- **Examine the output** for any warnings or error messages that might indicate issues. These messages should provide clues about the root cause of the problem. + +#### System with systemd + +Use the following command to view logs generated since the last Netdata service restart: + +```bash +journalctl _SYSTEMD_INVOCATION_ID="$(systemctl show --value --property=InvocationID netdata)" --namespace=netdata --grep prometheus +``` + +#### System without systemd + +Locate the collector log file, typically at `/var/log/netdata/collector.log`, and use `grep` to filter for collector's name: + +```bash +grep prometheus /var/log/netdata/collector.log +``` + +**Note**: This method shows logs from all restarts. Focus on the **latest entries** for troubleshooting current issues. + +#### Docker Container + +If your Netdata runs in a Docker container named "netdata" (replace if different), use this command: + +```bash +docker logs netdata 2>&1 | grep prometheus +``` + diff --git a/src/go/collectors/go.d.plugin/modules/prometheus/integrations/excel_spreadsheet.md b/src/go/plugin/go.d/modules/prometheus/integrations/excel_spreadsheet.md index 8e4c88dff..6039ee832 100644 --- a/src/go/collectors/go.d.plugin/modules/prometheus/integrations/excel_spreadsheet.md +++ b/src/go/plugin/go.d/modules/prometheus/integrations/excel_spreadsheet.md @@ -1,6 +1,6 @@ <!--startmeta -custom_edit_url: "https://github.com/netdata/netdata/edit/master/src/go/collectors/go.d.plugin/modules/prometheus/integrations/excel_spreadsheet.md" -meta_yaml: "https://github.com/netdata/netdata/edit/master/src/go/collectors/go.d.plugin/modules/prometheus/metadata.yaml" +custom_edit_url: "https://github.com/netdata/netdata/edit/master/src/go/plugin/go.d/modules/prometheus/integrations/excel_spreadsheet.md" +meta_yaml: "https://github.com/netdata/netdata/edit/master/src/go/plugin/go.d/modules/prometheus/metadata.yaml" sidebar_label: "Excel spreadsheet" learn_status: "Published" learn_rel_path: "Collecting Metrics/Generic Collecting Metrics" @@ -37,7 +37,6 @@ This collector supports collecting metrics from multiple instances of this integ #### Auto-Detection By default, it detects instances running on the local host by trying to connect to known ports that are [allocated to exporters](https://github.com/prometheus/prometheus/wiki/Default-port-allocations). -The full list of endpoints is available in the collector's [configuration file](https://github.com/netdata/netdata/blob/master/src/go/collectors/go.d.plugin/config/go.d/prometheus.conf). #### Limits @@ -138,7 +137,7 @@ The following options can be defined globally: update_every, autodetection_retry This option allows you to filter out unwanted time series. Only metrics matching the selector will be collected. - Logic: (pattern1 OR pattern2) AND !(pattern3 or pattern4) -- Pattern syntax: [selector](/src/go/collectors/go.d.plugin/pkg/prometheus/selector/README.md). +- Pattern syntax: [selector](/src/go/plugin/go.d/pkg/prometheus/selector/README.md). - Option syntax: ```yaml @@ -266,6 +265,8 @@ jobs: ### Debug Mode +**Important**: Debug mode is not supported for data collection jobs created via the UI using the Dyncfg feature. + To troubleshoot issues with the `prometheus` collector, run the `go.d.plugin` with the debug option enabled. The output should give you clues as to why the collector isn't working. @@ -288,4 +289,37 @@ should give you clues as to why the collector isn't working. ./go.d.plugin -d -m prometheus ``` +### Getting Logs + +If you're encountering problems with the `prometheus` collector, follow these steps to retrieve logs and identify potential issues: + +- **Run the command** specific to your system (systemd, non-systemd, or Docker container). +- **Examine the output** for any warnings or error messages that might indicate issues. These messages should provide clues about the root cause of the problem. + +#### System with systemd + +Use the following command to view logs generated since the last Netdata service restart: + +```bash +journalctl _SYSTEMD_INVOCATION_ID="$(systemctl show --value --property=InvocationID netdata)" --namespace=netdata --grep prometheus +``` + +#### System without systemd + +Locate the collector log file, typically at `/var/log/netdata/collector.log`, and use `grep` to filter for collector's name: + +```bash +grep prometheus /var/log/netdata/collector.log +``` + +**Note**: This method shows logs from all restarts. Focus on the **latest entries** for troubleshooting current issues. + +#### Docker Container + +If your Netdata runs in a Docker container named "netdata" (replace if different), use this command: + +```bash +docker logs netdata 2>&1 | grep prometheus +``` + diff --git a/src/go/collectors/go.d.plugin/modules/prometheus/integrations/fastd.md b/src/go/plugin/go.d/modules/prometheus/integrations/fastd.md index bb4eeeded..2442dff82 100644 --- a/src/go/collectors/go.d.plugin/modules/prometheus/integrations/fastd.md +++ b/src/go/plugin/go.d/modules/prometheus/integrations/fastd.md @@ -1,6 +1,6 @@ <!--startmeta -custom_edit_url: "https://github.com/netdata/netdata/edit/master/src/go/collectors/go.d.plugin/modules/prometheus/integrations/fastd.md" -meta_yaml: "https://github.com/netdata/netdata/edit/master/src/go/collectors/go.d.plugin/modules/prometheus/metadata.yaml" +custom_edit_url: "https://github.com/netdata/netdata/edit/master/src/go/plugin/go.d/modules/prometheus/integrations/fastd.md" +meta_yaml: "https://github.com/netdata/netdata/edit/master/src/go/plugin/go.d/modules/prometheus/metadata.yaml" sidebar_label: "Fastd" learn_status: "Published" learn_rel_path: "Collecting Metrics/VPNs" @@ -37,7 +37,6 @@ This collector supports collecting metrics from multiple instances of this integ #### Auto-Detection By default, it detects instances running on the local host by trying to connect to known ports that are [allocated to exporters](https://github.com/prometheus/prometheus/wiki/Default-port-allocations). -The full list of endpoints is available in the collector's [configuration file](https://github.com/netdata/netdata/blob/master/src/go/collectors/go.d.plugin/config/go.d/prometheus.conf). #### Limits @@ -138,7 +137,7 @@ The following options can be defined globally: update_every, autodetection_retry This option allows you to filter out unwanted time series. Only metrics matching the selector will be collected. - Logic: (pattern1 OR pattern2) AND !(pattern3 or pattern4) -- Pattern syntax: [selector](/src/go/collectors/go.d.plugin/pkg/prometheus/selector/README.md). +- Pattern syntax: [selector](/src/go/plugin/go.d/pkg/prometheus/selector/README.md). - Option syntax: ```yaml @@ -266,6 +265,8 @@ jobs: ### Debug Mode +**Important**: Debug mode is not supported for data collection jobs created via the UI using the Dyncfg feature. + To troubleshoot issues with the `prometheus` collector, run the `go.d.plugin` with the debug option enabled. The output should give you clues as to why the collector isn't working. @@ -288,4 +289,37 @@ should give you clues as to why the collector isn't working. ./go.d.plugin -d -m prometheus ``` +### Getting Logs + +If you're encountering problems with the `prometheus` collector, follow these steps to retrieve logs and identify potential issues: + +- **Run the command** specific to your system (systemd, non-systemd, or Docker container). +- **Examine the output** for any warnings or error messages that might indicate issues. These messages should provide clues about the root cause of the problem. + +#### System with systemd + +Use the following command to view logs generated since the last Netdata service restart: + +```bash +journalctl _SYSTEMD_INVOCATION_ID="$(systemctl show --value --property=InvocationID netdata)" --namespace=netdata --grep prometheus +``` + +#### System without systemd + +Locate the collector log file, typically at `/var/log/netdata/collector.log`, and use `grep` to filter for collector's name: + +```bash +grep prometheus /var/log/netdata/collector.log +``` + +**Note**: This method shows logs from all restarts. Focus on the **latest entries** for troubleshooting current issues. + +#### Docker Container + +If your Netdata runs in a Docker container named "netdata" (replace if different), use this command: + +```bash +docker logs netdata 2>&1 | grep prometheus +``` + diff --git a/src/go/collectors/go.d.plugin/modules/prometheus/integrations/fortigate_firewall.md b/src/go/plugin/go.d/modules/prometheus/integrations/fortigate_firewall.md index 6c22c8b31..b89853a99 100644 --- a/src/go/collectors/go.d.plugin/modules/prometheus/integrations/fortigate_firewall.md +++ b/src/go/plugin/go.d/modules/prometheus/integrations/fortigate_firewall.md @@ -1,6 +1,6 @@ <!--startmeta -custom_edit_url: "https://github.com/netdata/netdata/edit/master/src/go/collectors/go.d.plugin/modules/prometheus/integrations/fortigate_firewall.md" -meta_yaml: "https://github.com/netdata/netdata/edit/master/src/go/collectors/go.d.plugin/modules/prometheus/metadata.yaml" +custom_edit_url: "https://github.com/netdata/netdata/edit/master/src/go/plugin/go.d/modules/prometheus/integrations/fortigate_firewall.md" +meta_yaml: "https://github.com/netdata/netdata/edit/master/src/go/plugin/go.d/modules/prometheus/metadata.yaml" sidebar_label: "Fortigate firewall" learn_status: "Published" learn_rel_path: "Collecting Metrics/Networking Stack and Network Interfaces" @@ -37,7 +37,6 @@ This collector supports collecting metrics from multiple instances of this integ #### Auto-Detection By default, it detects instances running on the local host by trying to connect to known ports that are [allocated to exporters](https://github.com/prometheus/prometheus/wiki/Default-port-allocations). -The full list of endpoints is available in the collector's [configuration file](https://github.com/netdata/netdata/blob/master/src/go/collectors/go.d.plugin/config/go.d/prometheus.conf). #### Limits @@ -138,7 +137,7 @@ The following options can be defined globally: update_every, autodetection_retry This option allows you to filter out unwanted time series. Only metrics matching the selector will be collected. - Logic: (pattern1 OR pattern2) AND !(pattern3 or pattern4) -- Pattern syntax: [selector](/src/go/collectors/go.d.plugin/pkg/prometheus/selector/README.md). +- Pattern syntax: [selector](/src/go/plugin/go.d/pkg/prometheus/selector/README.md). - Option syntax: ```yaml @@ -266,6 +265,8 @@ jobs: ### Debug Mode +**Important**: Debug mode is not supported for data collection jobs created via the UI using the Dyncfg feature. + To troubleshoot issues with the `prometheus` collector, run the `go.d.plugin` with the debug option enabled. The output should give you clues as to why the collector isn't working. @@ -288,4 +289,37 @@ should give you clues as to why the collector isn't working. ./go.d.plugin -d -m prometheus ``` +### Getting Logs + +If you're encountering problems with the `prometheus` collector, follow these steps to retrieve logs and identify potential issues: + +- **Run the command** specific to your system (systemd, non-systemd, or Docker container). +- **Examine the output** for any warnings or error messages that might indicate issues. These messages should provide clues about the root cause of the problem. + +#### System with systemd + +Use the following command to view logs generated since the last Netdata service restart: + +```bash +journalctl _SYSTEMD_INVOCATION_ID="$(systemctl show --value --property=InvocationID netdata)" --namespace=netdata --grep prometheus +``` + +#### System without systemd + +Locate the collector log file, typically at `/var/log/netdata/collector.log`, and use `grep` to filter for collector's name: + +```bash +grep prometheus /var/log/netdata/collector.log +``` + +**Note**: This method shows logs from all restarts. Focus on the **latest entries** for troubleshooting current issues. + +#### Docker Container + +If your Netdata runs in a Docker container named "netdata" (replace if different), use this command: + +```bash +docker logs netdata 2>&1 | grep prometheus +``` + diff --git a/src/go/collectors/go.d.plugin/modules/prometheus/integrations/freebsd_nfs.md b/src/go/plugin/go.d/modules/prometheus/integrations/freebsd_nfs.md index f2105ab2f..cf60803ad 100644 --- a/src/go/collectors/go.d.plugin/modules/prometheus/integrations/freebsd_nfs.md +++ b/src/go/plugin/go.d/modules/prometheus/integrations/freebsd_nfs.md @@ -1,6 +1,6 @@ <!--startmeta -custom_edit_url: "https://github.com/netdata/netdata/edit/master/src/go/collectors/go.d.plugin/modules/prometheus/integrations/freebsd_nfs.md" -meta_yaml: "https://github.com/netdata/netdata/edit/master/src/go/collectors/go.d.plugin/modules/prometheus/metadata.yaml" +custom_edit_url: "https://github.com/netdata/netdata/edit/master/src/go/plugin/go.d/modules/prometheus/integrations/freebsd_nfs.md" +meta_yaml: "https://github.com/netdata/netdata/edit/master/src/go/plugin/go.d/modules/prometheus/metadata.yaml" sidebar_label: "FreeBSD NFS" learn_status: "Published" learn_rel_path: "Collecting Metrics/FreeBSD" @@ -37,7 +37,6 @@ This collector supports collecting metrics from multiple instances of this integ #### Auto-Detection By default, it detects instances running on the local host by trying to connect to known ports that are [allocated to exporters](https://github.com/prometheus/prometheus/wiki/Default-port-allocations). -The full list of endpoints is available in the collector's [configuration file](https://github.com/netdata/netdata/blob/master/src/go/collectors/go.d.plugin/config/go.d/prometheus.conf). #### Limits @@ -138,7 +137,7 @@ The following options can be defined globally: update_every, autodetection_retry This option allows you to filter out unwanted time series. Only metrics matching the selector will be collected. - Logic: (pattern1 OR pattern2) AND !(pattern3 or pattern4) -- Pattern syntax: [selector](/src/go/collectors/go.d.plugin/pkg/prometheus/selector/README.md). +- Pattern syntax: [selector](/src/go/plugin/go.d/pkg/prometheus/selector/README.md). - Option syntax: ```yaml @@ -266,6 +265,8 @@ jobs: ### Debug Mode +**Important**: Debug mode is not supported for data collection jobs created via the UI using the Dyncfg feature. + To troubleshoot issues with the `prometheus` collector, run the `go.d.plugin` with the debug option enabled. The output should give you clues as to why the collector isn't working. @@ -288,4 +289,37 @@ should give you clues as to why the collector isn't working. ./go.d.plugin -d -m prometheus ``` +### Getting Logs + +If you're encountering problems with the `prometheus` collector, follow these steps to retrieve logs and identify potential issues: + +- **Run the command** specific to your system (systemd, non-systemd, or Docker container). +- **Examine the output** for any warnings or error messages that might indicate issues. These messages should provide clues about the root cause of the problem. + +#### System with systemd + +Use the following command to view logs generated since the last Netdata service restart: + +```bash +journalctl _SYSTEMD_INVOCATION_ID="$(systemctl show --value --property=InvocationID netdata)" --namespace=netdata --grep prometheus +``` + +#### System without systemd + +Locate the collector log file, typically at `/var/log/netdata/collector.log`, and use `grep` to filter for collector's name: + +```bash +grep prometheus /var/log/netdata/collector.log +``` + +**Note**: This method shows logs from all restarts. Focus on the **latest entries** for troubleshooting current issues. + +#### Docker Container + +If your Netdata runs in a Docker container named "netdata" (replace if different), use this command: + +```bash +docker logs netdata 2>&1 | grep prometheus +``` + diff --git a/src/go/collectors/go.d.plugin/modules/prometheus/integrations/freebsd_rctl-racct.md b/src/go/plugin/go.d/modules/prometheus/integrations/freebsd_rctl-racct.md index db61bd9c5..bfe6e9e93 100644 --- a/src/go/collectors/go.d.plugin/modules/prometheus/integrations/freebsd_rctl-racct.md +++ b/src/go/plugin/go.d/modules/prometheus/integrations/freebsd_rctl-racct.md @@ -1,6 +1,6 @@ <!--startmeta -custom_edit_url: "https://github.com/netdata/netdata/edit/master/src/go/collectors/go.d.plugin/modules/prometheus/integrations/freebsd_rctl-racct.md" -meta_yaml: "https://github.com/netdata/netdata/edit/master/src/go/collectors/go.d.plugin/modules/prometheus/metadata.yaml" +custom_edit_url: "https://github.com/netdata/netdata/edit/master/src/go/plugin/go.d/modules/prometheus/integrations/freebsd_rctl-racct.md" +meta_yaml: "https://github.com/netdata/netdata/edit/master/src/go/plugin/go.d/modules/prometheus/metadata.yaml" sidebar_label: "FreeBSD RCTL-RACCT" learn_status: "Published" learn_rel_path: "Collecting Metrics/FreeBSD" @@ -37,7 +37,6 @@ This collector supports collecting metrics from multiple instances of this integ #### Auto-Detection By default, it detects instances running on the local host by trying to connect to known ports that are [allocated to exporters](https://github.com/prometheus/prometheus/wiki/Default-port-allocations). -The full list of endpoints is available in the collector's [configuration file](https://github.com/netdata/netdata/blob/master/src/go/collectors/go.d.plugin/config/go.d/prometheus.conf). #### Limits @@ -138,7 +137,7 @@ The following options can be defined globally: update_every, autodetection_retry This option allows you to filter out unwanted time series. Only metrics matching the selector will be collected. - Logic: (pattern1 OR pattern2) AND !(pattern3 or pattern4) -- Pattern syntax: [selector](/src/go/collectors/go.d.plugin/pkg/prometheus/selector/README.md). +- Pattern syntax: [selector](/src/go/plugin/go.d/pkg/prometheus/selector/README.md). - Option syntax: ```yaml @@ -266,6 +265,8 @@ jobs: ### Debug Mode +**Important**: Debug mode is not supported for data collection jobs created via the UI using the Dyncfg feature. + To troubleshoot issues with the `prometheus` collector, run the `go.d.plugin` with the debug option enabled. The output should give you clues as to why the collector isn't working. @@ -288,4 +289,37 @@ should give you clues as to why the collector isn't working. ./go.d.plugin -d -m prometheus ``` +### Getting Logs + +If you're encountering problems with the `prometheus` collector, follow these steps to retrieve logs and identify potential issues: + +- **Run the command** specific to your system (systemd, non-systemd, or Docker container). +- **Examine the output** for any warnings or error messages that might indicate issues. These messages should provide clues about the root cause of the problem. + +#### System with systemd + +Use the following command to view logs generated since the last Netdata service restart: + +```bash +journalctl _SYSTEMD_INVOCATION_ID="$(systemctl show --value --property=InvocationID netdata)" --namespace=netdata --grep prometheus +``` + +#### System without systemd + +Locate the collector log file, typically at `/var/log/netdata/collector.log`, and use `grep` to filter for collector's name: + +```bash +grep prometheus /var/log/netdata/collector.log +``` + +**Note**: This method shows logs from all restarts. Focus on the **latest entries** for troubleshooting current issues. + +#### Docker Container + +If your Netdata runs in a Docker container named "netdata" (replace if different), use this command: + +```bash +docker logs netdata 2>&1 | grep prometheus +``` + diff --git a/src/go/collectors/go.d.plugin/modules/prometheus/integrations/freifunk_network.md b/src/go/plugin/go.d/modules/prometheus/integrations/freifunk_network.md index b716bfa2f..847e305d1 100644 --- a/src/go/collectors/go.d.plugin/modules/prometheus/integrations/freifunk_network.md +++ b/src/go/plugin/go.d/modules/prometheus/integrations/freifunk_network.md @@ -1,6 +1,6 @@ <!--startmeta -custom_edit_url: "https://github.com/netdata/netdata/edit/master/src/go/collectors/go.d.plugin/modules/prometheus/integrations/freifunk_network.md" -meta_yaml: "https://github.com/netdata/netdata/edit/master/src/go/collectors/go.d.plugin/modules/prometheus/metadata.yaml" +custom_edit_url: "https://github.com/netdata/netdata/edit/master/src/go/plugin/go.d/modules/prometheus/integrations/freifunk_network.md" +meta_yaml: "https://github.com/netdata/netdata/edit/master/src/go/plugin/go.d/modules/prometheus/metadata.yaml" sidebar_label: "Freifunk network" learn_status: "Published" learn_rel_path: "Collecting Metrics/Networking Stack and Network Interfaces" @@ -37,7 +37,6 @@ This collector supports collecting metrics from multiple instances of this integ #### Auto-Detection By default, it detects instances running on the local host by trying to connect to known ports that are [allocated to exporters](https://github.com/prometheus/prometheus/wiki/Default-port-allocations). -The full list of endpoints is available in the collector's [configuration file](https://github.com/netdata/netdata/blob/master/src/go/collectors/go.d.plugin/config/go.d/prometheus.conf). #### Limits @@ -138,7 +137,7 @@ The following options can be defined globally: update_every, autodetection_retry This option allows you to filter out unwanted time series. Only metrics matching the selector will be collected. - Logic: (pattern1 OR pattern2) AND !(pattern3 or pattern4) -- Pattern syntax: [selector](/src/go/collectors/go.d.plugin/pkg/prometheus/selector/README.md). +- Pattern syntax: [selector](/src/go/plugin/go.d/pkg/prometheus/selector/README.md). - Option syntax: ```yaml @@ -266,6 +265,8 @@ jobs: ### Debug Mode +**Important**: Debug mode is not supported for data collection jobs created via the UI using the Dyncfg feature. + To troubleshoot issues with the `prometheus` collector, run the `go.d.plugin` with the debug option enabled. The output should give you clues as to why the collector isn't working. @@ -288,4 +289,37 @@ should give you clues as to why the collector isn't working. ./go.d.plugin -d -m prometheus ``` +### Getting Logs + +If you're encountering problems with the `prometheus` collector, follow these steps to retrieve logs and identify potential issues: + +- **Run the command** specific to your system (systemd, non-systemd, or Docker container). +- **Examine the output** for any warnings or error messages that might indicate issues. These messages should provide clues about the root cause of the problem. + +#### System with systemd + +Use the following command to view logs generated since the last Netdata service restart: + +```bash +journalctl _SYSTEMD_INVOCATION_ID="$(systemctl show --value --property=InvocationID netdata)" --namespace=netdata --grep prometheus +``` + +#### System without systemd + +Locate the collector log file, typically at `/var/log/netdata/collector.log`, and use `grep` to filter for collector's name: + +```bash +grep prometheus /var/log/netdata/collector.log +``` + +**Note**: This method shows logs from all restarts. Focus on the **latest entries** for troubleshooting current issues. + +#### Docker Container + +If your Netdata runs in a Docker container named "netdata" (replace if different), use this command: + +```bash +docker logs netdata 2>&1 | grep prometheus +``` + diff --git a/src/go/collectors/go.d.plugin/modules/prometheus/integrations/fritzbox_network_devices.md b/src/go/plugin/go.d/modules/prometheus/integrations/fritzbox_network_devices.md index 7410803fc..0158b0ba6 100644 --- a/src/go/collectors/go.d.plugin/modules/prometheus/integrations/fritzbox_network_devices.md +++ b/src/go/plugin/go.d/modules/prometheus/integrations/fritzbox_network_devices.md @@ -1,6 +1,6 @@ <!--startmeta -custom_edit_url: "https://github.com/netdata/netdata/edit/master/src/go/collectors/go.d.plugin/modules/prometheus/integrations/fritzbox_network_devices.md" -meta_yaml: "https://github.com/netdata/netdata/edit/master/src/go/collectors/go.d.plugin/modules/prometheus/metadata.yaml" +custom_edit_url: "https://github.com/netdata/netdata/edit/master/src/go/plugin/go.d/modules/prometheus/integrations/fritzbox_network_devices.md" +meta_yaml: "https://github.com/netdata/netdata/edit/master/src/go/plugin/go.d/modules/prometheus/metadata.yaml" sidebar_label: "Fritzbox network devices" learn_status: "Published" learn_rel_path: "Collecting Metrics/Networking Stack and Network Interfaces" @@ -37,7 +37,6 @@ This collector supports collecting metrics from multiple instances of this integ #### Auto-Detection By default, it detects instances running on the local host by trying to connect to known ports that are [allocated to exporters](https://github.com/prometheus/prometheus/wiki/Default-port-allocations). -The full list of endpoints is available in the collector's [configuration file](https://github.com/netdata/netdata/blob/master/src/go/collectors/go.d.plugin/config/go.d/prometheus.conf). #### Limits @@ -138,7 +137,7 @@ The following options can be defined globally: update_every, autodetection_retry This option allows you to filter out unwanted time series. Only metrics matching the selector will be collected. - Logic: (pattern1 OR pattern2) AND !(pattern3 or pattern4) -- Pattern syntax: [selector](/src/go/collectors/go.d.plugin/pkg/prometheus/selector/README.md). +- Pattern syntax: [selector](/src/go/plugin/go.d/pkg/prometheus/selector/README.md). - Option syntax: ```yaml @@ -266,6 +265,8 @@ jobs: ### Debug Mode +**Important**: Debug mode is not supported for data collection jobs created via the UI using the Dyncfg feature. + To troubleshoot issues with the `prometheus` collector, run the `go.d.plugin` with the debug option enabled. The output should give you clues as to why the collector isn't working. @@ -288,4 +289,37 @@ should give you clues as to why the collector isn't working. ./go.d.plugin -d -m prometheus ``` +### Getting Logs + +If you're encountering problems with the `prometheus` collector, follow these steps to retrieve logs and identify potential issues: + +- **Run the command** specific to your system (systemd, non-systemd, or Docker container). +- **Examine the output** for any warnings or error messages that might indicate issues. These messages should provide clues about the root cause of the problem. + +#### System with systemd + +Use the following command to view logs generated since the last Netdata service restart: + +```bash +journalctl _SYSTEMD_INVOCATION_ID="$(systemctl show --value --property=InvocationID netdata)" --namespace=netdata --grep prometheus +``` + +#### System without systemd + +Locate the collector log file, typically at `/var/log/netdata/collector.log`, and use `grep` to filter for collector's name: + +```bash +grep prometheus /var/log/netdata/collector.log +``` + +**Note**: This method shows logs from all restarts. Focus on the **latest entries** for troubleshooting current issues. + +#### Docker Container + +If your Netdata runs in a Docker container named "netdata" (replace if different), use this command: + +```bash +docker logs netdata 2>&1 | grep prometheus +``` + diff --git a/src/go/collectors/go.d.plugin/modules/prometheus/integrations/frrouting.md b/src/go/plugin/go.d/modules/prometheus/integrations/frrouting.md index 651a028ea..5f492a475 100644 --- a/src/go/collectors/go.d.plugin/modules/prometheus/integrations/frrouting.md +++ b/src/go/plugin/go.d/modules/prometheus/integrations/frrouting.md @@ -1,6 +1,6 @@ <!--startmeta -custom_edit_url: "https://github.com/netdata/netdata/edit/master/src/go/collectors/go.d.plugin/modules/prometheus/integrations/frrouting.md" -meta_yaml: "https://github.com/netdata/netdata/edit/master/src/go/collectors/go.d.plugin/modules/prometheus/metadata.yaml" +custom_edit_url: "https://github.com/netdata/netdata/edit/master/src/go/plugin/go.d/modules/prometheus/integrations/frrouting.md" +meta_yaml: "https://github.com/netdata/netdata/edit/master/src/go/plugin/go.d/modules/prometheus/metadata.yaml" sidebar_label: "FRRouting" learn_status: "Published" learn_rel_path: "Collecting Metrics/Networking Stack and Network Interfaces" @@ -37,7 +37,6 @@ This collector supports collecting metrics from multiple instances of this integ #### Auto-Detection By default, it detects instances running on the local host by trying to connect to known ports that are [allocated to exporters](https://github.com/prometheus/prometheus/wiki/Default-port-allocations). -The full list of endpoints is available in the collector's [configuration file](https://github.com/netdata/netdata/blob/master/src/go/collectors/go.d.plugin/config/go.d/prometheus.conf). #### Limits @@ -138,7 +137,7 @@ The following options can be defined globally: update_every, autodetection_retry This option allows you to filter out unwanted time series. Only metrics matching the selector will be collected. - Logic: (pattern1 OR pattern2) AND !(pattern3 or pattern4) -- Pattern syntax: [selector](/src/go/collectors/go.d.plugin/pkg/prometheus/selector/README.md). +- Pattern syntax: [selector](/src/go/plugin/go.d/pkg/prometheus/selector/README.md). - Option syntax: ```yaml @@ -266,6 +265,8 @@ jobs: ### Debug Mode +**Important**: Debug mode is not supported for data collection jobs created via the UI using the Dyncfg feature. + To troubleshoot issues with the `prometheus` collector, run the `go.d.plugin` with the debug option enabled. The output should give you clues as to why the collector isn't working. @@ -288,4 +289,37 @@ should give you clues as to why the collector isn't working. ./go.d.plugin -d -m prometheus ``` +### Getting Logs + +If you're encountering problems with the `prometheus` collector, follow these steps to retrieve logs and identify potential issues: + +- **Run the command** specific to your system (systemd, non-systemd, or Docker container). +- **Examine the output** for any warnings or error messages that might indicate issues. These messages should provide clues about the root cause of the problem. + +#### System with systemd + +Use the following command to view logs generated since the last Netdata service restart: + +```bash +journalctl _SYSTEMD_INVOCATION_ID="$(systemctl show --value --property=InvocationID netdata)" --namespace=netdata --grep prometheus +``` + +#### System without systemd + +Locate the collector log file, typically at `/var/log/netdata/collector.log`, and use `grep` to filter for collector's name: + +```bash +grep prometheus /var/log/netdata/collector.log +``` + +**Note**: This method shows logs from all restarts. Focus on the **latest entries** for troubleshooting current issues. + +#### Docker Container + +If your Netdata runs in a Docker container named "netdata" (replace if different), use this command: + +```bash +docker logs netdata 2>&1 | grep prometheus +``` + diff --git a/src/go/collectors/go.d.plugin/modules/prometheus/integrations/gcp_gce.md b/src/go/plugin/go.d/modules/prometheus/integrations/gcp_gce.md index 87c3f2947..34c6d7673 100644 --- a/src/go/collectors/go.d.plugin/modules/prometheus/integrations/gcp_gce.md +++ b/src/go/plugin/go.d/modules/prometheus/integrations/gcp_gce.md @@ -1,6 +1,6 @@ <!--startmeta -custom_edit_url: "https://github.com/netdata/netdata/edit/master/src/go/collectors/go.d.plugin/modules/prometheus/integrations/gcp_gce.md" -meta_yaml: "https://github.com/netdata/netdata/edit/master/src/go/collectors/go.d.plugin/modules/prometheus/metadata.yaml" +custom_edit_url: "https://github.com/netdata/netdata/edit/master/src/go/plugin/go.d/modules/prometheus/integrations/gcp_gce.md" +meta_yaml: "https://github.com/netdata/netdata/edit/master/src/go/plugin/go.d/modules/prometheus/metadata.yaml" sidebar_label: "GCP GCE" learn_status: "Published" learn_rel_path: "Collecting Metrics/Cloud Provider Managed" @@ -37,7 +37,6 @@ This collector supports collecting metrics from multiple instances of this integ #### Auto-Detection By default, it detects instances running on the local host by trying to connect to known ports that are [allocated to exporters](https://github.com/prometheus/prometheus/wiki/Default-port-allocations). -The full list of endpoints is available in the collector's [configuration file](https://github.com/netdata/netdata/blob/master/src/go/collectors/go.d.plugin/config/go.d/prometheus.conf). #### Limits @@ -138,7 +137,7 @@ The following options can be defined globally: update_every, autodetection_retry This option allows you to filter out unwanted time series. Only metrics matching the selector will be collected. - Logic: (pattern1 OR pattern2) AND !(pattern3 or pattern4) -- Pattern syntax: [selector](/src/go/collectors/go.d.plugin/pkg/prometheus/selector/README.md). +- Pattern syntax: [selector](/src/go/plugin/go.d/pkg/prometheus/selector/README.md). - Option syntax: ```yaml @@ -266,6 +265,8 @@ jobs: ### Debug Mode +**Important**: Debug mode is not supported for data collection jobs created via the UI using the Dyncfg feature. + To troubleshoot issues with the `prometheus` collector, run the `go.d.plugin` with the debug option enabled. The output should give you clues as to why the collector isn't working. @@ -288,4 +289,37 @@ should give you clues as to why the collector isn't working. ./go.d.plugin -d -m prometheus ``` +### Getting Logs + +If you're encountering problems with the `prometheus` collector, follow these steps to retrieve logs and identify potential issues: + +- **Run the command** specific to your system (systemd, non-systemd, or Docker container). +- **Examine the output** for any warnings or error messages that might indicate issues. These messages should provide clues about the root cause of the problem. + +#### System with systemd + +Use the following command to view logs generated since the last Netdata service restart: + +```bash +journalctl _SYSTEMD_INVOCATION_ID="$(systemctl show --value --property=InvocationID netdata)" --namespace=netdata --grep prometheus +``` + +#### System without systemd + +Locate the collector log file, typically at `/var/log/netdata/collector.log`, and use `grep` to filter for collector's name: + +```bash +grep prometheus /var/log/netdata/collector.log +``` + +**Note**: This method shows logs from all restarts. Focus on the **latest entries** for troubleshooting current issues. + +#### Docker Container + +If your Netdata runs in a Docker container named "netdata" (replace if different), use this command: + +```bash +docker logs netdata 2>&1 | grep prometheus +``` + diff --git a/src/go/collectors/go.d.plugin/modules/prometheus/integrations/gcp_quota.md b/src/go/plugin/go.d/modules/prometheus/integrations/gcp_quota.md index 1fcc61ed0..85959b677 100644 --- a/src/go/collectors/go.d.plugin/modules/prometheus/integrations/gcp_quota.md +++ b/src/go/plugin/go.d/modules/prometheus/integrations/gcp_quota.md @@ -1,6 +1,6 @@ <!--startmeta -custom_edit_url: "https://github.com/netdata/netdata/edit/master/src/go/collectors/go.d.plugin/modules/prometheus/integrations/gcp_quota.md" -meta_yaml: "https://github.com/netdata/netdata/edit/master/src/go/collectors/go.d.plugin/modules/prometheus/metadata.yaml" +custom_edit_url: "https://github.com/netdata/netdata/edit/master/src/go/plugin/go.d/modules/prometheus/integrations/gcp_quota.md" +meta_yaml: "https://github.com/netdata/netdata/edit/master/src/go/plugin/go.d/modules/prometheus/metadata.yaml" sidebar_label: "GCP Quota" learn_status: "Published" learn_rel_path: "Collecting Metrics/Cloud Provider Managed" @@ -37,7 +37,6 @@ This collector supports collecting metrics from multiple instances of this integ #### Auto-Detection By default, it detects instances running on the local host by trying to connect to known ports that are [allocated to exporters](https://github.com/prometheus/prometheus/wiki/Default-port-allocations). -The full list of endpoints is available in the collector's [configuration file](https://github.com/netdata/netdata/blob/master/src/go/collectors/go.d.plugin/config/go.d/prometheus.conf). #### Limits @@ -138,7 +137,7 @@ The following options can be defined globally: update_every, autodetection_retry This option allows you to filter out unwanted time series. Only metrics matching the selector will be collected. - Logic: (pattern1 OR pattern2) AND !(pattern3 or pattern4) -- Pattern syntax: [selector](/src/go/collectors/go.d.plugin/pkg/prometheus/selector/README.md). +- Pattern syntax: [selector](/src/go/plugin/go.d/pkg/prometheus/selector/README.md). - Option syntax: ```yaml @@ -266,6 +265,8 @@ jobs: ### Debug Mode +**Important**: Debug mode is not supported for data collection jobs created via the UI using the Dyncfg feature. + To troubleshoot issues with the `prometheus` collector, run the `go.d.plugin` with the debug option enabled. The output should give you clues as to why the collector isn't working. @@ -288,4 +289,37 @@ should give you clues as to why the collector isn't working. ./go.d.plugin -d -m prometheus ``` +### Getting Logs + +If you're encountering problems with the `prometheus` collector, follow these steps to retrieve logs and identify potential issues: + +- **Run the command** specific to your system (systemd, non-systemd, or Docker container). +- **Examine the output** for any warnings or error messages that might indicate issues. These messages should provide clues about the root cause of the problem. + +#### System with systemd + +Use the following command to view logs generated since the last Netdata service restart: + +```bash +journalctl _SYSTEMD_INVOCATION_ID="$(systemctl show --value --property=InvocationID netdata)" --namespace=netdata --grep prometheus +``` + +#### System without systemd + +Locate the collector log file, typically at `/var/log/netdata/collector.log`, and use `grep` to filter for collector's name: + +```bash +grep prometheus /var/log/netdata/collector.log +``` + +**Note**: This method shows logs from all restarts. Focus on the **latest entries** for troubleshooting current issues. + +#### Docker Container + +If your Netdata runs in a Docker container named "netdata" (replace if different), use this command: + +```bash +docker logs netdata 2>&1 | grep prometheus +``` + diff --git a/src/go/collectors/go.d.plugin/modules/prometheus/integrations/generic_command_line_output.md b/src/go/plugin/go.d/modules/prometheus/integrations/generic_command_line_output.md index 49d4f716e..27f1cb647 100644 --- a/src/go/collectors/go.d.plugin/modules/prometheus/integrations/generic_command_line_output.md +++ b/src/go/plugin/go.d/modules/prometheus/integrations/generic_command_line_output.md @@ -1,6 +1,6 @@ <!--startmeta -custom_edit_url: "https://github.com/netdata/netdata/edit/master/src/go/collectors/go.d.plugin/modules/prometheus/integrations/generic_command_line_output.md" -meta_yaml: "https://github.com/netdata/netdata/edit/master/src/go/collectors/go.d.plugin/modules/prometheus/metadata.yaml" +custom_edit_url: "https://github.com/netdata/netdata/edit/master/src/go/plugin/go.d/modules/prometheus/integrations/generic_command_line_output.md" +meta_yaml: "https://github.com/netdata/netdata/edit/master/src/go/plugin/go.d/modules/prometheus/metadata.yaml" sidebar_label: "Generic Command Line Output" learn_status: "Published" learn_rel_path: "Collecting Metrics/Generic Collecting Metrics" @@ -37,7 +37,6 @@ This collector supports collecting metrics from multiple instances of this integ #### Auto-Detection By default, it detects instances running on the local host by trying to connect to known ports that are [allocated to exporters](https://github.com/prometheus/prometheus/wiki/Default-port-allocations). -The full list of endpoints is available in the collector's [configuration file](https://github.com/netdata/netdata/blob/master/src/go/collectors/go.d.plugin/config/go.d/prometheus.conf). #### Limits @@ -138,7 +137,7 @@ The following options can be defined globally: update_every, autodetection_retry This option allows you to filter out unwanted time series. Only metrics matching the selector will be collected. - Logic: (pattern1 OR pattern2) AND !(pattern3 or pattern4) -- Pattern syntax: [selector](/src/go/collectors/go.d.plugin/pkg/prometheus/selector/README.md). +- Pattern syntax: [selector](/src/go/plugin/go.d/pkg/prometheus/selector/README.md). - Option syntax: ```yaml @@ -266,6 +265,8 @@ jobs: ### Debug Mode +**Important**: Debug mode is not supported for data collection jobs created via the UI using the Dyncfg feature. + To troubleshoot issues with the `prometheus` collector, run the `go.d.plugin` with the debug option enabled. The output should give you clues as to why the collector isn't working. @@ -288,4 +289,37 @@ should give you clues as to why the collector isn't working. ./go.d.plugin -d -m prometheus ``` +### Getting Logs + +If you're encountering problems with the `prometheus` collector, follow these steps to retrieve logs and identify potential issues: + +- **Run the command** specific to your system (systemd, non-systemd, or Docker container). +- **Examine the output** for any warnings or error messages that might indicate issues. These messages should provide clues about the root cause of the problem. + +#### System with systemd + +Use the following command to view logs generated since the last Netdata service restart: + +```bash +journalctl _SYSTEMD_INVOCATION_ID="$(systemctl show --value --property=InvocationID netdata)" --namespace=netdata --grep prometheus +``` + +#### System without systemd + +Locate the collector log file, typically at `/var/log/netdata/collector.log`, and use `grep` to filter for collector's name: + +```bash +grep prometheus /var/log/netdata/collector.log +``` + +**Note**: This method shows logs from all restarts. Focus on the **latest entries** for troubleshooting current issues. + +#### Docker Container + +If your Netdata runs in a Docker container named "netdata" (replace if different), use this command: + +```bash +docker logs netdata 2>&1 | grep prometheus +``` + diff --git a/src/go/collectors/go.d.plugin/modules/prometheus/integrations/generic_storage_enclosure_tool.md b/src/go/plugin/go.d/modules/prometheus/integrations/generic_storage_enclosure_tool.md index 1ba08a424..ac8f74a43 100644 --- a/src/go/collectors/go.d.plugin/modules/prometheus/integrations/generic_storage_enclosure_tool.md +++ b/src/go/plugin/go.d/modules/prometheus/integrations/generic_storage_enclosure_tool.md @@ -1,6 +1,6 @@ <!--startmeta -custom_edit_url: "https://github.com/netdata/netdata/edit/master/src/go/collectors/go.d.plugin/modules/prometheus/integrations/generic_storage_enclosure_tool.md" -meta_yaml: "https://github.com/netdata/netdata/edit/master/src/go/collectors/go.d.plugin/modules/prometheus/metadata.yaml" +custom_edit_url: "https://github.com/netdata/netdata/edit/master/src/go/plugin/go.d/modules/prometheus/integrations/generic_storage_enclosure_tool.md" +meta_yaml: "https://github.com/netdata/netdata/edit/master/src/go/plugin/go.d/modules/prometheus/metadata.yaml" sidebar_label: "Generic storage enclosure tool" learn_status: "Published" learn_rel_path: "Collecting Metrics/Storage, Mount Points and Filesystems" @@ -37,7 +37,6 @@ This collector supports collecting metrics from multiple instances of this integ #### Auto-Detection By default, it detects instances running on the local host by trying to connect to known ports that are [allocated to exporters](https://github.com/prometheus/prometheus/wiki/Default-port-allocations). -The full list of endpoints is available in the collector's [configuration file](https://github.com/netdata/netdata/blob/master/src/go/collectors/go.d.plugin/config/go.d/prometheus.conf). #### Limits @@ -138,7 +137,7 @@ The following options can be defined globally: update_every, autodetection_retry This option allows you to filter out unwanted time series. Only metrics matching the selector will be collected. - Logic: (pattern1 OR pattern2) AND !(pattern3 or pattern4) -- Pattern syntax: [selector](/src/go/collectors/go.d.plugin/pkg/prometheus/selector/README.md). +- Pattern syntax: [selector](/src/go/plugin/go.d/pkg/prometheus/selector/README.md). - Option syntax: ```yaml @@ -266,6 +265,8 @@ jobs: ### Debug Mode +**Important**: Debug mode is not supported for data collection jobs created via the UI using the Dyncfg feature. + To troubleshoot issues with the `prometheus` collector, run the `go.d.plugin` with the debug option enabled. The output should give you clues as to why the collector isn't working. @@ -288,4 +289,37 @@ should give you clues as to why the collector isn't working. ./go.d.plugin -d -m prometheus ``` +### Getting Logs + +If you're encountering problems with the `prometheus` collector, follow these steps to retrieve logs and identify potential issues: + +- **Run the command** specific to your system (systemd, non-systemd, or Docker container). +- **Examine the output** for any warnings or error messages that might indicate issues. These messages should provide clues about the root cause of the problem. + +#### System with systemd + +Use the following command to view logs generated since the last Netdata service restart: + +```bash +journalctl _SYSTEMD_INVOCATION_ID="$(systemctl show --value --property=InvocationID netdata)" --namespace=netdata --grep prometheus +``` + +#### System without systemd + +Locate the collector log file, typically at `/var/log/netdata/collector.log`, and use `grep` to filter for collector's name: + +```bash +grep prometheus /var/log/netdata/collector.log +``` + +**Note**: This method shows logs from all restarts. Focus on the **latest entries** for troubleshooting current issues. + +#### Docker Container + +If your Netdata runs in a Docker container named "netdata" (replace if different), use this command: + +```bash +docker logs netdata 2>&1 | grep prometheus +``` + diff --git a/src/go/collectors/go.d.plugin/modules/prometheus/integrations/github_api_rate_limit.md b/src/go/plugin/go.d/modules/prometheus/integrations/github_api_rate_limit.md index 6e9abc583..548430349 100644 --- a/src/go/collectors/go.d.plugin/modules/prometheus/integrations/github_api_rate_limit.md +++ b/src/go/plugin/go.d/modules/prometheus/integrations/github_api_rate_limit.md @@ -1,6 +1,6 @@ <!--startmeta -custom_edit_url: "https://github.com/netdata/netdata/edit/master/src/go/collectors/go.d.plugin/modules/prometheus/integrations/github_api_rate_limit.md" -meta_yaml: "https://github.com/netdata/netdata/edit/master/src/go/collectors/go.d.plugin/modules/prometheus/metadata.yaml" +custom_edit_url: "https://github.com/netdata/netdata/edit/master/src/go/plugin/go.d/modules/prometheus/integrations/github_api_rate_limit.md" +meta_yaml: "https://github.com/netdata/netdata/edit/master/src/go/plugin/go.d/modules/prometheus/metadata.yaml" sidebar_label: "GitHub API rate limit" learn_status: "Published" learn_rel_path: "Collecting Metrics/Other" @@ -38,7 +38,6 @@ This collector supports collecting metrics from multiple instances of this integ #### Auto-Detection By default, it detects instances running on the local host by trying to connect to known ports that are [allocated to exporters](https://github.com/prometheus/prometheus/wiki/Default-port-allocations). -The full list of endpoints is available in the collector's [configuration file](https://github.com/netdata/netdata/blob/master/src/go/collectors/go.d.plugin/config/go.d/prometheus.conf). #### Limits @@ -139,7 +138,7 @@ The following options can be defined globally: update_every, autodetection_retry This option allows you to filter out unwanted time series. Only metrics matching the selector will be collected. - Logic: (pattern1 OR pattern2) AND !(pattern3 or pattern4) -- Pattern syntax: [selector](/src/go/collectors/go.d.plugin/pkg/prometheus/selector/README.md). +- Pattern syntax: [selector](/src/go/plugin/go.d/pkg/prometheus/selector/README.md). - Option syntax: ```yaml @@ -267,6 +266,8 @@ jobs: ### Debug Mode +**Important**: Debug mode is not supported for data collection jobs created via the UI using the Dyncfg feature. + To troubleshoot issues with the `prometheus` collector, run the `go.d.plugin` with the debug option enabled. The output should give you clues as to why the collector isn't working. @@ -289,4 +290,37 @@ should give you clues as to why the collector isn't working. ./go.d.plugin -d -m prometheus ``` +### Getting Logs + +If you're encountering problems with the `prometheus` collector, follow these steps to retrieve logs and identify potential issues: + +- **Run the command** specific to your system (systemd, non-systemd, or Docker container). +- **Examine the output** for any warnings or error messages that might indicate issues. These messages should provide clues about the root cause of the problem. + +#### System with systemd + +Use the following command to view logs generated since the last Netdata service restart: + +```bash +journalctl _SYSTEMD_INVOCATION_ID="$(systemctl show --value --property=InvocationID netdata)" --namespace=netdata --grep prometheus +``` + +#### System without systemd + +Locate the collector log file, typically at `/var/log/netdata/collector.log`, and use `grep` to filter for collector's name: + +```bash +grep prometheus /var/log/netdata/collector.log +``` + +**Note**: This method shows logs from all restarts. Focus on the **latest entries** for troubleshooting current issues. + +#### Docker Container + +If your Netdata runs in a Docker container named "netdata" (replace if different), use this command: + +```bash +docker logs netdata 2>&1 | grep prometheus +``` + diff --git a/src/go/collectors/go.d.plugin/modules/prometheus/integrations/github_repository.md b/src/go/plugin/go.d/modules/prometheus/integrations/github_repository.md index f01cbf61c..f96fc527a 100644 --- a/src/go/collectors/go.d.plugin/modules/prometheus/integrations/github_repository.md +++ b/src/go/plugin/go.d/modules/prometheus/integrations/github_repository.md @@ -1,6 +1,6 @@ <!--startmeta -custom_edit_url: "https://github.com/netdata/netdata/edit/master/src/go/collectors/go.d.plugin/modules/prometheus/integrations/github_repository.md" -meta_yaml: "https://github.com/netdata/netdata/edit/master/src/go/collectors/go.d.plugin/modules/prometheus/metadata.yaml" +custom_edit_url: "https://github.com/netdata/netdata/edit/master/src/go/plugin/go.d/modules/prometheus/integrations/github_repository.md" +meta_yaml: "https://github.com/netdata/netdata/edit/master/src/go/plugin/go.d/modules/prometheus/metadata.yaml" sidebar_label: "GitHub repository" learn_status: "Published" learn_rel_path: "Collecting Metrics/Other" @@ -37,7 +37,6 @@ This collector supports collecting metrics from multiple instances of this integ #### Auto-Detection By default, it detects instances running on the local host by trying to connect to known ports that are [allocated to exporters](https://github.com/prometheus/prometheus/wiki/Default-port-allocations). -The full list of endpoints is available in the collector's [configuration file](https://github.com/netdata/netdata/blob/master/src/go/collectors/go.d.plugin/config/go.d/prometheus.conf). #### Limits @@ -138,7 +137,7 @@ The following options can be defined globally: update_every, autodetection_retry This option allows you to filter out unwanted time series. Only metrics matching the selector will be collected. - Logic: (pattern1 OR pattern2) AND !(pattern3 or pattern4) -- Pattern syntax: [selector](/src/go/collectors/go.d.plugin/pkg/prometheus/selector/README.md). +- Pattern syntax: [selector](/src/go/plugin/go.d/pkg/prometheus/selector/README.md). - Option syntax: ```yaml @@ -266,6 +265,8 @@ jobs: ### Debug Mode +**Important**: Debug mode is not supported for data collection jobs created via the UI using the Dyncfg feature. + To troubleshoot issues with the `prometheus` collector, run the `go.d.plugin` with the debug option enabled. The output should give you clues as to why the collector isn't working. @@ -288,4 +289,37 @@ should give you clues as to why the collector isn't working. ./go.d.plugin -d -m prometheus ``` +### Getting Logs + +If you're encountering problems with the `prometheus` collector, follow these steps to retrieve logs and identify potential issues: + +- **Run the command** specific to your system (systemd, non-systemd, or Docker container). +- **Examine the output** for any warnings or error messages that might indicate issues. These messages should provide clues about the root cause of the problem. + +#### System with systemd + +Use the following command to view logs generated since the last Netdata service restart: + +```bash +journalctl _SYSTEMD_INVOCATION_ID="$(systemctl show --value --property=InvocationID netdata)" --namespace=netdata --grep prometheus +``` + +#### System without systemd + +Locate the collector log file, typically at `/var/log/netdata/collector.log`, and use `grep` to filter for collector's name: + +```bash +grep prometheus /var/log/netdata/collector.log +``` + +**Note**: This method shows logs from all restarts. Focus on the **latest entries** for troubleshooting current issues. + +#### Docker Container + +If your Netdata runs in a Docker container named "netdata" (replace if different), use this command: + +```bash +docker logs netdata 2>&1 | grep prometheus +``` + diff --git a/src/go/collectors/go.d.plugin/modules/prometheus/integrations/gitlab_runner.md b/src/go/plugin/go.d/modules/prometheus/integrations/gitlab_runner.md index 528543038..6982b7a59 100644 --- a/src/go/collectors/go.d.plugin/modules/prometheus/integrations/gitlab_runner.md +++ b/src/go/plugin/go.d/modules/prometheus/integrations/gitlab_runner.md @@ -1,6 +1,6 @@ <!--startmeta -custom_edit_url: "https://github.com/netdata/netdata/edit/master/src/go/collectors/go.d.plugin/modules/prometheus/integrations/gitlab_runner.md" -meta_yaml: "https://github.com/netdata/netdata/edit/master/src/go/collectors/go.d.plugin/modules/prometheus/metadata.yaml" +custom_edit_url: "https://github.com/netdata/netdata/edit/master/src/go/plugin/go.d/modules/prometheus/integrations/gitlab_runner.md" +meta_yaml: "https://github.com/netdata/netdata/edit/master/src/go/plugin/go.d/modules/prometheus/metadata.yaml" sidebar_label: "GitLab Runner" learn_status: "Published" learn_rel_path: "Collecting Metrics/CICD Platforms" @@ -37,7 +37,6 @@ This collector supports collecting metrics from multiple instances of this integ #### Auto-Detection By default, it detects instances running on the local host by trying to connect to known ports that are [allocated to exporters](https://github.com/prometheus/prometheus/wiki/Default-port-allocations). -The full list of endpoints is available in the collector's [configuration file](https://github.com/netdata/netdata/blob/master/src/go/collectors/go.d.plugin/config/go.d/prometheus.conf). #### Limits @@ -138,7 +137,7 @@ The following options can be defined globally: update_every, autodetection_retry This option allows you to filter out unwanted time series. Only metrics matching the selector will be collected. - Logic: (pattern1 OR pattern2) AND !(pattern3 or pattern4) -- Pattern syntax: [selector](/src/go/collectors/go.d.plugin/pkg/prometheus/selector/README.md). +- Pattern syntax: [selector](/src/go/plugin/go.d/pkg/prometheus/selector/README.md). - Option syntax: ```yaml @@ -266,6 +265,8 @@ jobs: ### Debug Mode +**Important**: Debug mode is not supported for data collection jobs created via the UI using the Dyncfg feature. + To troubleshoot issues with the `prometheus` collector, run the `go.d.plugin` with the debug option enabled. The output should give you clues as to why the collector isn't working. @@ -288,4 +289,37 @@ should give you clues as to why the collector isn't working. ./go.d.plugin -d -m prometheus ``` +### Getting Logs + +If you're encountering problems with the `prometheus` collector, follow these steps to retrieve logs and identify potential issues: + +- **Run the command** specific to your system (systemd, non-systemd, or Docker container). +- **Examine the output** for any warnings or error messages that might indicate issues. These messages should provide clues about the root cause of the problem. + +#### System with systemd + +Use the following command to view logs generated since the last Netdata service restart: + +```bash +journalctl _SYSTEMD_INVOCATION_ID="$(systemctl show --value --property=InvocationID netdata)" --namespace=netdata --grep prometheus +``` + +#### System without systemd + +Locate the collector log file, typically at `/var/log/netdata/collector.log`, and use `grep` to filter for collector's name: + +```bash +grep prometheus /var/log/netdata/collector.log +``` + +**Note**: This method shows logs from all restarts. Focus on the **latest entries** for troubleshooting current issues. + +#### Docker Container + +If your Netdata runs in a Docker container named "netdata" (replace if different), use this command: + +```bash +docker logs netdata 2>&1 | grep prometheus +``` + diff --git a/src/go/collectors/go.d.plugin/modules/prometheus/integrations/gobetween.md b/src/go/plugin/go.d/modules/prometheus/integrations/gobetween.md index 39b74b786..7ea5ec62c 100644 --- a/src/go/collectors/go.d.plugin/modules/prometheus/integrations/gobetween.md +++ b/src/go/plugin/go.d/modules/prometheus/integrations/gobetween.md @@ -1,6 +1,6 @@ <!--startmeta -custom_edit_url: "https://github.com/netdata/netdata/edit/master/src/go/collectors/go.d.plugin/modules/prometheus/integrations/gobetween.md" -meta_yaml: "https://github.com/netdata/netdata/edit/master/src/go/collectors/go.d.plugin/modules/prometheus/metadata.yaml" +custom_edit_url: "https://github.com/netdata/netdata/edit/master/src/go/plugin/go.d/modules/prometheus/integrations/gobetween.md" +meta_yaml: "https://github.com/netdata/netdata/edit/master/src/go/plugin/go.d/modules/prometheus/metadata.yaml" sidebar_label: "Gobetween" learn_status: "Published" learn_rel_path: "Collecting Metrics/Web Servers and Web Proxies" @@ -37,7 +37,6 @@ This collector supports collecting metrics from multiple instances of this integ #### Auto-Detection By default, it detects instances running on the local host by trying to connect to known ports that are [allocated to exporters](https://github.com/prometheus/prometheus/wiki/Default-port-allocations). -The full list of endpoints is available in the collector's [configuration file](https://github.com/netdata/netdata/blob/master/src/go/collectors/go.d.plugin/config/go.d/prometheus.conf). #### Limits @@ -134,7 +133,7 @@ The following options can be defined globally: update_every, autodetection_retry This option allows you to filter out unwanted time series. Only metrics matching the selector will be collected. - Logic: (pattern1 OR pattern2) AND !(pattern3 or pattern4) -- Pattern syntax: [selector](/src/go/collectors/go.d.plugin/pkg/prometheus/selector/README.md). +- Pattern syntax: [selector](/src/go/plugin/go.d/pkg/prometheus/selector/README.md). - Option syntax: ```yaml @@ -262,6 +261,8 @@ jobs: ### Debug Mode +**Important**: Debug mode is not supported for data collection jobs created via the UI using the Dyncfg feature. + To troubleshoot issues with the `prometheus` collector, run the `go.d.plugin` with the debug option enabled. The output should give you clues as to why the collector isn't working. @@ -284,4 +285,37 @@ should give you clues as to why the collector isn't working. ./go.d.plugin -d -m prometheus ``` +### Getting Logs + +If you're encountering problems with the `prometheus` collector, follow these steps to retrieve logs and identify potential issues: + +- **Run the command** specific to your system (systemd, non-systemd, or Docker container). +- **Examine the output** for any warnings or error messages that might indicate issues. These messages should provide clues about the root cause of the problem. + +#### System with systemd + +Use the following command to view logs generated since the last Netdata service restart: + +```bash +journalctl _SYSTEMD_INVOCATION_ID="$(systemctl show --value --property=InvocationID netdata)" --namespace=netdata --grep prometheus +``` + +#### System without systemd + +Locate the collector log file, typically at `/var/log/netdata/collector.log`, and use `grep` to filter for collector's name: + +```bash +grep prometheus /var/log/netdata/collector.log +``` + +**Note**: This method shows logs from all restarts. Focus on the **latest entries** for troubleshooting current issues. + +#### Docker Container + +If your Netdata runs in a Docker container named "netdata" (replace if different), use this command: + +```bash +docker logs netdata 2>&1 | grep prometheus +``` + diff --git a/src/go/collectors/go.d.plugin/modules/prometheus/integrations/google_cloud_platform.md b/src/go/plugin/go.d/modules/prometheus/integrations/google_cloud_platform.md index 4575a9edb..50fad9263 100644 --- a/src/go/collectors/go.d.plugin/modules/prometheus/integrations/google_cloud_platform.md +++ b/src/go/plugin/go.d/modules/prometheus/integrations/google_cloud_platform.md @@ -1,6 +1,6 @@ <!--startmeta -custom_edit_url: "https://github.com/netdata/netdata/edit/master/src/go/collectors/go.d.plugin/modules/prometheus/integrations/google_cloud_platform.md" -meta_yaml: "https://github.com/netdata/netdata/edit/master/src/go/collectors/go.d.plugin/modules/prometheus/metadata.yaml" +custom_edit_url: "https://github.com/netdata/netdata/edit/master/src/go/plugin/go.d/modules/prometheus/integrations/google_cloud_platform.md" +meta_yaml: "https://github.com/netdata/netdata/edit/master/src/go/plugin/go.d/modules/prometheus/metadata.yaml" sidebar_label: "Google Cloud Platform" learn_status: "Published" learn_rel_path: "Collecting Metrics/Cloud Provider Managed" @@ -37,7 +37,6 @@ This collector supports collecting metrics from multiple instances of this integ #### Auto-Detection By default, it detects instances running on the local host by trying to connect to known ports that are [allocated to exporters](https://github.com/prometheus/prometheus/wiki/Default-port-allocations). -The full list of endpoints is available in the collector's [configuration file](https://github.com/netdata/netdata/blob/master/src/go/collectors/go.d.plugin/config/go.d/prometheus.conf). #### Limits @@ -138,7 +137,7 @@ The following options can be defined globally: update_every, autodetection_retry This option allows you to filter out unwanted time series. Only metrics matching the selector will be collected. - Logic: (pattern1 OR pattern2) AND !(pattern3 or pattern4) -- Pattern syntax: [selector](/src/go/collectors/go.d.plugin/pkg/prometheus/selector/README.md). +- Pattern syntax: [selector](/src/go/plugin/go.d/pkg/prometheus/selector/README.md). - Option syntax: ```yaml @@ -266,6 +265,8 @@ jobs: ### Debug Mode +**Important**: Debug mode is not supported for data collection jobs created via the UI using the Dyncfg feature. + To troubleshoot issues with the `prometheus` collector, run the `go.d.plugin` with the debug option enabled. The output should give you clues as to why the collector isn't working. @@ -288,4 +289,37 @@ should give you clues as to why the collector isn't working. ./go.d.plugin -d -m prometheus ``` +### Getting Logs + +If you're encountering problems with the `prometheus` collector, follow these steps to retrieve logs and identify potential issues: + +- **Run the command** specific to your system (systemd, non-systemd, or Docker container). +- **Examine the output** for any warnings or error messages that might indicate issues. These messages should provide clues about the root cause of the problem. + +#### System with systemd + +Use the following command to view logs generated since the last Netdata service restart: + +```bash +journalctl _SYSTEMD_INVOCATION_ID="$(systemctl show --value --property=InvocationID netdata)" --namespace=netdata --grep prometheus +``` + +#### System without systemd + +Locate the collector log file, typically at `/var/log/netdata/collector.log`, and use `grep` to filter for collector's name: + +```bash +grep prometheus /var/log/netdata/collector.log +``` + +**Note**: This method shows logs from all restarts. Focus on the **latest entries** for troubleshooting current issues. + +#### Docker Container + +If your Netdata runs in a Docker container named "netdata" (replace if different), use this command: + +```bash +docker logs netdata 2>&1 | grep prometheus +``` + diff --git a/src/go/collectors/go.d.plugin/modules/prometheus/integrations/google_pagespeed.md b/src/go/plugin/go.d/modules/prometheus/integrations/google_pagespeed.md index a76cf48f4..a3a3ecefe 100644 --- a/src/go/collectors/go.d.plugin/modules/prometheus/integrations/google_pagespeed.md +++ b/src/go/plugin/go.d/modules/prometheus/integrations/google_pagespeed.md @@ -1,6 +1,6 @@ <!--startmeta -custom_edit_url: "https://github.com/netdata/netdata/edit/master/src/go/collectors/go.d.plugin/modules/prometheus/integrations/google_pagespeed.md" -meta_yaml: "https://github.com/netdata/netdata/edit/master/src/go/collectors/go.d.plugin/modules/prometheus/metadata.yaml" +custom_edit_url: "https://github.com/netdata/netdata/edit/master/src/go/plugin/go.d/modules/prometheus/integrations/google_pagespeed.md" +meta_yaml: "https://github.com/netdata/netdata/edit/master/src/go/plugin/go.d/modules/prometheus/metadata.yaml" sidebar_label: "Google Pagespeed" learn_status: "Published" learn_rel_path: "Collecting Metrics/APM" @@ -37,7 +37,6 @@ This collector supports collecting metrics from multiple instances of this integ #### Auto-Detection By default, it detects instances running on the local host by trying to connect to known ports that are [allocated to exporters](https://github.com/prometheus/prometheus/wiki/Default-port-allocations). -The full list of endpoints is available in the collector's [configuration file](https://github.com/netdata/netdata/blob/master/src/go/collectors/go.d.plugin/config/go.d/prometheus.conf). #### Limits @@ -138,7 +137,7 @@ The following options can be defined globally: update_every, autodetection_retry This option allows you to filter out unwanted time series. Only metrics matching the selector will be collected. - Logic: (pattern1 OR pattern2) AND !(pattern3 or pattern4) -- Pattern syntax: [selector](/src/go/collectors/go.d.plugin/pkg/prometheus/selector/README.md). +- Pattern syntax: [selector](/src/go/plugin/go.d/pkg/prometheus/selector/README.md). - Option syntax: ```yaml @@ -266,6 +265,8 @@ jobs: ### Debug Mode +**Important**: Debug mode is not supported for data collection jobs created via the UI using the Dyncfg feature. + To troubleshoot issues with the `prometheus` collector, run the `go.d.plugin` with the debug option enabled. The output should give you clues as to why the collector isn't working. @@ -288,4 +289,37 @@ should give you clues as to why the collector isn't working. ./go.d.plugin -d -m prometheus ``` +### Getting Logs + +If you're encountering problems with the `prometheus` collector, follow these steps to retrieve logs and identify potential issues: + +- **Run the command** specific to your system (systemd, non-systemd, or Docker container). +- **Examine the output** for any warnings or error messages that might indicate issues. These messages should provide clues about the root cause of the problem. + +#### System with systemd + +Use the following command to view logs generated since the last Netdata service restart: + +```bash +journalctl _SYSTEMD_INVOCATION_ID="$(systemctl show --value --property=InvocationID netdata)" --namespace=netdata --grep prometheus +``` + +#### System without systemd + +Locate the collector log file, typically at `/var/log/netdata/collector.log`, and use `grep` to filter for collector's name: + +```bash +grep prometheus /var/log/netdata/collector.log +``` + +**Note**: This method shows logs from all restarts. Focus on the **latest entries** for troubleshooting current issues. + +#### Docker Container + +If your Netdata runs in a Docker container named "netdata" (replace if different), use this command: + +```bash +docker logs netdata 2>&1 | grep prometheus +``` + diff --git a/src/go/collectors/go.d.plugin/modules/prometheus/integrations/google_stackdriver.md b/src/go/plugin/go.d/modules/prometheus/integrations/google_stackdriver.md index b54979932..ef8fc5734 100644 --- a/src/go/collectors/go.d.plugin/modules/prometheus/integrations/google_stackdriver.md +++ b/src/go/plugin/go.d/modules/prometheus/integrations/google_stackdriver.md @@ -1,6 +1,6 @@ <!--startmeta -custom_edit_url: "https://github.com/netdata/netdata/edit/master/src/go/collectors/go.d.plugin/modules/prometheus/integrations/google_stackdriver.md" -meta_yaml: "https://github.com/netdata/netdata/edit/master/src/go/collectors/go.d.plugin/modules/prometheus/metadata.yaml" +custom_edit_url: "https://github.com/netdata/netdata/edit/master/src/go/plugin/go.d/modules/prometheus/integrations/google_stackdriver.md" +meta_yaml: "https://github.com/netdata/netdata/edit/master/src/go/plugin/go.d/modules/prometheus/metadata.yaml" sidebar_label: "Google Stackdriver" learn_status: "Published" learn_rel_path: "Collecting Metrics/Cloud Provider Managed" @@ -37,7 +37,6 @@ This collector supports collecting metrics from multiple instances of this integ #### Auto-Detection By default, it detects instances running on the local host by trying to connect to known ports that are [allocated to exporters](https://github.com/prometheus/prometheus/wiki/Default-port-allocations). -The full list of endpoints is available in the collector's [configuration file](https://github.com/netdata/netdata/blob/master/src/go/collectors/go.d.plugin/config/go.d/prometheus.conf). #### Limits @@ -138,7 +137,7 @@ The following options can be defined globally: update_every, autodetection_retry This option allows you to filter out unwanted time series. Only metrics matching the selector will be collected. - Logic: (pattern1 OR pattern2) AND !(pattern3 or pattern4) -- Pattern syntax: [selector](/src/go/collectors/go.d.plugin/pkg/prometheus/selector/README.md). +- Pattern syntax: [selector](/src/go/plugin/go.d/pkg/prometheus/selector/README.md). - Option syntax: ```yaml @@ -266,6 +265,8 @@ jobs: ### Debug Mode +**Important**: Debug mode is not supported for data collection jobs created via the UI using the Dyncfg feature. + To troubleshoot issues with the `prometheus` collector, run the `go.d.plugin` with the debug option enabled. The output should give you clues as to why the collector isn't working. @@ -288,4 +289,37 @@ should give you clues as to why the collector isn't working. ./go.d.plugin -d -m prometheus ``` +### Getting Logs + +If you're encountering problems with the `prometheus` collector, follow these steps to retrieve logs and identify potential issues: + +- **Run the command** specific to your system (systemd, non-systemd, or Docker container). +- **Examine the output** for any warnings or error messages that might indicate issues. These messages should provide clues about the root cause of the problem. + +#### System with systemd + +Use the following command to view logs generated since the last Netdata service restart: + +```bash +journalctl _SYSTEMD_INVOCATION_ID="$(systemctl show --value --property=InvocationID netdata)" --namespace=netdata --grep prometheus +``` + +#### System without systemd + +Locate the collector log file, typically at `/var/log/netdata/collector.log`, and use `grep` to filter for collector's name: + +```bash +grep prometheus /var/log/netdata/collector.log +``` + +**Note**: This method shows logs from all restarts. Focus on the **latest entries** for troubleshooting current issues. + +#### Docker Container + +If your Netdata runs in a Docker container named "netdata" (replace if different), use this command: + +```bash +docker logs netdata 2>&1 | grep prometheus +``` + diff --git a/src/go/collectors/go.d.plugin/modules/prometheus/integrations/gpsd.md b/src/go/plugin/go.d/modules/prometheus/integrations/gpsd.md index 48716d99f..68a588515 100644 --- a/src/go/collectors/go.d.plugin/modules/prometheus/integrations/gpsd.md +++ b/src/go/plugin/go.d/modules/prometheus/integrations/gpsd.md @@ -1,6 +1,6 @@ <!--startmeta -custom_edit_url: "https://github.com/netdata/netdata/edit/master/src/go/collectors/go.d.plugin/modules/prometheus/integrations/gpsd.md" -meta_yaml: "https://github.com/netdata/netdata/edit/master/src/go/collectors/go.d.plugin/modules/prometheus/metadata.yaml" +custom_edit_url: "https://github.com/netdata/netdata/edit/master/src/go/plugin/go.d/modules/prometheus/integrations/gpsd.md" +meta_yaml: "https://github.com/netdata/netdata/edit/master/src/go/plugin/go.d/modules/prometheus/metadata.yaml" sidebar_label: "gpsd" learn_status: "Published" learn_rel_path: "Collecting Metrics/APM" @@ -37,7 +37,6 @@ This collector supports collecting metrics from multiple instances of this integ #### Auto-Detection By default, it detects instances running on the local host by trying to connect to known ports that are [allocated to exporters](https://github.com/prometheus/prometheus/wiki/Default-port-allocations). -The full list of endpoints is available in the collector's [configuration file](https://github.com/netdata/netdata/blob/master/src/go/collectors/go.d.plugin/config/go.d/prometheus.conf). #### Limits @@ -138,7 +137,7 @@ The following options can be defined globally: update_every, autodetection_retry This option allows you to filter out unwanted time series. Only metrics matching the selector will be collected. - Logic: (pattern1 OR pattern2) AND !(pattern3 or pattern4) -- Pattern syntax: [selector](/src/go/collectors/go.d.plugin/pkg/prometheus/selector/README.md). +- Pattern syntax: [selector](/src/go/plugin/go.d/pkg/prometheus/selector/README.md). - Option syntax: ```yaml @@ -266,6 +265,8 @@ jobs: ### Debug Mode +**Important**: Debug mode is not supported for data collection jobs created via the UI using the Dyncfg feature. + To troubleshoot issues with the `prometheus` collector, run the `go.d.plugin` with the debug option enabled. The output should give you clues as to why the collector isn't working. @@ -288,4 +289,37 @@ should give you clues as to why the collector isn't working. ./go.d.plugin -d -m prometheus ``` +### Getting Logs + +If you're encountering problems with the `prometheus` collector, follow these steps to retrieve logs and identify potential issues: + +- **Run the command** specific to your system (systemd, non-systemd, or Docker container). +- **Examine the output** for any warnings or error messages that might indicate issues. These messages should provide clues about the root cause of the problem. + +#### System with systemd + +Use the following command to view logs generated since the last Netdata service restart: + +```bash +journalctl _SYSTEMD_INVOCATION_ID="$(systemctl show --value --property=InvocationID netdata)" --namespace=netdata --grep prometheus +``` + +#### System without systemd + +Locate the collector log file, typically at `/var/log/netdata/collector.log`, and use `grep` to filter for collector's name: + +```bash +grep prometheus /var/log/netdata/collector.log +``` + +**Note**: This method shows logs from all restarts. Focus on the **latest entries** for troubleshooting current issues. + +#### Docker Container + +If your Netdata runs in a Docker container named "netdata" (replace if different), use this command: + +```bash +docker logs netdata 2>&1 | grep prometheus +``` + diff --git a/src/go/collectors/go.d.plugin/modules/prometheus/integrations/grafana.md b/src/go/plugin/go.d/modules/prometheus/integrations/grafana.md index c099fa869..2c0baa395 100644 --- a/src/go/collectors/go.d.plugin/modules/prometheus/integrations/grafana.md +++ b/src/go/plugin/go.d/modules/prometheus/integrations/grafana.md @@ -1,6 +1,6 @@ <!--startmeta -custom_edit_url: "https://github.com/netdata/netdata/edit/master/src/go/collectors/go.d.plugin/modules/prometheus/integrations/grafana.md" -meta_yaml: "https://github.com/netdata/netdata/edit/master/src/go/collectors/go.d.plugin/modules/prometheus/metadata.yaml" +custom_edit_url: "https://github.com/netdata/netdata/edit/master/src/go/plugin/go.d/modules/prometheus/integrations/grafana.md" +meta_yaml: "https://github.com/netdata/netdata/edit/master/src/go/plugin/go.d/modules/prometheus/metadata.yaml" sidebar_label: "Grafana" learn_status: "Published" learn_rel_path: "Collecting Metrics/Observability" @@ -37,7 +37,6 @@ This collector supports collecting metrics from multiple instances of this integ #### Auto-Detection By default, it detects instances running on the local host by trying to connect to known ports that are [allocated to exporters](https://github.com/prometheus/prometheus/wiki/Default-port-allocations). -The full list of endpoints is available in the collector's [configuration file](https://github.com/netdata/netdata/blob/master/src/go/collectors/go.d.plugin/config/go.d/prometheus.conf). #### Limits @@ -134,7 +133,7 @@ The following options can be defined globally: update_every, autodetection_retry This option allows you to filter out unwanted time series. Only metrics matching the selector will be collected. - Logic: (pattern1 OR pattern2) AND !(pattern3 or pattern4) -- Pattern syntax: [selector](/src/go/collectors/go.d.plugin/pkg/prometheus/selector/README.md). +- Pattern syntax: [selector](/src/go/plugin/go.d/pkg/prometheus/selector/README.md). - Option syntax: ```yaml @@ -262,6 +261,8 @@ jobs: ### Debug Mode +**Important**: Debug mode is not supported for data collection jobs created via the UI using the Dyncfg feature. + To troubleshoot issues with the `prometheus` collector, run the `go.d.plugin` with the debug option enabled. The output should give you clues as to why the collector isn't working. @@ -284,4 +285,37 @@ should give you clues as to why the collector isn't working. ./go.d.plugin -d -m prometheus ``` +### Getting Logs + +If you're encountering problems with the `prometheus` collector, follow these steps to retrieve logs and identify potential issues: + +- **Run the command** specific to your system (systemd, non-systemd, or Docker container). +- **Examine the output** for any warnings or error messages that might indicate issues. These messages should provide clues about the root cause of the problem. + +#### System with systemd + +Use the following command to view logs generated since the last Netdata service restart: + +```bash +journalctl _SYSTEMD_INVOCATION_ID="$(systemctl show --value --property=InvocationID netdata)" --namespace=netdata --grep prometheus +``` + +#### System without systemd + +Locate the collector log file, typically at `/var/log/netdata/collector.log`, and use `grep` to filter for collector's name: + +```bash +grep prometheus /var/log/netdata/collector.log +``` + +**Note**: This method shows logs from all restarts. Focus on the **latest entries** for troubleshooting current issues. + +#### Docker Container + +If your Netdata runs in a Docker container named "netdata" (replace if different), use this command: + +```bash +docker logs netdata 2>&1 | grep prometheus +``` + diff --git a/src/go/collectors/go.d.plugin/modules/prometheus/integrations/graylog_server.md b/src/go/plugin/go.d/modules/prometheus/integrations/graylog_server.md index c62c03f8d..8888ae210 100644 --- a/src/go/collectors/go.d.plugin/modules/prometheus/integrations/graylog_server.md +++ b/src/go/plugin/go.d/modules/prometheus/integrations/graylog_server.md @@ -1,6 +1,6 @@ <!--startmeta -custom_edit_url: "https://github.com/netdata/netdata/edit/master/src/go/collectors/go.d.plugin/modules/prometheus/integrations/graylog_server.md" -meta_yaml: "https://github.com/netdata/netdata/edit/master/src/go/collectors/go.d.plugin/modules/prometheus/metadata.yaml" +custom_edit_url: "https://github.com/netdata/netdata/edit/master/src/go/plugin/go.d/modules/prometheus/integrations/graylog_server.md" +meta_yaml: "https://github.com/netdata/netdata/edit/master/src/go/plugin/go.d/modules/prometheus/metadata.yaml" sidebar_label: "Graylog Server" learn_status: "Published" learn_rel_path: "Collecting Metrics/Logs Servers" @@ -37,7 +37,6 @@ This collector supports collecting metrics from multiple instances of this integ #### Auto-Detection By default, it detects instances running on the local host by trying to connect to known ports that are [allocated to exporters](https://github.com/prometheus/prometheus/wiki/Default-port-allocations). -The full list of endpoints is available in the collector's [configuration file](https://github.com/netdata/netdata/blob/master/src/go/collectors/go.d.plugin/config/go.d/prometheus.conf). #### Limits @@ -138,7 +137,7 @@ The following options can be defined globally: update_every, autodetection_retry This option allows you to filter out unwanted time series. Only metrics matching the selector will be collected. - Logic: (pattern1 OR pattern2) AND !(pattern3 or pattern4) -- Pattern syntax: [selector](/src/go/collectors/go.d.plugin/pkg/prometheus/selector/README.md). +- Pattern syntax: [selector](/src/go/plugin/go.d/pkg/prometheus/selector/README.md). - Option syntax: ```yaml @@ -266,6 +265,8 @@ jobs: ### Debug Mode +**Important**: Debug mode is not supported for data collection jobs created via the UI using the Dyncfg feature. + To troubleshoot issues with the `prometheus` collector, run the `go.d.plugin` with the debug option enabled. The output should give you clues as to why the collector isn't working. @@ -288,4 +289,37 @@ should give you clues as to why the collector isn't working. ./go.d.plugin -d -m prometheus ``` +### Getting Logs + +If you're encountering problems with the `prometheus` collector, follow these steps to retrieve logs and identify potential issues: + +- **Run the command** specific to your system (systemd, non-systemd, or Docker container). +- **Examine the output** for any warnings or error messages that might indicate issues. These messages should provide clues about the root cause of the problem. + +#### System with systemd + +Use the following command to view logs generated since the last Netdata service restart: + +```bash +journalctl _SYSTEMD_INVOCATION_ID="$(systemctl show --value --property=InvocationID netdata)" --namespace=netdata --grep prometheus +``` + +#### System without systemd + +Locate the collector log file, typically at `/var/log/netdata/collector.log`, and use `grep` to filter for collector's name: + +```bash +grep prometheus /var/log/netdata/collector.log +``` + +**Note**: This method shows logs from all restarts. Focus on the **latest entries** for troubleshooting current issues. + +#### Docker Container + +If your Netdata runs in a Docker container named "netdata" (replace if different), use this command: + +```bash +docker logs netdata 2>&1 | grep prometheus +``` + diff --git a/src/go/collectors/go.d.plugin/modules/prometheus/integrations/gtp.md b/src/go/plugin/go.d/modules/prometheus/integrations/gtp.md index f0ad36c02..edd3b3a56 100644 --- a/src/go/collectors/go.d.plugin/modules/prometheus/integrations/gtp.md +++ b/src/go/plugin/go.d/modules/prometheus/integrations/gtp.md @@ -1,6 +1,6 @@ <!--startmeta -custom_edit_url: "https://github.com/netdata/netdata/edit/master/src/go/collectors/go.d.plugin/modules/prometheus/integrations/gtp.md" -meta_yaml: "https://github.com/netdata/netdata/edit/master/src/go/collectors/go.d.plugin/modules/prometheus/metadata.yaml" +custom_edit_url: "https://github.com/netdata/netdata/edit/master/src/go/plugin/go.d/modules/prometheus/integrations/gtp.md" +meta_yaml: "https://github.com/netdata/netdata/edit/master/src/go/plugin/go.d/modules/prometheus/metadata.yaml" sidebar_label: "GTP" learn_status: "Published" learn_rel_path: "Collecting Metrics/Telephony Servers" @@ -37,7 +37,6 @@ This collector supports collecting metrics from multiple instances of this integ #### Auto-Detection By default, it detects instances running on the local host by trying to connect to known ports that are [allocated to exporters](https://github.com/prometheus/prometheus/wiki/Default-port-allocations). -The full list of endpoints is available in the collector's [configuration file](https://github.com/netdata/netdata/blob/master/src/go/collectors/go.d.plugin/config/go.d/prometheus.conf). #### Limits @@ -138,7 +137,7 @@ The following options can be defined globally: update_every, autodetection_retry This option allows you to filter out unwanted time series. Only metrics matching the selector will be collected. - Logic: (pattern1 OR pattern2) AND !(pattern3 or pattern4) -- Pattern syntax: [selector](/src/go/collectors/go.d.plugin/pkg/prometheus/selector/README.md). +- Pattern syntax: [selector](/src/go/plugin/go.d/pkg/prometheus/selector/README.md). - Option syntax: ```yaml @@ -266,6 +265,8 @@ jobs: ### Debug Mode +**Important**: Debug mode is not supported for data collection jobs created via the UI using the Dyncfg feature. + To troubleshoot issues with the `prometheus` collector, run the `go.d.plugin` with the debug option enabled. The output should give you clues as to why the collector isn't working. @@ -288,4 +289,37 @@ should give you clues as to why the collector isn't working. ./go.d.plugin -d -m prometheus ``` +### Getting Logs + +If you're encountering problems with the `prometheus` collector, follow these steps to retrieve logs and identify potential issues: + +- **Run the command** specific to your system (systemd, non-systemd, or Docker container). +- **Examine the output** for any warnings or error messages that might indicate issues. These messages should provide clues about the root cause of the problem. + +#### System with systemd + +Use the following command to view logs generated since the last Netdata service restart: + +```bash +journalctl _SYSTEMD_INVOCATION_ID="$(systemctl show --value --property=InvocationID netdata)" --namespace=netdata --grep prometheus +``` + +#### System without systemd + +Locate the collector log file, typically at `/var/log/netdata/collector.log`, and use `grep` to filter for collector's name: + +```bash +grep prometheus /var/log/netdata/collector.log +``` + +**Note**: This method shows logs from all restarts. Focus on the **latest entries** for troubleshooting current issues. + +#### Docker Container + +If your Netdata runs in a Docker container named "netdata" (replace if different), use this command: + +```bash +docker logs netdata 2>&1 | grep prometheus +``` + diff --git a/src/go/collectors/go.d.plugin/modules/prometheus/integrations/halon.md b/src/go/plugin/go.d/modules/prometheus/integrations/halon.md index 41b611579..3a288e53b 100644 --- a/src/go/collectors/go.d.plugin/modules/prometheus/integrations/halon.md +++ b/src/go/plugin/go.d/modules/prometheus/integrations/halon.md @@ -1,6 +1,6 @@ <!--startmeta -custom_edit_url: "https://github.com/netdata/netdata/edit/master/src/go/collectors/go.d.plugin/modules/prometheus/integrations/halon.md" -meta_yaml: "https://github.com/netdata/netdata/edit/master/src/go/collectors/go.d.plugin/modules/prometheus/metadata.yaml" +custom_edit_url: "https://github.com/netdata/netdata/edit/master/src/go/plugin/go.d/modules/prometheus/integrations/halon.md" +meta_yaml: "https://github.com/netdata/netdata/edit/master/src/go/plugin/go.d/modules/prometheus/metadata.yaml" sidebar_label: "Halon" learn_status: "Published" learn_rel_path: "Collecting Metrics/Mail Servers" @@ -37,7 +37,6 @@ This collector supports collecting metrics from multiple instances of this integ #### Auto-Detection By default, it detects instances running on the local host by trying to connect to known ports that are [allocated to exporters](https://github.com/prometheus/prometheus/wiki/Default-port-allocations). -The full list of endpoints is available in the collector's [configuration file](https://github.com/netdata/netdata/blob/master/src/go/collectors/go.d.plugin/config/go.d/prometheus.conf). #### Limits @@ -138,7 +137,7 @@ The following options can be defined globally: update_every, autodetection_retry This option allows you to filter out unwanted time series. Only metrics matching the selector will be collected. - Logic: (pattern1 OR pattern2) AND !(pattern3 or pattern4) -- Pattern syntax: [selector](/src/go/collectors/go.d.plugin/pkg/prometheus/selector/README.md). +- Pattern syntax: [selector](/src/go/plugin/go.d/pkg/prometheus/selector/README.md). - Option syntax: ```yaml @@ -266,6 +265,8 @@ jobs: ### Debug Mode +**Important**: Debug mode is not supported for data collection jobs created via the UI using the Dyncfg feature. + To troubleshoot issues with the `prometheus` collector, run the `go.d.plugin` with the debug option enabled. The output should give you clues as to why the collector isn't working. @@ -288,4 +289,37 @@ should give you clues as to why the collector isn't working. ./go.d.plugin -d -m prometheus ``` +### Getting Logs + +If you're encountering problems with the `prometheus` collector, follow these steps to retrieve logs and identify potential issues: + +- **Run the command** specific to your system (systemd, non-systemd, or Docker container). +- **Examine the output** for any warnings or error messages that might indicate issues. These messages should provide clues about the root cause of the problem. + +#### System with systemd + +Use the following command to view logs generated since the last Netdata service restart: + +```bash +journalctl _SYSTEMD_INVOCATION_ID="$(systemctl show --value --property=InvocationID netdata)" --namespace=netdata --grep prometheus +``` + +#### System without systemd + +Locate the collector log file, typically at `/var/log/netdata/collector.log`, and use `grep` to filter for collector's name: + +```bash +grep prometheus /var/log/netdata/collector.log +``` + +**Note**: This method shows logs from all restarts. Focus on the **latest entries** for troubleshooting current issues. + +#### Docker Container + +If your Netdata runs in a Docker container named "netdata" (replace if different), use this command: + +```bash +docker logs netdata 2>&1 | grep prometheus +``` + diff --git a/src/go/collectors/go.d.plugin/modules/prometheus/integrations/hana.md b/src/go/plugin/go.d/modules/prometheus/integrations/hana.md index eb421d9ee..75d84fef6 100644 --- a/src/go/collectors/go.d.plugin/modules/prometheus/integrations/hana.md +++ b/src/go/plugin/go.d/modules/prometheus/integrations/hana.md @@ -1,6 +1,6 @@ <!--startmeta -custom_edit_url: "https://github.com/netdata/netdata/edit/master/src/go/collectors/go.d.plugin/modules/prometheus/integrations/hana.md" -meta_yaml: "https://github.com/netdata/netdata/edit/master/src/go/collectors/go.d.plugin/modules/prometheus/metadata.yaml" +custom_edit_url: "https://github.com/netdata/netdata/edit/master/src/go/plugin/go.d/modules/prometheus/integrations/hana.md" +meta_yaml: "https://github.com/netdata/netdata/edit/master/src/go/plugin/go.d/modules/prometheus/metadata.yaml" sidebar_label: "HANA" learn_status: "Published" learn_rel_path: "Collecting Metrics/Databases" @@ -37,7 +37,6 @@ This collector supports collecting metrics from multiple instances of this integ #### Auto-Detection By default, it detects instances running on the local host by trying to connect to known ports that are [allocated to exporters](https://github.com/prometheus/prometheus/wiki/Default-port-allocations). -The full list of endpoints is available in the collector's [configuration file](https://github.com/netdata/netdata/blob/master/src/go/collectors/go.d.plugin/config/go.d/prometheus.conf). #### Limits @@ -138,7 +137,7 @@ The following options can be defined globally: update_every, autodetection_retry This option allows you to filter out unwanted time series. Only metrics matching the selector will be collected. - Logic: (pattern1 OR pattern2) AND !(pattern3 or pattern4) -- Pattern syntax: [selector](/src/go/collectors/go.d.plugin/pkg/prometheus/selector/README.md). +- Pattern syntax: [selector](/src/go/plugin/go.d/pkg/prometheus/selector/README.md). - Option syntax: ```yaml @@ -266,6 +265,8 @@ jobs: ### Debug Mode +**Important**: Debug mode is not supported for data collection jobs created via the UI using the Dyncfg feature. + To troubleshoot issues with the `prometheus` collector, run the `go.d.plugin` with the debug option enabled. The output should give you clues as to why the collector isn't working. @@ -288,4 +289,37 @@ should give you clues as to why the collector isn't working. ./go.d.plugin -d -m prometheus ``` +### Getting Logs + +If you're encountering problems with the `prometheus` collector, follow these steps to retrieve logs and identify potential issues: + +- **Run the command** specific to your system (systemd, non-systemd, or Docker container). +- **Examine the output** for any warnings or error messages that might indicate issues. These messages should provide clues about the root cause of the problem. + +#### System with systemd + +Use the following command to view logs generated since the last Netdata service restart: + +```bash +journalctl _SYSTEMD_INVOCATION_ID="$(systemctl show --value --property=InvocationID netdata)" --namespace=netdata --grep prometheus +``` + +#### System without systemd + +Locate the collector log file, typically at `/var/log/netdata/collector.log`, and use `grep` to filter for collector's name: + +```bash +grep prometheus /var/log/netdata/collector.log +``` + +**Note**: This method shows logs from all restarts. Focus on the **latest entries** for troubleshooting current issues. + +#### Docker Container + +If your Netdata runs in a Docker container named "netdata" (replace if different), use this command: + +```bash +docker logs netdata 2>&1 | grep prometheus +``` + diff --git a/src/go/collectors/go.d.plugin/modules/prometheus/integrations/hashicorp_vault_secrets.md b/src/go/plugin/go.d/modules/prometheus/integrations/hashicorp_vault_secrets.md index 9eb74f791..c619344d4 100644 --- a/src/go/collectors/go.d.plugin/modules/prometheus/integrations/hashicorp_vault_secrets.md +++ b/src/go/plugin/go.d/modules/prometheus/integrations/hashicorp_vault_secrets.md @@ -1,6 +1,6 @@ <!--startmeta -custom_edit_url: "https://github.com/netdata/netdata/edit/master/src/go/collectors/go.d.plugin/modules/prometheus/integrations/hashicorp_vault_secrets.md" -meta_yaml: "https://github.com/netdata/netdata/edit/master/src/go/collectors/go.d.plugin/modules/prometheus/metadata.yaml" +custom_edit_url: "https://github.com/netdata/netdata/edit/master/src/go/plugin/go.d/modules/prometheus/integrations/hashicorp_vault_secrets.md" +meta_yaml: "https://github.com/netdata/netdata/edit/master/src/go/plugin/go.d/modules/prometheus/metadata.yaml" sidebar_label: "HashiCorp Vault secrets" learn_status: "Published" learn_rel_path: "Collecting Metrics/Authentication and Authorization" @@ -37,7 +37,6 @@ This collector supports collecting metrics from multiple instances of this integ #### Auto-Detection By default, it detects instances running on the local host by trying to connect to known ports that are [allocated to exporters](https://github.com/prometheus/prometheus/wiki/Default-port-allocations). -The full list of endpoints is available in the collector's [configuration file](https://github.com/netdata/netdata/blob/master/src/go/collectors/go.d.plugin/config/go.d/prometheus.conf). #### Limits @@ -138,7 +137,7 @@ The following options can be defined globally: update_every, autodetection_retry This option allows you to filter out unwanted time series. Only metrics matching the selector will be collected. - Logic: (pattern1 OR pattern2) AND !(pattern3 or pattern4) -- Pattern syntax: [selector](/src/go/collectors/go.d.plugin/pkg/prometheus/selector/README.md). +- Pattern syntax: [selector](/src/go/plugin/go.d/pkg/prometheus/selector/README.md). - Option syntax: ```yaml @@ -266,6 +265,8 @@ jobs: ### Debug Mode +**Important**: Debug mode is not supported for data collection jobs created via the UI using the Dyncfg feature. + To troubleshoot issues with the `prometheus` collector, run the `go.d.plugin` with the debug option enabled. The output should give you clues as to why the collector isn't working. @@ -288,4 +289,37 @@ should give you clues as to why the collector isn't working. ./go.d.plugin -d -m prometheus ``` +### Getting Logs + +If you're encountering problems with the `prometheus` collector, follow these steps to retrieve logs and identify potential issues: + +- **Run the command** specific to your system (systemd, non-systemd, or Docker container). +- **Examine the output** for any warnings or error messages that might indicate issues. These messages should provide clues about the root cause of the problem. + +#### System with systemd + +Use the following command to view logs generated since the last Netdata service restart: + +```bash +journalctl _SYSTEMD_INVOCATION_ID="$(systemctl show --value --property=InvocationID netdata)" --namespace=netdata --grep prometheus +``` + +#### System without systemd + +Locate the collector log file, typically at `/var/log/netdata/collector.log`, and use `grep` to filter for collector's name: + +```bash +grep prometheus /var/log/netdata/collector.log +``` + +**Note**: This method shows logs from all restarts. Focus on the **latest entries** for troubleshooting current issues. + +#### Docker Container + +If your Netdata runs in a Docker container named "netdata" (replace if different), use this command: + +```bash +docker logs netdata 2>&1 | grep prometheus +``` + diff --git a/src/go/collectors/go.d.plugin/modules/prometheus/integrations/hasura_graphql_server.md b/src/go/plugin/go.d/modules/prometheus/integrations/hasura_graphql_server.md index 0597a033c..d95a9199b 100644 --- a/src/go/collectors/go.d.plugin/modules/prometheus/integrations/hasura_graphql_server.md +++ b/src/go/plugin/go.d/modules/prometheus/integrations/hasura_graphql_server.md @@ -1,6 +1,6 @@ <!--startmeta -custom_edit_url: "https://github.com/netdata/netdata/edit/master/src/go/collectors/go.d.plugin/modules/prometheus/integrations/hasura_graphql_server.md" -meta_yaml: "https://github.com/netdata/netdata/edit/master/src/go/collectors/go.d.plugin/modules/prometheus/metadata.yaml" +custom_edit_url: "https://github.com/netdata/netdata/edit/master/src/go/plugin/go.d/modules/prometheus/integrations/hasura_graphql_server.md" +meta_yaml: "https://github.com/netdata/netdata/edit/master/src/go/plugin/go.d/modules/prometheus/metadata.yaml" sidebar_label: "Hasura GraphQL Server" learn_status: "Published" learn_rel_path: "Collecting Metrics/Databases" @@ -38,7 +38,6 @@ This collector supports collecting metrics from multiple instances of this integ #### Auto-Detection By default, it detects instances running on the local host by trying to connect to known ports that are [allocated to exporters](https://github.com/prometheus/prometheus/wiki/Default-port-allocations). -The full list of endpoints is available in the collector's [configuration file](https://github.com/netdata/netdata/blob/master/src/go/collectors/go.d.plugin/config/go.d/prometheus.conf). #### Limits @@ -139,7 +138,7 @@ The following options can be defined globally: update_every, autodetection_retry This option allows you to filter out unwanted time series. Only metrics matching the selector will be collected. - Logic: (pattern1 OR pattern2) AND !(pattern3 or pattern4) -- Pattern syntax: [selector](/src/go/collectors/go.d.plugin/pkg/prometheus/selector/README.md). +- Pattern syntax: [selector](/src/go/plugin/go.d/pkg/prometheus/selector/README.md). - Option syntax: ```yaml @@ -267,6 +266,8 @@ jobs: ### Debug Mode +**Important**: Debug mode is not supported for data collection jobs created via the UI using the Dyncfg feature. + To troubleshoot issues with the `prometheus` collector, run the `go.d.plugin` with the debug option enabled. The output should give you clues as to why the collector isn't working. @@ -289,4 +290,37 @@ should give you clues as to why the collector isn't working. ./go.d.plugin -d -m prometheus ``` +### Getting Logs + +If you're encountering problems with the `prometheus` collector, follow these steps to retrieve logs and identify potential issues: + +- **Run the command** specific to your system (systemd, non-systemd, or Docker container). +- **Examine the output** for any warnings or error messages that might indicate issues. These messages should provide clues about the root cause of the problem. + +#### System with systemd + +Use the following command to view logs generated since the last Netdata service restart: + +```bash +journalctl _SYSTEMD_INVOCATION_ID="$(systemctl show --value --property=InvocationID netdata)" --namespace=netdata --grep prometheus +``` + +#### System without systemd + +Locate the collector log file, typically at `/var/log/netdata/collector.log`, and use `grep` to filter for collector's name: + +```bash +grep prometheus /var/log/netdata/collector.log +``` + +**Note**: This method shows logs from all restarts. Focus on the **latest entries** for troubleshooting current issues. + +#### Docker Container + +If your Netdata runs in a Docker container named "netdata" (replace if different), use this command: + +```bash +docker logs netdata 2>&1 | grep prometheus +``` + diff --git a/src/go/collectors/go.d.plugin/modules/prometheus/integrations/hdsentinel.md b/src/go/plugin/go.d/modules/prometheus/integrations/hdsentinel.md index 49cce578d..1daad64a5 100644 --- a/src/go/collectors/go.d.plugin/modules/prometheus/integrations/hdsentinel.md +++ b/src/go/plugin/go.d/modules/prometheus/integrations/hdsentinel.md @@ -1,6 +1,6 @@ <!--startmeta -custom_edit_url: "https://github.com/netdata/netdata/edit/master/src/go/collectors/go.d.plugin/modules/prometheus/integrations/hdsentinel.md" -meta_yaml: "https://github.com/netdata/netdata/edit/master/src/go/collectors/go.d.plugin/modules/prometheus/metadata.yaml" +custom_edit_url: "https://github.com/netdata/netdata/edit/master/src/go/plugin/go.d/modules/prometheus/integrations/hdsentinel.md" +meta_yaml: "https://github.com/netdata/netdata/edit/master/src/go/plugin/go.d/modules/prometheus/metadata.yaml" sidebar_label: "HDSentinel" learn_status: "Published" learn_rel_path: "Collecting Metrics/Storage, Mount Points and Filesystems" @@ -37,7 +37,6 @@ This collector supports collecting metrics from multiple instances of this integ #### Auto-Detection By default, it detects instances running on the local host by trying to connect to known ports that are [allocated to exporters](https://github.com/prometheus/prometheus/wiki/Default-port-allocations). -The full list of endpoints is available in the collector's [configuration file](https://github.com/netdata/netdata/blob/master/src/go/collectors/go.d.plugin/config/go.d/prometheus.conf). #### Limits @@ -138,7 +137,7 @@ The following options can be defined globally: update_every, autodetection_retry This option allows you to filter out unwanted time series. Only metrics matching the selector will be collected. - Logic: (pattern1 OR pattern2) AND !(pattern3 or pattern4) -- Pattern syntax: [selector](/src/go/collectors/go.d.plugin/pkg/prometheus/selector/README.md). +- Pattern syntax: [selector](/src/go/plugin/go.d/pkg/prometheus/selector/README.md). - Option syntax: ```yaml @@ -266,6 +265,8 @@ jobs: ### Debug Mode +**Important**: Debug mode is not supported for data collection jobs created via the UI using the Dyncfg feature. + To troubleshoot issues with the `prometheus` collector, run the `go.d.plugin` with the debug option enabled. The output should give you clues as to why the collector isn't working. @@ -288,4 +289,37 @@ should give you clues as to why the collector isn't working. ./go.d.plugin -d -m prometheus ``` +### Getting Logs + +If you're encountering problems with the `prometheus` collector, follow these steps to retrieve logs and identify potential issues: + +- **Run the command** specific to your system (systemd, non-systemd, or Docker container). +- **Examine the output** for any warnings or error messages that might indicate issues. These messages should provide clues about the root cause of the problem. + +#### System with systemd + +Use the following command to view logs generated since the last Netdata service restart: + +```bash +journalctl _SYSTEMD_INVOCATION_ID="$(systemctl show --value --property=InvocationID netdata)" --namespace=netdata --grep prometheus +``` + +#### System without systemd + +Locate the collector log file, typically at `/var/log/netdata/collector.log`, and use `grep` to filter for collector's name: + +```bash +grep prometheus /var/log/netdata/collector.log +``` + +**Note**: This method shows logs from all restarts. Focus on the **latest entries** for troubleshooting current issues. + +#### Docker Container + +If your Netdata runs in a Docker container named "netdata" (replace if different), use this command: + +```bash +docker logs netdata 2>&1 | grep prometheus +``` + diff --git a/src/go/collectors/go.d.plugin/modules/prometheus/integrations/helium_hotspot.md b/src/go/plugin/go.d/modules/prometheus/integrations/helium_hotspot.md index adf9a4cf0..6ce0d3348 100644 --- a/src/go/collectors/go.d.plugin/modules/prometheus/integrations/helium_hotspot.md +++ b/src/go/plugin/go.d/modules/prometheus/integrations/helium_hotspot.md @@ -1,6 +1,6 @@ <!--startmeta -custom_edit_url: "https://github.com/netdata/netdata/edit/master/src/go/collectors/go.d.plugin/modules/prometheus/integrations/helium_hotspot.md" -meta_yaml: "https://github.com/netdata/netdata/edit/master/src/go/collectors/go.d.plugin/modules/prometheus/metadata.yaml" +custom_edit_url: "https://github.com/netdata/netdata/edit/master/src/go/plugin/go.d/modules/prometheus/integrations/helium_hotspot.md" +meta_yaml: "https://github.com/netdata/netdata/edit/master/src/go/plugin/go.d/modules/prometheus/metadata.yaml" sidebar_label: "Helium hotspot" learn_status: "Published" learn_rel_path: "Collecting Metrics/IoT Devices" @@ -37,7 +37,6 @@ This collector supports collecting metrics from multiple instances of this integ #### Auto-Detection By default, it detects instances running on the local host by trying to connect to known ports that are [allocated to exporters](https://github.com/prometheus/prometheus/wiki/Default-port-allocations). -The full list of endpoints is available in the collector's [configuration file](https://github.com/netdata/netdata/blob/master/src/go/collectors/go.d.plugin/config/go.d/prometheus.conf). #### Limits @@ -138,7 +137,7 @@ The following options can be defined globally: update_every, autodetection_retry This option allows you to filter out unwanted time series. Only metrics matching the selector will be collected. - Logic: (pattern1 OR pattern2) AND !(pattern3 or pattern4) -- Pattern syntax: [selector](/src/go/collectors/go.d.plugin/pkg/prometheus/selector/README.md). +- Pattern syntax: [selector](/src/go/plugin/go.d/pkg/prometheus/selector/README.md). - Option syntax: ```yaml @@ -266,6 +265,8 @@ jobs: ### Debug Mode +**Important**: Debug mode is not supported for data collection jobs created via the UI using the Dyncfg feature. + To troubleshoot issues with the `prometheus` collector, run the `go.d.plugin` with the debug option enabled. The output should give you clues as to why the collector isn't working. @@ -288,4 +289,37 @@ should give you clues as to why the collector isn't working. ./go.d.plugin -d -m prometheus ``` +### Getting Logs + +If you're encountering problems with the `prometheus` collector, follow these steps to retrieve logs and identify potential issues: + +- **Run the command** specific to your system (systemd, non-systemd, or Docker container). +- **Examine the output** for any warnings or error messages that might indicate issues. These messages should provide clues about the root cause of the problem. + +#### System with systemd + +Use the following command to view logs generated since the last Netdata service restart: + +```bash +journalctl _SYSTEMD_INVOCATION_ID="$(systemctl show --value --property=InvocationID netdata)" --namespace=netdata --grep prometheus +``` + +#### System without systemd + +Locate the collector log file, typically at `/var/log/netdata/collector.log`, and use `grep` to filter for collector's name: + +```bash +grep prometheus /var/log/netdata/collector.log +``` + +**Note**: This method shows logs from all restarts. Focus on the **latest entries** for troubleshooting current issues. + +#### Docker Container + +If your Netdata runs in a Docker container named "netdata" (replace if different), use this command: + +```bash +docker logs netdata 2>&1 | grep prometheus +``` + diff --git a/src/go/collectors/go.d.plugin/modules/prometheus/integrations/helium_miner_validator.md b/src/go/plugin/go.d/modules/prometheus/integrations/helium_miner_validator.md index 6f38b8e8b..a8fdb2814 100644 --- a/src/go/collectors/go.d.plugin/modules/prometheus/integrations/helium_miner_validator.md +++ b/src/go/plugin/go.d/modules/prometheus/integrations/helium_miner_validator.md @@ -1,6 +1,6 @@ <!--startmeta -custom_edit_url: "https://github.com/netdata/netdata/edit/master/src/go/collectors/go.d.plugin/modules/prometheus/integrations/helium_miner_validator.md" -meta_yaml: "https://github.com/netdata/netdata/edit/master/src/go/collectors/go.d.plugin/modules/prometheus/metadata.yaml" +custom_edit_url: "https://github.com/netdata/netdata/edit/master/src/go/plugin/go.d/modules/prometheus/integrations/helium_miner_validator.md" +meta_yaml: "https://github.com/netdata/netdata/edit/master/src/go/plugin/go.d/modules/prometheus/metadata.yaml" sidebar_label: "Helium miner (validator)" learn_status: "Published" learn_rel_path: "Collecting Metrics/Blockchain Servers" @@ -37,7 +37,6 @@ This collector supports collecting metrics from multiple instances of this integ #### Auto-Detection By default, it detects instances running on the local host by trying to connect to known ports that are [allocated to exporters](https://github.com/prometheus/prometheus/wiki/Default-port-allocations). -The full list of endpoints is available in the collector's [configuration file](https://github.com/netdata/netdata/blob/master/src/go/collectors/go.d.plugin/config/go.d/prometheus.conf). #### Limits @@ -138,7 +137,7 @@ The following options can be defined globally: update_every, autodetection_retry This option allows you to filter out unwanted time series. Only metrics matching the selector will be collected. - Logic: (pattern1 OR pattern2) AND !(pattern3 or pattern4) -- Pattern syntax: [selector](/src/go/collectors/go.d.plugin/pkg/prometheus/selector/README.md). +- Pattern syntax: [selector](/src/go/plugin/go.d/pkg/prometheus/selector/README.md). - Option syntax: ```yaml @@ -266,6 +265,8 @@ jobs: ### Debug Mode +**Important**: Debug mode is not supported for data collection jobs created via the UI using the Dyncfg feature. + To troubleshoot issues with the `prometheus` collector, run the `go.d.plugin` with the debug option enabled. The output should give you clues as to why the collector isn't working. @@ -288,4 +289,37 @@ should give you clues as to why the collector isn't working. ./go.d.plugin -d -m prometheus ``` +### Getting Logs + +If you're encountering problems with the `prometheus` collector, follow these steps to retrieve logs and identify potential issues: + +- **Run the command** specific to your system (systemd, non-systemd, or Docker container). +- **Examine the output** for any warnings or error messages that might indicate issues. These messages should provide clues about the root cause of the problem. + +#### System with systemd + +Use the following command to view logs generated since the last Netdata service restart: + +```bash +journalctl _SYSTEMD_INVOCATION_ID="$(systemctl show --value --property=InvocationID netdata)" --namespace=netdata --grep prometheus +``` + +#### System without systemd + +Locate the collector log file, typically at `/var/log/netdata/collector.log`, and use `grep` to filter for collector's name: + +```bash +grep prometheus /var/log/netdata/collector.log +``` + +**Note**: This method shows logs from all restarts. Focus on the **latest entries** for troubleshooting current issues. + +#### Docker Container + +If your Netdata runs in a Docker container named "netdata" (replace if different), use this command: + +```bash +docker logs netdata 2>&1 | grep prometheus +``` + diff --git a/src/go/collectors/go.d.plugin/modules/prometheus/integrations/hhvm.md b/src/go/plugin/go.d/modules/prometheus/integrations/hhvm.md index 20511dc13..4201947be 100644 --- a/src/go/collectors/go.d.plugin/modules/prometheus/integrations/hhvm.md +++ b/src/go/plugin/go.d/modules/prometheus/integrations/hhvm.md @@ -1,6 +1,6 @@ <!--startmeta -custom_edit_url: "https://github.com/netdata/netdata/edit/master/src/go/collectors/go.d.plugin/modules/prometheus/integrations/hhvm.md" -meta_yaml: "https://github.com/netdata/netdata/edit/master/src/go/collectors/go.d.plugin/modules/prometheus/metadata.yaml" +custom_edit_url: "https://github.com/netdata/netdata/edit/master/src/go/plugin/go.d/modules/prometheus/integrations/hhvm.md" +meta_yaml: "https://github.com/netdata/netdata/edit/master/src/go/plugin/go.d/modules/prometheus/metadata.yaml" sidebar_label: "HHVM" learn_status: "Published" learn_rel_path: "Collecting Metrics/Web Servers and Web Proxies" @@ -38,7 +38,6 @@ This collector supports collecting metrics from multiple instances of this integ #### Auto-Detection By default, it detects instances running on the local host by trying to connect to known ports that are [allocated to exporters](https://github.com/prometheus/prometheus/wiki/Default-port-allocations). -The full list of endpoints is available in the collector's [configuration file](https://github.com/netdata/netdata/blob/master/src/go/collectors/go.d.plugin/config/go.d/prometheus.conf). #### Limits @@ -139,7 +138,7 @@ The following options can be defined globally: update_every, autodetection_retry This option allows you to filter out unwanted time series. Only metrics matching the selector will be collected. - Logic: (pattern1 OR pattern2) AND !(pattern3 or pattern4) -- Pattern syntax: [selector](/src/go/collectors/go.d.plugin/pkg/prometheus/selector/README.md). +- Pattern syntax: [selector](/src/go/plugin/go.d/pkg/prometheus/selector/README.md). - Option syntax: ```yaml @@ -267,6 +266,8 @@ jobs: ### Debug Mode +**Important**: Debug mode is not supported for data collection jobs created via the UI using the Dyncfg feature. + To troubleshoot issues with the `prometheus` collector, run the `go.d.plugin` with the debug option enabled. The output should give you clues as to why the collector isn't working. @@ -289,4 +290,37 @@ should give you clues as to why the collector isn't working. ./go.d.plugin -d -m prometheus ``` +### Getting Logs + +If you're encountering problems with the `prometheus` collector, follow these steps to retrieve logs and identify potential issues: + +- **Run the command** specific to your system (systemd, non-systemd, or Docker container). +- **Examine the output** for any warnings or error messages that might indicate issues. These messages should provide clues about the root cause of the problem. + +#### System with systemd + +Use the following command to view logs generated since the last Netdata service restart: + +```bash +journalctl _SYSTEMD_INVOCATION_ID="$(systemctl show --value --property=InvocationID netdata)" --namespace=netdata --grep prometheus +``` + +#### System without systemd + +Locate the collector log file, typically at `/var/log/netdata/collector.log`, and use `grep` to filter for collector's name: + +```bash +grep prometheus /var/log/netdata/collector.log +``` + +**Note**: This method shows logs from all restarts. Focus on the **latest entries** for troubleshooting current issues. + +#### Docker Container + +If your Netdata runs in a Docker container named "netdata" (replace if different), use this command: + +```bash +docker logs netdata 2>&1 | grep prometheus +``` + diff --git a/src/go/collectors/go.d.plugin/modules/prometheus/integrations/hitron_cgn_series_cpe.md b/src/go/plugin/go.d/modules/prometheus/integrations/hitron_cgn_series_cpe.md index 519e76261..069062f61 100644 --- a/src/go/collectors/go.d.plugin/modules/prometheus/integrations/hitron_cgn_series_cpe.md +++ b/src/go/plugin/go.d/modules/prometheus/integrations/hitron_cgn_series_cpe.md @@ -1,6 +1,6 @@ <!--startmeta -custom_edit_url: "https://github.com/netdata/netdata/edit/master/src/go/collectors/go.d.plugin/modules/prometheus/integrations/hitron_cgn_series_cpe.md" -meta_yaml: "https://github.com/netdata/netdata/edit/master/src/go/collectors/go.d.plugin/modules/prometheus/metadata.yaml" +custom_edit_url: "https://github.com/netdata/netdata/edit/master/src/go/plugin/go.d/modules/prometheus/integrations/hitron_cgn_series_cpe.md" +meta_yaml: "https://github.com/netdata/netdata/edit/master/src/go/plugin/go.d/modules/prometheus/metadata.yaml" sidebar_label: "Hitron CGN series CPE" learn_status: "Published" learn_rel_path: "Collecting Metrics/Networking Stack and Network Interfaces" @@ -37,7 +37,6 @@ This collector supports collecting metrics from multiple instances of this integ #### Auto-Detection By default, it detects instances running on the local host by trying to connect to known ports that are [allocated to exporters](https://github.com/prometheus/prometheus/wiki/Default-port-allocations). -The full list of endpoints is available in the collector's [configuration file](https://github.com/netdata/netdata/blob/master/src/go/collectors/go.d.plugin/config/go.d/prometheus.conf). #### Limits @@ -138,7 +137,7 @@ The following options can be defined globally: update_every, autodetection_retry This option allows you to filter out unwanted time series. Only metrics matching the selector will be collected. - Logic: (pattern1 OR pattern2) AND !(pattern3 or pattern4) -- Pattern syntax: [selector](/src/go/collectors/go.d.plugin/pkg/prometheus/selector/README.md). +- Pattern syntax: [selector](/src/go/plugin/go.d/pkg/prometheus/selector/README.md). - Option syntax: ```yaml @@ -266,6 +265,8 @@ jobs: ### Debug Mode +**Important**: Debug mode is not supported for data collection jobs created via the UI using the Dyncfg feature. + To troubleshoot issues with the `prometheus` collector, run the `go.d.plugin` with the debug option enabled. The output should give you clues as to why the collector isn't working. @@ -288,4 +289,37 @@ should give you clues as to why the collector isn't working. ./go.d.plugin -d -m prometheus ``` +### Getting Logs + +If you're encountering problems with the `prometheus` collector, follow these steps to retrieve logs and identify potential issues: + +- **Run the command** specific to your system (systemd, non-systemd, or Docker container). +- **Examine the output** for any warnings or error messages that might indicate issues. These messages should provide clues about the root cause of the problem. + +#### System with systemd + +Use the following command to view logs generated since the last Netdata service restart: + +```bash +journalctl _SYSTEMD_INVOCATION_ID="$(systemctl show --value --property=InvocationID netdata)" --namespace=netdata --grep prometheus +``` + +#### System without systemd + +Locate the collector log file, typically at `/var/log/netdata/collector.log`, and use `grep` to filter for collector's name: + +```bash +grep prometheus /var/log/netdata/collector.log +``` + +**Note**: This method shows logs from all restarts. Focus on the **latest entries** for troubleshooting current issues. + +#### Docker Container + +If your Netdata runs in a Docker container named "netdata" (replace if different), use this command: + +```bash +docker logs netdata 2>&1 | grep prometheus +``` + diff --git a/src/go/collectors/go.d.plugin/modules/prometheus/integrations/hitron_coda_cable_modem.md b/src/go/plugin/go.d/modules/prometheus/integrations/hitron_coda_cable_modem.md index 17119f3af..c62b7b24a 100644 --- a/src/go/collectors/go.d.plugin/modules/prometheus/integrations/hitron_coda_cable_modem.md +++ b/src/go/plugin/go.d/modules/prometheus/integrations/hitron_coda_cable_modem.md @@ -1,6 +1,6 @@ <!--startmeta -custom_edit_url: "https://github.com/netdata/netdata/edit/master/src/go/collectors/go.d.plugin/modules/prometheus/integrations/hitron_coda_cable_modem.md" -meta_yaml: "https://github.com/netdata/netdata/edit/master/src/go/collectors/go.d.plugin/modules/prometheus/metadata.yaml" +custom_edit_url: "https://github.com/netdata/netdata/edit/master/src/go/plugin/go.d/modules/prometheus/integrations/hitron_coda_cable_modem.md" +meta_yaml: "https://github.com/netdata/netdata/edit/master/src/go/plugin/go.d/modules/prometheus/metadata.yaml" sidebar_label: "Hitron CODA Cable Modem" learn_status: "Published" learn_rel_path: "Collecting Metrics/Networking Stack and Network Interfaces" @@ -37,7 +37,6 @@ This collector supports collecting metrics from multiple instances of this integ #### Auto-Detection By default, it detects instances running on the local host by trying to connect to known ports that are [allocated to exporters](https://github.com/prometheus/prometheus/wiki/Default-port-allocations). -The full list of endpoints is available in the collector's [configuration file](https://github.com/netdata/netdata/blob/master/src/go/collectors/go.d.plugin/config/go.d/prometheus.conf). #### Limits @@ -138,7 +137,7 @@ The following options can be defined globally: update_every, autodetection_retry This option allows you to filter out unwanted time series. Only metrics matching the selector will be collected. - Logic: (pattern1 OR pattern2) AND !(pattern3 or pattern4) -- Pattern syntax: [selector](/src/go/collectors/go.d.plugin/pkg/prometheus/selector/README.md). +- Pattern syntax: [selector](/src/go/plugin/go.d/pkg/prometheus/selector/README.md). - Option syntax: ```yaml @@ -266,6 +265,8 @@ jobs: ### Debug Mode +**Important**: Debug mode is not supported for data collection jobs created via the UI using the Dyncfg feature. + To troubleshoot issues with the `prometheus` collector, run the `go.d.plugin` with the debug option enabled. The output should give you clues as to why the collector isn't working. @@ -288,4 +289,37 @@ should give you clues as to why the collector isn't working. ./go.d.plugin -d -m prometheus ``` +### Getting Logs + +If you're encountering problems with the `prometheus` collector, follow these steps to retrieve logs and identify potential issues: + +- **Run the command** specific to your system (systemd, non-systemd, or Docker container). +- **Examine the output** for any warnings or error messages that might indicate issues. These messages should provide clues about the root cause of the problem. + +#### System with systemd + +Use the following command to view logs generated since the last Netdata service restart: + +```bash +journalctl _SYSTEMD_INVOCATION_ID="$(systemctl show --value --property=InvocationID netdata)" --namespace=netdata --grep prometheus +``` + +#### System without systemd + +Locate the collector log file, typically at `/var/log/netdata/collector.log`, and use `grep` to filter for collector's name: + +```bash +grep prometheus /var/log/netdata/collector.log +``` + +**Note**: This method shows logs from all restarts. Focus on the **latest entries** for troubleshooting current issues. + +#### Docker Container + +If your Netdata runs in a Docker container named "netdata" (replace if different), use this command: + +```bash +docker logs netdata 2>&1 | grep prometheus +``` + diff --git a/src/go/collectors/go.d.plugin/modules/prometheus/integrations/homebridge.md b/src/go/plugin/go.d/modules/prometheus/integrations/homebridge.md index e7dba4735..ca56a7647 100644 --- a/src/go/collectors/go.d.plugin/modules/prometheus/integrations/homebridge.md +++ b/src/go/plugin/go.d/modules/prometheus/integrations/homebridge.md @@ -1,6 +1,6 @@ <!--startmeta -custom_edit_url: "https://github.com/netdata/netdata/edit/master/src/go/collectors/go.d.plugin/modules/prometheus/integrations/homebridge.md" -meta_yaml: "https://github.com/netdata/netdata/edit/master/src/go/collectors/go.d.plugin/modules/prometheus/metadata.yaml" +custom_edit_url: "https://github.com/netdata/netdata/edit/master/src/go/plugin/go.d/modules/prometheus/integrations/homebridge.md" +meta_yaml: "https://github.com/netdata/netdata/edit/master/src/go/plugin/go.d/modules/prometheus/metadata.yaml" sidebar_label: "Homebridge" learn_status: "Published" learn_rel_path: "Collecting Metrics/IoT Devices" @@ -37,7 +37,6 @@ This collector supports collecting metrics from multiple instances of this integ #### Auto-Detection By default, it detects instances running on the local host by trying to connect to known ports that are [allocated to exporters](https://github.com/prometheus/prometheus/wiki/Default-port-allocations). -The full list of endpoints is available in the collector's [configuration file](https://github.com/netdata/netdata/blob/master/src/go/collectors/go.d.plugin/config/go.d/prometheus.conf). #### Limits @@ -138,7 +137,7 @@ The following options can be defined globally: update_every, autodetection_retry This option allows you to filter out unwanted time series. Only metrics matching the selector will be collected. - Logic: (pattern1 OR pattern2) AND !(pattern3 or pattern4) -- Pattern syntax: [selector](/src/go/collectors/go.d.plugin/pkg/prometheus/selector/README.md). +- Pattern syntax: [selector](/src/go/plugin/go.d/pkg/prometheus/selector/README.md). - Option syntax: ```yaml @@ -266,6 +265,8 @@ jobs: ### Debug Mode +**Important**: Debug mode is not supported for data collection jobs created via the UI using the Dyncfg feature. + To troubleshoot issues with the `prometheus` collector, run the `go.d.plugin` with the debug option enabled. The output should give you clues as to why the collector isn't working. @@ -288,4 +289,37 @@ should give you clues as to why the collector isn't working. ./go.d.plugin -d -m prometheus ``` +### Getting Logs + +If you're encountering problems with the `prometheus` collector, follow these steps to retrieve logs and identify potential issues: + +- **Run the command** specific to your system (systemd, non-systemd, or Docker container). +- **Examine the output** for any warnings or error messages that might indicate issues. These messages should provide clues about the root cause of the problem. + +#### System with systemd + +Use the following command to view logs generated since the last Netdata service restart: + +```bash +journalctl _SYSTEMD_INVOCATION_ID="$(systemctl show --value --property=InvocationID netdata)" --namespace=netdata --grep prometheus +``` + +#### System without systemd + +Locate the collector log file, typically at `/var/log/netdata/collector.log`, and use `grep` to filter for collector's name: + +```bash +grep prometheus /var/log/netdata/collector.log +``` + +**Note**: This method shows logs from all restarts. Focus on the **latest entries** for troubleshooting current issues. + +#### Docker Container + +If your Netdata runs in a Docker container named "netdata" (replace if different), use this command: + +```bash +docker logs netdata 2>&1 | grep prometheus +``` + diff --git a/src/go/collectors/go.d.plugin/modules/prometheus/integrations/homey.md b/src/go/plugin/go.d/modules/prometheus/integrations/homey.md index cad04c0d6..b17aae574 100644 --- a/src/go/collectors/go.d.plugin/modules/prometheus/integrations/homey.md +++ b/src/go/plugin/go.d/modules/prometheus/integrations/homey.md @@ -1,6 +1,6 @@ <!--startmeta -custom_edit_url: "https://github.com/netdata/netdata/edit/master/src/go/collectors/go.d.plugin/modules/prometheus/integrations/homey.md" -meta_yaml: "https://github.com/netdata/netdata/edit/master/src/go/collectors/go.d.plugin/modules/prometheus/metadata.yaml" +custom_edit_url: "https://github.com/netdata/netdata/edit/master/src/go/plugin/go.d/modules/prometheus/integrations/homey.md" +meta_yaml: "https://github.com/netdata/netdata/edit/master/src/go/plugin/go.d/modules/prometheus/metadata.yaml" sidebar_label: "Homey" learn_status: "Published" learn_rel_path: "Collecting Metrics/IoT Devices" @@ -37,7 +37,6 @@ This collector supports collecting metrics from multiple instances of this integ #### Auto-Detection By default, it detects instances running on the local host by trying to connect to known ports that are [allocated to exporters](https://github.com/prometheus/prometheus/wiki/Default-port-allocations). -The full list of endpoints is available in the collector's [configuration file](https://github.com/netdata/netdata/blob/master/src/go/collectors/go.d.plugin/config/go.d/prometheus.conf). #### Limits @@ -138,7 +137,7 @@ The following options can be defined globally: update_every, autodetection_retry This option allows you to filter out unwanted time series. Only metrics matching the selector will be collected. - Logic: (pattern1 OR pattern2) AND !(pattern3 or pattern4) -- Pattern syntax: [selector](/src/go/collectors/go.d.plugin/pkg/prometheus/selector/README.md). +- Pattern syntax: [selector](/src/go/plugin/go.d/pkg/prometheus/selector/README.md). - Option syntax: ```yaml @@ -266,6 +265,8 @@ jobs: ### Debug Mode +**Important**: Debug mode is not supported for data collection jobs created via the UI using the Dyncfg feature. + To troubleshoot issues with the `prometheus` collector, run the `go.d.plugin` with the debug option enabled. The output should give you clues as to why the collector isn't working. @@ -288,4 +289,37 @@ should give you clues as to why the collector isn't working. ./go.d.plugin -d -m prometheus ``` +### Getting Logs + +If you're encountering problems with the `prometheus` collector, follow these steps to retrieve logs and identify potential issues: + +- **Run the command** specific to your system (systemd, non-systemd, or Docker container). +- **Examine the output** for any warnings or error messages that might indicate issues. These messages should provide clues about the root cause of the problem. + +#### System with systemd + +Use the following command to view logs generated since the last Netdata service restart: + +```bash +journalctl _SYSTEMD_INVOCATION_ID="$(systemctl show --value --property=InvocationID netdata)" --namespace=netdata --grep prometheus +``` + +#### System without systemd + +Locate the collector log file, typically at `/var/log/netdata/collector.log`, and use `grep` to filter for collector's name: + +```bash +grep prometheus /var/log/netdata/collector.log +``` + +**Note**: This method shows logs from all restarts. Focus on the **latest entries** for troubleshooting current issues. + +#### Docker Container + +If your Netdata runs in a Docker container named "netdata" (replace if different), use this command: + +```bash +docker logs netdata 2>&1 | grep prometheus +``` + diff --git a/src/go/collectors/go.d.plugin/modules/prometheus/integrations/honeypot.md b/src/go/plugin/go.d/modules/prometheus/integrations/honeypot.md index 70ab53506..28fdf70b2 100644 --- a/src/go/collectors/go.d.plugin/modules/prometheus/integrations/honeypot.md +++ b/src/go/plugin/go.d/modules/prometheus/integrations/honeypot.md @@ -1,6 +1,6 @@ <!--startmeta -custom_edit_url: "https://github.com/netdata/netdata/edit/master/src/go/collectors/go.d.plugin/modules/prometheus/integrations/honeypot.md" -meta_yaml: "https://github.com/netdata/netdata/edit/master/src/go/collectors/go.d.plugin/modules/prometheus/metadata.yaml" +custom_edit_url: "https://github.com/netdata/netdata/edit/master/src/go/plugin/go.d/modules/prometheus/integrations/honeypot.md" +meta_yaml: "https://github.com/netdata/netdata/edit/master/src/go/plugin/go.d/modules/prometheus/metadata.yaml" sidebar_label: "Honeypot" learn_status: "Published" learn_rel_path: "Collecting Metrics/Security Systems" @@ -37,7 +37,6 @@ This collector supports collecting metrics from multiple instances of this integ #### Auto-Detection By default, it detects instances running on the local host by trying to connect to known ports that are [allocated to exporters](https://github.com/prometheus/prometheus/wiki/Default-port-allocations). -The full list of endpoints is available in the collector's [configuration file](https://github.com/netdata/netdata/blob/master/src/go/collectors/go.d.plugin/config/go.d/prometheus.conf). #### Limits @@ -138,7 +137,7 @@ The following options can be defined globally: update_every, autodetection_retry This option allows you to filter out unwanted time series. Only metrics matching the selector will be collected. - Logic: (pattern1 OR pattern2) AND !(pattern3 or pattern4) -- Pattern syntax: [selector](/src/go/collectors/go.d.plugin/pkg/prometheus/selector/README.md). +- Pattern syntax: [selector](/src/go/plugin/go.d/pkg/prometheus/selector/README.md). - Option syntax: ```yaml @@ -266,6 +265,8 @@ jobs: ### Debug Mode +**Important**: Debug mode is not supported for data collection jobs created via the UI using the Dyncfg feature. + To troubleshoot issues with the `prometheus` collector, run the `go.d.plugin` with the debug option enabled. The output should give you clues as to why the collector isn't working. @@ -288,4 +289,37 @@ should give you clues as to why the collector isn't working. ./go.d.plugin -d -m prometheus ``` +### Getting Logs + +If you're encountering problems with the `prometheus` collector, follow these steps to retrieve logs and identify potential issues: + +- **Run the command** specific to your system (systemd, non-systemd, or Docker container). +- **Examine the output** for any warnings or error messages that might indicate issues. These messages should provide clues about the root cause of the problem. + +#### System with systemd + +Use the following command to view logs generated since the last Netdata service restart: + +```bash +journalctl _SYSTEMD_INVOCATION_ID="$(systemctl show --value --property=InvocationID netdata)" --namespace=netdata --grep prometheus +``` + +#### System without systemd + +Locate the collector log file, typically at `/var/log/netdata/collector.log`, and use `grep` to filter for collector's name: + +```bash +grep prometheus /var/log/netdata/collector.log +``` + +**Note**: This method shows logs from all restarts. Focus on the **latest entries** for troubleshooting current issues. + +#### Docker Container + +If your Netdata runs in a Docker container named "netdata" (replace if different), use this command: + +```bash +docker logs netdata 2>&1 | grep prometheus +``` + diff --git a/src/go/collectors/go.d.plugin/modules/prometheus/integrations/hp_ilo.md b/src/go/plugin/go.d/modules/prometheus/integrations/hp_ilo.md index 47a18b3da..54de557cb 100644 --- a/src/go/collectors/go.d.plugin/modules/prometheus/integrations/hp_ilo.md +++ b/src/go/plugin/go.d/modules/prometheus/integrations/hp_ilo.md @@ -1,6 +1,6 @@ <!--startmeta -custom_edit_url: "https://github.com/netdata/netdata/edit/master/src/go/collectors/go.d.plugin/modules/prometheus/integrations/hp_ilo.md" -meta_yaml: "https://github.com/netdata/netdata/edit/master/src/go/collectors/go.d.plugin/modules/prometheus/metadata.yaml" +custom_edit_url: "https://github.com/netdata/netdata/edit/master/src/go/plugin/go.d/modules/prometheus/integrations/hp_ilo.md" +meta_yaml: "https://github.com/netdata/netdata/edit/master/src/go/plugin/go.d/modules/prometheus/metadata.yaml" sidebar_label: "HP iLO" learn_status: "Published" learn_rel_path: "Collecting Metrics/Hardware Devices and Sensors" @@ -37,7 +37,6 @@ This collector supports collecting metrics from multiple instances of this integ #### Auto-Detection By default, it detects instances running on the local host by trying to connect to known ports that are [allocated to exporters](https://github.com/prometheus/prometheus/wiki/Default-port-allocations). -The full list of endpoints is available in the collector's [configuration file](https://github.com/netdata/netdata/blob/master/src/go/collectors/go.d.plugin/config/go.d/prometheus.conf). #### Limits @@ -138,7 +137,7 @@ The following options can be defined globally: update_every, autodetection_retry This option allows you to filter out unwanted time series. Only metrics matching the selector will be collected. - Logic: (pattern1 OR pattern2) AND !(pattern3 or pattern4) -- Pattern syntax: [selector](/src/go/collectors/go.d.plugin/pkg/prometheus/selector/README.md). +- Pattern syntax: [selector](/src/go/plugin/go.d/pkg/prometheus/selector/README.md). - Option syntax: ```yaml @@ -266,6 +265,8 @@ jobs: ### Debug Mode +**Important**: Debug mode is not supported for data collection jobs created via the UI using the Dyncfg feature. + To troubleshoot issues with the `prometheus` collector, run the `go.d.plugin` with the debug option enabled. The output should give you clues as to why the collector isn't working. @@ -288,4 +289,37 @@ should give you clues as to why the collector isn't working. ./go.d.plugin -d -m prometheus ``` +### Getting Logs + +If you're encountering problems with the `prometheus` collector, follow these steps to retrieve logs and identify potential issues: + +- **Run the command** specific to your system (systemd, non-systemd, or Docker container). +- **Examine the output** for any warnings or error messages that might indicate issues. These messages should provide clues about the root cause of the problem. + +#### System with systemd + +Use the following command to view logs generated since the last Netdata service restart: + +```bash +journalctl _SYSTEMD_INVOCATION_ID="$(systemctl show --value --property=InvocationID netdata)" --namespace=netdata --grep prometheus +``` + +#### System without systemd + +Locate the collector log file, typically at `/var/log/netdata/collector.log`, and use `grep` to filter for collector's name: + +```bash +grep prometheus /var/log/netdata/collector.log +``` + +**Note**: This method shows logs from all restarts. Focus on the **latest entries** for troubleshooting current issues. + +#### Docker Container + +If your Netdata runs in a Docker container named "netdata" (replace if different), use this command: + +```bash +docker logs netdata 2>&1 | grep prometheus +``` + diff --git a/src/go/collectors/go.d.plugin/modules/prometheus/integrations/huawei_devices.md b/src/go/plugin/go.d/modules/prometheus/integrations/huawei_devices.md index 1e4e207ed..2f1e95733 100644 --- a/src/go/collectors/go.d.plugin/modules/prometheus/integrations/huawei_devices.md +++ b/src/go/plugin/go.d/modules/prometheus/integrations/huawei_devices.md @@ -1,6 +1,6 @@ <!--startmeta -custom_edit_url: "https://github.com/netdata/netdata/edit/master/src/go/collectors/go.d.plugin/modules/prometheus/integrations/huawei_devices.md" -meta_yaml: "https://github.com/netdata/netdata/edit/master/src/go/collectors/go.d.plugin/modules/prometheus/metadata.yaml" +custom_edit_url: "https://github.com/netdata/netdata/edit/master/src/go/plugin/go.d/modules/prometheus/integrations/huawei_devices.md" +meta_yaml: "https://github.com/netdata/netdata/edit/master/src/go/plugin/go.d/modules/prometheus/metadata.yaml" sidebar_label: "Huawei devices" learn_status: "Published" learn_rel_path: "Collecting Metrics/Networking Stack and Network Interfaces" @@ -37,7 +37,6 @@ This collector supports collecting metrics from multiple instances of this integ #### Auto-Detection By default, it detects instances running on the local host by trying to connect to known ports that are [allocated to exporters](https://github.com/prometheus/prometheus/wiki/Default-port-allocations). -The full list of endpoints is available in the collector's [configuration file](https://github.com/netdata/netdata/blob/master/src/go/collectors/go.d.plugin/config/go.d/prometheus.conf). #### Limits @@ -138,7 +137,7 @@ The following options can be defined globally: update_every, autodetection_retry This option allows you to filter out unwanted time series. Only metrics matching the selector will be collected. - Logic: (pattern1 OR pattern2) AND !(pattern3 or pattern4) -- Pattern syntax: [selector](/src/go/collectors/go.d.plugin/pkg/prometheus/selector/README.md). +- Pattern syntax: [selector](/src/go/plugin/go.d/pkg/prometheus/selector/README.md). - Option syntax: ```yaml @@ -266,6 +265,8 @@ jobs: ### Debug Mode +**Important**: Debug mode is not supported for data collection jobs created via the UI using the Dyncfg feature. + To troubleshoot issues with the `prometheus` collector, run the `go.d.plugin` with the debug option enabled. The output should give you clues as to why the collector isn't working. @@ -288,4 +289,37 @@ should give you clues as to why the collector isn't working. ./go.d.plugin -d -m prometheus ``` +### Getting Logs + +If you're encountering problems with the `prometheus` collector, follow these steps to retrieve logs and identify potential issues: + +- **Run the command** specific to your system (systemd, non-systemd, or Docker container). +- **Examine the output** for any warnings or error messages that might indicate issues. These messages should provide clues about the root cause of the problem. + +#### System with systemd + +Use the following command to view logs generated since the last Netdata service restart: + +```bash +journalctl _SYSTEMD_INVOCATION_ID="$(systemctl show --value --property=InvocationID netdata)" --namespace=netdata --grep prometheus +``` + +#### System without systemd + +Locate the collector log file, typically at `/var/log/netdata/collector.log`, and use `grep` to filter for collector's name: + +```bash +grep prometheus /var/log/netdata/collector.log +``` + +**Note**: This method shows logs from all restarts. Focus on the **latest entries** for troubleshooting current issues. + +#### Docker Container + +If your Netdata runs in a Docker container named "netdata" (replace if different), use this command: + +```bash +docker logs netdata 2>&1 | grep prometheus +``` + diff --git a/src/go/collectors/go.d.plugin/modules/prometheus/integrations/hubble.md b/src/go/plugin/go.d/modules/prometheus/integrations/hubble.md index ebfb34698..36bd86d69 100644 --- a/src/go/collectors/go.d.plugin/modules/prometheus/integrations/hubble.md +++ b/src/go/plugin/go.d/modules/prometheus/integrations/hubble.md @@ -1,6 +1,6 @@ <!--startmeta -custom_edit_url: "https://github.com/netdata/netdata/edit/master/src/go/collectors/go.d.plugin/modules/prometheus/integrations/hubble.md" -meta_yaml: "https://github.com/netdata/netdata/edit/master/src/go/collectors/go.d.plugin/modules/prometheus/metadata.yaml" +custom_edit_url: "https://github.com/netdata/netdata/edit/master/src/go/plugin/go.d/modules/prometheus/integrations/hubble.md" +meta_yaml: "https://github.com/netdata/netdata/edit/master/src/go/plugin/go.d/modules/prometheus/metadata.yaml" sidebar_label: "Hubble" learn_status: "Published" learn_rel_path: "Collecting Metrics/Observability" @@ -37,7 +37,6 @@ This collector supports collecting metrics from multiple instances of this integ #### Auto-Detection By default, it detects instances running on the local host by trying to connect to known ports that are [allocated to exporters](https://github.com/prometheus/prometheus/wiki/Default-port-allocations). -The full list of endpoints is available in the collector's [configuration file](https://github.com/netdata/netdata/blob/master/src/go/collectors/go.d.plugin/config/go.d/prometheus.conf). #### Limits @@ -138,7 +137,7 @@ The following options can be defined globally: update_every, autodetection_retry This option allows you to filter out unwanted time series. Only metrics matching the selector will be collected. - Logic: (pattern1 OR pattern2) AND !(pattern3 or pattern4) -- Pattern syntax: [selector](/src/go/collectors/go.d.plugin/pkg/prometheus/selector/README.md). +- Pattern syntax: [selector](/src/go/plugin/go.d/pkg/prometheus/selector/README.md). - Option syntax: ```yaml @@ -266,6 +265,8 @@ jobs: ### Debug Mode +**Important**: Debug mode is not supported for data collection jobs created via the UI using the Dyncfg feature. + To troubleshoot issues with the `prometheus` collector, run the `go.d.plugin` with the debug option enabled. The output should give you clues as to why the collector isn't working. @@ -288,4 +289,37 @@ should give you clues as to why the collector isn't working. ./go.d.plugin -d -m prometheus ``` +### Getting Logs + +If you're encountering problems with the `prometheus` collector, follow these steps to retrieve logs and identify potential issues: + +- **Run the command** specific to your system (systemd, non-systemd, or Docker container). +- **Examine the output** for any warnings or error messages that might indicate issues. These messages should provide clues about the root cause of the problem. + +#### System with systemd + +Use the following command to view logs generated since the last Netdata service restart: + +```bash +journalctl _SYSTEMD_INVOCATION_ID="$(systemctl show --value --property=InvocationID netdata)" --namespace=netdata --grep prometheus +``` + +#### System without systemd + +Locate the collector log file, typically at `/var/log/netdata/collector.log`, and use `grep` to filter for collector's name: + +```bash +grep prometheus /var/log/netdata/collector.log +``` + +**Note**: This method shows logs from all restarts. Focus on the **latest entries** for troubleshooting current issues. + +#### Docker Container + +If your Netdata runs in a Docker container named "netdata" (replace if different), use this command: + +```bash +docker logs netdata 2>&1 | grep prometheus +``` + diff --git a/src/go/collectors/go.d.plugin/modules/prometheus/integrations/ibm_aix_systems_njmon.md b/src/go/plugin/go.d/modules/prometheus/integrations/ibm_aix_systems_njmon.md index 0b9a60271..5a4499e6a 100644 --- a/src/go/collectors/go.d.plugin/modules/prometheus/integrations/ibm_aix_systems_njmon.md +++ b/src/go/plugin/go.d/modules/prometheus/integrations/ibm_aix_systems_njmon.md @@ -1,6 +1,6 @@ <!--startmeta -custom_edit_url: "https://github.com/netdata/netdata/edit/master/src/go/collectors/go.d.plugin/modules/prometheus/integrations/ibm_aix_systems_njmon.md" -meta_yaml: "https://github.com/netdata/netdata/edit/master/src/go/collectors/go.d.plugin/modules/prometheus/metadata.yaml" +custom_edit_url: "https://github.com/netdata/netdata/edit/master/src/go/plugin/go.d/modules/prometheus/integrations/ibm_aix_systems_njmon.md" +meta_yaml: "https://github.com/netdata/netdata/edit/master/src/go/plugin/go.d/modules/prometheus/metadata.yaml" sidebar_label: "IBM AIX systems Njmon" learn_status: "Published" learn_rel_path: "Collecting Metrics/APM" @@ -37,7 +37,6 @@ This collector supports collecting metrics from multiple instances of this integ #### Auto-Detection By default, it detects instances running on the local host by trying to connect to known ports that are [allocated to exporters](https://github.com/prometheus/prometheus/wiki/Default-port-allocations). -The full list of endpoints is available in the collector's [configuration file](https://github.com/netdata/netdata/blob/master/src/go/collectors/go.d.plugin/config/go.d/prometheus.conf). #### Limits @@ -138,7 +137,7 @@ The following options can be defined globally: update_every, autodetection_retry This option allows you to filter out unwanted time series. Only metrics matching the selector will be collected. - Logic: (pattern1 OR pattern2) AND !(pattern3 or pattern4) -- Pattern syntax: [selector](/src/go/collectors/go.d.plugin/pkg/prometheus/selector/README.md). +- Pattern syntax: [selector](/src/go/plugin/go.d/pkg/prometheus/selector/README.md). - Option syntax: ```yaml @@ -266,6 +265,8 @@ jobs: ### Debug Mode +**Important**: Debug mode is not supported for data collection jobs created via the UI using the Dyncfg feature. + To troubleshoot issues with the `prometheus` collector, run the `go.d.plugin` with the debug option enabled. The output should give you clues as to why the collector isn't working. @@ -288,4 +289,37 @@ should give you clues as to why the collector isn't working. ./go.d.plugin -d -m prometheus ``` +### Getting Logs + +If you're encountering problems with the `prometheus` collector, follow these steps to retrieve logs and identify potential issues: + +- **Run the command** specific to your system (systemd, non-systemd, or Docker container). +- **Examine the output** for any warnings or error messages that might indicate issues. These messages should provide clues about the root cause of the problem. + +#### System with systemd + +Use the following command to view logs generated since the last Netdata service restart: + +```bash +journalctl _SYSTEMD_INVOCATION_ID="$(systemctl show --value --property=InvocationID netdata)" --namespace=netdata --grep prometheus +``` + +#### System without systemd + +Locate the collector log file, typically at `/var/log/netdata/collector.log`, and use `grep` to filter for collector's name: + +```bash +grep prometheus /var/log/netdata/collector.log +``` + +**Note**: This method shows logs from all restarts. Focus on the **latest entries** for troubleshooting current issues. + +#### Docker Container + +If your Netdata runs in a Docker container named "netdata" (replace if different), use this command: + +```bash +docker logs netdata 2>&1 | grep prometheus +``` + diff --git a/src/go/collectors/go.d.plugin/modules/prometheus/integrations/ibm_cryptoexpress_cex_cards.md b/src/go/plugin/go.d/modules/prometheus/integrations/ibm_cryptoexpress_cex_cards.md index e745b88ca..f32cdd0c4 100644 --- a/src/go/collectors/go.d.plugin/modules/prometheus/integrations/ibm_cryptoexpress_cex_cards.md +++ b/src/go/plugin/go.d/modules/prometheus/integrations/ibm_cryptoexpress_cex_cards.md @@ -1,6 +1,6 @@ <!--startmeta -custom_edit_url: "https://github.com/netdata/netdata/edit/master/src/go/collectors/go.d.plugin/modules/prometheus/integrations/ibm_cryptoexpress_cex_cards.md" -meta_yaml: "https://github.com/netdata/netdata/edit/master/src/go/collectors/go.d.plugin/modules/prometheus/metadata.yaml" +custom_edit_url: "https://github.com/netdata/netdata/edit/master/src/go/plugin/go.d/modules/prometheus/integrations/ibm_cryptoexpress_cex_cards.md" +meta_yaml: "https://github.com/netdata/netdata/edit/master/src/go/plugin/go.d/modules/prometheus/metadata.yaml" sidebar_label: "IBM CryptoExpress (CEX) cards" learn_status: "Published" learn_rel_path: "Collecting Metrics/Hardware Devices and Sensors" @@ -37,7 +37,6 @@ This collector supports collecting metrics from multiple instances of this integ #### Auto-Detection By default, it detects instances running on the local host by trying to connect to known ports that are [allocated to exporters](https://github.com/prometheus/prometheus/wiki/Default-port-allocations). -The full list of endpoints is available in the collector's [configuration file](https://github.com/netdata/netdata/blob/master/src/go/collectors/go.d.plugin/config/go.d/prometheus.conf). #### Limits @@ -138,7 +137,7 @@ The following options can be defined globally: update_every, autodetection_retry This option allows you to filter out unwanted time series. Only metrics matching the selector will be collected. - Logic: (pattern1 OR pattern2) AND !(pattern3 or pattern4) -- Pattern syntax: [selector](/src/go/collectors/go.d.plugin/pkg/prometheus/selector/README.md). +- Pattern syntax: [selector](/src/go/plugin/go.d/pkg/prometheus/selector/README.md). - Option syntax: ```yaml @@ -266,6 +265,8 @@ jobs: ### Debug Mode +**Important**: Debug mode is not supported for data collection jobs created via the UI using the Dyncfg feature. + To troubleshoot issues with the `prometheus` collector, run the `go.d.plugin` with the debug option enabled. The output should give you clues as to why the collector isn't working. @@ -288,4 +289,37 @@ should give you clues as to why the collector isn't working. ./go.d.plugin -d -m prometheus ``` +### Getting Logs + +If you're encountering problems with the `prometheus` collector, follow these steps to retrieve logs and identify potential issues: + +- **Run the command** specific to your system (systemd, non-systemd, or Docker container). +- **Examine the output** for any warnings or error messages that might indicate issues. These messages should provide clues about the root cause of the problem. + +#### System with systemd + +Use the following command to view logs generated since the last Netdata service restart: + +```bash +journalctl _SYSTEMD_INVOCATION_ID="$(systemctl show --value --property=InvocationID netdata)" --namespace=netdata --grep prometheus +``` + +#### System without systemd + +Locate the collector log file, typically at `/var/log/netdata/collector.log`, and use `grep` to filter for collector's name: + +```bash +grep prometheus /var/log/netdata/collector.log +``` + +**Note**: This method shows logs from all restarts. Focus on the **latest entries** for troubleshooting current issues. + +#### Docker Container + +If your Netdata runs in a Docker container named "netdata" (replace if different), use this command: + +```bash +docker logs netdata 2>&1 | grep prometheus +``` + diff --git a/src/go/collectors/go.d.plugin/modules/prometheus/integrations/ibm_mq.md b/src/go/plugin/go.d/modules/prometheus/integrations/ibm_mq.md index a07219227..d41219bbb 100644 --- a/src/go/collectors/go.d.plugin/modules/prometheus/integrations/ibm_mq.md +++ b/src/go/plugin/go.d/modules/prometheus/integrations/ibm_mq.md @@ -1,6 +1,6 @@ <!--startmeta -custom_edit_url: "https://github.com/netdata/netdata/edit/master/src/go/collectors/go.d.plugin/modules/prometheus/integrations/ibm_mq.md" -meta_yaml: "https://github.com/netdata/netdata/edit/master/src/go/collectors/go.d.plugin/modules/prometheus/metadata.yaml" +custom_edit_url: "https://github.com/netdata/netdata/edit/master/src/go/plugin/go.d/modules/prometheus/integrations/ibm_mq.md" +meta_yaml: "https://github.com/netdata/netdata/edit/master/src/go/plugin/go.d/modules/prometheus/metadata.yaml" sidebar_label: "IBM MQ" learn_status: "Published" learn_rel_path: "Collecting Metrics/Message Brokers" @@ -37,7 +37,6 @@ This collector supports collecting metrics from multiple instances of this integ #### Auto-Detection By default, it detects instances running on the local host by trying to connect to known ports that are [allocated to exporters](https://github.com/prometheus/prometheus/wiki/Default-port-allocations). -The full list of endpoints is available in the collector's [configuration file](https://github.com/netdata/netdata/blob/master/src/go/collectors/go.d.plugin/config/go.d/prometheus.conf). #### Limits @@ -138,7 +137,7 @@ The following options can be defined globally: update_every, autodetection_retry This option allows you to filter out unwanted time series. Only metrics matching the selector will be collected. - Logic: (pattern1 OR pattern2) AND !(pattern3 or pattern4) -- Pattern syntax: [selector](/src/go/collectors/go.d.plugin/pkg/prometheus/selector/README.md). +- Pattern syntax: [selector](/src/go/plugin/go.d/pkg/prometheus/selector/README.md). - Option syntax: ```yaml @@ -266,6 +265,8 @@ jobs: ### Debug Mode +**Important**: Debug mode is not supported for data collection jobs created via the UI using the Dyncfg feature. + To troubleshoot issues with the `prometheus` collector, run the `go.d.plugin` with the debug option enabled. The output should give you clues as to why the collector isn't working. @@ -288,4 +289,37 @@ should give you clues as to why the collector isn't working. ./go.d.plugin -d -m prometheus ``` +### Getting Logs + +If you're encountering problems with the `prometheus` collector, follow these steps to retrieve logs and identify potential issues: + +- **Run the command** specific to your system (systemd, non-systemd, or Docker container). +- **Examine the output** for any warnings or error messages that might indicate issues. These messages should provide clues about the root cause of the problem. + +#### System with systemd + +Use the following command to view logs generated since the last Netdata service restart: + +```bash +journalctl _SYSTEMD_INVOCATION_ID="$(systemctl show --value --property=InvocationID netdata)" --namespace=netdata --grep prometheus +``` + +#### System without systemd + +Locate the collector log file, typically at `/var/log/netdata/collector.log`, and use `grep` to filter for collector's name: + +```bash +grep prometheus /var/log/netdata/collector.log +``` + +**Note**: This method shows logs from all restarts. Focus on the **latest entries** for troubleshooting current issues. + +#### Docker Container + +If your Netdata runs in a Docker container named "netdata" (replace if different), use this command: + +```bash +docker logs netdata 2>&1 | grep prometheus +``` + diff --git a/src/go/collectors/go.d.plugin/modules/prometheus/integrations/ibm_spectrum.md b/src/go/plugin/go.d/modules/prometheus/integrations/ibm_spectrum.md index f1bff1f6d..edffab950 100644 --- a/src/go/collectors/go.d.plugin/modules/prometheus/integrations/ibm_spectrum.md +++ b/src/go/plugin/go.d/modules/prometheus/integrations/ibm_spectrum.md @@ -1,6 +1,6 @@ <!--startmeta -custom_edit_url: "https://github.com/netdata/netdata/edit/master/src/go/collectors/go.d.plugin/modules/prometheus/integrations/ibm_spectrum.md" -meta_yaml: "https://github.com/netdata/netdata/edit/master/src/go/collectors/go.d.plugin/modules/prometheus/metadata.yaml" +custom_edit_url: "https://github.com/netdata/netdata/edit/master/src/go/plugin/go.d/modules/prometheus/integrations/ibm_spectrum.md" +meta_yaml: "https://github.com/netdata/netdata/edit/master/src/go/plugin/go.d/modules/prometheus/metadata.yaml" sidebar_label: "IBM Spectrum" learn_status: "Published" learn_rel_path: "Collecting Metrics/Storage, Mount Points and Filesystems" @@ -37,7 +37,6 @@ This collector supports collecting metrics from multiple instances of this integ #### Auto-Detection By default, it detects instances running on the local host by trying to connect to known ports that are [allocated to exporters](https://github.com/prometheus/prometheus/wiki/Default-port-allocations). -The full list of endpoints is available in the collector's [configuration file](https://github.com/netdata/netdata/blob/master/src/go/collectors/go.d.plugin/config/go.d/prometheus.conf). #### Limits @@ -138,7 +137,7 @@ The following options can be defined globally: update_every, autodetection_retry This option allows you to filter out unwanted time series. Only metrics matching the selector will be collected. - Logic: (pattern1 OR pattern2) AND !(pattern3 or pattern4) -- Pattern syntax: [selector](/src/go/collectors/go.d.plugin/pkg/prometheus/selector/README.md). +- Pattern syntax: [selector](/src/go/plugin/go.d/pkg/prometheus/selector/README.md). - Option syntax: ```yaml @@ -266,6 +265,8 @@ jobs: ### Debug Mode +**Important**: Debug mode is not supported for data collection jobs created via the UI using the Dyncfg feature. + To troubleshoot issues with the `prometheus` collector, run the `go.d.plugin` with the debug option enabled. The output should give you clues as to why the collector isn't working. @@ -288,4 +289,37 @@ should give you clues as to why the collector isn't working. ./go.d.plugin -d -m prometheus ``` +### Getting Logs + +If you're encountering problems with the `prometheus` collector, follow these steps to retrieve logs and identify potential issues: + +- **Run the command** specific to your system (systemd, non-systemd, or Docker container). +- **Examine the output** for any warnings or error messages that might indicate issues. These messages should provide clues about the root cause of the problem. + +#### System with systemd + +Use the following command to view logs generated since the last Netdata service restart: + +```bash +journalctl _SYSTEMD_INVOCATION_ID="$(systemctl show --value --property=InvocationID netdata)" --namespace=netdata --grep prometheus +``` + +#### System without systemd + +Locate the collector log file, typically at `/var/log/netdata/collector.log`, and use `grep` to filter for collector's name: + +```bash +grep prometheus /var/log/netdata/collector.log +``` + +**Note**: This method shows logs from all restarts. Focus on the **latest entries** for troubleshooting current issues. + +#### Docker Container + +If your Netdata runs in a Docker container named "netdata" (replace if different), use this command: + +```bash +docker logs netdata 2>&1 | grep prometheus +``` + diff --git a/src/go/collectors/go.d.plugin/modules/prometheus/integrations/ibm_spectrum_virtualize.md b/src/go/plugin/go.d/modules/prometheus/integrations/ibm_spectrum_virtualize.md index de55933d5..5d3dab9e7 100644 --- a/src/go/collectors/go.d.plugin/modules/prometheus/integrations/ibm_spectrum_virtualize.md +++ b/src/go/plugin/go.d/modules/prometheus/integrations/ibm_spectrum_virtualize.md @@ -1,6 +1,6 @@ <!--startmeta -custom_edit_url: "https://github.com/netdata/netdata/edit/master/src/go/collectors/go.d.plugin/modules/prometheus/integrations/ibm_spectrum_virtualize.md" -meta_yaml: "https://github.com/netdata/netdata/edit/master/src/go/collectors/go.d.plugin/modules/prometheus/metadata.yaml" +custom_edit_url: "https://github.com/netdata/netdata/edit/master/src/go/plugin/go.d/modules/prometheus/integrations/ibm_spectrum_virtualize.md" +meta_yaml: "https://github.com/netdata/netdata/edit/master/src/go/plugin/go.d/modules/prometheus/metadata.yaml" sidebar_label: "IBM Spectrum Virtualize" learn_status: "Published" learn_rel_path: "Collecting Metrics/Storage, Mount Points and Filesystems" @@ -37,7 +37,6 @@ This collector supports collecting metrics from multiple instances of this integ #### Auto-Detection By default, it detects instances running on the local host by trying to connect to known ports that are [allocated to exporters](https://github.com/prometheus/prometheus/wiki/Default-port-allocations). -The full list of endpoints is available in the collector's [configuration file](https://github.com/netdata/netdata/blob/master/src/go/collectors/go.d.plugin/config/go.d/prometheus.conf). #### Limits @@ -138,7 +137,7 @@ The following options can be defined globally: update_every, autodetection_retry This option allows you to filter out unwanted time series. Only metrics matching the selector will be collected. - Logic: (pattern1 OR pattern2) AND !(pattern3 or pattern4) -- Pattern syntax: [selector](/src/go/collectors/go.d.plugin/pkg/prometheus/selector/README.md). +- Pattern syntax: [selector](/src/go/plugin/go.d/pkg/prometheus/selector/README.md). - Option syntax: ```yaml @@ -266,6 +265,8 @@ jobs: ### Debug Mode +**Important**: Debug mode is not supported for data collection jobs created via the UI using the Dyncfg feature. + To troubleshoot issues with the `prometheus` collector, run the `go.d.plugin` with the debug option enabled. The output should give you clues as to why the collector isn't working. @@ -288,4 +289,37 @@ should give you clues as to why the collector isn't working. ./go.d.plugin -d -m prometheus ``` +### Getting Logs + +If you're encountering problems with the `prometheus` collector, follow these steps to retrieve logs and identify potential issues: + +- **Run the command** specific to your system (systemd, non-systemd, or Docker container). +- **Examine the output** for any warnings or error messages that might indicate issues. These messages should provide clues about the root cause of the problem. + +#### System with systemd + +Use the following command to view logs generated since the last Netdata service restart: + +```bash +journalctl _SYSTEMD_INVOCATION_ID="$(systemctl show --value --property=InvocationID netdata)" --namespace=netdata --grep prometheus +``` + +#### System without systemd + +Locate the collector log file, typically at `/var/log/netdata/collector.log`, and use `grep` to filter for collector's name: + +```bash +grep prometheus /var/log/netdata/collector.log +``` + +**Note**: This method shows logs from all restarts. Focus on the **latest entries** for troubleshooting current issues. + +#### Docker Container + +If your Netdata runs in a Docker container named "netdata" (replace if different), use this command: + +```bash +docker logs netdata 2>&1 | grep prometheus +``` + diff --git a/src/go/collectors/go.d.plugin/modules/prometheus/integrations/ibm_z_hardware_management_console.md b/src/go/plugin/go.d/modules/prometheus/integrations/ibm_z_hardware_management_console.md index 715c6a4e0..5cca9c2ae 100644 --- a/src/go/collectors/go.d.plugin/modules/prometheus/integrations/ibm_z_hardware_management_console.md +++ b/src/go/plugin/go.d/modules/prometheus/integrations/ibm_z_hardware_management_console.md @@ -1,6 +1,6 @@ <!--startmeta -custom_edit_url: "https://github.com/netdata/netdata/edit/master/src/go/collectors/go.d.plugin/modules/prometheus/integrations/ibm_z_hardware_management_console.md" -meta_yaml: "https://github.com/netdata/netdata/edit/master/src/go/collectors/go.d.plugin/modules/prometheus/metadata.yaml" +custom_edit_url: "https://github.com/netdata/netdata/edit/master/src/go/plugin/go.d/modules/prometheus/integrations/ibm_z_hardware_management_console.md" +meta_yaml: "https://github.com/netdata/netdata/edit/master/src/go/plugin/go.d/modules/prometheus/metadata.yaml" sidebar_label: "IBM Z Hardware Management Console" learn_status: "Published" learn_rel_path: "Collecting Metrics/Hardware Devices and Sensors" @@ -37,7 +37,6 @@ This collector supports collecting metrics from multiple instances of this integ #### Auto-Detection By default, it detects instances running on the local host by trying to connect to known ports that are [allocated to exporters](https://github.com/prometheus/prometheus/wiki/Default-port-allocations). -The full list of endpoints is available in the collector's [configuration file](https://github.com/netdata/netdata/blob/master/src/go/collectors/go.d.plugin/config/go.d/prometheus.conf). #### Limits @@ -138,7 +137,7 @@ The following options can be defined globally: update_every, autodetection_retry This option allows you to filter out unwanted time series. Only metrics matching the selector will be collected. - Logic: (pattern1 OR pattern2) AND !(pattern3 or pattern4) -- Pattern syntax: [selector](/src/go/collectors/go.d.plugin/pkg/prometheus/selector/README.md). +- Pattern syntax: [selector](/src/go/plugin/go.d/pkg/prometheus/selector/README.md). - Option syntax: ```yaml @@ -266,6 +265,8 @@ jobs: ### Debug Mode +**Important**: Debug mode is not supported for data collection jobs created via the UI using the Dyncfg feature. + To troubleshoot issues with the `prometheus` collector, run the `go.d.plugin` with the debug option enabled. The output should give you clues as to why the collector isn't working. @@ -288,4 +289,37 @@ should give you clues as to why the collector isn't working. ./go.d.plugin -d -m prometheus ``` +### Getting Logs + +If you're encountering problems with the `prometheus` collector, follow these steps to retrieve logs and identify potential issues: + +- **Run the command** specific to your system (systemd, non-systemd, or Docker container). +- **Examine the output** for any warnings or error messages that might indicate issues. These messages should provide clues about the root cause of the problem. + +#### System with systemd + +Use the following command to view logs generated since the last Netdata service restart: + +```bash +journalctl _SYSTEMD_INVOCATION_ID="$(systemctl show --value --property=InvocationID netdata)" --namespace=netdata --grep prometheus +``` + +#### System without systemd + +Locate the collector log file, typically at `/var/log/netdata/collector.log`, and use `grep` to filter for collector's name: + +```bash +grep prometheus /var/log/netdata/collector.log +``` + +**Note**: This method shows logs from all restarts. Focus on the **latest entries** for troubleshooting current issues. + +#### Docker Container + +If your Netdata runs in a Docker container named "netdata" (replace if different), use this command: + +```bash +docker logs netdata 2>&1 | grep prometheus +``` + diff --git a/src/go/collectors/go.d.plugin/modules/prometheus/integrations/influxdb.md b/src/go/plugin/go.d/modules/prometheus/integrations/influxdb.md index 11b340d33..817144efb 100644 --- a/src/go/collectors/go.d.plugin/modules/prometheus/integrations/influxdb.md +++ b/src/go/plugin/go.d/modules/prometheus/integrations/influxdb.md @@ -1,6 +1,6 @@ <!--startmeta -custom_edit_url: "https://github.com/netdata/netdata/edit/master/src/go/collectors/go.d.plugin/modules/prometheus/integrations/influxdb.md" -meta_yaml: "https://github.com/netdata/netdata/edit/master/src/go/collectors/go.d.plugin/modules/prometheus/metadata.yaml" +custom_edit_url: "https://github.com/netdata/netdata/edit/master/src/go/plugin/go.d/modules/prometheus/integrations/influxdb.md" +meta_yaml: "https://github.com/netdata/netdata/edit/master/src/go/plugin/go.d/modules/prometheus/metadata.yaml" sidebar_label: "InfluxDB" learn_status: "Published" learn_rel_path: "Collecting Metrics/Databases" @@ -37,7 +37,6 @@ This collector supports collecting metrics from multiple instances of this integ #### Auto-Detection By default, it detects instances running on the local host by trying to connect to known ports that are [allocated to exporters](https://github.com/prometheus/prometheus/wiki/Default-port-allocations). -The full list of endpoints is available in the collector's [configuration file](https://github.com/netdata/netdata/blob/master/src/go/collectors/go.d.plugin/config/go.d/prometheus.conf). #### Limits @@ -138,7 +137,7 @@ The following options can be defined globally: update_every, autodetection_retry This option allows you to filter out unwanted time series. Only metrics matching the selector will be collected. - Logic: (pattern1 OR pattern2) AND !(pattern3 or pattern4) -- Pattern syntax: [selector](/src/go/collectors/go.d.plugin/pkg/prometheus/selector/README.md). +- Pattern syntax: [selector](/src/go/plugin/go.d/pkg/prometheus/selector/README.md). - Option syntax: ```yaml @@ -266,6 +265,8 @@ jobs: ### Debug Mode +**Important**: Debug mode is not supported for data collection jobs created via the UI using the Dyncfg feature. + To troubleshoot issues with the `prometheus` collector, run the `go.d.plugin` with the debug option enabled. The output should give you clues as to why the collector isn't working. @@ -288,4 +289,37 @@ should give you clues as to why the collector isn't working. ./go.d.plugin -d -m prometheus ``` +### Getting Logs + +If you're encountering problems with the `prometheus` collector, follow these steps to retrieve logs and identify potential issues: + +- **Run the command** specific to your system (systemd, non-systemd, or Docker container). +- **Examine the output** for any warnings or error messages that might indicate issues. These messages should provide clues about the root cause of the problem. + +#### System with systemd + +Use the following command to view logs generated since the last Netdata service restart: + +```bash +journalctl _SYSTEMD_INVOCATION_ID="$(systemctl show --value --property=InvocationID netdata)" --namespace=netdata --grep prometheus +``` + +#### System without systemd + +Locate the collector log file, typically at `/var/log/netdata/collector.log`, and use `grep` to filter for collector's name: + +```bash +grep prometheus /var/log/netdata/collector.log +``` + +**Note**: This method shows logs from all restarts. Focus on the **latest entries** for troubleshooting current issues. + +#### Docker Container + +If your Netdata runs in a Docker container named "netdata" (replace if different), use this command: + +```bash +docker logs netdata 2>&1 | grep prometheus +``` + diff --git a/src/go/collectors/go.d.plugin/modules/prometheus/integrations/iota_full_node.md b/src/go/plugin/go.d/modules/prometheus/integrations/iota_full_node.md index b81e4eacb..74ba5a3ef 100644 --- a/src/go/collectors/go.d.plugin/modules/prometheus/integrations/iota_full_node.md +++ b/src/go/plugin/go.d/modules/prometheus/integrations/iota_full_node.md @@ -1,6 +1,6 @@ <!--startmeta -custom_edit_url: "https://github.com/netdata/netdata/edit/master/src/go/collectors/go.d.plugin/modules/prometheus/integrations/iota_full_node.md" -meta_yaml: "https://github.com/netdata/netdata/edit/master/src/go/collectors/go.d.plugin/modules/prometheus/metadata.yaml" +custom_edit_url: "https://github.com/netdata/netdata/edit/master/src/go/plugin/go.d/modules/prometheus/integrations/iota_full_node.md" +meta_yaml: "https://github.com/netdata/netdata/edit/master/src/go/plugin/go.d/modules/prometheus/metadata.yaml" sidebar_label: "IOTA full node" learn_status: "Published" learn_rel_path: "Collecting Metrics/Blockchain Servers" @@ -37,7 +37,6 @@ This collector supports collecting metrics from multiple instances of this integ #### Auto-Detection By default, it detects instances running on the local host by trying to connect to known ports that are [allocated to exporters](https://github.com/prometheus/prometheus/wiki/Default-port-allocations). -The full list of endpoints is available in the collector's [configuration file](https://github.com/netdata/netdata/blob/master/src/go/collectors/go.d.plugin/config/go.d/prometheus.conf). #### Limits @@ -138,7 +137,7 @@ The following options can be defined globally: update_every, autodetection_retry This option allows you to filter out unwanted time series. Only metrics matching the selector will be collected. - Logic: (pattern1 OR pattern2) AND !(pattern3 or pattern4) -- Pattern syntax: [selector](/src/go/collectors/go.d.plugin/pkg/prometheus/selector/README.md). +- Pattern syntax: [selector](/src/go/plugin/go.d/pkg/prometheus/selector/README.md). - Option syntax: ```yaml @@ -266,6 +265,8 @@ jobs: ### Debug Mode +**Important**: Debug mode is not supported for data collection jobs created via the UI using the Dyncfg feature. + To troubleshoot issues with the `prometheus` collector, run the `go.d.plugin` with the debug option enabled. The output should give you clues as to why the collector isn't working. @@ -288,4 +289,37 @@ should give you clues as to why the collector isn't working. ./go.d.plugin -d -m prometheus ``` +### Getting Logs + +If you're encountering problems with the `prometheus` collector, follow these steps to retrieve logs and identify potential issues: + +- **Run the command** specific to your system (systemd, non-systemd, or Docker container). +- **Examine the output** for any warnings or error messages that might indicate issues. These messages should provide clues about the root cause of the problem. + +#### System with systemd + +Use the following command to view logs generated since the last Netdata service restart: + +```bash +journalctl _SYSTEMD_INVOCATION_ID="$(systemctl show --value --property=InvocationID netdata)" --namespace=netdata --grep prometheus +``` + +#### System without systemd + +Locate the collector log file, typically at `/var/log/netdata/collector.log`, and use `grep` to filter for collector's name: + +```bash +grep prometheus /var/log/netdata/collector.log +``` + +**Note**: This method shows logs from all restarts. Focus on the **latest entries** for troubleshooting current issues. + +#### Docker Container + +If your Netdata runs in a Docker container named "netdata" (replace if different), use this command: + +```bash +docker logs netdata 2>&1 | grep prometheus +``` + diff --git a/src/go/collectors/go.d.plugin/modules/prometheus/integrations/ipmi_by_soundcloud.md b/src/go/plugin/go.d/modules/prometheus/integrations/ipmi_by_soundcloud.md index 089c68c08..52966c728 100644 --- a/src/go/collectors/go.d.plugin/modules/prometheus/integrations/ipmi_by_soundcloud.md +++ b/src/go/plugin/go.d/modules/prometheus/integrations/ipmi_by_soundcloud.md @@ -1,6 +1,6 @@ <!--startmeta -custom_edit_url: "https://github.com/netdata/netdata/edit/master/src/go/collectors/go.d.plugin/modules/prometheus/integrations/ipmi_by_soundcloud.md" -meta_yaml: "https://github.com/netdata/netdata/edit/master/src/go/collectors/go.d.plugin/modules/prometheus/metadata.yaml" +custom_edit_url: "https://github.com/netdata/netdata/edit/master/src/go/plugin/go.d/modules/prometheus/integrations/ipmi_by_soundcloud.md" +meta_yaml: "https://github.com/netdata/netdata/edit/master/src/go/plugin/go.d/modules/prometheus/metadata.yaml" sidebar_label: "IPMI (By SoundCloud)" learn_status: "Published" learn_rel_path: "Collecting Metrics/Hardware Devices and Sensors" @@ -37,7 +37,6 @@ This collector supports collecting metrics from multiple instances of this integ #### Auto-Detection By default, it detects instances running on the local host by trying to connect to known ports that are [allocated to exporters](https://github.com/prometheus/prometheus/wiki/Default-port-allocations). -The full list of endpoints is available in the collector's [configuration file](https://github.com/netdata/netdata/blob/master/src/go/collectors/go.d.plugin/config/go.d/prometheus.conf). #### Limits @@ -138,7 +137,7 @@ The following options can be defined globally: update_every, autodetection_retry This option allows you to filter out unwanted time series. Only metrics matching the selector will be collected. - Logic: (pattern1 OR pattern2) AND !(pattern3 or pattern4) -- Pattern syntax: [selector](/src/go/collectors/go.d.plugin/pkg/prometheus/selector/README.md). +- Pattern syntax: [selector](/src/go/plugin/go.d/pkg/prometheus/selector/README.md). - Option syntax: ```yaml @@ -266,6 +265,8 @@ jobs: ### Debug Mode +**Important**: Debug mode is not supported for data collection jobs created via the UI using the Dyncfg feature. + To troubleshoot issues with the `prometheus` collector, run the `go.d.plugin` with the debug option enabled. The output should give you clues as to why the collector isn't working. @@ -288,4 +289,37 @@ should give you clues as to why the collector isn't working. ./go.d.plugin -d -m prometheus ``` +### Getting Logs + +If you're encountering problems with the `prometheus` collector, follow these steps to retrieve logs and identify potential issues: + +- **Run the command** specific to your system (systemd, non-systemd, or Docker container). +- **Examine the output** for any warnings or error messages that might indicate issues. These messages should provide clues about the root cause of the problem. + +#### System with systemd + +Use the following command to view logs generated since the last Netdata service restart: + +```bash +journalctl _SYSTEMD_INVOCATION_ID="$(systemctl show --value --property=InvocationID netdata)" --namespace=netdata --grep prometheus +``` + +#### System without systemd + +Locate the collector log file, typically at `/var/log/netdata/collector.log`, and use `grep` to filter for collector's name: + +```bash +grep prometheus /var/log/netdata/collector.log +``` + +**Note**: This method shows logs from all restarts. Focus on the **latest entries** for troubleshooting current issues. + +#### Docker Container + +If your Netdata runs in a Docker container named "netdata" (replace if different), use this command: + +```bash +docker logs netdata 2>&1 | grep prometheus +``` + diff --git a/src/go/collectors/go.d.plugin/modules/prometheus/integrations/iqair_airvisual_air_quality_monitors.md b/src/go/plugin/go.d/modules/prometheus/integrations/iqair_airvisual_air_quality_monitors.md index 336639604..9e2ed89a5 100644 --- a/src/go/collectors/go.d.plugin/modules/prometheus/integrations/iqair_airvisual_air_quality_monitors.md +++ b/src/go/plugin/go.d/modules/prometheus/integrations/iqair_airvisual_air_quality_monitors.md @@ -1,6 +1,6 @@ <!--startmeta -custom_edit_url: "https://github.com/netdata/netdata/edit/master/src/go/collectors/go.d.plugin/modules/prometheus/integrations/iqair_airvisual_air_quality_monitors.md" -meta_yaml: "https://github.com/netdata/netdata/edit/master/src/go/collectors/go.d.plugin/modules/prometheus/metadata.yaml" +custom_edit_url: "https://github.com/netdata/netdata/edit/master/src/go/plugin/go.d/modules/prometheus/integrations/iqair_airvisual_air_quality_monitors.md" +meta_yaml: "https://github.com/netdata/netdata/edit/master/src/go/plugin/go.d/modules/prometheus/metadata.yaml" sidebar_label: "iqAir AirVisual air quality monitors" learn_status: "Published" learn_rel_path: "Collecting Metrics/IoT Devices" @@ -37,7 +37,6 @@ This collector supports collecting metrics from multiple instances of this integ #### Auto-Detection By default, it detects instances running on the local host by trying to connect to known ports that are [allocated to exporters](https://github.com/prometheus/prometheus/wiki/Default-port-allocations). -The full list of endpoints is available in the collector's [configuration file](https://github.com/netdata/netdata/blob/master/src/go/collectors/go.d.plugin/config/go.d/prometheus.conf). #### Limits @@ -138,7 +137,7 @@ The following options can be defined globally: update_every, autodetection_retry This option allows you to filter out unwanted time series. Only metrics matching the selector will be collected. - Logic: (pattern1 OR pattern2) AND !(pattern3 or pattern4) -- Pattern syntax: [selector](/src/go/collectors/go.d.plugin/pkg/prometheus/selector/README.md). +- Pattern syntax: [selector](/src/go/plugin/go.d/pkg/prometheus/selector/README.md). - Option syntax: ```yaml @@ -266,6 +265,8 @@ jobs: ### Debug Mode +**Important**: Debug mode is not supported for data collection jobs created via the UI using the Dyncfg feature. + To troubleshoot issues with the `prometheus` collector, run the `go.d.plugin` with the debug option enabled. The output should give you clues as to why the collector isn't working. @@ -288,4 +289,37 @@ should give you clues as to why the collector isn't working. ./go.d.plugin -d -m prometheus ``` +### Getting Logs + +If you're encountering problems with the `prometheus` collector, follow these steps to retrieve logs and identify potential issues: + +- **Run the command** specific to your system (systemd, non-systemd, or Docker container). +- **Examine the output** for any warnings or error messages that might indicate issues. These messages should provide clues about the root cause of the problem. + +#### System with systemd + +Use the following command to view logs generated since the last Netdata service restart: + +```bash +journalctl _SYSTEMD_INVOCATION_ID="$(systemctl show --value --property=InvocationID netdata)" --namespace=netdata --grep prometheus +``` + +#### System without systemd + +Locate the collector log file, typically at `/var/log/netdata/collector.log`, and use `grep` to filter for collector's name: + +```bash +grep prometheus /var/log/netdata/collector.log +``` + +**Note**: This method shows logs from all restarts. Focus on the **latest entries** for troubleshooting current issues. + +#### Docker Container + +If your Netdata runs in a Docker container named "netdata" (replace if different), use this command: + +```bash +docker logs netdata 2>&1 | grep prometheus +``` + diff --git a/src/go/collectors/go.d.plugin/modules/prometheus/integrations/jarvis_standing_desk.md b/src/go/plugin/go.d/modules/prometheus/integrations/jarvis_standing_desk.md index 3ba765fef..cd392a297 100644 --- a/src/go/collectors/go.d.plugin/modules/prometheus/integrations/jarvis_standing_desk.md +++ b/src/go/plugin/go.d/modules/prometheus/integrations/jarvis_standing_desk.md @@ -1,6 +1,6 @@ <!--startmeta -custom_edit_url: "https://github.com/netdata/netdata/edit/master/src/go/collectors/go.d.plugin/modules/prometheus/integrations/jarvis_standing_desk.md" -meta_yaml: "https://github.com/netdata/netdata/edit/master/src/go/collectors/go.d.plugin/modules/prometheus/metadata.yaml" +custom_edit_url: "https://github.com/netdata/netdata/edit/master/src/go/plugin/go.d/modules/prometheus/integrations/jarvis_standing_desk.md" +meta_yaml: "https://github.com/netdata/netdata/edit/master/src/go/plugin/go.d/modules/prometheus/metadata.yaml" sidebar_label: "Jarvis Standing Desk" learn_status: "Published" learn_rel_path: "Collecting Metrics/IoT Devices" @@ -37,7 +37,6 @@ This collector supports collecting metrics from multiple instances of this integ #### Auto-Detection By default, it detects instances running on the local host by trying to connect to known ports that are [allocated to exporters](https://github.com/prometheus/prometheus/wiki/Default-port-allocations). -The full list of endpoints is available in the collector's [configuration file](https://github.com/netdata/netdata/blob/master/src/go/collectors/go.d.plugin/config/go.d/prometheus.conf). #### Limits @@ -138,7 +137,7 @@ The following options can be defined globally: update_every, autodetection_retry This option allows you to filter out unwanted time series. Only metrics matching the selector will be collected. - Logic: (pattern1 OR pattern2) AND !(pattern3 or pattern4) -- Pattern syntax: [selector](/src/go/collectors/go.d.plugin/pkg/prometheus/selector/README.md). +- Pattern syntax: [selector](/src/go/plugin/go.d/pkg/prometheus/selector/README.md). - Option syntax: ```yaml @@ -266,6 +265,8 @@ jobs: ### Debug Mode +**Important**: Debug mode is not supported for data collection jobs created via the UI using the Dyncfg feature. + To troubleshoot issues with the `prometheus` collector, run the `go.d.plugin` with the debug option enabled. The output should give you clues as to why the collector isn't working. @@ -288,4 +289,37 @@ should give you clues as to why the collector isn't working. ./go.d.plugin -d -m prometheus ``` +### Getting Logs + +If you're encountering problems with the `prometheus` collector, follow these steps to retrieve logs and identify potential issues: + +- **Run the command** specific to your system (systemd, non-systemd, or Docker container). +- **Examine the output** for any warnings or error messages that might indicate issues. These messages should provide clues about the root cause of the problem. + +#### System with systemd + +Use the following command to view logs generated since the last Netdata service restart: + +```bash +journalctl _SYSTEMD_INVOCATION_ID="$(systemctl show --value --property=InvocationID netdata)" --namespace=netdata --grep prometheus +``` + +#### System without systemd + +Locate the collector log file, typically at `/var/log/netdata/collector.log`, and use `grep` to filter for collector's name: + +```bash +grep prometheus /var/log/netdata/collector.log +``` + +**Note**: This method shows logs from all restarts. Focus on the **latest entries** for troubleshooting current issues. + +#### Docker Container + +If your Netdata runs in a Docker container named "netdata" (replace if different), use this command: + +```bash +docker logs netdata 2>&1 | grep prometheus +``` + diff --git a/src/go/collectors/go.d.plugin/modules/prometheus/integrations/jenkins.md b/src/go/plugin/go.d/modules/prometheus/integrations/jenkins.md index aeaf8bc23..203ae3d69 100644 --- a/src/go/collectors/go.d.plugin/modules/prometheus/integrations/jenkins.md +++ b/src/go/plugin/go.d/modules/prometheus/integrations/jenkins.md @@ -1,6 +1,6 @@ <!--startmeta -custom_edit_url: "https://github.com/netdata/netdata/edit/master/src/go/collectors/go.d.plugin/modules/prometheus/integrations/jenkins.md" -meta_yaml: "https://github.com/netdata/netdata/edit/master/src/go/collectors/go.d.plugin/modules/prometheus/metadata.yaml" +custom_edit_url: "https://github.com/netdata/netdata/edit/master/src/go/plugin/go.d/modules/prometheus/integrations/jenkins.md" +meta_yaml: "https://github.com/netdata/netdata/edit/master/src/go/plugin/go.d/modules/prometheus/metadata.yaml" sidebar_label: "Jenkins" learn_status: "Published" learn_rel_path: "Collecting Metrics/CICD Platforms" @@ -37,7 +37,6 @@ This collector supports collecting metrics from multiple instances of this integ #### Auto-Detection By default, it detects instances running on the local host by trying to connect to known ports that are [allocated to exporters](https://github.com/prometheus/prometheus/wiki/Default-port-allocations). -The full list of endpoints is available in the collector's [configuration file](https://github.com/netdata/netdata/blob/master/src/go/collectors/go.d.plugin/config/go.d/prometheus.conf). #### Limits @@ -138,7 +137,7 @@ The following options can be defined globally: update_every, autodetection_retry This option allows you to filter out unwanted time series. Only metrics matching the selector will be collected. - Logic: (pattern1 OR pattern2) AND !(pattern3 or pattern4) -- Pattern syntax: [selector](/src/go/collectors/go.d.plugin/pkg/prometheus/selector/README.md). +- Pattern syntax: [selector](/src/go/plugin/go.d/pkg/prometheus/selector/README.md). - Option syntax: ```yaml @@ -266,6 +265,8 @@ jobs: ### Debug Mode +**Important**: Debug mode is not supported for data collection jobs created via the UI using the Dyncfg feature. + To troubleshoot issues with the `prometheus` collector, run the `go.d.plugin` with the debug option enabled. The output should give you clues as to why the collector isn't working. @@ -288,4 +289,37 @@ should give you clues as to why the collector isn't working. ./go.d.plugin -d -m prometheus ``` +### Getting Logs + +If you're encountering problems with the `prometheus` collector, follow these steps to retrieve logs and identify potential issues: + +- **Run the command** specific to your system (systemd, non-systemd, or Docker container). +- **Examine the output** for any warnings or error messages that might indicate issues. These messages should provide clues about the root cause of the problem. + +#### System with systemd + +Use the following command to view logs generated since the last Netdata service restart: + +```bash +journalctl _SYSTEMD_INVOCATION_ID="$(systemctl show --value --property=InvocationID netdata)" --namespace=netdata --grep prometheus +``` + +#### System without systemd + +Locate the collector log file, typically at `/var/log/netdata/collector.log`, and use `grep` to filter for collector's name: + +```bash +grep prometheus /var/log/netdata/collector.log +``` + +**Note**: This method shows logs from all restarts. Focus on the **latest entries** for troubleshooting current issues. + +#### Docker Container + +If your Netdata runs in a Docker container named "netdata" (replace if different), use this command: + +```bash +docker logs netdata 2>&1 | grep prometheus +``` + diff --git a/src/go/collectors/go.d.plugin/modules/prometheus/integrations/jetbrains_floating_license_server.md b/src/go/plugin/go.d/modules/prometheus/integrations/jetbrains_floating_license_server.md index 88eae33c8..cde4e22a6 100644 --- a/src/go/collectors/go.d.plugin/modules/prometheus/integrations/jetbrains_floating_license_server.md +++ b/src/go/plugin/go.d/modules/prometheus/integrations/jetbrains_floating_license_server.md @@ -1,6 +1,6 @@ <!--startmeta -custom_edit_url: "https://github.com/netdata/netdata/edit/master/src/go/collectors/go.d.plugin/modules/prometheus/integrations/jetbrains_floating_license_server.md" -meta_yaml: "https://github.com/netdata/netdata/edit/master/src/go/collectors/go.d.plugin/modules/prometheus/metadata.yaml" +custom_edit_url: "https://github.com/netdata/netdata/edit/master/src/go/plugin/go.d/modules/prometheus/integrations/jetbrains_floating_license_server.md" +meta_yaml: "https://github.com/netdata/netdata/edit/master/src/go/plugin/go.d/modules/prometheus/metadata.yaml" sidebar_label: "JetBrains Floating License Server" learn_status: "Published" learn_rel_path: "Collecting Metrics/Generic Collecting Metrics" @@ -37,7 +37,6 @@ This collector supports collecting metrics from multiple instances of this integ #### Auto-Detection By default, it detects instances running on the local host by trying to connect to known ports that are [allocated to exporters](https://github.com/prometheus/prometheus/wiki/Default-port-allocations). -The full list of endpoints is available in the collector's [configuration file](https://github.com/netdata/netdata/blob/master/src/go/collectors/go.d.plugin/config/go.d/prometheus.conf). #### Limits @@ -138,7 +137,7 @@ The following options can be defined globally: update_every, autodetection_retry This option allows you to filter out unwanted time series. Only metrics matching the selector will be collected. - Logic: (pattern1 OR pattern2) AND !(pattern3 or pattern4) -- Pattern syntax: [selector](/src/go/collectors/go.d.plugin/pkg/prometheus/selector/README.md). +- Pattern syntax: [selector](/src/go/plugin/go.d/pkg/prometheus/selector/README.md). - Option syntax: ```yaml @@ -266,6 +265,8 @@ jobs: ### Debug Mode +**Important**: Debug mode is not supported for data collection jobs created via the UI using the Dyncfg feature. + To troubleshoot issues with the `prometheus` collector, run the `go.d.plugin` with the debug option enabled. The output should give you clues as to why the collector isn't working. @@ -288,4 +289,37 @@ should give you clues as to why the collector isn't working. ./go.d.plugin -d -m prometheus ``` +### Getting Logs + +If you're encountering problems with the `prometheus` collector, follow these steps to retrieve logs and identify potential issues: + +- **Run the command** specific to your system (systemd, non-systemd, or Docker container). +- **Examine the output** for any warnings or error messages that might indicate issues. These messages should provide clues about the root cause of the problem. + +#### System with systemd + +Use the following command to view logs generated since the last Netdata service restart: + +```bash +journalctl _SYSTEMD_INVOCATION_ID="$(systemctl show --value --property=InvocationID netdata)" --namespace=netdata --grep prometheus +``` + +#### System without systemd + +Locate the collector log file, typically at `/var/log/netdata/collector.log`, and use `grep` to filter for collector's name: + +```bash +grep prometheus /var/log/netdata/collector.log +``` + +**Note**: This method shows logs from all restarts. Focus on the **latest entries** for troubleshooting current issues. + +#### Docker Container + +If your Netdata runs in a Docker container named "netdata" (replace if different), use this command: + +```bash +docker logs netdata 2>&1 | grep prometheus +``` + diff --git a/src/go/collectors/go.d.plugin/modules/prometheus/integrations/jmx.md b/src/go/plugin/go.d/modules/prometheus/integrations/jmx.md index 4473dd624..6813a8087 100644 --- a/src/go/collectors/go.d.plugin/modules/prometheus/integrations/jmx.md +++ b/src/go/plugin/go.d/modules/prometheus/integrations/jmx.md @@ -1,6 +1,6 @@ <!--startmeta -custom_edit_url: "https://github.com/netdata/netdata/edit/master/src/go/collectors/go.d.plugin/modules/prometheus/integrations/jmx.md" -meta_yaml: "https://github.com/netdata/netdata/edit/master/src/go/collectors/go.d.plugin/modules/prometheus/metadata.yaml" +custom_edit_url: "https://github.com/netdata/netdata/edit/master/src/go/plugin/go.d/modules/prometheus/integrations/jmx.md" +meta_yaml: "https://github.com/netdata/netdata/edit/master/src/go/plugin/go.d/modules/prometheus/metadata.yaml" sidebar_label: "JMX" learn_status: "Published" learn_rel_path: "Collecting Metrics/APM" @@ -37,7 +37,6 @@ This collector supports collecting metrics from multiple instances of this integ #### Auto-Detection By default, it detects instances running on the local host by trying to connect to known ports that are [allocated to exporters](https://github.com/prometheus/prometheus/wiki/Default-port-allocations). -The full list of endpoints is available in the collector's [configuration file](https://github.com/netdata/netdata/blob/master/src/go/collectors/go.d.plugin/config/go.d/prometheus.conf). #### Limits @@ -138,7 +137,7 @@ The following options can be defined globally: update_every, autodetection_retry This option allows you to filter out unwanted time series. Only metrics matching the selector will be collected. - Logic: (pattern1 OR pattern2) AND !(pattern3 or pattern4) -- Pattern syntax: [selector](/src/go/collectors/go.d.plugin/pkg/prometheus/selector/README.md). +- Pattern syntax: [selector](/src/go/plugin/go.d/pkg/prometheus/selector/README.md). - Option syntax: ```yaml @@ -266,6 +265,8 @@ jobs: ### Debug Mode +**Important**: Debug mode is not supported for data collection jobs created via the UI using the Dyncfg feature. + To troubleshoot issues with the `prometheus` collector, run the `go.d.plugin` with the debug option enabled. The output should give you clues as to why the collector isn't working. @@ -288,4 +289,37 @@ should give you clues as to why the collector isn't working. ./go.d.plugin -d -m prometheus ``` +### Getting Logs + +If you're encountering problems with the `prometheus` collector, follow these steps to retrieve logs and identify potential issues: + +- **Run the command** specific to your system (systemd, non-systemd, or Docker container). +- **Examine the output** for any warnings or error messages that might indicate issues. These messages should provide clues about the root cause of the problem. + +#### System with systemd + +Use the following command to view logs generated since the last Netdata service restart: + +```bash +journalctl _SYSTEMD_INVOCATION_ID="$(systemctl show --value --property=InvocationID netdata)" --namespace=netdata --grep prometheus +``` + +#### System without systemd + +Locate the collector log file, typically at `/var/log/netdata/collector.log`, and use `grep` to filter for collector's name: + +```bash +grep prometheus /var/log/netdata/collector.log +``` + +**Note**: This method shows logs from all restarts. Focus on the **latest entries** for troubleshooting current issues. + +#### Docker Container + +If your Netdata runs in a Docker container named "netdata" (replace if different), use this command: + +```bash +docker logs netdata 2>&1 | grep prometheus +``` + diff --git a/src/go/collectors/go.d.plugin/modules/prometheus/integrations/jolokia.md b/src/go/plugin/go.d/modules/prometheus/integrations/jolokia.md index c4c5f26af..187b40be1 100644 --- a/src/go/collectors/go.d.plugin/modules/prometheus/integrations/jolokia.md +++ b/src/go/plugin/go.d/modules/prometheus/integrations/jolokia.md @@ -1,6 +1,6 @@ <!--startmeta -custom_edit_url: "https://github.com/netdata/netdata/edit/master/src/go/collectors/go.d.plugin/modules/prometheus/integrations/jolokia.md" -meta_yaml: "https://github.com/netdata/netdata/edit/master/src/go/collectors/go.d.plugin/modules/prometheus/metadata.yaml" +custom_edit_url: "https://github.com/netdata/netdata/edit/master/src/go/plugin/go.d/modules/prometheus/integrations/jolokia.md" +meta_yaml: "https://github.com/netdata/netdata/edit/master/src/go/plugin/go.d/modules/prometheus/metadata.yaml" sidebar_label: "jolokia" learn_status: "Published" learn_rel_path: "Collecting Metrics/APM" @@ -37,7 +37,6 @@ This collector supports collecting metrics from multiple instances of this integ #### Auto-Detection By default, it detects instances running on the local host by trying to connect to known ports that are [allocated to exporters](https://github.com/prometheus/prometheus/wiki/Default-port-allocations). -The full list of endpoints is available in the collector's [configuration file](https://github.com/netdata/netdata/blob/master/src/go/collectors/go.d.plugin/config/go.d/prometheus.conf). #### Limits @@ -138,7 +137,7 @@ The following options can be defined globally: update_every, autodetection_retry This option allows you to filter out unwanted time series. Only metrics matching the selector will be collected. - Logic: (pattern1 OR pattern2) AND !(pattern3 or pattern4) -- Pattern syntax: [selector](/src/go/collectors/go.d.plugin/pkg/prometheus/selector/README.md). +- Pattern syntax: [selector](/src/go/plugin/go.d/pkg/prometheus/selector/README.md). - Option syntax: ```yaml @@ -266,6 +265,8 @@ jobs: ### Debug Mode +**Important**: Debug mode is not supported for data collection jobs created via the UI using the Dyncfg feature. + To troubleshoot issues with the `prometheus` collector, run the `go.d.plugin` with the debug option enabled. The output should give you clues as to why the collector isn't working. @@ -288,4 +289,37 @@ should give you clues as to why the collector isn't working. ./go.d.plugin -d -m prometheus ``` +### Getting Logs + +If you're encountering problems with the `prometheus` collector, follow these steps to retrieve logs and identify potential issues: + +- **Run the command** specific to your system (systemd, non-systemd, or Docker container). +- **Examine the output** for any warnings or error messages that might indicate issues. These messages should provide clues about the root cause of the problem. + +#### System with systemd + +Use the following command to view logs generated since the last Netdata service restart: + +```bash +journalctl _SYSTEMD_INVOCATION_ID="$(systemctl show --value --property=InvocationID netdata)" --namespace=netdata --grep prometheus +``` + +#### System without systemd + +Locate the collector log file, typically at `/var/log/netdata/collector.log`, and use `grep` to filter for collector's name: + +```bash +grep prometheus /var/log/netdata/collector.log +``` + +**Note**: This method shows logs from all restarts. Focus on the **latest entries** for troubleshooting current issues. + +#### Docker Container + +If your Netdata runs in a Docker container named "netdata" (replace if different), use this command: + +```bash +docker logs netdata 2>&1 | grep prometheus +``` + diff --git a/src/go/collectors/go.d.plugin/modules/prometheus/integrations/journald.md b/src/go/plugin/go.d/modules/prometheus/integrations/journald.md index 36a9eeafd..0d016ad21 100644 --- a/src/go/collectors/go.d.plugin/modules/prometheus/integrations/journald.md +++ b/src/go/plugin/go.d/modules/prometheus/integrations/journald.md @@ -1,6 +1,6 @@ <!--startmeta -custom_edit_url: "https://github.com/netdata/netdata/edit/master/src/go/collectors/go.d.plugin/modules/prometheus/integrations/journald.md" -meta_yaml: "https://github.com/netdata/netdata/edit/master/src/go/collectors/go.d.plugin/modules/prometheus/metadata.yaml" +custom_edit_url: "https://github.com/netdata/netdata/edit/master/src/go/plugin/go.d/modules/prometheus/integrations/journald.md" +meta_yaml: "https://github.com/netdata/netdata/edit/master/src/go/plugin/go.d/modules/prometheus/metadata.yaml" sidebar_label: "journald" learn_status: "Published" learn_rel_path: "Collecting Metrics/Logs Servers" @@ -37,7 +37,6 @@ This collector supports collecting metrics from multiple instances of this integ #### Auto-Detection By default, it detects instances running on the local host by trying to connect to known ports that are [allocated to exporters](https://github.com/prometheus/prometheus/wiki/Default-port-allocations). -The full list of endpoints is available in the collector's [configuration file](https://github.com/netdata/netdata/blob/master/src/go/collectors/go.d.plugin/config/go.d/prometheus.conf). #### Limits @@ -138,7 +137,7 @@ The following options can be defined globally: update_every, autodetection_retry This option allows you to filter out unwanted time series. Only metrics matching the selector will be collected. - Logic: (pattern1 OR pattern2) AND !(pattern3 or pattern4) -- Pattern syntax: [selector](/src/go/collectors/go.d.plugin/pkg/prometheus/selector/README.md). +- Pattern syntax: [selector](/src/go/plugin/go.d/pkg/prometheus/selector/README.md). - Option syntax: ```yaml @@ -266,6 +265,8 @@ jobs: ### Debug Mode +**Important**: Debug mode is not supported for data collection jobs created via the UI using the Dyncfg feature. + To troubleshoot issues with the `prometheus` collector, run the `go.d.plugin` with the debug option enabled. The output should give you clues as to why the collector isn't working. @@ -288,4 +289,37 @@ should give you clues as to why the collector isn't working. ./go.d.plugin -d -m prometheus ``` +### Getting Logs + +If you're encountering problems with the `prometheus` collector, follow these steps to retrieve logs and identify potential issues: + +- **Run the command** specific to your system (systemd, non-systemd, or Docker container). +- **Examine the output** for any warnings or error messages that might indicate issues. These messages should provide clues about the root cause of the problem. + +#### System with systemd + +Use the following command to view logs generated since the last Netdata service restart: + +```bash +journalctl _SYSTEMD_INVOCATION_ID="$(systemctl show --value --property=InvocationID netdata)" --namespace=netdata --grep prometheus +``` + +#### System without systemd + +Locate the collector log file, typically at `/var/log/netdata/collector.log`, and use `grep` to filter for collector's name: + +```bash +grep prometheus /var/log/netdata/collector.log +``` + +**Note**: This method shows logs from all restarts. Focus on the **latest entries** for troubleshooting current issues. + +#### Docker Container + +If your Netdata runs in a Docker container named "netdata" (replace if different), use this command: + +```bash +docker logs netdata 2>&1 | grep prometheus +``` + diff --git a/src/go/collectors/go.d.plugin/modules/prometheus/integrations/kafka.md b/src/go/plugin/go.d/modules/prometheus/integrations/kafka.md index 83e94397f..fb328f740 100644 --- a/src/go/collectors/go.d.plugin/modules/prometheus/integrations/kafka.md +++ b/src/go/plugin/go.d/modules/prometheus/integrations/kafka.md @@ -1,6 +1,6 @@ <!--startmeta -custom_edit_url: "https://github.com/netdata/netdata/edit/master/src/go/collectors/go.d.plugin/modules/prometheus/integrations/kafka.md" -meta_yaml: "https://github.com/netdata/netdata/edit/master/src/go/collectors/go.d.plugin/modules/prometheus/metadata.yaml" +custom_edit_url: "https://github.com/netdata/netdata/edit/master/src/go/plugin/go.d/modules/prometheus/integrations/kafka.md" +meta_yaml: "https://github.com/netdata/netdata/edit/master/src/go/plugin/go.d/modules/prometheus/metadata.yaml" sidebar_label: "Kafka" learn_status: "Published" learn_rel_path: "Collecting Metrics/Message Brokers" @@ -37,7 +37,6 @@ This collector supports collecting metrics from multiple instances of this integ #### Auto-Detection By default, it detects instances running on the local host by trying to connect to known ports that are [allocated to exporters](https://github.com/prometheus/prometheus/wiki/Default-port-allocations). -The full list of endpoints is available in the collector's [configuration file](https://github.com/netdata/netdata/blob/master/src/go/collectors/go.d.plugin/config/go.d/prometheus.conf). #### Limits @@ -138,7 +137,7 @@ The following options can be defined globally: update_every, autodetection_retry This option allows you to filter out unwanted time series. Only metrics matching the selector will be collected. - Logic: (pattern1 OR pattern2) AND !(pattern3 or pattern4) -- Pattern syntax: [selector](/src/go/collectors/go.d.plugin/pkg/prometheus/selector/README.md). +- Pattern syntax: [selector](/src/go/plugin/go.d/pkg/prometheus/selector/README.md). - Option syntax: ```yaml @@ -266,6 +265,8 @@ jobs: ### Debug Mode +**Important**: Debug mode is not supported for data collection jobs created via the UI using the Dyncfg feature. + To troubleshoot issues with the `prometheus` collector, run the `go.d.plugin` with the debug option enabled. The output should give you clues as to why the collector isn't working. @@ -288,4 +289,37 @@ should give you clues as to why the collector isn't working. ./go.d.plugin -d -m prometheus ``` +### Getting Logs + +If you're encountering problems with the `prometheus` collector, follow these steps to retrieve logs and identify potential issues: + +- **Run the command** specific to your system (systemd, non-systemd, or Docker container). +- **Examine the output** for any warnings or error messages that might indicate issues. These messages should provide clues about the root cause of the problem. + +#### System with systemd + +Use the following command to view logs generated since the last Netdata service restart: + +```bash +journalctl _SYSTEMD_INVOCATION_ID="$(systemctl show --value --property=InvocationID netdata)" --namespace=netdata --grep prometheus +``` + +#### System without systemd + +Locate the collector log file, typically at `/var/log/netdata/collector.log`, and use `grep` to filter for collector's name: + +```bash +grep prometheus /var/log/netdata/collector.log +``` + +**Note**: This method shows logs from all restarts. Focus on the **latest entries** for troubleshooting current issues. + +#### Docker Container + +If your Netdata runs in a Docker container named "netdata" (replace if different), use this command: + +```bash +docker logs netdata 2>&1 | grep prometheus +``` + diff --git a/src/go/collectors/go.d.plugin/modules/prometheus/integrations/kafka_connect.md b/src/go/plugin/go.d/modules/prometheus/integrations/kafka_connect.md index 6709ce172..c28c90f49 100644 --- a/src/go/collectors/go.d.plugin/modules/prometheus/integrations/kafka_connect.md +++ b/src/go/plugin/go.d/modules/prometheus/integrations/kafka_connect.md @@ -1,6 +1,6 @@ <!--startmeta -custom_edit_url: "https://github.com/netdata/netdata/edit/master/src/go/collectors/go.d.plugin/modules/prometheus/integrations/kafka_connect.md" -meta_yaml: "https://github.com/netdata/netdata/edit/master/src/go/collectors/go.d.plugin/modules/prometheus/metadata.yaml" +custom_edit_url: "https://github.com/netdata/netdata/edit/master/src/go/plugin/go.d/modules/prometheus/integrations/kafka_connect.md" +meta_yaml: "https://github.com/netdata/netdata/edit/master/src/go/plugin/go.d/modules/prometheus/metadata.yaml" sidebar_label: "Kafka Connect" learn_status: "Published" learn_rel_path: "Collecting Metrics/Message Brokers" @@ -37,7 +37,6 @@ This collector supports collecting metrics from multiple instances of this integ #### Auto-Detection By default, it detects instances running on the local host by trying to connect to known ports that are [allocated to exporters](https://github.com/prometheus/prometheus/wiki/Default-port-allocations). -The full list of endpoints is available in the collector's [configuration file](https://github.com/netdata/netdata/blob/master/src/go/collectors/go.d.plugin/config/go.d/prometheus.conf). #### Limits @@ -138,7 +137,7 @@ The following options can be defined globally: update_every, autodetection_retry This option allows you to filter out unwanted time series. Only metrics matching the selector will be collected. - Logic: (pattern1 OR pattern2) AND !(pattern3 or pattern4) -- Pattern syntax: [selector](/src/go/collectors/go.d.plugin/pkg/prometheus/selector/README.md). +- Pattern syntax: [selector](/src/go/plugin/go.d/pkg/prometheus/selector/README.md). - Option syntax: ```yaml @@ -266,6 +265,8 @@ jobs: ### Debug Mode +**Important**: Debug mode is not supported for data collection jobs created via the UI using the Dyncfg feature. + To troubleshoot issues with the `prometheus` collector, run the `go.d.plugin` with the debug option enabled. The output should give you clues as to why the collector isn't working. @@ -288,4 +289,37 @@ should give you clues as to why the collector isn't working. ./go.d.plugin -d -m prometheus ``` +### Getting Logs + +If you're encountering problems with the `prometheus` collector, follow these steps to retrieve logs and identify potential issues: + +- **Run the command** specific to your system (systemd, non-systemd, or Docker container). +- **Examine the output** for any warnings or error messages that might indicate issues. These messages should provide clues about the root cause of the problem. + +#### System with systemd + +Use the following command to view logs generated since the last Netdata service restart: + +```bash +journalctl _SYSTEMD_INVOCATION_ID="$(systemctl show --value --property=InvocationID netdata)" --namespace=netdata --grep prometheus +``` + +#### System without systemd + +Locate the collector log file, typically at `/var/log/netdata/collector.log`, and use `grep` to filter for collector's name: + +```bash +grep prometheus /var/log/netdata/collector.log +``` + +**Note**: This method shows logs from all restarts. Focus on the **latest entries** for troubleshooting current issues. + +#### Docker Container + +If your Netdata runs in a Docker container named "netdata" (replace if different), use this command: + +```bash +docker logs netdata 2>&1 | grep prometheus +``` + diff --git a/src/go/collectors/go.d.plugin/modules/prometheus/integrations/kafka_consumer_lag.md b/src/go/plugin/go.d/modules/prometheus/integrations/kafka_consumer_lag.md index 95d5fc566..6003d3af9 100644 --- a/src/go/collectors/go.d.plugin/modules/prometheus/integrations/kafka_consumer_lag.md +++ b/src/go/plugin/go.d/modules/prometheus/integrations/kafka_consumer_lag.md @@ -1,6 +1,6 @@ <!--startmeta -custom_edit_url: "https://github.com/netdata/netdata/edit/master/src/go/collectors/go.d.plugin/modules/prometheus/integrations/kafka_consumer_lag.md" -meta_yaml: "https://github.com/netdata/netdata/edit/master/src/go/collectors/go.d.plugin/modules/prometheus/metadata.yaml" +custom_edit_url: "https://github.com/netdata/netdata/edit/master/src/go/plugin/go.d/modules/prometheus/integrations/kafka_consumer_lag.md" +meta_yaml: "https://github.com/netdata/netdata/edit/master/src/go/plugin/go.d/modules/prometheus/metadata.yaml" sidebar_label: "Kafka Consumer Lag" learn_status: "Published" learn_rel_path: "Collecting Metrics/Service Discovery / Registry" @@ -37,7 +37,6 @@ This collector supports collecting metrics from multiple instances of this integ #### Auto-Detection By default, it detects instances running on the local host by trying to connect to known ports that are [allocated to exporters](https://github.com/prometheus/prometheus/wiki/Default-port-allocations). -The full list of endpoints is available in the collector's [configuration file](https://github.com/netdata/netdata/blob/master/src/go/collectors/go.d.plugin/config/go.d/prometheus.conf). #### Limits @@ -138,7 +137,7 @@ The following options can be defined globally: update_every, autodetection_retry This option allows you to filter out unwanted time series. Only metrics matching the selector will be collected. - Logic: (pattern1 OR pattern2) AND !(pattern3 or pattern4) -- Pattern syntax: [selector](/src/go/collectors/go.d.plugin/pkg/prometheus/selector/README.md). +- Pattern syntax: [selector](/src/go/plugin/go.d/pkg/prometheus/selector/README.md). - Option syntax: ```yaml @@ -266,6 +265,8 @@ jobs: ### Debug Mode +**Important**: Debug mode is not supported for data collection jobs created via the UI using the Dyncfg feature. + To troubleshoot issues with the `prometheus` collector, run the `go.d.plugin` with the debug option enabled. The output should give you clues as to why the collector isn't working. @@ -288,4 +289,37 @@ should give you clues as to why the collector isn't working. ./go.d.plugin -d -m prometheus ``` +### Getting Logs + +If you're encountering problems with the `prometheus` collector, follow these steps to retrieve logs and identify potential issues: + +- **Run the command** specific to your system (systemd, non-systemd, or Docker container). +- **Examine the output** for any warnings or error messages that might indicate issues. These messages should provide clues about the root cause of the problem. + +#### System with systemd + +Use the following command to view logs generated since the last Netdata service restart: + +```bash +journalctl _SYSTEMD_INVOCATION_ID="$(systemctl show --value --property=InvocationID netdata)" --namespace=netdata --grep prometheus +``` + +#### System without systemd + +Locate the collector log file, typically at `/var/log/netdata/collector.log`, and use `grep` to filter for collector's name: + +```bash +grep prometheus /var/log/netdata/collector.log +``` + +**Note**: This method shows logs from all restarts. Focus on the **latest entries** for troubleshooting current issues. + +#### Docker Container + +If your Netdata runs in a Docker container named "netdata" (replace if different), use this command: + +```bash +docker logs netdata 2>&1 | grep prometheus +``` + diff --git a/src/go/collectors/go.d.plugin/modules/prometheus/integrations/kafka_zookeeper.md b/src/go/plugin/go.d/modules/prometheus/integrations/kafka_zookeeper.md index 907aeaf4d..cbf799ca3 100644 --- a/src/go/collectors/go.d.plugin/modules/prometheus/integrations/kafka_zookeeper.md +++ b/src/go/plugin/go.d/modules/prometheus/integrations/kafka_zookeeper.md @@ -1,6 +1,6 @@ <!--startmeta -custom_edit_url: "https://github.com/netdata/netdata/edit/master/src/go/collectors/go.d.plugin/modules/prometheus/integrations/kafka_zookeeper.md" -meta_yaml: "https://github.com/netdata/netdata/edit/master/src/go/collectors/go.d.plugin/modules/prometheus/metadata.yaml" +custom_edit_url: "https://github.com/netdata/netdata/edit/master/src/go/plugin/go.d/modules/prometheus/integrations/kafka_zookeeper.md" +meta_yaml: "https://github.com/netdata/netdata/edit/master/src/go/plugin/go.d/modules/prometheus/metadata.yaml" sidebar_label: "Kafka ZooKeeper" learn_status: "Published" learn_rel_path: "Collecting Metrics/Message Brokers" @@ -37,7 +37,6 @@ This collector supports collecting metrics from multiple instances of this integ #### Auto-Detection By default, it detects instances running on the local host by trying to connect to known ports that are [allocated to exporters](https://github.com/prometheus/prometheus/wiki/Default-port-allocations). -The full list of endpoints is available in the collector's [configuration file](https://github.com/netdata/netdata/blob/master/src/go/collectors/go.d.plugin/config/go.d/prometheus.conf). #### Limits @@ -138,7 +137,7 @@ The following options can be defined globally: update_every, autodetection_retry This option allows you to filter out unwanted time series. Only metrics matching the selector will be collected. - Logic: (pattern1 OR pattern2) AND !(pattern3 or pattern4) -- Pattern syntax: [selector](/src/go/collectors/go.d.plugin/pkg/prometheus/selector/README.md). +- Pattern syntax: [selector](/src/go/plugin/go.d/pkg/prometheus/selector/README.md). - Option syntax: ```yaml @@ -266,6 +265,8 @@ jobs: ### Debug Mode +**Important**: Debug mode is not supported for data collection jobs created via the UI using the Dyncfg feature. + To troubleshoot issues with the `prometheus` collector, run the `go.d.plugin` with the debug option enabled. The output should give you clues as to why the collector isn't working. @@ -288,4 +289,37 @@ should give you clues as to why the collector isn't working. ./go.d.plugin -d -m prometheus ``` +### Getting Logs + +If you're encountering problems with the `prometheus` collector, follow these steps to retrieve logs and identify potential issues: + +- **Run the command** specific to your system (systemd, non-systemd, or Docker container). +- **Examine the output** for any warnings or error messages that might indicate issues. These messages should provide clues about the root cause of the problem. + +#### System with systemd + +Use the following command to view logs generated since the last Netdata service restart: + +```bash +journalctl _SYSTEMD_INVOCATION_ID="$(systemctl show --value --property=InvocationID netdata)" --namespace=netdata --grep prometheus +``` + +#### System without systemd + +Locate the collector log file, typically at `/var/log/netdata/collector.log`, and use `grep` to filter for collector's name: + +```bash +grep prometheus /var/log/netdata/collector.log +``` + +**Note**: This method shows logs from all restarts. Focus on the **latest entries** for troubleshooting current issues. + +#### Docker Container + +If your Netdata runs in a Docker container named "netdata" (replace if different), use this command: + +```bash +docker logs netdata 2>&1 | grep prometheus +``` + diff --git a/src/go/collectors/go.d.plugin/modules/prometheus/integrations/kannel.md b/src/go/plugin/go.d/modules/prometheus/integrations/kannel.md index 98fe1466e..a2264e9d9 100644 --- a/src/go/collectors/go.d.plugin/modules/prometheus/integrations/kannel.md +++ b/src/go/plugin/go.d/modules/prometheus/integrations/kannel.md @@ -1,6 +1,6 @@ <!--startmeta -custom_edit_url: "https://github.com/netdata/netdata/edit/master/src/go/collectors/go.d.plugin/modules/prometheus/integrations/kannel.md" -meta_yaml: "https://github.com/netdata/netdata/edit/master/src/go/collectors/go.d.plugin/modules/prometheus/metadata.yaml" +custom_edit_url: "https://github.com/netdata/netdata/edit/master/src/go/plugin/go.d/modules/prometheus/integrations/kannel.md" +meta_yaml: "https://github.com/netdata/netdata/edit/master/src/go/plugin/go.d/modules/prometheus/metadata.yaml" sidebar_label: "Kannel" learn_status: "Published" learn_rel_path: "Collecting Metrics/Telephony Servers" @@ -37,7 +37,6 @@ This collector supports collecting metrics from multiple instances of this integ #### Auto-Detection By default, it detects instances running on the local host by trying to connect to known ports that are [allocated to exporters](https://github.com/prometheus/prometheus/wiki/Default-port-allocations). -The full list of endpoints is available in the collector's [configuration file](https://github.com/netdata/netdata/blob/master/src/go/collectors/go.d.plugin/config/go.d/prometheus.conf). #### Limits @@ -138,7 +137,7 @@ The following options can be defined globally: update_every, autodetection_retry This option allows you to filter out unwanted time series. Only metrics matching the selector will be collected. - Logic: (pattern1 OR pattern2) AND !(pattern3 or pattern4) -- Pattern syntax: [selector](/src/go/collectors/go.d.plugin/pkg/prometheus/selector/README.md). +- Pattern syntax: [selector](/src/go/plugin/go.d/pkg/prometheus/selector/README.md). - Option syntax: ```yaml @@ -266,6 +265,8 @@ jobs: ### Debug Mode +**Important**: Debug mode is not supported for data collection jobs created via the UI using the Dyncfg feature. + To troubleshoot issues with the `prometheus` collector, run the `go.d.plugin` with the debug option enabled. The output should give you clues as to why the collector isn't working. @@ -288,4 +289,37 @@ should give you clues as to why the collector isn't working. ./go.d.plugin -d -m prometheus ``` +### Getting Logs + +If you're encountering problems with the `prometheus` collector, follow these steps to retrieve logs and identify potential issues: + +- **Run the command** specific to your system (systemd, non-systemd, or Docker container). +- **Examine the output** for any warnings or error messages that might indicate issues. These messages should provide clues about the root cause of the problem. + +#### System with systemd + +Use the following command to view logs generated since the last Netdata service restart: + +```bash +journalctl _SYSTEMD_INVOCATION_ID="$(systemctl show --value --property=InvocationID netdata)" --namespace=netdata --grep prometheus +``` + +#### System without systemd + +Locate the collector log file, typically at `/var/log/netdata/collector.log`, and use `grep` to filter for collector's name: + +```bash +grep prometheus /var/log/netdata/collector.log +``` + +**Note**: This method shows logs from all restarts. Focus on the **latest entries** for troubleshooting current issues. + +#### Docker Container + +If your Netdata runs in a Docker container named "netdata" (replace if different), use this command: + +```bash +docker logs netdata 2>&1 | grep prometheus +``` + diff --git a/src/go/collectors/go.d.plugin/modules/prometheus/integrations/keepalived.md b/src/go/plugin/go.d/modules/prometheus/integrations/keepalived.md index c82813cbc..aeb0d99b0 100644 --- a/src/go/collectors/go.d.plugin/modules/prometheus/integrations/keepalived.md +++ b/src/go/plugin/go.d/modules/prometheus/integrations/keepalived.md @@ -1,6 +1,6 @@ <!--startmeta -custom_edit_url: "https://github.com/netdata/netdata/edit/master/src/go/collectors/go.d.plugin/modules/prometheus/integrations/keepalived.md" -meta_yaml: "https://github.com/netdata/netdata/edit/master/src/go/collectors/go.d.plugin/modules/prometheus/metadata.yaml" +custom_edit_url: "https://github.com/netdata/netdata/edit/master/src/go/plugin/go.d/modules/prometheus/integrations/keepalived.md" +meta_yaml: "https://github.com/netdata/netdata/edit/master/src/go/plugin/go.d/modules/prometheus/metadata.yaml" sidebar_label: "Keepalived" learn_status: "Published" learn_rel_path: "Collecting Metrics/Networking Stack and Network Interfaces" @@ -37,7 +37,6 @@ This collector supports collecting metrics from multiple instances of this integ #### Auto-Detection By default, it detects instances running on the local host by trying to connect to known ports that are [allocated to exporters](https://github.com/prometheus/prometheus/wiki/Default-port-allocations). -The full list of endpoints is available in the collector's [configuration file](https://github.com/netdata/netdata/blob/master/src/go/collectors/go.d.plugin/config/go.d/prometheus.conf). #### Limits @@ -138,7 +137,7 @@ The following options can be defined globally: update_every, autodetection_retry This option allows you to filter out unwanted time series. Only metrics matching the selector will be collected. - Logic: (pattern1 OR pattern2) AND !(pattern3 or pattern4) -- Pattern syntax: [selector](/src/go/collectors/go.d.plugin/pkg/prometheus/selector/README.md). +- Pattern syntax: [selector](/src/go/plugin/go.d/pkg/prometheus/selector/README.md). - Option syntax: ```yaml @@ -266,6 +265,8 @@ jobs: ### Debug Mode +**Important**: Debug mode is not supported for data collection jobs created via the UI using the Dyncfg feature. + To troubleshoot issues with the `prometheus` collector, run the `go.d.plugin` with the debug option enabled. The output should give you clues as to why the collector isn't working. @@ -288,4 +289,37 @@ should give you clues as to why the collector isn't working. ./go.d.plugin -d -m prometheus ``` +### Getting Logs + +If you're encountering problems with the `prometheus` collector, follow these steps to retrieve logs and identify potential issues: + +- **Run the command** specific to your system (systemd, non-systemd, or Docker container). +- **Examine the output** for any warnings or error messages that might indicate issues. These messages should provide clues about the root cause of the problem. + +#### System with systemd + +Use the following command to view logs generated since the last Netdata service restart: + +```bash +journalctl _SYSTEMD_INVOCATION_ID="$(systemctl show --value --property=InvocationID netdata)" --namespace=netdata --grep prometheus +``` + +#### System without systemd + +Locate the collector log file, typically at `/var/log/netdata/collector.log`, and use `grep` to filter for collector's name: + +```bash +grep prometheus /var/log/netdata/collector.log +``` + +**Note**: This method shows logs from all restarts. Focus on the **latest entries** for troubleshooting current issues. + +#### Docker Container + +If your Netdata runs in a Docker container named "netdata" (replace if different), use this command: + +```bash +docker logs netdata 2>&1 | grep prometheus +``` + diff --git a/src/go/collectors/go.d.plugin/modules/prometheus/integrations/kubernetes_cluster_cloud_cost.md b/src/go/plugin/go.d/modules/prometheus/integrations/kubernetes_cluster_cloud_cost.md index 01d0fc60c..759ce0cbe 100644 --- a/src/go/collectors/go.d.plugin/modules/prometheus/integrations/kubernetes_cluster_cloud_cost.md +++ b/src/go/plugin/go.d/modules/prometheus/integrations/kubernetes_cluster_cloud_cost.md @@ -1,6 +1,6 @@ <!--startmeta -custom_edit_url: "https://github.com/netdata/netdata/edit/master/src/go/collectors/go.d.plugin/modules/prometheus/integrations/kubernetes_cluster_cloud_cost.md" -meta_yaml: "https://github.com/netdata/netdata/edit/master/src/go/collectors/go.d.plugin/modules/prometheus/metadata.yaml" +custom_edit_url: "https://github.com/netdata/netdata/edit/master/src/go/plugin/go.d/modules/prometheus/integrations/kubernetes_cluster_cloud_cost.md" +meta_yaml: "https://github.com/netdata/netdata/edit/master/src/go/plugin/go.d/modules/prometheus/metadata.yaml" sidebar_label: "Kubernetes Cluster Cloud Cost" learn_status: "Published" learn_rel_path: "Collecting Metrics/Kubernetes" @@ -37,7 +37,6 @@ This collector supports collecting metrics from multiple instances of this integ #### Auto-Detection By default, it detects instances running on the local host by trying to connect to known ports that are [allocated to exporters](https://github.com/prometheus/prometheus/wiki/Default-port-allocations). -The full list of endpoints is available in the collector's [configuration file](https://github.com/netdata/netdata/blob/master/src/go/collectors/go.d.plugin/config/go.d/prometheus.conf). #### Limits @@ -138,7 +137,7 @@ The following options can be defined globally: update_every, autodetection_retry This option allows you to filter out unwanted time series. Only metrics matching the selector will be collected. - Logic: (pattern1 OR pattern2) AND !(pattern3 or pattern4) -- Pattern syntax: [selector](/src/go/collectors/go.d.plugin/pkg/prometheus/selector/README.md). +- Pattern syntax: [selector](/src/go/plugin/go.d/pkg/prometheus/selector/README.md). - Option syntax: ```yaml @@ -266,6 +265,8 @@ jobs: ### Debug Mode +**Important**: Debug mode is not supported for data collection jobs created via the UI using the Dyncfg feature. + To troubleshoot issues with the `prometheus` collector, run the `go.d.plugin` with the debug option enabled. The output should give you clues as to why the collector isn't working. @@ -288,4 +289,37 @@ should give you clues as to why the collector isn't working. ./go.d.plugin -d -m prometheus ``` +### Getting Logs + +If you're encountering problems with the `prometheus` collector, follow these steps to retrieve logs and identify potential issues: + +- **Run the command** specific to your system (systemd, non-systemd, or Docker container). +- **Examine the output** for any warnings or error messages that might indicate issues. These messages should provide clues about the root cause of the problem. + +#### System with systemd + +Use the following command to view logs generated since the last Netdata service restart: + +```bash +journalctl _SYSTEMD_INVOCATION_ID="$(systemctl show --value --property=InvocationID netdata)" --namespace=netdata --grep prometheus +``` + +#### System without systemd + +Locate the collector log file, typically at `/var/log/netdata/collector.log`, and use `grep` to filter for collector's name: + +```bash +grep prometheus /var/log/netdata/collector.log +``` + +**Note**: This method shows logs from all restarts. Focus on the **latest entries** for troubleshooting current issues. + +#### Docker Container + +If your Netdata runs in a Docker container named "netdata" (replace if different), use this command: + +```bash +docker logs netdata 2>&1 | grep prometheus +``` + diff --git a/src/go/collectors/go.d.plugin/modules/prometheus/integrations/lagerist_disk_latency.md b/src/go/plugin/go.d/modules/prometheus/integrations/lagerist_disk_latency.md index e878d16ce..73019995c 100644 --- a/src/go/collectors/go.d.plugin/modules/prometheus/integrations/lagerist_disk_latency.md +++ b/src/go/plugin/go.d/modules/prometheus/integrations/lagerist_disk_latency.md @@ -1,6 +1,6 @@ <!--startmeta -custom_edit_url: "https://github.com/netdata/netdata/edit/master/src/go/collectors/go.d.plugin/modules/prometheus/integrations/lagerist_disk_latency.md" -meta_yaml: "https://github.com/netdata/netdata/edit/master/src/go/collectors/go.d.plugin/modules/prometheus/metadata.yaml" +custom_edit_url: "https://github.com/netdata/netdata/edit/master/src/go/plugin/go.d/modules/prometheus/integrations/lagerist_disk_latency.md" +meta_yaml: "https://github.com/netdata/netdata/edit/master/src/go/plugin/go.d/modules/prometheus/metadata.yaml" sidebar_label: "Lagerist Disk latency" learn_status: "Published" learn_rel_path: "Collecting Metrics/Storage, Mount Points and Filesystems" @@ -37,7 +37,6 @@ This collector supports collecting metrics from multiple instances of this integ #### Auto-Detection By default, it detects instances running on the local host by trying to connect to known ports that are [allocated to exporters](https://github.com/prometheus/prometheus/wiki/Default-port-allocations). -The full list of endpoints is available in the collector's [configuration file](https://github.com/netdata/netdata/blob/master/src/go/collectors/go.d.plugin/config/go.d/prometheus.conf). #### Limits @@ -138,7 +137,7 @@ The following options can be defined globally: update_every, autodetection_retry This option allows you to filter out unwanted time series. Only metrics matching the selector will be collected. - Logic: (pattern1 OR pattern2) AND !(pattern3 or pattern4) -- Pattern syntax: [selector](/src/go/collectors/go.d.plugin/pkg/prometheus/selector/README.md). +- Pattern syntax: [selector](/src/go/plugin/go.d/pkg/prometheus/selector/README.md). - Option syntax: ```yaml @@ -266,6 +265,8 @@ jobs: ### Debug Mode +**Important**: Debug mode is not supported for data collection jobs created via the UI using the Dyncfg feature. + To troubleshoot issues with the `prometheus` collector, run the `go.d.plugin` with the debug option enabled. The output should give you clues as to why the collector isn't working. @@ -288,4 +289,37 @@ should give you clues as to why the collector isn't working. ./go.d.plugin -d -m prometheus ``` +### Getting Logs + +If you're encountering problems with the `prometheus` collector, follow these steps to retrieve logs and identify potential issues: + +- **Run the command** specific to your system (systemd, non-systemd, or Docker container). +- **Examine the output** for any warnings or error messages that might indicate issues. These messages should provide clues about the root cause of the problem. + +#### System with systemd + +Use the following command to view logs generated since the last Netdata service restart: + +```bash +journalctl _SYSTEMD_INVOCATION_ID="$(systemctl show --value --property=InvocationID netdata)" --namespace=netdata --grep prometheus +``` + +#### System without systemd + +Locate the collector log file, typically at `/var/log/netdata/collector.log`, and use `grep` to filter for collector's name: + +```bash +grep prometheus /var/log/netdata/collector.log +``` + +**Note**: This method shows logs from all restarts. Focus on the **latest entries** for troubleshooting current issues. + +#### Docker Container + +If your Netdata runs in a Docker container named "netdata" (replace if different), use this command: + +```bash +docker logs netdata 2>&1 | grep prometheus +``` + diff --git a/src/go/collectors/go.d.plugin/modules/prometheus/integrations/ldap.md b/src/go/plugin/go.d/modules/prometheus/integrations/ldap.md index 2c4bd0ba7..705d1e198 100644 --- a/src/go/collectors/go.d.plugin/modules/prometheus/integrations/ldap.md +++ b/src/go/plugin/go.d/modules/prometheus/integrations/ldap.md @@ -1,6 +1,6 @@ <!--startmeta -custom_edit_url: "https://github.com/netdata/netdata/edit/master/src/go/collectors/go.d.plugin/modules/prometheus/integrations/ldap.md" -meta_yaml: "https://github.com/netdata/netdata/edit/master/src/go/collectors/go.d.plugin/modules/prometheus/metadata.yaml" +custom_edit_url: "https://github.com/netdata/netdata/edit/master/src/go/plugin/go.d/modules/prometheus/integrations/ldap.md" +meta_yaml: "https://github.com/netdata/netdata/edit/master/src/go/plugin/go.d/modules/prometheus/metadata.yaml" sidebar_label: "LDAP" learn_status: "Published" learn_rel_path: "Collecting Metrics/Authentication and Authorization" @@ -37,7 +37,6 @@ This collector supports collecting metrics from multiple instances of this integ #### Auto-Detection By default, it detects instances running on the local host by trying to connect to known ports that are [allocated to exporters](https://github.com/prometheus/prometheus/wiki/Default-port-allocations). -The full list of endpoints is available in the collector's [configuration file](https://github.com/netdata/netdata/blob/master/src/go/collectors/go.d.plugin/config/go.d/prometheus.conf). #### Limits @@ -138,7 +137,7 @@ The following options can be defined globally: update_every, autodetection_retry This option allows you to filter out unwanted time series. Only metrics matching the selector will be collected. - Logic: (pattern1 OR pattern2) AND !(pattern3 or pattern4) -- Pattern syntax: [selector](/src/go/collectors/go.d.plugin/pkg/prometheus/selector/README.md). +- Pattern syntax: [selector](/src/go/plugin/go.d/pkg/prometheus/selector/README.md). - Option syntax: ```yaml @@ -266,6 +265,8 @@ jobs: ### Debug Mode +**Important**: Debug mode is not supported for data collection jobs created via the UI using the Dyncfg feature. + To troubleshoot issues with the `prometheus` collector, run the `go.d.plugin` with the debug option enabled. The output should give you clues as to why the collector isn't working. @@ -288,4 +289,37 @@ should give you clues as to why the collector isn't working. ./go.d.plugin -d -m prometheus ``` +### Getting Logs + +If you're encountering problems with the `prometheus` collector, follow these steps to retrieve logs and identify potential issues: + +- **Run the command** specific to your system (systemd, non-systemd, or Docker container). +- **Examine the output** for any warnings or error messages that might indicate issues. These messages should provide clues about the root cause of the problem. + +#### System with systemd + +Use the following command to view logs generated since the last Netdata service restart: + +```bash +journalctl _SYSTEMD_INVOCATION_ID="$(systemctl show --value --property=InvocationID netdata)" --namespace=netdata --grep prometheus +``` + +#### System without systemd + +Locate the collector log file, typically at `/var/log/netdata/collector.log`, and use `grep` to filter for collector's name: + +```bash +grep prometheus /var/log/netdata/collector.log +``` + +**Note**: This method shows logs from all restarts. Focus on the **latest entries** for troubleshooting current issues. + +#### Docker Container + +If your Netdata runs in a Docker container named "netdata" (replace if different), use this command: + +```bash +docker logs netdata 2>&1 | grep prometheus +``` + diff --git a/src/go/collectors/go.d.plugin/modules/prometheus/integrations/linode.md b/src/go/plugin/go.d/modules/prometheus/integrations/linode.md index 046a57e3d..eff67ae75 100644 --- a/src/go/collectors/go.d.plugin/modules/prometheus/integrations/linode.md +++ b/src/go/plugin/go.d/modules/prometheus/integrations/linode.md @@ -1,6 +1,6 @@ <!--startmeta -custom_edit_url: "https://github.com/netdata/netdata/edit/master/src/go/collectors/go.d.plugin/modules/prometheus/integrations/linode.md" -meta_yaml: "https://github.com/netdata/netdata/edit/master/src/go/collectors/go.d.plugin/modules/prometheus/metadata.yaml" +custom_edit_url: "https://github.com/netdata/netdata/edit/master/src/go/plugin/go.d/modules/prometheus/integrations/linode.md" +meta_yaml: "https://github.com/netdata/netdata/edit/master/src/go/plugin/go.d/modules/prometheus/metadata.yaml" sidebar_label: "Linode" learn_status: "Published" learn_rel_path: "Collecting Metrics/Cloud Provider Managed" @@ -37,7 +37,6 @@ This collector supports collecting metrics from multiple instances of this integ #### Auto-Detection By default, it detects instances running on the local host by trying to connect to known ports that are [allocated to exporters](https://github.com/prometheus/prometheus/wiki/Default-port-allocations). -The full list of endpoints is available in the collector's [configuration file](https://github.com/netdata/netdata/blob/master/src/go/collectors/go.d.plugin/config/go.d/prometheus.conf). #### Limits @@ -138,7 +137,7 @@ The following options can be defined globally: update_every, autodetection_retry This option allows you to filter out unwanted time series. Only metrics matching the selector will be collected. - Logic: (pattern1 OR pattern2) AND !(pattern3 or pattern4) -- Pattern syntax: [selector](/src/go/collectors/go.d.plugin/pkg/prometheus/selector/README.md). +- Pattern syntax: [selector](/src/go/plugin/go.d/pkg/prometheus/selector/README.md). - Option syntax: ```yaml @@ -266,6 +265,8 @@ jobs: ### Debug Mode +**Important**: Debug mode is not supported for data collection jobs created via the UI using the Dyncfg feature. + To troubleshoot issues with the `prometheus` collector, run the `go.d.plugin` with the debug option enabled. The output should give you clues as to why the collector isn't working. @@ -288,4 +289,37 @@ should give you clues as to why the collector isn't working. ./go.d.plugin -d -m prometheus ``` +### Getting Logs + +If you're encountering problems with the `prometheus` collector, follow these steps to retrieve logs and identify potential issues: + +- **Run the command** specific to your system (systemd, non-systemd, or Docker container). +- **Examine the output** for any warnings or error messages that might indicate issues. These messages should provide clues about the root cause of the problem. + +#### System with systemd + +Use the following command to view logs generated since the last Netdata service restart: + +```bash +journalctl _SYSTEMD_INVOCATION_ID="$(systemctl show --value --property=InvocationID netdata)" --namespace=netdata --grep prometheus +``` + +#### System without systemd + +Locate the collector log file, typically at `/var/log/netdata/collector.log`, and use `grep` to filter for collector's name: + +```bash +grep prometheus /var/log/netdata/collector.log +``` + +**Note**: This method shows logs from all restarts. Focus on the **latest entries** for troubleshooting current issues. + +#### Docker Container + +If your Netdata runs in a Docker container named "netdata" (replace if different), use this command: + +```bash +docker logs netdata 2>&1 | grep prometheus +``` + diff --git a/src/go/collectors/go.d.plugin/modules/prometheus/integrations/loki.md b/src/go/plugin/go.d/modules/prometheus/integrations/loki.md index bd607a23e..002634a10 100644 --- a/src/go/collectors/go.d.plugin/modules/prometheus/integrations/loki.md +++ b/src/go/plugin/go.d/modules/prometheus/integrations/loki.md @@ -1,6 +1,6 @@ <!--startmeta -custom_edit_url: "https://github.com/netdata/netdata/edit/master/src/go/collectors/go.d.plugin/modules/prometheus/integrations/loki.md" -meta_yaml: "https://github.com/netdata/netdata/edit/master/src/go/collectors/go.d.plugin/modules/prometheus/metadata.yaml" +custom_edit_url: "https://github.com/netdata/netdata/edit/master/src/go/plugin/go.d/modules/prometheus/integrations/loki.md" +meta_yaml: "https://github.com/netdata/netdata/edit/master/src/go/plugin/go.d/modules/prometheus/metadata.yaml" sidebar_label: "loki" learn_status: "Published" learn_rel_path: "Collecting Metrics/Logs Servers" @@ -37,7 +37,6 @@ This collector supports collecting metrics from multiple instances of this integ #### Auto-Detection By default, it detects instances running on the local host by trying to connect to known ports that are [allocated to exporters](https://github.com/prometheus/prometheus/wiki/Default-port-allocations). -The full list of endpoints is available in the collector's [configuration file](https://github.com/netdata/netdata/blob/master/src/go/collectors/go.d.plugin/config/go.d/prometheus.conf). #### Limits @@ -138,7 +137,7 @@ The following options can be defined globally: update_every, autodetection_retry This option allows you to filter out unwanted time series. Only metrics matching the selector will be collected. - Logic: (pattern1 OR pattern2) AND !(pattern3 or pattern4) -- Pattern syntax: [selector](/src/go/collectors/go.d.plugin/pkg/prometheus/selector/README.md). +- Pattern syntax: [selector](/src/go/plugin/go.d/pkg/prometheus/selector/README.md). - Option syntax: ```yaml @@ -266,6 +265,8 @@ jobs: ### Debug Mode +**Important**: Debug mode is not supported for data collection jobs created via the UI using the Dyncfg feature. + To troubleshoot issues with the `prometheus` collector, run the `go.d.plugin` with the debug option enabled. The output should give you clues as to why the collector isn't working. @@ -288,4 +289,37 @@ should give you clues as to why the collector isn't working. ./go.d.plugin -d -m prometheus ``` +### Getting Logs + +If you're encountering problems with the `prometheus` collector, follow these steps to retrieve logs and identify potential issues: + +- **Run the command** specific to your system (systemd, non-systemd, or Docker container). +- **Examine the output** for any warnings or error messages that might indicate issues. These messages should provide clues about the root cause of the problem. + +#### System with systemd + +Use the following command to view logs generated since the last Netdata service restart: + +```bash +journalctl _SYSTEMD_INVOCATION_ID="$(systemctl show --value --property=InvocationID netdata)" --namespace=netdata --grep prometheus +``` + +#### System without systemd + +Locate the collector log file, typically at `/var/log/netdata/collector.log`, and use `grep` to filter for collector's name: + +```bash +grep prometheus /var/log/netdata/collector.log +``` + +**Note**: This method shows logs from all restarts. Focus on the **latest entries** for troubleshooting current issues. + +#### Docker Container + +If your Netdata runs in a Docker container named "netdata" (replace if different), use this command: + +```bash +docker logs netdata 2>&1 | grep prometheus +``` + diff --git a/src/go/collectors/go.d.plugin/modules/prometheus/integrations/lustre_metadata.md b/src/go/plugin/go.d/modules/prometheus/integrations/lustre_metadata.md index a13c2502d..2fe27331e 100644 --- a/src/go/collectors/go.d.plugin/modules/prometheus/integrations/lustre_metadata.md +++ b/src/go/plugin/go.d/modules/prometheus/integrations/lustre_metadata.md @@ -1,6 +1,6 @@ <!--startmeta -custom_edit_url: "https://github.com/netdata/netdata/edit/master/src/go/collectors/go.d.plugin/modules/prometheus/integrations/lustre_metadata.md" -meta_yaml: "https://github.com/netdata/netdata/edit/master/src/go/collectors/go.d.plugin/modules/prometheus/metadata.yaml" +custom_edit_url: "https://github.com/netdata/netdata/edit/master/src/go/plugin/go.d/modules/prometheus/integrations/lustre_metadata.md" +meta_yaml: "https://github.com/netdata/netdata/edit/master/src/go/plugin/go.d/modules/prometheus/metadata.yaml" sidebar_label: "Lustre metadata" learn_status: "Published" learn_rel_path: "Collecting Metrics/Cloud Provider Managed" @@ -37,7 +37,6 @@ This collector supports collecting metrics from multiple instances of this integ #### Auto-Detection By default, it detects instances running on the local host by trying to connect to known ports that are [allocated to exporters](https://github.com/prometheus/prometheus/wiki/Default-port-allocations). -The full list of endpoints is available in the collector's [configuration file](https://github.com/netdata/netdata/blob/master/src/go/collectors/go.d.plugin/config/go.d/prometheus.conf). #### Limits @@ -138,7 +137,7 @@ The following options can be defined globally: update_every, autodetection_retry This option allows you to filter out unwanted time series. Only metrics matching the selector will be collected. - Logic: (pattern1 OR pattern2) AND !(pattern3 or pattern4) -- Pattern syntax: [selector](/src/go/collectors/go.d.plugin/pkg/prometheus/selector/README.md). +- Pattern syntax: [selector](/src/go/plugin/go.d/pkg/prometheus/selector/README.md). - Option syntax: ```yaml @@ -266,6 +265,8 @@ jobs: ### Debug Mode +**Important**: Debug mode is not supported for data collection jobs created via the UI using the Dyncfg feature. + To troubleshoot issues with the `prometheus` collector, run the `go.d.plugin` with the debug option enabled. The output should give you clues as to why the collector isn't working. @@ -288,4 +289,37 @@ should give you clues as to why the collector isn't working. ./go.d.plugin -d -m prometheus ``` +### Getting Logs + +If you're encountering problems with the `prometheus` collector, follow these steps to retrieve logs and identify potential issues: + +- **Run the command** specific to your system (systemd, non-systemd, or Docker container). +- **Examine the output** for any warnings or error messages that might indicate issues. These messages should provide clues about the root cause of the problem. + +#### System with systemd + +Use the following command to view logs generated since the last Netdata service restart: + +```bash +journalctl _SYSTEMD_INVOCATION_ID="$(systemctl show --value --property=InvocationID netdata)" --namespace=netdata --grep prometheus +``` + +#### System without systemd + +Locate the collector log file, typically at `/var/log/netdata/collector.log`, and use `grep` to filter for collector's name: + +```bash +grep prometheus /var/log/netdata/collector.log +``` + +**Note**: This method shows logs from all restarts. Focus on the **latest entries** for troubleshooting current issues. + +#### Docker Container + +If your Netdata runs in a Docker container named "netdata" (replace if different), use this command: + +```bash +docker logs netdata 2>&1 | grep prometheus +``` + diff --git a/src/go/collectors/go.d.plugin/modules/prometheus/integrations/lynis_audit_reports.md b/src/go/plugin/go.d/modules/prometheus/integrations/lynis_audit_reports.md index 13b2ef300..47b87c2d3 100644 --- a/src/go/collectors/go.d.plugin/modules/prometheus/integrations/lynis_audit_reports.md +++ b/src/go/plugin/go.d/modules/prometheus/integrations/lynis_audit_reports.md @@ -1,6 +1,6 @@ <!--startmeta -custom_edit_url: "https://github.com/netdata/netdata/edit/master/src/go/collectors/go.d.plugin/modules/prometheus/integrations/lynis_audit_reports.md" -meta_yaml: "https://github.com/netdata/netdata/edit/master/src/go/collectors/go.d.plugin/modules/prometheus/metadata.yaml" +custom_edit_url: "https://github.com/netdata/netdata/edit/master/src/go/plugin/go.d/modules/prometheus/integrations/lynis_audit_reports.md" +meta_yaml: "https://github.com/netdata/netdata/edit/master/src/go/plugin/go.d/modules/prometheus/metadata.yaml" sidebar_label: "Lynis audit reports" learn_status: "Published" learn_rel_path: "Collecting Metrics/Security Systems" @@ -37,7 +37,6 @@ This collector supports collecting metrics from multiple instances of this integ #### Auto-Detection By default, it detects instances running on the local host by trying to connect to known ports that are [allocated to exporters](https://github.com/prometheus/prometheus/wiki/Default-port-allocations). -The full list of endpoints is available in the collector's [configuration file](https://github.com/netdata/netdata/blob/master/src/go/collectors/go.d.plugin/config/go.d/prometheus.conf). #### Limits @@ -138,7 +137,7 @@ The following options can be defined globally: update_every, autodetection_retry This option allows you to filter out unwanted time series. Only metrics matching the selector will be collected. - Logic: (pattern1 OR pattern2) AND !(pattern3 or pattern4) -- Pattern syntax: [selector](/src/go/collectors/go.d.plugin/pkg/prometheus/selector/README.md). +- Pattern syntax: [selector](/src/go/plugin/go.d/pkg/prometheus/selector/README.md). - Option syntax: ```yaml @@ -266,6 +265,8 @@ jobs: ### Debug Mode +**Important**: Debug mode is not supported for data collection jobs created via the UI using the Dyncfg feature. + To troubleshoot issues with the `prometheus` collector, run the `go.d.plugin` with the debug option enabled. The output should give you clues as to why the collector isn't working. @@ -288,4 +289,37 @@ should give you clues as to why the collector isn't working. ./go.d.plugin -d -m prometheus ``` +### Getting Logs + +If you're encountering problems with the `prometheus` collector, follow these steps to retrieve logs and identify potential issues: + +- **Run the command** specific to your system (systemd, non-systemd, or Docker container). +- **Examine the output** for any warnings or error messages that might indicate issues. These messages should provide clues about the root cause of the problem. + +#### System with systemd + +Use the following command to view logs generated since the last Netdata service restart: + +```bash +journalctl _SYSTEMD_INVOCATION_ID="$(systemctl show --value --property=InvocationID netdata)" --namespace=netdata --grep prometheus +``` + +#### System without systemd + +Locate the collector log file, typically at `/var/log/netdata/collector.log`, and use `grep` to filter for collector's name: + +```bash +grep prometheus /var/log/netdata/collector.log +``` + +**Note**: This method shows logs from all restarts. Focus on the **latest entries** for troubleshooting current issues. + +#### Docker Container + +If your Netdata runs in a Docker container named "netdata" (replace if different), use this command: + +```bash +docker logs netdata 2>&1 | grep prometheus +``` + diff --git a/src/go/collectors/go.d.plugin/modules/prometheus/integrations/machbase.md b/src/go/plugin/go.d/modules/prometheus/integrations/machbase.md index 48dd9aee0..23e928296 100644 --- a/src/go/collectors/go.d.plugin/modules/prometheus/integrations/machbase.md +++ b/src/go/plugin/go.d/modules/prometheus/integrations/machbase.md @@ -1,6 +1,6 @@ <!--startmeta -custom_edit_url: "https://github.com/netdata/netdata/edit/master/src/go/collectors/go.d.plugin/modules/prometheus/integrations/machbase.md" -meta_yaml: "https://github.com/netdata/netdata/edit/master/src/go/collectors/go.d.plugin/modules/prometheus/metadata.yaml" +custom_edit_url: "https://github.com/netdata/netdata/edit/master/src/go/plugin/go.d/modules/prometheus/integrations/machbase.md" +meta_yaml: "https://github.com/netdata/netdata/edit/master/src/go/plugin/go.d/modules/prometheus/metadata.yaml" sidebar_label: "Machbase" learn_status: "Published" learn_rel_path: "Collecting Metrics/Databases" @@ -37,7 +37,6 @@ This collector supports collecting metrics from multiple instances of this integ #### Auto-Detection By default, it detects instances running on the local host by trying to connect to known ports that are [allocated to exporters](https://github.com/prometheus/prometheus/wiki/Default-port-allocations). -The full list of endpoints is available in the collector's [configuration file](https://github.com/netdata/netdata/blob/master/src/go/collectors/go.d.plugin/config/go.d/prometheus.conf). #### Limits @@ -138,7 +137,7 @@ The following options can be defined globally: update_every, autodetection_retry This option allows you to filter out unwanted time series. Only metrics matching the selector will be collected. - Logic: (pattern1 OR pattern2) AND !(pattern3 or pattern4) -- Pattern syntax: [selector](/src/go/collectors/go.d.plugin/pkg/prometheus/selector/README.md). +- Pattern syntax: [selector](/src/go/plugin/go.d/pkg/prometheus/selector/README.md). - Option syntax: ```yaml @@ -266,6 +265,8 @@ jobs: ### Debug Mode +**Important**: Debug mode is not supported for data collection jobs created via the UI using the Dyncfg feature. + To troubleshoot issues with the `prometheus` collector, run the `go.d.plugin` with the debug option enabled. The output should give you clues as to why the collector isn't working. @@ -288,4 +289,37 @@ should give you clues as to why the collector isn't working. ./go.d.plugin -d -m prometheus ``` +### Getting Logs + +If you're encountering problems with the `prometheus` collector, follow these steps to retrieve logs and identify potential issues: + +- **Run the command** specific to your system (systemd, non-systemd, or Docker container). +- **Examine the output** for any warnings or error messages that might indicate issues. These messages should provide clues about the root cause of the problem. + +#### System with systemd + +Use the following command to view logs generated since the last Netdata service restart: + +```bash +journalctl _SYSTEMD_INVOCATION_ID="$(systemctl show --value --property=InvocationID netdata)" --namespace=netdata --grep prometheus +``` + +#### System without systemd + +Locate the collector log file, typically at `/var/log/netdata/collector.log`, and use `grep` to filter for collector's name: + +```bash +grep prometheus /var/log/netdata/collector.log +``` + +**Note**: This method shows logs from all restarts. Focus on the **latest entries** for troubleshooting current issues. + +#### Docker Container + +If your Netdata runs in a Docker container named "netdata" (replace if different), use this command: + +```bash +docker logs netdata 2>&1 | grep prometheus +``` + diff --git a/src/go/collectors/go.d.plugin/modules/prometheus/integrations/maildir.md b/src/go/plugin/go.d/modules/prometheus/integrations/maildir.md index 69c8003eb..a7c106e83 100644 --- a/src/go/collectors/go.d.plugin/modules/prometheus/integrations/maildir.md +++ b/src/go/plugin/go.d/modules/prometheus/integrations/maildir.md @@ -1,6 +1,6 @@ <!--startmeta -custom_edit_url: "https://github.com/netdata/netdata/edit/master/src/go/collectors/go.d.plugin/modules/prometheus/integrations/maildir.md" -meta_yaml: "https://github.com/netdata/netdata/edit/master/src/go/collectors/go.d.plugin/modules/prometheus/metadata.yaml" +custom_edit_url: "https://github.com/netdata/netdata/edit/master/src/go/plugin/go.d/modules/prometheus/integrations/maildir.md" +meta_yaml: "https://github.com/netdata/netdata/edit/master/src/go/plugin/go.d/modules/prometheus/metadata.yaml" sidebar_label: "Maildir" learn_status: "Published" learn_rel_path: "Collecting Metrics/Mail Servers" @@ -37,7 +37,6 @@ This collector supports collecting metrics from multiple instances of this integ #### Auto-Detection By default, it detects instances running on the local host by trying to connect to known ports that are [allocated to exporters](https://github.com/prometheus/prometheus/wiki/Default-port-allocations). -The full list of endpoints is available in the collector's [configuration file](https://github.com/netdata/netdata/blob/master/src/go/collectors/go.d.plugin/config/go.d/prometheus.conf). #### Limits @@ -138,7 +137,7 @@ The following options can be defined globally: update_every, autodetection_retry This option allows you to filter out unwanted time series. Only metrics matching the selector will be collected. - Logic: (pattern1 OR pattern2) AND !(pattern3 or pattern4) -- Pattern syntax: [selector](/src/go/collectors/go.d.plugin/pkg/prometheus/selector/README.md). +- Pattern syntax: [selector](/src/go/plugin/go.d/pkg/prometheus/selector/README.md). - Option syntax: ```yaml @@ -266,6 +265,8 @@ jobs: ### Debug Mode +**Important**: Debug mode is not supported for data collection jobs created via the UI using the Dyncfg feature. + To troubleshoot issues with the `prometheus` collector, run the `go.d.plugin` with the debug option enabled. The output should give you clues as to why the collector isn't working. @@ -288,4 +289,37 @@ should give you clues as to why the collector isn't working. ./go.d.plugin -d -m prometheus ``` +### Getting Logs + +If you're encountering problems with the `prometheus` collector, follow these steps to retrieve logs and identify potential issues: + +- **Run the command** specific to your system (systemd, non-systemd, or Docker container). +- **Examine the output** for any warnings or error messages that might indicate issues. These messages should provide clues about the root cause of the problem. + +#### System with systemd + +Use the following command to view logs generated since the last Netdata service restart: + +```bash +journalctl _SYSTEMD_INVOCATION_ID="$(systemctl show --value --property=InvocationID netdata)" --namespace=netdata --grep prometheus +``` + +#### System without systemd + +Locate the collector log file, typically at `/var/log/netdata/collector.log`, and use `grep` to filter for collector's name: + +```bash +grep prometheus /var/log/netdata/collector.log +``` + +**Note**: This method shows logs from all restarts. Focus on the **latest entries** for troubleshooting current issues. + +#### Docker Container + +If your Netdata runs in a Docker container named "netdata" (replace if different), use this command: + +```bash +docker logs netdata 2>&1 | grep prometheus +``` + diff --git a/src/go/collectors/go.d.plugin/modules/prometheus/integrations/meilisearch.md b/src/go/plugin/go.d/modules/prometheus/integrations/meilisearch.md index 3b22f13c6..60cad4a91 100644 --- a/src/go/collectors/go.d.plugin/modules/prometheus/integrations/meilisearch.md +++ b/src/go/plugin/go.d/modules/prometheus/integrations/meilisearch.md @@ -1,6 +1,6 @@ <!--startmeta -custom_edit_url: "https://github.com/netdata/netdata/edit/master/src/go/collectors/go.d.plugin/modules/prometheus/integrations/meilisearch.md" -meta_yaml: "https://github.com/netdata/netdata/edit/master/src/go/collectors/go.d.plugin/modules/prometheus/metadata.yaml" +custom_edit_url: "https://github.com/netdata/netdata/edit/master/src/go/plugin/go.d/modules/prometheus/integrations/meilisearch.md" +meta_yaml: "https://github.com/netdata/netdata/edit/master/src/go/plugin/go.d/modules/prometheus/metadata.yaml" sidebar_label: "Meilisearch" learn_status: "Published" learn_rel_path: "Collecting Metrics/Search Engines" @@ -37,7 +37,6 @@ This collector supports collecting metrics from multiple instances of this integ #### Auto-Detection By default, it detects instances running on the local host by trying to connect to known ports that are [allocated to exporters](https://github.com/prometheus/prometheus/wiki/Default-port-allocations). -The full list of endpoints is available in the collector's [configuration file](https://github.com/netdata/netdata/blob/master/src/go/collectors/go.d.plugin/config/go.d/prometheus.conf). #### Limits @@ -138,7 +137,7 @@ The following options can be defined globally: update_every, autodetection_retry This option allows you to filter out unwanted time series. Only metrics matching the selector will be collected. - Logic: (pattern1 OR pattern2) AND !(pattern3 or pattern4) -- Pattern syntax: [selector](/src/go/collectors/go.d.plugin/pkg/prometheus/selector/README.md). +- Pattern syntax: [selector](/src/go/plugin/go.d/pkg/prometheus/selector/README.md). - Option syntax: ```yaml @@ -266,6 +265,8 @@ jobs: ### Debug Mode +**Important**: Debug mode is not supported for data collection jobs created via the UI using the Dyncfg feature. + To troubleshoot issues with the `prometheus` collector, run the `go.d.plugin` with the debug option enabled. The output should give you clues as to why the collector isn't working. @@ -288,4 +289,37 @@ should give you clues as to why the collector isn't working. ./go.d.plugin -d -m prometheus ``` +### Getting Logs + +If you're encountering problems with the `prometheus` collector, follow these steps to retrieve logs and identify potential issues: + +- **Run the command** specific to your system (systemd, non-systemd, or Docker container). +- **Examine the output** for any warnings or error messages that might indicate issues. These messages should provide clues about the root cause of the problem. + +#### System with systemd + +Use the following command to view logs generated since the last Netdata service restart: + +```bash +journalctl _SYSTEMD_INVOCATION_ID="$(systemctl show --value --property=InvocationID netdata)" --namespace=netdata --grep prometheus +``` + +#### System without systemd + +Locate the collector log file, typically at `/var/log/netdata/collector.log`, and use `grep` to filter for collector's name: + +```bash +grep prometheus /var/log/netdata/collector.log +``` + +**Note**: This method shows logs from all restarts. Focus on the **latest entries** for troubleshooting current issues. + +#### Docker Container + +If your Netdata runs in a Docker container named "netdata" (replace if different), use this command: + +```bash +docker logs netdata 2>&1 | grep prometheus +``` + diff --git a/src/go/collectors/go.d.plugin/modules/prometheus/integrations/memcached_community.md b/src/go/plugin/go.d/modules/prometheus/integrations/memcached_community.md index 83b53f8cd..45acae167 100644 --- a/src/go/collectors/go.d.plugin/modules/prometheus/integrations/memcached_community.md +++ b/src/go/plugin/go.d/modules/prometheus/integrations/memcached_community.md @@ -1,6 +1,6 @@ <!--startmeta -custom_edit_url: "https://github.com/netdata/netdata/edit/master/src/go/collectors/go.d.plugin/modules/prometheus/integrations/memcached_community.md" -meta_yaml: "https://github.com/netdata/netdata/edit/master/src/go/collectors/go.d.plugin/modules/prometheus/metadata.yaml" +custom_edit_url: "https://github.com/netdata/netdata/edit/master/src/go/plugin/go.d/modules/prometheus/integrations/memcached_community.md" +meta_yaml: "https://github.com/netdata/netdata/edit/master/src/go/plugin/go.d/modules/prometheus/metadata.yaml" sidebar_label: "Memcached (community)" learn_status: "Published" learn_rel_path: "Collecting Metrics/Databases" @@ -37,7 +37,6 @@ This collector supports collecting metrics from multiple instances of this integ #### Auto-Detection By default, it detects instances running on the local host by trying to connect to known ports that are [allocated to exporters](https://github.com/prometheus/prometheus/wiki/Default-port-allocations). -The full list of endpoints is available in the collector's [configuration file](https://github.com/netdata/netdata/blob/master/src/go/collectors/go.d.plugin/config/go.d/prometheus.conf). #### Limits @@ -138,7 +137,7 @@ The following options can be defined globally: update_every, autodetection_retry This option allows you to filter out unwanted time series. Only metrics matching the selector will be collected. - Logic: (pattern1 OR pattern2) AND !(pattern3 or pattern4) -- Pattern syntax: [selector](/src/go/collectors/go.d.plugin/pkg/prometheus/selector/README.md). +- Pattern syntax: [selector](/src/go/plugin/go.d/pkg/prometheus/selector/README.md). - Option syntax: ```yaml @@ -266,6 +265,8 @@ jobs: ### Debug Mode +**Important**: Debug mode is not supported for data collection jobs created via the UI using the Dyncfg feature. + To troubleshoot issues with the `prometheus` collector, run the `go.d.plugin` with the debug option enabled. The output should give you clues as to why the collector isn't working. @@ -288,4 +289,37 @@ should give you clues as to why the collector isn't working. ./go.d.plugin -d -m prometheus ``` +### Getting Logs + +If you're encountering problems with the `prometheus` collector, follow these steps to retrieve logs and identify potential issues: + +- **Run the command** specific to your system (systemd, non-systemd, or Docker container). +- **Examine the output** for any warnings or error messages that might indicate issues. These messages should provide clues about the root cause of the problem. + +#### System with systemd + +Use the following command to view logs generated since the last Netdata service restart: + +```bash +journalctl _SYSTEMD_INVOCATION_ID="$(systemctl show --value --property=InvocationID netdata)" --namespace=netdata --grep prometheus +``` + +#### System without systemd + +Locate the collector log file, typically at `/var/log/netdata/collector.log`, and use `grep` to filter for collector's name: + +```bash +grep prometheus /var/log/netdata/collector.log +``` + +**Note**: This method shows logs from all restarts. Focus on the **latest entries** for troubleshooting current issues. + +#### Docker Container + +If your Netdata runs in a Docker container named "netdata" (replace if different), use this command: + +```bash +docker logs netdata 2>&1 | grep prometheus +``` + diff --git a/src/go/collectors/go.d.plugin/modules/prometheus/integrations/meraki_dashboard.md b/src/go/plugin/go.d/modules/prometheus/integrations/meraki_dashboard.md index 83bb309f4..28626195a 100644 --- a/src/go/collectors/go.d.plugin/modules/prometheus/integrations/meraki_dashboard.md +++ b/src/go/plugin/go.d/modules/prometheus/integrations/meraki_dashboard.md @@ -1,6 +1,6 @@ <!--startmeta -custom_edit_url: "https://github.com/netdata/netdata/edit/master/src/go/collectors/go.d.plugin/modules/prometheus/integrations/meraki_dashboard.md" -meta_yaml: "https://github.com/netdata/netdata/edit/master/src/go/collectors/go.d.plugin/modules/prometheus/metadata.yaml" +custom_edit_url: "https://github.com/netdata/netdata/edit/master/src/go/plugin/go.d/modules/prometheus/integrations/meraki_dashboard.md" +meta_yaml: "https://github.com/netdata/netdata/edit/master/src/go/plugin/go.d/modules/prometheus/metadata.yaml" sidebar_label: "Meraki dashboard" learn_status: "Published" learn_rel_path: "Collecting Metrics/Networking Stack and Network Interfaces" @@ -37,7 +37,6 @@ This collector supports collecting metrics from multiple instances of this integ #### Auto-Detection By default, it detects instances running on the local host by trying to connect to known ports that are [allocated to exporters](https://github.com/prometheus/prometheus/wiki/Default-port-allocations). -The full list of endpoints is available in the collector's [configuration file](https://github.com/netdata/netdata/blob/master/src/go/collectors/go.d.plugin/config/go.d/prometheus.conf). #### Limits @@ -138,7 +137,7 @@ The following options can be defined globally: update_every, autodetection_retry This option allows you to filter out unwanted time series. Only metrics matching the selector will be collected. - Logic: (pattern1 OR pattern2) AND !(pattern3 or pattern4) -- Pattern syntax: [selector](/src/go/collectors/go.d.plugin/pkg/prometheus/selector/README.md). +- Pattern syntax: [selector](/src/go/plugin/go.d/pkg/prometheus/selector/README.md). - Option syntax: ```yaml @@ -266,6 +265,8 @@ jobs: ### Debug Mode +**Important**: Debug mode is not supported for data collection jobs created via the UI using the Dyncfg feature. + To troubleshoot issues with the `prometheus` collector, run the `go.d.plugin` with the debug option enabled. The output should give you clues as to why the collector isn't working. @@ -288,4 +289,37 @@ should give you clues as to why the collector isn't working. ./go.d.plugin -d -m prometheus ``` +### Getting Logs + +If you're encountering problems with the `prometheus` collector, follow these steps to retrieve logs and identify potential issues: + +- **Run the command** specific to your system (systemd, non-systemd, or Docker container). +- **Examine the output** for any warnings or error messages that might indicate issues. These messages should provide clues about the root cause of the problem. + +#### System with systemd + +Use the following command to view logs generated since the last Netdata service restart: + +```bash +journalctl _SYSTEMD_INVOCATION_ID="$(systemctl show --value --property=InvocationID netdata)" --namespace=netdata --grep prometheus +``` + +#### System without systemd + +Locate the collector log file, typically at `/var/log/netdata/collector.log`, and use `grep` to filter for collector's name: + +```bash +grep prometheus /var/log/netdata/collector.log +``` + +**Note**: This method shows logs from all restarts. Focus on the **latest entries** for troubleshooting current issues. + +#### Docker Container + +If your Netdata runs in a Docker container named "netdata" (replace if different), use this command: + +```bash +docker logs netdata 2>&1 | grep prometheus +``` + diff --git a/src/go/collectors/go.d.plugin/modules/prometheus/integrations/mesos.md b/src/go/plugin/go.d/modules/prometheus/integrations/mesos.md index 094d53b8a..c1f7cd0ee 100644 --- a/src/go/collectors/go.d.plugin/modules/prometheus/integrations/mesos.md +++ b/src/go/plugin/go.d/modules/prometheus/integrations/mesos.md @@ -1,6 +1,6 @@ <!--startmeta -custom_edit_url: "https://github.com/netdata/netdata/edit/master/src/go/collectors/go.d.plugin/modules/prometheus/integrations/mesos.md" -meta_yaml: "https://github.com/netdata/netdata/edit/master/src/go/collectors/go.d.plugin/modules/prometheus/metadata.yaml" +custom_edit_url: "https://github.com/netdata/netdata/edit/master/src/go/plugin/go.d/modules/prometheus/integrations/mesos.md" +meta_yaml: "https://github.com/netdata/netdata/edit/master/src/go/plugin/go.d/modules/prometheus/metadata.yaml" sidebar_label: "Mesos" learn_status: "Published" learn_rel_path: "Collecting Metrics/Task Queues" @@ -37,7 +37,6 @@ This collector supports collecting metrics from multiple instances of this integ #### Auto-Detection By default, it detects instances running on the local host by trying to connect to known ports that are [allocated to exporters](https://github.com/prometheus/prometheus/wiki/Default-port-allocations). -The full list of endpoints is available in the collector's [configuration file](https://github.com/netdata/netdata/blob/master/src/go/collectors/go.d.plugin/config/go.d/prometheus.conf). #### Limits @@ -138,7 +137,7 @@ The following options can be defined globally: update_every, autodetection_retry This option allows you to filter out unwanted time series. Only metrics matching the selector will be collected. - Logic: (pattern1 OR pattern2) AND !(pattern3 or pattern4) -- Pattern syntax: [selector](/src/go/collectors/go.d.plugin/pkg/prometheus/selector/README.md). +- Pattern syntax: [selector](/src/go/plugin/go.d/pkg/prometheus/selector/README.md). - Option syntax: ```yaml @@ -266,6 +265,8 @@ jobs: ### Debug Mode +**Important**: Debug mode is not supported for data collection jobs created via the UI using the Dyncfg feature. + To troubleshoot issues with the `prometheus` collector, run the `go.d.plugin` with the debug option enabled. The output should give you clues as to why the collector isn't working. @@ -288,4 +289,37 @@ should give you clues as to why the collector isn't working. ./go.d.plugin -d -m prometheus ``` +### Getting Logs + +If you're encountering problems with the `prometheus` collector, follow these steps to retrieve logs and identify potential issues: + +- **Run the command** specific to your system (systemd, non-systemd, or Docker container). +- **Examine the output** for any warnings or error messages that might indicate issues. These messages should provide clues about the root cause of the problem. + +#### System with systemd + +Use the following command to view logs generated since the last Netdata service restart: + +```bash +journalctl _SYSTEMD_INVOCATION_ID="$(systemctl show --value --property=InvocationID netdata)" --namespace=netdata --grep prometheus +``` + +#### System without systemd + +Locate the collector log file, typically at `/var/log/netdata/collector.log`, and use `grep` to filter for collector's name: + +```bash +grep prometheus /var/log/netdata/collector.log +``` + +**Note**: This method shows logs from all restarts. Focus on the **latest entries** for troubleshooting current issues. + +#### Docker Container + +If your Netdata runs in a Docker container named "netdata" (replace if different), use this command: + +```bash +docker logs netdata 2>&1 | grep prometheus +``` + diff --git a/src/go/collectors/go.d.plugin/modules/prometheus/integrations/mikrotik_devices.md b/src/go/plugin/go.d/modules/prometheus/integrations/mikrotik_devices.md index cac9a8c64..8d846fd26 100644 --- a/src/go/collectors/go.d.plugin/modules/prometheus/integrations/mikrotik_devices.md +++ b/src/go/plugin/go.d/modules/prometheus/integrations/mikrotik_devices.md @@ -1,6 +1,6 @@ <!--startmeta -custom_edit_url: "https://github.com/netdata/netdata/edit/master/src/go/collectors/go.d.plugin/modules/prometheus/integrations/mikrotik_devices.md" -meta_yaml: "https://github.com/netdata/netdata/edit/master/src/go/collectors/go.d.plugin/modules/prometheus/metadata.yaml" +custom_edit_url: "https://github.com/netdata/netdata/edit/master/src/go/plugin/go.d/modules/prometheus/integrations/mikrotik_devices.md" +meta_yaml: "https://github.com/netdata/netdata/edit/master/src/go/plugin/go.d/modules/prometheus/metadata.yaml" sidebar_label: "MikroTik devices" learn_status: "Published" learn_rel_path: "Collecting Metrics/Networking Stack and Network Interfaces" @@ -37,7 +37,6 @@ This collector supports collecting metrics from multiple instances of this integ #### Auto-Detection By default, it detects instances running on the local host by trying to connect to known ports that are [allocated to exporters](https://github.com/prometheus/prometheus/wiki/Default-port-allocations). -The full list of endpoints is available in the collector's [configuration file](https://github.com/netdata/netdata/blob/master/src/go/collectors/go.d.plugin/config/go.d/prometheus.conf). #### Limits @@ -138,7 +137,7 @@ The following options can be defined globally: update_every, autodetection_retry This option allows you to filter out unwanted time series. Only metrics matching the selector will be collected. - Logic: (pattern1 OR pattern2) AND !(pattern3 or pattern4) -- Pattern syntax: [selector](/src/go/collectors/go.d.plugin/pkg/prometheus/selector/README.md). +- Pattern syntax: [selector](/src/go/plugin/go.d/pkg/prometheus/selector/README.md). - Option syntax: ```yaml @@ -266,6 +265,8 @@ jobs: ### Debug Mode +**Important**: Debug mode is not supported for data collection jobs created via the UI using the Dyncfg feature. + To troubleshoot issues with the `prometheus` collector, run the `go.d.plugin` with the debug option enabled. The output should give you clues as to why the collector isn't working. @@ -288,4 +289,37 @@ should give you clues as to why the collector isn't working. ./go.d.plugin -d -m prometheus ``` +### Getting Logs + +If you're encountering problems with the `prometheus` collector, follow these steps to retrieve logs and identify potential issues: + +- **Run the command** specific to your system (systemd, non-systemd, or Docker container). +- **Examine the output** for any warnings or error messages that might indicate issues. These messages should provide clues about the root cause of the problem. + +#### System with systemd + +Use the following command to view logs generated since the last Netdata service restart: + +```bash +journalctl _SYSTEMD_INVOCATION_ID="$(systemctl show --value --property=InvocationID netdata)" --namespace=netdata --grep prometheus +``` + +#### System without systemd + +Locate the collector log file, typically at `/var/log/netdata/collector.log`, and use `grep` to filter for collector's name: + +```bash +grep prometheus /var/log/netdata/collector.log +``` + +**Note**: This method shows logs from all restarts. Focus on the **latest entries** for troubleshooting current issues. + +#### Docker Container + +If your Netdata runs in a Docker container named "netdata" (replace if different), use this command: + +```bash +docker logs netdata 2>&1 | grep prometheus +``` + diff --git a/src/go/collectors/go.d.plugin/modules/prometheus/integrations/mikrotik_routeros_devices.md b/src/go/plugin/go.d/modules/prometheus/integrations/mikrotik_routeros_devices.md index 5060a2d25..e988add25 100644 --- a/src/go/collectors/go.d.plugin/modules/prometheus/integrations/mikrotik_routeros_devices.md +++ b/src/go/plugin/go.d/modules/prometheus/integrations/mikrotik_routeros_devices.md @@ -1,6 +1,6 @@ <!--startmeta -custom_edit_url: "https://github.com/netdata/netdata/edit/master/src/go/collectors/go.d.plugin/modules/prometheus/integrations/mikrotik_routeros_devices.md" -meta_yaml: "https://github.com/netdata/netdata/edit/master/src/go/collectors/go.d.plugin/modules/prometheus/metadata.yaml" +custom_edit_url: "https://github.com/netdata/netdata/edit/master/src/go/plugin/go.d/modules/prometheus/integrations/mikrotik_routeros_devices.md" +meta_yaml: "https://github.com/netdata/netdata/edit/master/src/go/plugin/go.d/modules/prometheus/metadata.yaml" sidebar_label: "Mikrotik RouterOS devices" learn_status: "Published" learn_rel_path: "Collecting Metrics/Networking Stack and Network Interfaces" @@ -37,7 +37,6 @@ This collector supports collecting metrics from multiple instances of this integ #### Auto-Detection By default, it detects instances running on the local host by trying to connect to known ports that are [allocated to exporters](https://github.com/prometheus/prometheus/wiki/Default-port-allocations). -The full list of endpoints is available in the collector's [configuration file](https://github.com/netdata/netdata/blob/master/src/go/collectors/go.d.plugin/config/go.d/prometheus.conf). #### Limits @@ -138,7 +137,7 @@ The following options can be defined globally: update_every, autodetection_retry This option allows you to filter out unwanted time series. Only metrics matching the selector will be collected. - Logic: (pattern1 OR pattern2) AND !(pattern3 or pattern4) -- Pattern syntax: [selector](/src/go/collectors/go.d.plugin/pkg/prometheus/selector/README.md). +- Pattern syntax: [selector](/src/go/plugin/go.d/pkg/prometheus/selector/README.md). - Option syntax: ```yaml @@ -266,6 +265,8 @@ jobs: ### Debug Mode +**Important**: Debug mode is not supported for data collection jobs created via the UI using the Dyncfg feature. + To troubleshoot issues with the `prometheus` collector, run the `go.d.plugin` with the debug option enabled. The output should give you clues as to why the collector isn't working. @@ -288,4 +289,37 @@ should give you clues as to why the collector isn't working. ./go.d.plugin -d -m prometheus ``` +### Getting Logs + +If you're encountering problems with the `prometheus` collector, follow these steps to retrieve logs and identify potential issues: + +- **Run the command** specific to your system (systemd, non-systemd, or Docker container). +- **Examine the output** for any warnings or error messages that might indicate issues. These messages should provide clues about the root cause of the problem. + +#### System with systemd + +Use the following command to view logs generated since the last Netdata service restart: + +```bash +journalctl _SYSTEMD_INVOCATION_ID="$(systemctl show --value --property=InvocationID netdata)" --namespace=netdata --grep prometheus +``` + +#### System without systemd + +Locate the collector log file, typically at `/var/log/netdata/collector.log`, and use `grep` to filter for collector's name: + +```bash +grep prometheus /var/log/netdata/collector.log +``` + +**Note**: This method shows logs from all restarts. Focus on the **latest entries** for troubleshooting current issues. + +#### Docker Container + +If your Netdata runs in a Docker container named "netdata" (replace if different), use this command: + +```bash +docker logs netdata 2>&1 | grep prometheus +``` + diff --git a/src/go/collectors/go.d.plugin/modules/prometheus/integrations/minecraft.md b/src/go/plugin/go.d/modules/prometheus/integrations/minecraft.md index 7926ef8aa..f8649bbcb 100644 --- a/src/go/collectors/go.d.plugin/modules/prometheus/integrations/minecraft.md +++ b/src/go/plugin/go.d/modules/prometheus/integrations/minecraft.md @@ -1,6 +1,6 @@ <!--startmeta -custom_edit_url: "https://github.com/netdata/netdata/edit/master/src/go/collectors/go.d.plugin/modules/prometheus/integrations/minecraft.md" -meta_yaml: "https://github.com/netdata/netdata/edit/master/src/go/collectors/go.d.plugin/modules/prometheus/metadata.yaml" +custom_edit_url: "https://github.com/netdata/netdata/edit/master/src/go/plugin/go.d/modules/prometheus/integrations/minecraft.md" +meta_yaml: "https://github.com/netdata/netdata/edit/master/src/go/plugin/go.d/modules/prometheus/metadata.yaml" sidebar_label: "Minecraft" learn_status: "Published" learn_rel_path: "Collecting Metrics/Gaming" @@ -37,7 +37,6 @@ This collector supports collecting metrics from multiple instances of this integ #### Auto-Detection By default, it detects instances running on the local host by trying to connect to known ports that are [allocated to exporters](https://github.com/prometheus/prometheus/wiki/Default-port-allocations). -The full list of endpoints is available in the collector's [configuration file](https://github.com/netdata/netdata/blob/master/src/go/collectors/go.d.plugin/config/go.d/prometheus.conf). #### Limits @@ -138,7 +137,7 @@ The following options can be defined globally: update_every, autodetection_retry This option allows you to filter out unwanted time series. Only metrics matching the selector will be collected. - Logic: (pattern1 OR pattern2) AND !(pattern3 or pattern4) -- Pattern syntax: [selector](/src/go/collectors/go.d.plugin/pkg/prometheus/selector/README.md). +- Pattern syntax: [selector](/src/go/plugin/go.d/pkg/prometheus/selector/README.md). - Option syntax: ```yaml @@ -266,6 +265,8 @@ jobs: ### Debug Mode +**Important**: Debug mode is not supported for data collection jobs created via the UI using the Dyncfg feature. + To troubleshoot issues with the `prometheus` collector, run the `go.d.plugin` with the debug option enabled. The output should give you clues as to why the collector isn't working. @@ -288,4 +289,37 @@ should give you clues as to why the collector isn't working. ./go.d.plugin -d -m prometheus ``` +### Getting Logs + +If you're encountering problems with the `prometheus` collector, follow these steps to retrieve logs and identify potential issues: + +- **Run the command** specific to your system (systemd, non-systemd, or Docker container). +- **Examine the output** for any warnings or error messages that might indicate issues. These messages should provide clues about the root cause of the problem. + +#### System with systemd + +Use the following command to view logs generated since the last Netdata service restart: + +```bash +journalctl _SYSTEMD_INVOCATION_ID="$(systemctl show --value --property=InvocationID netdata)" --namespace=netdata --grep prometheus +``` + +#### System without systemd + +Locate the collector log file, typically at `/var/log/netdata/collector.log`, and use `grep` to filter for collector's name: + +```bash +grep prometheus /var/log/netdata/collector.log +``` + +**Note**: This method shows logs from all restarts. Focus on the **latest entries** for troubleshooting current issues. + +#### Docker Container + +If your Netdata runs in a Docker container named "netdata" (replace if different), use this command: + +```bash +docker logs netdata 2>&1 | grep prometheus +``` + diff --git a/src/go/collectors/go.d.plugin/modules/prometheus/integrations/modbus_protocol.md b/src/go/plugin/go.d/modules/prometheus/integrations/modbus_protocol.md index 8712f31cd..f6266cd43 100644 --- a/src/go/collectors/go.d.plugin/modules/prometheus/integrations/modbus_protocol.md +++ b/src/go/plugin/go.d/modules/prometheus/integrations/modbus_protocol.md @@ -1,6 +1,6 @@ <!--startmeta -custom_edit_url: "https://github.com/netdata/netdata/edit/master/src/go/collectors/go.d.plugin/modules/prometheus/integrations/modbus_protocol.md" -meta_yaml: "https://github.com/netdata/netdata/edit/master/src/go/collectors/go.d.plugin/modules/prometheus/metadata.yaml" +custom_edit_url: "https://github.com/netdata/netdata/edit/master/src/go/plugin/go.d/modules/prometheus/integrations/modbus_protocol.md" +meta_yaml: "https://github.com/netdata/netdata/edit/master/src/go/plugin/go.d/modules/prometheus/metadata.yaml" sidebar_label: "Modbus protocol" learn_status: "Published" learn_rel_path: "Collecting Metrics/IoT Devices" @@ -37,7 +37,6 @@ This collector supports collecting metrics from multiple instances of this integ #### Auto-Detection By default, it detects instances running on the local host by trying to connect to known ports that are [allocated to exporters](https://github.com/prometheus/prometheus/wiki/Default-port-allocations). -The full list of endpoints is available in the collector's [configuration file](https://github.com/netdata/netdata/blob/master/src/go/collectors/go.d.plugin/config/go.d/prometheus.conf). #### Limits @@ -138,7 +137,7 @@ The following options can be defined globally: update_every, autodetection_retry This option allows you to filter out unwanted time series. Only metrics matching the selector will be collected. - Logic: (pattern1 OR pattern2) AND !(pattern3 or pattern4) -- Pattern syntax: [selector](/src/go/collectors/go.d.plugin/pkg/prometheus/selector/README.md). +- Pattern syntax: [selector](/src/go/plugin/go.d/pkg/prometheus/selector/README.md). - Option syntax: ```yaml @@ -266,6 +265,8 @@ jobs: ### Debug Mode +**Important**: Debug mode is not supported for data collection jobs created via the UI using the Dyncfg feature. + To troubleshoot issues with the `prometheus` collector, run the `go.d.plugin` with the debug option enabled. The output should give you clues as to why the collector isn't working. @@ -288,4 +289,37 @@ should give you clues as to why the collector isn't working. ./go.d.plugin -d -m prometheus ``` +### Getting Logs + +If you're encountering problems with the `prometheus` collector, follow these steps to retrieve logs and identify potential issues: + +- **Run the command** specific to your system (systemd, non-systemd, or Docker container). +- **Examine the output** for any warnings or error messages that might indicate issues. These messages should provide clues about the root cause of the problem. + +#### System with systemd + +Use the following command to view logs generated since the last Netdata service restart: + +```bash +journalctl _SYSTEMD_INVOCATION_ID="$(systemctl show --value --property=InvocationID netdata)" --namespace=netdata --grep prometheus +``` + +#### System without systemd + +Locate the collector log file, typically at `/var/log/netdata/collector.log`, and use `grep` to filter for collector's name: + +```bash +grep prometheus /var/log/netdata/collector.log +``` + +**Note**: This method shows logs from all restarts. Focus on the **latest entries** for troubleshooting current issues. + +#### Docker Container + +If your Netdata runs in a Docker container named "netdata" (replace if different), use this command: + +```bash +docker logs netdata 2>&1 | grep prometheus +``` + diff --git a/src/go/collectors/go.d.plugin/modules/prometheus/integrations/mogilefs.md b/src/go/plugin/go.d/modules/prometheus/integrations/mogilefs.md index c1759ded7..becc6c194 100644 --- a/src/go/collectors/go.d.plugin/modules/prometheus/integrations/mogilefs.md +++ b/src/go/plugin/go.d/modules/prometheus/integrations/mogilefs.md @@ -1,6 +1,6 @@ <!--startmeta -custom_edit_url: "https://github.com/netdata/netdata/edit/master/src/go/collectors/go.d.plugin/modules/prometheus/integrations/mogilefs.md" -meta_yaml: "https://github.com/netdata/netdata/edit/master/src/go/collectors/go.d.plugin/modules/prometheus/metadata.yaml" +custom_edit_url: "https://github.com/netdata/netdata/edit/master/src/go/plugin/go.d/modules/prometheus/integrations/mogilefs.md" +meta_yaml: "https://github.com/netdata/netdata/edit/master/src/go/plugin/go.d/modules/prometheus/metadata.yaml" sidebar_label: "MogileFS" learn_status: "Published" learn_rel_path: "Collecting Metrics/Storage, Mount Points and Filesystems" @@ -37,7 +37,6 @@ This collector supports collecting metrics from multiple instances of this integ #### Auto-Detection By default, it detects instances running on the local host by trying to connect to known ports that are [allocated to exporters](https://github.com/prometheus/prometheus/wiki/Default-port-allocations). -The full list of endpoints is available in the collector's [configuration file](https://github.com/netdata/netdata/blob/master/src/go/collectors/go.d.plugin/config/go.d/prometheus.conf). #### Limits @@ -138,7 +137,7 @@ The following options can be defined globally: update_every, autodetection_retry This option allows you to filter out unwanted time series. Only metrics matching the selector will be collected. - Logic: (pattern1 OR pattern2) AND !(pattern3 or pattern4) -- Pattern syntax: [selector](/src/go/collectors/go.d.plugin/pkg/prometheus/selector/README.md). +- Pattern syntax: [selector](/src/go/plugin/go.d/pkg/prometheus/selector/README.md). - Option syntax: ```yaml @@ -266,6 +265,8 @@ jobs: ### Debug Mode +**Important**: Debug mode is not supported for data collection jobs created via the UI using the Dyncfg feature. + To troubleshoot issues with the `prometheus` collector, run the `go.d.plugin` with the debug option enabled. The output should give you clues as to why the collector isn't working. @@ -288,4 +289,37 @@ should give you clues as to why the collector isn't working. ./go.d.plugin -d -m prometheus ``` +### Getting Logs + +If you're encountering problems with the `prometheus` collector, follow these steps to retrieve logs and identify potential issues: + +- **Run the command** specific to your system (systemd, non-systemd, or Docker container). +- **Examine the output** for any warnings or error messages that might indicate issues. These messages should provide clues about the root cause of the problem. + +#### System with systemd + +Use the following command to view logs generated since the last Netdata service restart: + +```bash +journalctl _SYSTEMD_INVOCATION_ID="$(systemctl show --value --property=InvocationID netdata)" --namespace=netdata --grep prometheus +``` + +#### System without systemd + +Locate the collector log file, typically at `/var/log/netdata/collector.log`, and use `grep` to filter for collector's name: + +```bash +grep prometheus /var/log/netdata/collector.log +``` + +**Note**: This method shows logs from all restarts. Focus on the **latest entries** for troubleshooting current issues. + +#### Docker Container + +If your Netdata runs in a Docker container named "netdata" (replace if different), use this command: + +```bash +docker logs netdata 2>&1 | grep prometheus +``` + diff --git a/src/go/collectors/go.d.plugin/modules/prometheus/integrations/monnit_sensors_mqtt.md b/src/go/plugin/go.d/modules/prometheus/integrations/monnit_sensors_mqtt.md index 0e854c1b2..05517f39f 100644 --- a/src/go/collectors/go.d.plugin/modules/prometheus/integrations/monnit_sensors_mqtt.md +++ b/src/go/plugin/go.d/modules/prometheus/integrations/monnit_sensors_mqtt.md @@ -1,6 +1,6 @@ <!--startmeta -custom_edit_url: "https://github.com/netdata/netdata/edit/master/src/go/collectors/go.d.plugin/modules/prometheus/integrations/monnit_sensors_mqtt.md" -meta_yaml: "https://github.com/netdata/netdata/edit/master/src/go/collectors/go.d.plugin/modules/prometheus/metadata.yaml" +custom_edit_url: "https://github.com/netdata/netdata/edit/master/src/go/plugin/go.d/modules/prometheus/integrations/monnit_sensors_mqtt.md" +meta_yaml: "https://github.com/netdata/netdata/edit/master/src/go/plugin/go.d/modules/prometheus/metadata.yaml" sidebar_label: "Monnit Sensors MQTT" learn_status: "Published" learn_rel_path: "Collecting Metrics/IoT Devices" @@ -37,7 +37,6 @@ This collector supports collecting metrics from multiple instances of this integ #### Auto-Detection By default, it detects instances running on the local host by trying to connect to known ports that are [allocated to exporters](https://github.com/prometheus/prometheus/wiki/Default-port-allocations). -The full list of endpoints is available in the collector's [configuration file](https://github.com/netdata/netdata/blob/master/src/go/collectors/go.d.plugin/config/go.d/prometheus.conf). #### Limits @@ -138,7 +137,7 @@ The following options can be defined globally: update_every, autodetection_retry This option allows you to filter out unwanted time series. Only metrics matching the selector will be collected. - Logic: (pattern1 OR pattern2) AND !(pattern3 or pattern4) -- Pattern syntax: [selector](/src/go/collectors/go.d.plugin/pkg/prometheus/selector/README.md). +- Pattern syntax: [selector](/src/go/plugin/go.d/pkg/prometheus/selector/README.md). - Option syntax: ```yaml @@ -266,6 +265,8 @@ jobs: ### Debug Mode +**Important**: Debug mode is not supported for data collection jobs created via the UI using the Dyncfg feature. + To troubleshoot issues with the `prometheus` collector, run the `go.d.plugin` with the debug option enabled. The output should give you clues as to why the collector isn't working. @@ -288,4 +289,37 @@ should give you clues as to why the collector isn't working. ./go.d.plugin -d -m prometheus ``` +### Getting Logs + +If you're encountering problems with the `prometheus` collector, follow these steps to retrieve logs and identify potential issues: + +- **Run the command** specific to your system (systemd, non-systemd, or Docker container). +- **Examine the output** for any warnings or error messages that might indicate issues. These messages should provide clues about the root cause of the problem. + +#### System with systemd + +Use the following command to view logs generated since the last Netdata service restart: + +```bash +journalctl _SYSTEMD_INVOCATION_ID="$(systemctl show --value --property=InvocationID netdata)" --namespace=netdata --grep prometheus +``` + +#### System without systemd + +Locate the collector log file, typically at `/var/log/netdata/collector.log`, and use `grep` to filter for collector's name: + +```bash +grep prometheus /var/log/netdata/collector.log +``` + +**Note**: This method shows logs from all restarts. Focus on the **latest entries** for troubleshooting current issues. + +#### Docker Container + +If your Netdata runs in a Docker container named "netdata" (replace if different), use this command: + +```bash +docker logs netdata 2>&1 | grep prometheus +``` + diff --git a/src/go/collectors/go.d.plugin/modules/prometheus/integrations/mosquitto.md b/src/go/plugin/go.d/modules/prometheus/integrations/mosquitto.md index 9f5606364..115dde093 100644 --- a/src/go/collectors/go.d.plugin/modules/prometheus/integrations/mosquitto.md +++ b/src/go/plugin/go.d/modules/prometheus/integrations/mosquitto.md @@ -1,6 +1,6 @@ <!--startmeta -custom_edit_url: "https://github.com/netdata/netdata/edit/master/src/go/collectors/go.d.plugin/modules/prometheus/integrations/mosquitto.md" -meta_yaml: "https://github.com/netdata/netdata/edit/master/src/go/collectors/go.d.plugin/modules/prometheus/metadata.yaml" +custom_edit_url: "https://github.com/netdata/netdata/edit/master/src/go/plugin/go.d/modules/prometheus/integrations/mosquitto.md" +meta_yaml: "https://github.com/netdata/netdata/edit/master/src/go/plugin/go.d/modules/prometheus/metadata.yaml" sidebar_label: "mosquitto" learn_status: "Published" learn_rel_path: "Collecting Metrics/Message Brokers" @@ -37,7 +37,6 @@ This collector supports collecting metrics from multiple instances of this integ #### Auto-Detection By default, it detects instances running on the local host by trying to connect to known ports that are [allocated to exporters](https://github.com/prometheus/prometheus/wiki/Default-port-allocations). -The full list of endpoints is available in the collector's [configuration file](https://github.com/netdata/netdata/blob/master/src/go/collectors/go.d.plugin/config/go.d/prometheus.conf). #### Limits @@ -138,7 +137,7 @@ The following options can be defined globally: update_every, autodetection_retry This option allows you to filter out unwanted time series. Only metrics matching the selector will be collected. - Logic: (pattern1 OR pattern2) AND !(pattern3 or pattern4) -- Pattern syntax: [selector](/src/go/collectors/go.d.plugin/pkg/prometheus/selector/README.md). +- Pattern syntax: [selector](/src/go/plugin/go.d/pkg/prometheus/selector/README.md). - Option syntax: ```yaml @@ -266,6 +265,8 @@ jobs: ### Debug Mode +**Important**: Debug mode is not supported for data collection jobs created via the UI using the Dyncfg feature. + To troubleshoot issues with the `prometheus` collector, run the `go.d.plugin` with the debug option enabled. The output should give you clues as to why the collector isn't working. @@ -288,4 +289,37 @@ should give you clues as to why the collector isn't working. ./go.d.plugin -d -m prometheus ``` +### Getting Logs + +If you're encountering problems with the `prometheus` collector, follow these steps to retrieve logs and identify potential issues: + +- **Run the command** specific to your system (systemd, non-systemd, or Docker container). +- **Examine the output** for any warnings or error messages that might indicate issues. These messages should provide clues about the root cause of the problem. + +#### System with systemd + +Use the following command to view logs generated since the last Netdata service restart: + +```bash +journalctl _SYSTEMD_INVOCATION_ID="$(systemctl show --value --property=InvocationID netdata)" --namespace=netdata --grep prometheus +``` + +#### System without systemd + +Locate the collector log file, typically at `/var/log/netdata/collector.log`, and use `grep` to filter for collector's name: + +```bash +grep prometheus /var/log/netdata/collector.log +``` + +**Note**: This method shows logs from all restarts. Focus on the **latest entries** for troubleshooting current issues. + +#### Docker Container + +If your Netdata runs in a Docker container named "netdata" (replace if different), use this command: + +```bash +docker logs netdata 2>&1 | grep prometheus +``` + diff --git a/src/go/collectors/go.d.plugin/modules/prometheus/integrations/mp707_usb_thermometer.md b/src/go/plugin/go.d/modules/prometheus/integrations/mp707_usb_thermometer.md index 7beeaa202..f032dcfb6 100644 --- a/src/go/collectors/go.d.plugin/modules/prometheus/integrations/mp707_usb_thermometer.md +++ b/src/go/plugin/go.d/modules/prometheus/integrations/mp707_usb_thermometer.md @@ -1,6 +1,6 @@ <!--startmeta -custom_edit_url: "https://github.com/netdata/netdata/edit/master/src/go/collectors/go.d.plugin/modules/prometheus/integrations/mp707_usb_thermometer.md" -meta_yaml: "https://github.com/netdata/netdata/edit/master/src/go/collectors/go.d.plugin/modules/prometheus/metadata.yaml" +custom_edit_url: "https://github.com/netdata/netdata/edit/master/src/go/plugin/go.d/modules/prometheus/integrations/mp707_usb_thermometer.md" +meta_yaml: "https://github.com/netdata/netdata/edit/master/src/go/plugin/go.d/modules/prometheus/metadata.yaml" sidebar_label: "MP707 USB thermometer" learn_status: "Published" learn_rel_path: "Collecting Metrics/IoT Devices" @@ -37,7 +37,6 @@ This collector supports collecting metrics from multiple instances of this integ #### Auto-Detection By default, it detects instances running on the local host by trying to connect to known ports that are [allocated to exporters](https://github.com/prometheus/prometheus/wiki/Default-port-allocations). -The full list of endpoints is available in the collector's [configuration file](https://github.com/netdata/netdata/blob/master/src/go/collectors/go.d.plugin/config/go.d/prometheus.conf). #### Limits @@ -138,7 +137,7 @@ The following options can be defined globally: update_every, autodetection_retry This option allows you to filter out unwanted time series. Only metrics matching the selector will be collected. - Logic: (pattern1 OR pattern2) AND !(pattern3 or pattern4) -- Pattern syntax: [selector](/src/go/collectors/go.d.plugin/pkg/prometheus/selector/README.md). +- Pattern syntax: [selector](/src/go/plugin/go.d/pkg/prometheus/selector/README.md). - Option syntax: ```yaml @@ -266,6 +265,8 @@ jobs: ### Debug Mode +**Important**: Debug mode is not supported for data collection jobs created via the UI using the Dyncfg feature. + To troubleshoot issues with the `prometheus` collector, run the `go.d.plugin` with the debug option enabled. The output should give you clues as to why the collector isn't working. @@ -288,4 +289,37 @@ should give you clues as to why the collector isn't working. ./go.d.plugin -d -m prometheus ``` +### Getting Logs + +If you're encountering problems with the `prometheus` collector, follow these steps to retrieve logs and identify potential issues: + +- **Run the command** specific to your system (systemd, non-systemd, or Docker container). +- **Examine the output** for any warnings or error messages that might indicate issues. These messages should provide clues about the root cause of the problem. + +#### System with systemd + +Use the following command to view logs generated since the last Netdata service restart: + +```bash +journalctl _SYSTEMD_INVOCATION_ID="$(systemctl show --value --property=InvocationID netdata)" --namespace=netdata --grep prometheus +``` + +#### System without systemd + +Locate the collector log file, typically at `/var/log/netdata/collector.log`, and use `grep` to filter for collector's name: + +```bash +grep prometheus /var/log/netdata/collector.log +``` + +**Note**: This method shows logs from all restarts. Focus on the **latest entries** for troubleshooting current issues. + +#### Docker Container + +If your Netdata runs in a Docker container named "netdata" (replace if different), use this command: + +```bash +docker logs netdata 2>&1 | grep prometheus +``` + diff --git a/src/go/collectors/go.d.plugin/modules/prometheus/integrations/mqtt_blackbox.md b/src/go/plugin/go.d/modules/prometheus/integrations/mqtt_blackbox.md index 79b295cf5..2f6e6ca57 100644 --- a/src/go/collectors/go.d.plugin/modules/prometheus/integrations/mqtt_blackbox.md +++ b/src/go/plugin/go.d/modules/prometheus/integrations/mqtt_blackbox.md @@ -1,6 +1,6 @@ <!--startmeta -custom_edit_url: "https://github.com/netdata/netdata/edit/master/src/go/collectors/go.d.plugin/modules/prometheus/integrations/mqtt_blackbox.md" -meta_yaml: "https://github.com/netdata/netdata/edit/master/src/go/collectors/go.d.plugin/modules/prometheus/metadata.yaml" +custom_edit_url: "https://github.com/netdata/netdata/edit/master/src/go/plugin/go.d/modules/prometheus/integrations/mqtt_blackbox.md" +meta_yaml: "https://github.com/netdata/netdata/edit/master/src/go/plugin/go.d/modules/prometheus/metadata.yaml" sidebar_label: "MQTT Blackbox" learn_status: "Published" learn_rel_path: "Collecting Metrics/Message Brokers" @@ -37,7 +37,6 @@ This collector supports collecting metrics from multiple instances of this integ #### Auto-Detection By default, it detects instances running on the local host by trying to connect to known ports that are [allocated to exporters](https://github.com/prometheus/prometheus/wiki/Default-port-allocations). -The full list of endpoints is available in the collector's [configuration file](https://github.com/netdata/netdata/blob/master/src/go/collectors/go.d.plugin/config/go.d/prometheus.conf). #### Limits @@ -138,7 +137,7 @@ The following options can be defined globally: update_every, autodetection_retry This option allows you to filter out unwanted time series. Only metrics matching the selector will be collected. - Logic: (pattern1 OR pattern2) AND !(pattern3 or pattern4) -- Pattern syntax: [selector](/src/go/collectors/go.d.plugin/pkg/prometheus/selector/README.md). +- Pattern syntax: [selector](/src/go/plugin/go.d/pkg/prometheus/selector/README.md). - Option syntax: ```yaml @@ -266,6 +265,8 @@ jobs: ### Debug Mode +**Important**: Debug mode is not supported for data collection jobs created via the UI using the Dyncfg feature. + To troubleshoot issues with the `prometheus` collector, run the `go.d.plugin` with the debug option enabled. The output should give you clues as to why the collector isn't working. @@ -288,4 +289,37 @@ should give you clues as to why the collector isn't working. ./go.d.plugin -d -m prometheus ``` +### Getting Logs + +If you're encountering problems with the `prometheus` collector, follow these steps to retrieve logs and identify potential issues: + +- **Run the command** specific to your system (systemd, non-systemd, or Docker container). +- **Examine the output** for any warnings or error messages that might indicate issues. These messages should provide clues about the root cause of the problem. + +#### System with systemd + +Use the following command to view logs generated since the last Netdata service restart: + +```bash +journalctl _SYSTEMD_INVOCATION_ID="$(systemctl show --value --property=InvocationID netdata)" --namespace=netdata --grep prometheus +``` + +#### System without systemd + +Locate the collector log file, typically at `/var/log/netdata/collector.log`, and use `grep` to filter for collector's name: + +```bash +grep prometheus /var/log/netdata/collector.log +``` + +**Note**: This method shows logs from all restarts. Focus on the **latest entries** for troubleshooting current issues. + +#### Docker Container + +If your Netdata runs in a Docker container named "netdata" (replace if different), use this command: + +```bash +docker logs netdata 2>&1 | grep prometheus +``` + diff --git a/src/go/collectors/go.d.plugin/modules/prometheus/integrations/mtail.md b/src/go/plugin/go.d/modules/prometheus/integrations/mtail.md index 35ddb22df..e44f88d4c 100644 --- a/src/go/collectors/go.d.plugin/modules/prometheus/integrations/mtail.md +++ b/src/go/plugin/go.d/modules/prometheus/integrations/mtail.md @@ -1,6 +1,6 @@ <!--startmeta -custom_edit_url: "https://github.com/netdata/netdata/edit/master/src/go/collectors/go.d.plugin/modules/prometheus/integrations/mtail.md" -meta_yaml: "https://github.com/netdata/netdata/edit/master/src/go/collectors/go.d.plugin/modules/prometheus/metadata.yaml" +custom_edit_url: "https://github.com/netdata/netdata/edit/master/src/go/plugin/go.d/modules/prometheus/integrations/mtail.md" +meta_yaml: "https://github.com/netdata/netdata/edit/master/src/go/plugin/go.d/modules/prometheus/metadata.yaml" sidebar_label: "mtail" learn_status: "Published" learn_rel_path: "Collecting Metrics/Logs Servers" @@ -37,7 +37,6 @@ This collector supports collecting metrics from multiple instances of this integ #### Auto-Detection By default, it detects instances running on the local host by trying to connect to known ports that are [allocated to exporters](https://github.com/prometheus/prometheus/wiki/Default-port-allocations). -The full list of endpoints is available in the collector's [configuration file](https://github.com/netdata/netdata/blob/master/src/go/collectors/go.d.plugin/config/go.d/prometheus.conf). #### Limits @@ -138,7 +137,7 @@ The following options can be defined globally: update_every, autodetection_retry This option allows you to filter out unwanted time series. Only metrics matching the selector will be collected. - Logic: (pattern1 OR pattern2) AND !(pattern3 or pattern4) -- Pattern syntax: [selector](/src/go/collectors/go.d.plugin/pkg/prometheus/selector/README.md). +- Pattern syntax: [selector](/src/go/plugin/go.d/pkg/prometheus/selector/README.md). - Option syntax: ```yaml @@ -266,6 +265,8 @@ jobs: ### Debug Mode +**Important**: Debug mode is not supported for data collection jobs created via the UI using the Dyncfg feature. + To troubleshoot issues with the `prometheus` collector, run the `go.d.plugin` with the debug option enabled. The output should give you clues as to why the collector isn't working. @@ -288,4 +289,37 @@ should give you clues as to why the collector isn't working. ./go.d.plugin -d -m prometheus ``` +### Getting Logs + +If you're encountering problems with the `prometheus` collector, follow these steps to retrieve logs and identify potential issues: + +- **Run the command** specific to your system (systemd, non-systemd, or Docker container). +- **Examine the output** for any warnings or error messages that might indicate issues. These messages should provide clues about the root cause of the problem. + +#### System with systemd + +Use the following command to view logs generated since the last Netdata service restart: + +```bash +journalctl _SYSTEMD_INVOCATION_ID="$(systemctl show --value --property=InvocationID netdata)" --namespace=netdata --grep prometheus +``` + +#### System without systemd + +Locate the collector log file, typically at `/var/log/netdata/collector.log`, and use `grep` to filter for collector's name: + +```bash +grep prometheus /var/log/netdata/collector.log +``` + +**Note**: This method shows logs from all restarts. Focus on the **latest entries** for troubleshooting current issues. + +#### Docker Container + +If your Netdata runs in a Docker container named "netdata" (replace if different), use this command: + +```bash +docker logs netdata 2>&1 | grep prometheus +``` + diff --git a/src/go/collectors/go.d.plugin/modules/prometheus/integrations/naemon.md b/src/go/plugin/go.d/modules/prometheus/integrations/naemon.md index 061b4f723..208777b95 100644 --- a/src/go/collectors/go.d.plugin/modules/prometheus/integrations/naemon.md +++ b/src/go/plugin/go.d/modules/prometheus/integrations/naemon.md @@ -1,6 +1,6 @@ <!--startmeta -custom_edit_url: "https://github.com/netdata/netdata/edit/master/src/go/collectors/go.d.plugin/modules/prometheus/integrations/naemon.md" -meta_yaml: "https://github.com/netdata/netdata/edit/master/src/go/collectors/go.d.plugin/modules/prometheus/metadata.yaml" +custom_edit_url: "https://github.com/netdata/netdata/edit/master/src/go/plugin/go.d/modules/prometheus/integrations/naemon.md" +meta_yaml: "https://github.com/netdata/netdata/edit/master/src/go/plugin/go.d/modules/prometheus/metadata.yaml" sidebar_label: "Naemon" learn_status: "Published" learn_rel_path: "Collecting Metrics/Observability" @@ -37,7 +37,6 @@ This collector supports collecting metrics from multiple instances of this integ #### Auto-Detection By default, it detects instances running on the local host by trying to connect to known ports that are [allocated to exporters](https://github.com/prometheus/prometheus/wiki/Default-port-allocations). -The full list of endpoints is available in the collector's [configuration file](https://github.com/netdata/netdata/blob/master/src/go/collectors/go.d.plugin/config/go.d/prometheus.conf). #### Limits @@ -138,7 +137,7 @@ The following options can be defined globally: update_every, autodetection_retry This option allows you to filter out unwanted time series. Only metrics matching the selector will be collected. - Logic: (pattern1 OR pattern2) AND !(pattern3 or pattern4) -- Pattern syntax: [selector](/src/go/collectors/go.d.plugin/pkg/prometheus/selector/README.md). +- Pattern syntax: [selector](/src/go/plugin/go.d/pkg/prometheus/selector/README.md). - Option syntax: ```yaml @@ -266,6 +265,8 @@ jobs: ### Debug Mode +**Important**: Debug mode is not supported for data collection jobs created via the UI using the Dyncfg feature. + To troubleshoot issues with the `prometheus` collector, run the `go.d.plugin` with the debug option enabled. The output should give you clues as to why the collector isn't working. @@ -288,4 +289,37 @@ should give you clues as to why the collector isn't working. ./go.d.plugin -d -m prometheus ``` +### Getting Logs + +If you're encountering problems with the `prometheus` collector, follow these steps to retrieve logs and identify potential issues: + +- **Run the command** specific to your system (systemd, non-systemd, or Docker container). +- **Examine the output** for any warnings or error messages that might indicate issues. These messages should provide clues about the root cause of the problem. + +#### System with systemd + +Use the following command to view logs generated since the last Netdata service restart: + +```bash +journalctl _SYSTEMD_INVOCATION_ID="$(systemctl show --value --property=InvocationID netdata)" --namespace=netdata --grep prometheus +``` + +#### System without systemd + +Locate the collector log file, typically at `/var/log/netdata/collector.log`, and use `grep` to filter for collector's name: + +```bash +grep prometheus /var/log/netdata/collector.log +``` + +**Note**: This method shows logs from all restarts. Focus on the **latest entries** for troubleshooting current issues. + +#### Docker Container + +If your Netdata runs in a Docker container named "netdata" (replace if different), use this command: + +```bash +docker logs netdata 2>&1 | grep prometheus +``` + diff --git a/src/go/collectors/go.d.plugin/modules/prometheus/integrations/nagios.md b/src/go/plugin/go.d/modules/prometheus/integrations/nagios.md index 973749943..bdd669c76 100644 --- a/src/go/collectors/go.d.plugin/modules/prometheus/integrations/nagios.md +++ b/src/go/plugin/go.d/modules/prometheus/integrations/nagios.md @@ -1,6 +1,6 @@ <!--startmeta -custom_edit_url: "https://github.com/netdata/netdata/edit/master/src/go/collectors/go.d.plugin/modules/prometheus/integrations/nagios.md" -meta_yaml: "https://github.com/netdata/netdata/edit/master/src/go/collectors/go.d.plugin/modules/prometheus/metadata.yaml" +custom_edit_url: "https://github.com/netdata/netdata/edit/master/src/go/plugin/go.d/modules/prometheus/integrations/nagios.md" +meta_yaml: "https://github.com/netdata/netdata/edit/master/src/go/plugin/go.d/modules/prometheus/metadata.yaml" sidebar_label: "Nagios" learn_status: "Published" learn_rel_path: "Collecting Metrics/Observability" @@ -38,7 +38,6 @@ This collector supports collecting metrics from multiple instances of this integ #### Auto-Detection By default, it detects instances running on the local host by trying to connect to known ports that are [allocated to exporters](https://github.com/prometheus/prometheus/wiki/Default-port-allocations). -The full list of endpoints is available in the collector's [configuration file](https://github.com/netdata/netdata/blob/master/src/go/collectors/go.d.plugin/config/go.d/prometheus.conf). #### Limits @@ -139,7 +138,7 @@ The following options can be defined globally: update_every, autodetection_retry This option allows you to filter out unwanted time series. Only metrics matching the selector will be collected. - Logic: (pattern1 OR pattern2) AND !(pattern3 or pattern4) -- Pattern syntax: [selector](/src/go/collectors/go.d.plugin/pkg/prometheus/selector/README.md). +- Pattern syntax: [selector](/src/go/plugin/go.d/pkg/prometheus/selector/README.md). - Option syntax: ```yaml @@ -267,6 +266,8 @@ jobs: ### Debug Mode +**Important**: Debug mode is not supported for data collection jobs created via the UI using the Dyncfg feature. + To troubleshoot issues with the `prometheus` collector, run the `go.d.plugin` with the debug option enabled. The output should give you clues as to why the collector isn't working. @@ -289,4 +290,37 @@ should give you clues as to why the collector isn't working. ./go.d.plugin -d -m prometheus ``` +### Getting Logs + +If you're encountering problems with the `prometheus` collector, follow these steps to retrieve logs and identify potential issues: + +- **Run the command** specific to your system (systemd, non-systemd, or Docker container). +- **Examine the output** for any warnings or error messages that might indicate issues. These messages should provide clues about the root cause of the problem. + +#### System with systemd + +Use the following command to view logs generated since the last Netdata service restart: + +```bash +journalctl _SYSTEMD_INVOCATION_ID="$(systemctl show --value --property=InvocationID netdata)" --namespace=netdata --grep prometheus +``` + +#### System without systemd + +Locate the collector log file, typically at `/var/log/netdata/collector.log`, and use `grep` to filter for collector's name: + +```bash +grep prometheus /var/log/netdata/collector.log +``` + +**Note**: This method shows logs from all restarts. Focus on the **latest entries** for troubleshooting current issues. + +#### Docker Container + +If your Netdata runs in a Docker container named "netdata" (replace if different), use this command: + +```bash +docker logs netdata 2>&1 | grep prometheus +``` + diff --git a/src/go/collectors/go.d.plugin/modules/prometheus/integrations/nature_remo_e_lite_devices.md b/src/go/plugin/go.d/modules/prometheus/integrations/nature_remo_e_lite_devices.md index da5030d6a..c102e4a7c 100644 --- a/src/go/collectors/go.d.plugin/modules/prometheus/integrations/nature_remo_e_lite_devices.md +++ b/src/go/plugin/go.d/modules/prometheus/integrations/nature_remo_e_lite_devices.md @@ -1,6 +1,6 @@ <!--startmeta -custom_edit_url: "https://github.com/netdata/netdata/edit/master/src/go/collectors/go.d.plugin/modules/prometheus/integrations/nature_remo_e_lite_devices.md" -meta_yaml: "https://github.com/netdata/netdata/edit/master/src/go/collectors/go.d.plugin/modules/prometheus/metadata.yaml" +custom_edit_url: "https://github.com/netdata/netdata/edit/master/src/go/plugin/go.d/modules/prometheus/integrations/nature_remo_e_lite_devices.md" +meta_yaml: "https://github.com/netdata/netdata/edit/master/src/go/plugin/go.d/modules/prometheus/metadata.yaml" sidebar_label: "Nature Remo E lite devices" learn_status: "Published" learn_rel_path: "Collecting Metrics/IoT Devices" @@ -37,7 +37,6 @@ This collector supports collecting metrics from multiple instances of this integ #### Auto-Detection By default, it detects instances running on the local host by trying to connect to known ports that are [allocated to exporters](https://github.com/prometheus/prometheus/wiki/Default-port-allocations). -The full list of endpoints is available in the collector's [configuration file](https://github.com/netdata/netdata/blob/master/src/go/collectors/go.d.plugin/config/go.d/prometheus.conf). #### Limits @@ -138,7 +137,7 @@ The following options can be defined globally: update_every, autodetection_retry This option allows you to filter out unwanted time series. Only metrics matching the selector will be collected. - Logic: (pattern1 OR pattern2) AND !(pattern3 or pattern4) -- Pattern syntax: [selector](/src/go/collectors/go.d.plugin/pkg/prometheus/selector/README.md). +- Pattern syntax: [selector](/src/go/plugin/go.d/pkg/prometheus/selector/README.md). - Option syntax: ```yaml @@ -266,6 +265,8 @@ jobs: ### Debug Mode +**Important**: Debug mode is not supported for data collection jobs created via the UI using the Dyncfg feature. + To troubleshoot issues with the `prometheus` collector, run the `go.d.plugin` with the debug option enabled. The output should give you clues as to why the collector isn't working. @@ -288,4 +289,37 @@ should give you clues as to why the collector isn't working. ./go.d.plugin -d -m prometheus ``` +### Getting Logs + +If you're encountering problems with the `prometheus` collector, follow these steps to retrieve logs and identify potential issues: + +- **Run the command** specific to your system (systemd, non-systemd, or Docker container). +- **Examine the output** for any warnings or error messages that might indicate issues. These messages should provide clues about the root cause of the problem. + +#### System with systemd + +Use the following command to view logs generated since the last Netdata service restart: + +```bash +journalctl _SYSTEMD_INVOCATION_ID="$(systemctl show --value --property=InvocationID netdata)" --namespace=netdata --grep prometheus +``` + +#### System without systemd + +Locate the collector log file, typically at `/var/log/netdata/collector.log`, and use `grep` to filter for collector's name: + +```bash +grep prometheus /var/log/netdata/collector.log +``` + +**Note**: This method shows logs from all restarts. Focus on the **latest entries** for troubleshooting current issues. + +#### Docker Container + +If your Netdata runs in a Docker container named "netdata" (replace if different), use this command: + +```bash +docker logs netdata 2>&1 | grep prometheus +``` + diff --git a/src/go/collectors/go.d.plugin/modules/prometheus/integrations/netapp_ontap_api.md b/src/go/plugin/go.d/modules/prometheus/integrations/netapp_ontap_api.md index 6a5025463..80e4dce3b 100644 --- a/src/go/collectors/go.d.plugin/modules/prometheus/integrations/netapp_ontap_api.md +++ b/src/go/plugin/go.d/modules/prometheus/integrations/netapp_ontap_api.md @@ -1,6 +1,6 @@ <!--startmeta -custom_edit_url: "https://github.com/netdata/netdata/edit/master/src/go/collectors/go.d.plugin/modules/prometheus/integrations/netapp_ontap_api.md" -meta_yaml: "https://github.com/netdata/netdata/edit/master/src/go/collectors/go.d.plugin/modules/prometheus/metadata.yaml" +custom_edit_url: "https://github.com/netdata/netdata/edit/master/src/go/plugin/go.d/modules/prometheus/integrations/netapp_ontap_api.md" +meta_yaml: "https://github.com/netdata/netdata/edit/master/src/go/plugin/go.d/modules/prometheus/metadata.yaml" sidebar_label: "Netapp ONTAP API" learn_status: "Published" learn_rel_path: "Collecting Metrics/Storage, Mount Points and Filesystems" @@ -37,7 +37,6 @@ This collector supports collecting metrics from multiple instances of this integ #### Auto-Detection By default, it detects instances running on the local host by trying to connect to known ports that are [allocated to exporters](https://github.com/prometheus/prometheus/wiki/Default-port-allocations). -The full list of endpoints is available in the collector's [configuration file](https://github.com/netdata/netdata/blob/master/src/go/collectors/go.d.plugin/config/go.d/prometheus.conf). #### Limits @@ -138,7 +137,7 @@ The following options can be defined globally: update_every, autodetection_retry This option allows you to filter out unwanted time series. Only metrics matching the selector will be collected. - Logic: (pattern1 OR pattern2) AND !(pattern3 or pattern4) -- Pattern syntax: [selector](/src/go/collectors/go.d.plugin/pkg/prometheus/selector/README.md). +- Pattern syntax: [selector](/src/go/plugin/go.d/pkg/prometheus/selector/README.md). - Option syntax: ```yaml @@ -266,6 +265,8 @@ jobs: ### Debug Mode +**Important**: Debug mode is not supported for data collection jobs created via the UI using the Dyncfg feature. + To troubleshoot issues with the `prometheus` collector, run the `go.d.plugin` with the debug option enabled. The output should give you clues as to why the collector isn't working. @@ -288,4 +289,37 @@ should give you clues as to why the collector isn't working. ./go.d.plugin -d -m prometheus ``` +### Getting Logs + +If you're encountering problems with the `prometheus` collector, follow these steps to retrieve logs and identify potential issues: + +- **Run the command** specific to your system (systemd, non-systemd, or Docker container). +- **Examine the output** for any warnings or error messages that might indicate issues. These messages should provide clues about the root cause of the problem. + +#### System with systemd + +Use the following command to view logs generated since the last Netdata service restart: + +```bash +journalctl _SYSTEMD_INVOCATION_ID="$(systemctl show --value --property=InvocationID netdata)" --namespace=netdata --grep prometheus +``` + +#### System without systemd + +Locate the collector log file, typically at `/var/log/netdata/collector.log`, and use `grep` to filter for collector's name: + +```bash +grep prometheus /var/log/netdata/collector.log +``` + +**Note**: This method shows logs from all restarts. Focus on the **latest entries** for troubleshooting current issues. + +#### Docker Container + +If your Netdata runs in a Docker container named "netdata" (replace if different), use this command: + +```bash +docker logs netdata 2>&1 | grep prometheus +``` + diff --git a/src/go/collectors/go.d.plugin/modules/prometheus/integrations/netapp_solidfire.md b/src/go/plugin/go.d/modules/prometheus/integrations/netapp_solidfire.md index eab756cf4..a15aef5fb 100644 --- a/src/go/collectors/go.d.plugin/modules/prometheus/integrations/netapp_solidfire.md +++ b/src/go/plugin/go.d/modules/prometheus/integrations/netapp_solidfire.md @@ -1,6 +1,6 @@ <!--startmeta -custom_edit_url: "https://github.com/netdata/netdata/edit/master/src/go/collectors/go.d.plugin/modules/prometheus/integrations/netapp_solidfire.md" -meta_yaml: "https://github.com/netdata/netdata/edit/master/src/go/collectors/go.d.plugin/modules/prometheus/metadata.yaml" +custom_edit_url: "https://github.com/netdata/netdata/edit/master/src/go/plugin/go.d/modules/prometheus/integrations/netapp_solidfire.md" +meta_yaml: "https://github.com/netdata/netdata/edit/master/src/go/plugin/go.d/modules/prometheus/metadata.yaml" sidebar_label: "NetApp Solidfire" learn_status: "Published" learn_rel_path: "Collecting Metrics/Storage, Mount Points and Filesystems" @@ -37,7 +37,6 @@ This collector supports collecting metrics from multiple instances of this integ #### Auto-Detection By default, it detects instances running on the local host by trying to connect to known ports that are [allocated to exporters](https://github.com/prometheus/prometheus/wiki/Default-port-allocations). -The full list of endpoints is available in the collector's [configuration file](https://github.com/netdata/netdata/blob/master/src/go/collectors/go.d.plugin/config/go.d/prometheus.conf). #### Limits @@ -138,7 +137,7 @@ The following options can be defined globally: update_every, autodetection_retry This option allows you to filter out unwanted time series. Only metrics matching the selector will be collected. - Logic: (pattern1 OR pattern2) AND !(pattern3 or pattern4) -- Pattern syntax: [selector](/src/go/collectors/go.d.plugin/pkg/prometheus/selector/README.md). +- Pattern syntax: [selector](/src/go/plugin/go.d/pkg/prometheus/selector/README.md). - Option syntax: ```yaml @@ -266,6 +265,8 @@ jobs: ### Debug Mode +**Important**: Debug mode is not supported for data collection jobs created via the UI using the Dyncfg feature. + To troubleshoot issues with the `prometheus` collector, run the `go.d.plugin` with the debug option enabled. The output should give you clues as to why the collector isn't working. @@ -288,4 +289,37 @@ should give you clues as to why the collector isn't working. ./go.d.plugin -d -m prometheus ``` +### Getting Logs + +If you're encountering problems with the `prometheus` collector, follow these steps to retrieve logs and identify potential issues: + +- **Run the command** specific to your system (systemd, non-systemd, or Docker container). +- **Examine the output** for any warnings or error messages that might indicate issues. These messages should provide clues about the root cause of the problem. + +#### System with systemd + +Use the following command to view logs generated since the last Netdata service restart: + +```bash +journalctl _SYSTEMD_INVOCATION_ID="$(systemctl show --value --property=InvocationID netdata)" --namespace=netdata --grep prometheus +``` + +#### System without systemd + +Locate the collector log file, typically at `/var/log/netdata/collector.log`, and use `grep` to filter for collector's name: + +```bash +grep prometheus /var/log/netdata/collector.log +``` + +**Note**: This method shows logs from all restarts. Focus on the **latest entries** for troubleshooting current issues. + +#### Docker Container + +If your Netdata runs in a Docker container named "netdata" (replace if different), use this command: + +```bash +docker logs netdata 2>&1 | grep prometheus +``` + diff --git a/src/go/collectors/go.d.plugin/modules/prometheus/integrations/netatmo_sensors.md b/src/go/plugin/go.d/modules/prometheus/integrations/netatmo_sensors.md index 08d17d59e..8420a5fe0 100644 --- a/src/go/collectors/go.d.plugin/modules/prometheus/integrations/netatmo_sensors.md +++ b/src/go/plugin/go.d/modules/prometheus/integrations/netatmo_sensors.md @@ -1,6 +1,6 @@ <!--startmeta -custom_edit_url: "https://github.com/netdata/netdata/edit/master/src/go/collectors/go.d.plugin/modules/prometheus/integrations/netatmo_sensors.md" -meta_yaml: "https://github.com/netdata/netdata/edit/master/src/go/collectors/go.d.plugin/modules/prometheus/metadata.yaml" +custom_edit_url: "https://github.com/netdata/netdata/edit/master/src/go/plugin/go.d/modules/prometheus/integrations/netatmo_sensors.md" +meta_yaml: "https://github.com/netdata/netdata/edit/master/src/go/plugin/go.d/modules/prometheus/metadata.yaml" sidebar_label: "Netatmo sensors" learn_status: "Published" learn_rel_path: "Collecting Metrics/IoT Devices" @@ -37,7 +37,6 @@ This collector supports collecting metrics from multiple instances of this integ #### Auto-Detection By default, it detects instances running on the local host by trying to connect to known ports that are [allocated to exporters](https://github.com/prometheus/prometheus/wiki/Default-port-allocations). -The full list of endpoints is available in the collector's [configuration file](https://github.com/netdata/netdata/blob/master/src/go/collectors/go.d.plugin/config/go.d/prometheus.conf). #### Limits @@ -138,7 +137,7 @@ The following options can be defined globally: update_every, autodetection_retry This option allows you to filter out unwanted time series. Only metrics matching the selector will be collected. - Logic: (pattern1 OR pattern2) AND !(pattern3 or pattern4) -- Pattern syntax: [selector](/src/go/collectors/go.d.plugin/pkg/prometheus/selector/README.md). +- Pattern syntax: [selector](/src/go/plugin/go.d/pkg/prometheus/selector/README.md). - Option syntax: ```yaml @@ -266,6 +265,8 @@ jobs: ### Debug Mode +**Important**: Debug mode is not supported for data collection jobs created via the UI using the Dyncfg feature. + To troubleshoot issues with the `prometheus` collector, run the `go.d.plugin` with the debug option enabled. The output should give you clues as to why the collector isn't working. @@ -288,4 +289,37 @@ should give you clues as to why the collector isn't working. ./go.d.plugin -d -m prometheus ``` +### Getting Logs + +If you're encountering problems with the `prometheus` collector, follow these steps to retrieve logs and identify potential issues: + +- **Run the command** specific to your system (systemd, non-systemd, or Docker container). +- **Examine the output** for any warnings or error messages that might indicate issues. These messages should provide clues about the root cause of the problem. + +#### System with systemd + +Use the following command to view logs generated since the last Netdata service restart: + +```bash +journalctl _SYSTEMD_INVOCATION_ID="$(systemctl show --value --property=InvocationID netdata)" --namespace=netdata --grep prometheus +``` + +#### System without systemd + +Locate the collector log file, typically at `/var/log/netdata/collector.log`, and use `grep` to filter for collector's name: + +```bash +grep prometheus /var/log/netdata/collector.log +``` + +**Note**: This method shows logs from all restarts. Focus on the **latest entries** for troubleshooting current issues. + +#### Docker Container + +If your Netdata runs in a Docker container named "netdata" (replace if different), use this command: + +```bash +docker logs netdata 2>&1 | grep prometheus +``` + diff --git a/src/go/collectors/go.d.plugin/modules/prometheus/integrations/netflow.md b/src/go/plugin/go.d/modules/prometheus/integrations/netflow.md index a5023d7b1..0b23e39b0 100644 --- a/src/go/collectors/go.d.plugin/modules/prometheus/integrations/netflow.md +++ b/src/go/plugin/go.d/modules/prometheus/integrations/netflow.md @@ -1,6 +1,6 @@ <!--startmeta -custom_edit_url: "https://github.com/netdata/netdata/edit/master/src/go/collectors/go.d.plugin/modules/prometheus/integrations/netflow.md" -meta_yaml: "https://github.com/netdata/netdata/edit/master/src/go/collectors/go.d.plugin/modules/prometheus/metadata.yaml" +custom_edit_url: "https://github.com/netdata/netdata/edit/master/src/go/plugin/go.d/modules/prometheus/integrations/netflow.md" +meta_yaml: "https://github.com/netdata/netdata/edit/master/src/go/plugin/go.d/modules/prometheus/metadata.yaml" sidebar_label: "NetFlow" learn_status: "Published" learn_rel_path: "Collecting Metrics/Networking Stack and Network Interfaces" @@ -37,7 +37,6 @@ This collector supports collecting metrics from multiple instances of this integ #### Auto-Detection By default, it detects instances running on the local host by trying to connect to known ports that are [allocated to exporters](https://github.com/prometheus/prometheus/wiki/Default-port-allocations). -The full list of endpoints is available in the collector's [configuration file](https://github.com/netdata/netdata/blob/master/src/go/collectors/go.d.plugin/config/go.d/prometheus.conf). #### Limits @@ -138,7 +137,7 @@ The following options can be defined globally: update_every, autodetection_retry This option allows you to filter out unwanted time series. Only metrics matching the selector will be collected. - Logic: (pattern1 OR pattern2) AND !(pattern3 or pattern4) -- Pattern syntax: [selector](/src/go/collectors/go.d.plugin/pkg/prometheus/selector/README.md). +- Pattern syntax: [selector](/src/go/plugin/go.d/pkg/prometheus/selector/README.md). - Option syntax: ```yaml @@ -266,6 +265,8 @@ jobs: ### Debug Mode +**Important**: Debug mode is not supported for data collection jobs created via the UI using the Dyncfg feature. + To troubleshoot issues with the `prometheus` collector, run the `go.d.plugin` with the debug option enabled. The output should give you clues as to why the collector isn't working. @@ -288,4 +289,37 @@ should give you clues as to why the collector isn't working. ./go.d.plugin -d -m prometheus ``` +### Getting Logs + +If you're encountering problems with the `prometheus` collector, follow these steps to retrieve logs and identify potential issues: + +- **Run the command** specific to your system (systemd, non-systemd, or Docker container). +- **Examine the output** for any warnings or error messages that might indicate issues. These messages should provide clues about the root cause of the problem. + +#### System with systemd + +Use the following command to view logs generated since the last Netdata service restart: + +```bash +journalctl _SYSTEMD_INVOCATION_ID="$(systemctl show --value --property=InvocationID netdata)" --namespace=netdata --grep prometheus +``` + +#### System without systemd + +Locate the collector log file, typically at `/var/log/netdata/collector.log`, and use `grep` to filter for collector's name: + +```bash +grep prometheus /var/log/netdata/collector.log +``` + +**Note**: This method shows logs from all restarts. Focus on the **latest entries** for troubleshooting current issues. + +#### Docker Container + +If your Netdata runs in a Docker container named "netdata" (replace if different), use this command: + +```bash +docker logs netdata 2>&1 | grep prometheus +``` + diff --git a/src/go/collectors/go.d.plugin/modules/prometheus/integrations/netmeter.md b/src/go/plugin/go.d/modules/prometheus/integrations/netmeter.md index 6311eeac5..97c9893d3 100644 --- a/src/go/collectors/go.d.plugin/modules/prometheus/integrations/netmeter.md +++ b/src/go/plugin/go.d/modules/prometheus/integrations/netmeter.md @@ -1,6 +1,6 @@ <!--startmeta -custom_edit_url: "https://github.com/netdata/netdata/edit/master/src/go/collectors/go.d.plugin/modules/prometheus/integrations/netmeter.md" -meta_yaml: "https://github.com/netdata/netdata/edit/master/src/go/collectors/go.d.plugin/modules/prometheus/metadata.yaml" +custom_edit_url: "https://github.com/netdata/netdata/edit/master/src/go/plugin/go.d/modules/prometheus/integrations/netmeter.md" +meta_yaml: "https://github.com/netdata/netdata/edit/master/src/go/plugin/go.d/modules/prometheus/metadata.yaml" sidebar_label: "NetMeter" learn_status: "Published" learn_rel_path: "Collecting Metrics/Networking Stack and Network Interfaces" @@ -37,7 +37,6 @@ This collector supports collecting metrics from multiple instances of this integ #### Auto-Detection By default, it detects instances running on the local host by trying to connect to known ports that are [allocated to exporters](https://github.com/prometheus/prometheus/wiki/Default-port-allocations). -The full list of endpoints is available in the collector's [configuration file](https://github.com/netdata/netdata/blob/master/src/go/collectors/go.d.plugin/config/go.d/prometheus.conf). #### Limits @@ -138,7 +137,7 @@ The following options can be defined globally: update_every, autodetection_retry This option allows you to filter out unwanted time series. Only metrics matching the selector will be collected. - Logic: (pattern1 OR pattern2) AND !(pattern3 or pattern4) -- Pattern syntax: [selector](/src/go/collectors/go.d.plugin/pkg/prometheus/selector/README.md). +- Pattern syntax: [selector](/src/go/plugin/go.d/pkg/prometheus/selector/README.md). - Option syntax: ```yaml @@ -266,6 +265,8 @@ jobs: ### Debug Mode +**Important**: Debug mode is not supported for data collection jobs created via the UI using the Dyncfg feature. + To troubleshoot issues with the `prometheus` collector, run the `go.d.plugin` with the debug option enabled. The output should give you clues as to why the collector isn't working. @@ -288,4 +289,37 @@ should give you clues as to why the collector isn't working. ./go.d.plugin -d -m prometheus ``` +### Getting Logs + +If you're encountering problems with the `prometheus` collector, follow these steps to retrieve logs and identify potential issues: + +- **Run the command** specific to your system (systemd, non-systemd, or Docker container). +- **Examine the output** for any warnings or error messages that might indicate issues. These messages should provide clues about the root cause of the problem. + +#### System with systemd + +Use the following command to view logs generated since the last Netdata service restart: + +```bash +journalctl _SYSTEMD_INVOCATION_ID="$(systemctl show --value --property=InvocationID netdata)" --namespace=netdata --grep prometheus +``` + +#### System without systemd + +Locate the collector log file, typically at `/var/log/netdata/collector.log`, and use `grep` to filter for collector's name: + +```bash +grep prometheus /var/log/netdata/collector.log +``` + +**Note**: This method shows logs from all restarts. Focus on the **latest entries** for troubleshooting current issues. + +#### Docker Container + +If your Netdata runs in a Docker container named "netdata" (replace if different), use this command: + +```bash +docker logs netdata 2>&1 | grep prometheus +``` + diff --git a/src/go/collectors/go.d.plugin/modules/prometheus/integrations/new_relic.md b/src/go/plugin/go.d/modules/prometheus/integrations/new_relic.md index fb237679d..9ca6b4c8a 100644 --- a/src/go/collectors/go.d.plugin/modules/prometheus/integrations/new_relic.md +++ b/src/go/plugin/go.d/modules/prometheus/integrations/new_relic.md @@ -1,6 +1,6 @@ <!--startmeta -custom_edit_url: "https://github.com/netdata/netdata/edit/master/src/go/collectors/go.d.plugin/modules/prometheus/integrations/new_relic.md" -meta_yaml: "https://github.com/netdata/netdata/edit/master/src/go/collectors/go.d.plugin/modules/prometheus/metadata.yaml" +custom_edit_url: "https://github.com/netdata/netdata/edit/master/src/go/plugin/go.d/modules/prometheus/integrations/new_relic.md" +meta_yaml: "https://github.com/netdata/netdata/edit/master/src/go/plugin/go.d/modules/prometheus/metadata.yaml" sidebar_label: "New Relic" learn_status: "Published" learn_rel_path: "Collecting Metrics/Observability" @@ -37,7 +37,6 @@ This collector supports collecting metrics from multiple instances of this integ #### Auto-Detection By default, it detects instances running on the local host by trying to connect to known ports that are [allocated to exporters](https://github.com/prometheus/prometheus/wiki/Default-port-allocations). -The full list of endpoints is available in the collector's [configuration file](https://github.com/netdata/netdata/blob/master/src/go/collectors/go.d.plugin/config/go.d/prometheus.conf). #### Limits @@ -138,7 +137,7 @@ The following options can be defined globally: update_every, autodetection_retry This option allows you to filter out unwanted time series. Only metrics matching the selector will be collected. - Logic: (pattern1 OR pattern2) AND !(pattern3 or pattern4) -- Pattern syntax: [selector](/src/go/collectors/go.d.plugin/pkg/prometheus/selector/README.md). +- Pattern syntax: [selector](/src/go/plugin/go.d/pkg/prometheus/selector/README.md). - Option syntax: ```yaml @@ -266,6 +265,8 @@ jobs: ### Debug Mode +**Important**: Debug mode is not supported for data collection jobs created via the UI using the Dyncfg feature. + To troubleshoot issues with the `prometheus` collector, run the `go.d.plugin` with the debug option enabled. The output should give you clues as to why the collector isn't working. @@ -288,4 +289,37 @@ should give you clues as to why the collector isn't working. ./go.d.plugin -d -m prometheus ``` +### Getting Logs + +If you're encountering problems with the `prometheus` collector, follow these steps to retrieve logs and identify potential issues: + +- **Run the command** specific to your system (systemd, non-systemd, or Docker container). +- **Examine the output** for any warnings or error messages that might indicate issues. These messages should provide clues about the root cause of the problem. + +#### System with systemd + +Use the following command to view logs generated since the last Netdata service restart: + +```bash +journalctl _SYSTEMD_INVOCATION_ID="$(systemctl show --value --property=InvocationID netdata)" --namespace=netdata --grep prometheus +``` + +#### System without systemd + +Locate the collector log file, typically at `/var/log/netdata/collector.log`, and use `grep` to filter for collector's name: + +```bash +grep prometheus /var/log/netdata/collector.log +``` + +**Note**: This method shows logs from all restarts. Focus on the **latest entries** for troubleshooting current issues. + +#### Docker Container + +If your Netdata runs in a Docker container named "netdata" (replace if different), use this command: + +```bash +docker logs netdata 2>&1 | grep prometheus +``` + diff --git a/src/go/collectors/go.d.plugin/modules/prometheus/integrations/nextcloud_servers.md b/src/go/plugin/go.d/modules/prometheus/integrations/nextcloud_servers.md index 134a73520..9e61c6be8 100644 --- a/src/go/collectors/go.d.plugin/modules/prometheus/integrations/nextcloud_servers.md +++ b/src/go/plugin/go.d/modules/prometheus/integrations/nextcloud_servers.md @@ -1,6 +1,6 @@ <!--startmeta -custom_edit_url: "https://github.com/netdata/netdata/edit/master/src/go/collectors/go.d.plugin/modules/prometheus/integrations/nextcloud_servers.md" -meta_yaml: "https://github.com/netdata/netdata/edit/master/src/go/collectors/go.d.plugin/modules/prometheus/metadata.yaml" +custom_edit_url: "https://github.com/netdata/netdata/edit/master/src/go/plugin/go.d/modules/prometheus/integrations/nextcloud_servers.md" +meta_yaml: "https://github.com/netdata/netdata/edit/master/src/go/plugin/go.d/modules/prometheus/metadata.yaml" sidebar_label: "Nextcloud servers" learn_status: "Published" learn_rel_path: "Collecting Metrics/Cloud Provider Managed" @@ -37,7 +37,6 @@ This collector supports collecting metrics from multiple instances of this integ #### Auto-Detection By default, it detects instances running on the local host by trying to connect to known ports that are [allocated to exporters](https://github.com/prometheus/prometheus/wiki/Default-port-allocations). -The full list of endpoints is available in the collector's [configuration file](https://github.com/netdata/netdata/blob/master/src/go/collectors/go.d.plugin/config/go.d/prometheus.conf). #### Limits @@ -138,7 +137,7 @@ The following options can be defined globally: update_every, autodetection_retry This option allows you to filter out unwanted time series. Only metrics matching the selector will be collected. - Logic: (pattern1 OR pattern2) AND !(pattern3 or pattern4) -- Pattern syntax: [selector](/src/go/collectors/go.d.plugin/pkg/prometheus/selector/README.md). +- Pattern syntax: [selector](/src/go/plugin/go.d/pkg/prometheus/selector/README.md). - Option syntax: ```yaml @@ -266,6 +265,8 @@ jobs: ### Debug Mode +**Important**: Debug mode is not supported for data collection jobs created via the UI using the Dyncfg feature. + To troubleshoot issues with the `prometheus` collector, run the `go.d.plugin` with the debug option enabled. The output should give you clues as to why the collector isn't working. @@ -288,4 +289,37 @@ should give you clues as to why the collector isn't working. ./go.d.plugin -d -m prometheus ``` +### Getting Logs + +If you're encountering problems with the `prometheus` collector, follow these steps to retrieve logs and identify potential issues: + +- **Run the command** specific to your system (systemd, non-systemd, or Docker container). +- **Examine the output** for any warnings or error messages that might indicate issues. These messages should provide clues about the root cause of the problem. + +#### System with systemd + +Use the following command to view logs generated since the last Netdata service restart: + +```bash +journalctl _SYSTEMD_INVOCATION_ID="$(systemctl show --value --property=InvocationID netdata)" --namespace=netdata --grep prometheus +``` + +#### System without systemd + +Locate the collector log file, typically at `/var/log/netdata/collector.log`, and use `grep` to filter for collector's name: + +```bash +grep prometheus /var/log/netdata/collector.log +``` + +**Note**: This method shows logs from all restarts. Focus on the **latest entries** for troubleshooting current issues. + +#### Docker Container + +If your Netdata runs in a Docker container named "netdata" (replace if different), use this command: + +```bash +docker logs netdata 2>&1 | grep prometheus +``` + diff --git a/src/go/collectors/go.d.plugin/modules/prometheus/integrations/nextdns.md b/src/go/plugin/go.d/modules/prometheus/integrations/nextdns.md index 9989c80ed..3d5bc0a6d 100644 --- a/src/go/collectors/go.d.plugin/modules/prometheus/integrations/nextdns.md +++ b/src/go/plugin/go.d/modules/prometheus/integrations/nextdns.md @@ -1,6 +1,6 @@ <!--startmeta -custom_edit_url: "https://github.com/netdata/netdata/edit/master/src/go/collectors/go.d.plugin/modules/prometheus/integrations/nextdns.md" -meta_yaml: "https://github.com/netdata/netdata/edit/master/src/go/collectors/go.d.plugin/modules/prometheus/metadata.yaml" +custom_edit_url: "https://github.com/netdata/netdata/edit/master/src/go/plugin/go.d/modules/prometheus/integrations/nextdns.md" +meta_yaml: "https://github.com/netdata/netdata/edit/master/src/go/plugin/go.d/modules/prometheus/metadata.yaml" sidebar_label: "NextDNS" learn_status: "Published" learn_rel_path: "Collecting Metrics/DNS and DHCP Servers" @@ -37,7 +37,6 @@ This collector supports collecting metrics from multiple instances of this integ #### Auto-Detection By default, it detects instances running on the local host by trying to connect to known ports that are [allocated to exporters](https://github.com/prometheus/prometheus/wiki/Default-port-allocations). -The full list of endpoints is available in the collector's [configuration file](https://github.com/netdata/netdata/blob/master/src/go/collectors/go.d.plugin/config/go.d/prometheus.conf). #### Limits @@ -138,7 +137,7 @@ The following options can be defined globally: update_every, autodetection_retry This option allows you to filter out unwanted time series. Only metrics matching the selector will be collected. - Logic: (pattern1 OR pattern2) AND !(pattern3 or pattern4) -- Pattern syntax: [selector](/src/go/collectors/go.d.plugin/pkg/prometheus/selector/README.md). +- Pattern syntax: [selector](/src/go/plugin/go.d/pkg/prometheus/selector/README.md). - Option syntax: ```yaml @@ -266,6 +265,8 @@ jobs: ### Debug Mode +**Important**: Debug mode is not supported for data collection jobs created via the UI using the Dyncfg feature. + To troubleshoot issues with the `prometheus` collector, run the `go.d.plugin` with the debug option enabled. The output should give you clues as to why the collector isn't working. @@ -288,4 +289,37 @@ should give you clues as to why the collector isn't working. ./go.d.plugin -d -m prometheus ``` +### Getting Logs + +If you're encountering problems with the `prometheus` collector, follow these steps to retrieve logs and identify potential issues: + +- **Run the command** specific to your system (systemd, non-systemd, or Docker container). +- **Examine the output** for any warnings or error messages that might indicate issues. These messages should provide clues about the root cause of the problem. + +#### System with systemd + +Use the following command to view logs generated since the last Netdata service restart: + +```bash +journalctl _SYSTEMD_INVOCATION_ID="$(systemctl show --value --property=InvocationID netdata)" --namespace=netdata --grep prometheus +``` + +#### System without systemd + +Locate the collector log file, typically at `/var/log/netdata/collector.log`, and use `grep` to filter for collector's name: + +```bash +grep prometheus /var/log/netdata/collector.log +``` + +**Note**: This method shows logs from all restarts. Focus on the **latest entries** for troubleshooting current issues. + +#### Docker Container + +If your Netdata runs in a Docker container named "netdata" (replace if different), use this command: + +```bash +docker logs netdata 2>&1 | grep prometheus +``` + diff --git a/src/go/collectors/go.d.plugin/modules/prometheus/integrations/nftables.md b/src/go/plugin/go.d/modules/prometheus/integrations/nftables.md index 30b04d5b4..acce8b8af 100644 --- a/src/go/collectors/go.d.plugin/modules/prometheus/integrations/nftables.md +++ b/src/go/plugin/go.d/modules/prometheus/integrations/nftables.md @@ -1,6 +1,6 @@ <!--startmeta -custom_edit_url: "https://github.com/netdata/netdata/edit/master/src/go/collectors/go.d.plugin/modules/prometheus/integrations/nftables.md" -meta_yaml: "https://github.com/netdata/netdata/edit/master/src/go/collectors/go.d.plugin/modules/prometheus/metadata.yaml" +custom_edit_url: "https://github.com/netdata/netdata/edit/master/src/go/plugin/go.d/modules/prometheus/integrations/nftables.md" +meta_yaml: "https://github.com/netdata/netdata/edit/master/src/go/plugin/go.d/modules/prometheus/metadata.yaml" sidebar_label: "nftables" learn_status: "Published" learn_rel_path: "Collecting Metrics/Linux Systems/Firewall" @@ -37,7 +37,6 @@ This collector supports collecting metrics from multiple instances of this integ #### Auto-Detection By default, it detects instances running on the local host by trying to connect to known ports that are [allocated to exporters](https://github.com/prometheus/prometheus/wiki/Default-port-allocations). -The full list of endpoints is available in the collector's [configuration file](https://github.com/netdata/netdata/blob/master/src/go/collectors/go.d.plugin/config/go.d/prometheus.conf). #### Limits @@ -138,7 +137,7 @@ The following options can be defined globally: update_every, autodetection_retry This option allows you to filter out unwanted time series. Only metrics matching the selector will be collected. - Logic: (pattern1 OR pattern2) AND !(pattern3 or pattern4) -- Pattern syntax: [selector](/src/go/collectors/go.d.plugin/pkg/prometheus/selector/README.md). +- Pattern syntax: [selector](/src/go/plugin/go.d/pkg/prometheus/selector/README.md). - Option syntax: ```yaml @@ -266,6 +265,8 @@ jobs: ### Debug Mode +**Important**: Debug mode is not supported for data collection jobs created via the UI using the Dyncfg feature. + To troubleshoot issues with the `prometheus` collector, run the `go.d.plugin` with the debug option enabled. The output should give you clues as to why the collector isn't working. @@ -288,4 +289,37 @@ should give you clues as to why the collector isn't working. ./go.d.plugin -d -m prometheus ``` +### Getting Logs + +If you're encountering problems with the `prometheus` collector, follow these steps to retrieve logs and identify potential issues: + +- **Run the command** specific to your system (systemd, non-systemd, or Docker container). +- **Examine the output** for any warnings or error messages that might indicate issues. These messages should provide clues about the root cause of the problem. + +#### System with systemd + +Use the following command to view logs generated since the last Netdata service restart: + +```bash +journalctl _SYSTEMD_INVOCATION_ID="$(systemctl show --value --property=InvocationID netdata)" --namespace=netdata --grep prometheus +``` + +#### System without systemd + +Locate the collector log file, typically at `/var/log/netdata/collector.log`, and use `grep` to filter for collector's name: + +```bash +grep prometheus /var/log/netdata/collector.log +``` + +**Note**: This method shows logs from all restarts. Focus on the **latest entries** for troubleshooting current issues. + +#### Docker Container + +If your Netdata runs in a Docker container named "netdata" (replace if different), use this command: + +```bash +docker logs netdata 2>&1 | grep prometheus +``` + diff --git a/src/go/collectors/go.d.plugin/modules/prometheus/integrations/nrpe_daemon.md b/src/go/plugin/go.d/modules/prometheus/integrations/nrpe_daemon.md index f6378aaac..e3a03e356 100644 --- a/src/go/collectors/go.d.plugin/modules/prometheus/integrations/nrpe_daemon.md +++ b/src/go/plugin/go.d/modules/prometheus/integrations/nrpe_daemon.md @@ -1,6 +1,6 @@ <!--startmeta -custom_edit_url: "https://github.com/netdata/netdata/edit/master/src/go/collectors/go.d.plugin/modules/prometheus/integrations/nrpe_daemon.md" -meta_yaml: "https://github.com/netdata/netdata/edit/master/src/go/collectors/go.d.plugin/modules/prometheus/metadata.yaml" +custom_edit_url: "https://github.com/netdata/netdata/edit/master/src/go/plugin/go.d/modules/prometheus/integrations/nrpe_daemon.md" +meta_yaml: "https://github.com/netdata/netdata/edit/master/src/go/plugin/go.d/modules/prometheus/metadata.yaml" sidebar_label: "NRPE daemon" learn_status: "Published" learn_rel_path: "Collecting Metrics/APM" @@ -37,7 +37,6 @@ This collector supports collecting metrics from multiple instances of this integ #### Auto-Detection By default, it detects instances running on the local host by trying to connect to known ports that are [allocated to exporters](https://github.com/prometheus/prometheus/wiki/Default-port-allocations). -The full list of endpoints is available in the collector's [configuration file](https://github.com/netdata/netdata/blob/master/src/go/collectors/go.d.plugin/config/go.d/prometheus.conf). #### Limits @@ -138,7 +137,7 @@ The following options can be defined globally: update_every, autodetection_retry This option allows you to filter out unwanted time series. Only metrics matching the selector will be collected. - Logic: (pattern1 OR pattern2) AND !(pattern3 or pattern4) -- Pattern syntax: [selector](/src/go/collectors/go.d.plugin/pkg/prometheus/selector/README.md). +- Pattern syntax: [selector](/src/go/plugin/go.d/pkg/prometheus/selector/README.md). - Option syntax: ```yaml @@ -266,6 +265,8 @@ jobs: ### Debug Mode +**Important**: Debug mode is not supported for data collection jobs created via the UI using the Dyncfg feature. + To troubleshoot issues with the `prometheus` collector, run the `go.d.plugin` with the debug option enabled. The output should give you clues as to why the collector isn't working. @@ -288,4 +289,37 @@ should give you clues as to why the collector isn't working. ./go.d.plugin -d -m prometheus ``` +### Getting Logs + +If you're encountering problems with the `prometheus` collector, follow these steps to retrieve logs and identify potential issues: + +- **Run the command** specific to your system (systemd, non-systemd, or Docker container). +- **Examine the output** for any warnings or error messages that might indicate issues. These messages should provide clues about the root cause of the problem. + +#### System with systemd + +Use the following command to view logs generated since the last Netdata service restart: + +```bash +journalctl _SYSTEMD_INVOCATION_ID="$(systemctl show --value --property=InvocationID netdata)" --namespace=netdata --grep prometheus +``` + +#### System without systemd + +Locate the collector log file, typically at `/var/log/netdata/collector.log`, and use `grep` to filter for collector's name: + +```bash +grep prometheus /var/log/netdata/collector.log +``` + +**Note**: This method shows logs from all restarts. Focus on the **latest entries** for troubleshooting current issues. + +#### Docker Container + +If your Netdata runs in a Docker container named "netdata" (replace if different), use this command: + +```bash +docker logs netdata 2>&1 | grep prometheus +``` + diff --git a/src/go/collectors/go.d.plugin/modules/prometheus/integrations/nsx-t.md b/src/go/plugin/go.d/modules/prometheus/integrations/nsx-t.md index ec1581207..4e670ba56 100644 --- a/src/go/collectors/go.d.plugin/modules/prometheus/integrations/nsx-t.md +++ b/src/go/plugin/go.d/modules/prometheus/integrations/nsx-t.md @@ -1,6 +1,6 @@ <!--startmeta -custom_edit_url: "https://github.com/netdata/netdata/edit/master/src/go/collectors/go.d.plugin/modules/prometheus/integrations/nsx-t.md" -meta_yaml: "https://github.com/netdata/netdata/edit/master/src/go/collectors/go.d.plugin/modules/prometheus/metadata.yaml" +custom_edit_url: "https://github.com/netdata/netdata/edit/master/src/go/plugin/go.d/modules/prometheus/integrations/nsx-t.md" +meta_yaml: "https://github.com/netdata/netdata/edit/master/src/go/plugin/go.d/modules/prometheus/metadata.yaml" sidebar_label: "NSX-T" learn_status: "Published" learn_rel_path: "Collecting Metrics/Containers and VMs" @@ -37,7 +37,6 @@ This collector supports collecting metrics from multiple instances of this integ #### Auto-Detection By default, it detects instances running on the local host by trying to connect to known ports that are [allocated to exporters](https://github.com/prometheus/prometheus/wiki/Default-port-allocations). -The full list of endpoints is available in the collector's [configuration file](https://github.com/netdata/netdata/blob/master/src/go/collectors/go.d.plugin/config/go.d/prometheus.conf). #### Limits @@ -138,7 +137,7 @@ The following options can be defined globally: update_every, autodetection_retry This option allows you to filter out unwanted time series. Only metrics matching the selector will be collected. - Logic: (pattern1 OR pattern2) AND !(pattern3 or pattern4) -- Pattern syntax: [selector](/src/go/collectors/go.d.plugin/pkg/prometheus/selector/README.md). +- Pattern syntax: [selector](/src/go/plugin/go.d/pkg/prometheus/selector/README.md). - Option syntax: ```yaml @@ -266,6 +265,8 @@ jobs: ### Debug Mode +**Important**: Debug mode is not supported for data collection jobs created via the UI using the Dyncfg feature. + To troubleshoot issues with the `prometheus` collector, run the `go.d.plugin` with the debug option enabled. The output should give you clues as to why the collector isn't working. @@ -288,4 +289,37 @@ should give you clues as to why the collector isn't working. ./go.d.plugin -d -m prometheus ``` +### Getting Logs + +If you're encountering problems with the `prometheus` collector, follow these steps to retrieve logs and identify potential issues: + +- **Run the command** specific to your system (systemd, non-systemd, or Docker container). +- **Examine the output** for any warnings or error messages that might indicate issues. These messages should provide clues about the root cause of the problem. + +#### System with systemd + +Use the following command to view logs generated since the last Netdata service restart: + +```bash +journalctl _SYSTEMD_INVOCATION_ID="$(systemctl show --value --property=InvocationID netdata)" --namespace=netdata --grep prometheus +``` + +#### System without systemd + +Locate the collector log file, typically at `/var/log/netdata/collector.log`, and use `grep` to filter for collector's name: + +```bash +grep prometheus /var/log/netdata/collector.log +``` + +**Note**: This method shows logs from all restarts. Focus on the **latest entries** for troubleshooting current issues. + +#### Docker Container + +If your Netdata runs in a Docker container named "netdata" (replace if different), use this command: + +```bash +docker logs netdata 2>&1 | grep prometheus +``` + diff --git a/src/go/collectors/go.d.plugin/modules/prometheus/integrations/nvml.md b/src/go/plugin/go.d/modules/prometheus/integrations/nvml.md index a6d863dc9..54bb3f1fb 100644 --- a/src/go/collectors/go.d.plugin/modules/prometheus/integrations/nvml.md +++ b/src/go/plugin/go.d/modules/prometheus/integrations/nvml.md @@ -1,6 +1,6 @@ <!--startmeta -custom_edit_url: "https://github.com/netdata/netdata/edit/master/src/go/collectors/go.d.plugin/modules/prometheus/integrations/nvml.md" -meta_yaml: "https://github.com/netdata/netdata/edit/master/src/go/collectors/go.d.plugin/modules/prometheus/metadata.yaml" +custom_edit_url: "https://github.com/netdata/netdata/edit/master/src/go/plugin/go.d/modules/prometheus/integrations/nvml.md" +meta_yaml: "https://github.com/netdata/netdata/edit/master/src/go/plugin/go.d/modules/prometheus/metadata.yaml" sidebar_label: "NVML" learn_status: "Published" learn_rel_path: "Collecting Metrics/Hardware Devices and Sensors" @@ -37,7 +37,6 @@ This collector supports collecting metrics from multiple instances of this integ #### Auto-Detection By default, it detects instances running on the local host by trying to connect to known ports that are [allocated to exporters](https://github.com/prometheus/prometheus/wiki/Default-port-allocations). -The full list of endpoints is available in the collector's [configuration file](https://github.com/netdata/netdata/blob/master/src/go/collectors/go.d.plugin/config/go.d/prometheus.conf). #### Limits @@ -138,7 +137,7 @@ The following options can be defined globally: update_every, autodetection_retry This option allows you to filter out unwanted time series. Only metrics matching the selector will be collected. - Logic: (pattern1 OR pattern2) AND !(pattern3 or pattern4) -- Pattern syntax: [selector](/src/go/collectors/go.d.plugin/pkg/prometheus/selector/README.md). +- Pattern syntax: [selector](/src/go/plugin/go.d/pkg/prometheus/selector/README.md). - Option syntax: ```yaml @@ -266,6 +265,8 @@ jobs: ### Debug Mode +**Important**: Debug mode is not supported for data collection jobs created via the UI using the Dyncfg feature. + To troubleshoot issues with the `prometheus` collector, run the `go.d.plugin` with the debug option enabled. The output should give you clues as to why the collector isn't working. @@ -288,4 +289,37 @@ should give you clues as to why the collector isn't working. ./go.d.plugin -d -m prometheus ``` +### Getting Logs + +If you're encountering problems with the `prometheus` collector, follow these steps to retrieve logs and identify potential issues: + +- **Run the command** specific to your system (systemd, non-systemd, or Docker container). +- **Examine the output** for any warnings or error messages that might indicate issues. These messages should provide clues about the root cause of the problem. + +#### System with systemd + +Use the following command to view logs generated since the last Netdata service restart: + +```bash +journalctl _SYSTEMD_INVOCATION_ID="$(systemctl show --value --property=InvocationID netdata)" --namespace=netdata --grep prometheus +``` + +#### System without systemd + +Locate the collector log file, typically at `/var/log/netdata/collector.log`, and use `grep` to filter for collector's name: + +```bash +grep prometheus /var/log/netdata/collector.log +``` + +**Note**: This method shows logs from all restarts. Focus on the **latest entries** for troubleshooting current issues. + +#### Docker Container + +If your Netdata runs in a Docker container named "netdata" (replace if different), use this command: + +```bash +docker logs netdata 2>&1 | grep prometheus +``` + diff --git a/src/go/collectors/go.d.plugin/modules/prometheus/integrations/obs_studio.md b/src/go/plugin/go.d/modules/prometheus/integrations/obs_studio.md index eb97ee513..254833af5 100644 --- a/src/go/collectors/go.d.plugin/modules/prometheus/integrations/obs_studio.md +++ b/src/go/plugin/go.d/modules/prometheus/integrations/obs_studio.md @@ -1,6 +1,6 @@ <!--startmeta -custom_edit_url: "https://github.com/netdata/netdata/edit/master/src/go/collectors/go.d.plugin/modules/prometheus/integrations/obs_studio.md" -meta_yaml: "https://github.com/netdata/netdata/edit/master/src/go/collectors/go.d.plugin/modules/prometheus/metadata.yaml" +custom_edit_url: "https://github.com/netdata/netdata/edit/master/src/go/plugin/go.d/modules/prometheus/integrations/obs_studio.md" +meta_yaml: "https://github.com/netdata/netdata/edit/master/src/go/plugin/go.d/modules/prometheus/metadata.yaml" sidebar_label: "OBS Studio" learn_status: "Published" learn_rel_path: "Collecting Metrics/Media Services" @@ -37,7 +37,6 @@ This collector supports collecting metrics from multiple instances of this integ #### Auto-Detection By default, it detects instances running on the local host by trying to connect to known ports that are [allocated to exporters](https://github.com/prometheus/prometheus/wiki/Default-port-allocations). -The full list of endpoints is available in the collector's [configuration file](https://github.com/netdata/netdata/blob/master/src/go/collectors/go.d.plugin/config/go.d/prometheus.conf). #### Limits @@ -138,7 +137,7 @@ The following options can be defined globally: update_every, autodetection_retry This option allows you to filter out unwanted time series. Only metrics matching the selector will be collected. - Logic: (pattern1 OR pattern2) AND !(pattern3 or pattern4) -- Pattern syntax: [selector](/src/go/collectors/go.d.plugin/pkg/prometheus/selector/README.md). +- Pattern syntax: [selector](/src/go/plugin/go.d/pkg/prometheus/selector/README.md). - Option syntax: ```yaml @@ -266,6 +265,8 @@ jobs: ### Debug Mode +**Important**: Debug mode is not supported for data collection jobs created via the UI using the Dyncfg feature. + To troubleshoot issues with the `prometheus` collector, run the `go.d.plugin` with the debug option enabled. The output should give you clues as to why the collector isn't working. @@ -288,4 +289,37 @@ should give you clues as to why the collector isn't working. ./go.d.plugin -d -m prometheus ``` +### Getting Logs + +If you're encountering problems with the `prometheus` collector, follow these steps to retrieve logs and identify potential issues: + +- **Run the command** specific to your system (systemd, non-systemd, or Docker container). +- **Examine the output** for any warnings or error messages that might indicate issues. These messages should provide clues about the root cause of the problem. + +#### System with systemd + +Use the following command to view logs generated since the last Netdata service restart: + +```bash +journalctl _SYSTEMD_INVOCATION_ID="$(systemctl show --value --property=InvocationID netdata)" --namespace=netdata --grep prometheus +``` + +#### System without systemd + +Locate the collector log file, typically at `/var/log/netdata/collector.log`, and use `grep` to filter for collector's name: + +```bash +grep prometheus /var/log/netdata/collector.log +``` + +**Note**: This method shows logs from all restarts. Focus on the **latest entries** for troubleshooting current issues. + +#### Docker Container + +If your Netdata runs in a Docker container named "netdata" (replace if different), use this command: + +```bash +docker logs netdata 2>&1 | grep prometheus +``` + diff --git a/src/go/collectors/go.d.plugin/modules/prometheus/integrations/odbc.md b/src/go/plugin/go.d/modules/prometheus/integrations/odbc.md index 553571c86..d128b647b 100644 --- a/src/go/collectors/go.d.plugin/modules/prometheus/integrations/odbc.md +++ b/src/go/plugin/go.d/modules/prometheus/integrations/odbc.md @@ -1,6 +1,6 @@ <!--startmeta -custom_edit_url: "https://github.com/netdata/netdata/edit/master/src/go/collectors/go.d.plugin/modules/prometheus/integrations/odbc.md" -meta_yaml: "https://github.com/netdata/netdata/edit/master/src/go/collectors/go.d.plugin/modules/prometheus/metadata.yaml" +custom_edit_url: "https://github.com/netdata/netdata/edit/master/src/go/plugin/go.d/modules/prometheus/integrations/odbc.md" +meta_yaml: "https://github.com/netdata/netdata/edit/master/src/go/plugin/go.d/modules/prometheus/metadata.yaml" sidebar_label: "ODBC" learn_status: "Published" learn_rel_path: "Collecting Metrics/Databases" @@ -37,7 +37,6 @@ This collector supports collecting metrics from multiple instances of this integ #### Auto-Detection By default, it detects instances running on the local host by trying to connect to known ports that are [allocated to exporters](https://github.com/prometheus/prometheus/wiki/Default-port-allocations). -The full list of endpoints is available in the collector's [configuration file](https://github.com/netdata/netdata/blob/master/src/go/collectors/go.d.plugin/config/go.d/prometheus.conf). #### Limits @@ -138,7 +137,7 @@ The following options can be defined globally: update_every, autodetection_retry This option allows you to filter out unwanted time series. Only metrics matching the selector will be collected. - Logic: (pattern1 OR pattern2) AND !(pattern3 or pattern4) -- Pattern syntax: [selector](/src/go/collectors/go.d.plugin/pkg/prometheus/selector/README.md). +- Pattern syntax: [selector](/src/go/plugin/go.d/pkg/prometheus/selector/README.md). - Option syntax: ```yaml @@ -266,6 +265,8 @@ jobs: ### Debug Mode +**Important**: Debug mode is not supported for data collection jobs created via the UI using the Dyncfg feature. + To troubleshoot issues with the `prometheus` collector, run the `go.d.plugin` with the debug option enabled. The output should give you clues as to why the collector isn't working. @@ -288,4 +289,37 @@ should give you clues as to why the collector isn't working. ./go.d.plugin -d -m prometheus ``` +### Getting Logs + +If you're encountering problems with the `prometheus` collector, follow these steps to retrieve logs and identify potential issues: + +- **Run the command** specific to your system (systemd, non-systemd, or Docker container). +- **Examine the output** for any warnings or error messages that might indicate issues. These messages should provide clues about the root cause of the problem. + +#### System with systemd + +Use the following command to view logs generated since the last Netdata service restart: + +```bash +journalctl _SYSTEMD_INVOCATION_ID="$(systemctl show --value --property=InvocationID netdata)" --namespace=netdata --grep prometheus +``` + +#### System without systemd + +Locate the collector log file, typically at `/var/log/netdata/collector.log`, and use `grep` to filter for collector's name: + +```bash +grep prometheus /var/log/netdata/collector.log +``` + +**Note**: This method shows logs from all restarts. Focus on the **latest entries** for troubleshooting current issues. + +#### Docker Container + +If your Netdata runs in a Docker container named "netdata" (replace if different), use this command: + +```bash +docker logs netdata 2>&1 | grep prometheus +``` + diff --git a/src/go/collectors/go.d.plugin/modules/prometheus/integrations/open_vswitch.md b/src/go/plugin/go.d/modules/prometheus/integrations/open_vswitch.md index b317cb9f1..c8d24a876 100644 --- a/src/go/collectors/go.d.plugin/modules/prometheus/integrations/open_vswitch.md +++ b/src/go/plugin/go.d/modules/prometheus/integrations/open_vswitch.md @@ -1,6 +1,6 @@ <!--startmeta -custom_edit_url: "https://github.com/netdata/netdata/edit/master/src/go/collectors/go.d.plugin/modules/prometheus/integrations/open_vswitch.md" -meta_yaml: "https://github.com/netdata/netdata/edit/master/src/go/collectors/go.d.plugin/modules/prometheus/metadata.yaml" +custom_edit_url: "https://github.com/netdata/netdata/edit/master/src/go/plugin/go.d/modules/prometheus/integrations/open_vswitch.md" +meta_yaml: "https://github.com/netdata/netdata/edit/master/src/go/plugin/go.d/modules/prometheus/metadata.yaml" sidebar_label: "Open vSwitch" learn_status: "Published" learn_rel_path: "Collecting Metrics/Networking Stack and Network Interfaces" @@ -37,7 +37,6 @@ This collector supports collecting metrics from multiple instances of this integ #### Auto-Detection By default, it detects instances running on the local host by trying to connect to known ports that are [allocated to exporters](https://github.com/prometheus/prometheus/wiki/Default-port-allocations). -The full list of endpoints is available in the collector's [configuration file](https://github.com/netdata/netdata/blob/master/src/go/collectors/go.d.plugin/config/go.d/prometheus.conf). #### Limits @@ -138,7 +137,7 @@ The following options can be defined globally: update_every, autodetection_retry This option allows you to filter out unwanted time series. Only metrics matching the selector will be collected. - Logic: (pattern1 OR pattern2) AND !(pattern3 or pattern4) -- Pattern syntax: [selector](/src/go/collectors/go.d.plugin/pkg/prometheus/selector/README.md). +- Pattern syntax: [selector](/src/go/plugin/go.d/pkg/prometheus/selector/README.md). - Option syntax: ```yaml @@ -266,6 +265,8 @@ jobs: ### Debug Mode +**Important**: Debug mode is not supported for data collection jobs created via the UI using the Dyncfg feature. + To troubleshoot issues with the `prometheus` collector, run the `go.d.plugin` with the debug option enabled. The output should give you clues as to why the collector isn't working. @@ -288,4 +289,37 @@ should give you clues as to why the collector isn't working. ./go.d.plugin -d -m prometheus ``` +### Getting Logs + +If you're encountering problems with the `prometheus` collector, follow these steps to retrieve logs and identify potential issues: + +- **Run the command** specific to your system (systemd, non-systemd, or Docker container). +- **Examine the output** for any warnings or error messages that might indicate issues. These messages should provide clues about the root cause of the problem. + +#### System with systemd + +Use the following command to view logs generated since the last Netdata service restart: + +```bash +journalctl _SYSTEMD_INVOCATION_ID="$(systemctl show --value --property=InvocationID netdata)" --namespace=netdata --grep prometheus +``` + +#### System without systemd + +Locate the collector log file, typically at `/var/log/netdata/collector.log`, and use `grep` to filter for collector's name: + +```bash +grep prometheus /var/log/netdata/collector.log +``` + +**Note**: This method shows logs from all restarts. Focus on the **latest entries** for troubleshooting current issues. + +#### Docker Container + +If your Netdata runs in a Docker container named "netdata" (replace if different), use this command: + +```bash +docker logs netdata 2>&1 | grep prometheus +``` + diff --git a/src/go/collectors/go.d.plugin/modules/prometheus/integrations/openhab.md b/src/go/plugin/go.d/modules/prometheus/integrations/openhab.md index 1e0d9fa07..52a2ac94d 100644 --- a/src/go/collectors/go.d.plugin/modules/prometheus/integrations/openhab.md +++ b/src/go/plugin/go.d/modules/prometheus/integrations/openhab.md @@ -1,6 +1,6 @@ <!--startmeta -custom_edit_url: "https://github.com/netdata/netdata/edit/master/src/go/collectors/go.d.plugin/modules/prometheus/integrations/openhab.md" -meta_yaml: "https://github.com/netdata/netdata/edit/master/src/go/collectors/go.d.plugin/modules/prometheus/metadata.yaml" +custom_edit_url: "https://github.com/netdata/netdata/edit/master/src/go/plugin/go.d/modules/prometheus/integrations/openhab.md" +meta_yaml: "https://github.com/netdata/netdata/edit/master/src/go/plugin/go.d/modules/prometheus/metadata.yaml" sidebar_label: "OpenHAB" learn_status: "Published" learn_rel_path: "Collecting Metrics/IoT Devices" @@ -37,7 +37,6 @@ This collector supports collecting metrics from multiple instances of this integ #### Auto-Detection By default, it detects instances running on the local host by trying to connect to known ports that are [allocated to exporters](https://github.com/prometheus/prometheus/wiki/Default-port-allocations). -The full list of endpoints is available in the collector's [configuration file](https://github.com/netdata/netdata/blob/master/src/go/collectors/go.d.plugin/config/go.d/prometheus.conf). #### Limits @@ -138,7 +137,7 @@ The following options can be defined globally: update_every, autodetection_retry This option allows you to filter out unwanted time series. Only metrics matching the selector will be collected. - Logic: (pattern1 OR pattern2) AND !(pattern3 or pattern4) -- Pattern syntax: [selector](/src/go/collectors/go.d.plugin/pkg/prometheus/selector/README.md). +- Pattern syntax: [selector](/src/go/plugin/go.d/pkg/prometheus/selector/README.md). - Option syntax: ```yaml @@ -266,6 +265,8 @@ jobs: ### Debug Mode +**Important**: Debug mode is not supported for data collection jobs created via the UI using the Dyncfg feature. + To troubleshoot issues with the `prometheus` collector, run the `go.d.plugin` with the debug option enabled. The output should give you clues as to why the collector isn't working. @@ -288,4 +289,37 @@ should give you clues as to why the collector isn't working. ./go.d.plugin -d -m prometheus ``` +### Getting Logs + +If you're encountering problems with the `prometheus` collector, follow these steps to retrieve logs and identify potential issues: + +- **Run the command** specific to your system (systemd, non-systemd, or Docker container). +- **Examine the output** for any warnings or error messages that might indicate issues. These messages should provide clues about the root cause of the problem. + +#### System with systemd + +Use the following command to view logs generated since the last Netdata service restart: + +```bash +journalctl _SYSTEMD_INVOCATION_ID="$(systemctl show --value --property=InvocationID netdata)" --namespace=netdata --grep prometheus +``` + +#### System without systemd + +Locate the collector log file, typically at `/var/log/netdata/collector.log`, and use `grep` to filter for collector's name: + +```bash +grep prometheus /var/log/netdata/collector.log +``` + +**Note**: This method shows logs from all restarts. Focus on the **latest entries** for troubleshooting current issues. + +#### Docker Container + +If your Netdata runs in a Docker container named "netdata" (replace if different), use this command: + +```bash +docker logs netdata 2>&1 | grep prometheus +``` + diff --git a/src/go/collectors/go.d.plugin/modules/prometheus/integrations/openldap_community.md b/src/go/plugin/go.d/modules/prometheus/integrations/openldap_community.md index 29ab99e86..c1a547211 100644 --- a/src/go/collectors/go.d.plugin/modules/prometheus/integrations/openldap_community.md +++ b/src/go/plugin/go.d/modules/prometheus/integrations/openldap_community.md @@ -1,6 +1,6 @@ <!--startmeta -custom_edit_url: "https://github.com/netdata/netdata/edit/master/src/go/collectors/go.d.plugin/modules/prometheus/integrations/openldap_community.md" -meta_yaml: "https://github.com/netdata/netdata/edit/master/src/go/collectors/go.d.plugin/modules/prometheus/metadata.yaml" +custom_edit_url: "https://github.com/netdata/netdata/edit/master/src/go/plugin/go.d/modules/prometheus/integrations/openldap_community.md" +meta_yaml: "https://github.com/netdata/netdata/edit/master/src/go/plugin/go.d/modules/prometheus/metadata.yaml" sidebar_label: "OpenLDAP (community)" learn_status: "Published" learn_rel_path: "Collecting Metrics/Authentication and Authorization" @@ -37,7 +37,6 @@ This collector supports collecting metrics from multiple instances of this integ #### Auto-Detection By default, it detects instances running on the local host by trying to connect to known ports that are [allocated to exporters](https://github.com/prometheus/prometheus/wiki/Default-port-allocations). -The full list of endpoints is available in the collector's [configuration file](https://github.com/netdata/netdata/blob/master/src/go/collectors/go.d.plugin/config/go.d/prometheus.conf). #### Limits @@ -138,7 +137,7 @@ The following options can be defined globally: update_every, autodetection_retry This option allows you to filter out unwanted time series. Only metrics matching the selector will be collected. - Logic: (pattern1 OR pattern2) AND !(pattern3 or pattern4) -- Pattern syntax: [selector](/src/go/collectors/go.d.plugin/pkg/prometheus/selector/README.md). +- Pattern syntax: [selector](/src/go/plugin/go.d/pkg/prometheus/selector/README.md). - Option syntax: ```yaml @@ -266,6 +265,8 @@ jobs: ### Debug Mode +**Important**: Debug mode is not supported for data collection jobs created via the UI using the Dyncfg feature. + To troubleshoot issues with the `prometheus` collector, run the `go.d.plugin` with the debug option enabled. The output should give you clues as to why the collector isn't working. @@ -288,4 +289,37 @@ should give you clues as to why the collector isn't working. ./go.d.plugin -d -m prometheus ``` +### Getting Logs + +If you're encountering problems with the `prometheus` collector, follow these steps to retrieve logs and identify potential issues: + +- **Run the command** specific to your system (systemd, non-systemd, or Docker container). +- **Examine the output** for any warnings or error messages that might indicate issues. These messages should provide clues about the root cause of the problem. + +#### System with systemd + +Use the following command to view logs generated since the last Netdata service restart: + +```bash +journalctl _SYSTEMD_INVOCATION_ID="$(systemctl show --value --property=InvocationID netdata)" --namespace=netdata --grep prometheus +``` + +#### System without systemd + +Locate the collector log file, typically at `/var/log/netdata/collector.log`, and use `grep` to filter for collector's name: + +```bash +grep prometheus /var/log/netdata/collector.log +``` + +**Note**: This method shows logs from all restarts. Focus on the **latest entries** for troubleshooting current issues. + +#### Docker Container + +If your Netdata runs in a Docker container named "netdata" (replace if different), use this command: + +```bash +docker logs netdata 2>&1 | grep prometheus +``` + diff --git a/src/go/collectors/go.d.plugin/modules/prometheus/integrations/openrc.md b/src/go/plugin/go.d/modules/prometheus/integrations/openrc.md index 112f95ff8..bc5dfa902 100644 --- a/src/go/collectors/go.d.plugin/modules/prometheus/integrations/openrc.md +++ b/src/go/plugin/go.d/modules/prometheus/integrations/openrc.md @@ -1,6 +1,6 @@ <!--startmeta -custom_edit_url: "https://github.com/netdata/netdata/edit/master/src/go/collectors/go.d.plugin/modules/prometheus/integrations/openrc.md" -meta_yaml: "https://github.com/netdata/netdata/edit/master/src/go/collectors/go.d.plugin/modules/prometheus/metadata.yaml" +custom_edit_url: "https://github.com/netdata/netdata/edit/master/src/go/plugin/go.d/modules/prometheus/integrations/openrc.md" +meta_yaml: "https://github.com/netdata/netdata/edit/master/src/go/plugin/go.d/modules/prometheus/metadata.yaml" sidebar_label: "OpenRC" learn_status: "Published" learn_rel_path: "Collecting Metrics/Linux Systems" @@ -37,7 +37,6 @@ This collector supports collecting metrics from multiple instances of this integ #### Auto-Detection By default, it detects instances running on the local host by trying to connect to known ports that are [allocated to exporters](https://github.com/prometheus/prometheus/wiki/Default-port-allocations). -The full list of endpoints is available in the collector's [configuration file](https://github.com/netdata/netdata/blob/master/src/go/collectors/go.d.plugin/config/go.d/prometheus.conf). #### Limits @@ -138,7 +137,7 @@ The following options can be defined globally: update_every, autodetection_retry This option allows you to filter out unwanted time series. Only metrics matching the selector will be collected. - Logic: (pattern1 OR pattern2) AND !(pattern3 or pattern4) -- Pattern syntax: [selector](/src/go/collectors/go.d.plugin/pkg/prometheus/selector/README.md). +- Pattern syntax: [selector](/src/go/plugin/go.d/pkg/prometheus/selector/README.md). - Option syntax: ```yaml @@ -266,6 +265,8 @@ jobs: ### Debug Mode +**Important**: Debug mode is not supported for data collection jobs created via the UI using the Dyncfg feature. + To troubleshoot issues with the `prometheus` collector, run the `go.d.plugin` with the debug option enabled. The output should give you clues as to why the collector isn't working. @@ -288,4 +289,37 @@ should give you clues as to why the collector isn't working. ./go.d.plugin -d -m prometheus ``` +### Getting Logs + +If you're encountering problems with the `prometheus` collector, follow these steps to retrieve logs and identify potential issues: + +- **Run the command** specific to your system (systemd, non-systemd, or Docker container). +- **Examine the output** for any warnings or error messages that might indicate issues. These messages should provide clues about the root cause of the problem. + +#### System with systemd + +Use the following command to view logs generated since the last Netdata service restart: + +```bash +journalctl _SYSTEMD_INVOCATION_ID="$(systemctl show --value --property=InvocationID netdata)" --namespace=netdata --grep prometheus +``` + +#### System without systemd + +Locate the collector log file, typically at `/var/log/netdata/collector.log`, and use `grep` to filter for collector's name: + +```bash +grep prometheus /var/log/netdata/collector.log +``` + +**Note**: This method shows logs from all restarts. Focus on the **latest entries** for troubleshooting current issues. + +#### Docker Container + +If your Netdata runs in a Docker container named "netdata" (replace if different), use this command: + +```bash +docker logs netdata 2>&1 | grep prometheus +``` + diff --git a/src/go/collectors/go.d.plugin/modules/prometheus/integrations/openrct2.md b/src/go/plugin/go.d/modules/prometheus/integrations/openrct2.md index a6b6b422d..7995839b1 100644 --- a/src/go/collectors/go.d.plugin/modules/prometheus/integrations/openrct2.md +++ b/src/go/plugin/go.d/modules/prometheus/integrations/openrct2.md @@ -1,6 +1,6 @@ <!--startmeta -custom_edit_url: "https://github.com/netdata/netdata/edit/master/src/go/collectors/go.d.plugin/modules/prometheus/integrations/openrct2.md" -meta_yaml: "https://github.com/netdata/netdata/edit/master/src/go/collectors/go.d.plugin/modules/prometheus/metadata.yaml" +custom_edit_url: "https://github.com/netdata/netdata/edit/master/src/go/plugin/go.d/modules/prometheus/integrations/openrct2.md" +meta_yaml: "https://github.com/netdata/netdata/edit/master/src/go/plugin/go.d/modules/prometheus/metadata.yaml" sidebar_label: "OpenRCT2" learn_status: "Published" learn_rel_path: "Collecting Metrics/Gaming" @@ -37,7 +37,6 @@ This collector supports collecting metrics from multiple instances of this integ #### Auto-Detection By default, it detects instances running on the local host by trying to connect to known ports that are [allocated to exporters](https://github.com/prometheus/prometheus/wiki/Default-port-allocations). -The full list of endpoints is available in the collector's [configuration file](https://github.com/netdata/netdata/blob/master/src/go/collectors/go.d.plugin/config/go.d/prometheus.conf). #### Limits @@ -138,7 +137,7 @@ The following options can be defined globally: update_every, autodetection_retry This option allows you to filter out unwanted time series. Only metrics matching the selector will be collected. - Logic: (pattern1 OR pattern2) AND !(pattern3 or pattern4) -- Pattern syntax: [selector](/src/go/collectors/go.d.plugin/pkg/prometheus/selector/README.md). +- Pattern syntax: [selector](/src/go/plugin/go.d/pkg/prometheus/selector/README.md). - Option syntax: ```yaml @@ -266,6 +265,8 @@ jobs: ### Debug Mode +**Important**: Debug mode is not supported for data collection jobs created via the UI using the Dyncfg feature. + To troubleshoot issues with the `prometheus` collector, run the `go.d.plugin` with the debug option enabled. The output should give you clues as to why the collector isn't working. @@ -288,4 +289,37 @@ should give you clues as to why the collector isn't working. ./go.d.plugin -d -m prometheus ``` +### Getting Logs + +If you're encountering problems with the `prometheus` collector, follow these steps to retrieve logs and identify potential issues: + +- **Run the command** specific to your system (systemd, non-systemd, or Docker container). +- **Examine the output** for any warnings or error messages that might indicate issues. These messages should provide clues about the root cause of the problem. + +#### System with systemd + +Use the following command to view logs generated since the last Netdata service restart: + +```bash +journalctl _SYSTEMD_INVOCATION_ID="$(systemctl show --value --property=InvocationID netdata)" --namespace=netdata --grep prometheus +``` + +#### System without systemd + +Locate the collector log file, typically at `/var/log/netdata/collector.log`, and use `grep` to filter for collector's name: + +```bash +grep prometheus /var/log/netdata/collector.log +``` + +**Note**: This method shows logs from all restarts. Focus on the **latest entries** for troubleshooting current issues. + +#### Docker Container + +If your Netdata runs in a Docker container named "netdata" (replace if different), use this command: + +```bash +docker logs netdata 2>&1 | grep prometheus +``` + diff --git a/src/go/collectors/go.d.plugin/modules/prometheus/integrations/openroadm_devices.md b/src/go/plugin/go.d/modules/prometheus/integrations/openroadm_devices.md index b6c30bd8a..d1e23dc3c 100644 --- a/src/go/collectors/go.d.plugin/modules/prometheus/integrations/openroadm_devices.md +++ b/src/go/plugin/go.d/modules/prometheus/integrations/openroadm_devices.md @@ -1,6 +1,6 @@ <!--startmeta -custom_edit_url: "https://github.com/netdata/netdata/edit/master/src/go/collectors/go.d.plugin/modules/prometheus/integrations/openroadm_devices.md" -meta_yaml: "https://github.com/netdata/netdata/edit/master/src/go/collectors/go.d.plugin/modules/prometheus/metadata.yaml" +custom_edit_url: "https://github.com/netdata/netdata/edit/master/src/go/plugin/go.d/modules/prometheus/integrations/openroadm_devices.md" +meta_yaml: "https://github.com/netdata/netdata/edit/master/src/go/plugin/go.d/modules/prometheus/metadata.yaml" sidebar_label: "OpenROADM devices" learn_status: "Published" learn_rel_path: "Collecting Metrics/Networking Stack and Network Interfaces" @@ -37,7 +37,6 @@ This collector supports collecting metrics from multiple instances of this integ #### Auto-Detection By default, it detects instances running on the local host by trying to connect to known ports that are [allocated to exporters](https://github.com/prometheus/prometheus/wiki/Default-port-allocations). -The full list of endpoints is available in the collector's [configuration file](https://github.com/netdata/netdata/blob/master/src/go/collectors/go.d.plugin/config/go.d/prometheus.conf). #### Limits @@ -138,7 +137,7 @@ The following options can be defined globally: update_every, autodetection_retry This option allows you to filter out unwanted time series. Only metrics matching the selector will be collected. - Logic: (pattern1 OR pattern2) AND !(pattern3 or pattern4) -- Pattern syntax: [selector](/src/go/collectors/go.d.plugin/pkg/prometheus/selector/README.md). +- Pattern syntax: [selector](/src/go/plugin/go.d/pkg/prometheus/selector/README.md). - Option syntax: ```yaml @@ -266,6 +265,8 @@ jobs: ### Debug Mode +**Important**: Debug mode is not supported for data collection jobs created via the UI using the Dyncfg feature. + To troubleshoot issues with the `prometheus` collector, run the `go.d.plugin` with the debug option enabled. The output should give you clues as to why the collector isn't working. @@ -288,4 +289,37 @@ should give you clues as to why the collector isn't working. ./go.d.plugin -d -m prometheus ``` +### Getting Logs + +If you're encountering problems with the `prometheus` collector, follow these steps to retrieve logs and identify potential issues: + +- **Run the command** specific to your system (systemd, non-systemd, or Docker container). +- **Examine the output** for any warnings or error messages that might indicate issues. These messages should provide clues about the root cause of the problem. + +#### System with systemd + +Use the following command to view logs generated since the last Netdata service restart: + +```bash +journalctl _SYSTEMD_INVOCATION_ID="$(systemctl show --value --property=InvocationID netdata)" --namespace=netdata --grep prometheus +``` + +#### System without systemd + +Locate the collector log file, typically at `/var/log/netdata/collector.log`, and use `grep` to filter for collector's name: + +```bash +grep prometheus /var/log/netdata/collector.log +``` + +**Note**: This method shows logs from all restarts. Focus on the **latest entries** for troubleshooting current issues. + +#### Docker Container + +If your Netdata runs in a Docker container named "netdata" (replace if different), use this command: + +```bash +docker logs netdata 2>&1 | grep prometheus +``` + diff --git a/src/go/collectors/go.d.plugin/modules/prometheus/integrations/openstack.md b/src/go/plugin/go.d/modules/prometheus/integrations/openstack.md index babb27210..874cf5ce7 100644 --- a/src/go/collectors/go.d.plugin/modules/prometheus/integrations/openstack.md +++ b/src/go/plugin/go.d/modules/prometheus/integrations/openstack.md @@ -1,6 +1,6 @@ <!--startmeta -custom_edit_url: "https://github.com/netdata/netdata/edit/master/src/go/collectors/go.d.plugin/modules/prometheus/integrations/openstack.md" -meta_yaml: "https://github.com/netdata/netdata/edit/master/src/go/collectors/go.d.plugin/modules/prometheus/metadata.yaml" +custom_edit_url: "https://github.com/netdata/netdata/edit/master/src/go/plugin/go.d/modules/prometheus/integrations/openstack.md" +meta_yaml: "https://github.com/netdata/netdata/edit/master/src/go/plugin/go.d/modules/prometheus/metadata.yaml" sidebar_label: "OpenStack" learn_status: "Published" learn_rel_path: "Collecting Metrics/Cloud Provider Managed" @@ -37,7 +37,6 @@ This collector supports collecting metrics from multiple instances of this integ #### Auto-Detection By default, it detects instances running on the local host by trying to connect to known ports that are [allocated to exporters](https://github.com/prometheus/prometheus/wiki/Default-port-allocations). -The full list of endpoints is available in the collector's [configuration file](https://github.com/netdata/netdata/blob/master/src/go/collectors/go.d.plugin/config/go.d/prometheus.conf). #### Limits @@ -138,7 +137,7 @@ The following options can be defined globally: update_every, autodetection_retry This option allows you to filter out unwanted time series. Only metrics matching the selector will be collected. - Logic: (pattern1 OR pattern2) AND !(pattern3 or pattern4) -- Pattern syntax: [selector](/src/go/collectors/go.d.plugin/pkg/prometheus/selector/README.md). +- Pattern syntax: [selector](/src/go/plugin/go.d/pkg/prometheus/selector/README.md). - Option syntax: ```yaml @@ -266,6 +265,8 @@ jobs: ### Debug Mode +**Important**: Debug mode is not supported for data collection jobs created via the UI using the Dyncfg feature. + To troubleshoot issues with the `prometheus` collector, run the `go.d.plugin` with the debug option enabled. The output should give you clues as to why the collector isn't working. @@ -288,4 +289,37 @@ should give you clues as to why the collector isn't working. ./go.d.plugin -d -m prometheus ``` +### Getting Logs + +If you're encountering problems with the `prometheus` collector, follow these steps to retrieve logs and identify potential issues: + +- **Run the command** specific to your system (systemd, non-systemd, or Docker container). +- **Examine the output** for any warnings or error messages that might indicate issues. These messages should provide clues about the root cause of the problem. + +#### System with systemd + +Use the following command to view logs generated since the last Netdata service restart: + +```bash +journalctl _SYSTEMD_INVOCATION_ID="$(systemctl show --value --property=InvocationID netdata)" --namespace=netdata --grep prometheus +``` + +#### System without systemd + +Locate the collector log file, typically at `/var/log/netdata/collector.log`, and use `grep` to filter for collector's name: + +```bash +grep prometheus /var/log/netdata/collector.log +``` + +**Note**: This method shows logs from all restarts. Focus on the **latest entries** for troubleshooting current issues. + +#### Docker Container + +If your Netdata runs in a Docker container named "netdata" (replace if different), use this command: + +```bash +docker logs netdata 2>&1 | grep prometheus +``` + diff --git a/src/go/collectors/go.d.plugin/modules/prometheus/integrations/openvas.md b/src/go/plugin/go.d/modules/prometheus/integrations/openvas.md index fcafa2e21..09681ae7e 100644 --- a/src/go/collectors/go.d.plugin/modules/prometheus/integrations/openvas.md +++ b/src/go/plugin/go.d/modules/prometheus/integrations/openvas.md @@ -1,6 +1,6 @@ <!--startmeta -custom_edit_url: "https://github.com/netdata/netdata/edit/master/src/go/collectors/go.d.plugin/modules/prometheus/integrations/openvas.md" -meta_yaml: "https://github.com/netdata/netdata/edit/master/src/go/collectors/go.d.plugin/modules/prometheus/metadata.yaml" +custom_edit_url: "https://github.com/netdata/netdata/edit/master/src/go/plugin/go.d/modules/prometheus/integrations/openvas.md" +meta_yaml: "https://github.com/netdata/netdata/edit/master/src/go/plugin/go.d/modules/prometheus/metadata.yaml" sidebar_label: "OpenVAS" learn_status: "Published" learn_rel_path: "Collecting Metrics/Security Systems" @@ -37,7 +37,6 @@ This collector supports collecting metrics from multiple instances of this integ #### Auto-Detection By default, it detects instances running on the local host by trying to connect to known ports that are [allocated to exporters](https://github.com/prometheus/prometheus/wiki/Default-port-allocations). -The full list of endpoints is available in the collector's [configuration file](https://github.com/netdata/netdata/blob/master/src/go/collectors/go.d.plugin/config/go.d/prometheus.conf). #### Limits @@ -138,7 +137,7 @@ The following options can be defined globally: update_every, autodetection_retry This option allows you to filter out unwanted time series. Only metrics matching the selector will be collected. - Logic: (pattern1 OR pattern2) AND !(pattern3 or pattern4) -- Pattern syntax: [selector](/src/go/collectors/go.d.plugin/pkg/prometheus/selector/README.md). +- Pattern syntax: [selector](/src/go/plugin/go.d/pkg/prometheus/selector/README.md). - Option syntax: ```yaml @@ -266,6 +265,8 @@ jobs: ### Debug Mode +**Important**: Debug mode is not supported for data collection jobs created via the UI using the Dyncfg feature. + To troubleshoot issues with the `prometheus` collector, run the `go.d.plugin` with the debug option enabled. The output should give you clues as to why the collector isn't working. @@ -288,4 +289,37 @@ should give you clues as to why the collector isn't working. ./go.d.plugin -d -m prometheus ``` +### Getting Logs + +If you're encountering problems with the `prometheus` collector, follow these steps to retrieve logs and identify potential issues: + +- **Run the command** specific to your system (systemd, non-systemd, or Docker container). +- **Examine the output** for any warnings or error messages that might indicate issues. These messages should provide clues about the root cause of the problem. + +#### System with systemd + +Use the following command to view logs generated since the last Netdata service restart: + +```bash +journalctl _SYSTEMD_INVOCATION_ID="$(systemctl show --value --property=InvocationID netdata)" --namespace=netdata --grep prometheus +``` + +#### System without systemd + +Locate the collector log file, typically at `/var/log/netdata/collector.log`, and use `grep` to filter for collector's name: + +```bash +grep prometheus /var/log/netdata/collector.log +``` + +**Note**: This method shows logs from all restarts. Focus on the **latest entries** for troubleshooting current issues. + +#### Docker Container + +If your Netdata runs in a Docker container named "netdata" (replace if different), use this command: + +```bash +docker logs netdata 2>&1 | grep prometheus +``` + diff --git a/src/go/collectors/go.d.plugin/modules/prometheus/integrations/openweathermap.md b/src/go/plugin/go.d/modules/prometheus/integrations/openweathermap.md index 63ea81b82..624478e2b 100644 --- a/src/go/collectors/go.d.plugin/modules/prometheus/integrations/openweathermap.md +++ b/src/go/plugin/go.d/modules/prometheus/integrations/openweathermap.md @@ -1,6 +1,6 @@ <!--startmeta -custom_edit_url: "https://github.com/netdata/netdata/edit/master/src/go/collectors/go.d.plugin/modules/prometheus/integrations/openweathermap.md" -meta_yaml: "https://github.com/netdata/netdata/edit/master/src/go/collectors/go.d.plugin/modules/prometheus/metadata.yaml" +custom_edit_url: "https://github.com/netdata/netdata/edit/master/src/go/plugin/go.d/modules/prometheus/integrations/openweathermap.md" +meta_yaml: "https://github.com/netdata/netdata/edit/master/src/go/plugin/go.d/modules/prometheus/metadata.yaml" sidebar_label: "OpenWeatherMap" learn_status: "Published" learn_rel_path: "Collecting Metrics/Generic Collecting Metrics" @@ -37,7 +37,6 @@ This collector supports collecting metrics from multiple instances of this integ #### Auto-Detection By default, it detects instances running on the local host by trying to connect to known ports that are [allocated to exporters](https://github.com/prometheus/prometheus/wiki/Default-port-allocations). -The full list of endpoints is available in the collector's [configuration file](https://github.com/netdata/netdata/blob/master/src/go/collectors/go.d.plugin/config/go.d/prometheus.conf). #### Limits @@ -138,7 +137,7 @@ The following options can be defined globally: update_every, autodetection_retry This option allows you to filter out unwanted time series. Only metrics matching the selector will be collected. - Logic: (pattern1 OR pattern2) AND !(pattern3 or pattern4) -- Pattern syntax: [selector](/src/go/collectors/go.d.plugin/pkg/prometheus/selector/README.md). +- Pattern syntax: [selector](/src/go/plugin/go.d/pkg/prometheus/selector/README.md). - Option syntax: ```yaml @@ -266,6 +265,8 @@ jobs: ### Debug Mode +**Important**: Debug mode is not supported for data collection jobs created via the UI using the Dyncfg feature. + To troubleshoot issues with the `prometheus` collector, run the `go.d.plugin` with the debug option enabled. The output should give you clues as to why the collector isn't working. @@ -288,4 +289,37 @@ should give you clues as to why the collector isn't working. ./go.d.plugin -d -m prometheus ``` +### Getting Logs + +If you're encountering problems with the `prometheus` collector, follow these steps to retrieve logs and identify potential issues: + +- **Run the command** specific to your system (systemd, non-systemd, or Docker container). +- **Examine the output** for any warnings or error messages that might indicate issues. These messages should provide clues about the root cause of the problem. + +#### System with systemd + +Use the following command to view logs generated since the last Netdata service restart: + +```bash +journalctl _SYSTEMD_INVOCATION_ID="$(systemctl show --value --property=InvocationID netdata)" --namespace=netdata --grep prometheus +``` + +#### System without systemd + +Locate the collector log file, typically at `/var/log/netdata/collector.log`, and use `grep` to filter for collector's name: + +```bash +grep prometheus /var/log/netdata/collector.log +``` + +**Note**: This method shows logs from all restarts. Focus on the **latest entries** for troubleshooting current issues. + +#### Docker Container + +If your Netdata runs in a Docker container named "netdata" (replace if different), use this command: + +```bash +docker logs netdata 2>&1 | grep prometheus +``` + diff --git a/src/go/collectors/go.d.plugin/modules/prometheus/integrations/oracle_db_community.md b/src/go/plugin/go.d/modules/prometheus/integrations/oracle_db_community.md index 18efb8d58..ab59c3181 100644 --- a/src/go/collectors/go.d.plugin/modules/prometheus/integrations/oracle_db_community.md +++ b/src/go/plugin/go.d/modules/prometheus/integrations/oracle_db_community.md @@ -1,6 +1,6 @@ <!--startmeta -custom_edit_url: "https://github.com/netdata/netdata/edit/master/src/go/collectors/go.d.plugin/modules/prometheus/integrations/oracle_db_community.md" -meta_yaml: "https://github.com/netdata/netdata/edit/master/src/go/collectors/go.d.plugin/modules/prometheus/metadata.yaml" +custom_edit_url: "https://github.com/netdata/netdata/edit/master/src/go/plugin/go.d/modules/prometheus/integrations/oracle_db_community.md" +meta_yaml: "https://github.com/netdata/netdata/edit/master/src/go/plugin/go.d/modules/prometheus/metadata.yaml" sidebar_label: "Oracle DB (community)" learn_status: "Published" learn_rel_path: "Collecting Metrics/Databases" @@ -37,7 +37,6 @@ This collector supports collecting metrics from multiple instances of this integ #### Auto-Detection By default, it detects instances running on the local host by trying to connect to known ports that are [allocated to exporters](https://github.com/prometheus/prometheus/wiki/Default-port-allocations). -The full list of endpoints is available in the collector's [configuration file](https://github.com/netdata/netdata/blob/master/src/go/collectors/go.d.plugin/config/go.d/prometheus.conf). #### Limits @@ -138,7 +137,7 @@ The following options can be defined globally: update_every, autodetection_retry This option allows you to filter out unwanted time series. Only metrics matching the selector will be collected. - Logic: (pattern1 OR pattern2) AND !(pattern3 or pattern4) -- Pattern syntax: [selector](/src/go/collectors/go.d.plugin/pkg/prometheus/selector/README.md). +- Pattern syntax: [selector](/src/go/plugin/go.d/pkg/prometheus/selector/README.md). - Option syntax: ```yaml @@ -266,6 +265,8 @@ jobs: ### Debug Mode +**Important**: Debug mode is not supported for data collection jobs created via the UI using the Dyncfg feature. + To troubleshoot issues with the `prometheus` collector, run the `go.d.plugin` with the debug option enabled. The output should give you clues as to why the collector isn't working. @@ -288,4 +289,37 @@ should give you clues as to why the collector isn't working. ./go.d.plugin -d -m prometheus ``` +### Getting Logs + +If you're encountering problems with the `prometheus` collector, follow these steps to retrieve logs and identify potential issues: + +- **Run the command** specific to your system (systemd, non-systemd, or Docker container). +- **Examine the output** for any warnings or error messages that might indicate issues. These messages should provide clues about the root cause of the problem. + +#### System with systemd + +Use the following command to view logs generated since the last Netdata service restart: + +```bash +journalctl _SYSTEMD_INVOCATION_ID="$(systemctl show --value --property=InvocationID netdata)" --namespace=netdata --grep prometheus +``` + +#### System without systemd + +Locate the collector log file, typically at `/var/log/netdata/collector.log`, and use `grep` to filter for collector's name: + +```bash +grep prometheus /var/log/netdata/collector.log +``` + +**Note**: This method shows logs from all restarts. Focus on the **latest entries** for troubleshooting current issues. + +#### Docker Container + +If your Netdata runs in a Docker container named "netdata" (replace if different), use this command: + +```bash +docker logs netdata 2>&1 | grep prometheus +``` + diff --git a/src/go/collectors/go.d.plugin/modules/prometheus/integrations/otrs.md b/src/go/plugin/go.d/modules/prometheus/integrations/otrs.md index 6bb6adabd..8eadb3410 100644 --- a/src/go/collectors/go.d.plugin/modules/prometheus/integrations/otrs.md +++ b/src/go/plugin/go.d/modules/prometheus/integrations/otrs.md @@ -1,6 +1,6 @@ <!--startmeta -custom_edit_url: "https://github.com/netdata/netdata/edit/master/src/go/collectors/go.d.plugin/modules/prometheus/integrations/otrs.md" -meta_yaml: "https://github.com/netdata/netdata/edit/master/src/go/collectors/go.d.plugin/modules/prometheus/metadata.yaml" +custom_edit_url: "https://github.com/netdata/netdata/edit/master/src/go/plugin/go.d/modules/prometheus/integrations/otrs.md" +meta_yaml: "https://github.com/netdata/netdata/edit/master/src/go/plugin/go.d/modules/prometheus/metadata.yaml" sidebar_label: "OTRS" learn_status: "Published" learn_rel_path: "Collecting Metrics/Incident Management" @@ -37,7 +37,6 @@ This collector supports collecting metrics from multiple instances of this integ #### Auto-Detection By default, it detects instances running on the local host by trying to connect to known ports that are [allocated to exporters](https://github.com/prometheus/prometheus/wiki/Default-port-allocations). -The full list of endpoints is available in the collector's [configuration file](https://github.com/netdata/netdata/blob/master/src/go/collectors/go.d.plugin/config/go.d/prometheus.conf). #### Limits @@ -138,7 +137,7 @@ The following options can be defined globally: update_every, autodetection_retry This option allows you to filter out unwanted time series. Only metrics matching the selector will be collected. - Logic: (pattern1 OR pattern2) AND !(pattern3 or pattern4) -- Pattern syntax: [selector](/src/go/collectors/go.d.plugin/pkg/prometheus/selector/README.md). +- Pattern syntax: [selector](/src/go/plugin/go.d/pkg/prometheus/selector/README.md). - Option syntax: ```yaml @@ -266,6 +265,8 @@ jobs: ### Debug Mode +**Important**: Debug mode is not supported for data collection jobs created via the UI using the Dyncfg feature. + To troubleshoot issues with the `prometheus` collector, run the `go.d.plugin` with the debug option enabled. The output should give you clues as to why the collector isn't working. @@ -288,4 +289,37 @@ should give you clues as to why the collector isn't working. ./go.d.plugin -d -m prometheus ``` +### Getting Logs + +If you're encountering problems with the `prometheus` collector, follow these steps to retrieve logs and identify potential issues: + +- **Run the command** specific to your system (systemd, non-systemd, or Docker container). +- **Examine the output** for any warnings or error messages that might indicate issues. These messages should provide clues about the root cause of the problem. + +#### System with systemd + +Use the following command to view logs generated since the last Netdata service restart: + +```bash +journalctl _SYSTEMD_INVOCATION_ID="$(systemctl show --value --property=InvocationID netdata)" --namespace=netdata --grep prometheus +``` + +#### System without systemd + +Locate the collector log file, typically at `/var/log/netdata/collector.log`, and use `grep` to filter for collector's name: + +```bash +grep prometheus /var/log/netdata/collector.log +``` + +**Note**: This method shows logs from all restarts. Focus on the **latest entries** for troubleshooting current issues. + +#### Docker Container + +If your Netdata runs in a Docker container named "netdata" (replace if different), use this command: + +```bash +docker logs netdata 2>&1 | grep prometheus +``` + diff --git a/src/go/collectors/go.d.plugin/modules/prometheus/integrations/patroni.md b/src/go/plugin/go.d/modules/prometheus/integrations/patroni.md index a3ac52cb9..e4fe20123 100644 --- a/src/go/collectors/go.d.plugin/modules/prometheus/integrations/patroni.md +++ b/src/go/plugin/go.d/modules/prometheus/integrations/patroni.md @@ -1,6 +1,6 @@ <!--startmeta -custom_edit_url: "https://github.com/netdata/netdata/edit/master/src/go/collectors/go.d.plugin/modules/prometheus/integrations/patroni.md" -meta_yaml: "https://github.com/netdata/netdata/edit/master/src/go/collectors/go.d.plugin/modules/prometheus/metadata.yaml" +custom_edit_url: "https://github.com/netdata/netdata/edit/master/src/go/plugin/go.d/modules/prometheus/integrations/patroni.md" +meta_yaml: "https://github.com/netdata/netdata/edit/master/src/go/plugin/go.d/modules/prometheus/metadata.yaml" sidebar_label: "Patroni" learn_status: "Published" learn_rel_path: "Collecting Metrics/Databases" @@ -37,7 +37,6 @@ This collector supports collecting metrics from multiple instances of this integ #### Auto-Detection By default, it detects instances running on the local host by trying to connect to known ports that are [allocated to exporters](https://github.com/prometheus/prometheus/wiki/Default-port-allocations). -The full list of endpoints is available in the collector's [configuration file](https://github.com/netdata/netdata/blob/master/src/go/collectors/go.d.plugin/config/go.d/prometheus.conf). #### Limits @@ -138,7 +137,7 @@ The following options can be defined globally: update_every, autodetection_retry This option allows you to filter out unwanted time series. Only metrics matching the selector will be collected. - Logic: (pattern1 OR pattern2) AND !(pattern3 or pattern4) -- Pattern syntax: [selector](/src/go/collectors/go.d.plugin/pkg/prometheus/selector/README.md). +- Pattern syntax: [selector](/src/go/plugin/go.d/pkg/prometheus/selector/README.md). - Option syntax: ```yaml @@ -266,6 +265,8 @@ jobs: ### Debug Mode +**Important**: Debug mode is not supported for data collection jobs created via the UI using the Dyncfg feature. + To troubleshoot issues with the `prometheus` collector, run the `go.d.plugin` with the debug option enabled. The output should give you clues as to why the collector isn't working. @@ -288,4 +289,37 @@ should give you clues as to why the collector isn't working. ./go.d.plugin -d -m prometheus ``` +### Getting Logs + +If you're encountering problems with the `prometheus` collector, follow these steps to retrieve logs and identify potential issues: + +- **Run the command** specific to your system (systemd, non-systemd, or Docker container). +- **Examine the output** for any warnings or error messages that might indicate issues. These messages should provide clues about the root cause of the problem. + +#### System with systemd + +Use the following command to view logs generated since the last Netdata service restart: + +```bash +journalctl _SYSTEMD_INVOCATION_ID="$(systemctl show --value --property=InvocationID netdata)" --namespace=netdata --grep prometheus +``` + +#### System without systemd + +Locate the collector log file, typically at `/var/log/netdata/collector.log`, and use `grep` to filter for collector's name: + +```bash +grep prometheus /var/log/netdata/collector.log +``` + +**Note**: This method shows logs from all restarts. Focus on the **latest entries** for troubleshooting current issues. + +#### Docker Container + +If your Netdata runs in a Docker container named "netdata" (replace if different), use this command: + +```bash +docker logs netdata 2>&1 | grep prometheus +``` + diff --git a/src/go/collectors/go.d.plugin/modules/prometheus/integrations/personal_weather_station.md b/src/go/plugin/go.d/modules/prometheus/integrations/personal_weather_station.md index 97e6bf5b9..af1482067 100644 --- a/src/go/collectors/go.d.plugin/modules/prometheus/integrations/personal_weather_station.md +++ b/src/go/plugin/go.d/modules/prometheus/integrations/personal_weather_station.md @@ -1,6 +1,6 @@ <!--startmeta -custom_edit_url: "https://github.com/netdata/netdata/edit/master/src/go/collectors/go.d.plugin/modules/prometheus/integrations/personal_weather_station.md" -meta_yaml: "https://github.com/netdata/netdata/edit/master/src/go/collectors/go.d.plugin/modules/prometheus/metadata.yaml" +custom_edit_url: "https://github.com/netdata/netdata/edit/master/src/go/plugin/go.d/modules/prometheus/integrations/personal_weather_station.md" +meta_yaml: "https://github.com/netdata/netdata/edit/master/src/go/plugin/go.d/modules/prometheus/metadata.yaml" sidebar_label: "Personal Weather Station" learn_status: "Published" learn_rel_path: "Collecting Metrics/IoT Devices" @@ -37,7 +37,6 @@ This collector supports collecting metrics from multiple instances of this integ #### Auto-Detection By default, it detects instances running on the local host by trying to connect to known ports that are [allocated to exporters](https://github.com/prometheus/prometheus/wiki/Default-port-allocations). -The full list of endpoints is available in the collector's [configuration file](https://github.com/netdata/netdata/blob/master/src/go/collectors/go.d.plugin/config/go.d/prometheus.conf). #### Limits @@ -138,7 +137,7 @@ The following options can be defined globally: update_every, autodetection_retry This option allows you to filter out unwanted time series. Only metrics matching the selector will be collected. - Logic: (pattern1 OR pattern2) AND !(pattern3 or pattern4) -- Pattern syntax: [selector](/src/go/collectors/go.d.plugin/pkg/prometheus/selector/README.md). +- Pattern syntax: [selector](/src/go/plugin/go.d/pkg/prometheus/selector/README.md). - Option syntax: ```yaml @@ -266,6 +265,8 @@ jobs: ### Debug Mode +**Important**: Debug mode is not supported for data collection jobs created via the UI using the Dyncfg feature. + To troubleshoot issues with the `prometheus` collector, run the `go.d.plugin` with the debug option enabled. The output should give you clues as to why the collector isn't working. @@ -288,4 +289,37 @@ should give you clues as to why the collector isn't working. ./go.d.plugin -d -m prometheus ``` +### Getting Logs + +If you're encountering problems with the `prometheus` collector, follow these steps to retrieve logs and identify potential issues: + +- **Run the command** specific to your system (systemd, non-systemd, or Docker container). +- **Examine the output** for any warnings or error messages that might indicate issues. These messages should provide clues about the root cause of the problem. + +#### System with systemd + +Use the following command to view logs generated since the last Netdata service restart: + +```bash +journalctl _SYSTEMD_INVOCATION_ID="$(systemctl show --value --property=InvocationID netdata)" --namespace=netdata --grep prometheus +``` + +#### System without systemd + +Locate the collector log file, typically at `/var/log/netdata/collector.log`, and use `grep` to filter for collector's name: + +```bash +grep prometheus /var/log/netdata/collector.log +``` + +**Note**: This method shows logs from all restarts. Focus on the **latest entries** for troubleshooting current issues. + +#### Docker Container + +If your Netdata runs in a Docker container named "netdata" (replace if different), use this command: + +```bash +docker logs netdata 2>&1 | grep prometheus +``` + diff --git a/src/go/collectors/go.d.plugin/modules/prometheus/integrations/pgbackrest.md b/src/go/plugin/go.d/modules/prometheus/integrations/pgbackrest.md index e61b9e0a7..19c60d95a 100644 --- a/src/go/collectors/go.d.plugin/modules/prometheus/integrations/pgbackrest.md +++ b/src/go/plugin/go.d/modules/prometheus/integrations/pgbackrest.md @@ -1,6 +1,6 @@ <!--startmeta -custom_edit_url: "https://github.com/netdata/netdata/edit/master/src/go/collectors/go.d.plugin/modules/prometheus/integrations/pgbackrest.md" -meta_yaml: "https://github.com/netdata/netdata/edit/master/src/go/collectors/go.d.plugin/modules/prometheus/metadata.yaml" +custom_edit_url: "https://github.com/netdata/netdata/edit/master/src/go/plugin/go.d/modules/prometheus/integrations/pgbackrest.md" +meta_yaml: "https://github.com/netdata/netdata/edit/master/src/go/plugin/go.d/modules/prometheus/metadata.yaml" sidebar_label: "pgBackRest" learn_status: "Published" learn_rel_path: "Collecting Metrics/Databases" @@ -37,7 +37,6 @@ This collector supports collecting metrics from multiple instances of this integ #### Auto-Detection By default, it detects instances running on the local host by trying to connect to known ports that are [allocated to exporters](https://github.com/prometheus/prometheus/wiki/Default-port-allocations). -The full list of endpoints is available in the collector's [configuration file](https://github.com/netdata/netdata/blob/master/src/go/collectors/go.d.plugin/config/go.d/prometheus.conf). #### Limits @@ -138,7 +137,7 @@ The following options can be defined globally: update_every, autodetection_retry This option allows you to filter out unwanted time series. Only metrics matching the selector will be collected. - Logic: (pattern1 OR pattern2) AND !(pattern3 or pattern4) -- Pattern syntax: [selector](/src/go/collectors/go.d.plugin/pkg/prometheus/selector/README.md). +- Pattern syntax: [selector](/src/go/plugin/go.d/pkg/prometheus/selector/README.md). - Option syntax: ```yaml @@ -266,6 +265,8 @@ jobs: ### Debug Mode +**Important**: Debug mode is not supported for data collection jobs created via the UI using the Dyncfg feature. + To troubleshoot issues with the `prometheus` collector, run the `go.d.plugin` with the debug option enabled. The output should give you clues as to why the collector isn't working. @@ -288,4 +289,37 @@ should give you clues as to why the collector isn't working. ./go.d.plugin -d -m prometheus ``` +### Getting Logs + +If you're encountering problems with the `prometheus` collector, follow these steps to retrieve logs and identify potential issues: + +- **Run the command** specific to your system (systemd, non-systemd, or Docker container). +- **Examine the output** for any warnings or error messages that might indicate issues. These messages should provide clues about the root cause of the problem. + +#### System with systemd + +Use the following command to view logs generated since the last Netdata service restart: + +```bash +journalctl _SYSTEMD_INVOCATION_ID="$(systemctl show --value --property=InvocationID netdata)" --namespace=netdata --grep prometheus +``` + +#### System without systemd + +Locate the collector log file, typically at `/var/log/netdata/collector.log`, and use `grep` to filter for collector's name: + +```bash +grep prometheus /var/log/netdata/collector.log +``` + +**Note**: This method shows logs from all restarts. Focus on the **latest entries** for troubleshooting current issues. + +#### Docker Container + +If your Netdata runs in a Docker container named "netdata" (replace if different), use this command: + +```bash +docker logs netdata 2>&1 | grep prometheus +``` + diff --git a/src/go/collectors/go.d.plugin/modules/prometheus/integrations/pgpool-ii.md b/src/go/plugin/go.d/modules/prometheus/integrations/pgpool-ii.md index 153304e5b..a7cfd941f 100644 --- a/src/go/collectors/go.d.plugin/modules/prometheus/integrations/pgpool-ii.md +++ b/src/go/plugin/go.d/modules/prometheus/integrations/pgpool-ii.md @@ -1,6 +1,6 @@ <!--startmeta -custom_edit_url: "https://github.com/netdata/netdata/edit/master/src/go/collectors/go.d.plugin/modules/prometheus/integrations/pgpool-ii.md" -meta_yaml: "https://github.com/netdata/netdata/edit/master/src/go/collectors/go.d.plugin/modules/prometheus/metadata.yaml" +custom_edit_url: "https://github.com/netdata/netdata/edit/master/src/go/plugin/go.d/modules/prometheus/integrations/pgpool-ii.md" +meta_yaml: "https://github.com/netdata/netdata/edit/master/src/go/plugin/go.d/modules/prometheus/metadata.yaml" sidebar_label: "Pgpool-II" learn_status: "Published" learn_rel_path: "Collecting Metrics/Databases" @@ -37,7 +37,6 @@ This collector supports collecting metrics from multiple instances of this integ #### Auto-Detection By default, it detects instances running on the local host by trying to connect to known ports that are [allocated to exporters](https://github.com/prometheus/prometheus/wiki/Default-port-allocations). -The full list of endpoints is available in the collector's [configuration file](https://github.com/netdata/netdata/blob/master/src/go/collectors/go.d.plugin/config/go.d/prometheus.conf). #### Limits @@ -138,7 +137,7 @@ The following options can be defined globally: update_every, autodetection_retry This option allows you to filter out unwanted time series. Only metrics matching the selector will be collected. - Logic: (pattern1 OR pattern2) AND !(pattern3 or pattern4) -- Pattern syntax: [selector](/src/go/collectors/go.d.plugin/pkg/prometheus/selector/README.md). +- Pattern syntax: [selector](/src/go/plugin/go.d/pkg/prometheus/selector/README.md). - Option syntax: ```yaml @@ -266,6 +265,8 @@ jobs: ### Debug Mode +**Important**: Debug mode is not supported for data collection jobs created via the UI using the Dyncfg feature. + To troubleshoot issues with the `prometheus` collector, run the `go.d.plugin` with the debug option enabled. The output should give you clues as to why the collector isn't working. @@ -288,4 +289,37 @@ should give you clues as to why the collector isn't working. ./go.d.plugin -d -m prometheus ``` +### Getting Logs + +If you're encountering problems with the `prometheus` collector, follow these steps to retrieve logs and identify potential issues: + +- **Run the command** specific to your system (systemd, non-systemd, or Docker container). +- **Examine the output** for any warnings or error messages that might indicate issues. These messages should provide clues about the root cause of the problem. + +#### System with systemd + +Use the following command to view logs generated since the last Netdata service restart: + +```bash +journalctl _SYSTEMD_INVOCATION_ID="$(systemctl show --value --property=InvocationID netdata)" --namespace=netdata --grep prometheus +``` + +#### System without systemd + +Locate the collector log file, typically at `/var/log/netdata/collector.log`, and use `grep` to filter for collector's name: + +```bash +grep prometheus /var/log/netdata/collector.log +``` + +**Note**: This method shows logs from all restarts. Focus on the **latest entries** for troubleshooting current issues. + +#### Docker Container + +If your Netdata runs in a Docker container named "netdata" (replace if different), use this command: + +```bash +docker logs netdata 2>&1 | grep prometheus +``` + diff --git a/src/go/collectors/go.d.plugin/modules/prometheus/integrations/philips_hue.md b/src/go/plugin/go.d/modules/prometheus/integrations/philips_hue.md index 0ee879030..47dd77b0e 100644 --- a/src/go/collectors/go.d.plugin/modules/prometheus/integrations/philips_hue.md +++ b/src/go/plugin/go.d/modules/prometheus/integrations/philips_hue.md @@ -1,6 +1,6 @@ <!--startmeta -custom_edit_url: "https://github.com/netdata/netdata/edit/master/src/go/collectors/go.d.plugin/modules/prometheus/integrations/philips_hue.md" -meta_yaml: "https://github.com/netdata/netdata/edit/master/src/go/collectors/go.d.plugin/modules/prometheus/metadata.yaml" +custom_edit_url: "https://github.com/netdata/netdata/edit/master/src/go/plugin/go.d/modules/prometheus/integrations/philips_hue.md" +meta_yaml: "https://github.com/netdata/netdata/edit/master/src/go/plugin/go.d/modules/prometheus/metadata.yaml" sidebar_label: "Philips Hue" learn_status: "Published" learn_rel_path: "Collecting Metrics/IoT Devices" @@ -37,7 +37,6 @@ This collector supports collecting metrics from multiple instances of this integ #### Auto-Detection By default, it detects instances running on the local host by trying to connect to known ports that are [allocated to exporters](https://github.com/prometheus/prometheus/wiki/Default-port-allocations). -The full list of endpoints is available in the collector's [configuration file](https://github.com/netdata/netdata/blob/master/src/go/collectors/go.d.plugin/config/go.d/prometheus.conf). #### Limits @@ -138,7 +137,7 @@ The following options can be defined globally: update_every, autodetection_retry This option allows you to filter out unwanted time series. Only metrics matching the selector will be collected. - Logic: (pattern1 OR pattern2) AND !(pattern3 or pattern4) -- Pattern syntax: [selector](/src/go/collectors/go.d.plugin/pkg/prometheus/selector/README.md). +- Pattern syntax: [selector](/src/go/plugin/go.d/pkg/prometheus/selector/README.md). - Option syntax: ```yaml @@ -266,6 +265,8 @@ jobs: ### Debug Mode +**Important**: Debug mode is not supported for data collection jobs created via the UI using the Dyncfg feature. + To troubleshoot issues with the `prometheus` collector, run the `go.d.plugin` with the debug option enabled. The output should give you clues as to why the collector isn't working. @@ -288,4 +289,37 @@ should give you clues as to why the collector isn't working. ./go.d.plugin -d -m prometheus ``` +### Getting Logs + +If you're encountering problems with the `prometheus` collector, follow these steps to retrieve logs and identify potential issues: + +- **Run the command** specific to your system (systemd, non-systemd, or Docker container). +- **Examine the output** for any warnings or error messages that might indicate issues. These messages should provide clues about the root cause of the problem. + +#### System with systemd + +Use the following command to view logs generated since the last Netdata service restart: + +```bash +journalctl _SYSTEMD_INVOCATION_ID="$(systemctl show --value --property=InvocationID netdata)" --namespace=netdata --grep prometheus +``` + +#### System without systemd + +Locate the collector log file, typically at `/var/log/netdata/collector.log`, and use `grep` to filter for collector's name: + +```bash +grep prometheus /var/log/netdata/collector.log +``` + +**Note**: This method shows logs from all restarts. Focus on the **latest entries** for troubleshooting current issues. + +#### Docker Container + +If your Netdata runs in a Docker container named "netdata" (replace if different), use this command: + +```bash +docker logs netdata 2>&1 | grep prometheus +``` + diff --git a/src/go/collectors/go.d.plugin/modules/prometheus/integrations/pimoroni_enviro+.md b/src/go/plugin/go.d/modules/prometheus/integrations/pimoroni_enviro+.md index 8c93b99bf..12b5719c5 100644 --- a/src/go/collectors/go.d.plugin/modules/prometheus/integrations/pimoroni_enviro+.md +++ b/src/go/plugin/go.d/modules/prometheus/integrations/pimoroni_enviro+.md @@ -1,6 +1,6 @@ <!--startmeta -custom_edit_url: "https://github.com/netdata/netdata/edit/master/src/go/collectors/go.d.plugin/modules/prometheus/integrations/pimoroni_enviro+.md" -meta_yaml: "https://github.com/netdata/netdata/edit/master/src/go/collectors/go.d.plugin/modules/prometheus/metadata.yaml" +custom_edit_url: "https://github.com/netdata/netdata/edit/master/src/go/plugin/go.d/modules/prometheus/integrations/pimoroni_enviro+.md" +meta_yaml: "https://github.com/netdata/netdata/edit/master/src/go/plugin/go.d/modules/prometheus/metadata.yaml" sidebar_label: "Pimoroni Enviro+" learn_status: "Published" learn_rel_path: "Collecting Metrics/IoT Devices" @@ -37,7 +37,6 @@ This collector supports collecting metrics from multiple instances of this integ #### Auto-Detection By default, it detects instances running on the local host by trying to connect to known ports that are [allocated to exporters](https://github.com/prometheus/prometheus/wiki/Default-port-allocations). -The full list of endpoints is available in the collector's [configuration file](https://github.com/netdata/netdata/blob/master/src/go/collectors/go.d.plugin/config/go.d/prometheus.conf). #### Limits @@ -138,7 +137,7 @@ The following options can be defined globally: update_every, autodetection_retry This option allows you to filter out unwanted time series. Only metrics matching the selector will be collected. - Logic: (pattern1 OR pattern2) AND !(pattern3 or pattern4) -- Pattern syntax: [selector](/src/go/collectors/go.d.plugin/pkg/prometheus/selector/README.md). +- Pattern syntax: [selector](/src/go/plugin/go.d/pkg/prometheus/selector/README.md). - Option syntax: ```yaml @@ -266,6 +265,8 @@ jobs: ### Debug Mode +**Important**: Debug mode is not supported for data collection jobs created via the UI using the Dyncfg feature. + To troubleshoot issues with the `prometheus` collector, run the `go.d.plugin` with the debug option enabled. The output should give you clues as to why the collector isn't working. @@ -288,4 +289,37 @@ should give you clues as to why the collector isn't working. ./go.d.plugin -d -m prometheus ``` +### Getting Logs + +If you're encountering problems with the `prometheus` collector, follow these steps to retrieve logs and identify potential issues: + +- **Run the command** specific to your system (systemd, non-systemd, or Docker container). +- **Examine the output** for any warnings or error messages that might indicate issues. These messages should provide clues about the root cause of the problem. + +#### System with systemd + +Use the following command to view logs generated since the last Netdata service restart: + +```bash +journalctl _SYSTEMD_INVOCATION_ID="$(systemctl show --value --property=InvocationID netdata)" --namespace=netdata --grep prometheus +``` + +#### System without systemd + +Locate the collector log file, typically at `/var/log/netdata/collector.log`, and use `grep` to filter for collector's name: + +```bash +grep prometheus /var/log/netdata/collector.log +``` + +**Note**: This method shows logs from all restarts. Focus on the **latest entries** for troubleshooting current issues. + +#### Docker Container + +If your Netdata runs in a Docker container named "netdata" (replace if different), use this command: + +```bash +docker logs netdata 2>&1 | grep prometheus +``` + diff --git a/src/go/collectors/go.d.plugin/modules/prometheus/integrations/pingdom.md b/src/go/plugin/go.d/modules/prometheus/integrations/pingdom.md index b28271a4b..758b80eff 100644 --- a/src/go/collectors/go.d.plugin/modules/prometheus/integrations/pingdom.md +++ b/src/go/plugin/go.d/modules/prometheus/integrations/pingdom.md @@ -1,6 +1,6 @@ <!--startmeta -custom_edit_url: "https://github.com/netdata/netdata/edit/master/src/go/collectors/go.d.plugin/modules/prometheus/integrations/pingdom.md" -meta_yaml: "https://github.com/netdata/netdata/edit/master/src/go/collectors/go.d.plugin/modules/prometheus/metadata.yaml" +custom_edit_url: "https://github.com/netdata/netdata/edit/master/src/go/plugin/go.d/modules/prometheus/integrations/pingdom.md" +meta_yaml: "https://github.com/netdata/netdata/edit/master/src/go/plugin/go.d/modules/prometheus/metadata.yaml" sidebar_label: "Pingdom" learn_status: "Published" learn_rel_path: "Collecting Metrics/Synthetic Checks" @@ -37,7 +37,6 @@ This collector supports collecting metrics from multiple instances of this integ #### Auto-Detection By default, it detects instances running on the local host by trying to connect to known ports that are [allocated to exporters](https://github.com/prometheus/prometheus/wiki/Default-port-allocations). -The full list of endpoints is available in the collector's [configuration file](https://github.com/netdata/netdata/blob/master/src/go/collectors/go.d.plugin/config/go.d/prometheus.conf). #### Limits @@ -138,7 +137,7 @@ The following options can be defined globally: update_every, autodetection_retry This option allows you to filter out unwanted time series. Only metrics matching the selector will be collected. - Logic: (pattern1 OR pattern2) AND !(pattern3 or pattern4) -- Pattern syntax: [selector](/src/go/collectors/go.d.plugin/pkg/prometheus/selector/README.md). +- Pattern syntax: [selector](/src/go/plugin/go.d/pkg/prometheus/selector/README.md). - Option syntax: ```yaml @@ -266,6 +265,8 @@ jobs: ### Debug Mode +**Important**: Debug mode is not supported for data collection jobs created via the UI using the Dyncfg feature. + To troubleshoot issues with the `prometheus` collector, run the `go.d.plugin` with the debug option enabled. The output should give you clues as to why the collector isn't working. @@ -288,4 +289,37 @@ should give you clues as to why the collector isn't working. ./go.d.plugin -d -m prometheus ``` +### Getting Logs + +If you're encountering problems with the `prometheus` collector, follow these steps to retrieve logs and identify potential issues: + +- **Run the command** specific to your system (systemd, non-systemd, or Docker container). +- **Examine the output** for any warnings or error messages that might indicate issues. These messages should provide clues about the root cause of the problem. + +#### System with systemd + +Use the following command to view logs generated since the last Netdata service restart: + +```bash +journalctl _SYSTEMD_INVOCATION_ID="$(systemctl show --value --property=InvocationID netdata)" --namespace=netdata --grep prometheus +``` + +#### System without systemd + +Locate the collector log file, typically at `/var/log/netdata/collector.log`, and use `grep` to filter for collector's name: + +```bash +grep prometheus /var/log/netdata/collector.log +``` + +**Note**: This method shows logs from all restarts. Focus on the **latest entries** for troubleshooting current issues. + +#### Docker Container + +If your Netdata runs in a Docker container named "netdata" (replace if different), use this command: + +```bash +docker logs netdata 2>&1 | grep prometheus +``` + diff --git a/src/go/collectors/go.d.plugin/modules/prometheus/integrations/podman.md b/src/go/plugin/go.d/modules/prometheus/integrations/podman.md index fe7fd0cdb..346e765cf 100644 --- a/src/go/collectors/go.d.plugin/modules/prometheus/integrations/podman.md +++ b/src/go/plugin/go.d/modules/prometheus/integrations/podman.md @@ -1,6 +1,6 @@ <!--startmeta -custom_edit_url: "https://github.com/netdata/netdata/edit/master/src/go/collectors/go.d.plugin/modules/prometheus/integrations/podman.md" -meta_yaml: "https://github.com/netdata/netdata/edit/master/src/go/collectors/go.d.plugin/modules/prometheus/metadata.yaml" +custom_edit_url: "https://github.com/netdata/netdata/edit/master/src/go/plugin/go.d/modules/prometheus/integrations/podman.md" +meta_yaml: "https://github.com/netdata/netdata/edit/master/src/go/plugin/go.d/modules/prometheus/metadata.yaml" sidebar_label: "Podman" learn_status: "Published" learn_rel_path: "Collecting Metrics/Containers and VMs" @@ -37,7 +37,6 @@ This collector supports collecting metrics from multiple instances of this integ #### Auto-Detection By default, it detects instances running on the local host by trying to connect to known ports that are [allocated to exporters](https://github.com/prometheus/prometheus/wiki/Default-port-allocations). -The full list of endpoints is available in the collector's [configuration file](https://github.com/netdata/netdata/blob/master/src/go/collectors/go.d.plugin/config/go.d/prometheus.conf). #### Limits @@ -138,7 +137,7 @@ The following options can be defined globally: update_every, autodetection_retry This option allows you to filter out unwanted time series. Only metrics matching the selector will be collected. - Logic: (pattern1 OR pattern2) AND !(pattern3 or pattern4) -- Pattern syntax: [selector](/src/go/collectors/go.d.plugin/pkg/prometheus/selector/README.md). +- Pattern syntax: [selector](/src/go/plugin/go.d/pkg/prometheus/selector/README.md). - Option syntax: ```yaml @@ -266,6 +265,8 @@ jobs: ### Debug Mode +**Important**: Debug mode is not supported for data collection jobs created via the UI using the Dyncfg feature. + To troubleshoot issues with the `prometheus` collector, run the `go.d.plugin` with the debug option enabled. The output should give you clues as to why the collector isn't working. @@ -288,4 +289,37 @@ should give you clues as to why the collector isn't working. ./go.d.plugin -d -m prometheus ``` +### Getting Logs + +If you're encountering problems with the `prometheus` collector, follow these steps to retrieve logs and identify potential issues: + +- **Run the command** specific to your system (systemd, non-systemd, or Docker container). +- **Examine the output** for any warnings or error messages that might indicate issues. These messages should provide clues about the root cause of the problem. + +#### System with systemd + +Use the following command to view logs generated since the last Netdata service restart: + +```bash +journalctl _SYSTEMD_INVOCATION_ID="$(systemctl show --value --property=InvocationID netdata)" --namespace=netdata --grep prometheus +``` + +#### System without systemd + +Locate the collector log file, typically at `/var/log/netdata/collector.log`, and use `grep` to filter for collector's name: + +```bash +grep prometheus /var/log/netdata/collector.log +``` + +**Note**: This method shows logs from all restarts. Focus on the **latest entries** for troubleshooting current issues. + +#### Docker Container + +If your Netdata runs in a Docker container named "netdata" (replace if different), use this command: + +```bash +docker logs netdata 2>&1 | grep prometheus +``` + diff --git a/src/go/collectors/go.d.plugin/modules/prometheus/integrations/powerpal_devices.md b/src/go/plugin/go.d/modules/prometheus/integrations/powerpal_devices.md index eacd9b916..cc7b681ee 100644 --- a/src/go/collectors/go.d.plugin/modules/prometheus/integrations/powerpal_devices.md +++ b/src/go/plugin/go.d/modules/prometheus/integrations/powerpal_devices.md @@ -1,6 +1,6 @@ <!--startmeta -custom_edit_url: "https://github.com/netdata/netdata/edit/master/src/go/collectors/go.d.plugin/modules/prometheus/integrations/powerpal_devices.md" -meta_yaml: "https://github.com/netdata/netdata/edit/master/src/go/collectors/go.d.plugin/modules/prometheus/metadata.yaml" +custom_edit_url: "https://github.com/netdata/netdata/edit/master/src/go/plugin/go.d/modules/prometheus/integrations/powerpal_devices.md" +meta_yaml: "https://github.com/netdata/netdata/edit/master/src/go/plugin/go.d/modules/prometheus/metadata.yaml" sidebar_label: "Powerpal devices" learn_status: "Published" learn_rel_path: "Collecting Metrics/IoT Devices" @@ -37,7 +37,6 @@ This collector supports collecting metrics from multiple instances of this integ #### Auto-Detection By default, it detects instances running on the local host by trying to connect to known ports that are [allocated to exporters](https://github.com/prometheus/prometheus/wiki/Default-port-allocations). -The full list of endpoints is available in the collector's [configuration file](https://github.com/netdata/netdata/blob/master/src/go/collectors/go.d.plugin/config/go.d/prometheus.conf). #### Limits @@ -138,7 +137,7 @@ The following options can be defined globally: update_every, autodetection_retry This option allows you to filter out unwanted time series. Only metrics matching the selector will be collected. - Logic: (pattern1 OR pattern2) AND !(pattern3 or pattern4) -- Pattern syntax: [selector](/src/go/collectors/go.d.plugin/pkg/prometheus/selector/README.md). +- Pattern syntax: [selector](/src/go/plugin/go.d/pkg/prometheus/selector/README.md). - Option syntax: ```yaml @@ -266,6 +265,8 @@ jobs: ### Debug Mode +**Important**: Debug mode is not supported for data collection jobs created via the UI using the Dyncfg feature. + To troubleshoot issues with the `prometheus` collector, run the `go.d.plugin` with the debug option enabled. The output should give you clues as to why the collector isn't working. @@ -288,4 +289,37 @@ should give you clues as to why the collector isn't working. ./go.d.plugin -d -m prometheus ``` +### Getting Logs + +If you're encountering problems with the `prometheus` collector, follow these steps to retrieve logs and identify potential issues: + +- **Run the command** specific to your system (systemd, non-systemd, or Docker container). +- **Examine the output** for any warnings or error messages that might indicate issues. These messages should provide clues about the root cause of the problem. + +#### System with systemd + +Use the following command to view logs generated since the last Netdata service restart: + +```bash +journalctl _SYSTEMD_INVOCATION_ID="$(systemctl show --value --property=InvocationID netdata)" --namespace=netdata --grep prometheus +``` + +#### System without systemd + +Locate the collector log file, typically at `/var/log/netdata/collector.log`, and use `grep` to filter for collector's name: + +```bash +grep prometheus /var/log/netdata/collector.log +``` + +**Note**: This method shows logs from all restarts. Focus on the **latest entries** for troubleshooting current issues. + +#### Docker Container + +If your Netdata runs in a Docker container named "netdata" (replace if different), use this command: + +```bash +docker logs netdata 2>&1 | grep prometheus +``` + diff --git a/src/go/collectors/go.d.plugin/modules/prometheus/integrations/proftpd.md b/src/go/plugin/go.d/modules/prometheus/integrations/proftpd.md index 9853deac1..f92612383 100644 --- a/src/go/collectors/go.d.plugin/modules/prometheus/integrations/proftpd.md +++ b/src/go/plugin/go.d/modules/prometheus/integrations/proftpd.md @@ -1,6 +1,6 @@ <!--startmeta -custom_edit_url: "https://github.com/netdata/netdata/edit/master/src/go/collectors/go.d.plugin/modules/prometheus/integrations/proftpd.md" -meta_yaml: "https://github.com/netdata/netdata/edit/master/src/go/collectors/go.d.plugin/modules/prometheus/metadata.yaml" +custom_edit_url: "https://github.com/netdata/netdata/edit/master/src/go/plugin/go.d/modules/prometheus/integrations/proftpd.md" +meta_yaml: "https://github.com/netdata/netdata/edit/master/src/go/plugin/go.d/modules/prometheus/metadata.yaml" sidebar_label: "ProFTPD" learn_status: "Published" learn_rel_path: "Collecting Metrics/FTP Servers" @@ -37,7 +37,6 @@ This collector supports collecting metrics from multiple instances of this integ #### Auto-Detection By default, it detects instances running on the local host by trying to connect to known ports that are [allocated to exporters](https://github.com/prometheus/prometheus/wiki/Default-port-allocations). -The full list of endpoints is available in the collector's [configuration file](https://github.com/netdata/netdata/blob/master/src/go/collectors/go.d.plugin/config/go.d/prometheus.conf). #### Limits @@ -138,7 +137,7 @@ The following options can be defined globally: update_every, autodetection_retry This option allows you to filter out unwanted time series. Only metrics matching the selector will be collected. - Logic: (pattern1 OR pattern2) AND !(pattern3 or pattern4) -- Pattern syntax: [selector](/src/go/collectors/go.d.plugin/pkg/prometheus/selector/README.md). +- Pattern syntax: [selector](/src/go/plugin/go.d/pkg/prometheus/selector/README.md). - Option syntax: ```yaml @@ -266,6 +265,8 @@ jobs: ### Debug Mode +**Important**: Debug mode is not supported for data collection jobs created via the UI using the Dyncfg feature. + To troubleshoot issues with the `prometheus` collector, run the `go.d.plugin` with the debug option enabled. The output should give you clues as to why the collector isn't working. @@ -288,4 +289,37 @@ should give you clues as to why the collector isn't working. ./go.d.plugin -d -m prometheus ``` +### Getting Logs + +If you're encountering problems with the `prometheus` collector, follow these steps to retrieve logs and identify potential issues: + +- **Run the command** specific to your system (systemd, non-systemd, or Docker container). +- **Examine the output** for any warnings or error messages that might indicate issues. These messages should provide clues about the root cause of the problem. + +#### System with systemd + +Use the following command to view logs generated since the last Netdata service restart: + +```bash +journalctl _SYSTEMD_INVOCATION_ID="$(systemctl show --value --property=InvocationID netdata)" --namespace=netdata --grep prometheus +``` + +#### System without systemd + +Locate the collector log file, typically at `/var/log/netdata/collector.log`, and use `grep` to filter for collector's name: + +```bash +grep prometheus /var/log/netdata/collector.log +``` + +**Note**: This method shows logs from all restarts. Focus on the **latest entries** for troubleshooting current issues. + +#### Docker Container + +If your Netdata runs in a Docker container named "netdata" (replace if different), use this command: + +```bash +docker logs netdata 2>&1 | grep prometheus +``` + diff --git a/src/go/collectors/go.d.plugin/modules/prometheus/integrations/prometheus_endpoint.md b/src/go/plugin/go.d/modules/prometheus/integrations/prometheus_endpoint.md index fb24711a0..18bbd9d0a 100644 --- a/src/go/collectors/go.d.plugin/modules/prometheus/integrations/prometheus_endpoint.md +++ b/src/go/plugin/go.d/modules/prometheus/integrations/prometheus_endpoint.md @@ -1,6 +1,6 @@ <!--startmeta -custom_edit_url: "https://github.com/netdata/netdata/edit/master/src/go/collectors/go.d.plugin/modules/prometheus/integrations/prometheus_endpoint.md" -meta_yaml: "https://github.com/netdata/netdata/edit/master/src/go/collectors/go.d.plugin/modules/prometheus/metadata.yaml" +custom_edit_url: "https://github.com/netdata/netdata/edit/master/src/go/plugin/go.d/modules/prometheus/integrations/prometheus_endpoint.md" +meta_yaml: "https://github.com/netdata/netdata/edit/master/src/go/plugin/go.d/modules/prometheus/metadata.yaml" sidebar_label: "Prometheus endpoint" learn_status: "Published" learn_rel_path: "Collecting Metrics/Generic Collecting Metrics" @@ -37,7 +37,6 @@ This collector supports collecting metrics from multiple instances of this integ #### Auto-Detection By default, it detects instances running on the local host by trying to connect to known ports that are [allocated to exporters](https://github.com/prometheus/prometheus/wiki/Default-port-allocations). -The full list of endpoints is available in the collector's [configuration file](https://github.com/netdata/netdata/blob/master/src/go/collectors/go.d.plugin/config/go.d/prometheus.conf). #### Limits @@ -134,7 +133,7 @@ The following options can be defined globally: update_every, autodetection_retry This option allows you to filter out unwanted time series. Only metrics matching the selector will be collected. - Logic: (pattern1 OR pattern2) AND !(pattern3 or pattern4) -- Pattern syntax: [selector](/src/go/collectors/go.d.plugin/pkg/prometheus/selector/README.md). +- Pattern syntax: [selector](/src/go/plugin/go.d/pkg/prometheus/selector/README.md). - Option syntax: ```yaml @@ -262,6 +261,8 @@ jobs: ### Debug Mode +**Important**: Debug mode is not supported for data collection jobs created via the UI using the Dyncfg feature. + To troubleshoot issues with the `prometheus` collector, run the `go.d.plugin` with the debug option enabled. The output should give you clues as to why the collector isn't working. @@ -284,4 +285,37 @@ should give you clues as to why the collector isn't working. ./go.d.plugin -d -m prometheus ``` +### Getting Logs + +If you're encountering problems with the `prometheus` collector, follow these steps to retrieve logs and identify potential issues: + +- **Run the command** specific to your system (systemd, non-systemd, or Docker container). +- **Examine the output** for any warnings or error messages that might indicate issues. These messages should provide clues about the root cause of the problem. + +#### System with systemd + +Use the following command to view logs generated since the last Netdata service restart: + +```bash +journalctl _SYSTEMD_INVOCATION_ID="$(systemctl show --value --property=InvocationID netdata)" --namespace=netdata --grep prometheus +``` + +#### System without systemd + +Locate the collector log file, typically at `/var/log/netdata/collector.log`, and use `grep` to filter for collector's name: + +```bash +grep prometheus /var/log/netdata/collector.log +``` + +**Note**: This method shows logs from all restarts. Focus on the **latest entries** for troubleshooting current issues. + +#### Docker Container + +If your Netdata runs in a Docker container named "netdata" (replace if different), use this command: + +```bash +docker logs netdata 2>&1 | grep prometheus +``` + diff --git a/src/go/collectors/go.d.plugin/modules/prometheus/integrations/proxmox_ve.md b/src/go/plugin/go.d/modules/prometheus/integrations/proxmox_ve.md index 9ac69820c..ad4bdfe63 100644 --- a/src/go/collectors/go.d.plugin/modules/prometheus/integrations/proxmox_ve.md +++ b/src/go/plugin/go.d/modules/prometheus/integrations/proxmox_ve.md @@ -1,6 +1,6 @@ <!--startmeta -custom_edit_url: "https://github.com/netdata/netdata/edit/master/src/go/collectors/go.d.plugin/modules/prometheus/integrations/proxmox_ve.md" -meta_yaml: "https://github.com/netdata/netdata/edit/master/src/go/collectors/go.d.plugin/modules/prometheus/metadata.yaml" +custom_edit_url: "https://github.com/netdata/netdata/edit/master/src/go/plugin/go.d/modules/prometheus/integrations/proxmox_ve.md" +meta_yaml: "https://github.com/netdata/netdata/edit/master/src/go/plugin/go.d/modules/prometheus/metadata.yaml" sidebar_label: "Proxmox VE" learn_status: "Published" learn_rel_path: "Collecting Metrics/Containers and VMs" @@ -37,7 +37,6 @@ This collector supports collecting metrics from multiple instances of this integ #### Auto-Detection By default, it detects instances running on the local host by trying to connect to known ports that are [allocated to exporters](https://github.com/prometheus/prometheus/wiki/Default-port-allocations). -The full list of endpoints is available in the collector's [configuration file](https://github.com/netdata/netdata/blob/master/src/go/collectors/go.d.plugin/config/go.d/prometheus.conf). #### Limits @@ -138,7 +137,7 @@ The following options can be defined globally: update_every, autodetection_retry This option allows you to filter out unwanted time series. Only metrics matching the selector will be collected. - Logic: (pattern1 OR pattern2) AND !(pattern3 or pattern4) -- Pattern syntax: [selector](/src/go/collectors/go.d.plugin/pkg/prometheus/selector/README.md). +- Pattern syntax: [selector](/src/go/plugin/go.d/pkg/prometheus/selector/README.md). - Option syntax: ```yaml @@ -266,6 +265,8 @@ jobs: ### Debug Mode +**Important**: Debug mode is not supported for data collection jobs created via the UI using the Dyncfg feature. + To troubleshoot issues with the `prometheus` collector, run the `go.d.plugin` with the debug option enabled. The output should give you clues as to why the collector isn't working. @@ -288,4 +289,37 @@ should give you clues as to why the collector isn't working. ./go.d.plugin -d -m prometheus ``` +### Getting Logs + +If you're encountering problems with the `prometheus` collector, follow these steps to retrieve logs and identify potential issues: + +- **Run the command** specific to your system (systemd, non-systemd, or Docker container). +- **Examine the output** for any warnings or error messages that might indicate issues. These messages should provide clues about the root cause of the problem. + +#### System with systemd + +Use the following command to view logs generated since the last Netdata service restart: + +```bash +journalctl _SYSTEMD_INVOCATION_ID="$(systemctl show --value --property=InvocationID netdata)" --namespace=netdata --grep prometheus +``` + +#### System without systemd + +Locate the collector log file, typically at `/var/log/netdata/collector.log`, and use `grep` to filter for collector's name: + +```bash +grep prometheus /var/log/netdata/collector.log +``` + +**Note**: This method shows logs from all restarts. Focus on the **latest entries** for troubleshooting current issues. + +#### Docker Container + +If your Netdata runs in a Docker container named "netdata" (replace if different), use this command: + +```bash +docker logs netdata 2>&1 | grep prometheus +``` + diff --git a/src/go/collectors/go.d.plugin/modules/prometheus/integrations/radio_thermostat.md b/src/go/plugin/go.d/modules/prometheus/integrations/radio_thermostat.md index 3418c68cf..8004e7ff1 100644 --- a/src/go/collectors/go.d.plugin/modules/prometheus/integrations/radio_thermostat.md +++ b/src/go/plugin/go.d/modules/prometheus/integrations/radio_thermostat.md @@ -1,6 +1,6 @@ <!--startmeta -custom_edit_url: "https://github.com/netdata/netdata/edit/master/src/go/collectors/go.d.plugin/modules/prometheus/integrations/radio_thermostat.md" -meta_yaml: "https://github.com/netdata/netdata/edit/master/src/go/collectors/go.d.plugin/modules/prometheus/metadata.yaml" +custom_edit_url: "https://github.com/netdata/netdata/edit/master/src/go/plugin/go.d/modules/prometheus/integrations/radio_thermostat.md" +meta_yaml: "https://github.com/netdata/netdata/edit/master/src/go/plugin/go.d/modules/prometheus/metadata.yaml" sidebar_label: "Radio Thermostat" learn_status: "Published" learn_rel_path: "Collecting Metrics/IoT Devices" @@ -37,7 +37,6 @@ This collector supports collecting metrics from multiple instances of this integ #### Auto-Detection By default, it detects instances running on the local host by trying to connect to known ports that are [allocated to exporters](https://github.com/prometheus/prometheus/wiki/Default-port-allocations). -The full list of endpoints is available in the collector's [configuration file](https://github.com/netdata/netdata/blob/master/src/go/collectors/go.d.plugin/config/go.d/prometheus.conf). #### Limits @@ -138,7 +137,7 @@ The following options can be defined globally: update_every, autodetection_retry This option allows you to filter out unwanted time series. Only metrics matching the selector will be collected. - Logic: (pattern1 OR pattern2) AND !(pattern3 or pattern4) -- Pattern syntax: [selector](/src/go/collectors/go.d.plugin/pkg/prometheus/selector/README.md). +- Pattern syntax: [selector](/src/go/plugin/go.d/pkg/prometheus/selector/README.md). - Option syntax: ```yaml @@ -266,6 +265,8 @@ jobs: ### Debug Mode +**Important**: Debug mode is not supported for data collection jobs created via the UI using the Dyncfg feature. + To troubleshoot issues with the `prometheus` collector, run the `go.d.plugin` with the debug option enabled. The output should give you clues as to why the collector isn't working. @@ -288,4 +289,37 @@ should give you clues as to why the collector isn't working. ./go.d.plugin -d -m prometheus ``` +### Getting Logs + +If you're encountering problems with the `prometheus` collector, follow these steps to retrieve logs and identify potential issues: + +- **Run the command** specific to your system (systemd, non-systemd, or Docker container). +- **Examine the output** for any warnings or error messages that might indicate issues. These messages should provide clues about the root cause of the problem. + +#### System with systemd + +Use the following command to view logs generated since the last Netdata service restart: + +```bash +journalctl _SYSTEMD_INVOCATION_ID="$(systemctl show --value --property=InvocationID netdata)" --namespace=netdata --grep prometheus +``` + +#### System without systemd + +Locate the collector log file, typically at `/var/log/netdata/collector.log`, and use `grep` to filter for collector's name: + +```bash +grep prometheus /var/log/netdata/collector.log +``` + +**Note**: This method shows logs from all restarts. Focus on the **latest entries** for troubleshooting current issues. + +#### Docker Container + +If your Netdata runs in a Docker container named "netdata" (replace if different), use this command: + +```bash +docker logs netdata 2>&1 | grep prometheus +``` + diff --git a/src/go/collectors/go.d.plugin/modules/prometheus/integrations/radius.md b/src/go/plugin/go.d/modules/prometheus/integrations/radius.md index 11a4625e8..22e2567e6 100644 --- a/src/go/collectors/go.d.plugin/modules/prometheus/integrations/radius.md +++ b/src/go/plugin/go.d/modules/prometheus/integrations/radius.md @@ -1,6 +1,6 @@ <!--startmeta -custom_edit_url: "https://github.com/netdata/netdata/edit/master/src/go/collectors/go.d.plugin/modules/prometheus/integrations/radius.md" -meta_yaml: "https://github.com/netdata/netdata/edit/master/src/go/collectors/go.d.plugin/modules/prometheus/metadata.yaml" +custom_edit_url: "https://github.com/netdata/netdata/edit/master/src/go/plugin/go.d/modules/prometheus/integrations/radius.md" +meta_yaml: "https://github.com/netdata/netdata/edit/master/src/go/plugin/go.d/modules/prometheus/metadata.yaml" sidebar_label: "RADIUS" learn_status: "Published" learn_rel_path: "Collecting Metrics/Authentication and Authorization" @@ -37,7 +37,6 @@ This collector supports collecting metrics from multiple instances of this integ #### Auto-Detection By default, it detects instances running on the local host by trying to connect to known ports that are [allocated to exporters](https://github.com/prometheus/prometheus/wiki/Default-port-allocations). -The full list of endpoints is available in the collector's [configuration file](https://github.com/netdata/netdata/blob/master/src/go/collectors/go.d.plugin/config/go.d/prometheus.conf). #### Limits @@ -138,7 +137,7 @@ The following options can be defined globally: update_every, autodetection_retry This option allows you to filter out unwanted time series. Only metrics matching the selector will be collected. - Logic: (pattern1 OR pattern2) AND !(pattern3 or pattern4) -- Pattern syntax: [selector](/src/go/collectors/go.d.plugin/pkg/prometheus/selector/README.md). +- Pattern syntax: [selector](/src/go/plugin/go.d/pkg/prometheus/selector/README.md). - Option syntax: ```yaml @@ -266,6 +265,8 @@ jobs: ### Debug Mode +**Important**: Debug mode is not supported for data collection jobs created via the UI using the Dyncfg feature. + To troubleshoot issues with the `prometheus` collector, run the `go.d.plugin` with the debug option enabled. The output should give you clues as to why the collector isn't working. @@ -288,4 +289,37 @@ should give you clues as to why the collector isn't working. ./go.d.plugin -d -m prometheus ``` +### Getting Logs + +If you're encountering problems with the `prometheus` collector, follow these steps to retrieve logs and identify potential issues: + +- **Run the command** specific to your system (systemd, non-systemd, or Docker container). +- **Examine the output** for any warnings or error messages that might indicate issues. These messages should provide clues about the root cause of the problem. + +#### System with systemd + +Use the following command to view logs generated since the last Netdata service restart: + +```bash +journalctl _SYSTEMD_INVOCATION_ID="$(systemctl show --value --property=InvocationID netdata)" --namespace=netdata --grep prometheus +``` + +#### System without systemd + +Locate the collector log file, typically at `/var/log/netdata/collector.log`, and use `grep` to filter for collector's name: + +```bash +grep prometheus /var/log/netdata/collector.log +``` + +**Note**: This method shows logs from all restarts. Focus on the **latest entries** for troubleshooting current issues. + +#### Docker Container + +If your Netdata runs in a Docker container named "netdata" (replace if different), use this command: + +```bash +docker logs netdata 2>&1 | grep prometheus +``` + diff --git a/src/go/collectors/go.d.plugin/modules/prometheus/integrations/rancher.md b/src/go/plugin/go.d/modules/prometheus/integrations/rancher.md index 8a00fcf5b..945813b1d 100644 --- a/src/go/collectors/go.d.plugin/modules/prometheus/integrations/rancher.md +++ b/src/go/plugin/go.d/modules/prometheus/integrations/rancher.md @@ -1,6 +1,6 @@ <!--startmeta -custom_edit_url: "https://github.com/netdata/netdata/edit/master/src/go/collectors/go.d.plugin/modules/prometheus/integrations/rancher.md" -meta_yaml: "https://github.com/netdata/netdata/edit/master/src/go/collectors/go.d.plugin/modules/prometheus/metadata.yaml" +custom_edit_url: "https://github.com/netdata/netdata/edit/master/src/go/plugin/go.d/modules/prometheus/integrations/rancher.md" +meta_yaml: "https://github.com/netdata/netdata/edit/master/src/go/plugin/go.d/modules/prometheus/metadata.yaml" sidebar_label: "Rancher" learn_status: "Published" learn_rel_path: "Collecting Metrics/Kubernetes" @@ -37,7 +37,6 @@ This collector supports collecting metrics from multiple instances of this integ #### Auto-Detection By default, it detects instances running on the local host by trying to connect to known ports that are [allocated to exporters](https://github.com/prometheus/prometheus/wiki/Default-port-allocations). -The full list of endpoints is available in the collector's [configuration file](https://github.com/netdata/netdata/blob/master/src/go/collectors/go.d.plugin/config/go.d/prometheus.conf). #### Limits @@ -138,7 +137,7 @@ The following options can be defined globally: update_every, autodetection_retry This option allows you to filter out unwanted time series. Only metrics matching the selector will be collected. - Logic: (pattern1 OR pattern2) AND !(pattern3 or pattern4) -- Pattern syntax: [selector](/src/go/collectors/go.d.plugin/pkg/prometheus/selector/README.md). +- Pattern syntax: [selector](/src/go/plugin/go.d/pkg/prometheus/selector/README.md). - Option syntax: ```yaml @@ -266,6 +265,8 @@ jobs: ### Debug Mode +**Important**: Debug mode is not supported for data collection jobs created via the UI using the Dyncfg feature. + To troubleshoot issues with the `prometheus` collector, run the `go.d.plugin` with the debug option enabled. The output should give you clues as to why the collector isn't working. @@ -288,4 +289,37 @@ should give you clues as to why the collector isn't working. ./go.d.plugin -d -m prometheus ``` +### Getting Logs + +If you're encountering problems with the `prometheus` collector, follow these steps to retrieve logs and identify potential issues: + +- **Run the command** specific to your system (systemd, non-systemd, or Docker container). +- **Examine the output** for any warnings or error messages that might indicate issues. These messages should provide clues about the root cause of the problem. + +#### System with systemd + +Use the following command to view logs generated since the last Netdata service restart: + +```bash +journalctl _SYSTEMD_INVOCATION_ID="$(systemctl show --value --property=InvocationID netdata)" --namespace=netdata --grep prometheus +``` + +#### System without systemd + +Locate the collector log file, typically at `/var/log/netdata/collector.log`, and use `grep` to filter for collector's name: + +```bash +grep prometheus /var/log/netdata/collector.log +``` + +**Note**: This method shows logs from all restarts. Focus on the **latest entries** for troubleshooting current issues. + +#### Docker Container + +If your Netdata runs in a Docker container named "netdata" (replace if different), use this command: + +```bash +docker logs netdata 2>&1 | grep prometheus +``` + diff --git a/src/go/collectors/go.d.plugin/modules/prometheus/integrations/raritan_pdu.md b/src/go/plugin/go.d/modules/prometheus/integrations/raritan_pdu.md index f7b1720e1..2781c3af8 100644 --- a/src/go/collectors/go.d.plugin/modules/prometheus/integrations/raritan_pdu.md +++ b/src/go/plugin/go.d/modules/prometheus/integrations/raritan_pdu.md @@ -1,6 +1,6 @@ <!--startmeta -custom_edit_url: "https://github.com/netdata/netdata/edit/master/src/go/collectors/go.d.plugin/modules/prometheus/integrations/raritan_pdu.md" -meta_yaml: "https://github.com/netdata/netdata/edit/master/src/go/collectors/go.d.plugin/modules/prometheus/metadata.yaml" +custom_edit_url: "https://github.com/netdata/netdata/edit/master/src/go/plugin/go.d/modules/prometheus/integrations/raritan_pdu.md" +meta_yaml: "https://github.com/netdata/netdata/edit/master/src/go/plugin/go.d/modules/prometheus/metadata.yaml" sidebar_label: "Raritan PDU" learn_status: "Published" learn_rel_path: "Collecting Metrics/Hardware Devices and Sensors" @@ -37,7 +37,6 @@ This collector supports collecting metrics from multiple instances of this integ #### Auto-Detection By default, it detects instances running on the local host by trying to connect to known ports that are [allocated to exporters](https://github.com/prometheus/prometheus/wiki/Default-port-allocations). -The full list of endpoints is available in the collector's [configuration file](https://github.com/netdata/netdata/blob/master/src/go/collectors/go.d.plugin/config/go.d/prometheus.conf). #### Limits @@ -138,7 +137,7 @@ The following options can be defined globally: update_every, autodetection_retry This option allows you to filter out unwanted time series. Only metrics matching the selector will be collected. - Logic: (pattern1 OR pattern2) AND !(pattern3 or pattern4) -- Pattern syntax: [selector](/src/go/collectors/go.d.plugin/pkg/prometheus/selector/README.md). +- Pattern syntax: [selector](/src/go/plugin/go.d/pkg/prometheus/selector/README.md). - Option syntax: ```yaml @@ -266,6 +265,8 @@ jobs: ### Debug Mode +**Important**: Debug mode is not supported for data collection jobs created via the UI using the Dyncfg feature. + To troubleshoot issues with the `prometheus` collector, run the `go.d.plugin` with the debug option enabled. The output should give you clues as to why the collector isn't working. @@ -288,4 +289,37 @@ should give you clues as to why the collector isn't working. ./go.d.plugin -d -m prometheus ``` +### Getting Logs + +If you're encountering problems with the `prometheus` collector, follow these steps to retrieve logs and identify potential issues: + +- **Run the command** specific to your system (systemd, non-systemd, or Docker container). +- **Examine the output** for any warnings or error messages that might indicate issues. These messages should provide clues about the root cause of the problem. + +#### System with systemd + +Use the following command to view logs generated since the last Netdata service restart: + +```bash +journalctl _SYSTEMD_INVOCATION_ID="$(systemctl show --value --property=InvocationID netdata)" --namespace=netdata --grep prometheus +``` + +#### System without systemd + +Locate the collector log file, typically at `/var/log/netdata/collector.log`, and use `grep` to filter for collector's name: + +```bash +grep prometheus /var/log/netdata/collector.log +``` + +**Note**: This method shows logs from all restarts. Focus on the **latest entries** for troubleshooting current issues. + +#### Docker Container + +If your Netdata runs in a Docker container named "netdata" (replace if different), use this command: + +```bash +docker logs netdata 2>&1 | grep prometheus +``` + diff --git a/src/go/collectors/go.d.plugin/modules/prometheus/integrations/redis_queue.md b/src/go/plugin/go.d/modules/prometheus/integrations/redis_queue.md index 5dc630057..d3fb16d4d 100644 --- a/src/go/collectors/go.d.plugin/modules/prometheus/integrations/redis_queue.md +++ b/src/go/plugin/go.d/modules/prometheus/integrations/redis_queue.md @@ -1,6 +1,6 @@ <!--startmeta -custom_edit_url: "https://github.com/netdata/netdata/edit/master/src/go/collectors/go.d.plugin/modules/prometheus/integrations/redis_queue.md" -meta_yaml: "https://github.com/netdata/netdata/edit/master/src/go/collectors/go.d.plugin/modules/prometheus/metadata.yaml" +custom_edit_url: "https://github.com/netdata/netdata/edit/master/src/go/plugin/go.d/modules/prometheus/integrations/redis_queue.md" +meta_yaml: "https://github.com/netdata/netdata/edit/master/src/go/plugin/go.d/modules/prometheus/metadata.yaml" sidebar_label: "Redis Queue" learn_status: "Published" learn_rel_path: "Collecting Metrics/Message Brokers" @@ -37,7 +37,6 @@ This collector supports collecting metrics from multiple instances of this integ #### Auto-Detection By default, it detects instances running on the local host by trying to connect to known ports that are [allocated to exporters](https://github.com/prometheus/prometheus/wiki/Default-port-allocations). -The full list of endpoints is available in the collector's [configuration file](https://github.com/netdata/netdata/blob/master/src/go/collectors/go.d.plugin/config/go.d/prometheus.conf). #### Limits @@ -138,7 +137,7 @@ The following options can be defined globally: update_every, autodetection_retry This option allows you to filter out unwanted time series. Only metrics matching the selector will be collected. - Logic: (pattern1 OR pattern2) AND !(pattern3 or pattern4) -- Pattern syntax: [selector](/src/go/collectors/go.d.plugin/pkg/prometheus/selector/README.md). +- Pattern syntax: [selector](/src/go/plugin/go.d/pkg/prometheus/selector/README.md). - Option syntax: ```yaml @@ -266,6 +265,8 @@ jobs: ### Debug Mode +**Important**: Debug mode is not supported for data collection jobs created via the UI using the Dyncfg feature. + To troubleshoot issues with the `prometheus` collector, run the `go.d.plugin` with the debug option enabled. The output should give you clues as to why the collector isn't working. @@ -288,4 +289,37 @@ should give you clues as to why the collector isn't working. ./go.d.plugin -d -m prometheus ``` +### Getting Logs + +If you're encountering problems with the `prometheus` collector, follow these steps to retrieve logs and identify potential issues: + +- **Run the command** specific to your system (systemd, non-systemd, or Docker container). +- **Examine the output** for any warnings or error messages that might indicate issues. These messages should provide clues about the root cause of the problem. + +#### System with systemd + +Use the following command to view logs generated since the last Netdata service restart: + +```bash +journalctl _SYSTEMD_INVOCATION_ID="$(systemctl show --value --property=InvocationID netdata)" --namespace=netdata --grep prometheus +``` + +#### System without systemd + +Locate the collector log file, typically at `/var/log/netdata/collector.log`, and use `grep` to filter for collector's name: + +```bash +grep prometheus /var/log/netdata/collector.log +``` + +**Note**: This method shows logs from all restarts. Focus on the **latest entries** for troubleshooting current issues. + +#### Docker Container + +If your Netdata runs in a Docker container named "netdata" (replace if different), use this command: + +```bash +docker logs netdata 2>&1 | grep prometheus +``` + diff --git a/src/go/collectors/go.d.plugin/modules/prometheus/integrations/ripe_atlas.md b/src/go/plugin/go.d/modules/prometheus/integrations/ripe_atlas.md index 4c666ffd7..7aa35e8d5 100644 --- a/src/go/collectors/go.d.plugin/modules/prometheus/integrations/ripe_atlas.md +++ b/src/go/plugin/go.d/modules/prometheus/integrations/ripe_atlas.md @@ -1,6 +1,6 @@ <!--startmeta -custom_edit_url: "https://github.com/netdata/netdata/edit/master/src/go/collectors/go.d.plugin/modules/prometheus/integrations/ripe_atlas.md" -meta_yaml: "https://github.com/netdata/netdata/edit/master/src/go/collectors/go.d.plugin/modules/prometheus/metadata.yaml" +custom_edit_url: "https://github.com/netdata/netdata/edit/master/src/go/plugin/go.d/modules/prometheus/integrations/ripe_atlas.md" +meta_yaml: "https://github.com/netdata/netdata/edit/master/src/go/plugin/go.d/modules/prometheus/metadata.yaml" sidebar_label: "RIPE Atlas" learn_status: "Published" learn_rel_path: "Collecting Metrics/Networking Stack and Network Interfaces" @@ -37,7 +37,6 @@ This collector supports collecting metrics from multiple instances of this integ #### Auto-Detection By default, it detects instances running on the local host by trying to connect to known ports that are [allocated to exporters](https://github.com/prometheus/prometheus/wiki/Default-port-allocations). -The full list of endpoints is available in the collector's [configuration file](https://github.com/netdata/netdata/blob/master/src/go/collectors/go.d.plugin/config/go.d/prometheus.conf). #### Limits @@ -138,7 +137,7 @@ The following options can be defined globally: update_every, autodetection_retry This option allows you to filter out unwanted time series. Only metrics matching the selector will be collected. - Logic: (pattern1 OR pattern2) AND !(pattern3 or pattern4) -- Pattern syntax: [selector](/src/go/collectors/go.d.plugin/pkg/prometheus/selector/README.md). +- Pattern syntax: [selector](/src/go/plugin/go.d/pkg/prometheus/selector/README.md). - Option syntax: ```yaml @@ -266,6 +265,8 @@ jobs: ### Debug Mode +**Important**: Debug mode is not supported for data collection jobs created via the UI using the Dyncfg feature. + To troubleshoot issues with the `prometheus` collector, run the `go.d.plugin` with the debug option enabled. The output should give you clues as to why the collector isn't working. @@ -288,4 +289,37 @@ should give you clues as to why the collector isn't working. ./go.d.plugin -d -m prometheus ``` +### Getting Logs + +If you're encountering problems with the `prometheus` collector, follow these steps to retrieve logs and identify potential issues: + +- **Run the command** specific to your system (systemd, non-systemd, or Docker container). +- **Examine the output** for any warnings or error messages that might indicate issues. These messages should provide clues about the root cause of the problem. + +#### System with systemd + +Use the following command to view logs generated since the last Netdata service restart: + +```bash +journalctl _SYSTEMD_INVOCATION_ID="$(systemctl show --value --property=InvocationID netdata)" --namespace=netdata --grep prometheus +``` + +#### System without systemd + +Locate the collector log file, typically at `/var/log/netdata/collector.log`, and use `grep` to filter for collector's name: + +```bash +grep prometheus /var/log/netdata/collector.log +``` + +**Note**: This method shows logs from all restarts. Focus on the **latest entries** for troubleshooting current issues. + +#### Docker Container + +If your Netdata runs in a Docker container named "netdata" (replace if different), use this command: + +```bash +docker logs netdata 2>&1 | grep prometheus +``` + diff --git a/src/go/collectors/go.d.plugin/modules/prometheus/integrations/sabnzbd.md b/src/go/plugin/go.d/modules/prometheus/integrations/sabnzbd.md index f1e46ab98..3c98fa9e1 100644 --- a/src/go/collectors/go.d.plugin/modules/prometheus/integrations/sabnzbd.md +++ b/src/go/plugin/go.d/modules/prometheus/integrations/sabnzbd.md @@ -1,6 +1,6 @@ <!--startmeta -custom_edit_url: "https://github.com/netdata/netdata/edit/master/src/go/collectors/go.d.plugin/modules/prometheus/integrations/sabnzbd.md" -meta_yaml: "https://github.com/netdata/netdata/edit/master/src/go/collectors/go.d.plugin/modules/prometheus/metadata.yaml" +custom_edit_url: "https://github.com/netdata/netdata/edit/master/src/go/plugin/go.d/modules/prometheus/integrations/sabnzbd.md" +meta_yaml: "https://github.com/netdata/netdata/edit/master/src/go/plugin/go.d/modules/prometheus/metadata.yaml" sidebar_label: "SABnzbd" learn_status: "Published" learn_rel_path: "Collecting Metrics/Media Services" @@ -37,7 +37,6 @@ This collector supports collecting metrics from multiple instances of this integ #### Auto-Detection By default, it detects instances running on the local host by trying to connect to known ports that are [allocated to exporters](https://github.com/prometheus/prometheus/wiki/Default-port-allocations). -The full list of endpoints is available in the collector's [configuration file](https://github.com/netdata/netdata/blob/master/src/go/collectors/go.d.plugin/config/go.d/prometheus.conf). #### Limits @@ -138,7 +137,7 @@ The following options can be defined globally: update_every, autodetection_retry This option allows you to filter out unwanted time series. Only metrics matching the selector will be collected. - Logic: (pattern1 OR pattern2) AND !(pattern3 or pattern4) -- Pattern syntax: [selector](/src/go/collectors/go.d.plugin/pkg/prometheus/selector/README.md). +- Pattern syntax: [selector](/src/go/plugin/go.d/pkg/prometheus/selector/README.md). - Option syntax: ```yaml @@ -266,6 +265,8 @@ jobs: ### Debug Mode +**Important**: Debug mode is not supported for data collection jobs created via the UI using the Dyncfg feature. + To troubleshoot issues with the `prometheus` collector, run the `go.d.plugin` with the debug option enabled. The output should give you clues as to why the collector isn't working. @@ -288,4 +289,37 @@ should give you clues as to why the collector isn't working. ./go.d.plugin -d -m prometheus ``` +### Getting Logs + +If you're encountering problems with the `prometheus` collector, follow these steps to retrieve logs and identify potential issues: + +- **Run the command** specific to your system (systemd, non-systemd, or Docker container). +- **Examine the output** for any warnings or error messages that might indicate issues. These messages should provide clues about the root cause of the problem. + +#### System with systemd + +Use the following command to view logs generated since the last Netdata service restart: + +```bash +journalctl _SYSTEMD_INVOCATION_ID="$(systemctl show --value --property=InvocationID netdata)" --namespace=netdata --grep prometheus +``` + +#### System without systemd + +Locate the collector log file, typically at `/var/log/netdata/collector.log`, and use `grep` to filter for collector's name: + +```bash +grep prometheus /var/log/netdata/collector.log +``` + +**Note**: This method shows logs from all restarts. Focus on the **latest entries** for troubleshooting current issues. + +#### Docker Container + +If your Netdata runs in a Docker container named "netdata" (replace if different), use this command: + +```bash +docker logs netdata 2>&1 | grep prometheus +``` + diff --git a/src/go/collectors/go.d.plugin/modules/prometheus/integrations/salicru_eqx_inverter.md b/src/go/plugin/go.d/modules/prometheus/integrations/salicru_eqx_inverter.md index 4863484b1..b7c5b46c3 100644 --- a/src/go/collectors/go.d.plugin/modules/prometheus/integrations/salicru_eqx_inverter.md +++ b/src/go/plugin/go.d/modules/prometheus/integrations/salicru_eqx_inverter.md @@ -1,6 +1,6 @@ <!--startmeta -custom_edit_url: "https://github.com/netdata/netdata/edit/master/src/go/collectors/go.d.plugin/modules/prometheus/integrations/salicru_eqx_inverter.md" -meta_yaml: "https://github.com/netdata/netdata/edit/master/src/go/collectors/go.d.plugin/modules/prometheus/metadata.yaml" +custom_edit_url: "https://github.com/netdata/netdata/edit/master/src/go/plugin/go.d/modules/prometheus/integrations/salicru_eqx_inverter.md" +meta_yaml: "https://github.com/netdata/netdata/edit/master/src/go/plugin/go.d/modules/prometheus/metadata.yaml" sidebar_label: "Salicru EQX inverter" learn_status: "Published" learn_rel_path: "Collecting Metrics/IoT Devices" @@ -37,7 +37,6 @@ This collector supports collecting metrics from multiple instances of this integ #### Auto-Detection By default, it detects instances running on the local host by trying to connect to known ports that are [allocated to exporters](https://github.com/prometheus/prometheus/wiki/Default-port-allocations). -The full list of endpoints is available in the collector's [configuration file](https://github.com/netdata/netdata/blob/master/src/go/collectors/go.d.plugin/config/go.d/prometheus.conf). #### Limits @@ -138,7 +137,7 @@ The following options can be defined globally: update_every, autodetection_retry This option allows you to filter out unwanted time series. Only metrics matching the selector will be collected. - Logic: (pattern1 OR pattern2) AND !(pattern3 or pattern4) -- Pattern syntax: [selector](/src/go/collectors/go.d.plugin/pkg/prometheus/selector/README.md). +- Pattern syntax: [selector](/src/go/plugin/go.d/pkg/prometheus/selector/README.md). - Option syntax: ```yaml @@ -266,6 +265,8 @@ jobs: ### Debug Mode +**Important**: Debug mode is not supported for data collection jobs created via the UI using the Dyncfg feature. + To troubleshoot issues with the `prometheus` collector, run the `go.d.plugin` with the debug option enabled. The output should give you clues as to why the collector isn't working. @@ -288,4 +289,37 @@ should give you clues as to why the collector isn't working. ./go.d.plugin -d -m prometheus ``` +### Getting Logs + +If you're encountering problems with the `prometheus` collector, follow these steps to retrieve logs and identify potential issues: + +- **Run the command** specific to your system (systemd, non-systemd, or Docker container). +- **Examine the output** for any warnings or error messages that might indicate issues. These messages should provide clues about the root cause of the problem. + +#### System with systemd + +Use the following command to view logs generated since the last Netdata service restart: + +```bash +journalctl _SYSTEMD_INVOCATION_ID="$(systemctl show --value --property=InvocationID netdata)" --namespace=netdata --grep prometheus +``` + +#### System without systemd + +Locate the collector log file, typically at `/var/log/netdata/collector.log`, and use `grep` to filter for collector's name: + +```bash +grep prometheus /var/log/netdata/collector.log +``` + +**Note**: This method shows logs from all restarts. Focus on the **latest entries** for troubleshooting current issues. + +#### Docker Container + +If your Netdata runs in a Docker container named "netdata" (replace if different), use this command: + +```bash +docker logs netdata 2>&1 | grep prometheus +``` + diff --git a/src/go/collectors/go.d.plugin/modules/prometheus/integrations/sense_energy.md b/src/go/plugin/go.d/modules/prometheus/integrations/sense_energy.md index d65773ac0..837d30ceb 100644 --- a/src/go/collectors/go.d.plugin/modules/prometheus/integrations/sense_energy.md +++ b/src/go/plugin/go.d/modules/prometheus/integrations/sense_energy.md @@ -1,6 +1,6 @@ <!--startmeta -custom_edit_url: "https://github.com/netdata/netdata/edit/master/src/go/collectors/go.d.plugin/modules/prometheus/integrations/sense_energy.md" -meta_yaml: "https://github.com/netdata/netdata/edit/master/src/go/collectors/go.d.plugin/modules/prometheus/metadata.yaml" +custom_edit_url: "https://github.com/netdata/netdata/edit/master/src/go/plugin/go.d/modules/prometheus/integrations/sense_energy.md" +meta_yaml: "https://github.com/netdata/netdata/edit/master/src/go/plugin/go.d/modules/prometheus/metadata.yaml" sidebar_label: "Sense Energy" learn_status: "Published" learn_rel_path: "Collecting Metrics/IoT Devices" @@ -37,7 +37,6 @@ This collector supports collecting metrics from multiple instances of this integ #### Auto-Detection By default, it detects instances running on the local host by trying to connect to known ports that are [allocated to exporters](https://github.com/prometheus/prometheus/wiki/Default-port-allocations). -The full list of endpoints is available in the collector's [configuration file](https://github.com/netdata/netdata/blob/master/src/go/collectors/go.d.plugin/config/go.d/prometheus.conf). #### Limits @@ -138,7 +137,7 @@ The following options can be defined globally: update_every, autodetection_retry This option allows you to filter out unwanted time series. Only metrics matching the selector will be collected. - Logic: (pattern1 OR pattern2) AND !(pattern3 or pattern4) -- Pattern syntax: [selector](/src/go/collectors/go.d.plugin/pkg/prometheus/selector/README.md). +- Pattern syntax: [selector](/src/go/plugin/go.d/pkg/prometheus/selector/README.md). - Option syntax: ```yaml @@ -266,6 +265,8 @@ jobs: ### Debug Mode +**Important**: Debug mode is not supported for data collection jobs created via the UI using the Dyncfg feature. + To troubleshoot issues with the `prometheus` collector, run the `go.d.plugin` with the debug option enabled. The output should give you clues as to why the collector isn't working. @@ -288,4 +289,37 @@ should give you clues as to why the collector isn't working. ./go.d.plugin -d -m prometheus ``` +### Getting Logs + +If you're encountering problems with the `prometheus` collector, follow these steps to retrieve logs and identify potential issues: + +- **Run the command** specific to your system (systemd, non-systemd, or Docker container). +- **Examine the output** for any warnings or error messages that might indicate issues. These messages should provide clues about the root cause of the problem. + +#### System with systemd + +Use the following command to view logs generated since the last Netdata service restart: + +```bash +journalctl _SYSTEMD_INVOCATION_ID="$(systemctl show --value --property=InvocationID netdata)" --namespace=netdata --grep prometheus +``` + +#### System without systemd + +Locate the collector log file, typically at `/var/log/netdata/collector.log`, and use `grep` to filter for collector's name: + +```bash +grep prometheus /var/log/netdata/collector.log +``` + +**Note**: This method shows logs from all restarts. Focus on the **latest entries** for troubleshooting current issues. + +#### Docker Container + +If your Netdata runs in a Docker container named "netdata" (replace if different), use this command: + +```bash +docker logs netdata 2>&1 | grep prometheus +``` + diff --git a/src/go/collectors/go.d.plugin/modules/prometheus/integrations/sentry.md b/src/go/plugin/go.d/modules/prometheus/integrations/sentry.md index 0837ad0af..ae878cedf 100644 --- a/src/go/collectors/go.d.plugin/modules/prometheus/integrations/sentry.md +++ b/src/go/plugin/go.d/modules/prometheus/integrations/sentry.md @@ -1,6 +1,6 @@ <!--startmeta -custom_edit_url: "https://github.com/netdata/netdata/edit/master/src/go/collectors/go.d.plugin/modules/prometheus/integrations/sentry.md" -meta_yaml: "https://github.com/netdata/netdata/edit/master/src/go/collectors/go.d.plugin/modules/prometheus/metadata.yaml" +custom_edit_url: "https://github.com/netdata/netdata/edit/master/src/go/plugin/go.d/modules/prometheus/integrations/sentry.md" +meta_yaml: "https://github.com/netdata/netdata/edit/master/src/go/plugin/go.d/modules/prometheus/metadata.yaml" sidebar_label: "Sentry" learn_status: "Published" learn_rel_path: "Collecting Metrics/APM" @@ -37,7 +37,6 @@ This collector supports collecting metrics from multiple instances of this integ #### Auto-Detection By default, it detects instances running on the local host by trying to connect to known ports that are [allocated to exporters](https://github.com/prometheus/prometheus/wiki/Default-port-allocations). -The full list of endpoints is available in the collector's [configuration file](https://github.com/netdata/netdata/blob/master/src/go/collectors/go.d.plugin/config/go.d/prometheus.conf). #### Limits @@ -138,7 +137,7 @@ The following options can be defined globally: update_every, autodetection_retry This option allows you to filter out unwanted time series. Only metrics matching the selector will be collected. - Logic: (pattern1 OR pattern2) AND !(pattern3 or pattern4) -- Pattern syntax: [selector](/src/go/collectors/go.d.plugin/pkg/prometheus/selector/README.md). +- Pattern syntax: [selector](/src/go/plugin/go.d/pkg/prometheus/selector/README.md). - Option syntax: ```yaml @@ -266,6 +265,8 @@ jobs: ### Debug Mode +**Important**: Debug mode is not supported for data collection jobs created via the UI using the Dyncfg feature. + To troubleshoot issues with the `prometheus` collector, run the `go.d.plugin` with the debug option enabled. The output should give you clues as to why the collector isn't working. @@ -288,4 +289,37 @@ should give you clues as to why the collector isn't working. ./go.d.plugin -d -m prometheus ``` +### Getting Logs + +If you're encountering problems with the `prometheus` collector, follow these steps to retrieve logs and identify potential issues: + +- **Run the command** specific to your system (systemd, non-systemd, or Docker container). +- **Examine the output** for any warnings or error messages that might indicate issues. These messages should provide clues about the root cause of the problem. + +#### System with systemd + +Use the following command to view logs generated since the last Netdata service restart: + +```bash +journalctl _SYSTEMD_INVOCATION_ID="$(systemctl show --value --property=InvocationID netdata)" --namespace=netdata --grep prometheus +``` + +#### System without systemd + +Locate the collector log file, typically at `/var/log/netdata/collector.log`, and use `grep` to filter for collector's name: + +```bash +grep prometheus /var/log/netdata/collector.log +``` + +**Note**: This method shows logs from all restarts. Focus on the **latest entries** for troubleshooting current issues. + +#### Docker Container + +If your Netdata runs in a Docker container named "netdata" (replace if different), use this command: + +```bash +docker logs netdata 2>&1 | grep prometheus +``` + diff --git a/src/go/collectors/go.d.plugin/modules/prometheus/integrations/servertech.md b/src/go/plugin/go.d/modules/prometheus/integrations/servertech.md index f1846b348..d287fb65b 100644 --- a/src/go/collectors/go.d.plugin/modules/prometheus/integrations/servertech.md +++ b/src/go/plugin/go.d/modules/prometheus/integrations/servertech.md @@ -1,6 +1,6 @@ <!--startmeta -custom_edit_url: "https://github.com/netdata/netdata/edit/master/src/go/collectors/go.d.plugin/modules/prometheus/integrations/servertech.md" -meta_yaml: "https://github.com/netdata/netdata/edit/master/src/go/collectors/go.d.plugin/modules/prometheus/metadata.yaml" +custom_edit_url: "https://github.com/netdata/netdata/edit/master/src/go/plugin/go.d/modules/prometheus/integrations/servertech.md" +meta_yaml: "https://github.com/netdata/netdata/edit/master/src/go/plugin/go.d/modules/prometheus/metadata.yaml" sidebar_label: "ServerTech" learn_status: "Published" learn_rel_path: "Collecting Metrics/Hardware Devices and Sensors" @@ -37,7 +37,6 @@ This collector supports collecting metrics from multiple instances of this integ #### Auto-Detection By default, it detects instances running on the local host by trying to connect to known ports that are [allocated to exporters](https://github.com/prometheus/prometheus/wiki/Default-port-allocations). -The full list of endpoints is available in the collector's [configuration file](https://github.com/netdata/netdata/blob/master/src/go/collectors/go.d.plugin/config/go.d/prometheus.conf). #### Limits @@ -138,7 +137,7 @@ The following options can be defined globally: update_every, autodetection_retry This option allows you to filter out unwanted time series. Only metrics matching the selector will be collected. - Logic: (pattern1 OR pattern2) AND !(pattern3 or pattern4) -- Pattern syntax: [selector](/src/go/collectors/go.d.plugin/pkg/prometheus/selector/README.md). +- Pattern syntax: [selector](/src/go/plugin/go.d/pkg/prometheus/selector/README.md). - Option syntax: ```yaml @@ -266,6 +265,8 @@ jobs: ### Debug Mode +**Important**: Debug mode is not supported for data collection jobs created via the UI using the Dyncfg feature. + To troubleshoot issues with the `prometheus` collector, run the `go.d.plugin` with the debug option enabled. The output should give you clues as to why the collector isn't working. @@ -288,4 +289,37 @@ should give you clues as to why the collector isn't working. ./go.d.plugin -d -m prometheus ``` +### Getting Logs + +If you're encountering problems with the `prometheus` collector, follow these steps to retrieve logs and identify potential issues: + +- **Run the command** specific to your system (systemd, non-systemd, or Docker container). +- **Examine the output** for any warnings or error messages that might indicate issues. These messages should provide clues about the root cause of the problem. + +#### System with systemd + +Use the following command to view logs generated since the last Netdata service restart: + +```bash +journalctl _SYSTEMD_INVOCATION_ID="$(systemctl show --value --property=InvocationID netdata)" --namespace=netdata --grep prometheus +``` + +#### System without systemd + +Locate the collector log file, typically at `/var/log/netdata/collector.log`, and use `grep` to filter for collector's name: + +```bash +grep prometheus /var/log/netdata/collector.log +``` + +**Note**: This method shows logs from all restarts. Focus on the **latest entries** for troubleshooting current issues. + +#### Docker Container + +If your Netdata runs in a Docker container named "netdata" (replace if different), use this command: + +```bash +docker logs netdata 2>&1 | grep prometheus +``` + diff --git a/src/go/collectors/go.d.plugin/modules/prometheus/integrations/shell_command.md b/src/go/plugin/go.d/modules/prometheus/integrations/shell_command.md index 91f4449b2..dec29a66c 100644 --- a/src/go/collectors/go.d.plugin/modules/prometheus/integrations/shell_command.md +++ b/src/go/plugin/go.d/modules/prometheus/integrations/shell_command.md @@ -1,6 +1,6 @@ <!--startmeta -custom_edit_url: "https://github.com/netdata/netdata/edit/master/src/go/collectors/go.d.plugin/modules/prometheus/integrations/shell_command.md" -meta_yaml: "https://github.com/netdata/netdata/edit/master/src/go/collectors/go.d.plugin/modules/prometheus/metadata.yaml" +custom_edit_url: "https://github.com/netdata/netdata/edit/master/src/go/plugin/go.d/modules/prometheus/integrations/shell_command.md" +meta_yaml: "https://github.com/netdata/netdata/edit/master/src/go/plugin/go.d/modules/prometheus/metadata.yaml" sidebar_label: "Shell command" learn_status: "Published" learn_rel_path: "Collecting Metrics/Generic Collecting Metrics" @@ -37,7 +37,6 @@ This collector supports collecting metrics from multiple instances of this integ #### Auto-Detection By default, it detects instances running on the local host by trying to connect to known ports that are [allocated to exporters](https://github.com/prometheus/prometheus/wiki/Default-port-allocations). -The full list of endpoints is available in the collector's [configuration file](https://github.com/netdata/netdata/blob/master/src/go/collectors/go.d.plugin/config/go.d/prometheus.conf). #### Limits @@ -138,7 +137,7 @@ The following options can be defined globally: update_every, autodetection_retry This option allows you to filter out unwanted time series. Only metrics matching the selector will be collected. - Logic: (pattern1 OR pattern2) AND !(pattern3 or pattern4) -- Pattern syntax: [selector](/src/go/collectors/go.d.plugin/pkg/prometheus/selector/README.md). +- Pattern syntax: [selector](/src/go/plugin/go.d/pkg/prometheus/selector/README.md). - Option syntax: ```yaml @@ -266,6 +265,8 @@ jobs: ### Debug Mode +**Important**: Debug mode is not supported for data collection jobs created via the UI using the Dyncfg feature. + To troubleshoot issues with the `prometheus` collector, run the `go.d.plugin` with the debug option enabled. The output should give you clues as to why the collector isn't working. @@ -288,4 +289,37 @@ should give you clues as to why the collector isn't working. ./go.d.plugin -d -m prometheus ``` +### Getting Logs + +If you're encountering problems with the `prometheus` collector, follow these steps to retrieve logs and identify potential issues: + +- **Run the command** specific to your system (systemd, non-systemd, or Docker container). +- **Examine the output** for any warnings or error messages that might indicate issues. These messages should provide clues about the root cause of the problem. + +#### System with systemd + +Use the following command to view logs generated since the last Netdata service restart: + +```bash +journalctl _SYSTEMD_INVOCATION_ID="$(systemctl show --value --property=InvocationID netdata)" --namespace=netdata --grep prometheus +``` + +#### System without systemd + +Locate the collector log file, typically at `/var/log/netdata/collector.log`, and use `grep` to filter for collector's name: + +```bash +grep prometheus /var/log/netdata/collector.log +``` + +**Note**: This method shows logs from all restarts. Focus on the **latest entries** for troubleshooting current issues. + +#### Docker Container + +If your Netdata runs in a Docker container named "netdata" (replace if different), use this command: + +```bash +docker logs netdata 2>&1 | grep prometheus +``` + diff --git a/src/go/collectors/go.d.plugin/modules/prometheus/integrations/shelly_humidity_sensor.md b/src/go/plugin/go.d/modules/prometheus/integrations/shelly_humidity_sensor.md index 256b9a94b..baf6fa58f 100644 --- a/src/go/collectors/go.d.plugin/modules/prometheus/integrations/shelly_humidity_sensor.md +++ b/src/go/plugin/go.d/modules/prometheus/integrations/shelly_humidity_sensor.md @@ -1,6 +1,6 @@ <!--startmeta -custom_edit_url: "https://github.com/netdata/netdata/edit/master/src/go/collectors/go.d.plugin/modules/prometheus/integrations/shelly_humidity_sensor.md" -meta_yaml: "https://github.com/netdata/netdata/edit/master/src/go/collectors/go.d.plugin/modules/prometheus/metadata.yaml" +custom_edit_url: "https://github.com/netdata/netdata/edit/master/src/go/plugin/go.d/modules/prometheus/integrations/shelly_humidity_sensor.md" +meta_yaml: "https://github.com/netdata/netdata/edit/master/src/go/plugin/go.d/modules/prometheus/metadata.yaml" sidebar_label: "Shelly humidity sensor" learn_status: "Published" learn_rel_path: "Collecting Metrics/IoT Devices" @@ -37,7 +37,6 @@ This collector supports collecting metrics from multiple instances of this integ #### Auto-Detection By default, it detects instances running on the local host by trying to connect to known ports that are [allocated to exporters](https://github.com/prometheus/prometheus/wiki/Default-port-allocations). -The full list of endpoints is available in the collector's [configuration file](https://github.com/netdata/netdata/blob/master/src/go/collectors/go.d.plugin/config/go.d/prometheus.conf). #### Limits @@ -138,7 +137,7 @@ The following options can be defined globally: update_every, autodetection_retry This option allows you to filter out unwanted time series. Only metrics matching the selector will be collected. - Logic: (pattern1 OR pattern2) AND !(pattern3 or pattern4) -- Pattern syntax: [selector](/src/go/collectors/go.d.plugin/pkg/prometheus/selector/README.md). +- Pattern syntax: [selector](/src/go/plugin/go.d/pkg/prometheus/selector/README.md). - Option syntax: ```yaml @@ -266,6 +265,8 @@ jobs: ### Debug Mode +**Important**: Debug mode is not supported for data collection jobs created via the UI using the Dyncfg feature. + To troubleshoot issues with the `prometheus` collector, run the `go.d.plugin` with the debug option enabled. The output should give you clues as to why the collector isn't working. @@ -288,4 +289,37 @@ should give you clues as to why the collector isn't working. ./go.d.plugin -d -m prometheus ``` +### Getting Logs + +If you're encountering problems with the `prometheus` collector, follow these steps to retrieve logs and identify potential issues: + +- **Run the command** specific to your system (systemd, non-systemd, or Docker container). +- **Examine the output** for any warnings or error messages that might indicate issues. These messages should provide clues about the root cause of the problem. + +#### System with systemd + +Use the following command to view logs generated since the last Netdata service restart: + +```bash +journalctl _SYSTEMD_INVOCATION_ID="$(systemctl show --value --property=InvocationID netdata)" --namespace=netdata --grep prometheus +``` + +#### System without systemd + +Locate the collector log file, typically at `/var/log/netdata/collector.log`, and use `grep` to filter for collector's name: + +```bash +grep prometheus /var/log/netdata/collector.log +``` + +**Note**: This method shows logs from all restarts. Focus on the **latest entries** for troubleshooting current issues. + +#### Docker Container + +If your Netdata runs in a Docker container named "netdata" (replace if different), use this command: + +```bash +docker logs netdata 2>&1 | grep prometheus +``` + diff --git a/src/go/collectors/go.d.plugin/modules/prometheus/integrations/sia.md b/src/go/plugin/go.d/modules/prometheus/integrations/sia.md index 41f80e7c3..6fe4a3684 100644 --- a/src/go/collectors/go.d.plugin/modules/prometheus/integrations/sia.md +++ b/src/go/plugin/go.d/modules/prometheus/integrations/sia.md @@ -1,6 +1,6 @@ <!--startmeta -custom_edit_url: "https://github.com/netdata/netdata/edit/master/src/go/collectors/go.d.plugin/modules/prometheus/integrations/sia.md" -meta_yaml: "https://github.com/netdata/netdata/edit/master/src/go/collectors/go.d.plugin/modules/prometheus/metadata.yaml" +custom_edit_url: "https://github.com/netdata/netdata/edit/master/src/go/plugin/go.d/modules/prometheus/integrations/sia.md" +meta_yaml: "https://github.com/netdata/netdata/edit/master/src/go/plugin/go.d/modules/prometheus/metadata.yaml" sidebar_label: "Sia" learn_status: "Published" learn_rel_path: "Collecting Metrics/Blockchain Servers" @@ -37,7 +37,6 @@ This collector supports collecting metrics from multiple instances of this integ #### Auto-Detection By default, it detects instances running on the local host by trying to connect to known ports that are [allocated to exporters](https://github.com/prometheus/prometheus/wiki/Default-port-allocations). -The full list of endpoints is available in the collector's [configuration file](https://github.com/netdata/netdata/blob/master/src/go/collectors/go.d.plugin/config/go.d/prometheus.conf). #### Limits @@ -138,7 +137,7 @@ The following options can be defined globally: update_every, autodetection_retry This option allows you to filter out unwanted time series. Only metrics matching the selector will be collected. - Logic: (pattern1 OR pattern2) AND !(pattern3 or pattern4) -- Pattern syntax: [selector](/src/go/collectors/go.d.plugin/pkg/prometheus/selector/README.md). +- Pattern syntax: [selector](/src/go/plugin/go.d/pkg/prometheus/selector/README.md). - Option syntax: ```yaml @@ -266,6 +265,8 @@ jobs: ### Debug Mode +**Important**: Debug mode is not supported for data collection jobs created via the UI using the Dyncfg feature. + To troubleshoot issues with the `prometheus` collector, run the `go.d.plugin` with the debug option enabled. The output should give you clues as to why the collector isn't working. @@ -288,4 +289,37 @@ should give you clues as to why the collector isn't working. ./go.d.plugin -d -m prometheus ``` +### Getting Logs + +If you're encountering problems with the `prometheus` collector, follow these steps to retrieve logs and identify potential issues: + +- **Run the command** specific to your system (systemd, non-systemd, or Docker container). +- **Examine the output** for any warnings or error messages that might indicate issues. These messages should provide clues about the root cause of the problem. + +#### System with systemd + +Use the following command to view logs generated since the last Netdata service restart: + +```bash +journalctl _SYSTEMD_INVOCATION_ID="$(systemctl show --value --property=InvocationID netdata)" --namespace=netdata --grep prometheus +``` + +#### System without systemd + +Locate the collector log file, typically at `/var/log/netdata/collector.log`, and use `grep` to filter for collector's name: + +```bash +grep prometheus /var/log/netdata/collector.log +``` + +**Note**: This method shows logs from all restarts. Focus on the **latest entries** for troubleshooting current issues. + +#### Docker Container + +If your Netdata runs in a Docker container named "netdata" (replace if different), use this command: + +```bash +docker logs netdata 2>&1 | grep prometheus +``` + diff --git a/src/go/collectors/go.d.plugin/modules/prometheus/integrations/siemens_s7_plc.md b/src/go/plugin/go.d/modules/prometheus/integrations/siemens_s7_plc.md index 33483d799..c6aec71e2 100644 --- a/src/go/collectors/go.d.plugin/modules/prometheus/integrations/siemens_s7_plc.md +++ b/src/go/plugin/go.d/modules/prometheus/integrations/siemens_s7_plc.md @@ -1,6 +1,6 @@ <!--startmeta -custom_edit_url: "https://github.com/netdata/netdata/edit/master/src/go/collectors/go.d.plugin/modules/prometheus/integrations/siemens_s7_plc.md" -meta_yaml: "https://github.com/netdata/netdata/edit/master/src/go/collectors/go.d.plugin/modules/prometheus/metadata.yaml" +custom_edit_url: "https://github.com/netdata/netdata/edit/master/src/go/plugin/go.d/modules/prometheus/integrations/siemens_s7_plc.md" +meta_yaml: "https://github.com/netdata/netdata/edit/master/src/go/plugin/go.d/modules/prometheus/metadata.yaml" sidebar_label: "Siemens S7 PLC" learn_status: "Published" learn_rel_path: "Collecting Metrics/Hardware Devices and Sensors" @@ -37,7 +37,6 @@ This collector supports collecting metrics from multiple instances of this integ #### Auto-Detection By default, it detects instances running on the local host by trying to connect to known ports that are [allocated to exporters](https://github.com/prometheus/prometheus/wiki/Default-port-allocations). -The full list of endpoints is available in the collector's [configuration file](https://github.com/netdata/netdata/blob/master/src/go/collectors/go.d.plugin/config/go.d/prometheus.conf). #### Limits @@ -138,7 +137,7 @@ The following options can be defined globally: update_every, autodetection_retry This option allows you to filter out unwanted time series. Only metrics matching the selector will be collected. - Logic: (pattern1 OR pattern2) AND !(pattern3 or pattern4) -- Pattern syntax: [selector](/src/go/collectors/go.d.plugin/pkg/prometheus/selector/README.md). +- Pattern syntax: [selector](/src/go/plugin/go.d/pkg/prometheus/selector/README.md). - Option syntax: ```yaml @@ -266,6 +265,8 @@ jobs: ### Debug Mode +**Important**: Debug mode is not supported for data collection jobs created via the UI using the Dyncfg feature. + To troubleshoot issues with the `prometheus` collector, run the `go.d.plugin` with the debug option enabled. The output should give you clues as to why the collector isn't working. @@ -288,4 +289,37 @@ should give you clues as to why the collector isn't working. ./go.d.plugin -d -m prometheus ``` +### Getting Logs + +If you're encountering problems with the `prometheus` collector, follow these steps to retrieve logs and identify potential issues: + +- **Run the command** specific to your system (systemd, non-systemd, or Docker container). +- **Examine the output** for any warnings or error messages that might indicate issues. These messages should provide clues about the root cause of the problem. + +#### System with systemd + +Use the following command to view logs generated since the last Netdata service restart: + +```bash +journalctl _SYSTEMD_INVOCATION_ID="$(systemctl show --value --property=InvocationID netdata)" --namespace=netdata --grep prometheus +``` + +#### System without systemd + +Locate the collector log file, typically at `/var/log/netdata/collector.log`, and use `grep` to filter for collector's name: + +```bash +grep prometheus /var/log/netdata/collector.log +``` + +**Note**: This method shows logs from all restarts. Focus on the **latest entries** for troubleshooting current issues. + +#### Docker Container + +If your Netdata runs in a Docker container named "netdata" (replace if different), use this command: + +```bash +docker logs netdata 2>&1 | grep prometheus +``` + diff --git a/src/go/collectors/go.d.plugin/modules/prometheus/integrations/site_24x7.md b/src/go/plugin/go.d/modules/prometheus/integrations/site_24x7.md index 50a47c896..8faefa53e 100644 --- a/src/go/collectors/go.d.plugin/modules/prometheus/integrations/site_24x7.md +++ b/src/go/plugin/go.d/modules/prometheus/integrations/site_24x7.md @@ -1,6 +1,6 @@ <!--startmeta -custom_edit_url: "https://github.com/netdata/netdata/edit/master/src/go/collectors/go.d.plugin/modules/prometheus/integrations/site_24x7.md" -meta_yaml: "https://github.com/netdata/netdata/edit/master/src/go/collectors/go.d.plugin/modules/prometheus/metadata.yaml" +custom_edit_url: "https://github.com/netdata/netdata/edit/master/src/go/plugin/go.d/modules/prometheus/integrations/site_24x7.md" +meta_yaml: "https://github.com/netdata/netdata/edit/master/src/go/plugin/go.d/modules/prometheus/metadata.yaml" sidebar_label: "Site 24x7" learn_status: "Published" learn_rel_path: "Collecting Metrics/Synthetic Checks" @@ -37,7 +37,6 @@ This collector supports collecting metrics from multiple instances of this integ #### Auto-Detection By default, it detects instances running on the local host by trying to connect to known ports that are [allocated to exporters](https://github.com/prometheus/prometheus/wiki/Default-port-allocations). -The full list of endpoints is available in the collector's [configuration file](https://github.com/netdata/netdata/blob/master/src/go/collectors/go.d.plugin/config/go.d/prometheus.conf). #### Limits @@ -138,7 +137,7 @@ The following options can be defined globally: update_every, autodetection_retry This option allows you to filter out unwanted time series. Only metrics matching the selector will be collected. - Logic: (pattern1 OR pattern2) AND !(pattern3 or pattern4) -- Pattern syntax: [selector](/src/go/collectors/go.d.plugin/pkg/prometheus/selector/README.md). +- Pattern syntax: [selector](/src/go/plugin/go.d/pkg/prometheus/selector/README.md). - Option syntax: ```yaml @@ -266,6 +265,8 @@ jobs: ### Debug Mode +**Important**: Debug mode is not supported for data collection jobs created via the UI using the Dyncfg feature. + To troubleshoot issues with the `prometheus` collector, run the `go.d.plugin` with the debug option enabled. The output should give you clues as to why the collector isn't working. @@ -288,4 +289,37 @@ should give you clues as to why the collector isn't working. ./go.d.plugin -d -m prometheus ``` +### Getting Logs + +If you're encountering problems with the `prometheus` collector, follow these steps to retrieve logs and identify potential issues: + +- **Run the command** specific to your system (systemd, non-systemd, or Docker container). +- **Examine the output** for any warnings or error messages that might indicate issues. These messages should provide clues about the root cause of the problem. + +#### System with systemd + +Use the following command to view logs generated since the last Netdata service restart: + +```bash +journalctl _SYSTEMD_INVOCATION_ID="$(systemctl show --value --property=InvocationID netdata)" --namespace=netdata --grep prometheus +``` + +#### System without systemd + +Locate the collector log file, typically at `/var/log/netdata/collector.log`, and use `grep` to filter for collector's name: + +```bash +grep prometheus /var/log/netdata/collector.log +``` + +**Note**: This method shows logs from all restarts. Focus on the **latest entries** for troubleshooting current issues. + +#### Docker Container + +If your Netdata runs in a Docker container named "netdata" (replace if different), use this command: + +```bash +docker logs netdata 2>&1 | grep prometheus +``` + diff --git a/src/go/collectors/go.d.plugin/modules/prometheus/integrations/slurm.md b/src/go/plugin/go.d/modules/prometheus/integrations/slurm.md index 003b975c0..00d27ca19 100644 --- a/src/go/collectors/go.d.plugin/modules/prometheus/integrations/slurm.md +++ b/src/go/plugin/go.d/modules/prometheus/integrations/slurm.md @@ -1,6 +1,6 @@ <!--startmeta -custom_edit_url: "https://github.com/netdata/netdata/edit/master/src/go/collectors/go.d.plugin/modules/prometheus/integrations/slurm.md" -meta_yaml: "https://github.com/netdata/netdata/edit/master/src/go/collectors/go.d.plugin/modules/prometheus/metadata.yaml" +custom_edit_url: "https://github.com/netdata/netdata/edit/master/src/go/plugin/go.d/modules/prometheus/integrations/slurm.md" +meta_yaml: "https://github.com/netdata/netdata/edit/master/src/go/plugin/go.d/modules/prometheus/metadata.yaml" sidebar_label: "Slurm" learn_status: "Published" learn_rel_path: "Collecting Metrics/Task Queues" @@ -37,7 +37,6 @@ This collector supports collecting metrics from multiple instances of this integ #### Auto-Detection By default, it detects instances running on the local host by trying to connect to known ports that are [allocated to exporters](https://github.com/prometheus/prometheus/wiki/Default-port-allocations). -The full list of endpoints is available in the collector's [configuration file](https://github.com/netdata/netdata/blob/master/src/go/collectors/go.d.plugin/config/go.d/prometheus.conf). #### Limits @@ -138,7 +137,7 @@ The following options can be defined globally: update_every, autodetection_retry This option allows you to filter out unwanted time series. Only metrics matching the selector will be collected. - Logic: (pattern1 OR pattern2) AND !(pattern3 or pattern4) -- Pattern syntax: [selector](/src/go/collectors/go.d.plugin/pkg/prometheus/selector/README.md). +- Pattern syntax: [selector](/src/go/plugin/go.d/pkg/prometheus/selector/README.md). - Option syntax: ```yaml @@ -266,6 +265,8 @@ jobs: ### Debug Mode +**Important**: Debug mode is not supported for data collection jobs created via the UI using the Dyncfg feature. + To troubleshoot issues with the `prometheus` collector, run the `go.d.plugin` with the debug option enabled. The output should give you clues as to why the collector isn't working. @@ -288,4 +289,37 @@ should give you clues as to why the collector isn't working. ./go.d.plugin -d -m prometheus ``` +### Getting Logs + +If you're encountering problems with the `prometheus` collector, follow these steps to retrieve logs and identify potential issues: + +- **Run the command** specific to your system (systemd, non-systemd, or Docker container). +- **Examine the output** for any warnings or error messages that might indicate issues. These messages should provide clues about the root cause of the problem. + +#### System with systemd + +Use the following command to view logs generated since the last Netdata service restart: + +```bash +journalctl _SYSTEMD_INVOCATION_ID="$(systemctl show --value --property=InvocationID netdata)" --namespace=netdata --grep prometheus +``` + +#### System without systemd + +Locate the collector log file, typically at `/var/log/netdata/collector.log`, and use `grep` to filter for collector's name: + +```bash +grep prometheus /var/log/netdata/collector.log +``` + +**Note**: This method shows logs from all restarts. Focus on the **latest entries** for troubleshooting current issues. + +#### Docker Container + +If your Netdata runs in a Docker container named "netdata" (replace if different), use this command: + +```bash +docker logs netdata 2>&1 | grep prometheus +``` + diff --git a/src/go/collectors/go.d.plugin/modules/prometheus/integrations/sma_inverters.md b/src/go/plugin/go.d/modules/prometheus/integrations/sma_inverters.md index 08072b85b..f739362eb 100644 --- a/src/go/collectors/go.d.plugin/modules/prometheus/integrations/sma_inverters.md +++ b/src/go/plugin/go.d/modules/prometheus/integrations/sma_inverters.md @@ -1,6 +1,6 @@ <!--startmeta -custom_edit_url: "https://github.com/netdata/netdata/edit/master/src/go/collectors/go.d.plugin/modules/prometheus/integrations/sma_inverters.md" -meta_yaml: "https://github.com/netdata/netdata/edit/master/src/go/collectors/go.d.plugin/modules/prometheus/metadata.yaml" +custom_edit_url: "https://github.com/netdata/netdata/edit/master/src/go/plugin/go.d/modules/prometheus/integrations/sma_inverters.md" +meta_yaml: "https://github.com/netdata/netdata/edit/master/src/go/plugin/go.d/modules/prometheus/metadata.yaml" sidebar_label: "SMA Inverters" learn_status: "Published" learn_rel_path: "Collecting Metrics/IoT Devices" @@ -37,7 +37,6 @@ This collector supports collecting metrics from multiple instances of this integ #### Auto-Detection By default, it detects instances running on the local host by trying to connect to known ports that are [allocated to exporters](https://github.com/prometheus/prometheus/wiki/Default-port-allocations). -The full list of endpoints is available in the collector's [configuration file](https://github.com/netdata/netdata/blob/master/src/go/collectors/go.d.plugin/config/go.d/prometheus.conf). #### Limits @@ -138,7 +137,7 @@ The following options can be defined globally: update_every, autodetection_retry This option allows you to filter out unwanted time series. Only metrics matching the selector will be collected. - Logic: (pattern1 OR pattern2) AND !(pattern3 or pattern4) -- Pattern syntax: [selector](/src/go/collectors/go.d.plugin/pkg/prometheus/selector/README.md). +- Pattern syntax: [selector](/src/go/plugin/go.d/pkg/prometheus/selector/README.md). - Option syntax: ```yaml @@ -266,6 +265,8 @@ jobs: ### Debug Mode +**Important**: Debug mode is not supported for data collection jobs created via the UI using the Dyncfg feature. + To troubleshoot issues with the `prometheus` collector, run the `go.d.plugin` with the debug option enabled. The output should give you clues as to why the collector isn't working. @@ -288,4 +289,37 @@ should give you clues as to why the collector isn't working. ./go.d.plugin -d -m prometheus ``` +### Getting Logs + +If you're encountering problems with the `prometheus` collector, follow these steps to retrieve logs and identify potential issues: + +- **Run the command** specific to your system (systemd, non-systemd, or Docker container). +- **Examine the output** for any warnings or error messages that might indicate issues. These messages should provide clues about the root cause of the problem. + +#### System with systemd + +Use the following command to view logs generated since the last Netdata service restart: + +```bash +journalctl _SYSTEMD_INVOCATION_ID="$(systemctl show --value --property=InvocationID netdata)" --namespace=netdata --grep prometheus +``` + +#### System without systemd + +Locate the collector log file, typically at `/var/log/netdata/collector.log`, and use `grep` to filter for collector's name: + +```bash +grep prometheus /var/log/netdata/collector.log +``` + +**Note**: This method shows logs from all restarts. Focus on the **latest entries** for troubleshooting current issues. + +#### Docker Container + +If your Netdata runs in a Docker container named "netdata" (replace if different), use this command: + +```bash +docker logs netdata 2>&1 | grep prometheus +``` + diff --git a/src/go/collectors/go.d.plugin/modules/prometheus/integrations/smart_meters_sml.md b/src/go/plugin/go.d/modules/prometheus/integrations/smart_meters_sml.md index 30578d06c..1201475a5 100644 --- a/src/go/collectors/go.d.plugin/modules/prometheus/integrations/smart_meters_sml.md +++ b/src/go/plugin/go.d/modules/prometheus/integrations/smart_meters_sml.md @@ -1,6 +1,6 @@ <!--startmeta -custom_edit_url: "https://github.com/netdata/netdata/edit/master/src/go/collectors/go.d.plugin/modules/prometheus/integrations/smart_meters_sml.md" -meta_yaml: "https://github.com/netdata/netdata/edit/master/src/go/collectors/go.d.plugin/modules/prometheus/metadata.yaml" +custom_edit_url: "https://github.com/netdata/netdata/edit/master/src/go/plugin/go.d/modules/prometheus/integrations/smart_meters_sml.md" +meta_yaml: "https://github.com/netdata/netdata/edit/master/src/go/plugin/go.d/modules/prometheus/metadata.yaml" sidebar_label: "Smart meters SML" learn_status: "Published" learn_rel_path: "Collecting Metrics/IoT Devices" @@ -37,7 +37,6 @@ This collector supports collecting metrics from multiple instances of this integ #### Auto-Detection By default, it detects instances running on the local host by trying to connect to known ports that are [allocated to exporters](https://github.com/prometheus/prometheus/wiki/Default-port-allocations). -The full list of endpoints is available in the collector's [configuration file](https://github.com/netdata/netdata/blob/master/src/go/collectors/go.d.plugin/config/go.d/prometheus.conf). #### Limits @@ -138,7 +137,7 @@ The following options can be defined globally: update_every, autodetection_retry This option allows you to filter out unwanted time series. Only metrics matching the selector will be collected. - Logic: (pattern1 OR pattern2) AND !(pattern3 or pattern4) -- Pattern syntax: [selector](/src/go/collectors/go.d.plugin/pkg/prometheus/selector/README.md). +- Pattern syntax: [selector](/src/go/plugin/go.d/pkg/prometheus/selector/README.md). - Option syntax: ```yaml @@ -266,6 +265,8 @@ jobs: ### Debug Mode +**Important**: Debug mode is not supported for data collection jobs created via the UI using the Dyncfg feature. + To troubleshoot issues with the `prometheus` collector, run the `go.d.plugin` with the debug option enabled. The output should give you clues as to why the collector isn't working. @@ -288,4 +289,37 @@ should give you clues as to why the collector isn't working. ./go.d.plugin -d -m prometheus ``` +### Getting Logs + +If you're encountering problems with the `prometheus` collector, follow these steps to retrieve logs and identify potential issues: + +- **Run the command** specific to your system (systemd, non-systemd, or Docker container). +- **Examine the output** for any warnings or error messages that might indicate issues. These messages should provide clues about the root cause of the problem. + +#### System with systemd + +Use the following command to view logs generated since the last Netdata service restart: + +```bash +journalctl _SYSTEMD_INVOCATION_ID="$(systemctl show --value --property=InvocationID netdata)" --namespace=netdata --grep prometheus +``` + +#### System without systemd + +Locate the collector log file, typically at `/var/log/netdata/collector.log`, and use `grep` to filter for collector's name: + +```bash +grep prometheus /var/log/netdata/collector.log +``` + +**Note**: This method shows logs from all restarts. Focus on the **latest entries** for troubleshooting current issues. + +#### Docker Container + +If your Netdata runs in a Docker container named "netdata" (replace if different), use this command: + +```bash +docker logs netdata 2>&1 | grep prometheus +``` + diff --git a/src/go/collectors/go.d.plugin/modules/prometheus/integrations/smartrg_808ac_cable_modem.md b/src/go/plugin/go.d/modules/prometheus/integrations/smartrg_808ac_cable_modem.md index 06cb9975d..1dadc3d85 100644 --- a/src/go/collectors/go.d.plugin/modules/prometheus/integrations/smartrg_808ac_cable_modem.md +++ b/src/go/plugin/go.d/modules/prometheus/integrations/smartrg_808ac_cable_modem.md @@ -1,6 +1,6 @@ <!--startmeta -custom_edit_url: "https://github.com/netdata/netdata/edit/master/src/go/collectors/go.d.plugin/modules/prometheus/integrations/smartrg_808ac_cable_modem.md" -meta_yaml: "https://github.com/netdata/netdata/edit/master/src/go/collectors/go.d.plugin/modules/prometheus/metadata.yaml" +custom_edit_url: "https://github.com/netdata/netdata/edit/master/src/go/plugin/go.d/modules/prometheus/integrations/smartrg_808ac_cable_modem.md" +meta_yaml: "https://github.com/netdata/netdata/edit/master/src/go/plugin/go.d/modules/prometheus/metadata.yaml" sidebar_label: "SmartRG 808AC Cable Modem" learn_status: "Published" learn_rel_path: "Collecting Metrics/Networking Stack and Network Interfaces" @@ -37,7 +37,6 @@ This collector supports collecting metrics from multiple instances of this integ #### Auto-Detection By default, it detects instances running on the local host by trying to connect to known ports that are [allocated to exporters](https://github.com/prometheus/prometheus/wiki/Default-port-allocations). -The full list of endpoints is available in the collector's [configuration file](https://github.com/netdata/netdata/blob/master/src/go/collectors/go.d.plugin/config/go.d/prometheus.conf). #### Limits @@ -138,7 +137,7 @@ The following options can be defined globally: update_every, autodetection_retry This option allows you to filter out unwanted time series. Only metrics matching the selector will be collected. - Logic: (pattern1 OR pattern2) AND !(pattern3 or pattern4) -- Pattern syntax: [selector](/src/go/collectors/go.d.plugin/pkg/prometheus/selector/README.md). +- Pattern syntax: [selector](/src/go/plugin/go.d/pkg/prometheus/selector/README.md). - Option syntax: ```yaml @@ -266,6 +265,8 @@ jobs: ### Debug Mode +**Important**: Debug mode is not supported for data collection jobs created via the UI using the Dyncfg feature. + To troubleshoot issues with the `prometheus` collector, run the `go.d.plugin` with the debug option enabled. The output should give you clues as to why the collector isn't working. @@ -288,4 +289,37 @@ should give you clues as to why the collector isn't working. ./go.d.plugin -d -m prometheus ``` +### Getting Logs + +If you're encountering problems with the `prometheus` collector, follow these steps to retrieve logs and identify potential issues: + +- **Run the command** specific to your system (systemd, non-systemd, or Docker container). +- **Examine the output** for any warnings or error messages that might indicate issues. These messages should provide clues about the root cause of the problem. + +#### System with systemd + +Use the following command to view logs generated since the last Netdata service restart: + +```bash +journalctl _SYSTEMD_INVOCATION_ID="$(systemctl show --value --property=InvocationID netdata)" --namespace=netdata --grep prometheus +``` + +#### System without systemd + +Locate the collector log file, typically at `/var/log/netdata/collector.log`, and use `grep` to filter for collector's name: + +```bash +grep prometheus /var/log/netdata/collector.log +``` + +**Note**: This method shows logs from all restarts. Focus on the **latest entries** for troubleshooting current issues. + +#### Docker Container + +If your Netdata runs in a Docker container named "netdata" (replace if different), use this command: + +```bash +docker logs netdata 2>&1 | grep prometheus +``` + diff --git a/src/go/collectors/go.d.plugin/modules/prometheus/integrations/softether_vpn_server.md b/src/go/plugin/go.d/modules/prometheus/integrations/softether_vpn_server.md index 5188707fc..30fd7cb64 100644 --- a/src/go/collectors/go.d.plugin/modules/prometheus/integrations/softether_vpn_server.md +++ b/src/go/plugin/go.d/modules/prometheus/integrations/softether_vpn_server.md @@ -1,6 +1,6 @@ <!--startmeta -custom_edit_url: "https://github.com/netdata/netdata/edit/master/src/go/collectors/go.d.plugin/modules/prometheus/integrations/softether_vpn_server.md" -meta_yaml: "https://github.com/netdata/netdata/edit/master/src/go/collectors/go.d.plugin/modules/prometheus/metadata.yaml" +custom_edit_url: "https://github.com/netdata/netdata/edit/master/src/go/plugin/go.d/modules/prometheus/integrations/softether_vpn_server.md" +meta_yaml: "https://github.com/netdata/netdata/edit/master/src/go/plugin/go.d/modules/prometheus/metadata.yaml" sidebar_label: "SoftEther VPN Server" learn_status: "Published" learn_rel_path: "Collecting Metrics/VPNs" @@ -37,7 +37,6 @@ This collector supports collecting metrics from multiple instances of this integ #### Auto-Detection By default, it detects instances running on the local host by trying to connect to known ports that are [allocated to exporters](https://github.com/prometheus/prometheus/wiki/Default-port-allocations). -The full list of endpoints is available in the collector's [configuration file](https://github.com/netdata/netdata/blob/master/src/go/collectors/go.d.plugin/config/go.d/prometheus.conf). #### Limits @@ -138,7 +137,7 @@ The following options can be defined globally: update_every, autodetection_retry This option allows you to filter out unwanted time series. Only metrics matching the selector will be collected. - Logic: (pattern1 OR pattern2) AND !(pattern3 or pattern4) -- Pattern syntax: [selector](/src/go/collectors/go.d.plugin/pkg/prometheus/selector/README.md). +- Pattern syntax: [selector](/src/go/plugin/go.d/pkg/prometheus/selector/README.md). - Option syntax: ```yaml @@ -266,6 +265,8 @@ jobs: ### Debug Mode +**Important**: Debug mode is not supported for data collection jobs created via the UI using the Dyncfg feature. + To troubleshoot issues with the `prometheus` collector, run the `go.d.plugin` with the debug option enabled. The output should give you clues as to why the collector isn't working. @@ -288,4 +289,37 @@ should give you clues as to why the collector isn't working. ./go.d.plugin -d -m prometheus ``` +### Getting Logs + +If you're encountering problems with the `prometheus` collector, follow these steps to retrieve logs and identify potential issues: + +- **Run the command** specific to your system (systemd, non-systemd, or Docker container). +- **Examine the output** for any warnings or error messages that might indicate issues. These messages should provide clues about the root cause of the problem. + +#### System with systemd + +Use the following command to view logs generated since the last Netdata service restart: + +```bash +journalctl _SYSTEMD_INVOCATION_ID="$(systemctl show --value --property=InvocationID netdata)" --namespace=netdata --grep prometheus +``` + +#### System without systemd + +Locate the collector log file, typically at `/var/log/netdata/collector.log`, and use `grep` to filter for collector's name: + +```bash +grep prometheus /var/log/netdata/collector.log +``` + +**Note**: This method shows logs from all restarts. Focus on the **latest entries** for troubleshooting current issues. + +#### Docker Container + +If your Netdata runs in a Docker container named "netdata" (replace if different), use this command: + +```bash +docker logs netdata 2>&1 | grep prometheus +``` + diff --git a/src/go/collectors/go.d.plugin/modules/prometheus/integrations/solar_logging_stick.md b/src/go/plugin/go.d/modules/prometheus/integrations/solar_logging_stick.md index caee6ce8d..35c78085e 100644 --- a/src/go/collectors/go.d.plugin/modules/prometheus/integrations/solar_logging_stick.md +++ b/src/go/plugin/go.d/modules/prometheus/integrations/solar_logging_stick.md @@ -1,6 +1,6 @@ <!--startmeta -custom_edit_url: "https://github.com/netdata/netdata/edit/master/src/go/collectors/go.d.plugin/modules/prometheus/integrations/solar_logging_stick.md" -meta_yaml: "https://github.com/netdata/netdata/edit/master/src/go/collectors/go.d.plugin/modules/prometheus/metadata.yaml" +custom_edit_url: "https://github.com/netdata/netdata/edit/master/src/go/plugin/go.d/modules/prometheus/integrations/solar_logging_stick.md" +meta_yaml: "https://github.com/netdata/netdata/edit/master/src/go/plugin/go.d/modules/prometheus/metadata.yaml" sidebar_label: "Solar logging stick" learn_status: "Published" learn_rel_path: "Collecting Metrics/IoT Devices" @@ -37,7 +37,6 @@ This collector supports collecting metrics from multiple instances of this integ #### Auto-Detection By default, it detects instances running on the local host by trying to connect to known ports that are [allocated to exporters](https://github.com/prometheus/prometheus/wiki/Default-port-allocations). -The full list of endpoints is available in the collector's [configuration file](https://github.com/netdata/netdata/blob/master/src/go/collectors/go.d.plugin/config/go.d/prometheus.conf). #### Limits @@ -138,7 +137,7 @@ The following options can be defined globally: update_every, autodetection_retry This option allows you to filter out unwanted time series. Only metrics matching the selector will be collected. - Logic: (pattern1 OR pattern2) AND !(pattern3 or pattern4) -- Pattern syntax: [selector](/src/go/collectors/go.d.plugin/pkg/prometheus/selector/README.md). +- Pattern syntax: [selector](/src/go/plugin/go.d/pkg/prometheus/selector/README.md). - Option syntax: ```yaml @@ -266,6 +265,8 @@ jobs: ### Debug Mode +**Important**: Debug mode is not supported for data collection jobs created via the UI using the Dyncfg feature. + To troubleshoot issues with the `prometheus` collector, run the `go.d.plugin` with the debug option enabled. The output should give you clues as to why the collector isn't working. @@ -288,4 +289,37 @@ should give you clues as to why the collector isn't working. ./go.d.plugin -d -m prometheus ``` +### Getting Logs + +If you're encountering problems with the `prometheus` collector, follow these steps to retrieve logs and identify potential issues: + +- **Run the command** specific to your system (systemd, non-systemd, or Docker container). +- **Examine the output** for any warnings or error messages that might indicate issues. These messages should provide clues about the root cause of the problem. + +#### System with systemd + +Use the following command to view logs generated since the last Netdata service restart: + +```bash +journalctl _SYSTEMD_INVOCATION_ID="$(systemctl show --value --property=InvocationID netdata)" --namespace=netdata --grep prometheus +``` + +#### System without systemd + +Locate the collector log file, typically at `/var/log/netdata/collector.log`, and use `grep` to filter for collector's name: + +```bash +grep prometheus /var/log/netdata/collector.log +``` + +**Note**: This method shows logs from all restarts. Focus on the **latest entries** for troubleshooting current issues. + +#### Docker Container + +If your Netdata runs in a Docker container named "netdata" (replace if different), use this command: + +```bash +docker logs netdata 2>&1 | grep prometheus +``` + diff --git a/src/go/collectors/go.d.plugin/modules/prometheus/integrations/solaredge_inverters.md b/src/go/plugin/go.d/modules/prometheus/integrations/solaredge_inverters.md index ad9a67021..266f2d05c 100644 --- a/src/go/collectors/go.d.plugin/modules/prometheus/integrations/solaredge_inverters.md +++ b/src/go/plugin/go.d/modules/prometheus/integrations/solaredge_inverters.md @@ -1,6 +1,6 @@ <!--startmeta -custom_edit_url: "https://github.com/netdata/netdata/edit/master/src/go/collectors/go.d.plugin/modules/prometheus/integrations/solaredge_inverters.md" -meta_yaml: "https://github.com/netdata/netdata/edit/master/src/go/collectors/go.d.plugin/modules/prometheus/metadata.yaml" +custom_edit_url: "https://github.com/netdata/netdata/edit/master/src/go/plugin/go.d/modules/prometheus/integrations/solaredge_inverters.md" +meta_yaml: "https://github.com/netdata/netdata/edit/master/src/go/plugin/go.d/modules/prometheus/metadata.yaml" sidebar_label: "SolarEdge inverters" learn_status: "Published" learn_rel_path: "Collecting Metrics/IoT Devices" @@ -37,7 +37,6 @@ This collector supports collecting metrics from multiple instances of this integ #### Auto-Detection By default, it detects instances running on the local host by trying to connect to known ports that are [allocated to exporters](https://github.com/prometheus/prometheus/wiki/Default-port-allocations). -The full list of endpoints is available in the collector's [configuration file](https://github.com/netdata/netdata/blob/master/src/go/collectors/go.d.plugin/config/go.d/prometheus.conf). #### Limits @@ -138,7 +137,7 @@ The following options can be defined globally: update_every, autodetection_retry This option allows you to filter out unwanted time series. Only metrics matching the selector will be collected. - Logic: (pattern1 OR pattern2) AND !(pattern3 or pattern4) -- Pattern syntax: [selector](/src/go/collectors/go.d.plugin/pkg/prometheus/selector/README.md). +- Pattern syntax: [selector](/src/go/plugin/go.d/pkg/prometheus/selector/README.md). - Option syntax: ```yaml @@ -266,6 +265,8 @@ jobs: ### Debug Mode +**Important**: Debug mode is not supported for data collection jobs created via the UI using the Dyncfg feature. + To troubleshoot issues with the `prometheus` collector, run the `go.d.plugin` with the debug option enabled. The output should give you clues as to why the collector isn't working. @@ -288,4 +289,37 @@ should give you clues as to why the collector isn't working. ./go.d.plugin -d -m prometheus ``` +### Getting Logs + +If you're encountering problems with the `prometheus` collector, follow these steps to retrieve logs and identify potential issues: + +- **Run the command** specific to your system (systemd, non-systemd, or Docker container). +- **Examine the output** for any warnings or error messages that might indicate issues. These messages should provide clues about the root cause of the problem. + +#### System with systemd + +Use the following command to view logs generated since the last Netdata service restart: + +```bash +journalctl _SYSTEMD_INVOCATION_ID="$(systemctl show --value --property=InvocationID netdata)" --namespace=netdata --grep prometheus +``` + +#### System without systemd + +Locate the collector log file, typically at `/var/log/netdata/collector.log`, and use `grep` to filter for collector's name: + +```bash +grep prometheus /var/log/netdata/collector.log +``` + +**Note**: This method shows logs from all restarts. Focus on the **latest entries** for troubleshooting current issues. + +#### Docker Container + +If your Netdata runs in a Docker container named "netdata" (replace if different), use this command: + +```bash +docker logs netdata 2>&1 | grep prometheus +``` + diff --git a/src/go/collectors/go.d.plugin/modules/prometheus/integrations/solis_ginlong_5g_inverters.md b/src/go/plugin/go.d/modules/prometheus/integrations/solis_ginlong_5g_inverters.md index 46c2b5218..d0d0658f5 100644 --- a/src/go/collectors/go.d.plugin/modules/prometheus/integrations/solis_ginlong_5g_inverters.md +++ b/src/go/plugin/go.d/modules/prometheus/integrations/solis_ginlong_5g_inverters.md @@ -1,6 +1,6 @@ <!--startmeta -custom_edit_url: "https://github.com/netdata/netdata/edit/master/src/go/collectors/go.d.plugin/modules/prometheus/integrations/solis_ginlong_5g_inverters.md" -meta_yaml: "https://github.com/netdata/netdata/edit/master/src/go/collectors/go.d.plugin/modules/prometheus/metadata.yaml" +custom_edit_url: "https://github.com/netdata/netdata/edit/master/src/go/plugin/go.d/modules/prometheus/integrations/solis_ginlong_5g_inverters.md" +meta_yaml: "https://github.com/netdata/netdata/edit/master/src/go/plugin/go.d/modules/prometheus/metadata.yaml" sidebar_label: "Solis Ginlong 5G inverters" learn_status: "Published" learn_rel_path: "Collecting Metrics/IoT Devices" @@ -37,7 +37,6 @@ This collector supports collecting metrics from multiple instances of this integ #### Auto-Detection By default, it detects instances running on the local host by trying to connect to known ports that are [allocated to exporters](https://github.com/prometheus/prometheus/wiki/Default-port-allocations). -The full list of endpoints is available in the collector's [configuration file](https://github.com/netdata/netdata/blob/master/src/go/collectors/go.d.plugin/config/go.d/prometheus.conf). #### Limits @@ -138,7 +137,7 @@ The following options can be defined globally: update_every, autodetection_retry This option allows you to filter out unwanted time series. Only metrics matching the selector will be collected. - Logic: (pattern1 OR pattern2) AND !(pattern3 or pattern4) -- Pattern syntax: [selector](/src/go/collectors/go.d.plugin/pkg/prometheus/selector/README.md). +- Pattern syntax: [selector](/src/go/plugin/go.d/pkg/prometheus/selector/README.md). - Option syntax: ```yaml @@ -266,6 +265,8 @@ jobs: ### Debug Mode +**Important**: Debug mode is not supported for data collection jobs created via the UI using the Dyncfg feature. + To troubleshoot issues with the `prometheus` collector, run the `go.d.plugin` with the debug option enabled. The output should give you clues as to why the collector isn't working. @@ -288,4 +289,37 @@ should give you clues as to why the collector isn't working. ./go.d.plugin -d -m prometheus ``` +### Getting Logs + +If you're encountering problems with the `prometheus` collector, follow these steps to retrieve logs and identify potential issues: + +- **Run the command** specific to your system (systemd, non-systemd, or Docker container). +- **Examine the output** for any warnings or error messages that might indicate issues. These messages should provide clues about the root cause of the problem. + +#### System with systemd + +Use the following command to view logs generated since the last Netdata service restart: + +```bash +journalctl _SYSTEMD_INVOCATION_ID="$(systemctl show --value --property=InvocationID netdata)" --namespace=netdata --grep prometheus +``` + +#### System without systemd + +Locate the collector log file, typically at `/var/log/netdata/collector.log`, and use `grep` to filter for collector's name: + +```bash +grep prometheus /var/log/netdata/collector.log +``` + +**Note**: This method shows logs from all restarts. Focus on the **latest entries** for troubleshooting current issues. + +#### Docker Container + +If your Netdata runs in a Docker container named "netdata" (replace if different), use this command: + +```bash +docker logs netdata 2>&1 | grep prometheus +``` + diff --git a/src/go/collectors/go.d.plugin/modules/prometheus/integrations/sonic_nos.md b/src/go/plugin/go.d/modules/prometheus/integrations/sonic_nos.md index 109f8fde6..455f14fbf 100644 --- a/src/go/collectors/go.d.plugin/modules/prometheus/integrations/sonic_nos.md +++ b/src/go/plugin/go.d/modules/prometheus/integrations/sonic_nos.md @@ -1,6 +1,6 @@ <!--startmeta -custom_edit_url: "https://github.com/netdata/netdata/edit/master/src/go/collectors/go.d.plugin/modules/prometheus/integrations/sonic_nos.md" -meta_yaml: "https://github.com/netdata/netdata/edit/master/src/go/collectors/go.d.plugin/modules/prometheus/metadata.yaml" +custom_edit_url: "https://github.com/netdata/netdata/edit/master/src/go/plugin/go.d/modules/prometheus/integrations/sonic_nos.md" +meta_yaml: "https://github.com/netdata/netdata/edit/master/src/go/plugin/go.d/modules/prometheus/metadata.yaml" sidebar_label: "SONiC NOS" learn_status: "Published" learn_rel_path: "Collecting Metrics/Networking Stack and Network Interfaces" @@ -37,7 +37,6 @@ This collector supports collecting metrics from multiple instances of this integ #### Auto-Detection By default, it detects instances running on the local host by trying to connect to known ports that are [allocated to exporters](https://github.com/prometheus/prometheus/wiki/Default-port-allocations). -The full list of endpoints is available in the collector's [configuration file](https://github.com/netdata/netdata/blob/master/src/go/collectors/go.d.plugin/config/go.d/prometheus.conf). #### Limits @@ -138,7 +137,7 @@ The following options can be defined globally: update_every, autodetection_retry This option allows you to filter out unwanted time series. Only metrics matching the selector will be collected. - Logic: (pattern1 OR pattern2) AND !(pattern3 or pattern4) -- Pattern syntax: [selector](/src/go/collectors/go.d.plugin/pkg/prometheus/selector/README.md). +- Pattern syntax: [selector](/src/go/plugin/go.d/pkg/prometheus/selector/README.md). - Option syntax: ```yaml @@ -266,6 +265,8 @@ jobs: ### Debug Mode +**Important**: Debug mode is not supported for data collection jobs created via the UI using the Dyncfg feature. + To troubleshoot issues with the `prometheus` collector, run the `go.d.plugin` with the debug option enabled. The output should give you clues as to why the collector isn't working. @@ -288,4 +289,37 @@ should give you clues as to why the collector isn't working. ./go.d.plugin -d -m prometheus ``` +### Getting Logs + +If you're encountering problems with the `prometheus` collector, follow these steps to retrieve logs and identify potential issues: + +- **Run the command** specific to your system (systemd, non-systemd, or Docker container). +- **Examine the output** for any warnings or error messages that might indicate issues. These messages should provide clues about the root cause of the problem. + +#### System with systemd + +Use the following command to view logs generated since the last Netdata service restart: + +```bash +journalctl _SYSTEMD_INVOCATION_ID="$(systemctl show --value --property=InvocationID netdata)" --namespace=netdata --grep prometheus +``` + +#### System without systemd + +Locate the collector log file, typically at `/var/log/netdata/collector.log`, and use `grep` to filter for collector's name: + +```bash +grep prometheus /var/log/netdata/collector.log +``` + +**Note**: This method shows logs from all restarts. Focus on the **latest entries** for troubleshooting current issues. + +#### Docker Container + +If your Netdata runs in a Docker container named "netdata" (replace if different), use this command: + +```bash +docker logs netdata 2>&1 | grep prometheus +``` + diff --git a/src/go/collectors/go.d.plugin/modules/prometheus/integrations/spacelift.md b/src/go/plugin/go.d/modules/prometheus/integrations/spacelift.md index fec5255ca..ab83110bb 100644 --- a/src/go/collectors/go.d.plugin/modules/prometheus/integrations/spacelift.md +++ b/src/go/plugin/go.d/modules/prometheus/integrations/spacelift.md @@ -1,6 +1,6 @@ <!--startmeta -custom_edit_url: "https://github.com/netdata/netdata/edit/master/src/go/collectors/go.d.plugin/modules/prometheus/integrations/spacelift.md" -meta_yaml: "https://github.com/netdata/netdata/edit/master/src/go/collectors/go.d.plugin/modules/prometheus/metadata.yaml" +custom_edit_url: "https://github.com/netdata/netdata/edit/master/src/go/plugin/go.d/modules/prometheus/integrations/spacelift.md" +meta_yaml: "https://github.com/netdata/netdata/edit/master/src/go/plugin/go.d/modules/prometheus/metadata.yaml" sidebar_label: "Spacelift" learn_status: "Published" learn_rel_path: "Collecting Metrics/Provisioning Systems" @@ -37,7 +37,6 @@ This collector supports collecting metrics from multiple instances of this integ #### Auto-Detection By default, it detects instances running on the local host by trying to connect to known ports that are [allocated to exporters](https://github.com/prometheus/prometheus/wiki/Default-port-allocations). -The full list of endpoints is available in the collector's [configuration file](https://github.com/netdata/netdata/blob/master/src/go/collectors/go.d.plugin/config/go.d/prometheus.conf). #### Limits @@ -138,7 +137,7 @@ The following options can be defined globally: update_every, autodetection_retry This option allows you to filter out unwanted time series. Only metrics matching the selector will be collected. - Logic: (pattern1 OR pattern2) AND !(pattern3 or pattern4) -- Pattern syntax: [selector](/src/go/collectors/go.d.plugin/pkg/prometheus/selector/README.md). +- Pattern syntax: [selector](/src/go/plugin/go.d/pkg/prometheus/selector/README.md). - Option syntax: ```yaml @@ -266,6 +265,8 @@ jobs: ### Debug Mode +**Important**: Debug mode is not supported for data collection jobs created via the UI using the Dyncfg feature. + To troubleshoot issues with the `prometheus` collector, run the `go.d.plugin` with the debug option enabled. The output should give you clues as to why the collector isn't working. @@ -288,4 +289,37 @@ should give you clues as to why the collector isn't working. ./go.d.plugin -d -m prometheus ``` +### Getting Logs + +If you're encountering problems with the `prometheus` collector, follow these steps to retrieve logs and identify potential issues: + +- **Run the command** specific to your system (systemd, non-systemd, or Docker container). +- **Examine the output** for any warnings or error messages that might indicate issues. These messages should provide clues about the root cause of the problem. + +#### System with systemd + +Use the following command to view logs generated since the last Netdata service restart: + +```bash +journalctl _SYSTEMD_INVOCATION_ID="$(systemctl show --value --property=InvocationID netdata)" --namespace=netdata --grep prometheus +``` + +#### System without systemd + +Locate the collector log file, typically at `/var/log/netdata/collector.log`, and use `grep` to filter for collector's name: + +```bash +grep prometheus /var/log/netdata/collector.log +``` + +**Note**: This method shows logs from all restarts. Focus on the **latest entries** for troubleshooting current issues. + +#### Docker Container + +If your Netdata runs in a Docker container named "netdata" (replace if different), use this command: + +```bash +docker logs netdata 2>&1 | grep prometheus +``` + diff --git a/src/go/collectors/go.d.plugin/modules/prometheus/integrations/speedify_cli.md b/src/go/plugin/go.d/modules/prometheus/integrations/speedify_cli.md index 98551c620..beed0bd1a 100644 --- a/src/go/collectors/go.d.plugin/modules/prometheus/integrations/speedify_cli.md +++ b/src/go/plugin/go.d/modules/prometheus/integrations/speedify_cli.md @@ -1,6 +1,6 @@ <!--startmeta -custom_edit_url: "https://github.com/netdata/netdata/edit/master/src/go/collectors/go.d.plugin/modules/prometheus/integrations/speedify_cli.md" -meta_yaml: "https://github.com/netdata/netdata/edit/master/src/go/collectors/go.d.plugin/modules/prometheus/metadata.yaml" +custom_edit_url: "https://github.com/netdata/netdata/edit/master/src/go/plugin/go.d/modules/prometheus/integrations/speedify_cli.md" +meta_yaml: "https://github.com/netdata/netdata/edit/master/src/go/plugin/go.d/modules/prometheus/metadata.yaml" sidebar_label: "Speedify CLI" learn_status: "Published" learn_rel_path: "Collecting Metrics/VPNs" @@ -37,7 +37,6 @@ This collector supports collecting metrics from multiple instances of this integ #### Auto-Detection By default, it detects instances running on the local host by trying to connect to known ports that are [allocated to exporters](https://github.com/prometheus/prometheus/wiki/Default-port-allocations). -The full list of endpoints is available in the collector's [configuration file](https://github.com/netdata/netdata/blob/master/src/go/collectors/go.d.plugin/config/go.d/prometheus.conf). #### Limits @@ -138,7 +137,7 @@ The following options can be defined globally: update_every, autodetection_retry This option allows you to filter out unwanted time series. Only metrics matching the selector will be collected. - Logic: (pattern1 OR pattern2) AND !(pattern3 or pattern4) -- Pattern syntax: [selector](/src/go/collectors/go.d.plugin/pkg/prometheus/selector/README.md). +- Pattern syntax: [selector](/src/go/plugin/go.d/pkg/prometheus/selector/README.md). - Option syntax: ```yaml @@ -266,6 +265,8 @@ jobs: ### Debug Mode +**Important**: Debug mode is not supported for data collection jobs created via the UI using the Dyncfg feature. + To troubleshoot issues with the `prometheus` collector, run the `go.d.plugin` with the debug option enabled. The output should give you clues as to why the collector isn't working. @@ -288,4 +289,37 @@ should give you clues as to why the collector isn't working. ./go.d.plugin -d -m prometheus ``` +### Getting Logs + +If you're encountering problems with the `prometheus` collector, follow these steps to retrieve logs and identify potential issues: + +- **Run the command** specific to your system (systemd, non-systemd, or Docker container). +- **Examine the output** for any warnings or error messages that might indicate issues. These messages should provide clues about the root cause of the problem. + +#### System with systemd + +Use the following command to view logs generated since the last Netdata service restart: + +```bash +journalctl _SYSTEMD_INVOCATION_ID="$(systemctl show --value --property=InvocationID netdata)" --namespace=netdata --grep prometheus +``` + +#### System without systemd + +Locate the collector log file, typically at `/var/log/netdata/collector.log`, and use `grep` to filter for collector's name: + +```bash +grep prometheus /var/log/netdata/collector.log +``` + +**Note**: This method shows logs from all restarts. Focus on the **latest entries** for troubleshooting current issues. + +#### Docker Container + +If your Netdata runs in a Docker container named "netdata" (replace if different), use this command: + +```bash +docker logs netdata 2>&1 | grep prometheus +``` + diff --git a/src/go/collectors/go.d.plugin/modules/prometheus/integrations/sphinx.md b/src/go/plugin/go.d/modules/prometheus/integrations/sphinx.md index d52f6b978..1116f91e0 100644 --- a/src/go/collectors/go.d.plugin/modules/prometheus/integrations/sphinx.md +++ b/src/go/plugin/go.d/modules/prometheus/integrations/sphinx.md @@ -1,6 +1,6 @@ <!--startmeta -custom_edit_url: "https://github.com/netdata/netdata/edit/master/src/go/collectors/go.d.plugin/modules/prometheus/integrations/sphinx.md" -meta_yaml: "https://github.com/netdata/netdata/edit/master/src/go/collectors/go.d.plugin/modules/prometheus/metadata.yaml" +custom_edit_url: "https://github.com/netdata/netdata/edit/master/src/go/plugin/go.d/modules/prometheus/integrations/sphinx.md" +meta_yaml: "https://github.com/netdata/netdata/edit/master/src/go/plugin/go.d/modules/prometheus/metadata.yaml" sidebar_label: "Sphinx" learn_status: "Published" learn_rel_path: "Collecting Metrics/Search Engines" @@ -37,7 +37,6 @@ This collector supports collecting metrics from multiple instances of this integ #### Auto-Detection By default, it detects instances running on the local host by trying to connect to known ports that are [allocated to exporters](https://github.com/prometheus/prometheus/wiki/Default-port-allocations). -The full list of endpoints is available in the collector's [configuration file](https://github.com/netdata/netdata/blob/master/src/go/collectors/go.d.plugin/config/go.d/prometheus.conf). #### Limits @@ -138,7 +137,7 @@ The following options can be defined globally: update_every, autodetection_retry This option allows you to filter out unwanted time series. Only metrics matching the selector will be collected. - Logic: (pattern1 OR pattern2) AND !(pattern3 or pattern4) -- Pattern syntax: [selector](/src/go/collectors/go.d.plugin/pkg/prometheus/selector/README.md). +- Pattern syntax: [selector](/src/go/plugin/go.d/pkg/prometheus/selector/README.md). - Option syntax: ```yaml @@ -266,6 +265,8 @@ jobs: ### Debug Mode +**Important**: Debug mode is not supported for data collection jobs created via the UI using the Dyncfg feature. + To troubleshoot issues with the `prometheus` collector, run the `go.d.plugin` with the debug option enabled. The output should give you clues as to why the collector isn't working. @@ -288,4 +289,37 @@ should give you clues as to why the collector isn't working. ./go.d.plugin -d -m prometheus ``` +### Getting Logs + +If you're encountering problems with the `prometheus` collector, follow these steps to retrieve logs and identify potential issues: + +- **Run the command** specific to your system (systemd, non-systemd, or Docker container). +- **Examine the output** for any warnings or error messages that might indicate issues. These messages should provide clues about the root cause of the problem. + +#### System with systemd + +Use the following command to view logs generated since the last Netdata service restart: + +```bash +journalctl _SYSTEMD_INVOCATION_ID="$(systemctl show --value --property=InvocationID netdata)" --namespace=netdata --grep prometheus +``` + +#### System without systemd + +Locate the collector log file, typically at `/var/log/netdata/collector.log`, and use `grep` to filter for collector's name: + +```bash +grep prometheus /var/log/netdata/collector.log +``` + +**Note**: This method shows logs from all restarts. Focus on the **latest entries** for troubleshooting current issues. + +#### Docker Container + +If your Netdata runs in a Docker container named "netdata" (replace if different), use this command: + +```bash +docker logs netdata 2>&1 | grep prometheus +``` + diff --git a/src/go/collectors/go.d.plugin/modules/prometheus/integrations/sql_database_agnostic.md b/src/go/plugin/go.d/modules/prometheus/integrations/sql_database_agnostic.md index 2716b751e..6a0a523c6 100644 --- a/src/go/collectors/go.d.plugin/modules/prometheus/integrations/sql_database_agnostic.md +++ b/src/go/plugin/go.d/modules/prometheus/integrations/sql_database_agnostic.md @@ -1,6 +1,6 @@ <!--startmeta -custom_edit_url: "https://github.com/netdata/netdata/edit/master/src/go/collectors/go.d.plugin/modules/prometheus/integrations/sql_database_agnostic.md" -meta_yaml: "https://github.com/netdata/netdata/edit/master/src/go/collectors/go.d.plugin/modules/prometheus/metadata.yaml" +custom_edit_url: "https://github.com/netdata/netdata/edit/master/src/go/plugin/go.d/modules/prometheus/integrations/sql_database_agnostic.md" +meta_yaml: "https://github.com/netdata/netdata/edit/master/src/go/plugin/go.d/modules/prometheus/metadata.yaml" sidebar_label: "SQL Database agnostic" learn_status: "Published" learn_rel_path: "Collecting Metrics/Databases" @@ -37,7 +37,6 @@ This collector supports collecting metrics from multiple instances of this integ #### Auto-Detection By default, it detects instances running on the local host by trying to connect to known ports that are [allocated to exporters](https://github.com/prometheus/prometheus/wiki/Default-port-allocations). -The full list of endpoints is available in the collector's [configuration file](https://github.com/netdata/netdata/blob/master/src/go/collectors/go.d.plugin/config/go.d/prometheus.conf). #### Limits @@ -138,7 +137,7 @@ The following options can be defined globally: update_every, autodetection_retry This option allows you to filter out unwanted time series. Only metrics matching the selector will be collected. - Logic: (pattern1 OR pattern2) AND !(pattern3 or pattern4) -- Pattern syntax: [selector](/src/go/collectors/go.d.plugin/pkg/prometheus/selector/README.md). +- Pattern syntax: [selector](/src/go/plugin/go.d/pkg/prometheus/selector/README.md). - Option syntax: ```yaml @@ -266,6 +265,8 @@ jobs: ### Debug Mode +**Important**: Debug mode is not supported for data collection jobs created via the UI using the Dyncfg feature. + To troubleshoot issues with the `prometheus` collector, run the `go.d.plugin` with the debug option enabled. The output should give you clues as to why the collector isn't working. @@ -288,4 +289,37 @@ should give you clues as to why the collector isn't working. ./go.d.plugin -d -m prometheus ``` +### Getting Logs + +If you're encountering problems with the `prometheus` collector, follow these steps to retrieve logs and identify potential issues: + +- **Run the command** specific to your system (systemd, non-systemd, or Docker container). +- **Examine the output** for any warnings or error messages that might indicate issues. These messages should provide clues about the root cause of the problem. + +#### System with systemd + +Use the following command to view logs generated since the last Netdata service restart: + +```bash +journalctl _SYSTEMD_INVOCATION_ID="$(systemctl show --value --property=InvocationID netdata)" --namespace=netdata --grep prometheus +``` + +#### System without systemd + +Locate the collector log file, typically at `/var/log/netdata/collector.log`, and use `grep` to filter for collector's name: + +```bash +grep prometheus /var/log/netdata/collector.log +``` + +**Note**: This method shows logs from all restarts. Focus on the **latest entries** for troubleshooting current issues. + +#### Docker Container + +If your Netdata runs in a Docker container named "netdata" (replace if different), use this command: + +```bash +docker logs netdata 2>&1 | grep prometheus +``` + diff --git a/src/go/collectors/go.d.plugin/modules/prometheus/integrations/ssh.md b/src/go/plugin/go.d/modules/prometheus/integrations/ssh.md index 55090280e..7ffe9b203 100644 --- a/src/go/collectors/go.d.plugin/modules/prometheus/integrations/ssh.md +++ b/src/go/plugin/go.d/modules/prometheus/integrations/ssh.md @@ -1,6 +1,6 @@ <!--startmeta -custom_edit_url: "https://github.com/netdata/netdata/edit/master/src/go/collectors/go.d.plugin/modules/prometheus/integrations/ssh.md" -meta_yaml: "https://github.com/netdata/netdata/edit/master/src/go/collectors/go.d.plugin/modules/prometheus/metadata.yaml" +custom_edit_url: "https://github.com/netdata/netdata/edit/master/src/go/plugin/go.d/modules/prometheus/integrations/ssh.md" +meta_yaml: "https://github.com/netdata/netdata/edit/master/src/go/plugin/go.d/modules/prometheus/metadata.yaml" sidebar_label: "SSH" learn_status: "Published" learn_rel_path: "Collecting Metrics/Authentication and Authorization" @@ -37,7 +37,6 @@ This collector supports collecting metrics from multiple instances of this integ #### Auto-Detection By default, it detects instances running on the local host by trying to connect to known ports that are [allocated to exporters](https://github.com/prometheus/prometheus/wiki/Default-port-allocations). -The full list of endpoints is available in the collector's [configuration file](https://github.com/netdata/netdata/blob/master/src/go/collectors/go.d.plugin/config/go.d/prometheus.conf). #### Limits @@ -138,7 +137,7 @@ The following options can be defined globally: update_every, autodetection_retry This option allows you to filter out unwanted time series. Only metrics matching the selector will be collected. - Logic: (pattern1 OR pattern2) AND !(pattern3 or pattern4) -- Pattern syntax: [selector](/src/go/collectors/go.d.plugin/pkg/prometheus/selector/README.md). +- Pattern syntax: [selector](/src/go/plugin/go.d/pkg/prometheus/selector/README.md). - Option syntax: ```yaml @@ -266,6 +265,8 @@ jobs: ### Debug Mode +**Important**: Debug mode is not supported for data collection jobs created via the UI using the Dyncfg feature. + To troubleshoot issues with the `prometheus` collector, run the `go.d.plugin` with the debug option enabled. The output should give you clues as to why the collector isn't working. @@ -288,4 +289,37 @@ should give you clues as to why the collector isn't working. ./go.d.plugin -d -m prometheus ``` +### Getting Logs + +If you're encountering problems with the `prometheus` collector, follow these steps to retrieve logs and identify potential issues: + +- **Run the command** specific to your system (systemd, non-systemd, or Docker container). +- **Examine the output** for any warnings or error messages that might indicate issues. These messages should provide clues about the root cause of the problem. + +#### System with systemd + +Use the following command to view logs generated since the last Netdata service restart: + +```bash +journalctl _SYSTEMD_INVOCATION_ID="$(systemctl show --value --property=InvocationID netdata)" --namespace=netdata --grep prometheus +``` + +#### System without systemd + +Locate the collector log file, typically at `/var/log/netdata/collector.log`, and use `grep` to filter for collector's name: + +```bash +grep prometheus /var/log/netdata/collector.log +``` + +**Note**: This method shows logs from all restarts. Focus on the **latest entries** for troubleshooting current issues. + +#### Docker Container + +If your Netdata runs in a Docker container named "netdata" (replace if different), use this command: + +```bash +docker logs netdata 2>&1 | grep prometheus +``` + diff --git a/src/go/collectors/go.d.plugin/modules/prometheus/integrations/ssl_certificate.md b/src/go/plugin/go.d/modules/prometheus/integrations/ssl_certificate.md index 577cc19db..2c1d519a8 100644 --- a/src/go/collectors/go.d.plugin/modules/prometheus/integrations/ssl_certificate.md +++ b/src/go/plugin/go.d/modules/prometheus/integrations/ssl_certificate.md @@ -1,6 +1,6 @@ <!--startmeta -custom_edit_url: "https://github.com/netdata/netdata/edit/master/src/go/collectors/go.d.plugin/modules/prometheus/integrations/ssl_certificate.md" -meta_yaml: "https://github.com/netdata/netdata/edit/master/src/go/collectors/go.d.plugin/modules/prometheus/metadata.yaml" +custom_edit_url: "https://github.com/netdata/netdata/edit/master/src/go/plugin/go.d/modules/prometheus/integrations/ssl_certificate.md" +meta_yaml: "https://github.com/netdata/netdata/edit/master/src/go/plugin/go.d/modules/prometheus/metadata.yaml" sidebar_label: "SSL Certificate" learn_status: "Published" learn_rel_path: "Collecting Metrics/Security Systems" @@ -37,7 +37,6 @@ This collector supports collecting metrics from multiple instances of this integ #### Auto-Detection By default, it detects instances running on the local host by trying to connect to known ports that are [allocated to exporters](https://github.com/prometheus/prometheus/wiki/Default-port-allocations). -The full list of endpoints is available in the collector's [configuration file](https://github.com/netdata/netdata/blob/master/src/go/collectors/go.d.plugin/config/go.d/prometheus.conf). #### Limits @@ -138,7 +137,7 @@ The following options can be defined globally: update_every, autodetection_retry This option allows you to filter out unwanted time series. Only metrics matching the selector will be collected. - Logic: (pattern1 OR pattern2) AND !(pattern3 or pattern4) -- Pattern syntax: [selector](/src/go/collectors/go.d.plugin/pkg/prometheus/selector/README.md). +- Pattern syntax: [selector](/src/go/plugin/go.d/pkg/prometheus/selector/README.md). - Option syntax: ```yaml @@ -266,6 +265,8 @@ jobs: ### Debug Mode +**Important**: Debug mode is not supported for data collection jobs created via the UI using the Dyncfg feature. + To troubleshoot issues with the `prometheus` collector, run the `go.d.plugin` with the debug option enabled. The output should give you clues as to why the collector isn't working. @@ -288,4 +289,37 @@ should give you clues as to why the collector isn't working. ./go.d.plugin -d -m prometheus ``` +### Getting Logs + +If you're encountering problems with the `prometheus` collector, follow these steps to retrieve logs and identify potential issues: + +- **Run the command** specific to your system (systemd, non-systemd, or Docker container). +- **Examine the output** for any warnings or error messages that might indicate issues. These messages should provide clues about the root cause of the problem. + +#### System with systemd + +Use the following command to view logs generated since the last Netdata service restart: + +```bash +journalctl _SYSTEMD_INVOCATION_ID="$(systemctl show --value --property=InvocationID netdata)" --namespace=netdata --grep prometheus +``` + +#### System without systemd + +Locate the collector log file, typically at `/var/log/netdata/collector.log`, and use `grep` to filter for collector's name: + +```bash +grep prometheus /var/log/netdata/collector.log +``` + +**Note**: This method shows logs from all restarts. Focus on the **latest entries** for troubleshooting current issues. + +#### Docker Container + +If your Netdata runs in a Docker container named "netdata" (replace if different), use this command: + +```bash +docker logs netdata 2>&1 | grep prometheus +``` + diff --git a/src/go/collectors/go.d.plugin/modules/prometheus/integrations/starlink_spacex.md b/src/go/plugin/go.d/modules/prometheus/integrations/starlink_spacex.md index 838d817db..b48f32c9a 100644 --- a/src/go/collectors/go.d.plugin/modules/prometheus/integrations/starlink_spacex.md +++ b/src/go/plugin/go.d/modules/prometheus/integrations/starlink_spacex.md @@ -1,6 +1,6 @@ <!--startmeta -custom_edit_url: "https://github.com/netdata/netdata/edit/master/src/go/collectors/go.d.plugin/modules/prometheus/integrations/starlink_spacex.md" -meta_yaml: "https://github.com/netdata/netdata/edit/master/src/go/collectors/go.d.plugin/modules/prometheus/metadata.yaml" +custom_edit_url: "https://github.com/netdata/netdata/edit/master/src/go/plugin/go.d/modules/prometheus/integrations/starlink_spacex.md" +meta_yaml: "https://github.com/netdata/netdata/edit/master/src/go/plugin/go.d/modules/prometheus/metadata.yaml" sidebar_label: "Starlink (SpaceX)" learn_status: "Published" learn_rel_path: "Collecting Metrics/Networking Stack and Network Interfaces" @@ -37,7 +37,6 @@ This collector supports collecting metrics from multiple instances of this integ #### Auto-Detection By default, it detects instances running on the local host by trying to connect to known ports that are [allocated to exporters](https://github.com/prometheus/prometheus/wiki/Default-port-allocations). -The full list of endpoints is available in the collector's [configuration file](https://github.com/netdata/netdata/blob/master/src/go/collectors/go.d.plugin/config/go.d/prometheus.conf). #### Limits @@ -138,7 +137,7 @@ The following options can be defined globally: update_every, autodetection_retry This option allows you to filter out unwanted time series. Only metrics matching the selector will be collected. - Logic: (pattern1 OR pattern2) AND !(pattern3 or pattern4) -- Pattern syntax: [selector](/src/go/collectors/go.d.plugin/pkg/prometheus/selector/README.md). +- Pattern syntax: [selector](/src/go/plugin/go.d/pkg/prometheus/selector/README.md). - Option syntax: ```yaml @@ -266,6 +265,8 @@ jobs: ### Debug Mode +**Important**: Debug mode is not supported for data collection jobs created via the UI using the Dyncfg feature. + To troubleshoot issues with the `prometheus` collector, run the `go.d.plugin` with the debug option enabled. The output should give you clues as to why the collector isn't working. @@ -288,4 +289,37 @@ should give you clues as to why the collector isn't working. ./go.d.plugin -d -m prometheus ``` +### Getting Logs + +If you're encountering problems with the `prometheus` collector, follow these steps to retrieve logs and identify potential issues: + +- **Run the command** specific to your system (systemd, non-systemd, or Docker container). +- **Examine the output** for any warnings or error messages that might indicate issues. These messages should provide clues about the root cause of the problem. + +#### System with systemd + +Use the following command to view logs generated since the last Netdata service restart: + +```bash +journalctl _SYSTEMD_INVOCATION_ID="$(systemctl show --value --property=InvocationID netdata)" --namespace=netdata --grep prometheus +``` + +#### System without systemd + +Locate the collector log file, typically at `/var/log/netdata/collector.log`, and use `grep` to filter for collector's name: + +```bash +grep prometheus /var/log/netdata/collector.log +``` + +**Note**: This method shows logs from all restarts. Focus on the **latest entries** for troubleshooting current issues. + +#### Docker Container + +If your Netdata runs in a Docker container named "netdata" (replace if different), use this command: + +```bash +docker logs netdata 2>&1 | grep prometheus +``` + diff --git a/src/go/collectors/go.d.plugin/modules/prometheus/integrations/starwind_vsan_vsphere_edition.md b/src/go/plugin/go.d/modules/prometheus/integrations/starwind_vsan_vsphere_edition.md index 5cc7847da..9b7409b83 100644 --- a/src/go/collectors/go.d.plugin/modules/prometheus/integrations/starwind_vsan_vsphere_edition.md +++ b/src/go/plugin/go.d/modules/prometheus/integrations/starwind_vsan_vsphere_edition.md @@ -1,6 +1,6 @@ <!--startmeta -custom_edit_url: "https://github.com/netdata/netdata/edit/master/src/go/collectors/go.d.plugin/modules/prometheus/integrations/starwind_vsan_vsphere_edition.md" -meta_yaml: "https://github.com/netdata/netdata/edit/master/src/go/collectors/go.d.plugin/modules/prometheus/metadata.yaml" +custom_edit_url: "https://github.com/netdata/netdata/edit/master/src/go/plugin/go.d/modules/prometheus/integrations/starwind_vsan_vsphere_edition.md" +meta_yaml: "https://github.com/netdata/netdata/edit/master/src/go/plugin/go.d/modules/prometheus/metadata.yaml" sidebar_label: "Starwind VSAN VSphere Edition" learn_status: "Published" learn_rel_path: "Collecting Metrics/Storage, Mount Points and Filesystems" @@ -37,7 +37,6 @@ This collector supports collecting metrics from multiple instances of this integ #### Auto-Detection By default, it detects instances running on the local host by trying to connect to known ports that are [allocated to exporters](https://github.com/prometheus/prometheus/wiki/Default-port-allocations). -The full list of endpoints is available in the collector's [configuration file](https://github.com/netdata/netdata/blob/master/src/go/collectors/go.d.plugin/config/go.d/prometheus.conf). #### Limits @@ -138,7 +137,7 @@ The following options can be defined globally: update_every, autodetection_retry This option allows you to filter out unwanted time series. Only metrics matching the selector will be collected. - Logic: (pattern1 OR pattern2) AND !(pattern3 or pattern4) -- Pattern syntax: [selector](/src/go/collectors/go.d.plugin/pkg/prometheus/selector/README.md). +- Pattern syntax: [selector](/src/go/plugin/go.d/pkg/prometheus/selector/README.md). - Option syntax: ```yaml @@ -266,6 +265,8 @@ jobs: ### Debug Mode +**Important**: Debug mode is not supported for data collection jobs created via the UI using the Dyncfg feature. + To troubleshoot issues with the `prometheus` collector, run the `go.d.plugin` with the debug option enabled. The output should give you clues as to why the collector isn't working. @@ -288,4 +289,37 @@ should give you clues as to why the collector isn't working. ./go.d.plugin -d -m prometheus ``` +### Getting Logs + +If you're encountering problems with the `prometheus` collector, follow these steps to retrieve logs and identify potential issues: + +- **Run the command** specific to your system (systemd, non-systemd, or Docker container). +- **Examine the output** for any warnings or error messages that might indicate issues. These messages should provide clues about the root cause of the problem. + +#### System with systemd + +Use the following command to view logs generated since the last Netdata service restart: + +```bash +journalctl _SYSTEMD_INVOCATION_ID="$(systemctl show --value --property=InvocationID netdata)" --namespace=netdata --grep prometheus +``` + +#### System without systemd + +Locate the collector log file, typically at `/var/log/netdata/collector.log`, and use `grep` to filter for collector's name: + +```bash +grep prometheus /var/log/netdata/collector.log +``` + +**Note**: This method shows logs from all restarts. Focus on the **latest entries** for troubleshooting current issues. + +#### Docker Container + +If your Netdata runs in a Docker container named "netdata" (replace if different), use this command: + +```bash +docker logs netdata 2>&1 | grep prometheus +``` + diff --git a/src/go/collectors/go.d.plugin/modules/prometheus/integrations/statuspage.md b/src/go/plugin/go.d/modules/prometheus/integrations/statuspage.md index 06fd21b99..6038729dc 100644 --- a/src/go/collectors/go.d.plugin/modules/prometheus/integrations/statuspage.md +++ b/src/go/plugin/go.d/modules/prometheus/integrations/statuspage.md @@ -1,6 +1,6 @@ <!--startmeta -custom_edit_url: "https://github.com/netdata/netdata/edit/master/src/go/collectors/go.d.plugin/modules/prometheus/integrations/statuspage.md" -meta_yaml: "https://github.com/netdata/netdata/edit/master/src/go/collectors/go.d.plugin/modules/prometheus/metadata.yaml" +custom_edit_url: "https://github.com/netdata/netdata/edit/master/src/go/plugin/go.d/modules/prometheus/integrations/statuspage.md" +meta_yaml: "https://github.com/netdata/netdata/edit/master/src/go/plugin/go.d/modules/prometheus/metadata.yaml" sidebar_label: "StatusPage" learn_status: "Published" learn_rel_path: "Collecting Metrics/Incident Management" @@ -37,7 +37,6 @@ This collector supports collecting metrics from multiple instances of this integ #### Auto-Detection By default, it detects instances running on the local host by trying to connect to known ports that are [allocated to exporters](https://github.com/prometheus/prometheus/wiki/Default-port-allocations). -The full list of endpoints is available in the collector's [configuration file](https://github.com/netdata/netdata/blob/master/src/go/collectors/go.d.plugin/config/go.d/prometheus.conf). #### Limits @@ -138,7 +137,7 @@ The following options can be defined globally: update_every, autodetection_retry This option allows you to filter out unwanted time series. Only metrics matching the selector will be collected. - Logic: (pattern1 OR pattern2) AND !(pattern3 or pattern4) -- Pattern syntax: [selector](/src/go/collectors/go.d.plugin/pkg/prometheus/selector/README.md). +- Pattern syntax: [selector](/src/go/plugin/go.d/pkg/prometheus/selector/README.md). - Option syntax: ```yaml @@ -266,6 +265,8 @@ jobs: ### Debug Mode +**Important**: Debug mode is not supported for data collection jobs created via the UI using the Dyncfg feature. + To troubleshoot issues with the `prometheus` collector, run the `go.d.plugin` with the debug option enabled. The output should give you clues as to why the collector isn't working. @@ -288,4 +289,37 @@ should give you clues as to why the collector isn't working. ./go.d.plugin -d -m prometheus ``` +### Getting Logs + +If you're encountering problems with the `prometheus` collector, follow these steps to retrieve logs and identify potential issues: + +- **Run the command** specific to your system (systemd, non-systemd, or Docker container). +- **Examine the output** for any warnings or error messages that might indicate issues. These messages should provide clues about the root cause of the problem. + +#### System with systemd + +Use the following command to view logs generated since the last Netdata service restart: + +```bash +journalctl _SYSTEMD_INVOCATION_ID="$(systemctl show --value --property=InvocationID netdata)" --namespace=netdata --grep prometheus +``` + +#### System without systemd + +Locate the collector log file, typically at `/var/log/netdata/collector.log`, and use `grep` to filter for collector's name: + +```bash +grep prometheus /var/log/netdata/collector.log +``` + +**Note**: This method shows logs from all restarts. Focus on the **latest entries** for troubleshooting current issues. + +#### Docker Container + +If your Netdata runs in a Docker container named "netdata" (replace if different), use this command: + +```bash +docker logs netdata 2>&1 | grep prometheus +``` + diff --git a/src/go/collectors/go.d.plugin/modules/prometheus/integrations/steam.md b/src/go/plugin/go.d/modules/prometheus/integrations/steam.md index deceacc5c..44b346593 100644 --- a/src/go/collectors/go.d.plugin/modules/prometheus/integrations/steam.md +++ b/src/go/plugin/go.d/modules/prometheus/integrations/steam.md @@ -1,6 +1,6 @@ <!--startmeta -custom_edit_url: "https://github.com/netdata/netdata/edit/master/src/go/collectors/go.d.plugin/modules/prometheus/integrations/steam.md" -meta_yaml: "https://github.com/netdata/netdata/edit/master/src/go/collectors/go.d.plugin/modules/prometheus/metadata.yaml" +custom_edit_url: "https://github.com/netdata/netdata/edit/master/src/go/plugin/go.d/modules/prometheus/integrations/steam.md" +meta_yaml: "https://github.com/netdata/netdata/edit/master/src/go/plugin/go.d/modules/prometheus/metadata.yaml" sidebar_label: "Steam" learn_status: "Published" learn_rel_path: "Collecting Metrics/Gaming" @@ -37,7 +37,6 @@ This collector supports collecting metrics from multiple instances of this integ #### Auto-Detection By default, it detects instances running on the local host by trying to connect to known ports that are [allocated to exporters](https://github.com/prometheus/prometheus/wiki/Default-port-allocations). -The full list of endpoints is available in the collector's [configuration file](https://github.com/netdata/netdata/blob/master/src/go/collectors/go.d.plugin/config/go.d/prometheus.conf). #### Limits @@ -138,7 +137,7 @@ The following options can be defined globally: update_every, autodetection_retry This option allows you to filter out unwanted time series. Only metrics matching the selector will be collected. - Logic: (pattern1 OR pattern2) AND !(pattern3 or pattern4) -- Pattern syntax: [selector](/src/go/collectors/go.d.plugin/pkg/prometheus/selector/README.md). +- Pattern syntax: [selector](/src/go/plugin/go.d/pkg/prometheus/selector/README.md). - Option syntax: ```yaml @@ -266,6 +265,8 @@ jobs: ### Debug Mode +**Important**: Debug mode is not supported for data collection jobs created via the UI using the Dyncfg feature. + To troubleshoot issues with the `prometheus` collector, run the `go.d.plugin` with the debug option enabled. The output should give you clues as to why the collector isn't working. @@ -288,4 +289,37 @@ should give you clues as to why the collector isn't working. ./go.d.plugin -d -m prometheus ``` +### Getting Logs + +If you're encountering problems with the `prometheus` collector, follow these steps to retrieve logs and identify potential issues: + +- **Run the command** specific to your system (systemd, non-systemd, or Docker container). +- **Examine the output** for any warnings or error messages that might indicate issues. These messages should provide clues about the root cause of the problem. + +#### System with systemd + +Use the following command to view logs generated since the last Netdata service restart: + +```bash +journalctl _SYSTEMD_INVOCATION_ID="$(systemctl show --value --property=InvocationID netdata)" --namespace=netdata --grep prometheus +``` + +#### System without systemd + +Locate the collector log file, typically at `/var/log/netdata/collector.log`, and use `grep` to filter for collector's name: + +```bash +grep prometheus /var/log/netdata/collector.log +``` + +**Note**: This method shows logs from all restarts. Focus on the **latest entries** for troubleshooting current issues. + +#### Docker Container + +If your Netdata runs in a Docker container named "netdata" (replace if different), use this command: + +```bash +docker logs netdata 2>&1 | grep prometheus +``` + diff --git a/src/go/collectors/go.d.plugin/modules/prometheus/integrations/storidge.md b/src/go/plugin/go.d/modules/prometheus/integrations/storidge.md index c3115de31..48a320ce6 100644 --- a/src/go/collectors/go.d.plugin/modules/prometheus/integrations/storidge.md +++ b/src/go/plugin/go.d/modules/prometheus/integrations/storidge.md @@ -1,6 +1,6 @@ <!--startmeta -custom_edit_url: "https://github.com/netdata/netdata/edit/master/src/go/collectors/go.d.plugin/modules/prometheus/integrations/storidge.md" -meta_yaml: "https://github.com/netdata/netdata/edit/master/src/go/collectors/go.d.plugin/modules/prometheus/metadata.yaml" +custom_edit_url: "https://github.com/netdata/netdata/edit/master/src/go/plugin/go.d/modules/prometheus/integrations/storidge.md" +meta_yaml: "https://github.com/netdata/netdata/edit/master/src/go/plugin/go.d/modules/prometheus/metadata.yaml" sidebar_label: "Storidge" learn_status: "Published" learn_rel_path: "Collecting Metrics/Storage, Mount Points and Filesystems" @@ -37,7 +37,6 @@ This collector supports collecting metrics from multiple instances of this integ #### Auto-Detection By default, it detects instances running on the local host by trying to connect to known ports that are [allocated to exporters](https://github.com/prometheus/prometheus/wiki/Default-port-allocations). -The full list of endpoints is available in the collector's [configuration file](https://github.com/netdata/netdata/blob/master/src/go/collectors/go.d.plugin/config/go.d/prometheus.conf). #### Limits @@ -138,7 +137,7 @@ The following options can be defined globally: update_every, autodetection_retry This option allows you to filter out unwanted time series. Only metrics matching the selector will be collected. - Logic: (pattern1 OR pattern2) AND !(pattern3 or pattern4) -- Pattern syntax: [selector](/src/go/collectors/go.d.plugin/pkg/prometheus/selector/README.md). +- Pattern syntax: [selector](/src/go/plugin/go.d/pkg/prometheus/selector/README.md). - Option syntax: ```yaml @@ -266,6 +265,8 @@ jobs: ### Debug Mode +**Important**: Debug mode is not supported for data collection jobs created via the UI using the Dyncfg feature. + To troubleshoot issues with the `prometheus` collector, run the `go.d.plugin` with the debug option enabled. The output should give you clues as to why the collector isn't working. @@ -288,4 +289,37 @@ should give you clues as to why the collector isn't working. ./go.d.plugin -d -m prometheus ``` +### Getting Logs + +If you're encountering problems with the `prometheus` collector, follow these steps to retrieve logs and identify potential issues: + +- **Run the command** specific to your system (systemd, non-systemd, or Docker container). +- **Examine the output** for any warnings or error messages that might indicate issues. These messages should provide clues about the root cause of the problem. + +#### System with systemd + +Use the following command to view logs generated since the last Netdata service restart: + +```bash +journalctl _SYSTEMD_INVOCATION_ID="$(systemctl show --value --property=InvocationID netdata)" --namespace=netdata --grep prometheus +``` + +#### System without systemd + +Locate the collector log file, typically at `/var/log/netdata/collector.log`, and use `grep` to filter for collector's name: + +```bash +grep prometheus /var/log/netdata/collector.log +``` + +**Note**: This method shows logs from all restarts. Focus on the **latest entries** for troubleshooting current issues. + +#### Docker Container + +If your Netdata runs in a Docker container named "netdata" (replace if different), use this command: + +```bash +docker logs netdata 2>&1 | grep prometheus +``` + diff --git a/src/go/collectors/go.d.plugin/modules/prometheus/integrations/stream.md b/src/go/plugin/go.d/modules/prometheus/integrations/stream.md index d1902ab8a..fb21cb4da 100644 --- a/src/go/collectors/go.d.plugin/modules/prometheus/integrations/stream.md +++ b/src/go/plugin/go.d/modules/prometheus/integrations/stream.md @@ -1,6 +1,6 @@ <!--startmeta -custom_edit_url: "https://github.com/netdata/netdata/edit/master/src/go/collectors/go.d.plugin/modules/prometheus/integrations/stream.md" -meta_yaml: "https://github.com/netdata/netdata/edit/master/src/go/collectors/go.d.plugin/modules/prometheus/metadata.yaml" +custom_edit_url: "https://github.com/netdata/netdata/edit/master/src/go/plugin/go.d/modules/prometheus/integrations/stream.md" +meta_yaml: "https://github.com/netdata/netdata/edit/master/src/go/plugin/go.d/modules/prometheus/metadata.yaml" sidebar_label: "Stream" learn_status: "Published" learn_rel_path: "Collecting Metrics/Media Services" @@ -37,7 +37,6 @@ This collector supports collecting metrics from multiple instances of this integ #### Auto-Detection By default, it detects instances running on the local host by trying to connect to known ports that are [allocated to exporters](https://github.com/prometheus/prometheus/wiki/Default-port-allocations). -The full list of endpoints is available in the collector's [configuration file](https://github.com/netdata/netdata/blob/master/src/go/collectors/go.d.plugin/config/go.d/prometheus.conf). #### Limits @@ -138,7 +137,7 @@ The following options can be defined globally: update_every, autodetection_retry This option allows you to filter out unwanted time series. Only metrics matching the selector will be collected. - Logic: (pattern1 OR pattern2) AND !(pattern3 or pattern4) -- Pattern syntax: [selector](/src/go/collectors/go.d.plugin/pkg/prometheus/selector/README.md). +- Pattern syntax: [selector](/src/go/plugin/go.d/pkg/prometheus/selector/README.md). - Option syntax: ```yaml @@ -266,6 +265,8 @@ jobs: ### Debug Mode +**Important**: Debug mode is not supported for data collection jobs created via the UI using the Dyncfg feature. + To troubleshoot issues with the `prometheus` collector, run the `go.d.plugin` with the debug option enabled. The output should give you clues as to why the collector isn't working. @@ -288,4 +289,37 @@ should give you clues as to why the collector isn't working. ./go.d.plugin -d -m prometheus ``` +### Getting Logs + +If you're encountering problems with the `prometheus` collector, follow these steps to retrieve logs and identify potential issues: + +- **Run the command** specific to your system (systemd, non-systemd, or Docker container). +- **Examine the output** for any warnings or error messages that might indicate issues. These messages should provide clues about the root cause of the problem. + +#### System with systemd + +Use the following command to view logs generated since the last Netdata service restart: + +```bash +journalctl _SYSTEMD_INVOCATION_ID="$(systemctl show --value --property=InvocationID netdata)" --namespace=netdata --grep prometheus +``` + +#### System without systemd + +Locate the collector log file, typically at `/var/log/netdata/collector.log`, and use `grep` to filter for collector's name: + +```bash +grep prometheus /var/log/netdata/collector.log +``` + +**Note**: This method shows logs from all restarts. Focus on the **latest entries** for troubleshooting current issues. + +#### Docker Container + +If your Netdata runs in a Docker container named "netdata" (replace if different), use this command: + +```bash +docker logs netdata 2>&1 | grep prometheus +``` + diff --git a/src/go/collectors/go.d.plugin/modules/prometheus/integrations/strongswan.md b/src/go/plugin/go.d/modules/prometheus/integrations/strongswan.md index 234fe4507..ffddfb022 100644 --- a/src/go/collectors/go.d.plugin/modules/prometheus/integrations/strongswan.md +++ b/src/go/plugin/go.d/modules/prometheus/integrations/strongswan.md @@ -1,6 +1,6 @@ <!--startmeta -custom_edit_url: "https://github.com/netdata/netdata/edit/master/src/go/collectors/go.d.plugin/modules/prometheus/integrations/strongswan.md" -meta_yaml: "https://github.com/netdata/netdata/edit/master/src/go/collectors/go.d.plugin/modules/prometheus/metadata.yaml" +custom_edit_url: "https://github.com/netdata/netdata/edit/master/src/go/plugin/go.d/modules/prometheus/integrations/strongswan.md" +meta_yaml: "https://github.com/netdata/netdata/edit/master/src/go/plugin/go.d/modules/prometheus/metadata.yaml" sidebar_label: "strongSwan" learn_status: "Published" learn_rel_path: "Collecting Metrics/VPNs" @@ -37,7 +37,6 @@ This collector supports collecting metrics from multiple instances of this integ #### Auto-Detection By default, it detects instances running on the local host by trying to connect to known ports that are [allocated to exporters](https://github.com/prometheus/prometheus/wiki/Default-port-allocations). -The full list of endpoints is available in the collector's [configuration file](https://github.com/netdata/netdata/blob/master/src/go/collectors/go.d.plugin/config/go.d/prometheus.conf). #### Limits @@ -138,7 +137,7 @@ The following options can be defined globally: update_every, autodetection_retry This option allows you to filter out unwanted time series. Only metrics matching the selector will be collected. - Logic: (pattern1 OR pattern2) AND !(pattern3 or pattern4) -- Pattern syntax: [selector](/src/go/collectors/go.d.plugin/pkg/prometheus/selector/README.md). +- Pattern syntax: [selector](/src/go/plugin/go.d/pkg/prometheus/selector/README.md). - Option syntax: ```yaml @@ -266,6 +265,8 @@ jobs: ### Debug Mode +**Important**: Debug mode is not supported for data collection jobs created via the UI using the Dyncfg feature. + To troubleshoot issues with the `prometheus` collector, run the `go.d.plugin` with the debug option enabled. The output should give you clues as to why the collector isn't working. @@ -288,4 +289,37 @@ should give you clues as to why the collector isn't working. ./go.d.plugin -d -m prometheus ``` +### Getting Logs + +If you're encountering problems with the `prometheus` collector, follow these steps to retrieve logs and identify potential issues: + +- **Run the command** specific to your system (systemd, non-systemd, or Docker container). +- **Examine the output** for any warnings or error messages that might indicate issues. These messages should provide clues about the root cause of the problem. + +#### System with systemd + +Use the following command to view logs generated since the last Netdata service restart: + +```bash +journalctl _SYSTEMD_INVOCATION_ID="$(systemctl show --value --property=InvocationID netdata)" --namespace=netdata --grep prometheus +``` + +#### System without systemd + +Locate the collector log file, typically at `/var/log/netdata/collector.log`, and use `grep` to filter for collector's name: + +```bash +grep prometheus /var/log/netdata/collector.log +``` + +**Note**: This method shows logs from all restarts. Focus on the **latest entries** for troubleshooting current issues. + +#### Docker Container + +If your Netdata runs in a Docker container named "netdata" (replace if different), use this command: + +```bash +docker logs netdata 2>&1 | grep prometheus +``` + diff --git a/src/go/collectors/go.d.plugin/modules/prometheus/integrations/sunspec_solar_energy.md b/src/go/plugin/go.d/modules/prometheus/integrations/sunspec_solar_energy.md index fad103072..552c5583b 100644 --- a/src/go/collectors/go.d.plugin/modules/prometheus/integrations/sunspec_solar_energy.md +++ b/src/go/plugin/go.d/modules/prometheus/integrations/sunspec_solar_energy.md @@ -1,6 +1,6 @@ <!--startmeta -custom_edit_url: "https://github.com/netdata/netdata/edit/master/src/go/collectors/go.d.plugin/modules/prometheus/integrations/sunspec_solar_energy.md" -meta_yaml: "https://github.com/netdata/netdata/edit/master/src/go/collectors/go.d.plugin/modules/prometheus/metadata.yaml" +custom_edit_url: "https://github.com/netdata/netdata/edit/master/src/go/plugin/go.d/modules/prometheus/integrations/sunspec_solar_energy.md" +meta_yaml: "https://github.com/netdata/netdata/edit/master/src/go/plugin/go.d/modules/prometheus/metadata.yaml" sidebar_label: "Sunspec Solar Energy" learn_status: "Published" learn_rel_path: "Collecting Metrics/IoT Devices" @@ -37,7 +37,6 @@ This collector supports collecting metrics from multiple instances of this integ #### Auto-Detection By default, it detects instances running on the local host by trying to connect to known ports that are [allocated to exporters](https://github.com/prometheus/prometheus/wiki/Default-port-allocations). -The full list of endpoints is available in the collector's [configuration file](https://github.com/netdata/netdata/blob/master/src/go/collectors/go.d.plugin/config/go.d/prometheus.conf). #### Limits @@ -138,7 +137,7 @@ The following options can be defined globally: update_every, autodetection_retry This option allows you to filter out unwanted time series. Only metrics matching the selector will be collected. - Logic: (pattern1 OR pattern2) AND !(pattern3 or pattern4) -- Pattern syntax: [selector](/src/go/collectors/go.d.plugin/pkg/prometheus/selector/README.md). +- Pattern syntax: [selector](/src/go/plugin/go.d/pkg/prometheus/selector/README.md). - Option syntax: ```yaml @@ -266,6 +265,8 @@ jobs: ### Debug Mode +**Important**: Debug mode is not supported for data collection jobs created via the UI using the Dyncfg feature. + To troubleshoot issues with the `prometheus` collector, run the `go.d.plugin` with the debug option enabled. The output should give you clues as to why the collector isn't working. @@ -288,4 +289,37 @@ should give you clues as to why the collector isn't working. ./go.d.plugin -d -m prometheus ``` +### Getting Logs + +If you're encountering problems with the `prometheus` collector, follow these steps to retrieve logs and identify potential issues: + +- **Run the command** specific to your system (systemd, non-systemd, or Docker container). +- **Examine the output** for any warnings or error messages that might indicate issues. These messages should provide clues about the root cause of the problem. + +#### System with systemd + +Use the following command to view logs generated since the last Netdata service restart: + +```bash +journalctl _SYSTEMD_INVOCATION_ID="$(systemctl show --value --property=InvocationID netdata)" --namespace=netdata --grep prometheus +``` + +#### System without systemd + +Locate the collector log file, typically at `/var/log/netdata/collector.log`, and use `grep` to filter for collector's name: + +```bash +grep prometheus /var/log/netdata/collector.log +``` + +**Note**: This method shows logs from all restarts. Focus on the **latest entries** for troubleshooting current issues. + +#### Docker Container + +If your Netdata runs in a Docker container named "netdata" (replace if different), use this command: + +```bash +docker logs netdata 2>&1 | grep prometheus +``` + diff --git a/src/go/collectors/go.d.plugin/modules/prometheus/integrations/suricata.md b/src/go/plugin/go.d/modules/prometheus/integrations/suricata.md index 0f6fbd1e6..d5bdd01b5 100644 --- a/src/go/collectors/go.d.plugin/modules/prometheus/integrations/suricata.md +++ b/src/go/plugin/go.d/modules/prometheus/integrations/suricata.md @@ -1,6 +1,6 @@ <!--startmeta -custom_edit_url: "https://github.com/netdata/netdata/edit/master/src/go/collectors/go.d.plugin/modules/prometheus/integrations/suricata.md" -meta_yaml: "https://github.com/netdata/netdata/edit/master/src/go/collectors/go.d.plugin/modules/prometheus/metadata.yaml" +custom_edit_url: "https://github.com/netdata/netdata/edit/master/src/go/plugin/go.d/modules/prometheus/integrations/suricata.md" +meta_yaml: "https://github.com/netdata/netdata/edit/master/src/go/plugin/go.d/modules/prometheus/metadata.yaml" sidebar_label: "Suricata" learn_status: "Published" learn_rel_path: "Collecting Metrics/Security Systems" @@ -37,7 +37,6 @@ This collector supports collecting metrics from multiple instances of this integ #### Auto-Detection By default, it detects instances running on the local host by trying to connect to known ports that are [allocated to exporters](https://github.com/prometheus/prometheus/wiki/Default-port-allocations). -The full list of endpoints is available in the collector's [configuration file](https://github.com/netdata/netdata/blob/master/src/go/collectors/go.d.plugin/config/go.d/prometheus.conf). #### Limits @@ -138,7 +137,7 @@ The following options can be defined globally: update_every, autodetection_retry This option allows you to filter out unwanted time series. Only metrics matching the selector will be collected. - Logic: (pattern1 OR pattern2) AND !(pattern3 or pattern4) -- Pattern syntax: [selector](/src/go/collectors/go.d.plugin/pkg/prometheus/selector/README.md). +- Pattern syntax: [selector](/src/go/plugin/go.d/pkg/prometheus/selector/README.md). - Option syntax: ```yaml @@ -266,6 +265,8 @@ jobs: ### Debug Mode +**Important**: Debug mode is not supported for data collection jobs created via the UI using the Dyncfg feature. + To troubleshoot issues with the `prometheus` collector, run the `go.d.plugin` with the debug option enabled. The output should give you clues as to why the collector isn't working. @@ -288,4 +289,37 @@ should give you clues as to why the collector isn't working. ./go.d.plugin -d -m prometheus ``` +### Getting Logs + +If you're encountering problems with the `prometheus` collector, follow these steps to retrieve logs and identify potential issues: + +- **Run the command** specific to your system (systemd, non-systemd, or Docker container). +- **Examine the output** for any warnings or error messages that might indicate issues. These messages should provide clues about the root cause of the problem. + +#### System with systemd + +Use the following command to view logs generated since the last Netdata service restart: + +```bash +journalctl _SYSTEMD_INVOCATION_ID="$(systemctl show --value --property=InvocationID netdata)" --namespace=netdata --grep prometheus +``` + +#### System without systemd + +Locate the collector log file, typically at `/var/log/netdata/collector.log`, and use `grep` to filter for collector's name: + +```bash +grep prometheus /var/log/netdata/collector.log +``` + +**Note**: This method shows logs from all restarts. Focus on the **latest entries** for troubleshooting current issues. + +#### Docker Container + +If your Netdata runs in a Docker container named "netdata" (replace if different), use this command: + +```bash +docker logs netdata 2>&1 | grep prometheus +``` + diff --git a/src/go/collectors/go.d.plugin/modules/prometheus/integrations/synology_activebackup.md b/src/go/plugin/go.d/modules/prometheus/integrations/synology_activebackup.md index 530f7b911..b558bbf92 100644 --- a/src/go/collectors/go.d.plugin/modules/prometheus/integrations/synology_activebackup.md +++ b/src/go/plugin/go.d/modules/prometheus/integrations/synology_activebackup.md @@ -1,6 +1,6 @@ <!--startmeta -custom_edit_url: "https://github.com/netdata/netdata/edit/master/src/go/collectors/go.d.plugin/modules/prometheus/integrations/synology_activebackup.md" -meta_yaml: "https://github.com/netdata/netdata/edit/master/src/go/collectors/go.d.plugin/modules/prometheus/metadata.yaml" +custom_edit_url: "https://github.com/netdata/netdata/edit/master/src/go/plugin/go.d/modules/prometheus/integrations/synology_activebackup.md" +meta_yaml: "https://github.com/netdata/netdata/edit/master/src/go/plugin/go.d/modules/prometheus/metadata.yaml" sidebar_label: "Synology ActiveBackup" learn_status: "Published" learn_rel_path: "Collecting Metrics/Storage, Mount Points and Filesystems" @@ -37,7 +37,6 @@ This collector supports collecting metrics from multiple instances of this integ #### Auto-Detection By default, it detects instances running on the local host by trying to connect to known ports that are [allocated to exporters](https://github.com/prometheus/prometheus/wiki/Default-port-allocations). -The full list of endpoints is available in the collector's [configuration file](https://github.com/netdata/netdata/blob/master/src/go/collectors/go.d.plugin/config/go.d/prometheus.conf). #### Limits @@ -138,7 +137,7 @@ The following options can be defined globally: update_every, autodetection_retry This option allows you to filter out unwanted time series. Only metrics matching the selector will be collected. - Logic: (pattern1 OR pattern2) AND !(pattern3 or pattern4) -- Pattern syntax: [selector](/src/go/collectors/go.d.plugin/pkg/prometheus/selector/README.md). +- Pattern syntax: [selector](/src/go/plugin/go.d/pkg/prometheus/selector/README.md). - Option syntax: ```yaml @@ -266,6 +265,8 @@ jobs: ### Debug Mode +**Important**: Debug mode is not supported for data collection jobs created via the UI using the Dyncfg feature. + To troubleshoot issues with the `prometheus` collector, run the `go.d.plugin` with the debug option enabled. The output should give you clues as to why the collector isn't working. @@ -288,4 +289,37 @@ should give you clues as to why the collector isn't working. ./go.d.plugin -d -m prometheus ``` +### Getting Logs + +If you're encountering problems with the `prometheus` collector, follow these steps to retrieve logs and identify potential issues: + +- **Run the command** specific to your system (systemd, non-systemd, or Docker container). +- **Examine the output** for any warnings or error messages that might indicate issues. These messages should provide clues about the root cause of the problem. + +#### System with systemd + +Use the following command to view logs generated since the last Netdata service restart: + +```bash +journalctl _SYSTEMD_INVOCATION_ID="$(systemctl show --value --property=InvocationID netdata)" --namespace=netdata --grep prometheus +``` + +#### System without systemd + +Locate the collector log file, typically at `/var/log/netdata/collector.log`, and use `grep` to filter for collector's name: + +```bash +grep prometheus /var/log/netdata/collector.log +``` + +**Note**: This method shows logs from all restarts. Focus on the **latest entries** for troubleshooting current issues. + +#### Docker Container + +If your Netdata runs in a Docker container named "netdata" (replace if different), use this command: + +```bash +docker logs netdata 2>&1 | grep prometheus +``` + diff --git a/src/go/collectors/go.d.plugin/modules/prometheus/integrations/sysload.md b/src/go/plugin/go.d/modules/prometheus/integrations/sysload.md index f697caa32..369a43020 100644 --- a/src/go/collectors/go.d.plugin/modules/prometheus/integrations/sysload.md +++ b/src/go/plugin/go.d/modules/prometheus/integrations/sysload.md @@ -1,6 +1,6 @@ <!--startmeta -custom_edit_url: "https://github.com/netdata/netdata/edit/master/src/go/collectors/go.d.plugin/modules/prometheus/integrations/sysload.md" -meta_yaml: "https://github.com/netdata/netdata/edit/master/src/go/collectors/go.d.plugin/modules/prometheus/metadata.yaml" +custom_edit_url: "https://github.com/netdata/netdata/edit/master/src/go/plugin/go.d/modules/prometheus/integrations/sysload.md" +meta_yaml: "https://github.com/netdata/netdata/edit/master/src/go/plugin/go.d/modules/prometheus/metadata.yaml" sidebar_label: "Sysload" learn_status: "Published" learn_rel_path: "Collecting Metrics/APM" @@ -37,7 +37,6 @@ This collector supports collecting metrics from multiple instances of this integ #### Auto-Detection By default, it detects instances running on the local host by trying to connect to known ports that are [allocated to exporters](https://github.com/prometheus/prometheus/wiki/Default-port-allocations). -The full list of endpoints is available in the collector's [configuration file](https://github.com/netdata/netdata/blob/master/src/go/collectors/go.d.plugin/config/go.d/prometheus.conf). #### Limits @@ -138,7 +137,7 @@ The following options can be defined globally: update_every, autodetection_retry This option allows you to filter out unwanted time series. Only metrics matching the selector will be collected. - Logic: (pattern1 OR pattern2) AND !(pattern3 or pattern4) -- Pattern syntax: [selector](/src/go/collectors/go.d.plugin/pkg/prometheus/selector/README.md). +- Pattern syntax: [selector](/src/go/plugin/go.d/pkg/prometheus/selector/README.md). - Option syntax: ```yaml @@ -266,6 +265,8 @@ jobs: ### Debug Mode +**Important**: Debug mode is not supported for data collection jobs created via the UI using the Dyncfg feature. + To troubleshoot issues with the `prometheus` collector, run the `go.d.plugin` with the debug option enabled. The output should give you clues as to why the collector isn't working. @@ -288,4 +289,37 @@ should give you clues as to why the collector isn't working. ./go.d.plugin -d -m prometheus ``` +### Getting Logs + +If you're encountering problems with the `prometheus` collector, follow these steps to retrieve logs and identify potential issues: + +- **Run the command** specific to your system (systemd, non-systemd, or Docker container). +- **Examine the output** for any warnings or error messages that might indicate issues. These messages should provide clues about the root cause of the problem. + +#### System with systemd + +Use the following command to view logs generated since the last Netdata service restart: + +```bash +journalctl _SYSTEMD_INVOCATION_ID="$(systemctl show --value --property=InvocationID netdata)" --namespace=netdata --grep prometheus +``` + +#### System without systemd + +Locate the collector log file, typically at `/var/log/netdata/collector.log`, and use `grep` to filter for collector's name: + +```bash +grep prometheus /var/log/netdata/collector.log +``` + +**Note**: This method shows logs from all restarts. Focus on the **latest entries** for troubleshooting current issues. + +#### Docker Container + +If your Netdata runs in a Docker container named "netdata" (replace if different), use this command: + +```bash +docker logs netdata 2>&1 | grep prometheus +``` + diff --git a/src/go/collectors/go.d.plugin/modules/prometheus/integrations/t-rex_nvidia_gpu_miner.md b/src/go/plugin/go.d/modules/prometheus/integrations/t-rex_nvidia_gpu_miner.md index 79a23a669..55b26bf9c 100644 --- a/src/go/collectors/go.d.plugin/modules/prometheus/integrations/t-rex_nvidia_gpu_miner.md +++ b/src/go/plugin/go.d/modules/prometheus/integrations/t-rex_nvidia_gpu_miner.md @@ -1,6 +1,6 @@ <!--startmeta -custom_edit_url: "https://github.com/netdata/netdata/edit/master/src/go/collectors/go.d.plugin/modules/prometheus/integrations/t-rex_nvidia_gpu_miner.md" -meta_yaml: "https://github.com/netdata/netdata/edit/master/src/go/collectors/go.d.plugin/modules/prometheus/metadata.yaml" +custom_edit_url: "https://github.com/netdata/netdata/edit/master/src/go/plugin/go.d/modules/prometheus/integrations/t-rex_nvidia_gpu_miner.md" +meta_yaml: "https://github.com/netdata/netdata/edit/master/src/go/plugin/go.d/modules/prometheus/metadata.yaml" sidebar_label: "T-Rex NVIDIA GPU Miner" learn_status: "Published" learn_rel_path: "Collecting Metrics/Hardware Devices and Sensors" @@ -37,7 +37,6 @@ This collector supports collecting metrics from multiple instances of this integ #### Auto-Detection By default, it detects instances running on the local host by trying to connect to known ports that are [allocated to exporters](https://github.com/prometheus/prometheus/wiki/Default-port-allocations). -The full list of endpoints is available in the collector's [configuration file](https://github.com/netdata/netdata/blob/master/src/go/collectors/go.d.plugin/config/go.d/prometheus.conf). #### Limits @@ -138,7 +137,7 @@ The following options can be defined globally: update_every, autodetection_retry This option allows you to filter out unwanted time series. Only metrics matching the selector will be collected. - Logic: (pattern1 OR pattern2) AND !(pattern3 or pattern4) -- Pattern syntax: [selector](/src/go/collectors/go.d.plugin/pkg/prometheus/selector/README.md). +- Pattern syntax: [selector](/src/go/plugin/go.d/pkg/prometheus/selector/README.md). - Option syntax: ```yaml @@ -266,6 +265,8 @@ jobs: ### Debug Mode +**Important**: Debug mode is not supported for data collection jobs created via the UI using the Dyncfg feature. + To troubleshoot issues with the `prometheus` collector, run the `go.d.plugin` with the debug option enabled. The output should give you clues as to why the collector isn't working. @@ -288,4 +289,37 @@ should give you clues as to why the collector isn't working. ./go.d.plugin -d -m prometheus ``` +### Getting Logs + +If you're encountering problems with the `prometheus` collector, follow these steps to retrieve logs and identify potential issues: + +- **Run the command** specific to your system (systemd, non-systemd, or Docker container). +- **Examine the output** for any warnings or error messages that might indicate issues. These messages should provide clues about the root cause of the problem. + +#### System with systemd + +Use the following command to view logs generated since the last Netdata service restart: + +```bash +journalctl _SYSTEMD_INVOCATION_ID="$(systemctl show --value --property=InvocationID netdata)" --namespace=netdata --grep prometheus +``` + +#### System without systemd + +Locate the collector log file, typically at `/var/log/netdata/collector.log`, and use `grep` to filter for collector's name: + +```bash +grep prometheus /var/log/netdata/collector.log +``` + +**Note**: This method shows logs from all restarts. Focus on the **latest entries** for troubleshooting current issues. + +#### Docker Container + +If your Netdata runs in a Docker container named "netdata" (replace if different), use this command: + +```bash +docker logs netdata 2>&1 | grep prometheus +``` + diff --git a/src/go/collectors/go.d.plugin/modules/prometheus/integrations/tacacs.md b/src/go/plugin/go.d/modules/prometheus/integrations/tacacs.md index 3443b6ab6..5d3534393 100644 --- a/src/go/collectors/go.d.plugin/modules/prometheus/integrations/tacacs.md +++ b/src/go/plugin/go.d/modules/prometheus/integrations/tacacs.md @@ -1,6 +1,6 @@ <!--startmeta -custom_edit_url: "https://github.com/netdata/netdata/edit/master/src/go/collectors/go.d.plugin/modules/prometheus/integrations/tacacs.md" -meta_yaml: "https://github.com/netdata/netdata/edit/master/src/go/collectors/go.d.plugin/modules/prometheus/metadata.yaml" +custom_edit_url: "https://github.com/netdata/netdata/edit/master/src/go/plugin/go.d/modules/prometheus/integrations/tacacs.md" +meta_yaml: "https://github.com/netdata/netdata/edit/master/src/go/plugin/go.d/modules/prometheus/metadata.yaml" sidebar_label: "TACACS" learn_status: "Published" learn_rel_path: "Collecting Metrics/Authentication and Authorization" @@ -37,7 +37,6 @@ This collector supports collecting metrics from multiple instances of this integ #### Auto-Detection By default, it detects instances running on the local host by trying to connect to known ports that are [allocated to exporters](https://github.com/prometheus/prometheus/wiki/Default-port-allocations). -The full list of endpoints is available in the collector's [configuration file](https://github.com/netdata/netdata/blob/master/src/go/collectors/go.d.plugin/config/go.d/prometheus.conf). #### Limits @@ -138,7 +137,7 @@ The following options can be defined globally: update_every, autodetection_retry This option allows you to filter out unwanted time series. Only metrics matching the selector will be collected. - Logic: (pattern1 OR pattern2) AND !(pattern3 or pattern4) -- Pattern syntax: [selector](/src/go/collectors/go.d.plugin/pkg/prometheus/selector/README.md). +- Pattern syntax: [selector](/src/go/plugin/go.d/pkg/prometheus/selector/README.md). - Option syntax: ```yaml @@ -266,6 +265,8 @@ jobs: ### Debug Mode +**Important**: Debug mode is not supported for data collection jobs created via the UI using the Dyncfg feature. + To troubleshoot issues with the `prometheus` collector, run the `go.d.plugin` with the debug option enabled. The output should give you clues as to why the collector isn't working. @@ -288,4 +289,37 @@ should give you clues as to why the collector isn't working. ./go.d.plugin -d -m prometheus ``` +### Getting Logs + +If you're encountering problems with the `prometheus` collector, follow these steps to retrieve logs and identify potential issues: + +- **Run the command** specific to your system (systemd, non-systemd, or Docker container). +- **Examine the output** for any warnings or error messages that might indicate issues. These messages should provide clues about the root cause of the problem. + +#### System with systemd + +Use the following command to view logs generated since the last Netdata service restart: + +```bash +journalctl _SYSTEMD_INVOCATION_ID="$(systemctl show --value --property=InvocationID netdata)" --namespace=netdata --grep prometheus +``` + +#### System without systemd + +Locate the collector log file, typically at `/var/log/netdata/collector.log`, and use `grep` to filter for collector's name: + +```bash +grep prometheus /var/log/netdata/collector.log +``` + +**Note**: This method shows logs from all restarts. Focus on the **latest entries** for troubleshooting current issues. + +#### Docker Container + +If your Netdata runs in a Docker container named "netdata" (replace if different), use this command: + +```bash +docker logs netdata 2>&1 | grep prometheus +``` + diff --git a/src/go/collectors/go.d.plugin/modules/prometheus/integrations/tado_smart_heating_solution.md b/src/go/plugin/go.d/modules/prometheus/integrations/tado_smart_heating_solution.md index f04344451..ece7fb677 100644 --- a/src/go/collectors/go.d.plugin/modules/prometheus/integrations/tado_smart_heating_solution.md +++ b/src/go/plugin/go.d/modules/prometheus/integrations/tado_smart_heating_solution.md @@ -1,6 +1,6 @@ <!--startmeta -custom_edit_url: "https://github.com/netdata/netdata/edit/master/src/go/collectors/go.d.plugin/modules/prometheus/integrations/tado_smart_heating_solution.md" -meta_yaml: "https://github.com/netdata/netdata/edit/master/src/go/collectors/go.d.plugin/modules/prometheus/metadata.yaml" +custom_edit_url: "https://github.com/netdata/netdata/edit/master/src/go/plugin/go.d/modules/prometheus/integrations/tado_smart_heating_solution.md" +meta_yaml: "https://github.com/netdata/netdata/edit/master/src/go/plugin/go.d/modules/prometheus/metadata.yaml" sidebar_label: "Tado smart heating solution" learn_status: "Published" learn_rel_path: "Collecting Metrics/IoT Devices" @@ -37,7 +37,6 @@ This collector supports collecting metrics from multiple instances of this integ #### Auto-Detection By default, it detects instances running on the local host by trying to connect to known ports that are [allocated to exporters](https://github.com/prometheus/prometheus/wiki/Default-port-allocations). -The full list of endpoints is available in the collector's [configuration file](https://github.com/netdata/netdata/blob/master/src/go/collectors/go.d.plugin/config/go.d/prometheus.conf). #### Limits @@ -138,7 +137,7 @@ The following options can be defined globally: update_every, autodetection_retry This option allows you to filter out unwanted time series. Only metrics matching the selector will be collected. - Logic: (pattern1 OR pattern2) AND !(pattern3 or pattern4) -- Pattern syntax: [selector](/src/go/collectors/go.d.plugin/pkg/prometheus/selector/README.md). +- Pattern syntax: [selector](/src/go/plugin/go.d/pkg/prometheus/selector/README.md). - Option syntax: ```yaml @@ -266,6 +265,8 @@ jobs: ### Debug Mode +**Important**: Debug mode is not supported for data collection jobs created via the UI using the Dyncfg feature. + To troubleshoot issues with the `prometheus` collector, run the `go.d.plugin` with the debug option enabled. The output should give you clues as to why the collector isn't working. @@ -288,4 +289,37 @@ should give you clues as to why the collector isn't working. ./go.d.plugin -d -m prometheus ``` +### Getting Logs + +If you're encountering problems with the `prometheus` collector, follow these steps to retrieve logs and identify potential issues: + +- **Run the command** specific to your system (systemd, non-systemd, or Docker container). +- **Examine the output** for any warnings or error messages that might indicate issues. These messages should provide clues about the root cause of the problem. + +#### System with systemd + +Use the following command to view logs generated since the last Netdata service restart: + +```bash +journalctl _SYSTEMD_INVOCATION_ID="$(systemctl show --value --property=InvocationID netdata)" --namespace=netdata --grep prometheus +``` + +#### System without systemd + +Locate the collector log file, typically at `/var/log/netdata/collector.log`, and use `grep` to filter for collector's name: + +```bash +grep prometheus /var/log/netdata/collector.log +``` + +**Note**: This method shows logs from all restarts. Focus on the **latest entries** for troubleshooting current issues. + +#### Docker Container + +If your Netdata runs in a Docker container named "netdata" (replace if different), use this command: + +```bash +docker logs netdata 2>&1 | grep prometheus +``` + diff --git a/src/go/collectors/go.d.plugin/modules/prometheus/integrations/tankerkoenig_api.md b/src/go/plugin/go.d/modules/prometheus/integrations/tankerkoenig_api.md index 5911debe6..01eb6557a 100644 --- a/src/go/collectors/go.d.plugin/modules/prometheus/integrations/tankerkoenig_api.md +++ b/src/go/plugin/go.d/modules/prometheus/integrations/tankerkoenig_api.md @@ -1,6 +1,6 @@ <!--startmeta -custom_edit_url: "https://github.com/netdata/netdata/edit/master/src/go/collectors/go.d.plugin/modules/prometheus/integrations/tankerkoenig_api.md" -meta_yaml: "https://github.com/netdata/netdata/edit/master/src/go/collectors/go.d.plugin/modules/prometheus/metadata.yaml" +custom_edit_url: "https://github.com/netdata/netdata/edit/master/src/go/plugin/go.d/modules/prometheus/integrations/tankerkoenig_api.md" +meta_yaml: "https://github.com/netdata/netdata/edit/master/src/go/plugin/go.d/modules/prometheus/metadata.yaml" sidebar_label: "Tankerkoenig API" learn_status: "Published" learn_rel_path: "Collecting Metrics/Generic Collecting Metrics" @@ -37,7 +37,6 @@ This collector supports collecting metrics from multiple instances of this integ #### Auto-Detection By default, it detects instances running on the local host by trying to connect to known ports that are [allocated to exporters](https://github.com/prometheus/prometheus/wiki/Default-port-allocations). -The full list of endpoints is available in the collector's [configuration file](https://github.com/netdata/netdata/blob/master/src/go/collectors/go.d.plugin/config/go.d/prometheus.conf). #### Limits @@ -138,7 +137,7 @@ The following options can be defined globally: update_every, autodetection_retry This option allows you to filter out unwanted time series. Only metrics matching the selector will be collected. - Logic: (pattern1 OR pattern2) AND !(pattern3 or pattern4) -- Pattern syntax: [selector](/src/go/collectors/go.d.plugin/pkg/prometheus/selector/README.md). +- Pattern syntax: [selector](/src/go/plugin/go.d/pkg/prometheus/selector/README.md). - Option syntax: ```yaml @@ -266,6 +265,8 @@ jobs: ### Debug Mode +**Important**: Debug mode is not supported for data collection jobs created via the UI using the Dyncfg feature. + To troubleshoot issues with the `prometheus` collector, run the `go.d.plugin` with the debug option enabled. The output should give you clues as to why the collector isn't working. @@ -288,4 +289,37 @@ should give you clues as to why the collector isn't working. ./go.d.plugin -d -m prometheus ``` +### Getting Logs + +If you're encountering problems with the `prometheus` collector, follow these steps to retrieve logs and identify potential issues: + +- **Run the command** specific to your system (systemd, non-systemd, or Docker container). +- **Examine the output** for any warnings or error messages that might indicate issues. These messages should provide clues about the root cause of the problem. + +#### System with systemd + +Use the following command to view logs generated since the last Netdata service restart: + +```bash +journalctl _SYSTEMD_INVOCATION_ID="$(systemctl show --value --property=InvocationID netdata)" --namespace=netdata --grep prometheus +``` + +#### System without systemd + +Locate the collector log file, typically at `/var/log/netdata/collector.log`, and use `grep` to filter for collector's name: + +```bash +grep prometheus /var/log/netdata/collector.log +``` + +**Note**: This method shows logs from all restarts. Focus on the **latest entries** for troubleshooting current issues. + +#### Docker Container + +If your Netdata runs in a Docker container named "netdata" (replace if different), use this command: + +```bash +docker logs netdata 2>&1 | grep prometheus +``` + diff --git a/src/go/collectors/go.d.plugin/modules/prometheus/integrations/tesla_powerwall.md b/src/go/plugin/go.d/modules/prometheus/integrations/tesla_powerwall.md index f1424add3..c24163111 100644 --- a/src/go/collectors/go.d.plugin/modules/prometheus/integrations/tesla_powerwall.md +++ b/src/go/plugin/go.d/modules/prometheus/integrations/tesla_powerwall.md @@ -1,6 +1,6 @@ <!--startmeta -custom_edit_url: "https://github.com/netdata/netdata/edit/master/src/go/collectors/go.d.plugin/modules/prometheus/integrations/tesla_powerwall.md" -meta_yaml: "https://github.com/netdata/netdata/edit/master/src/go/collectors/go.d.plugin/modules/prometheus/metadata.yaml" +custom_edit_url: "https://github.com/netdata/netdata/edit/master/src/go/plugin/go.d/modules/prometheus/integrations/tesla_powerwall.md" +meta_yaml: "https://github.com/netdata/netdata/edit/master/src/go/plugin/go.d/modules/prometheus/metadata.yaml" sidebar_label: "Tesla Powerwall" learn_status: "Published" learn_rel_path: "Collecting Metrics/IoT Devices" @@ -37,7 +37,6 @@ This collector supports collecting metrics from multiple instances of this integ #### Auto-Detection By default, it detects instances running on the local host by trying to connect to known ports that are [allocated to exporters](https://github.com/prometheus/prometheus/wiki/Default-port-allocations). -The full list of endpoints is available in the collector's [configuration file](https://github.com/netdata/netdata/blob/master/src/go/collectors/go.d.plugin/config/go.d/prometheus.conf). #### Limits @@ -138,7 +137,7 @@ The following options can be defined globally: update_every, autodetection_retry This option allows you to filter out unwanted time series. Only metrics matching the selector will be collected. - Logic: (pattern1 OR pattern2) AND !(pattern3 or pattern4) -- Pattern syntax: [selector](/src/go/collectors/go.d.plugin/pkg/prometheus/selector/README.md). +- Pattern syntax: [selector](/src/go/plugin/go.d/pkg/prometheus/selector/README.md). - Option syntax: ```yaml @@ -266,6 +265,8 @@ jobs: ### Debug Mode +**Important**: Debug mode is not supported for data collection jobs created via the UI using the Dyncfg feature. + To troubleshoot issues with the `prometheus` collector, run the `go.d.plugin` with the debug option enabled. The output should give you clues as to why the collector isn't working. @@ -288,4 +289,37 @@ should give you clues as to why the collector isn't working. ./go.d.plugin -d -m prometheus ``` +### Getting Logs + +If you're encountering problems with the `prometheus` collector, follow these steps to retrieve logs and identify potential issues: + +- **Run the command** specific to your system (systemd, non-systemd, or Docker container). +- **Examine the output** for any warnings or error messages that might indicate issues. These messages should provide clues about the root cause of the problem. + +#### System with systemd + +Use the following command to view logs generated since the last Netdata service restart: + +```bash +journalctl _SYSTEMD_INVOCATION_ID="$(systemctl show --value --property=InvocationID netdata)" --namespace=netdata --grep prometheus +``` + +#### System without systemd + +Locate the collector log file, typically at `/var/log/netdata/collector.log`, and use `grep` to filter for collector's name: + +```bash +grep prometheus /var/log/netdata/collector.log +``` + +**Note**: This method shows logs from all restarts. Focus on the **latest entries** for troubleshooting current issues. + +#### Docker Container + +If your Netdata runs in a Docker container named "netdata" (replace if different), use this command: + +```bash +docker logs netdata 2>&1 | grep prometheus +``` + diff --git a/src/go/collectors/go.d.plugin/modules/prometheus/integrations/tesla_vehicle.md b/src/go/plugin/go.d/modules/prometheus/integrations/tesla_vehicle.md index 10f22fbb3..56617affd 100644 --- a/src/go/collectors/go.d.plugin/modules/prometheus/integrations/tesla_vehicle.md +++ b/src/go/plugin/go.d/modules/prometheus/integrations/tesla_vehicle.md @@ -1,6 +1,6 @@ <!--startmeta -custom_edit_url: "https://github.com/netdata/netdata/edit/master/src/go/collectors/go.d.plugin/modules/prometheus/integrations/tesla_vehicle.md" -meta_yaml: "https://github.com/netdata/netdata/edit/master/src/go/collectors/go.d.plugin/modules/prometheus/metadata.yaml" +custom_edit_url: "https://github.com/netdata/netdata/edit/master/src/go/plugin/go.d/modules/prometheus/integrations/tesla_vehicle.md" +meta_yaml: "https://github.com/netdata/netdata/edit/master/src/go/plugin/go.d/modules/prometheus/metadata.yaml" sidebar_label: "Tesla vehicle" learn_status: "Published" learn_rel_path: "Collecting Metrics/IoT Devices" @@ -37,7 +37,6 @@ This collector supports collecting metrics from multiple instances of this integ #### Auto-Detection By default, it detects instances running on the local host by trying to connect to known ports that are [allocated to exporters](https://github.com/prometheus/prometheus/wiki/Default-port-allocations). -The full list of endpoints is available in the collector's [configuration file](https://github.com/netdata/netdata/blob/master/src/go/collectors/go.d.plugin/config/go.d/prometheus.conf). #### Limits @@ -138,7 +137,7 @@ The following options can be defined globally: update_every, autodetection_retry This option allows you to filter out unwanted time series. Only metrics matching the selector will be collected. - Logic: (pattern1 OR pattern2) AND !(pattern3 or pattern4) -- Pattern syntax: [selector](/src/go/collectors/go.d.plugin/pkg/prometheus/selector/README.md). +- Pattern syntax: [selector](/src/go/plugin/go.d/pkg/prometheus/selector/README.md). - Option syntax: ```yaml @@ -266,6 +265,8 @@ jobs: ### Debug Mode +**Important**: Debug mode is not supported for data collection jobs created via the UI using the Dyncfg feature. + To troubleshoot issues with the `prometheus` collector, run the `go.d.plugin` with the debug option enabled. The output should give you clues as to why the collector isn't working. @@ -288,4 +289,37 @@ should give you clues as to why the collector isn't working. ./go.d.plugin -d -m prometheus ``` +### Getting Logs + +If you're encountering problems with the `prometheus` collector, follow these steps to retrieve logs and identify potential issues: + +- **Run the command** specific to your system (systemd, non-systemd, or Docker container). +- **Examine the output** for any warnings or error messages that might indicate issues. These messages should provide clues about the root cause of the problem. + +#### System with systemd + +Use the following command to view logs generated since the last Netdata service restart: + +```bash +journalctl _SYSTEMD_INVOCATION_ID="$(systemctl show --value --property=InvocationID netdata)" --namespace=netdata --grep prometheus +``` + +#### System without systemd + +Locate the collector log file, typically at `/var/log/netdata/collector.log`, and use `grep` to filter for collector's name: + +```bash +grep prometheus /var/log/netdata/collector.log +``` + +**Note**: This method shows logs from all restarts. Focus on the **latest entries** for troubleshooting current issues. + +#### Docker Container + +If your Netdata runs in a Docker container named "netdata" (replace if different), use this command: + +```bash +docker logs netdata 2>&1 | grep prometheus +``` + diff --git a/src/go/collectors/go.d.plugin/modules/prometheus/integrations/tesla_wall_connector.md b/src/go/plugin/go.d/modules/prometheus/integrations/tesla_wall_connector.md index d2a12b295..8e3c0e901 100644 --- a/src/go/collectors/go.d.plugin/modules/prometheus/integrations/tesla_wall_connector.md +++ b/src/go/plugin/go.d/modules/prometheus/integrations/tesla_wall_connector.md @@ -1,6 +1,6 @@ <!--startmeta -custom_edit_url: "https://github.com/netdata/netdata/edit/master/src/go/collectors/go.d.plugin/modules/prometheus/integrations/tesla_wall_connector.md" -meta_yaml: "https://github.com/netdata/netdata/edit/master/src/go/collectors/go.d.plugin/modules/prometheus/metadata.yaml" +custom_edit_url: "https://github.com/netdata/netdata/edit/master/src/go/plugin/go.d/modules/prometheus/integrations/tesla_wall_connector.md" +meta_yaml: "https://github.com/netdata/netdata/edit/master/src/go/plugin/go.d/modules/prometheus/metadata.yaml" sidebar_label: "Tesla Wall Connector" learn_status: "Published" learn_rel_path: "Collecting Metrics/IoT Devices" @@ -37,7 +37,6 @@ This collector supports collecting metrics from multiple instances of this integ #### Auto-Detection By default, it detects instances running on the local host by trying to connect to known ports that are [allocated to exporters](https://github.com/prometheus/prometheus/wiki/Default-port-allocations). -The full list of endpoints is available in the collector's [configuration file](https://github.com/netdata/netdata/blob/master/src/go/collectors/go.d.plugin/config/go.d/prometheus.conf). #### Limits @@ -138,7 +137,7 @@ The following options can be defined globally: update_every, autodetection_retry This option allows you to filter out unwanted time series. Only metrics matching the selector will be collected. - Logic: (pattern1 OR pattern2) AND !(pattern3 or pattern4) -- Pattern syntax: [selector](/src/go/collectors/go.d.plugin/pkg/prometheus/selector/README.md). +- Pattern syntax: [selector](/src/go/plugin/go.d/pkg/prometheus/selector/README.md). - Option syntax: ```yaml @@ -266,6 +265,8 @@ jobs: ### Debug Mode +**Important**: Debug mode is not supported for data collection jobs created via the UI using the Dyncfg feature. + To troubleshoot issues with the `prometheus` collector, run the `go.d.plugin` with the debug option enabled. The output should give you clues as to why the collector isn't working. @@ -288,4 +289,37 @@ should give you clues as to why the collector isn't working. ./go.d.plugin -d -m prometheus ``` +### Getting Logs + +If you're encountering problems with the `prometheus` collector, follow these steps to retrieve logs and identify potential issues: + +- **Run the command** specific to your system (systemd, non-systemd, or Docker container). +- **Examine the output** for any warnings or error messages that might indicate issues. These messages should provide clues about the root cause of the problem. + +#### System with systemd + +Use the following command to view logs generated since the last Netdata service restart: + +```bash +journalctl _SYSTEMD_INVOCATION_ID="$(systemctl show --value --property=InvocationID netdata)" --namespace=netdata --grep prometheus +``` + +#### System without systemd + +Locate the collector log file, typically at `/var/log/netdata/collector.log`, and use `grep` to filter for collector's name: + +```bash +grep prometheus /var/log/netdata/collector.log +``` + +**Note**: This method shows logs from all restarts. Focus on the **latest entries** for troubleshooting current issues. + +#### Docker Container + +If your Netdata runs in a Docker container named "netdata" (replace if different), use this command: + +```bash +docker logs netdata 2>&1 | grep prometheus +``` + diff --git a/src/go/collectors/go.d.plugin/modules/prometheus/integrations/tp-link_p110.md b/src/go/plugin/go.d/modules/prometheus/integrations/tp-link_p110.md index 1d835bde6..5dd150413 100644 --- a/src/go/collectors/go.d.plugin/modules/prometheus/integrations/tp-link_p110.md +++ b/src/go/plugin/go.d/modules/prometheus/integrations/tp-link_p110.md @@ -1,6 +1,6 @@ <!--startmeta -custom_edit_url: "https://github.com/netdata/netdata/edit/master/src/go/collectors/go.d.plugin/modules/prometheus/integrations/tp-link_p110.md" -meta_yaml: "https://github.com/netdata/netdata/edit/master/src/go/collectors/go.d.plugin/modules/prometheus/metadata.yaml" +custom_edit_url: "https://github.com/netdata/netdata/edit/master/src/go/plugin/go.d/modules/prometheus/integrations/tp-link_p110.md" +meta_yaml: "https://github.com/netdata/netdata/edit/master/src/go/plugin/go.d/modules/prometheus/metadata.yaml" sidebar_label: "TP-Link P110" learn_status: "Published" learn_rel_path: "Collecting Metrics/IoT Devices" @@ -37,7 +37,6 @@ This collector supports collecting metrics from multiple instances of this integ #### Auto-Detection By default, it detects instances running on the local host by trying to connect to known ports that are [allocated to exporters](https://github.com/prometheus/prometheus/wiki/Default-port-allocations). -The full list of endpoints is available in the collector's [configuration file](https://github.com/netdata/netdata/blob/master/src/go/collectors/go.d.plugin/config/go.d/prometheus.conf). #### Limits @@ -138,7 +137,7 @@ The following options can be defined globally: update_every, autodetection_retry This option allows you to filter out unwanted time series. Only metrics matching the selector will be collected. - Logic: (pattern1 OR pattern2) AND !(pattern3 or pattern4) -- Pattern syntax: [selector](/src/go/collectors/go.d.plugin/pkg/prometheus/selector/README.md). +- Pattern syntax: [selector](/src/go/plugin/go.d/pkg/prometheus/selector/README.md). - Option syntax: ```yaml @@ -266,6 +265,8 @@ jobs: ### Debug Mode +**Important**: Debug mode is not supported for data collection jobs created via the UI using the Dyncfg feature. + To troubleshoot issues with the `prometheus` collector, run the `go.d.plugin` with the debug option enabled. The output should give you clues as to why the collector isn't working. @@ -288,4 +289,37 @@ should give you clues as to why the collector isn't working. ./go.d.plugin -d -m prometheus ``` +### Getting Logs + +If you're encountering problems with the `prometheus` collector, follow these steps to retrieve logs and identify potential issues: + +- **Run the command** specific to your system (systemd, non-systemd, or Docker container). +- **Examine the output** for any warnings or error messages that might indicate issues. These messages should provide clues about the root cause of the problem. + +#### System with systemd + +Use the following command to view logs generated since the last Netdata service restart: + +```bash +journalctl _SYSTEMD_INVOCATION_ID="$(systemctl show --value --property=InvocationID netdata)" --namespace=netdata --grep prometheus +``` + +#### System without systemd + +Locate the collector log file, typically at `/var/log/netdata/collector.log`, and use `grep` to filter for collector's name: + +```bash +grep prometheus /var/log/netdata/collector.log +``` + +**Note**: This method shows logs from all restarts. Focus on the **latest entries** for troubleshooting current issues. + +#### Docker Container + +If your Netdata runs in a Docker container named "netdata" (replace if different), use this command: + +```bash +docker logs netdata 2>&1 | grep prometheus +``` + diff --git a/src/go/collectors/go.d.plugin/modules/prometheus/integrations/traceroute.md b/src/go/plugin/go.d/modules/prometheus/integrations/traceroute.md index d2f8d5c41..0896fd9ca 100644 --- a/src/go/collectors/go.d.plugin/modules/prometheus/integrations/traceroute.md +++ b/src/go/plugin/go.d/modules/prometheus/integrations/traceroute.md @@ -1,6 +1,6 @@ <!--startmeta -custom_edit_url: "https://github.com/netdata/netdata/edit/master/src/go/collectors/go.d.plugin/modules/prometheus/integrations/traceroute.md" -meta_yaml: "https://github.com/netdata/netdata/edit/master/src/go/collectors/go.d.plugin/modules/prometheus/metadata.yaml" +custom_edit_url: "https://github.com/netdata/netdata/edit/master/src/go/plugin/go.d/modules/prometheus/integrations/traceroute.md" +meta_yaml: "https://github.com/netdata/netdata/edit/master/src/go/plugin/go.d/modules/prometheus/metadata.yaml" sidebar_label: "Traceroute" learn_status: "Published" learn_rel_path: "Collecting Metrics/Networking Stack and Network Interfaces" @@ -37,7 +37,6 @@ This collector supports collecting metrics from multiple instances of this integ #### Auto-Detection By default, it detects instances running on the local host by trying to connect to known ports that are [allocated to exporters](https://github.com/prometheus/prometheus/wiki/Default-port-allocations). -The full list of endpoints is available in the collector's [configuration file](https://github.com/netdata/netdata/blob/master/src/go/collectors/go.d.plugin/config/go.d/prometheus.conf). #### Limits @@ -138,7 +137,7 @@ The following options can be defined globally: update_every, autodetection_retry This option allows you to filter out unwanted time series. Only metrics matching the selector will be collected. - Logic: (pattern1 OR pattern2) AND !(pattern3 or pattern4) -- Pattern syntax: [selector](/src/go/collectors/go.d.plugin/pkg/prometheus/selector/README.md). +- Pattern syntax: [selector](/src/go/plugin/go.d/pkg/prometheus/selector/README.md). - Option syntax: ```yaml @@ -266,6 +265,8 @@ jobs: ### Debug Mode +**Important**: Debug mode is not supported for data collection jobs created via the UI using the Dyncfg feature. + To troubleshoot issues with the `prometheus` collector, run the `go.d.plugin` with the debug option enabled. The output should give you clues as to why the collector isn't working. @@ -288,4 +289,37 @@ should give you clues as to why the collector isn't working. ./go.d.plugin -d -m prometheus ``` +### Getting Logs + +If you're encountering problems with the `prometheus` collector, follow these steps to retrieve logs and identify potential issues: + +- **Run the command** specific to your system (systemd, non-systemd, or Docker container). +- **Examine the output** for any warnings or error messages that might indicate issues. These messages should provide clues about the root cause of the problem. + +#### System with systemd + +Use the following command to view logs generated since the last Netdata service restart: + +```bash +journalctl _SYSTEMD_INVOCATION_ID="$(systemctl show --value --property=InvocationID netdata)" --namespace=netdata --grep prometheus +``` + +#### System without systemd + +Locate the collector log file, typically at `/var/log/netdata/collector.log`, and use `grep` to filter for collector's name: + +```bash +grep prometheus /var/log/netdata/collector.log +``` + +**Note**: This method shows logs from all restarts. Focus on the **latest entries** for troubleshooting current issues. + +#### Docker Container + +If your Netdata runs in a Docker container named "netdata" (replace if different), use this command: + +```bash +docker logs netdata 2>&1 | grep prometheus +``` + diff --git a/src/go/collectors/go.d.plugin/modules/prometheus/integrations/twincat_ads_web_service.md b/src/go/plugin/go.d/modules/prometheus/integrations/twincat_ads_web_service.md index 9f8878c65..e276e598d 100644 --- a/src/go/collectors/go.d.plugin/modules/prometheus/integrations/twincat_ads_web_service.md +++ b/src/go/plugin/go.d/modules/prometheus/integrations/twincat_ads_web_service.md @@ -1,6 +1,6 @@ <!--startmeta -custom_edit_url: "https://github.com/netdata/netdata/edit/master/src/go/collectors/go.d.plugin/modules/prometheus/integrations/twincat_ads_web_service.md" -meta_yaml: "https://github.com/netdata/netdata/edit/master/src/go/collectors/go.d.plugin/modules/prometheus/metadata.yaml" +custom_edit_url: "https://github.com/netdata/netdata/edit/master/src/go/plugin/go.d/modules/prometheus/integrations/twincat_ads_web_service.md" +meta_yaml: "https://github.com/netdata/netdata/edit/master/src/go/plugin/go.d/modules/prometheus/metadata.yaml" sidebar_label: "TwinCAT ADS Web Service" learn_status: "Published" learn_rel_path: "Collecting Metrics/Generic Collecting Metrics" @@ -37,7 +37,6 @@ This collector supports collecting metrics from multiple instances of this integ #### Auto-Detection By default, it detects instances running on the local host by trying to connect to known ports that are [allocated to exporters](https://github.com/prometheus/prometheus/wiki/Default-port-allocations). -The full list of endpoints is available in the collector's [configuration file](https://github.com/netdata/netdata/blob/master/src/go/collectors/go.d.plugin/config/go.d/prometheus.conf). #### Limits @@ -138,7 +137,7 @@ The following options can be defined globally: update_every, autodetection_retry This option allows you to filter out unwanted time series. Only metrics matching the selector will be collected. - Logic: (pattern1 OR pattern2) AND !(pattern3 or pattern4) -- Pattern syntax: [selector](/src/go/collectors/go.d.plugin/pkg/prometheus/selector/README.md). +- Pattern syntax: [selector](/src/go/plugin/go.d/pkg/prometheus/selector/README.md). - Option syntax: ```yaml @@ -266,6 +265,8 @@ jobs: ### Debug Mode +**Important**: Debug mode is not supported for data collection jobs created via the UI using the Dyncfg feature. + To troubleshoot issues with the `prometheus` collector, run the `go.d.plugin` with the debug option enabled. The output should give you clues as to why the collector isn't working. @@ -288,4 +289,37 @@ should give you clues as to why the collector isn't working. ./go.d.plugin -d -m prometheus ``` +### Getting Logs + +If you're encountering problems with the `prometheus` collector, follow these steps to retrieve logs and identify potential issues: + +- **Run the command** specific to your system (systemd, non-systemd, or Docker container). +- **Examine the output** for any warnings or error messages that might indicate issues. These messages should provide clues about the root cause of the problem. + +#### System with systemd + +Use the following command to view logs generated since the last Netdata service restart: + +```bash +journalctl _SYSTEMD_INVOCATION_ID="$(systemctl show --value --property=InvocationID netdata)" --namespace=netdata --grep prometheus +``` + +#### System without systemd + +Locate the collector log file, typically at `/var/log/netdata/collector.log`, and use `grep` to filter for collector's name: + +```bash +grep prometheus /var/log/netdata/collector.log +``` + +**Note**: This method shows logs from all restarts. Focus on the **latest entries** for troubleshooting current issues. + +#### Docker Container + +If your Netdata runs in a Docker container named "netdata" (replace if different), use this command: + +```bash +docker logs netdata 2>&1 | grep prometheus +``` + diff --git a/src/go/collectors/go.d.plugin/modules/prometheus/integrations/twitch.md b/src/go/plugin/go.d/modules/prometheus/integrations/twitch.md index 9cf82aaaf..f08f81bd9 100644 --- a/src/go/collectors/go.d.plugin/modules/prometheus/integrations/twitch.md +++ b/src/go/plugin/go.d/modules/prometheus/integrations/twitch.md @@ -1,6 +1,6 @@ <!--startmeta -custom_edit_url: "https://github.com/netdata/netdata/edit/master/src/go/collectors/go.d.plugin/modules/prometheus/integrations/twitch.md" -meta_yaml: "https://github.com/netdata/netdata/edit/master/src/go/collectors/go.d.plugin/modules/prometheus/metadata.yaml" +custom_edit_url: "https://github.com/netdata/netdata/edit/master/src/go/plugin/go.d/modules/prometheus/integrations/twitch.md" +meta_yaml: "https://github.com/netdata/netdata/edit/master/src/go/plugin/go.d/modules/prometheus/metadata.yaml" sidebar_label: "Twitch" learn_status: "Published" learn_rel_path: "Collecting Metrics/Media Services" @@ -37,7 +37,6 @@ This collector supports collecting metrics from multiple instances of this integ #### Auto-Detection By default, it detects instances running on the local host by trying to connect to known ports that are [allocated to exporters](https://github.com/prometheus/prometheus/wiki/Default-port-allocations). -The full list of endpoints is available in the collector's [configuration file](https://github.com/netdata/netdata/blob/master/src/go/collectors/go.d.plugin/config/go.d/prometheus.conf). #### Limits @@ -138,7 +137,7 @@ The following options can be defined globally: update_every, autodetection_retry This option allows you to filter out unwanted time series. Only metrics matching the selector will be collected. - Logic: (pattern1 OR pattern2) AND !(pattern3 or pattern4) -- Pattern syntax: [selector](/src/go/collectors/go.d.plugin/pkg/prometheus/selector/README.md). +- Pattern syntax: [selector](/src/go/plugin/go.d/pkg/prometheus/selector/README.md). - Option syntax: ```yaml @@ -266,6 +265,8 @@ jobs: ### Debug Mode +**Important**: Debug mode is not supported for data collection jobs created via the UI using the Dyncfg feature. + To troubleshoot issues with the `prometheus` collector, run the `go.d.plugin` with the debug option enabled. The output should give you clues as to why the collector isn't working. @@ -288,4 +289,37 @@ should give you clues as to why the collector isn't working. ./go.d.plugin -d -m prometheus ``` +### Getting Logs + +If you're encountering problems with the `prometheus` collector, follow these steps to retrieve logs and identify potential issues: + +- **Run the command** specific to your system (systemd, non-systemd, or Docker container). +- **Examine the output** for any warnings or error messages that might indicate issues. These messages should provide clues about the root cause of the problem. + +#### System with systemd + +Use the following command to view logs generated since the last Netdata service restart: + +```bash +journalctl _SYSTEMD_INVOCATION_ID="$(systemctl show --value --property=InvocationID netdata)" --namespace=netdata --grep prometheus +``` + +#### System without systemd + +Locate the collector log file, typically at `/var/log/netdata/collector.log`, and use `grep` to filter for collector's name: + +```bash +grep prometheus /var/log/netdata/collector.log +``` + +**Note**: This method shows logs from all restarts. Focus on the **latest entries** for troubleshooting current issues. + +#### Docker Container + +If your Netdata runs in a Docker container named "netdata" (replace if different), use this command: + +```bash +docker logs netdata 2>&1 | grep prometheus +``` + diff --git a/src/go/collectors/go.d.plugin/modules/prometheus/integrations/ubiquiti_ufiber_olt.md b/src/go/plugin/go.d/modules/prometheus/integrations/ubiquiti_ufiber_olt.md index d5d978ee2..810ebbea3 100644 --- a/src/go/collectors/go.d.plugin/modules/prometheus/integrations/ubiquiti_ufiber_olt.md +++ b/src/go/plugin/go.d/modules/prometheus/integrations/ubiquiti_ufiber_olt.md @@ -1,6 +1,6 @@ <!--startmeta -custom_edit_url: "https://github.com/netdata/netdata/edit/master/src/go/collectors/go.d.plugin/modules/prometheus/integrations/ubiquiti_ufiber_olt.md" -meta_yaml: "https://github.com/netdata/netdata/edit/master/src/go/collectors/go.d.plugin/modules/prometheus/metadata.yaml" +custom_edit_url: "https://github.com/netdata/netdata/edit/master/src/go/plugin/go.d/modules/prometheus/integrations/ubiquiti_ufiber_olt.md" +meta_yaml: "https://github.com/netdata/netdata/edit/master/src/go/plugin/go.d/modules/prometheus/metadata.yaml" sidebar_label: "Ubiquiti UFiber OLT" learn_status: "Published" learn_rel_path: "Collecting Metrics/Networking Stack and Network Interfaces" @@ -37,7 +37,6 @@ This collector supports collecting metrics from multiple instances of this integ #### Auto-Detection By default, it detects instances running on the local host by trying to connect to known ports that are [allocated to exporters](https://github.com/prometheus/prometheus/wiki/Default-port-allocations). -The full list of endpoints is available in the collector's [configuration file](https://github.com/netdata/netdata/blob/master/src/go/collectors/go.d.plugin/config/go.d/prometheus.conf). #### Limits @@ -138,7 +137,7 @@ The following options can be defined globally: update_every, autodetection_retry This option allows you to filter out unwanted time series. Only metrics matching the selector will be collected. - Logic: (pattern1 OR pattern2) AND !(pattern3 or pattern4) -- Pattern syntax: [selector](/src/go/collectors/go.d.plugin/pkg/prometheus/selector/README.md). +- Pattern syntax: [selector](/src/go/plugin/go.d/pkg/prometheus/selector/README.md). - Option syntax: ```yaml @@ -266,6 +265,8 @@ jobs: ### Debug Mode +**Important**: Debug mode is not supported for data collection jobs created via the UI using the Dyncfg feature. + To troubleshoot issues with the `prometheus` collector, run the `go.d.plugin` with the debug option enabled. The output should give you clues as to why the collector isn't working. @@ -288,4 +289,37 @@ should give you clues as to why the collector isn't working. ./go.d.plugin -d -m prometheus ``` +### Getting Logs + +If you're encountering problems with the `prometheus` collector, follow these steps to retrieve logs and identify potential issues: + +- **Run the command** specific to your system (systemd, non-systemd, or Docker container). +- **Examine the output** for any warnings or error messages that might indicate issues. These messages should provide clues about the root cause of the problem. + +#### System with systemd + +Use the following command to view logs generated since the last Netdata service restart: + +```bash +journalctl _SYSTEMD_INVOCATION_ID="$(systemctl show --value --property=InvocationID netdata)" --namespace=netdata --grep prometheus +``` + +#### System without systemd + +Locate the collector log file, typically at `/var/log/netdata/collector.log`, and use `grep` to filter for collector's name: + +```bash +grep prometheus /var/log/netdata/collector.log +``` + +**Note**: This method shows logs from all restarts. Focus on the **latest entries** for troubleshooting current issues. + +#### Docker Container + +If your Netdata runs in a Docker container named "netdata" (replace if different), use this command: + +```bash +docker logs netdata 2>&1 | grep prometheus +``` + diff --git a/src/go/collectors/go.d.plugin/modules/prometheus/integrations/uptimerobot.md b/src/go/plugin/go.d/modules/prometheus/integrations/uptimerobot.md index fda2004c5..9c6b5395a 100644 --- a/src/go/collectors/go.d.plugin/modules/prometheus/integrations/uptimerobot.md +++ b/src/go/plugin/go.d/modules/prometheus/integrations/uptimerobot.md @@ -1,6 +1,6 @@ <!--startmeta -custom_edit_url: "https://github.com/netdata/netdata/edit/master/src/go/collectors/go.d.plugin/modules/prometheus/integrations/uptimerobot.md" -meta_yaml: "https://github.com/netdata/netdata/edit/master/src/go/collectors/go.d.plugin/modules/prometheus/metadata.yaml" +custom_edit_url: "https://github.com/netdata/netdata/edit/master/src/go/plugin/go.d/modules/prometheus/integrations/uptimerobot.md" +meta_yaml: "https://github.com/netdata/netdata/edit/master/src/go/plugin/go.d/modules/prometheus/metadata.yaml" sidebar_label: "Uptimerobot" learn_status: "Published" learn_rel_path: "Collecting Metrics/Synthetic Checks" @@ -37,7 +37,6 @@ This collector supports collecting metrics from multiple instances of this integ #### Auto-Detection By default, it detects instances running on the local host by trying to connect to known ports that are [allocated to exporters](https://github.com/prometheus/prometheus/wiki/Default-port-allocations). -The full list of endpoints is available in the collector's [configuration file](https://github.com/netdata/netdata/blob/master/src/go/collectors/go.d.plugin/config/go.d/prometheus.conf). #### Limits @@ -138,7 +137,7 @@ The following options can be defined globally: update_every, autodetection_retry This option allows you to filter out unwanted time series. Only metrics matching the selector will be collected. - Logic: (pattern1 OR pattern2) AND !(pattern3 or pattern4) -- Pattern syntax: [selector](/src/go/collectors/go.d.plugin/pkg/prometheus/selector/README.md). +- Pattern syntax: [selector](/src/go/plugin/go.d/pkg/prometheus/selector/README.md). - Option syntax: ```yaml @@ -266,6 +265,8 @@ jobs: ### Debug Mode +**Important**: Debug mode is not supported for data collection jobs created via the UI using the Dyncfg feature. + To troubleshoot issues with the `prometheus` collector, run the `go.d.plugin` with the debug option enabled. The output should give you clues as to why the collector isn't working. @@ -288,4 +289,37 @@ should give you clues as to why the collector isn't working. ./go.d.plugin -d -m prometheus ``` +### Getting Logs + +If you're encountering problems with the `prometheus` collector, follow these steps to retrieve logs and identify potential issues: + +- **Run the command** specific to your system (systemd, non-systemd, or Docker container). +- **Examine the output** for any warnings or error messages that might indicate issues. These messages should provide clues about the root cause of the problem. + +#### System with systemd + +Use the following command to view logs generated since the last Netdata service restart: + +```bash +journalctl _SYSTEMD_INVOCATION_ID="$(systemctl show --value --property=InvocationID netdata)" --namespace=netdata --grep prometheus +``` + +#### System without systemd + +Locate the collector log file, typically at `/var/log/netdata/collector.log`, and use `grep` to filter for collector's name: + +```bash +grep prometheus /var/log/netdata/collector.log +``` + +**Note**: This method shows logs from all restarts. Focus on the **latest entries** for troubleshooting current issues. + +#### Docker Container + +If your Netdata runs in a Docker container named "netdata" (replace if different), use this command: + +```bash +docker logs netdata 2>&1 | grep prometheus +``` + diff --git a/src/go/collectors/go.d.plugin/modules/prometheus/integrations/vault_pki.md b/src/go/plugin/go.d/modules/prometheus/integrations/vault_pki.md index 0954f0849..a7d11cd16 100644 --- a/src/go/collectors/go.d.plugin/modules/prometheus/integrations/vault_pki.md +++ b/src/go/plugin/go.d/modules/prometheus/integrations/vault_pki.md @@ -1,6 +1,6 @@ <!--startmeta -custom_edit_url: "https://github.com/netdata/netdata/edit/master/src/go/collectors/go.d.plugin/modules/prometheus/integrations/vault_pki.md" -meta_yaml: "https://github.com/netdata/netdata/edit/master/src/go/collectors/go.d.plugin/modules/prometheus/metadata.yaml" +custom_edit_url: "https://github.com/netdata/netdata/edit/master/src/go/plugin/go.d/modules/prometheus/integrations/vault_pki.md" +meta_yaml: "https://github.com/netdata/netdata/edit/master/src/go/plugin/go.d/modules/prometheus/metadata.yaml" sidebar_label: "Vault PKI" learn_status: "Published" learn_rel_path: "Collecting Metrics/Security Systems" @@ -37,7 +37,6 @@ This collector supports collecting metrics from multiple instances of this integ #### Auto-Detection By default, it detects instances running on the local host by trying to connect to known ports that are [allocated to exporters](https://github.com/prometheus/prometheus/wiki/Default-port-allocations). -The full list of endpoints is available in the collector's [configuration file](https://github.com/netdata/netdata/blob/master/src/go/collectors/go.d.plugin/config/go.d/prometheus.conf). #### Limits @@ -138,7 +137,7 @@ The following options can be defined globally: update_every, autodetection_retry This option allows you to filter out unwanted time series. Only metrics matching the selector will be collected. - Logic: (pattern1 OR pattern2) AND !(pattern3 or pattern4) -- Pattern syntax: [selector](/src/go/collectors/go.d.plugin/pkg/prometheus/selector/README.md). +- Pattern syntax: [selector](/src/go/plugin/go.d/pkg/prometheus/selector/README.md). - Option syntax: ```yaml @@ -266,6 +265,8 @@ jobs: ### Debug Mode +**Important**: Debug mode is not supported for data collection jobs created via the UI using the Dyncfg feature. + To troubleshoot issues with the `prometheus` collector, run the `go.d.plugin` with the debug option enabled. The output should give you clues as to why the collector isn't working. @@ -288,4 +289,37 @@ should give you clues as to why the collector isn't working. ./go.d.plugin -d -m prometheus ``` +### Getting Logs + +If you're encountering problems with the `prometheus` collector, follow these steps to retrieve logs and identify potential issues: + +- **Run the command** specific to your system (systemd, non-systemd, or Docker container). +- **Examine the output** for any warnings or error messages that might indicate issues. These messages should provide clues about the root cause of the problem. + +#### System with systemd + +Use the following command to view logs generated since the last Netdata service restart: + +```bash +journalctl _SYSTEMD_INVOCATION_ID="$(systemctl show --value --property=InvocationID netdata)" --namespace=netdata --grep prometheus +``` + +#### System without systemd + +Locate the collector log file, typically at `/var/log/netdata/collector.log`, and use `grep` to filter for collector's name: + +```bash +grep prometheus /var/log/netdata/collector.log +``` + +**Note**: This method shows logs from all restarts. Focus on the **latest entries** for troubleshooting current issues. + +#### Docker Container + +If your Netdata runs in a Docker container named "netdata" (replace if different), use this command: + +```bash +docker logs netdata 2>&1 | grep prometheus +``` + diff --git a/src/go/collectors/go.d.plugin/modules/prometheus/integrations/vertica.md b/src/go/plugin/go.d/modules/prometheus/integrations/vertica.md index 666123c8e..8463d713f 100644 --- a/src/go/collectors/go.d.plugin/modules/prometheus/integrations/vertica.md +++ b/src/go/plugin/go.d/modules/prometheus/integrations/vertica.md @@ -1,6 +1,6 @@ <!--startmeta -custom_edit_url: "https://github.com/netdata/netdata/edit/master/src/go/collectors/go.d.plugin/modules/prometheus/integrations/vertica.md" -meta_yaml: "https://github.com/netdata/netdata/edit/master/src/go/collectors/go.d.plugin/modules/prometheus/metadata.yaml" +custom_edit_url: "https://github.com/netdata/netdata/edit/master/src/go/plugin/go.d/modules/prometheus/integrations/vertica.md" +meta_yaml: "https://github.com/netdata/netdata/edit/master/src/go/plugin/go.d/modules/prometheus/metadata.yaml" sidebar_label: "Vertica" learn_status: "Published" learn_rel_path: "Collecting Metrics/Databases" @@ -37,7 +37,6 @@ This collector supports collecting metrics from multiple instances of this integ #### Auto-Detection By default, it detects instances running on the local host by trying to connect to known ports that are [allocated to exporters](https://github.com/prometheus/prometheus/wiki/Default-port-allocations). -The full list of endpoints is available in the collector's [configuration file](https://github.com/netdata/netdata/blob/master/src/go/collectors/go.d.plugin/config/go.d/prometheus.conf). #### Limits @@ -138,7 +137,7 @@ The following options can be defined globally: update_every, autodetection_retry This option allows you to filter out unwanted time series. Only metrics matching the selector will be collected. - Logic: (pattern1 OR pattern2) AND !(pattern3 or pattern4) -- Pattern syntax: [selector](/src/go/collectors/go.d.plugin/pkg/prometheus/selector/README.md). +- Pattern syntax: [selector](/src/go/plugin/go.d/pkg/prometheus/selector/README.md). - Option syntax: ```yaml @@ -266,6 +265,8 @@ jobs: ### Debug Mode +**Important**: Debug mode is not supported for data collection jobs created via the UI using the Dyncfg feature. + To troubleshoot issues with the `prometheus` collector, run the `go.d.plugin` with the debug option enabled. The output should give you clues as to why the collector isn't working. @@ -288,4 +289,37 @@ should give you clues as to why the collector isn't working. ./go.d.plugin -d -m prometheus ``` +### Getting Logs + +If you're encountering problems with the `prometheus` collector, follow these steps to retrieve logs and identify potential issues: + +- **Run the command** specific to your system (systemd, non-systemd, or Docker container). +- **Examine the output** for any warnings or error messages that might indicate issues. These messages should provide clues about the root cause of the problem. + +#### System with systemd + +Use the following command to view logs generated since the last Netdata service restart: + +```bash +journalctl _SYSTEMD_INVOCATION_ID="$(systemctl show --value --property=InvocationID netdata)" --namespace=netdata --grep prometheus +``` + +#### System without systemd + +Locate the collector log file, typically at `/var/log/netdata/collector.log`, and use `grep` to filter for collector's name: + +```bash +grep prometheus /var/log/netdata/collector.log +``` + +**Note**: This method shows logs from all restarts. Focus on the **latest entries** for troubleshooting current issues. + +#### Docker Container + +If your Netdata runs in a Docker container named "netdata" (replace if different), use this command: + +```bash +docker logs netdata 2>&1 | grep prometheus +``` + diff --git a/src/go/collectors/go.d.plugin/modules/prometheus/integrations/vscode.md b/src/go/plugin/go.d/modules/prometheus/integrations/vscode.md index d72a5bf27..5fcffca01 100644 --- a/src/go/collectors/go.d.plugin/modules/prometheus/integrations/vscode.md +++ b/src/go/plugin/go.d/modules/prometheus/integrations/vscode.md @@ -1,6 +1,6 @@ <!--startmeta -custom_edit_url: "https://github.com/netdata/netdata/edit/master/src/go/collectors/go.d.plugin/modules/prometheus/integrations/vscode.md" -meta_yaml: "https://github.com/netdata/netdata/edit/master/src/go/collectors/go.d.plugin/modules/prometheus/metadata.yaml" +custom_edit_url: "https://github.com/netdata/netdata/edit/master/src/go/plugin/go.d/modules/prometheus/integrations/vscode.md" +meta_yaml: "https://github.com/netdata/netdata/edit/master/src/go/plugin/go.d/modules/prometheus/metadata.yaml" sidebar_label: "VSCode" learn_status: "Published" learn_rel_path: "Collecting Metrics/APM" @@ -37,7 +37,6 @@ This collector supports collecting metrics from multiple instances of this integ #### Auto-Detection By default, it detects instances running on the local host by trying to connect to known ports that are [allocated to exporters](https://github.com/prometheus/prometheus/wiki/Default-port-allocations). -The full list of endpoints is available in the collector's [configuration file](https://github.com/netdata/netdata/blob/master/src/go/collectors/go.d.plugin/config/go.d/prometheus.conf). #### Limits @@ -138,7 +137,7 @@ The following options can be defined globally: update_every, autodetection_retry This option allows you to filter out unwanted time series. Only metrics matching the selector will be collected. - Logic: (pattern1 OR pattern2) AND !(pattern3 or pattern4) -- Pattern syntax: [selector](/src/go/collectors/go.d.plugin/pkg/prometheus/selector/README.md). +- Pattern syntax: [selector](/src/go/plugin/go.d/pkg/prometheus/selector/README.md). - Option syntax: ```yaml @@ -266,6 +265,8 @@ jobs: ### Debug Mode +**Important**: Debug mode is not supported for data collection jobs created via the UI using the Dyncfg feature. + To troubleshoot issues with the `prometheus` collector, run the `go.d.plugin` with the debug option enabled. The output should give you clues as to why the collector isn't working. @@ -288,4 +289,37 @@ should give you clues as to why the collector isn't working. ./go.d.plugin -d -m prometheus ``` +### Getting Logs + +If you're encountering problems with the `prometheus` collector, follow these steps to retrieve logs and identify potential issues: + +- **Run the command** specific to your system (systemd, non-systemd, or Docker container). +- **Examine the output** for any warnings or error messages that might indicate issues. These messages should provide clues about the root cause of the problem. + +#### System with systemd + +Use the following command to view logs generated since the last Netdata service restart: + +```bash +journalctl _SYSTEMD_INVOCATION_ID="$(systemctl show --value --property=InvocationID netdata)" --namespace=netdata --grep prometheus +``` + +#### System without systemd + +Locate the collector log file, typically at `/var/log/netdata/collector.log`, and use `grep` to filter for collector's name: + +```bash +grep prometheus /var/log/netdata/collector.log +``` + +**Note**: This method shows logs from all restarts. Focus on the **latest entries** for troubleshooting current issues. + +#### Docker Container + +If your Netdata runs in a Docker container named "netdata" (replace if different), use this command: + +```bash +docker logs netdata 2>&1 | grep prometheus +``` + diff --git a/src/go/collectors/go.d.plugin/modules/prometheus/integrations/warp10.md b/src/go/plugin/go.d/modules/prometheus/integrations/warp10.md index 5fd9e7c26..e9e60dea6 100644 --- a/src/go/collectors/go.d.plugin/modules/prometheus/integrations/warp10.md +++ b/src/go/plugin/go.d/modules/prometheus/integrations/warp10.md @@ -1,6 +1,6 @@ <!--startmeta -custom_edit_url: "https://github.com/netdata/netdata/edit/master/src/go/collectors/go.d.plugin/modules/prometheus/integrations/warp10.md" -meta_yaml: "https://github.com/netdata/netdata/edit/master/src/go/collectors/go.d.plugin/modules/prometheus/metadata.yaml" +custom_edit_url: "https://github.com/netdata/netdata/edit/master/src/go/plugin/go.d/modules/prometheus/integrations/warp10.md" +meta_yaml: "https://github.com/netdata/netdata/edit/master/src/go/plugin/go.d/modules/prometheus/metadata.yaml" sidebar_label: "Warp10" learn_status: "Published" learn_rel_path: "Collecting Metrics/Databases" @@ -37,7 +37,6 @@ This collector supports collecting metrics from multiple instances of this integ #### Auto-Detection By default, it detects instances running on the local host by trying to connect to known ports that are [allocated to exporters](https://github.com/prometheus/prometheus/wiki/Default-port-allocations). -The full list of endpoints is available in the collector's [configuration file](https://github.com/netdata/netdata/blob/master/src/go/collectors/go.d.plugin/config/go.d/prometheus.conf). #### Limits @@ -138,7 +137,7 @@ The following options can be defined globally: update_every, autodetection_retry This option allows you to filter out unwanted time series. Only metrics matching the selector will be collected. - Logic: (pattern1 OR pattern2) AND !(pattern3 or pattern4) -- Pattern syntax: [selector](/src/go/collectors/go.d.plugin/pkg/prometheus/selector/README.md). +- Pattern syntax: [selector](/src/go/plugin/go.d/pkg/prometheus/selector/README.md). - Option syntax: ```yaml @@ -266,6 +265,8 @@ jobs: ### Debug Mode +**Important**: Debug mode is not supported for data collection jobs created via the UI using the Dyncfg feature. + To troubleshoot issues with the `prometheus` collector, run the `go.d.plugin` with the debug option enabled. The output should give you clues as to why the collector isn't working. @@ -288,4 +289,37 @@ should give you clues as to why the collector isn't working. ./go.d.plugin -d -m prometheus ``` +### Getting Logs + +If you're encountering problems with the `prometheus` collector, follow these steps to retrieve logs and identify potential issues: + +- **Run the command** specific to your system (systemd, non-systemd, or Docker container). +- **Examine the output** for any warnings or error messages that might indicate issues. These messages should provide clues about the root cause of the problem. + +#### System with systemd + +Use the following command to view logs generated since the last Netdata service restart: + +```bash +journalctl _SYSTEMD_INVOCATION_ID="$(systemctl show --value --property=InvocationID netdata)" --namespace=netdata --grep prometheus +``` + +#### System without systemd + +Locate the collector log file, typically at `/var/log/netdata/collector.log`, and use `grep` to filter for collector's name: + +```bash +grep prometheus /var/log/netdata/collector.log +``` + +**Note**: This method shows logs from all restarts. Focus on the **latest entries** for troubleshooting current issues. + +#### Docker Container + +If your Netdata runs in a Docker container named "netdata" (replace if different), use this command: + +```bash +docker logs netdata 2>&1 | grep prometheus +``` + diff --git a/src/go/collectors/go.d.plugin/modules/prometheus/integrations/xiaomi_mi_flora.md b/src/go/plugin/go.d/modules/prometheus/integrations/xiaomi_mi_flora.md index 882c1022f..51314b8b2 100644 --- a/src/go/collectors/go.d.plugin/modules/prometheus/integrations/xiaomi_mi_flora.md +++ b/src/go/plugin/go.d/modules/prometheus/integrations/xiaomi_mi_flora.md @@ -1,6 +1,6 @@ <!--startmeta -custom_edit_url: "https://github.com/netdata/netdata/edit/master/src/go/collectors/go.d.plugin/modules/prometheus/integrations/xiaomi_mi_flora.md" -meta_yaml: "https://github.com/netdata/netdata/edit/master/src/go/collectors/go.d.plugin/modules/prometheus/metadata.yaml" +custom_edit_url: "https://github.com/netdata/netdata/edit/master/src/go/plugin/go.d/modules/prometheus/integrations/xiaomi_mi_flora.md" +meta_yaml: "https://github.com/netdata/netdata/edit/master/src/go/plugin/go.d/modules/prometheus/metadata.yaml" sidebar_label: "Xiaomi Mi Flora" learn_status: "Published" learn_rel_path: "Collecting Metrics/IoT Devices" @@ -37,7 +37,6 @@ This collector supports collecting metrics from multiple instances of this integ #### Auto-Detection By default, it detects instances running on the local host by trying to connect to known ports that are [allocated to exporters](https://github.com/prometheus/prometheus/wiki/Default-port-allocations). -The full list of endpoints is available in the collector's [configuration file](https://github.com/netdata/netdata/blob/master/src/go/collectors/go.d.plugin/config/go.d/prometheus.conf). #### Limits @@ -138,7 +137,7 @@ The following options can be defined globally: update_every, autodetection_retry This option allows you to filter out unwanted time series. Only metrics matching the selector will be collected. - Logic: (pattern1 OR pattern2) AND !(pattern3 or pattern4) -- Pattern syntax: [selector](/src/go/collectors/go.d.plugin/pkg/prometheus/selector/README.md). +- Pattern syntax: [selector](/src/go/plugin/go.d/pkg/prometheus/selector/README.md). - Option syntax: ```yaml @@ -266,6 +265,8 @@ jobs: ### Debug Mode +**Important**: Debug mode is not supported for data collection jobs created via the UI using the Dyncfg feature. + To troubleshoot issues with the `prometheus` collector, run the `go.d.plugin` with the debug option enabled. The output should give you clues as to why the collector isn't working. @@ -288,4 +289,37 @@ should give you clues as to why the collector isn't working. ./go.d.plugin -d -m prometheus ``` +### Getting Logs + +If you're encountering problems with the `prometheus` collector, follow these steps to retrieve logs and identify potential issues: + +- **Run the command** specific to your system (systemd, non-systemd, or Docker container). +- **Examine the output** for any warnings or error messages that might indicate issues. These messages should provide clues about the root cause of the problem. + +#### System with systemd + +Use the following command to view logs generated since the last Netdata service restart: + +```bash +journalctl _SYSTEMD_INVOCATION_ID="$(systemctl show --value --property=InvocationID netdata)" --namespace=netdata --grep prometheus +``` + +#### System without systemd + +Locate the collector log file, typically at `/var/log/netdata/collector.log`, and use `grep` to filter for collector's name: + +```bash +grep prometheus /var/log/netdata/collector.log +``` + +**Note**: This method shows logs from all restarts. Focus on the **latest entries** for troubleshooting current issues. + +#### Docker Container + +If your Netdata runs in a Docker container named "netdata" (replace if different), use this command: + +```bash +docker logs netdata 2>&1 | grep prometheus +``` + diff --git a/src/go/collectors/go.d.plugin/modules/prometheus/integrations/xmpp_server.md b/src/go/plugin/go.d/modules/prometheus/integrations/xmpp_server.md index 336282e27..eacae8393 100644 --- a/src/go/collectors/go.d.plugin/modules/prometheus/integrations/xmpp_server.md +++ b/src/go/plugin/go.d/modules/prometheus/integrations/xmpp_server.md @@ -1,6 +1,6 @@ <!--startmeta -custom_edit_url: "https://github.com/netdata/netdata/edit/master/src/go/collectors/go.d.plugin/modules/prometheus/integrations/xmpp_server.md" -meta_yaml: "https://github.com/netdata/netdata/edit/master/src/go/collectors/go.d.plugin/modules/prometheus/metadata.yaml" +custom_edit_url: "https://github.com/netdata/netdata/edit/master/src/go/plugin/go.d/modules/prometheus/integrations/xmpp_server.md" +meta_yaml: "https://github.com/netdata/netdata/edit/master/src/go/plugin/go.d/modules/prometheus/metadata.yaml" sidebar_label: "XMPP Server" learn_status: "Published" learn_rel_path: "Collecting Metrics/Message Brokers" @@ -37,7 +37,6 @@ This collector supports collecting metrics from multiple instances of this integ #### Auto-Detection By default, it detects instances running on the local host by trying to connect to known ports that are [allocated to exporters](https://github.com/prometheus/prometheus/wiki/Default-port-allocations). -The full list of endpoints is available in the collector's [configuration file](https://github.com/netdata/netdata/blob/master/src/go/collectors/go.d.plugin/config/go.d/prometheus.conf). #### Limits @@ -138,7 +137,7 @@ The following options can be defined globally: update_every, autodetection_retry This option allows you to filter out unwanted time series. Only metrics matching the selector will be collected. - Logic: (pattern1 OR pattern2) AND !(pattern3 or pattern4) -- Pattern syntax: [selector](/src/go/collectors/go.d.plugin/pkg/prometheus/selector/README.md). +- Pattern syntax: [selector](/src/go/plugin/go.d/pkg/prometheus/selector/README.md). - Option syntax: ```yaml @@ -266,6 +265,8 @@ jobs: ### Debug Mode +**Important**: Debug mode is not supported for data collection jobs created via the UI using the Dyncfg feature. + To troubleshoot issues with the `prometheus` collector, run the `go.d.plugin` with the debug option enabled. The output should give you clues as to why the collector isn't working. @@ -288,4 +289,37 @@ should give you clues as to why the collector isn't working. ./go.d.plugin -d -m prometheus ``` +### Getting Logs + +If you're encountering problems with the `prometheus` collector, follow these steps to retrieve logs and identify potential issues: + +- **Run the command** specific to your system (systemd, non-systemd, or Docker container). +- **Examine the output** for any warnings or error messages that might indicate issues. These messages should provide clues about the root cause of the problem. + +#### System with systemd + +Use the following command to view logs generated since the last Netdata service restart: + +```bash +journalctl _SYSTEMD_INVOCATION_ID="$(systemctl show --value --property=InvocationID netdata)" --namespace=netdata --grep prometheus +``` + +#### System without systemd + +Locate the collector log file, typically at `/var/log/netdata/collector.log`, and use `grep` to filter for collector's name: + +```bash +grep prometheus /var/log/netdata/collector.log +``` + +**Note**: This method shows logs from all restarts. Focus on the **latest entries** for troubleshooting current issues. + +#### Docker Container + +If your Netdata runs in a Docker container named "netdata" (replace if different), use this command: + +```bash +docker logs netdata 2>&1 | grep prometheus +``` + diff --git a/src/go/collectors/go.d.plugin/modules/prometheus/integrations/yourls_url_shortener.md b/src/go/plugin/go.d/modules/prometheus/integrations/yourls_url_shortener.md index 015622617..6b84c5ee6 100644 --- a/src/go/collectors/go.d.plugin/modules/prometheus/integrations/yourls_url_shortener.md +++ b/src/go/plugin/go.d/modules/prometheus/integrations/yourls_url_shortener.md @@ -1,6 +1,6 @@ <!--startmeta -custom_edit_url: "https://github.com/netdata/netdata/edit/master/src/go/collectors/go.d.plugin/modules/prometheus/integrations/yourls_url_shortener.md" -meta_yaml: "https://github.com/netdata/netdata/edit/master/src/go/collectors/go.d.plugin/modules/prometheus/metadata.yaml" +custom_edit_url: "https://github.com/netdata/netdata/edit/master/src/go/plugin/go.d/modules/prometheus/integrations/yourls_url_shortener.md" +meta_yaml: "https://github.com/netdata/netdata/edit/master/src/go/plugin/go.d/modules/prometheus/metadata.yaml" sidebar_label: "YOURLS URL Shortener" learn_status: "Published" learn_rel_path: "Collecting Metrics/APM" @@ -37,7 +37,6 @@ This collector supports collecting metrics from multiple instances of this integ #### Auto-Detection By default, it detects instances running on the local host by trying to connect to known ports that are [allocated to exporters](https://github.com/prometheus/prometheus/wiki/Default-port-allocations). -The full list of endpoints is available in the collector's [configuration file](https://github.com/netdata/netdata/blob/master/src/go/collectors/go.d.plugin/config/go.d/prometheus.conf). #### Limits @@ -138,7 +137,7 @@ The following options can be defined globally: update_every, autodetection_retry This option allows you to filter out unwanted time series. Only metrics matching the selector will be collected. - Logic: (pattern1 OR pattern2) AND !(pattern3 or pattern4) -- Pattern syntax: [selector](/src/go/collectors/go.d.plugin/pkg/prometheus/selector/README.md). +- Pattern syntax: [selector](/src/go/plugin/go.d/pkg/prometheus/selector/README.md). - Option syntax: ```yaml @@ -266,6 +265,8 @@ jobs: ### Debug Mode +**Important**: Debug mode is not supported for data collection jobs created via the UI using the Dyncfg feature. + To troubleshoot issues with the `prometheus` collector, run the `go.d.plugin` with the debug option enabled. The output should give you clues as to why the collector isn't working. @@ -288,4 +289,37 @@ should give you clues as to why the collector isn't working. ./go.d.plugin -d -m prometheus ``` +### Getting Logs + +If you're encountering problems with the `prometheus` collector, follow these steps to retrieve logs and identify potential issues: + +- **Run the command** specific to your system (systemd, non-systemd, or Docker container). +- **Examine the output** for any warnings or error messages that might indicate issues. These messages should provide clues about the root cause of the problem. + +#### System with systemd + +Use the following command to view logs generated since the last Netdata service restart: + +```bash +journalctl _SYSTEMD_INVOCATION_ID="$(systemctl show --value --property=InvocationID netdata)" --namespace=netdata --grep prometheus +``` + +#### System without systemd + +Locate the collector log file, typically at `/var/log/netdata/collector.log`, and use `grep` to filter for collector's name: + +```bash +grep prometheus /var/log/netdata/collector.log +``` + +**Note**: This method shows logs from all restarts. Focus on the **latest entries** for troubleshooting current issues. + +#### Docker Container + +If your Netdata runs in a Docker container named "netdata" (replace if different), use this command: + +```bash +docker logs netdata 2>&1 | grep prometheus +``` + diff --git a/src/go/collectors/go.d.plugin/modules/prometheus/integrations/zerto.md b/src/go/plugin/go.d/modules/prometheus/integrations/zerto.md index 612c6ec15..3d316461f 100644 --- a/src/go/collectors/go.d.plugin/modules/prometheus/integrations/zerto.md +++ b/src/go/plugin/go.d/modules/prometheus/integrations/zerto.md @@ -1,6 +1,6 @@ <!--startmeta -custom_edit_url: "https://github.com/netdata/netdata/edit/master/src/go/collectors/go.d.plugin/modules/prometheus/integrations/zerto.md" -meta_yaml: "https://github.com/netdata/netdata/edit/master/src/go/collectors/go.d.plugin/modules/prometheus/metadata.yaml" +custom_edit_url: "https://github.com/netdata/netdata/edit/master/src/go/plugin/go.d/modules/prometheus/integrations/zerto.md" +meta_yaml: "https://github.com/netdata/netdata/edit/master/src/go/plugin/go.d/modules/prometheus/metadata.yaml" sidebar_label: "Zerto" learn_status: "Published" learn_rel_path: "Collecting Metrics/Cloud Provider Managed" @@ -37,7 +37,6 @@ This collector supports collecting metrics from multiple instances of this integ #### Auto-Detection By default, it detects instances running on the local host by trying to connect to known ports that are [allocated to exporters](https://github.com/prometheus/prometheus/wiki/Default-port-allocations). -The full list of endpoints is available in the collector's [configuration file](https://github.com/netdata/netdata/blob/master/src/go/collectors/go.d.plugin/config/go.d/prometheus.conf). #### Limits @@ -138,7 +137,7 @@ The following options can be defined globally: update_every, autodetection_retry This option allows you to filter out unwanted time series. Only metrics matching the selector will be collected. - Logic: (pattern1 OR pattern2) AND !(pattern3 or pattern4) -- Pattern syntax: [selector](/src/go/collectors/go.d.plugin/pkg/prometheus/selector/README.md). +- Pattern syntax: [selector](/src/go/plugin/go.d/pkg/prometheus/selector/README.md). - Option syntax: ```yaml @@ -266,6 +265,8 @@ jobs: ### Debug Mode +**Important**: Debug mode is not supported for data collection jobs created via the UI using the Dyncfg feature. + To troubleshoot issues with the `prometheus` collector, run the `go.d.plugin` with the debug option enabled. The output should give you clues as to why the collector isn't working. @@ -288,4 +289,37 @@ should give you clues as to why the collector isn't working. ./go.d.plugin -d -m prometheus ``` +### Getting Logs + +If you're encountering problems with the `prometheus` collector, follow these steps to retrieve logs and identify potential issues: + +- **Run the command** specific to your system (systemd, non-systemd, or Docker container). +- **Examine the output** for any warnings or error messages that might indicate issues. These messages should provide clues about the root cause of the problem. + +#### System with systemd + +Use the following command to view logs generated since the last Netdata service restart: + +```bash +journalctl _SYSTEMD_INVOCATION_ID="$(systemctl show --value --property=InvocationID netdata)" --namespace=netdata --grep prometheus +``` + +#### System without systemd + +Locate the collector log file, typically at `/var/log/netdata/collector.log`, and use `grep` to filter for collector's name: + +```bash +grep prometheus /var/log/netdata/collector.log +``` + +**Note**: This method shows logs from all restarts. Focus on the **latest entries** for troubleshooting current issues. + +#### Docker Container + +If your Netdata runs in a Docker container named "netdata" (replace if different), use this command: + +```bash +docker logs netdata 2>&1 | grep prometheus +``` + diff --git a/src/go/collectors/go.d.plugin/modules/prometheus/integrations/zulip.md b/src/go/plugin/go.d/modules/prometheus/integrations/zulip.md index eb931759a..91e652c47 100644 --- a/src/go/collectors/go.d.plugin/modules/prometheus/integrations/zulip.md +++ b/src/go/plugin/go.d/modules/prometheus/integrations/zulip.md @@ -1,6 +1,6 @@ <!--startmeta -custom_edit_url: "https://github.com/netdata/netdata/edit/master/src/go/collectors/go.d.plugin/modules/prometheus/integrations/zulip.md" -meta_yaml: "https://github.com/netdata/netdata/edit/master/src/go/collectors/go.d.plugin/modules/prometheus/metadata.yaml" +custom_edit_url: "https://github.com/netdata/netdata/edit/master/src/go/plugin/go.d/modules/prometheus/integrations/zulip.md" +meta_yaml: "https://github.com/netdata/netdata/edit/master/src/go/plugin/go.d/modules/prometheus/metadata.yaml" sidebar_label: "Zulip" learn_status: "Published" learn_rel_path: "Collecting Metrics/Media Services" @@ -37,7 +37,6 @@ This collector supports collecting metrics from multiple instances of this integ #### Auto-Detection By default, it detects instances running on the local host by trying to connect to known ports that are [allocated to exporters](https://github.com/prometheus/prometheus/wiki/Default-port-allocations). -The full list of endpoints is available in the collector's [configuration file](https://github.com/netdata/netdata/blob/master/src/go/collectors/go.d.plugin/config/go.d/prometheus.conf). #### Limits @@ -138,7 +137,7 @@ The following options can be defined globally: update_every, autodetection_retry This option allows you to filter out unwanted time series. Only metrics matching the selector will be collected. - Logic: (pattern1 OR pattern2) AND !(pattern3 or pattern4) -- Pattern syntax: [selector](/src/go/collectors/go.d.plugin/pkg/prometheus/selector/README.md). +- Pattern syntax: [selector](/src/go/plugin/go.d/pkg/prometheus/selector/README.md). - Option syntax: ```yaml @@ -266,6 +265,8 @@ jobs: ### Debug Mode +**Important**: Debug mode is not supported for data collection jobs created via the UI using the Dyncfg feature. + To troubleshoot issues with the `prometheus` collector, run the `go.d.plugin` with the debug option enabled. The output should give you clues as to why the collector isn't working. @@ -288,4 +289,37 @@ should give you clues as to why the collector isn't working. ./go.d.plugin -d -m prometheus ``` +### Getting Logs + +If you're encountering problems with the `prometheus` collector, follow these steps to retrieve logs and identify potential issues: + +- **Run the command** specific to your system (systemd, non-systemd, or Docker container). +- **Examine the output** for any warnings or error messages that might indicate issues. These messages should provide clues about the root cause of the problem. + +#### System with systemd + +Use the following command to view logs generated since the last Netdata service restart: + +```bash +journalctl _SYSTEMD_INVOCATION_ID="$(systemctl show --value --property=InvocationID netdata)" --namespace=netdata --grep prometheus +``` + +#### System without systemd + +Locate the collector log file, typically at `/var/log/netdata/collector.log`, and use `grep` to filter for collector's name: + +```bash +grep prometheus /var/log/netdata/collector.log +``` + +**Note**: This method shows logs from all restarts. Focus on the **latest entries** for troubleshooting current issues. + +#### Docker Container + +If your Netdata runs in a Docker container named "netdata" (replace if different), use this command: + +```bash +docker logs netdata 2>&1 | grep prometheus +``` + diff --git a/src/go/collectors/go.d.plugin/modules/prometheus/integrations/zyxel_gs1200-8.md b/src/go/plugin/go.d/modules/prometheus/integrations/zyxel_gs1200-8.md index d4917f635..4f0b43431 100644 --- a/src/go/collectors/go.d.plugin/modules/prometheus/integrations/zyxel_gs1200-8.md +++ b/src/go/plugin/go.d/modules/prometheus/integrations/zyxel_gs1200-8.md @@ -1,6 +1,6 @@ <!--startmeta -custom_edit_url: "https://github.com/netdata/netdata/edit/master/src/go/collectors/go.d.plugin/modules/prometheus/integrations/zyxel_gs1200-8.md" -meta_yaml: "https://github.com/netdata/netdata/edit/master/src/go/collectors/go.d.plugin/modules/prometheus/metadata.yaml" +custom_edit_url: "https://github.com/netdata/netdata/edit/master/src/go/plugin/go.d/modules/prometheus/integrations/zyxel_gs1200-8.md" +meta_yaml: "https://github.com/netdata/netdata/edit/master/src/go/plugin/go.d/modules/prometheus/metadata.yaml" sidebar_label: "Zyxel GS1200-8" learn_status: "Published" learn_rel_path: "Collecting Metrics/Networking Stack and Network Interfaces" @@ -37,7 +37,6 @@ This collector supports collecting metrics from multiple instances of this integ #### Auto-Detection By default, it detects instances running on the local host by trying to connect to known ports that are [allocated to exporters](https://github.com/prometheus/prometheus/wiki/Default-port-allocations). -The full list of endpoints is available in the collector's [configuration file](https://github.com/netdata/netdata/blob/master/src/go/collectors/go.d.plugin/config/go.d/prometheus.conf). #### Limits @@ -138,7 +137,7 @@ The following options can be defined globally: update_every, autodetection_retry This option allows you to filter out unwanted time series. Only metrics matching the selector will be collected. - Logic: (pattern1 OR pattern2) AND !(pattern3 or pattern4) -- Pattern syntax: [selector](/src/go/collectors/go.d.plugin/pkg/prometheus/selector/README.md). +- Pattern syntax: [selector](/src/go/plugin/go.d/pkg/prometheus/selector/README.md). - Option syntax: ```yaml @@ -266,6 +265,8 @@ jobs: ### Debug Mode +**Important**: Debug mode is not supported for data collection jobs created via the UI using the Dyncfg feature. + To troubleshoot issues with the `prometheus` collector, run the `go.d.plugin` with the debug option enabled. The output should give you clues as to why the collector isn't working. @@ -288,4 +289,37 @@ should give you clues as to why the collector isn't working. ./go.d.plugin -d -m prometheus ``` +### Getting Logs + +If you're encountering problems with the `prometheus` collector, follow these steps to retrieve logs and identify potential issues: + +- **Run the command** specific to your system (systemd, non-systemd, or Docker container). +- **Examine the output** for any warnings or error messages that might indicate issues. These messages should provide clues about the root cause of the problem. + +#### System with systemd + +Use the following command to view logs generated since the last Netdata service restart: + +```bash +journalctl _SYSTEMD_INVOCATION_ID="$(systemctl show --value --property=InvocationID netdata)" --namespace=netdata --grep prometheus +``` + +#### System without systemd + +Locate the collector log file, typically at `/var/log/netdata/collector.log`, and use `grep` to filter for collector's name: + +```bash +grep prometheus /var/log/netdata/collector.log +``` + +**Note**: This method shows logs from all restarts. Focus on the **latest entries** for troubleshooting current issues. + +#### Docker Container + +If your Netdata runs in a Docker container named "netdata" (replace if different), use this command: + +```bash +docker logs netdata 2>&1 | grep prometheus +``` + diff --git a/src/go/collectors/go.d.plugin/modules/prometheus/metadata.yaml b/src/go/plugin/go.d/modules/prometheus/metadata.yaml index 8d1555f3e..fee2b820b 100644 --- a/src/go/collectors/go.d.plugin/modules/prometheus/metadata.yaml +++ b/src/go/plugin/go.d/modules/prometheus/metadata.yaml @@ -37,7 +37,6 @@ modules: auto_detection: description: | By default, it detects instances running on the local host by trying to connect to known ports that are [allocated to exporters](https://github.com/prometheus/prometheus/wiki/Default-port-allocations). - The full list of endpoints is available in the collector's [configuration file](https://github.com/netdata/netdata/blob/master/src/go/collectors/go.d.plugin/config/go.d/prometheus.conf). limits: description: "" performance_impact: @@ -75,7 +74,7 @@ modules: This option allows you to filter out unwanted time series. Only metrics matching the selector will be collected. - Logic: (pattern1 OR pattern2) AND !(pattern3 or pattern4) - - Pattern syntax: [selector](/src/go/collectors/go.d.plugin/pkg/prometheus/selector/README.md). + - Pattern syntax: [selector](/src/go/plugin/go.d/pkg/prometheus/selector/README.md). - Option syntax: ```yaml diff --git a/src/go/collectors/go.d.plugin/modules/prometheus/prometheus.go b/src/go/plugin/go.d/modules/prometheus/prometheus.go index c5dcb7390..b3f97fbd3 100644 --- a/src/go/collectors/go.d.plugin/modules/prometheus/prometheus.go +++ b/src/go/plugin/go.d/modules/prometheus/prometheus.go @@ -7,11 +7,11 @@ import ( "errors" "time" - "github.com/netdata/netdata/go/go.d.plugin/agent/module" - "github.com/netdata/netdata/go/go.d.plugin/pkg/matcher" - "github.com/netdata/netdata/go/go.d.plugin/pkg/prometheus" - "github.com/netdata/netdata/go/go.d.plugin/pkg/prometheus/selector" - "github.com/netdata/netdata/go/go.d.plugin/pkg/web" + "github.com/netdata/netdata/go/plugins/plugin/go.d/agent/module" + "github.com/netdata/netdata/go/plugins/plugin/go.d/pkg/matcher" + "github.com/netdata/netdata/go/plugins/plugin/go.d/pkg/prometheus" + "github.com/netdata/netdata/go/plugins/plugin/go.d/pkg/prometheus/selector" + "github.com/netdata/netdata/go/plugins/plugin/go.d/pkg/web" ) //go:embed "config_schema.json" diff --git a/src/go/collectors/go.d.plugin/modules/prometheus/prometheus_test.go b/src/go/plugin/go.d/modules/prometheus/prometheus_test.go index 52c30f143..5a5475cc9 100644 --- a/src/go/collectors/go.d.plugin/modules/prometheus/prometheus_test.go +++ b/src/go/plugin/go.d/modules/prometheus/prometheus_test.go @@ -9,9 +9,9 @@ import ( "os" "testing" - "github.com/netdata/netdata/go/go.d.plugin/agent/module" - "github.com/netdata/netdata/go/go.d.plugin/pkg/prometheus/selector" - "github.com/netdata/netdata/go/go.d.plugin/pkg/web" + "github.com/netdata/netdata/go/plugins/plugin/go.d/agent/module" + "github.com/netdata/netdata/go/plugins/plugin/go.d/pkg/prometheus/selector" + "github.com/netdata/netdata/go/plugins/plugin/go.d/pkg/web" "github.com/stretchr/testify/assert" "github.com/stretchr/testify/require" diff --git a/src/go/collectors/go.d.plugin/modules/prometheus/testdata/config.json b/src/go/plugin/go.d/modules/prometheus/testdata/config.json index 2e9b2e138..2e9b2e138 100644 --- a/src/go/collectors/go.d.plugin/modules/prometheus/testdata/config.json +++ b/src/go/plugin/go.d/modules/prometheus/testdata/config.json diff --git a/src/go/collectors/go.d.plugin/modules/prometheus/testdata/config.yaml b/src/go/plugin/go.d/modules/prometheus/testdata/config.yaml index 37a411b9a..37a411b9a 100644 --- a/src/go/collectors/go.d.plugin/modules/prometheus/testdata/config.yaml +++ b/src/go/plugin/go.d/modules/prometheus/testdata/config.yaml diff --git a/src/go/collectors/go.d.plugin/modules/proxysql/README.md b/src/go/plugin/go.d/modules/proxysql/README.md index 06223157d..06223157d 120000 --- a/src/go/collectors/go.d.plugin/modules/proxysql/README.md +++ b/src/go/plugin/go.d/modules/proxysql/README.md diff --git a/src/go/collectors/go.d.plugin/modules/proxysql/cache.go b/src/go/plugin/go.d/modules/proxysql/cache.go index c4fccefff..c4fccefff 100644 --- a/src/go/collectors/go.d.plugin/modules/proxysql/cache.go +++ b/src/go/plugin/go.d/modules/proxysql/cache.go diff --git a/src/go/collectors/go.d.plugin/modules/proxysql/charts.go b/src/go/plugin/go.d/modules/proxysql/charts.go index 34e012740..c36efa5ce 100644 --- a/src/go/collectors/go.d.plugin/modules/proxysql/charts.go +++ b/src/go/plugin/go.d/modules/proxysql/charts.go @@ -6,7 +6,7 @@ import ( "fmt" "strings" - "github.com/netdata/netdata/go/go.d.plugin/agent/module" + "github.com/netdata/netdata/go/plugins/plugin/go.d/agent/module" ) // TODO: check https://github.com/ProxySQL/proxysql-grafana-prometheus/blob/main/grafana/provisioning/dashboards/ProxySQL-Host-Statistics.json diff --git a/src/go/collectors/go.d.plugin/modules/proxysql/collect.go b/src/go/plugin/go.d/modules/proxysql/collect.go index dfc559a97..dfc559a97 100644 --- a/src/go/collectors/go.d.plugin/modules/proxysql/collect.go +++ b/src/go/plugin/go.d/modules/proxysql/collect.go diff --git a/src/go/collectors/go.d.plugin/modules/proxysql/config_schema.json b/src/go/plugin/go.d/modules/proxysql/config_schema.json index c0c880a2e..c0c880a2e 100644 --- a/src/go/collectors/go.d.plugin/modules/proxysql/config_schema.json +++ b/src/go/plugin/go.d/modules/proxysql/config_schema.json diff --git a/src/go/collectors/go.d.plugin/modules/proxysql/integrations/proxysql.md b/src/go/plugin/go.d/modules/proxysql/integrations/proxysql.md index 2cfb0b065..90d42114e 100644 --- a/src/go/collectors/go.d.plugin/modules/proxysql/integrations/proxysql.md +++ b/src/go/plugin/go.d/modules/proxysql/integrations/proxysql.md @@ -1,6 +1,6 @@ <!--startmeta -custom_edit_url: "https://github.com/netdata/netdata/edit/master/src/go/collectors/go.d.plugin/modules/proxysql/README.md" -meta_yaml: "https://github.com/netdata/netdata/edit/master/src/go/collectors/go.d.plugin/modules/proxysql/metadata.yaml" +custom_edit_url: "https://github.com/netdata/netdata/edit/master/src/go/plugin/go.d/modules/proxysql/README.md" +meta_yaml: "https://github.com/netdata/netdata/edit/master/src/go/plugin/go.d/modules/proxysql/metadata.yaml" sidebar_label: "ProxySQL" learn_status: "Published" learn_rel_path: "Collecting Metrics/Databases" @@ -249,6 +249,8 @@ jobs: ### Debug Mode +**Important**: Debug mode is not supported for data collection jobs created via the UI using the Dyncfg feature. + To troubleshoot issues with the `proxysql` collector, run the `go.d.plugin` with the debug option enabled. The output should give you clues as to why the collector isn't working. @@ -271,4 +273,37 @@ should give you clues as to why the collector isn't working. ./go.d.plugin -d -m proxysql ``` +### Getting Logs + +If you're encountering problems with the `proxysql` collector, follow these steps to retrieve logs and identify potential issues: + +- **Run the command** specific to your system (systemd, non-systemd, or Docker container). +- **Examine the output** for any warnings or error messages that might indicate issues. These messages should provide clues about the root cause of the problem. + +#### System with systemd + +Use the following command to view logs generated since the last Netdata service restart: + +```bash +journalctl _SYSTEMD_INVOCATION_ID="$(systemctl show --value --property=InvocationID netdata)" --namespace=netdata --grep proxysql +``` + +#### System without systemd + +Locate the collector log file, typically at `/var/log/netdata/collector.log`, and use `grep` to filter for collector's name: + +```bash +grep proxysql /var/log/netdata/collector.log +``` + +**Note**: This method shows logs from all restarts. Focus on the **latest entries** for troubleshooting current issues. + +#### Docker Container + +If your Netdata runs in a Docker container named "netdata" (replace if different), use this command: + +```bash +docker logs netdata 2>&1 | grep proxysql +``` + diff --git a/src/go/collectors/go.d.plugin/modules/proxysql/metadata.yaml b/src/go/plugin/go.d/modules/proxysql/metadata.yaml index 2c9562d99..2c9562d99 100644 --- a/src/go/collectors/go.d.plugin/modules/proxysql/metadata.yaml +++ b/src/go/plugin/go.d/modules/proxysql/metadata.yaml diff --git a/src/go/collectors/go.d.plugin/modules/proxysql/proxysql.go b/src/go/plugin/go.d/modules/proxysql/proxysql.go index 4fe08b8b0..fc4677b1d 100644 --- a/src/go/collectors/go.d.plugin/modules/proxysql/proxysql.go +++ b/src/go/plugin/go.d/modules/proxysql/proxysql.go @@ -10,8 +10,8 @@ import ( "sync" "time" - "github.com/netdata/netdata/go/go.d.plugin/agent/module" - "github.com/netdata/netdata/go/go.d.plugin/pkg/web" + "github.com/netdata/netdata/go/plugins/plugin/go.d/agent/module" + "github.com/netdata/netdata/go/plugins/plugin/go.d/pkg/web" ) //go:embed "config_schema.json" diff --git a/src/go/collectors/go.d.plugin/modules/proxysql/proxysql_test.go b/src/go/plugin/go.d/modules/proxysql/proxysql_test.go index 3dfaf1bf3..860e9032f 100644 --- a/src/go/collectors/go.d.plugin/modules/proxysql/proxysql_test.go +++ b/src/go/plugin/go.d/modules/proxysql/proxysql_test.go @@ -12,7 +12,7 @@ import ( "strings" "testing" - "github.com/netdata/netdata/go/go.d.plugin/agent/module" + "github.com/netdata/netdata/go/plugins/plugin/go.d/agent/module" "github.com/DATA-DOG/go-sqlmock" "github.com/stretchr/testify/assert" diff --git a/src/go/collectors/go.d.plugin/modules/proxysql/testdata/config.json b/src/go/plugin/go.d/modules/proxysql/testdata/config.json index ed8b72dcb..ed8b72dcb 100644 --- a/src/go/collectors/go.d.plugin/modules/proxysql/testdata/config.json +++ b/src/go/plugin/go.d/modules/proxysql/testdata/config.json diff --git a/src/go/collectors/go.d.plugin/modules/proxysql/testdata/config.yaml b/src/go/plugin/go.d/modules/proxysql/testdata/config.yaml index caff49039..caff49039 100644 --- a/src/go/collectors/go.d.plugin/modules/proxysql/testdata/config.yaml +++ b/src/go/plugin/go.d/modules/proxysql/testdata/config.yaml diff --git a/src/go/collectors/go.d.plugin/modules/proxysql/testdata/v2.0.10/stats_memory_metrics.txt b/src/go/plugin/go.d/modules/proxysql/testdata/v2.0.10/stats_memory_metrics.txt index 99ec093e1..99ec093e1 100644 --- a/src/go/collectors/go.d.plugin/modules/proxysql/testdata/v2.0.10/stats_memory_metrics.txt +++ b/src/go/plugin/go.d/modules/proxysql/testdata/v2.0.10/stats_memory_metrics.txt diff --git a/src/go/collectors/go.d.plugin/modules/proxysql/testdata/v2.0.10/stats_mysql_commands_counters.txt b/src/go/plugin/go.d/modules/proxysql/testdata/v2.0.10/stats_mysql_commands_counters.txt index 6ab6bb830..6ab6bb830 100644 --- a/src/go/collectors/go.d.plugin/modules/proxysql/testdata/v2.0.10/stats_mysql_commands_counters.txt +++ b/src/go/plugin/go.d/modules/proxysql/testdata/v2.0.10/stats_mysql_commands_counters.txt diff --git a/src/go/collectors/go.d.plugin/modules/proxysql/testdata/v2.0.10/stats_mysql_connection_pool .txt b/src/go/plugin/go.d/modules/proxysql/testdata/v2.0.10/stats_mysql_connection_pool .txt index 80b53e1af..80b53e1af 100644 --- a/src/go/collectors/go.d.plugin/modules/proxysql/testdata/v2.0.10/stats_mysql_connection_pool .txt +++ b/src/go/plugin/go.d/modules/proxysql/testdata/v2.0.10/stats_mysql_connection_pool .txt diff --git a/src/go/collectors/go.d.plugin/modules/proxysql/testdata/v2.0.10/stats_mysql_global.txt b/src/go/plugin/go.d/modules/proxysql/testdata/v2.0.10/stats_mysql_global.txt index 442266c45..442266c45 100644 --- a/src/go/collectors/go.d.plugin/modules/proxysql/testdata/v2.0.10/stats_mysql_global.txt +++ b/src/go/plugin/go.d/modules/proxysql/testdata/v2.0.10/stats_mysql_global.txt diff --git a/src/go/collectors/go.d.plugin/modules/proxysql/testdata/v2.0.10/stats_mysql_users.txt b/src/go/plugin/go.d/modules/proxysql/testdata/v2.0.10/stats_mysql_users.txt index 900776b76..900776b76 100644 --- a/src/go/collectors/go.d.plugin/modules/proxysql/testdata/v2.0.10/stats_mysql_users.txt +++ b/src/go/plugin/go.d/modules/proxysql/testdata/v2.0.10/stats_mysql_users.txt diff --git a/src/go/collectors/go.d.plugin/modules/proxysql/testdata/v2.0.10/version.txt b/src/go/plugin/go.d/modules/proxysql/testdata/v2.0.10/version.txt index 429a880b7..429a880b7 100644 --- a/src/go/collectors/go.d.plugin/modules/proxysql/testdata/v2.0.10/version.txt +++ b/src/go/plugin/go.d/modules/proxysql/testdata/v2.0.10/version.txt diff --git a/src/go/collectors/go.d.plugin/modules/pulsar/README.md b/src/go/plugin/go.d/modules/pulsar/README.md index dfa55301c..dfa55301c 120000 --- a/src/go/collectors/go.d.plugin/modules/pulsar/README.md +++ b/src/go/plugin/go.d/modules/pulsar/README.md diff --git a/src/go/collectors/go.d.plugin/modules/pulsar/cache.go b/src/go/plugin/go.d/modules/pulsar/cache.go index 7f113bf86..7f113bf86 100644 --- a/src/go/collectors/go.d.plugin/modules/pulsar/cache.go +++ b/src/go/plugin/go.d/modules/pulsar/cache.go diff --git a/src/go/collectors/go.d.plugin/modules/pulsar/charts.go b/src/go/plugin/go.d/modules/pulsar/charts.go index 3ddff66f6..e6bb9bde6 100644 --- a/src/go/collectors/go.d.plugin/modules/pulsar/charts.go +++ b/src/go/plugin/go.d/modules/pulsar/charts.go @@ -6,9 +6,9 @@ import ( "fmt" "strings" - "github.com/netdata/netdata/go/go.d.plugin/pkg/prometheus" + "github.com/netdata/netdata/go/plugins/plugin/go.d/pkg/prometheus" - "github.com/netdata/netdata/go/go.d.plugin/agent/module" + "github.com/netdata/netdata/go/plugins/plugin/go.d/agent/module" ) type ( diff --git a/src/go/collectors/go.d.plugin/modules/pulsar/collect.go b/src/go/plugin/go.d/modules/pulsar/collect.go index f28e6cb2c..10ff48b3e 100644 --- a/src/go/collectors/go.d.plugin/modules/pulsar/collect.go +++ b/src/go/plugin/go.d/modules/pulsar/collect.go @@ -6,8 +6,8 @@ import ( "errors" "strings" - "github.com/netdata/netdata/go/go.d.plugin/pkg/prometheus" - "github.com/netdata/netdata/go/go.d.plugin/pkg/stm" + "github.com/netdata/netdata/go/plugins/plugin/go.d/pkg/prometheus" + "github.com/netdata/netdata/go/plugins/plugin/go.d/pkg/stm" ) func isValidPulsarMetrics(pms prometheus.Series) bool { diff --git a/src/go/collectors/go.d.plugin/modules/pulsar/config_schema.json b/src/go/plugin/go.d/modules/pulsar/config_schema.json index 0336255ce..b4bc8b45f 100644 --- a/src/go/collectors/go.d.plugin/modules/pulsar/config_schema.json +++ b/src/go/plugin/go.d/modules/pulsar/config_schema.json @@ -167,6 +167,12 @@ "timeout": { "ui:help": "Accepts decimals for precise control (e.g., type 1.5 for 1.5 seconds)." }, + "username": { + "ui:widget": "password" + }, + "proxy_username": { + "ui:widget": "password" + }, "password": { "ui:widget": "password" }, diff --git a/src/go/collectors/go.d.plugin/modules/pulsar/init.go b/src/go/plugin/go.d/modules/pulsar/init.go index 2b17b5dfd..f165327a5 100644 --- a/src/go/collectors/go.d.plugin/modules/pulsar/init.go +++ b/src/go/plugin/go.d/modules/pulsar/init.go @@ -5,9 +5,9 @@ package pulsar import ( "errors" - "github.com/netdata/netdata/go/go.d.plugin/pkg/matcher" - "github.com/netdata/netdata/go/go.d.plugin/pkg/prometheus" - "github.com/netdata/netdata/go/go.d.plugin/pkg/web" + "github.com/netdata/netdata/go/plugins/plugin/go.d/pkg/matcher" + "github.com/netdata/netdata/go/plugins/plugin/go.d/pkg/prometheus" + "github.com/netdata/netdata/go/plugins/plugin/go.d/pkg/web" ) func (p *Pulsar) validateConfig() error { diff --git a/src/go/collectors/go.d.plugin/modules/pulsar/integrations/apache_pulsar.md b/src/go/plugin/go.d/modules/pulsar/integrations/apache_pulsar.md index b23e03d5e..8538fbf9c 100644 --- a/src/go/collectors/go.d.plugin/modules/pulsar/integrations/apache_pulsar.md +++ b/src/go/plugin/go.d/modules/pulsar/integrations/apache_pulsar.md @@ -1,6 +1,6 @@ <!--startmeta -custom_edit_url: "https://github.com/netdata/netdata/edit/master/src/go/collectors/go.d.plugin/modules/pulsar/README.md" -meta_yaml: "https://github.com/netdata/netdata/edit/master/src/go/collectors/go.d.plugin/modules/pulsar/metadata.yaml" +custom_edit_url: "https://github.com/netdata/netdata/edit/master/src/go/plugin/go.d/modules/pulsar/README.md" +meta_yaml: "https://github.com/netdata/netdata/edit/master/src/go/plugin/go.d/modules/pulsar/metadata.yaml" sidebar_label: "Apache Pulsar" learn_status: "Published" learn_rel_path: "Collecting Metrics/Message Brokers" @@ -254,6 +254,8 @@ jobs: ### Debug Mode +**Important**: Debug mode is not supported for data collection jobs created via the UI using the Dyncfg feature. + To troubleshoot issues with the `pulsar` collector, run the `go.d.plugin` with the debug option enabled. The output should give you clues as to why the collector isn't working. @@ -276,4 +278,37 @@ should give you clues as to why the collector isn't working. ./go.d.plugin -d -m pulsar ``` +### Getting Logs + +If you're encountering problems with the `pulsar` collector, follow these steps to retrieve logs and identify potential issues: + +- **Run the command** specific to your system (systemd, non-systemd, or Docker container). +- **Examine the output** for any warnings or error messages that might indicate issues. These messages should provide clues about the root cause of the problem. + +#### System with systemd + +Use the following command to view logs generated since the last Netdata service restart: + +```bash +journalctl _SYSTEMD_INVOCATION_ID="$(systemctl show --value --property=InvocationID netdata)" --namespace=netdata --grep pulsar +``` + +#### System without systemd + +Locate the collector log file, typically at `/var/log/netdata/collector.log`, and use `grep` to filter for collector's name: + +```bash +grep pulsar /var/log/netdata/collector.log +``` + +**Note**: This method shows logs from all restarts. Focus on the **latest entries** for troubleshooting current issues. + +#### Docker Container + +If your Netdata runs in a Docker container named "netdata" (replace if different), use this command: + +```bash +docker logs netdata 2>&1 | grep pulsar +``` + diff --git a/src/go/collectors/go.d.plugin/modules/pulsar/metadata.yaml b/src/go/plugin/go.d/modules/pulsar/metadata.yaml index f21389fd2..f21389fd2 100644 --- a/src/go/collectors/go.d.plugin/modules/pulsar/metadata.yaml +++ b/src/go/plugin/go.d/modules/pulsar/metadata.yaml diff --git a/src/go/collectors/go.d.plugin/modules/pulsar/metrics.go b/src/go/plugin/go.d/modules/pulsar/metrics.go index 9e38e5b9a..9e38e5b9a 100644 --- a/src/go/collectors/go.d.plugin/modules/pulsar/metrics.go +++ b/src/go/plugin/go.d/modules/pulsar/metrics.go diff --git a/src/go/collectors/go.d.plugin/modules/pulsar/pulsar.go b/src/go/plugin/go.d/modules/pulsar/pulsar.go index 507b1235e..aa5ac35fc 100644 --- a/src/go/collectors/go.d.plugin/modules/pulsar/pulsar.go +++ b/src/go/plugin/go.d/modules/pulsar/pulsar.go @@ -8,10 +8,10 @@ import ( "sync" "time" - "github.com/netdata/netdata/go/go.d.plugin/agent/module" - "github.com/netdata/netdata/go/go.d.plugin/pkg/matcher" - "github.com/netdata/netdata/go/go.d.plugin/pkg/prometheus" - "github.com/netdata/netdata/go/go.d.plugin/pkg/web" + "github.com/netdata/netdata/go/plugins/plugin/go.d/agent/module" + "github.com/netdata/netdata/go/plugins/plugin/go.d/pkg/matcher" + "github.com/netdata/netdata/go/plugins/plugin/go.d/pkg/prometheus" + "github.com/netdata/netdata/go/plugins/plugin/go.d/pkg/web" ) //go:embed "config_schema.json" diff --git a/src/go/collectors/go.d.plugin/modules/pulsar/pulsar_test.go b/src/go/plugin/go.d/modules/pulsar/pulsar_test.go index d6b5376d8..330656156 100644 --- a/src/go/collectors/go.d.plugin/modules/pulsar/pulsar_test.go +++ b/src/go/plugin/go.d/modules/pulsar/pulsar_test.go @@ -9,10 +9,10 @@ import ( "strings" "testing" - "github.com/netdata/netdata/go/go.d.plugin/agent/module" - "github.com/netdata/netdata/go/go.d.plugin/pkg/matcher" - "github.com/netdata/netdata/go/go.d.plugin/pkg/tlscfg" - "github.com/netdata/netdata/go/go.d.plugin/pkg/web" + "github.com/netdata/netdata/go/plugins/plugin/go.d/agent/module" + "github.com/netdata/netdata/go/plugins/plugin/go.d/pkg/matcher" + "github.com/netdata/netdata/go/plugins/plugin/go.d/pkg/tlscfg" + "github.com/netdata/netdata/go/plugins/plugin/go.d/pkg/web" "github.com/stretchr/testify/assert" "github.com/stretchr/testify/require" diff --git a/src/go/collectors/go.d.plugin/modules/pulsar/testdata/config.json b/src/go/plugin/go.d/modules/pulsar/testdata/config.json index ab4f38fe0..ab4f38fe0 100644 --- a/src/go/collectors/go.d.plugin/modules/pulsar/testdata/config.json +++ b/src/go/plugin/go.d/modules/pulsar/testdata/config.json diff --git a/src/go/collectors/go.d.plugin/modules/pulsar/testdata/config.yaml b/src/go/plugin/go.d/modules/pulsar/testdata/config.yaml index f2645d9e9..f2645d9e9 100644 --- a/src/go/collectors/go.d.plugin/modules/pulsar/testdata/config.yaml +++ b/src/go/plugin/go.d/modules/pulsar/testdata/config.yaml diff --git a/src/go/collectors/go.d.plugin/modules/pulsar/testdata/non-pulsar.txt b/src/go/plugin/go.d/modules/pulsar/testdata/non-pulsar.txt index f5f0ae082..f5f0ae082 100644 --- a/src/go/collectors/go.d.plugin/modules/pulsar/testdata/non-pulsar.txt +++ b/src/go/plugin/go.d/modules/pulsar/testdata/non-pulsar.txt diff --git a/src/go/collectors/go.d.plugin/modules/pulsar/testdata/standalone-v2.5.0-namespaces.txt b/src/go/plugin/go.d/modules/pulsar/testdata/standalone-v2.5.0-namespaces.txt index bbc3de4a0..bbc3de4a0 100644 --- a/src/go/collectors/go.d.plugin/modules/pulsar/testdata/standalone-v2.5.0-namespaces.txt +++ b/src/go/plugin/go.d/modules/pulsar/testdata/standalone-v2.5.0-namespaces.txt diff --git a/src/go/collectors/go.d.plugin/modules/pulsar/testdata/standalone-v2.5.0-topics-2.txt b/src/go/plugin/go.d/modules/pulsar/testdata/standalone-v2.5.0-topics-2.txt index ba5006094..ba5006094 100644 --- a/src/go/collectors/go.d.plugin/modules/pulsar/testdata/standalone-v2.5.0-topics-2.txt +++ b/src/go/plugin/go.d/modules/pulsar/testdata/standalone-v2.5.0-topics-2.txt diff --git a/src/go/collectors/go.d.plugin/modules/pulsar/testdata/standalone-v2.5.0-topics.txt b/src/go/plugin/go.d/modules/pulsar/testdata/standalone-v2.5.0-topics.txt index 7e0f0212a..7e0f0212a 100644 --- a/src/go/collectors/go.d.plugin/modules/pulsar/testdata/standalone-v2.5.0-topics.txt +++ b/src/go/plugin/go.d/modules/pulsar/testdata/standalone-v2.5.0-topics.txt diff --git a/src/collectors/python.d.plugin/puppet/README.md b/src/go/plugin/go.d/modules/puppet/README.md index b6c4c83f9..b6c4c83f9 120000 --- a/src/collectors/python.d.plugin/puppet/README.md +++ b/src/go/plugin/go.d/modules/puppet/README.md diff --git a/src/go/plugin/go.d/modules/puppet/charts.go b/src/go/plugin/go.d/modules/puppet/charts.go new file mode 100644 index 000000000..c1da8d162 --- /dev/null +++ b/src/go/plugin/go.d/modules/puppet/charts.go @@ -0,0 +1,93 @@ +// SPDX-License-Identifier: GPL-3.0-or-later + +package puppet + +import ( + "github.com/netdata/netdata/go/plugins/plugin/go.d/agent/module" +) + +const ( + prioJVMHeap = module.Priority + iota + prioJVMNonHeap + prioCPUUsage + prioFileDescriptors +) + +const ( + byteToMiB = 1 << 20 +) + +var charts = module.Charts{ + jvmHeapChart.Copy(), + jvmNonHeapChart.Copy(), + cpuUsageChart.Copy(), + fileDescriptorsChart.Copy(), +} + +var ( + jvmHeapChart = module.Chart{ + ID: "jvm_heap", + Title: "JVM Heap", + Units: "MiB", + Fam: "resources", + Ctx: "puppet.jvm_heap", + Type: module.Area, + Priority: prioJVMHeap, + Dims: module.Dims{ + {ID: "jvm_heap_committed", Name: "committed", Div: byteToMiB}, + {ID: "jvm_heap_used", Name: "used", Div: byteToMiB}, + }, + Vars: module.Vars{ + {ID: "jvm_heap_max"}, + {ID: "jvm_heap_init"}, + }, + } + + jvmNonHeapChart = module.Chart{ + ID: "jvm_nonheap", + Title: "JVM Non-Heap", + Units: "MiB", + Fam: "resources", + Ctx: "puppet.jvm_nonheap", + Type: module.Area, + Priority: prioJVMNonHeap, + Dims: module.Dims{ + {ID: "jvm_nonheap_committed", Name: "committed", Div: byteToMiB}, + {ID: "jvm_nonheap_used", Name: "used", Div: byteToMiB}, + }, + Vars: module.Vars{ + {ID: "jvm_nonheap_max"}, + {ID: "jvm_nonheap_init"}, + }, + } + + cpuUsageChart = module.Chart{ + ID: "cpu", + Title: "CPU usage", + Units: "percentage", + Fam: "resources", + Ctx: "puppet.cpu", + Type: module.Stacked, + Priority: prioCPUUsage, + Dims: module.Dims{ + {ID: "cpu_usage", Name: "execution", Div: 1000}, + {ID: "gc_cpu_usage", Name: "GC", Div: 1000}, + }, + } + + fileDescriptorsChart = module.Chart{ + ID: "fd_open", + Title: "File Descriptors", + Units: "descriptors", + Fam: "resources", + Ctx: "puppet.fdopen", + Type: module.Line, + Priority: prioFileDescriptors, + Dims: module.Dims{ + {ID: "fd_used", Name: "used"}, + }, + Vars: module.Vars{ + {ID: "fd_max"}, + }, + } +) diff --git a/src/go/plugin/go.d/modules/puppet/collect.go b/src/go/plugin/go.d/modules/puppet/collect.go new file mode 100644 index 000000000..a1b95e09c --- /dev/null +++ b/src/go/plugin/go.d/modules/puppet/collect.go @@ -0,0 +1,75 @@ +// SPDX-License-Identifier: GPL-3.0-or-later + +package puppet + +import ( + "encoding/json" + "fmt" + "io" + "net/http" + "net/url" + + "github.com/netdata/netdata/go/plugins/plugin/go.d/pkg/stm" + "github.com/netdata/netdata/go/plugins/plugin/go.d/pkg/web" +) + +var ( + //https://puppet.com/docs/puppet/8/server/status-api/v1/services + urlPathStatusService = "/status/v1/services" + urlQueryStatusService = url.Values{"level": {"debug"}}.Encode() +) + +func (p *Puppet) collect() (map[string]int64, error) { + stats, err := p.queryStatsService() + if err != nil { + return nil, err + } + + mx := stm.ToMap(stats) + + return mx, nil +} + +func (p *Puppet) queryStatsService() (*statusServiceResponse, error) { + req, err := web.NewHTTPRequestWithPath(p.Request, urlPathStatusService) + if err != nil { + return nil, err + } + + req.URL.RawQuery = urlQueryStatusService + + var stats statusServiceResponse + if err := p.doOKDecode(req, &stats); err != nil { + return nil, err + } + + if stats.StatusService == nil { + return nil, fmt.Errorf("unexpected response: not puppet service status data") + } + + return &stats, nil +} + +func (p *Puppet) doOKDecode(req *http.Request, in interface{}) error { + resp, err := p.httpClient.Do(req) + if err != nil { + return fmt.Errorf("error on HTTP request '%s': %v", req.URL, err) + } + defer closeBody(resp) + + if resp.StatusCode != http.StatusOK { + return fmt.Errorf("'%s' returned HTTP status code: %d", req.URL, resp.StatusCode) + } + + if err := json.NewDecoder(resp.Body).Decode(in); err != nil { + return fmt.Errorf("error on decoding response from '%s': %v", req.URL, err) + } + return nil +} + +func closeBody(resp *http.Response) { + if resp != nil && resp.Body != nil { + _, _ = io.Copy(io.Discard, resp.Body) + _ = resp.Body.Close() + } +} diff --git a/src/go/plugin/go.d/modules/puppet/config_schema.json b/src/go/plugin/go.d/modules/puppet/config_schema.json new file mode 100644 index 000000000..92cbcb87f --- /dev/null +++ b/src/go/plugin/go.d/modules/puppet/config_schema.json @@ -0,0 +1,177 @@ +{ + "jsonSchema": { + "$schema": "http://json-schema.org/draft-07/schema#", + "title": "Puppet collector configuration.", + "type": "object", + "properties": { + "update_every": { + "title": "Update every", + "description": "Data collection interval, measured in seconds.", + "type": "integer", + "minimum": 1, + "default": 1 + }, + "url": { + "title": "URL", + "description": "The base URL where the Puppet instance can be accessed.", + "type": "string", + "default": "https://127.0.0.1:8140", + "format": "uri" + }, + "timeout": { + "title": "Timeout", + "description": "The timeout in seconds for the HTTP request.", + "type": "number", + "minimum": 0.5, + "default": 1 + }, + "not_follow_redirects": { + "title": "Not follow redirects", + "description": "If set, the client will not follow HTTP redirects automatically.", + "type": "boolean" + }, + "username": { + "title": "Username", + "description": "The username for basic authentication.", + "type": "string", + "sensitive": true + }, + "password": { + "title": "Password", + "description": "The password for basic authentication.", + "type": "string", + "sensitive": true + }, + "proxy_url": { + "title": "Proxy URL", + "description": "The URL of the proxy server.", + "type": "string" + }, + "proxy_username": { + "title": "Proxy username", + "description": "The username for proxy authentication.", + "type": "string", + "sensitive": true + }, + "proxy_password": { + "title": "Proxy password", + "description": "The password for proxy authentication.", + "type": "string", + "sensitive": true + }, + "headers": { + "title": "Headers", + "description": "Additional HTTP headers to include in the request.", + "type": [ + "object", + "null" + ], + "additionalProperties": { + "type": "string" + } + }, + "tls_skip_verify": { + "title": "Skip TLS verification", + "description": "If set, TLS certificate verification will be skipped.", + "type": "boolean" + }, + "tls_ca": { + "title": "TLS CA", + "description": "The path to the CA certificate file for TLS verification.", + "type": "string", + "pattern": "^$|^/" + }, + "tls_cert": { + "title": "TLS certificate", + "description": "The path to the client certificate file for TLS authentication.", + "type": "string", + "pattern": "^$|^/" + }, + "tls_key": { + "title": "TLS key", + "description": "The path to the client key file for TLS authentication.", + "type": "string", + "pattern": "^$|^/" + }, + "body": { + "title": "Body", + "type": "string" + }, + "method": { + "title": "Method", + "type": "string" + } + }, + "required": [ + "url" + ], + "additionalProperties": false, + "patternProperties": { + "^name$": {} + } + }, + "uiSchema": { + "uiOptions": { + "fullPage": true + }, + "body": { + "ui:widget": "hidden" + }, + "method": { + "ui:widget": "hidden" + }, + "timeout": { + "ui:help": "Accepts decimals for precise control (e.g., type 1.5 for 1.5 seconds)." + }, + "password": { + "ui:widget": "password" + }, + "proxy_password": { + "ui:widget": "password" + }, + "ui:flavour": "tabs", + "ui:options": { + "tabs": [ + { + "title": "Base", + "fields": [ + "update_every", + "url", + "timeout", + "not_follow_redirects" + ] + }, + { + "title": "Auth", + "fields": [ + "username", + "password" + ] + }, + { + "title": "TLS", + "fields": [ + "tls_skip_verify", + "tls_ca", + "tls_cert", + "tls_key" + ] + }, + { + "title": "Proxy", + "fields": [ + "proxy_url", + "proxy_username", + "proxy_password" + ] + }, + { + "title": "Headers", + "fields": [ + "headers" + ] + } + ] + } + } +} diff --git a/src/go/plugin/go.d/modules/puppet/integrations/puppet.md b/src/go/plugin/go.d/modules/puppet/integrations/puppet.md new file mode 100644 index 000000000..23e85dc4d --- /dev/null +++ b/src/go/plugin/go.d/modules/puppet/integrations/puppet.md @@ -0,0 +1,233 @@ +<!--startmeta +custom_edit_url: "https://github.com/netdata/netdata/edit/master/src/go/plugin/go.d/modules/puppet/README.md" +meta_yaml: "https://github.com/netdata/netdata/edit/master/src/go/plugin/go.d/modules/puppet/metadata.yaml" +sidebar_label: "Puppet" +learn_status: "Published" +learn_rel_path: "Collecting Metrics/CICD Platforms" +most_popular: False +message: "DO NOT EDIT THIS FILE DIRECTLY, IT IS GENERATED BY THE COLLECTOR'S metadata.yaml FILE" +endmeta--> + +# Puppet + + +<img src="https://netdata.cloud/img/puppet.svg" width="150"/> + + +Plugin: go.d.plugin +Module: puppet + +<img src="https://img.shields.io/badge/maintained%20by-Netdata-%2300ab44" /> + +## Overview + +This collector monitors Puppet metrics, including JVM heap and non-heap memory, CPU usage, and file descriptors. + + +It uses Puppet's metrics API endpoint [/status/v1/services](https://www.puppet.com/docs/puppetserver/5.3/status-api/v1/services.html) to gather the metrics. + + +This collector is supported on all platforms. + +This collector supports collecting metrics from multiple instances of this integration, including remote instances. + + +### Default Behavior + +#### Auto-Detection + +By default, it detects Puppet instances running on localhost that are listening on port 8140. +On startup, it tries to collect metrics from: + +- https://127.0.0.1:8140 + + +#### Limits + +The default configuration for this integration does not impose any limits on data collection. + +#### Performance Impact + +The default configuration for this integration is not expected to impose a significant performance impact on the system. + + +## Metrics + +Metrics grouped by *scope*. + +The scope defines the instance that the metric belongs to. An instance is uniquely identified by a set of labels. + + + +### Per Puppet instance + +These metrics refer to the entire monitored application. + +This scope has no labels. + +Metrics: + +| Metric | Dimensions | Unit | +|:------|:----------|:----| +| puppet.jvm_heap | committed, used | MiB | +| puppet.jvm_nonheap | committed, used | MiB | +| puppet.cpu | execution, GC | percentage | +| puppet.fdopen | used | descriptors | + + + +## Alerts + +There are no alerts configured by default for this integration. + + +## Setup + +### Prerequisites + +No action required. + +### Configuration + +#### File + +The configuration file name for this integration is `go.d/puppet.conf`. + + +You can edit the configuration file using the `edit-config` script from the +Netdata [config directory](/docs/netdata-agent/configuration/README.md#the-netdata-config-directory). + +```bash +cd /etc/netdata 2>/dev/null || cd /opt/netdata/etc/netdata +sudo ./edit-config go.d/puppet.conf +``` +#### Options + +The following options can be defined globally: update_every, autodetection_retry. + + +<details open><summary></summary> + +| Name | Description | Default | Required | +|:----|:-----------|:-------|:--------:| +| url | The base URL where the Puppet instance can be accessed. | https://127.0.0.1:8140 | yes | +| timeout | HTTPS request timeout. | 1 | no | +| username | Username for basic HTTPS authentication. | | no | +| password | Password for basic HTTPS authentication. | | no | +| proxy_url | Proxy URL. | | no | +| proxy_username | Username for proxy basic HTTPS authentication. | | no | +| proxy_password | Password for proxy basic HTTPS authentication. | | no | +| method | HTTPS request method. | POST | no | +| body | HTTPS request body. | | no | +| headers | HTTPS request headers. | | no | +| not_follow_redirects | Redirect handling policy. Controls whether the client follows redirects. | no | no | +| tls_skip_verify | Server certificate chain and hostname validation policy. Controls whether the client performs this check. | no | no | +| tls_ca | Certification authority that the client uses when verifying the server's certificates. | | no | +| tls_cert | Client TLS certificate. | | no | +| tls_key | Client TLS key. | | no | + +</details> + +#### Examples + +##### Basic with self-signed certificate + +Puppet with self-signed TLS certificate. + +<details open><summary>Config</summary> + +```yaml +jobs: + - name: local + url: https://127.0.0.1:8140 + tls_skip_verify: yes + +``` +</details> + +##### Multi-instance + +> **Note**: When you define multiple jobs, their names must be unique. + +Collecting metrics from local and remote instances. + + +<details open><summary>Config</summary> + +```yaml +jobs: + - name: local + url: https://127.0.0.1:8140 + tls_skip_verify: yes + + - name: remote + url: https://192.0.2.1:8140 + tls_skip_verify: yes + +``` +</details> + + + +## Troubleshooting + +### Debug Mode + +**Important**: Debug mode is not supported for data collection jobs created via the UI using the Dyncfg feature. + +To troubleshoot issues with the `puppet` collector, run the `go.d.plugin` with the debug option enabled. The output +should give you clues as to why the collector isn't working. + +- Navigate to the `plugins.d` directory, usually at `/usr/libexec/netdata/plugins.d/`. If that's not the case on + your system, open `netdata.conf` and look for the `plugins` setting under `[directories]`. + + ```bash + cd /usr/libexec/netdata/plugins.d/ + ``` + +- Switch to the `netdata` user. + + ```bash + sudo -u netdata -s + ``` + +- Run the `go.d.plugin` to debug the collector: + + ```bash + ./go.d.plugin -d -m puppet + ``` + +### Getting Logs + +If you're encountering problems with the `puppet` collector, follow these steps to retrieve logs and identify potential issues: + +- **Run the command** specific to your system (systemd, non-systemd, or Docker container). +- **Examine the output** for any warnings or error messages that might indicate issues. These messages should provide clues about the root cause of the problem. + +#### System with systemd + +Use the following command to view logs generated since the last Netdata service restart: + +```bash +journalctl _SYSTEMD_INVOCATION_ID="$(systemctl show --value --property=InvocationID netdata)" --namespace=netdata --grep puppet +``` + +#### System without systemd + +Locate the collector log file, typically at `/var/log/netdata/collector.log`, and use `grep` to filter for collector's name: + +```bash +grep puppet /var/log/netdata/collector.log +``` + +**Note**: This method shows logs from all restarts. Focus on the **latest entries** for troubleshooting current issues. + +#### Docker Container + +If your Netdata runs in a Docker container named "netdata" (replace if different), use this command: + +```bash +docker logs netdata 2>&1 | grep puppet +``` + + diff --git a/src/go/plugin/go.d/modules/puppet/metadata.yaml b/src/go/plugin/go.d/modules/puppet/metadata.yaml new file mode 100644 index 000000000..fa96ea8f2 --- /dev/null +++ b/src/go/plugin/go.d/modules/puppet/metadata.yaml @@ -0,0 +1,184 @@ +plugin_name: go.d.plugin +modules: + - meta: + id: collector-go.d.plugin-puppet + plugin_name: go.d.plugin + module_name: puppet + monitored_instance: + name: Puppet + link: "https://www.puppet.com/" + categories: + - data-collection.ci-cd-systems + icon_filename: "puppet.svg" + related_resources: + integrations: + list: [] + info_provided_to_referring_integrations: + description: "" + keywords: + - puppet + most_popular: false + overview: + data_collection: + metrics_description: | + This collector monitors Puppet metrics, including JVM heap and non-heap memory, CPU usage, and file descriptors. + method_description: | + It uses Puppet's metrics API endpoint [/status/v1/services](https://www.puppet.com/docs/puppetserver/5.3/status-api/v1/services.html) to gather the metrics. + supported_platforms: + include: [] + exclude: [] + multi_instance: true + additional_permissions: + description: "" + default_behavior: + auto_detection: + description: | + By default, it detects Puppet instances running on localhost that are listening on port 8140. + On startup, it tries to collect metrics from: + + - https://127.0.0.1:8140 + limits: + description: "" + performance_impact: + description: "" + setup: + prerequisites: + list: [] + configuration: + file: + name: "go.d/puppet.conf" + options: + description: | + The following options can be defined globally: update_every, autodetection_retry. + folding: + title: "" + enabled: true + list: + - name: url + description: The base URL where the Puppet instance can be accessed. + default_value: https://127.0.0.1:8140 + required: true + - name: timeout + description: HTTPS request timeout. + default_value: 1 + required: false + - name: username + description: Username for basic HTTPS authentication. + default_value: "" + required: false + - name: password + description: Password for basic HTTPS authentication. + default_value: "" + required: false + - name: proxy_url + description: Proxy URL. + default_value: "" + required: false + - name: proxy_username + description: Username for proxy basic HTTPS authentication. + default_value: "" + required: false + - name: proxy_password + description: Password for proxy basic HTTPS authentication. + default_value: "" + required: false + - name: method + description: HTTPS request method. + default_value: POST + required: false + - name: body + description: HTTPS request body. + default_value: "" + required: false + - name: headers + description: HTTPS request headers. + default_value: "" + required: false + - name: not_follow_redirects + description: Redirect handling policy. Controls whether the client follows redirects. + default_value: false + required: false + - name: tls_skip_verify + description: Server certificate chain and hostname validation policy. Controls whether the client performs this check. + default_value: false + required: false + - name: tls_ca + description: Certification authority that the client uses when verifying the server's certificates. + default_value: "" + required: false + - name: tls_cert + description: Client TLS certificate. + default_value: "" + required: false + - name: tls_key + description: Client TLS key. + default_value: "" + required: false + examples: + folding: + enabled: true + title: "Config" + list: + - name: Basic with self-signed certificate + description: Puppet with self-signed TLS certificate. + config: | + jobs: + - name: local + url: https://127.0.0.1:8140 + tls_skip_verify: yes + - name: Multi-instance + description: | + > **Note**: When you define multiple jobs, their names must be unique. + + Collecting metrics from local and remote instances. + config: | + jobs: + - name: local + url: https://127.0.0.1:8140 + tls_skip_verify: yes + + - name: remote + url: https://192.0.2.1:8140 + tls_skip_verify: yes + troubleshooting: + problems: + list: [] + alerts: [] + metrics: + folding: + title: Metrics + enabled: false + description: "" + availability: [] + scopes: + - name: global + description: "These metrics refer to the entire monitored application." + labels: [] + metrics: + - name: puppet.jvm_heap + description: JVM Heap + unit: "MiB" + chart_type: area + dimensions: + - name: committed + - name: used + - name: puppet.jvm_nonheap + description: JVM Non-Heap + unit: "MiB" + chart_type: area + dimensions: + - name: committed + - name: used + - name: puppet.cpu + description: CPU usage + unit: "percentage" + chart_type: stacked + dimensions: + - name: execution + - name: GC + - name: puppet.fdopen + description: File Descriptors + unit: "descriptors" + chart_type: line + dimensions: + - name: used diff --git a/src/go/plugin/go.d/modules/puppet/puppet.go b/src/go/plugin/go.d/modules/puppet/puppet.go new file mode 100644 index 000000000..e6eb7b058 --- /dev/null +++ b/src/go/plugin/go.d/modules/puppet/puppet.go @@ -0,0 +1,114 @@ +// SPDX-License-Identifier: GPL-3.0-or-later + +package puppet + +import ( + _ "embed" + "errors" + "net/http" + "time" + + "github.com/netdata/netdata/go/plugins/plugin/go.d/agent/module" + "github.com/netdata/netdata/go/plugins/plugin/go.d/pkg/web" +) + +//go:embed "config_schema.json" +var configSchema string + +func init() { + module.Register("puppet", module.Creator{ + JobConfigSchema: configSchema, + Create: func() module.Module { return New() }, + Config: func() any { return &Config{} }, + }) +} + +func New() *Puppet { + return &Puppet{ + Config: Config{ + HTTP: web.HTTP{ + Request: web.Request{ + URL: "https://127.0.0.1:8140", + }, + Client: web.Client{ + Timeout: web.Duration(time.Second * 1), + }, + }, + }, + charts: charts.Copy(), + } +} + +type Config struct { + UpdateEvery int `yaml:"update_every,omitempty" json:"update_every"` + web.HTTP `yaml:",inline" json:""` +} + +type Puppet struct { + module.Base + Config `yaml:",inline" json:""` + + charts *module.Charts + + httpClient *http.Client +} + +func (p *Puppet) Configuration() any { + return p.Config +} + +func (p *Puppet) Init() error { + if p.URL == "" { + p.Error("URL not set") + return errors.New("url not set") + } + + client, err := web.NewHTTPClient(p.Client) + if err != nil { + p.Error(err) + return err + } + p.httpClient = client + + p.Debugf("using URL %s", p.URL) + p.Debugf("using timeout: %s", p.Timeout) + + return nil +} + +func (p *Puppet) Check() error { + mx, err := p.collect() + if err != nil { + p.Error(err) + return err + } + + if len(mx) == 0 { + return errors.New("no metrics collected") + } + + return nil +} + +func (p *Puppet) Charts() *module.Charts { + return p.charts +} + +func (p *Puppet) Collect() map[string]int64 { + mx, err := p.collect() + if err != nil { + p.Error(err) + } + + if len(mx) == 0 { + return nil + } + + return mx +} + +func (p *Puppet) Cleanup() { + if p.httpClient != nil { + p.httpClient.CloseIdleConnections() + } +} diff --git a/src/go/plugin/go.d/modules/puppet/puppet_test.go b/src/go/plugin/go.d/modules/puppet/puppet_test.go new file mode 100644 index 000000000..7c80a638a --- /dev/null +++ b/src/go/plugin/go.d/modules/puppet/puppet_test.go @@ -0,0 +1,252 @@ +// SPDX-License-Identifier: GPL-3.0-or-later + +package puppet + +import ( + "net/http" + "net/http/httptest" + "os" + "testing" + + "github.com/netdata/netdata/go/plugins/plugin/go.d/agent/module" + "github.com/netdata/netdata/go/plugins/plugin/go.d/pkg/web" + + "github.com/stretchr/testify/assert" + "github.com/stretchr/testify/require" +) + +var ( + dataConfigJSON, _ = os.ReadFile("testdata/config.json") + dataConfigYAML, _ = os.ReadFile("testdata/config.yaml") + + serviceStatusResponse, _ = os.ReadFile("testdata/serviceStatusResponse.json") +) + +func Test_testDataIsValid(t *testing.T) { + for name, data := range map[string][]byte{ + "dataConfigJSON": dataConfigJSON, + "dataConfigYAML": dataConfigYAML, + "serviceStatusResponse": serviceStatusResponse, + } { + require.NotNil(t, data, name) + } +} + +func TestPuppet_ConfigurationSerialize(t *testing.T) { + module.TestConfigurationSerialize(t, &Puppet{}, dataConfigJSON, dataConfigYAML) +} + +func TestPuppet_Init(t *testing.T) { + tests := map[string]struct { + wantFail bool + config Config + }{ + "success with default": { + wantFail: false, + config: New().Config, + }, + "fail when URL not set": { + wantFail: true, + config: Config{ + HTTP: web.HTTP{ + Request: web.Request{URL: ""}, + }, + }, + }, + } + + for name, test := range tests { + t.Run(name, func(t *testing.T) { + puppet := New() + puppet.Config = test.config + + if test.wantFail { + assert.Error(t, puppet.Init()) + } else { + assert.NoError(t, puppet.Init()) + } + }) + } +} + +func TestPuppet_Charts(t *testing.T) { + assert.NotNil(t, New().Charts()) +} + +func TestPuppet_Check(t *testing.T) { + tests := map[string]struct { + wantFail bool + prepare func(t *testing.T) (*Puppet, func()) + }{ + "success default config": { + wantFail: false, + prepare: prepareCaseOkDefault, + }, + "fails on unexpected json response": { + wantFail: true, + prepare: prepareCaseUnexpectedJsonResponse, + }, + "fails on invalid format response": { + wantFail: true, + prepare: prepareCaseInvalidFormatResponse, + }, + "fails on connection refused": { + wantFail: true, + prepare: prepareCaseConnectionRefused, + }, + } + + for name, test := range tests { + t.Run(name, func(t *testing.T) { + puppet, cleanup := test.prepare(t) + defer cleanup() + + if test.wantFail { + assert.Error(t, puppet.Check()) + } else { + assert.NoError(t, puppet.Check()) + } + }) + } +} + +func TestPuppet_Collect(t *testing.T) { + tests := map[string]struct { + prepare func(t *testing.T) (*Puppet, func()) + wantMetrics map[string]int64 + }{ + "success default config": { + prepare: prepareCaseOkDefault, + wantMetrics: map[string]int64{ + "cpu_usage": 49, + "fd_max": 524288, + "fd_used": 234, + "gc_cpu_usage": 0, + "jvm_heap_committed": 1073741824, + "jvm_heap_init": 1073741824, + "jvm_heap_max": 1073741824, + "jvm_heap_used": 550502400, + "jvm_nonheap_committed": 334102528, + "jvm_nonheap_init": 7667712, + "jvm_nonheap_max": -1, + "jvm_nonheap_used": 291591160, + }, + }, + "fails on unexpected json response": { + prepare: prepareCaseUnexpectedJsonResponse, + }, + "fails on invalid format response": { + prepare: prepareCaseInvalidFormatResponse, + }, + "fails on connection refused": { + prepare: prepareCaseConnectionRefused, + }, + } + + for name, test := range tests { + t.Run(name, func(t *testing.T) { + puppet, cleanup := test.prepare(t) + defer cleanup() + + mx := puppet.Collect() + + require.Equal(t, test.wantMetrics, mx) + if len(test.wantMetrics) > 0 { + testMetricsHasAllChartsDims(t, puppet, mx) + } + }) + } +} + +func testMetricsHasAllChartsDims(t *testing.T, puppet *Puppet, mx map[string]int64) { + for _, chart := range *puppet.Charts() { + if chart.Obsolete { + continue + } + for _, dim := range chart.Dims { + _, ok := mx[dim.ID] + assert.Truef(t, ok, "collected metrics has no data for dim '%s' chart '%s'", dim.ID, chart.ID) + } + for _, v := range chart.Vars { + _, ok := mx[v.ID] + assert.Truef(t, ok, "collected metrics has no data for var '%s' chart '%s'", v.ID, chart.ID) + } + } +} + +func prepareCaseOkDefault(t *testing.T) (*Puppet, func()) { + t.Helper() + srv := httptest.NewServer(http.HandlerFunc( + func(w http.ResponseWriter, r *http.Request) { + switch r.URL.Path { + case "/status/v1/services": + if r.URL.RawQuery != urlQueryStatusService { + w.WriteHeader(http.StatusNotFound) + } else { + _, _ = w.Write(serviceStatusResponse) + } + default: + w.WriteHeader(http.StatusNotFound) + } + })) + + puppet := New() + puppet.URL = srv.URL + require.NoError(t, puppet.Init()) + + return puppet, srv.Close +} + +func prepareCaseUnexpectedJsonResponse(t *testing.T) (*Puppet, func()) { + t.Helper() + resp := ` +{ + "elephant": { + "burn": false, + "mountain": true, + "fog": false, + "skin": -1561907625, + "burst": "anyway", + "shadow": 1558616893 + }, + "start": "ever", + "base": 2093056027, + "mission": -2007590351, + "victory": 999053756, + "die": false +} +` + srv := httptest.NewServer(http.HandlerFunc( + func(w http.ResponseWriter, r *http.Request) { + _, _ = w.Write([]byte(resp)) + })) + + puppet := New() + puppet.URL = srv.URL + require.NoError(t, puppet.Init()) + + return puppet, srv.Close +} + +func prepareCaseInvalidFormatResponse(t *testing.T) (*Puppet, func()) { + t.Helper() + srv := httptest.NewServer(http.HandlerFunc( + func(w http.ResponseWriter, r *http.Request) { + _, _ = w.Write([]byte("hello and\n goodbye")) + })) + + puppet := New() + puppet.URL = srv.URL + require.NoError(t, puppet.Init()) + + return puppet, srv.Close +} + +func prepareCaseConnectionRefused(t *testing.T) (*Puppet, func()) { + t.Helper() + puppet := New() + puppet.URL = "http://127.0.0.1:65001" + require.NoError(t, puppet.Init()) + + return puppet, func() {} +} diff --git a/src/go/plugin/go.d/modules/puppet/response.go b/src/go/plugin/go.d/modules/puppet/response.go new file mode 100644 index 000000000..dc903d0a9 --- /dev/null +++ b/src/go/plugin/go.d/modules/puppet/response.go @@ -0,0 +1,32 @@ +// SPDX-License-Identifier: GPL-3.0-or-later + +package puppet + +type statusServiceResponse struct { + StatusService *struct { + Status struct { + Experimental struct { + JVMMetrics *struct { + CPUUsage float64 `json:"cpu-usage" stm:"cpu_usage,1000,1"` + GCCPUUsage float64 `json:"gc-cpu-usage" stm:"gc_cpu_usage,1000,1"` + HeapMemory struct { + Committed int64 `json:"committed" stm:"committed"` + Init int64 `json:"init" stm:"init"` + Max int64 `json:"max" stm:"max"` + Used int64 `json:"used" stm:"used"` + } `json:"heap-memory" stm:"jvm_heap"` + FileDescriptors struct { + Used int `json:"used" stm:"used"` + Max int `json:"max" stm:"max"` + } `json:"file-descriptors" stm:"fd"` + NonHeapMemory struct { + Committed int64 `json:"committed" stm:"committed"` + Init int64 `json:"init" stm:"init"` + Max int64 `json:"max" stm:"max"` + Used int64 `json:"used" stm:"used"` + } `json:"non-heap-memory" stm:"jvm_nonheap"` + } `json:"jvm-metrics" stm:""` + } `json:"experimental" stm:""` + } `json:"status" stm:""` + } `json:"status-service" stm:""` +} diff --git a/src/go/collectors/go.d.plugin/modules/tengine/testdata/config.json b/src/go/plugin/go.d/modules/puppet/testdata/config.json index 984c3ed6e..984c3ed6e 100644 --- a/src/go/collectors/go.d.plugin/modules/tengine/testdata/config.json +++ b/src/go/plugin/go.d/modules/puppet/testdata/config.json diff --git a/src/go/collectors/go.d.plugin/modules/tengine/testdata/config.yaml b/src/go/plugin/go.d/modules/puppet/testdata/config.yaml index 8558b61cc..8558b61cc 100644 --- a/src/go/collectors/go.d.plugin/modules/tengine/testdata/config.yaml +++ b/src/go/plugin/go.d/modules/puppet/testdata/config.yaml diff --git a/src/go/plugin/go.d/modules/puppet/testdata/serviceStatusResponse.json b/src/go/plugin/go.d/modules/puppet/testdata/serviceStatusResponse.json new file mode 100644 index 000000000..a0eee8693 --- /dev/null +++ b/src/go/plugin/go.d/modules/puppet/testdata/serviceStatusResponse.json @@ -0,0 +1,497 @@ +{ + "puppet-profiler": { + "service_version": "8.4.0", + "service_status_version": 1, + "detail_level": "debug", + "state": "running", + "status": { + "experimental": { + "function-metrics": [], + "resource-metrics": [], + "catalog-metrics": [], + "puppetdb-metrics": [], + "inline-metrics": [] + } + }, + "active_alerts": [] + }, + "jruby-metrics": { + "service_version": "8.4.0", + "service_status_version": 1, + "detail_level": "debug", + "state": "running", + "status": { + "experimental": { + "jruby-pool-lock-status": { + "current-state": ":not-in-use", + "last-change-time": "2024-07-05T06:23:20.120Z" + }, + "metrics": { + "average-lock-wait-time": 0, + "num-free-jrubies": 4, + "borrow-count": 0, + "average-requested-jrubies": 0.0, + "borrow-timeout-count": 0, + "return-count": 0, + "borrow-timers": { + "total": { + "count": 0, + "mean": 0, + "max": 0, + "rate": 0.0 + } + }, + "borrow-retry-count": 0, + "borrowed-instances": [], + "average-borrow-time": 0, + "num-jrubies": 4, + "requested-count": 0, + "queue-limit-hit-rate": 0.0, + "average-lock-held-time": 0, + "requested-instances": [], + "queue-limit-hit-count": 0, + "average-free-jrubies": 3.3019592583652217, + "num-pool-locks": 0, + "average-wait-time": 0 + } + } + }, + "active_alerts": [] + }, + "ca": { + "service_version": "8.4.0", + "service_status_version": 1, + "detail_level": "debug", + "state": "running", + "status": {}, + "active_alerts": [] + }, + "master": { + "service_version": "8.4.0", + "service_status_version": 1, + "detail_level": "debug", + "state": "running", + "status": { + "experimental": { + "http-metrics": [ + { + "route-id": "puppet-v3-static_file_content-/*/", + "count": 0, + "mean": 0, + "aggregate": 0 + }, + { + "route-id": "puppet-v3-file_content-/*/", + "count": 0, + "mean": 0, + "aggregate": 0 + }, + { + "route-id": "puppet-v3-environments", + "count": 0, + "mean": 0, + "aggregate": 0 + }, + { + "route-id": "puppet-v3-tasks-:module-name-:task-name", + "count": 0, + "mean": 0, + "aggregate": 0 + }, + { + "route-id": "puppet-v3-file_metadata-/*/", + "count": 0, + "mean": 0, + "aggregate": 0 + }, + { + "route-id": "puppet-v3-facts-/*/", + "count": 0, + "mean": 0, + "aggregate": 0 + }, + { + "route-id": "other", + "count": 0, + "mean": 0, + "aggregate": 0 + }, + { + "route-id": "puppet-v3-tasks", + "count": 0, + "mean": 0, + "aggregate": 0 + }, + { + "route-id": "puppet-v3-compile", + "count": 0, + "mean": 0, + "aggregate": 0 + }, + { + "route-id": "puppet-v3-report-/*/", + "count": 0, + "mean": 0, + "aggregate": 0 + }, + { + "route-id": "puppet-v3-node-/*/", + "count": 0, + "mean": 0, + "aggregate": 0 + }, + { + "route-id": "puppet-v3-catalog-/*/", + "count": 0, + "mean": 0, + "aggregate": 0 + }, + { + "route-id": "puppet-v3-plans-:module-name-:plan-name", + "count": 0, + "mean": 0, + "aggregate": 0 + }, + { + "route-id": "puppet-v3-file_metadatas-/*/", + "count": 0, + "mean": 0, + "aggregate": 0 + }, + { + "route-id": "puppet-v3-file_bucket_file-/*/", + "count": 0, + "mean": 0, + "aggregate": 0 + }, + { + "route-id": "puppet-v4-catalog", + "count": 0, + "mean": 0, + "aggregate": 0 + }, + { + "route-id": "total", + "count": 0, + "mean": 0, + "aggregate": 0 + }, + { + "route-id": "puppet-v3-environment_modules-/*/", + "count": 0, + "mean": 0, + "aggregate": 0 + }, + { + "route-id": "puppet-v3-environment_classes-/*/", + "count": 0, + "mean": 0, + "aggregate": 0 + }, + { + "route-id": "puppet-v3-plans", + "count": 0, + "mean": 0, + "aggregate": 0 + }, + { + "route-id": "puppet-v3-environment_transports-/*/", + "count": 0, + "mean": 0, + "aggregate": 0 + } + ], + "http-client-metrics": [] + } + }, + "active_alerts": [] + }, + "server": { + "service_version": "8.4.0", + "service_status_version": 1, + "detail_level": "debug", + "state": "running", + "status": { + "experimental": { + "http-metrics": [ + { + "route-id": "puppet-v3-static_file_content-/*/", + "count": 0, + "mean": 0, + "aggregate": 0 + }, + { + "route-id": "puppet-v3-file_content-/*/", + "count": 0, + "mean": 0, + "aggregate": 0 + }, + { + "route-id": "puppet-v3-environments", + "count": 0, + "mean": 0, + "aggregate": 0 + }, + { + "route-id": "puppet-v3-tasks-:module-name-:task-name", + "count": 0, + "mean": 0, + "aggregate": 0 + }, + { + "route-id": "puppet-v3-file_metadata-/*/", + "count": 0, + "mean": 0, + "aggregate": 0 + }, + { + "route-id": "puppet-v3-facts-/*/", + "count": 0, + "mean": 0, + "aggregate": 0 + }, + { + "route-id": "other", + "count": 0, + "mean": 0, + "aggregate": 0 + }, + { + "route-id": "puppet-v3-tasks", + "count": 0, + "mean": 0, + "aggregate": 0 + }, + { + "route-id": "puppet-v3-compile", + "count": 0, + "mean": 0, + "aggregate": 0 + }, + { + "route-id": "puppet-v3-report-/*/", + "count": 0, + "mean": 0, + "aggregate": 0 + }, + { + "route-id": "puppet-v3-node-/*/", + "count": 0, + "mean": 0, + "aggregate": 0 + }, + { + "route-id": "puppet-v3-catalog-/*/", + "count": 0, + "mean": 0, + "aggregate": 0 + }, + { + "route-id": "puppet-v3-plans-:module-name-:plan-name", + "count": 0, + "mean": 0, + "aggregate": 0 + }, + { + "route-id": "puppet-v3-file_metadatas-/*/", + "count": 0, + "mean": 0, + "aggregate": 0 + }, + { + "route-id": "puppet-v3-file_bucket_file-/*/", + "count": 0, + "mean": 0, + "aggregate": 0 + }, + { + "route-id": "puppet-v4-catalog", + "count": 0, + "mean": 0, + "aggregate": 0 + }, + { + "route-id": "total", + "count": 0, + "mean": 0, + "aggregate": 0 + }, + { + "route-id": "puppet-v3-environment_modules-/*/", + "count": 0, + "mean": 0, + "aggregate": 0 + }, + { + "route-id": "puppet-v3-environment_classes-/*/", + "count": 0, + "mean": 0, + "aggregate": 0 + }, + { + "route-id": "puppet-v3-plans", + "count": 0, + "mean": 0, + "aggregate": 0 + }, + { + "route-id": "puppet-v3-environment_transports-/*/", + "count": 0, + "mean": 0, + "aggregate": 0 + } + ], + "http-client-metrics": [] + } + }, + "active_alerts": [] + }, + "status-service": { + "service_version": "1.1.1", + "service_status_version": 1, + "detail_level": "debug", + "state": "running", + "status": { + "experimental": { + "jvm-metrics": { + "cpu-usage": 0.04997002, + "up-time-ms": 51328, + "memory-pools": { + "Metaspace": { + "type": "NON_HEAP", + "usage": { + "committed": 214106112, + "init": 0, + "max": -1, + "used": 183450600 + } + }, + "CodeHeap 'non-nmethods'": { + "type": "NON_HEAP", + "usage": { + "committed": 2555904, + "init": 2555904, + "max": 5840896, + "used": 1923072 + } + }, + "CodeHeap 'profiled nmethods'": { + "type": "NON_HEAP", + "usage": { + "committed": 52559872, + "init": 2555904, + "max": 122908672, + "used": 52545664 + } + }, + "Compressed Class Space": { + "type": "NON_HEAP", + "usage": { + "committed": 49020928, + "init": 0, + "max": 1073741824, + "used": 37887856 + } + }, + "G1 Eden Space": { + "type": "HEAP", + "usage": { + "committed": 542113792, + "init": 53477376, + "max": -1, + "used": 146800640 + } + }, + "G1 Old Gen": { + "type": "HEAP", + "usage": { + "committed": 462422016, + "init": 1020264448, + "max": 1073741824, + "used": 335020032 + } + }, + "G1 Survivor Space": { + "type": "HEAP", + "usage": { + "committed": 69206016, + "init": 0, + "max": -1, + "used": 68681728 + } + }, + "CodeHeap 'non-profiled nmethods'": { + "type": "NON_HEAP", + "usage": { + "committed": 15597568, + "init": 2555904, + "max": 122908672, + "used": 15588736 + } + } + }, + "gc-cpu-usage": 0.0, + "threading": { + "thread-count": 59, + "peak-thread-count": 59 + }, + "heap-memory": { + "committed": 1073741824, + "init": 1073741824, + "max": 1073741824, + "used": 550502400 + }, + "gc-stats": { + "G1 Young Generation": { + "count": 18, + "total-time-ms": 550, + "last-gc-info": { + "duration-ms": 75 + } + }, + "G1 Old Generation": { + "count": 0, + "total-time-ms": 0 + }, + "G1 Concurrent GC": { + "count": 10, + "total-time-ms": 49, + "last-gc-info": { + "duration-ms": 0 + } + } + }, + "start-time-ms": 1720160584298, + "file-descriptors": { + "used": 234, + "max": 524288 + }, + "non-heap-memory": { + "committed": 334102528, + "init": 7667712, + "max": -1, + "used": 291591160 + }, + "nio-buffer-pools": { + "mapped": { + "count": 0, + "memory-used": 0, + "total-capacity": 0 + }, + "direct": { + "count": 11, + "memory-used": 197631, + "total-capacity": 197631 + }, + "mapped - 'non-volatile memory'": { + "count": 0, + "memory-used": 0, + "total-capacity": 0 + } + } + } + } + }, + "active_alerts": [] + } +} diff --git a/src/go/collectors/go.d.plugin/modules/rabbitmq/README.md b/src/go/plugin/go.d/modules/rabbitmq/README.md index 0119db91a..0119db91a 120000 --- a/src/go/collectors/go.d.plugin/modules/rabbitmq/README.md +++ b/src/go/plugin/go.d/modules/rabbitmq/README.md diff --git a/src/go/collectors/go.d.plugin/modules/rabbitmq/charts.go b/src/go/plugin/go.d/modules/rabbitmq/charts.go index 99b431907..f580a2f26 100644 --- a/src/go/collectors/go.d.plugin/modules/rabbitmq/charts.go +++ b/src/go/plugin/go.d/modules/rabbitmq/charts.go @@ -6,7 +6,7 @@ import ( "fmt" "strings" - "github.com/netdata/netdata/go/go.d.plugin/agent/module" + "github.com/netdata/netdata/go/plugins/plugin/go.d/agent/module" ) const ( diff --git a/src/go/collectors/go.d.plugin/modules/rabbitmq/collect.go b/src/go/plugin/go.d/modules/rabbitmq/collect.go index 665dfdfc8..70b2aa033 100644 --- a/src/go/collectors/go.d.plugin/modules/rabbitmq/collect.go +++ b/src/go/plugin/go.d/modules/rabbitmq/collect.go @@ -9,8 +9,8 @@ import ( "net/http" "path/filepath" - "github.com/netdata/netdata/go/go.d.plugin/pkg/stm" - "github.com/netdata/netdata/go/go.d.plugin/pkg/web" + "github.com/netdata/netdata/go/plugins/plugin/go.d/pkg/stm" + "github.com/netdata/netdata/go/plugins/plugin/go.d/pkg/web" ) const ( @@ -145,13 +145,11 @@ func (r *RabbitMQ) collectQueuesStats(mx map[string]int64) error { } func (r *RabbitMQ) doOKDecode(urlPath string, in interface{}) error { - req, err := web.NewHTTPRequest(r.Request.Copy()) + req, err := web.NewHTTPRequestWithPath(r.Request, urlPath) if err != nil { return fmt.Errorf("error on creating request: %v", err) } - req.URL.Path = urlPath - r.Debugf("doing HTTP %s to '%s'", req.Method, req.URL) resp, err := r.httpClient.Do(req) if err != nil { diff --git a/src/go/collectors/go.d.plugin/modules/rabbitmq/config_schema.json b/src/go/plugin/go.d/modules/rabbitmq/config_schema.json index 3636513e6..defa70142 100644 --- a/src/go/collectors/go.d.plugin/modules/rabbitmq/config_schema.json +++ b/src/go/plugin/go.d/modules/rabbitmq/config_schema.json @@ -176,6 +176,12 @@ "timeout": { "ui:help": "Accepts decimals for precise control (e.g., type 1.5 for 1.5 seconds)." }, + "username": { + "ui:widget": "password" + }, + "proxy_username": { + "ui:widget": "password" + }, "password": { "ui:widget": "password" }, diff --git a/src/go/collectors/go.d.plugin/modules/rabbitmq/integrations/rabbitmq.md b/src/go/plugin/go.d/modules/rabbitmq/integrations/rabbitmq.md index 519b807e3..e4c9df588 100644 --- a/src/go/collectors/go.d.plugin/modules/rabbitmq/integrations/rabbitmq.md +++ b/src/go/plugin/go.d/modules/rabbitmq/integrations/rabbitmq.md @@ -1,6 +1,6 @@ <!--startmeta -custom_edit_url: "https://github.com/netdata/netdata/edit/master/src/go/collectors/go.d.plugin/modules/rabbitmq/README.md" -meta_yaml: "https://github.com/netdata/netdata/edit/master/src/go/collectors/go.d.plugin/modules/rabbitmq/metadata.yaml" +custom_edit_url: "https://github.com/netdata/netdata/edit/master/src/go/plugin/go.d/modules/rabbitmq/README.md" +meta_yaml: "https://github.com/netdata/netdata/edit/master/src/go/plugin/go.d/modules/rabbitmq/metadata.yaml" sidebar_label: "RabbitMQ" learn_status: "Published" learn_rel_path: "Collecting Metrics/Message Brokers" @@ -240,6 +240,8 @@ jobs: ### Debug Mode +**Important**: Debug mode is not supported for data collection jobs created via the UI using the Dyncfg feature. + To troubleshoot issues with the `rabbitmq` collector, run the `go.d.plugin` with the debug option enabled. The output should give you clues as to why the collector isn't working. @@ -262,4 +264,37 @@ should give you clues as to why the collector isn't working. ./go.d.plugin -d -m rabbitmq ``` +### Getting Logs + +If you're encountering problems with the `rabbitmq` collector, follow these steps to retrieve logs and identify potential issues: + +- **Run the command** specific to your system (systemd, non-systemd, or Docker container). +- **Examine the output** for any warnings or error messages that might indicate issues. These messages should provide clues about the root cause of the problem. + +#### System with systemd + +Use the following command to view logs generated since the last Netdata service restart: + +```bash +journalctl _SYSTEMD_INVOCATION_ID="$(systemctl show --value --property=InvocationID netdata)" --namespace=netdata --grep rabbitmq +``` + +#### System without systemd + +Locate the collector log file, typically at `/var/log/netdata/collector.log`, and use `grep` to filter for collector's name: + +```bash +grep rabbitmq /var/log/netdata/collector.log +``` + +**Note**: This method shows logs from all restarts. Focus on the **latest entries** for troubleshooting current issues. + +#### Docker Container + +If your Netdata runs in a Docker container named "netdata" (replace if different), use this command: + +```bash +docker logs netdata 2>&1 | grep rabbitmq +``` + diff --git a/src/go/collectors/go.d.plugin/modules/rabbitmq/metadata.yaml b/src/go/plugin/go.d/modules/rabbitmq/metadata.yaml index f0a17b9e7..f0a17b9e7 100644 --- a/src/go/collectors/go.d.plugin/modules/rabbitmq/metadata.yaml +++ b/src/go/plugin/go.d/modules/rabbitmq/metadata.yaml diff --git a/src/go/collectors/go.d.plugin/modules/rabbitmq/metrics.go b/src/go/plugin/go.d/modules/rabbitmq/metrics.go index 871dfd57e..871dfd57e 100644 --- a/src/go/collectors/go.d.plugin/modules/rabbitmq/metrics.go +++ b/src/go/plugin/go.d/modules/rabbitmq/metrics.go diff --git a/src/go/collectors/go.d.plugin/modules/rabbitmq/rabbitmq.go b/src/go/plugin/go.d/modules/rabbitmq/rabbitmq.go index b07e50ed3..74805dab7 100644 --- a/src/go/collectors/go.d.plugin/modules/rabbitmq/rabbitmq.go +++ b/src/go/plugin/go.d/modules/rabbitmq/rabbitmq.go @@ -8,8 +8,8 @@ import ( "net/http" "time" - "github.com/netdata/netdata/go/go.d.plugin/agent/module" - "github.com/netdata/netdata/go/go.d.plugin/pkg/web" + "github.com/netdata/netdata/go/plugins/plugin/go.d/agent/module" + "github.com/netdata/netdata/go/plugins/plugin/go.d/pkg/web" ) //go:embed "config_schema.json" diff --git a/src/go/collectors/go.d.plugin/modules/rabbitmq/rabbitmq_test.go b/src/go/plugin/go.d/modules/rabbitmq/rabbitmq_test.go index 0d46d496e..7c4fe719e 100644 --- a/src/go/collectors/go.d.plugin/modules/rabbitmq/rabbitmq_test.go +++ b/src/go/plugin/go.d/modules/rabbitmq/rabbitmq_test.go @@ -9,8 +9,8 @@ import ( "path/filepath" "testing" - "github.com/netdata/netdata/go/go.d.plugin/agent/module" - "github.com/netdata/netdata/go/go.d.plugin/pkg/web" + "github.com/netdata/netdata/go/plugins/plugin/go.d/agent/module" + "github.com/netdata/netdata/go/plugins/plugin/go.d/pkg/web" "github.com/stretchr/testify/assert" "github.com/stretchr/testify/require" diff --git a/src/go/collectors/go.d.plugin/modules/rabbitmq/testdata/config.json b/src/go/plugin/go.d/modules/rabbitmq/testdata/config.json index b3f637f06..b3f637f06 100644 --- a/src/go/collectors/go.d.plugin/modules/rabbitmq/testdata/config.json +++ b/src/go/plugin/go.d/modules/rabbitmq/testdata/config.json diff --git a/src/go/collectors/go.d.plugin/modules/rabbitmq/testdata/config.yaml b/src/go/plugin/go.d/modules/rabbitmq/testdata/config.yaml index 12bb79bec..12bb79bec 100644 --- a/src/go/collectors/go.d.plugin/modules/rabbitmq/testdata/config.yaml +++ b/src/go/plugin/go.d/modules/rabbitmq/testdata/config.yaml diff --git a/src/go/collectors/go.d.plugin/modules/rabbitmq/testdata/v3.11.5/api-nodes-node.json b/src/go/plugin/go.d/modules/rabbitmq/testdata/v3.11.5/api-nodes-node.json index cc0a0ceb0..cc0a0ceb0 100644 --- a/src/go/collectors/go.d.plugin/modules/rabbitmq/testdata/v3.11.5/api-nodes-node.json +++ b/src/go/plugin/go.d/modules/rabbitmq/testdata/v3.11.5/api-nodes-node.json diff --git a/src/go/collectors/go.d.plugin/modules/rabbitmq/testdata/v3.11.5/api-overview.json b/src/go/plugin/go.d/modules/rabbitmq/testdata/v3.11.5/api-overview.json index 5c71aaf5d..5c71aaf5d 100644 --- a/src/go/collectors/go.d.plugin/modules/rabbitmq/testdata/v3.11.5/api-overview.json +++ b/src/go/plugin/go.d/modules/rabbitmq/testdata/v3.11.5/api-overview.json diff --git a/src/go/collectors/go.d.plugin/modules/rabbitmq/testdata/v3.11.5/api-queues.json b/src/go/plugin/go.d/modules/rabbitmq/testdata/v3.11.5/api-queues.json index 40c6e6c80..40c6e6c80 100644 --- a/src/go/collectors/go.d.plugin/modules/rabbitmq/testdata/v3.11.5/api-queues.json +++ b/src/go/plugin/go.d/modules/rabbitmq/testdata/v3.11.5/api-queues.json diff --git a/src/go/collectors/go.d.plugin/modules/rabbitmq/testdata/v3.11.5/api-vhosts.json b/src/go/plugin/go.d/modules/rabbitmq/testdata/v3.11.5/api-vhosts.json index ed2c3418d..ed2c3418d 100644 --- a/src/go/collectors/go.d.plugin/modules/rabbitmq/testdata/v3.11.5/api-vhosts.json +++ b/src/go/plugin/go.d/modules/rabbitmq/testdata/v3.11.5/api-vhosts.json diff --git a/src/go/collectors/go.d.plugin/modules/redis/README.md b/src/go/plugin/go.d/modules/redis/README.md index e41666257..e41666257 120000 --- a/src/go/collectors/go.d.plugin/modules/redis/README.md +++ b/src/go/plugin/go.d/modules/redis/README.md diff --git a/src/go/collectors/go.d.plugin/modules/redis/charts.go b/src/go/plugin/go.d/modules/redis/charts.go index 9fcf2338f..6d4f638bb 100644 --- a/src/go/collectors/go.d.plugin/modules/redis/charts.go +++ b/src/go/plugin/go.d/modules/redis/charts.go @@ -2,7 +2,7 @@ package redis -import "github.com/netdata/netdata/go/go.d.plugin/agent/module" +import "github.com/netdata/netdata/go/plugins/plugin/go.d/agent/module" const ( prioConnections = module.Priority + iota diff --git a/src/go/collectors/go.d.plugin/modules/redis/collect.go b/src/go/plugin/go.d/modules/redis/collect.go index 026164672..026164672 100644 --- a/src/go/collectors/go.d.plugin/modules/redis/collect.go +++ b/src/go/plugin/go.d/modules/redis/collect.go diff --git a/src/go/collectors/go.d.plugin/modules/redis/collect_info.go b/src/go/plugin/go.d/modules/redis/collect_info.go index ce6cae062..81f3646de 100644 --- a/src/go/collectors/go.d.plugin/modules/redis/collect_info.go +++ b/src/go/plugin/go.d/modules/redis/collect_info.go @@ -9,7 +9,7 @@ import ( "strings" "time" - "github.com/netdata/netdata/go/go.d.plugin/agent/module" + "github.com/netdata/netdata/go/plugins/plugin/go.d/agent/module" ) const ( diff --git a/src/go/collectors/go.d.plugin/modules/redis/collect_ping_latency.go b/src/go/plugin/go.d/modules/redis/collect_ping_latency.go index 063673c2c..063673c2c 100644 --- a/src/go/collectors/go.d.plugin/modules/redis/collect_ping_latency.go +++ b/src/go/plugin/go.d/modules/redis/collect_ping_latency.go diff --git a/src/go/collectors/go.d.plugin/modules/redis/config_schema.json b/src/go/plugin/go.d/modules/redis/config_schema.json index c1ea6768c..c57b06ac0 100644 --- a/src/go/collectors/go.d.plugin/modules/redis/config_schema.json +++ b/src/go/plugin/go.d/modules/redis/config_schema.json @@ -15,7 +15,7 @@ "title": "URI", "description": "The URI specifying the connection details for the Redis server.", "type": "string", - "default": "redis://@localhost:9221" + "default": "redis://@localhost:6379" }, "timeout": { "title": "Timeout", @@ -83,6 +83,9 @@ "timeout": { "ui:help": "Accepts decimals for precise control (e.g., type 1.5 for 1.5 seconds)." }, + "username": { + "ui:widget": "password" + }, "password": { "ui:widget": "password" }, diff --git a/src/go/collectors/go.d.plugin/modules/redis/init.go b/src/go/plugin/go.d/modules/redis/init.go index 6fcf4379d..8190be778 100644 --- a/src/go/collectors/go.d.plugin/modules/redis/init.go +++ b/src/go/plugin/go.d/modules/redis/init.go @@ -5,8 +5,8 @@ package redis import ( "errors" - "github.com/netdata/netdata/go/go.d.plugin/agent/module" - "github.com/netdata/netdata/go/go.d.plugin/pkg/tlscfg" + "github.com/netdata/netdata/go/plugins/plugin/go.d/agent/module" + "github.com/netdata/netdata/go/plugins/plugin/go.d/pkg/tlscfg" "github.com/go-redis/redis/v8" ) diff --git a/src/go/collectors/go.d.plugin/modules/redis/integrations/redis.md b/src/go/plugin/go.d/modules/redis/integrations/redis.md index 4bf20074c..52dfbf8f2 100644 --- a/src/go/collectors/go.d.plugin/modules/redis/integrations/redis.md +++ b/src/go/plugin/go.d/modules/redis/integrations/redis.md @@ -1,6 +1,6 @@ <!--startmeta -custom_edit_url: "https://github.com/netdata/netdata/edit/master/src/go/collectors/go.d.plugin/modules/redis/README.md" -meta_yaml: "https://github.com/netdata/netdata/edit/master/src/go/collectors/go.d.plugin/modules/redis/metadata.yaml" +custom_edit_url: "https://github.com/netdata/netdata/edit/master/src/go/plugin/go.d/modules/redis/README.md" +meta_yaml: "https://github.com/netdata/netdata/edit/master/src/go/plugin/go.d/modules/redis/metadata.yaml" sidebar_label: "Redis" learn_status: "Published" learn_rel_path: "Collecting Metrics/Databases" @@ -227,6 +227,8 @@ jobs: ### Debug Mode +**Important**: Debug mode is not supported for data collection jobs created via the UI using the Dyncfg feature. + To troubleshoot issues with the `redis` collector, run the `go.d.plugin` with the debug option enabled. The output should give you clues as to why the collector isn't working. @@ -249,4 +251,37 @@ should give you clues as to why the collector isn't working. ./go.d.plugin -d -m redis ``` +### Getting Logs + +If you're encountering problems with the `redis` collector, follow these steps to retrieve logs and identify potential issues: + +- **Run the command** specific to your system (systemd, non-systemd, or Docker container). +- **Examine the output** for any warnings or error messages that might indicate issues. These messages should provide clues about the root cause of the problem. + +#### System with systemd + +Use the following command to view logs generated since the last Netdata service restart: + +```bash +journalctl _SYSTEMD_INVOCATION_ID="$(systemctl show --value --property=InvocationID netdata)" --namespace=netdata --grep redis +``` + +#### System without systemd + +Locate the collector log file, typically at `/var/log/netdata/collector.log`, and use `grep` to filter for collector's name: + +```bash +grep redis /var/log/netdata/collector.log +``` + +**Note**: This method shows logs from all restarts. Focus on the **latest entries** for troubleshooting current issues. + +#### Docker Container + +If your Netdata runs in a Docker container named "netdata" (replace if different), use this command: + +```bash +docker logs netdata 2>&1 | grep redis +``` + diff --git a/src/go/collectors/go.d.plugin/modules/redis/metadata.yaml b/src/go/plugin/go.d/modules/redis/metadata.yaml index 2d94017d6..2d94017d6 100644 --- a/src/go/collectors/go.d.plugin/modules/redis/metadata.yaml +++ b/src/go/plugin/go.d/modules/redis/metadata.yaml diff --git a/src/go/collectors/go.d.plugin/modules/redis/redis.go b/src/go/plugin/go.d/modules/redis/redis.go index 009f34775..954205e1e 100644 --- a/src/go/collectors/go.d.plugin/modules/redis/redis.go +++ b/src/go/plugin/go.d/modules/redis/redis.go @@ -9,10 +9,10 @@ import ( "sync" "time" - "github.com/netdata/netdata/go/go.d.plugin/agent/module" - "github.com/netdata/netdata/go/go.d.plugin/pkg/metrics" - "github.com/netdata/netdata/go/go.d.plugin/pkg/tlscfg" - "github.com/netdata/netdata/go/go.d.plugin/pkg/web" + "github.com/netdata/netdata/go/plugins/plugin/go.d/agent/module" + "github.com/netdata/netdata/go/plugins/plugin/go.d/pkg/metrics" + "github.com/netdata/netdata/go/plugins/plugin/go.d/pkg/tlscfg" + "github.com/netdata/netdata/go/plugins/plugin/go.d/pkg/web" "github.com/blang/semver/v4" "github.com/go-redis/redis/v8" diff --git a/src/go/collectors/go.d.plugin/modules/redis/redis_test.go b/src/go/plugin/go.d/modules/redis/redis_test.go index c96232c34..e295f0f97 100644 --- a/src/go/collectors/go.d.plugin/modules/redis/redis_test.go +++ b/src/go/plugin/go.d/modules/redis/redis_test.go @@ -9,8 +9,8 @@ import ( "strings" "testing" - "github.com/netdata/netdata/go/go.d.plugin/agent/module" - "github.com/netdata/netdata/go/go.d.plugin/pkg/tlscfg" + "github.com/netdata/netdata/go/plugins/plugin/go.d/agent/module" + "github.com/netdata/netdata/go/plugins/plugin/go.d/pkg/tlscfg" "github.com/go-redis/redis/v8" "github.com/stretchr/testify/assert" diff --git a/src/go/collectors/go.d.plugin/modules/redis/testdata/config.json b/src/go/plugin/go.d/modules/redis/testdata/config.json index 050cfa3f4..050cfa3f4 100644 --- a/src/go/collectors/go.d.plugin/modules/redis/testdata/config.json +++ b/src/go/plugin/go.d/modules/redis/testdata/config.json diff --git a/src/go/collectors/go.d.plugin/modules/redis/testdata/config.yaml b/src/go/plugin/go.d/modules/redis/testdata/config.yaml index 57c5cf7ea..57c5cf7ea 100644 --- a/src/go/collectors/go.d.plugin/modules/redis/testdata/config.yaml +++ b/src/go/plugin/go.d/modules/redis/testdata/config.yaml diff --git a/src/go/collectors/go.d.plugin/modules/redis/testdata/pika/info_all.txt b/src/go/plugin/go.d/modules/redis/testdata/pika/info_all.txt index a2bebf720..a2bebf720 100644 --- a/src/go/collectors/go.d.plugin/modules/redis/testdata/pika/info_all.txt +++ b/src/go/plugin/go.d/modules/redis/testdata/pika/info_all.txt diff --git a/src/go/collectors/go.d.plugin/modules/redis/testdata/v6.0.9/info_all.txt b/src/go/plugin/go.d/modules/redis/testdata/v6.0.9/info_all.txt index 9f1618982..9f1618982 100644 --- a/src/go/collectors/go.d.plugin/modules/redis/testdata/v6.0.9/info_all.txt +++ b/src/go/plugin/go.d/modules/redis/testdata/v6.0.9/info_all.txt diff --git a/src/collectors/python.d.plugin/rethinkdbs/README.md b/src/go/plugin/go.d/modules/rethinkdb/README.md index 78ddcfa18..78ddcfa18 120000 --- a/src/collectors/python.d.plugin/rethinkdbs/README.md +++ b/src/go/plugin/go.d/modules/rethinkdb/README.md diff --git a/src/go/plugin/go.d/modules/rethinkdb/charts.go b/src/go/plugin/go.d/modules/rethinkdb/charts.go new file mode 100644 index 000000000..989a8c1e9 --- /dev/null +++ b/src/go/plugin/go.d/modules/rethinkdb/charts.go @@ -0,0 +1,189 @@ +// SPDX-License-Identifier: GPL-3.0-or-later + +package rethinkdb + +import ( + "fmt" + "strings" + + "github.com/netdata/netdata/go/plugins/plugin/go.d/agent/module" +) + +const ( + prioClusterServersStatsRequest = module.Priority + iota + prioClusterClientConnections + prioClusterActiveClients + prioClusterQueries + prioClusterDocuments + + prioServerStatsRequestStatus + prioServerClientConnections + prioServerActiveClients + prioServerQueries + prioServerDocuments +) + +var clusterCharts = module.Charts{ + clusterServersStatsRequestChart.Copy(), + clusterClientConnectionsChart.Copy(), + clusterActiveClientsChart.Copy(), + clusterQueriesChart.Copy(), + clusterDocumentsChart.Copy(), +} + +var ( + clusterServersStatsRequestChart = module.Chart{ + ID: "cluster_cluster_servers_stats_request", + Title: "Cluster Servers Stats Request", + Units: "servers", + Fam: "servers", + Ctx: "rethinkdb.cluster_servers_stats_request", + Priority: prioClusterServersStatsRequest, + Dims: module.Dims{ + {ID: "cluster_servers_stats_request_success", Name: "success"}, + {ID: "cluster_servers_stats_request_timeout", Name: "timeout"}, + }, + } + clusterClientConnectionsChart = module.Chart{ + ID: "cluster_client_connections", + Title: "Cluster Client Connections", + Units: "connections", + Fam: "connections", + Ctx: "rethinkdb.cluster_client_connections", + Priority: prioClusterClientConnections, + Dims: module.Dims{ + {ID: "cluster_client_connections", Name: "connections"}, + }, + } + clusterActiveClientsChart = module.Chart{ + ID: "cluster_active_clients", + Title: "Cluster Active Clients", + Units: "clients", + Fam: "clients", + Ctx: "rethinkdb.cluster_active_clients", + Priority: prioClusterActiveClients, + Dims: module.Dims{ + {ID: "cluster_clients_active", Name: "active"}, + }, + } + clusterQueriesChart = module.Chart{ + ID: "cluster_queries", + Title: "Cluster Queries", + Units: "queries/s", + Fam: "queries", + Ctx: "rethinkdb.cluster_queries", + Priority: prioClusterQueries, + Dims: module.Dims{ + {ID: "cluster_queries_total", Name: "queries", Algo: module.Incremental}, + }, + } + clusterDocumentsChart = module.Chart{ + ID: "cluster_documents", + Title: "Cluster Documents", + Units: "documents/s", + Fam: "documents", + Ctx: "rethinkdb.cluster_documents", + Priority: prioClusterDocuments, + Dims: module.Dims{ + {ID: "cluster_read_docs_total", Name: "read", Algo: module.Incremental}, + {ID: "cluster_written_docs_total", Name: "written", Mul: -1, Algo: module.Incremental}, + }, + } +) + +var serverChartsTmpl = module.Charts{ + serverStatsRequestStatusChartTmpl.Copy(), + serverConnectionsChartTmpl.Copy(), + serverActiveClientsChartTmpl.Copy(), + serverQueriesChartTmpl.Copy(), + serverDocumentsChartTmpl.Copy(), +} + +var ( + serverStatsRequestStatusChartTmpl = module.Chart{ + ID: "server_%s_stats_request_status", + Title: "Server Stats Request Status", + Units: "status", + Fam: "srv status", + Ctx: "rethinkdb.server_stats_request_status", + Priority: prioServerStatsRequestStatus, + Dims: module.Dims{ + {ID: "server_%s_stats_request_status_success", Name: "success"}, + {ID: "server_%s_stats_request_status_timeout", Name: "timeout"}, + }, + } + serverConnectionsChartTmpl = module.Chart{ + ID: "server_%s_client_connections", + Title: "Server Client Connections", + Units: "connections", + Fam: "srv connections", + Ctx: "rethinkdb.server_client_connections", + Priority: prioServerClientConnections, + Dims: module.Dims{ + {ID: "server_%s_client_connections", Name: "connections"}, + }, + } + serverActiveClientsChartTmpl = module.Chart{ + ID: "server_%s_active_clients", + Title: "Server Active Clients", + Units: "clients", + Fam: "srv clients", + Ctx: "rethinkdb.server_active_clients", + Priority: prioServerActiveClients, + Dims: module.Dims{ + {ID: "server_%s_clients_active", Name: "active"}, + }, + } + serverQueriesChartTmpl = module.Chart{ + ID: "server_%s_queries", + Title: "Server Queries", + Units: "queries/s", + Fam: "srv queries", + Ctx: "rethinkdb.server_queries", + Priority: prioServerQueries, + Dims: module.Dims{ + {ID: "server_%s_queries_total", Name: "queries", Algo: module.Incremental}, + }, + } + serverDocumentsChartTmpl = module.Chart{ + ID: "server_%s_documents", + Title: "Server Documents", + Units: "documents/s", + Fam: "srv documents", + Ctx: "rethinkdb.server_documents", + Priority: prioServerDocuments, + Dims: module.Dims{ + {ID: "server_%s_read_docs_total", Name: "read", Algo: module.Incremental}, + {ID: "server_%s_written_docs_total", Name: "written", Mul: -1, Algo: module.Incremental}, + }, + } +) + +func (r *Rethinkdb) addServerCharts(srvUUID, srvName string) { + charts := serverChartsTmpl.Copy() + + for _, chart := range *charts { + chart.ID = fmt.Sprintf(chart.ID, srvUUID) + chart.Labels = []module.Label{ + {Key: "sever_uuid", Value: srvUUID}, + {Key: "sever_name", Value: srvName}, + } + for _, dim := range chart.Dims { + dim.ID = fmt.Sprintf(dim.ID, srvUUID) + } + } + + if err := r.Charts().Add(*charts...); err != nil { + r.Warningf("failed to add chart for '%s' server: %v", srvName, err) + } +} + +func (r *Rethinkdb) removeServerCharts(srvUUID string) { + px := fmt.Sprintf("server_%s_", srvUUID) + for _, chart := range *r.Charts() { + if strings.HasPrefix(chart.ID, px) { + chart.MarkRemove() + chart.MarkNotCreated() + } + } +} diff --git a/src/go/plugin/go.d/modules/rethinkdb/client.go b/src/go/plugin/go.d/modules/rethinkdb/client.go new file mode 100644 index 000000000..d790d5439 --- /dev/null +++ b/src/go/plugin/go.d/modules/rethinkdb/client.go @@ -0,0 +1,72 @@ +// SPDX-License-Identifier: GPL-3.0-or-later + +package rethinkdb + +import ( + "context" + "errors" + "time" + + "gopkg.in/rethinkdb/rethinkdb-go.v6" +) + +type rdbConn interface { + stats() ([][]byte, error) + close() error +} + +func newRethinkdbConn(cfg Config) (rdbConn, error) { + sess, err := rethinkdb.Connect(rethinkdb.ConnectOpts{ + Address: cfg.Address, + Username: cfg.Username, + Password: cfg.Password, + }) + if err != nil { + return nil, err + } + + client := &rethinkdbClient{ + timeout: cfg.Timeout.Duration(), + sess: sess, + } + + return client, nil +} + +type rethinkdbClient struct { + timeout time.Duration + + sess *rethinkdb.Session +} + +func (c *rethinkdbClient) stats() ([][]byte, error) { + ctx, cancel := context.WithTimeout(context.Background(), c.timeout) + defer cancel() + + opts := rethinkdb.RunOpts{Context: ctx} + + cur, err := rethinkdb.DB("rethinkdb").Table("stats").Run(c.sess, opts) + if err != nil { + return nil, err + } + + if cur.IsNil() { + return nil, errors.New("no stats found (cursor is nil)") + } + defer func() { _ = cur.Close() }() + + var stats [][]byte + for { + bs, ok := cur.NextResponse() + if !ok { + break + } + stats = append(stats, bs) + } + + return stats, nil +} + +func (c *rethinkdbClient) close() (err error) { + return c.sess.Close() +} diff --git a/src/go/plugin/go.d/modules/rethinkdb/collect.go b/src/go/plugin/go.d/modules/rethinkdb/collect.go new file mode 100644 index 000000000..6c2bc32c9 --- /dev/null +++ b/src/go/plugin/go.d/modules/rethinkdb/collect.go @@ -0,0 +1,123 @@ +// SPDX-License-Identifier: GPL-3.0-or-later + +package rethinkdb + +import ( + "encoding/json" + "errors" + "fmt" + + "github.com/netdata/netdata/go/plugins/plugin/go.d/pkg/stm" +) + +type ( + // https://rethinkdb.com/docs/system-stats/ + serverStats struct { + ID []string `json:"id"` + Server string `json:"server"` + QueryEngine struct { + ClientConnections int64 `json:"client_connections" stm:"client_connections"` + ClientsActive int64 `json:"clients_active" stm:"clients_active"` + QueriesTotal int64 `json:"queries_total" stm:"queries_total"` + ReadDocsTotal int64 `json:"read_docs_total" stm:"read_docs_total"` + WrittenDocsTotal int64 `json:"written_docs_total" stm:"written_docs_total"` + } `json:"query_engine" stm:""` + + Error string `json:"error"` + } +) + +func (r *Rethinkdb) collect() (map[string]int64, error) { + if r.rdb == nil { + conn, err := r.newConn(r.Config) + if err != nil { + return nil, err + } + r.rdb = conn + } + + mx := make(map[string]int64) + + if err := r.collectStats(mx); err != nil { + return nil, err + } + + return mx, nil +} + +func (r *Rethinkdb) collectStats(mx map[string]int64) error { + resp, err := r.rdb.stats() + if err != nil { + return err + } + + if len(resp) == 0 { + return errors.New("empty stats response from server") + } + + for _, v := range []string{ + "cluster_servers_stats_request_success", + "cluster_servers_stats_request_timeout", + "cluster_client_connections", + "cluster_clients_active", + "cluster_queries_total", + "cluster_read_docs_total", + "cluster_written_docs_total", + } { + mx[v] = 0 + } + + seen := make(map[string]bool) + + for _, bs := range resp[1:] { // skip cluster + var srv serverStats + + if err := json.Unmarshal(bs, &srv); err != nil { + return fmt.Errorf("invalid stats response: failed to unmarshal server data: %v", err) + } + if len(srv.ID[0]) == 0 { + return errors.New("invalid stats response: empty id") + } + if srv.ID[0] != "server" { + continue + } + if len(srv.ID) != 2 { + return fmt.Errorf("invalid stats response: unexpected server id: '%v'", srv.ID) + } + + srvUUID := srv.ID[1] + + seen[srvUUID] = true + + if !r.seenServers[srvUUID] { + r.seenServers[srvUUID] = true + r.addServerCharts(srvUUID, srv.Server) + } + + px := fmt.Sprintf("server_%s_", srv.ID[1]) // uuid + + mx[px+"stats_request_status_success"] = 0 + mx[px+"stats_request_status_timeout"] = 0 + if srv.Error != "" { + mx["cluster_servers_stats_request_timeout"]++ + mx[px+"stats_request_status_timeout"] = 1 + continue + } + mx["cluster_servers_stats_request_success"]++ + mx[px+"stats_request_status_success"] = 1 + + for k, v := range stm.ToMap(srv.QueryEngine) { + mx["cluster_"+k] += v + mx[px+k] = v + } + } + + for k := range r.seenServers { + if !seen[k] { + delete(r.seenServers, k) + r.removeServerCharts(k) + } + } + + return nil +} diff --git a/src/go/plugin/go.d/modules/rethinkdb/config_schema.json b/src/go/plugin/go.d/modules/rethinkdb/config_schema.json new file mode 100644 index 000000000..9a84aeca4 --- /dev/null +++ b/src/go/plugin/go.d/modules/rethinkdb/config_schema.json @@ -0,0 +1,82 @@ +{ + "jsonSchema": { + "$schema": "http://json-schema.org/draft-07/schema#", + "title": "RethinkDB collector configuration.", + "type": "object", + "properties": { + "update_every": { + "title": "Update every", + "description": "Data collection interval, measured in seconds.", + "type": "integer", + "minimum": 1, + "default": 1 + }, + "address": { + "title": "Address", + "description": "The IP address and port where the RethinkDB service listens for connections.", + "type": "string", + "default": "127.0.0.1:28015" + }, + "timeout": { + "title": "Timeout", + "description": "Timeout for establishing a connection and communication (reading and writing) in seconds.", + "type": "number", + "minimum": 0.5, + "default": 1 + }, + "username": { + "title": "Username", + "description": "The username for basic authentication.", + "type": "string", + "sensitive": true + }, + "password": { + "title": "Password", + "description": "The password for basic authentication.", + "type": "string", + "sensitive": true + } + }, + "required": [ + "address" + ], + "additionalProperties": false, + "patternProperties": { + "^name$": {} + } + }, + "uiSchema": { + "uiOptions": { + "fullPage": true + }, + "timeout": { + "ui:help": "Accepts decimals for precise control (e.g., type 1.5 for 1.5 seconds)." + }, + "username": { + "ui:widget": "password" + }, + "password": { + "ui:widget": "password" + }, + "ui:flavour": "tabs", + "ui:options": { + "tabs": [ + { + "title": "Base", + "fields": [ + "update_every", + "address", + "timeout" + ] + }, + { + "title": "Auth", + "fields": [ + "username", + "password" + ] + } + ] + } + } +} diff --git a/src/go/plugin/go.d/modules/rethinkdb/integrations/rethinkdb.md b/src/go/plugin/go.d/modules/rethinkdb/integrations/rethinkdb.md new file mode 100644 index 000000000..3cc116e40 --- /dev/null +++ b/src/go/plugin/go.d/modules/rethinkdb/integrations/rethinkdb.md @@ -0,0 +1,257 @@ +<!--startmeta +custom_edit_url: "https://github.com/netdata/netdata/edit/master/src/go/plugin/go.d/modules/rethinkdb/README.md" +meta_yaml: "https://github.com/netdata/netdata/edit/master/src/go/plugin/go.d/modules/rethinkdb/metadata.yaml" +sidebar_label: "RethinkDB" +learn_status: "Published" +learn_rel_path: "Collecting Metrics/Databases" +most_popular: False +message: "DO NOT EDIT THIS FILE DIRECTLY, IT IS GENERATED BY THE COLLECTOR'S metadata.yaml FILE" +endmeta--> + +# RethinkDB + + +<img src="https://netdata.cloud/img/rethinkdb.png" width="150"/> + + +Plugin: go.d.plugin +Module: rethinkdb + +<img src="https://img.shields.io/badge/maintained%20by-Netdata-%2300ab44" /> + +## Overview + +It collects cluster-wide metrics such as server status, client connections, active clients, query rate, and document read/write rates. +For each server, it offers similar metrics. + + +The data is gathered by querying the stats table in RethinkDB, which stores real-time statistics related to the cluster and its individual servers. + + +This collector is supported on all platforms. + +This collector supports collecting metrics from multiple instances of this integration, including remote instances. + + +### Default Behavior + +#### Auto-Detection + +If no configuration is given, collector will attempt to connect to RethinkDB instance on `127.0.0.1:28015` address. + + +#### Limits + +The default configuration for this integration does not impose any limits on data collection. + +#### Performance Impact + +The default configuration for this integration is not expected to impose a significant performance impact on the system. + + +## Metrics + +Metrics grouped by *scope*. + +The scope defines the instance that the metric belongs to. An instance is uniquely identified by a set of labels. + + + +### Per RethinkDB instance + +These metrics refer to the entire monitored application. + +This scope has no labels. + +Metrics: + +| Metric | Dimensions | Unit | +|:------|:----------|:----| +| rethinkdb.cluster_servers_stats_request | success, timeout | servers | +| rethinkdb.cluster_client_connections | connections | connections | +| rethinkdb.cluster_active_clients | active | clients | +| rethinkdb.cluster_queries | queries | queries/s | +| rethinkdb.cluster_documents | read, written | documents/s | + +### Per server + +These metrics refer to the server (cluster member). + +Labels: + +| Label | Description | +|:-----------|:----------------| +| server_uuid | Server UUID. | +| server_name | Server name. | + +Metrics: + +| Metric | Dimensions | Unit | +|:------|:----------|:----| +| rethinkdb.server_stats_request_status | success, timeout | status | +| rethinkdb.server_client_connections | connections | connections | +| rethinkdb.server_active_clients | active | clients | +| rethinkdb.server_queries | queries | queries/s | +| rethinkdb.server_documents | read, written | documents/s | + + + +## Alerts + +There are no alerts configured by default for this integration. + + +## Setup + +### Prerequisites + +No action required. + +### Configuration + +#### File + +The configuration file name for this integration is `go.d/rethinkdb.conf`. + + +You can edit the configuration file using the `edit-config` script from the +Netdata [config directory](/docs/netdata-agent/configuration/README.md#the-netdata-config-directory). + +```bash +cd /etc/netdata 2>/dev/null || cd /opt/netdata/etc/netdata +sudo ./edit-config go.d/rethinkdb.conf +``` +#### Options + +The following options can be defined globally: update_every, autodetection_retry. + + +<details open><summary>Config options</summary> + +| Name | Description | Default | Required | +|:----|:-----------|:-------|:--------:| +| update_every | Data collection frequency. | 1 | no | +| autodetection_retry | Recheck interval in seconds. Zero means no recheck will be scheduled. | 0 | no | +| address | The IP address and port where the RethinkDB service listens for connections. | 127.0.0.1:28015 | yes | +| timeout | Connection, read, and write timeout duration in seconds. The timeout includes name resolution. | 1 | no | +| username | Username used for authentication. | | no | +| password | Password used for authentication. | | no | + +</details> + +#### Examples + +##### Basic + +A basic example configuration. + +<details open><summary>Config</summary> + +```yaml +jobs: + - name: local + address: 127.0.0.1:28015 + +``` +</details> + +##### With authentication + +An example configuration with authentication. + +<details open><summary>Config</summary> + +```yaml +jobs: + - name: local + address: 127.0.0.1:28015 + username: name + password: pass + +``` +</details> + +##### Multi-instance + +> **Note**: When you define multiple jobs, their names must be unique. + +Collecting metrics from local and remote instances. + + +<details open><summary>Config</summary> + +```yaml +jobs: + - name: local + address: 127.0.0.1:28015 + + - name: remote + address: 203.0.113.0:28015 + +``` +</details> + + + +## Troubleshooting + +### Debug Mode + +**Important**: Debug mode is not supported for data collection jobs created via the UI using the Dyncfg feature. + +To troubleshoot issues with the `rethinkdb` collector, run the `go.d.plugin` with the debug option enabled. The output +should give you clues as to why the collector isn't working. + +- Navigate to the `plugins.d` directory, usually at `/usr/libexec/netdata/plugins.d/`. If that's not the case on + your system, open `netdata.conf` and look for the `plugins` setting under `[directories]`. + + ```bash + cd /usr/libexec/netdata/plugins.d/ + ``` + +- Switch to the `netdata` user. + + ```bash + sudo -u netdata -s + ``` + +- Run the `go.d.plugin` to debug the collector: + + ```bash + ./go.d.plugin -d -m rethinkdb + ``` + +### Getting Logs + +If you're encountering problems with the `rethinkdb` collector, follow these steps to retrieve logs and identify potential issues: + +- **Run the command** specific to your system (systemd, non-systemd, or Docker container). +- **Examine the output** for any warnings or error messages that might indicate issues. These messages should provide clues about the root cause of the problem. + +#### System with systemd + +Use the following command to view logs generated since the last Netdata service restart: + +```bash +journalctl _SYSTEMD_INVOCATION_ID="$(systemctl show --value --property=InvocationID netdata)" --namespace=netdata --grep rethinkdb +``` + +#### System without systemd + +Locate the collector log file, typically at `/var/log/netdata/collector.log`, and use `grep` to filter for collector's name: + +```bash +grep rethinkdb /var/log/netdata/collector.log +``` + +**Note**: This method shows logs from all restarts. Focus on the **latest entries** for troubleshooting current issues. + +#### Docker Container + +If your Netdata runs in a Docker container named "netdata" (replace if different), use this command: + +```bash +docker logs netdata 2>&1 | grep rethinkdb +``` + + diff --git a/src/go/plugin/go.d/modules/rethinkdb/metadata.yaml b/src/go/plugin/go.d/modules/rethinkdb/metadata.yaml new file mode 100644 index 000000000..057d71a06 --- /dev/null +++ b/src/go/plugin/go.d/modules/rethinkdb/metadata.yaml @@ -0,0 +1,198 @@ +plugin_name: go.d.plugin +modules: + - meta: + id: collector-go.d.plugin-rethinkdb + plugin_name: go.d.plugin + module_name: rethinkdb + monitored_instance: + name: RethinkDB + link: https://rethinkdb.com + categories: + - data-collection.database-servers + icon_filename: "rethinkdb.png" + related_resources: + integrations: + list: [] + info_provided_to_referring_integrations: + description: "" + keywords: + - rethinkdb + - database + - db + most_popular: false + overview: + data_collection: + metrics_description: | + It collects cluster-wide metrics such as server status, client connections, active clients, query rate, and document read/write rates. + For each server, it offers similar metrics. + method_description: | + The data is gathered by querying the stats table in RethinkDB, which stores real-time statistics related to the cluster and its individual servers. + supported_platforms: + include: [] + exclude: [] + multi_instance: true + additional_permissions: + description: "" + default_behavior: + auto_detection: + description: | + If no configuration is given, collector will attempt to connect to RethinkDB instance on `127.0.0.1:28015` address. + limits: + description: "" + performance_impact: + description: "" + setup: + prerequisites: + list: [] + configuration: + file: + name: go.d/rethinkdb.conf + options: + description: | + The following options can be defined globally: update_every, autodetection_retry. + folding: + title: Config options + enabled: true + list: + - name: update_every + description: Data collection frequency. + default_value: 1 + required: false + - name: autodetection_retry + description: Recheck interval in seconds. Zero means no recheck will be scheduled. + default_value: 0 + required: false + - name: address + description: The IP address and port where the RethinkDB service listens for connections. + default_value: 127.0.0.1:28015 + required: true + - name: timeout + description: Connection, read, and write timeout duration in seconds. The timeout includes name resolution. + default_value: 1 + required: false + - name: username + description: Username used for authentication. + default_value: "" + required: false + - name: password + description: Password used for authentication. + default_value: "" + required: false + examples: + folding: + title: Config + enabled: true + list: + - name: Basic + description: A basic example configuration. + config: | + jobs: + - name: local + address: 127.0.0.1:28015 + - name: With authentication + description: An example configuration with authentication. + config: | + jobs: + - name: local + address: 127.0.0.1:28015 + username: name + password: pass + - name: Multi-instance + description: | + > **Note**: When you define multiple jobs, their names must be unique. + + Collecting metrics from local and remote instances. + config: | + jobs: + - name: local + address: 127.0.0.1:28015 + + - name: remote + address: 203.0.113.0:28015 + troubleshooting: + problems: + list: [] + alerts: [] + metrics: + folding: + title: Metrics + enabled: false + description: "" + availability: [] + scopes: + - name: global + description: "These metrics refer to the entire monitored application." + labels: [] + metrics: + - name: rethinkdb.cluster_servers_stats_request + description: Cluster Servers Stats Request + unit: "servers" + chart_type: line + dimensions: + - name: success + - name: timeout + - name: rethinkdb.cluster_client_connections + description: Cluster Client Connections + unit: "connections" + chart_type: line + dimensions: + - name: connections + - name: rethinkdb.cluster_active_clients + description: Cluster Active Clients + unit: "clients" + chart_type: line + dimensions: + - name: active + - name: rethinkdb.cluster_queries + description: Cluster Queries + unit: "queries/s" + chart_type: line + dimensions: + - name: queries + - name: rethinkdb.cluster_documents + description: Cluster Documents + unit: "documents/s" + chart_type: line + dimensions: + - name: read + - name: written + - name: server + description: "These metrics refer to the server (cluster member)." + labels: + - name: server_uuid + description: Server UUID. + - name: server_name + description: Server name. + metrics: + - name: rethinkdb.server_stats_request_status + description: Server Stats Request Status + unit: "status" + chart_type: line + dimensions: + - name: success + - name: timeout + - name: rethinkdb.server_client_connections + description: Server Client Connections + unit: "connections" + chart_type: line + dimensions: + - name: connections + - name: rethinkdb.server_active_clients + description: Server Active Clients + unit: "clients" + chart_type: line + dimensions: + - name: active + - name: rethinkdb.server_queries + description: Server Queries + unit: "queries/s" + chart_type: line + dimensions: + - name: queries + - name: rethinkdb.server_documents + description: Server Documents + unit: "documents/s" + chart_type: line + dimensions: + - name: read + - name: written diff --git a/src/go/plugin/go.d/modules/rethinkdb/rethinkdb.go b/src/go/plugin/go.d/modules/rethinkdb/rethinkdb.go new file mode 100644 index 000000000..ccde593de --- /dev/null +++ b/src/go/plugin/go.d/modules/rethinkdb/rethinkdb.go @@ -0,0 +1,107 @@ +// SPDX-License-Identifier: GPL-3.0-or-later + +package rethinkdb + +import ( + _ "embed" + "errors" + "time" + + "github.com/netdata/netdata/go/plugins/plugin/go.d/agent/module" + "github.com/netdata/netdata/go/plugins/plugin/go.d/pkg/web" +) + +//go:embed "config_schema.json" +var configSchema string + +func init() { + module.Register("rethinkdb", module.Creator{ + JobConfigSchema: configSchema, + Create: func() module.Module { return New() }, + Config: func() any { return &Config{} }, + }) +} + +func New() *Rethinkdb { + return &Rethinkdb{ + Config: Config{ + Address: "127.0.0.1:28015", + Timeout: web.Duration(time.Second * 1), + }, + + charts: clusterCharts.Copy(), + newConn: newRethinkdbConn, + seenServers: make(map[string]bool), + } +} + +type Config struct { + UpdateEvery int `yaml:"update_every,omitempty" json:"update_every"` + Address string `yaml:"address" json:"address"` + Timeout web.Duration `yaml:"timeout,omitempty" json:"timeout"` + Username string `yaml:"username,omitempty" json:"username"` + Password string `yaml:"password,omitempty" json:"password"` +} + +type ( + Rethinkdb struct { + module.Base + Config `yaml:",inline" json:""` + + charts *module.Charts + + newConn func(cfg Config) (rdbConn, error) + rdb rdbConn + + seenServers map[string]bool + } +) + +func (r *Rethinkdb) Configuration() any { + return r.Config +} + +func (r *Rethinkdb) Init() error { + if r.Address == "" { + r.Error("address is not set") + return errors.New("address is not set") + } + return nil +} + +func (r *Rethinkdb) Check() error { + mx, err := r.collect() + if err != nil { + r.Error(err) + return err + } + if len(mx) == 0 { + return errors.New("no metrics collected") + } + return nil +} + +func (r *Rethinkdb) Charts() *module.Charts { + return r.charts +} + +func (r *Rethinkdb) Collect() map[string]int64 { + ms, err := r.collect() + if err != nil { + r.Error(err) + } + + if len(ms) == 0 { + return nil + } + return ms +} + +func (r *Rethinkdb) Cleanup() { + if r.rdb != nil { + if err := r.rdb.close(); err != nil { + r.Warningf("cleanup: error on closing client [%s]: %v", r.Address, err) + } + r.rdb = nil + } +} diff --git a/src/go/plugin/go.d/modules/rethinkdb/rethinkdb_test.go b/src/go/plugin/go.d/modules/rethinkdb/rethinkdb_test.go new file mode 100644 index 000000000..f23c49747 --- /dev/null +++ b/src/go/plugin/go.d/modules/rethinkdb/rethinkdb_test.go @@ -0,0 +1,267 @@ +// SPDX-License-Identifier: GPL-3.0-or-later + +package rethinkdb + +import ( + "bytes" + "errors" + "fmt" + "os" + "strings" + "testing" + + "github.com/netdata/netdata/go/plugins/plugin/go.d/agent/module" + + "github.com/stretchr/testify/assert" + "github.com/stretchr/testify/require" +) + +var ( + dataConfigJSON, _ = os.ReadFile("testdata/config.json") + dataConfigYAML, _ = os.ReadFile("testdata/config.yaml") + + dataStats, _ = os.ReadFile("testdata/v2.4.4/stats.txt") +) + +func Test_testDataIsValid(t *testing.T) { + for name, data := range map[string][]byte{ + "dataConfigJSON": dataConfigJSON, + "dataConfigYAML": dataConfigYAML, + + "dataStats": dataStats, + } { + require.NotNil(t, data, name) + } +} + +func TestRethinkdb_ConfigurationSerialize(t *testing.T) { + module.TestConfigurationSerialize(t, &Rethinkdb{}, dataConfigJSON, dataConfigYAML) +} + +func TestRethinkdb_Init(t *testing.T) { + tests := map[string]struct { + config Config + wantFail bool + }{ + "success with default config": { + wantFail: false, + config: New().Config, + }, + "fails if address not set": { + wantFail: true, + config: func() Config { + conf := New().Config + conf.Address = "" + return conf + }(), + }, + } + + for name, test := range tests { + t.Run(name, func(t *testing.T) { + rdb := New() + rdb.Config = test.config + + if test.wantFail { + assert.Error(t, rdb.Init()) + } else { + assert.NoError(t, rdb.Init()) + } + }) + } +} + +func TestRethinkdb_Cleanup(t *testing.T) { + tests := map[string]struct { + prepare func() *Rethinkdb + }{ + "not initialized": { + prepare: func() *Rethinkdb { + return New() + }, + }, + "after check": { + prepare: func() *Rethinkdb { + rdb := New() + rdb.newConn = func(config Config) (rdbConn, error) { + return &mockRethinkdbConn{dataStats: dataStats}, nil + } + _ = rdb.Check() + return rdb + }, + }, + "after collect": { + prepare: func() *Rethinkdb { + rdb := New() + rdb.newConn = func(config Config) (rdbConn, error) { + return &mockRethinkdbConn{dataStats: dataStats}, nil + } + _ = rdb.Check() + return rdb + }, + }, + } + + for name, test := range tests { + t.Run(name, func(t *testing.T) { + rdb := test.prepare() + + assert.NotPanics(t, rdb.Cleanup) + }) + } +} + +func TestRethinkdb_Check(t *testing.T) { + tests := map[string]struct { + prepare func() *Rethinkdb + wantFail bool + }{ + "success on valid response": { + wantFail: false, + prepare: prepareCaseOk, + }, + "fails if error on stats": { + wantFail: true, + prepare: prepareCaseErrOnStats, + }, + "fails if error on connect": { + wantFail: true, + prepare: prepareCaseErrOnConnect, + }, + } + + for name, test := range tests { + t.Run(name, func(t *testing.T) { + rdb := test.prepare() + + if test.wantFail { + assert.Error(t, rdb.Check()) + } else { + assert.NoError(t, rdb.Check()) + } + + if m, ok := rdb.rdb.(*mockRethinkdbConn); ok { + assert.False(t, m.disconnectCalled, "rdb close before cleanup") + rdb.Cleanup() + assert.True(t, m.disconnectCalled, "rdb close after cleanup") + } + }) + } +} + +func TestRethinkdb_Collect(t *testing.T) { + tests := map[string]struct { + prepare func() *Rethinkdb + wantMetrics map[string]int64 + wantCharts int + skipChart func(chart *module.Chart) bool + }{ + "success on valid response": { + prepare: prepareCaseOk, + wantCharts: len(clusterCharts) + len(serverChartsTmpl)*3, + skipChart: func(chart *module.Chart) bool { + return strings.HasPrefix(chart.ID, "server_0f74c641-af5f-48d6-a005-35b8983c576a") && + !strings.Contains(chart.ID, "stats_request_status") + }, + wantMetrics: map[string]int64{ + "cluster_client_connections": 3, + "cluster_clients_active": 3, + "cluster_queries_total": 27, + "cluster_read_docs_total": 3, + "cluster_servers_stats_request_success": 2, + "cluster_servers_stats_request_timeout": 1, + "cluster_written_docs_total": 3, + "server_0f74c641-af5f-48d6-a005-35b8983c576a_stats_request_status_success": 0, + "server_0f74c641-af5f-48d6-a005-35b8983c576a_stats_request_status_timeout": 1, + "server_b7730db2-4303-4719-aef8-2a3c339c672b_client_connections": 1, + "server_b7730db2-4303-4719-aef8-2a3c339c672b_clients_active": 1, + "server_b7730db2-4303-4719-aef8-2a3c339c672b_queries_total": 13, + "server_b7730db2-4303-4719-aef8-2a3c339c672b_read_docs_total": 1, + "server_b7730db2-4303-4719-aef8-2a3c339c672b_stats_request_status_success": 1, + "server_b7730db2-4303-4719-aef8-2a3c339c672b_stats_request_status_timeout": 0, + "server_b7730db2-4303-4719-aef8-2a3c339c672b_written_docs_total": 1, + "server_f325e3c3-22d9-4005-b4b2-1f561d384edc_client_connections": 2, + "server_f325e3c3-22d9-4005-b4b2-1f561d384edc_clients_active": 2, + "server_f325e3c3-22d9-4005-b4b2-1f561d384edc_queries_total": 14, + "server_f325e3c3-22d9-4005-b4b2-1f561d384edc_read_docs_total": 2, + "server_f325e3c3-22d9-4005-b4b2-1f561d384edc_stats_request_status_success": 1, + "server_f325e3c3-22d9-4005-b4b2-1f561d384edc_stats_request_status_timeout": 0, + "server_f325e3c3-22d9-4005-b4b2-1f561d384edc_written_docs_total": 2, + }, + }, + "fails if error on stats": { + wantCharts: len(clusterCharts), + prepare: prepareCaseErrOnStats, + }, + "fails if error on connect": { + wantCharts: len(clusterCharts), + prepare: prepareCaseErrOnStats, + }, + } + + for name, test := range tests { + t.Run(name, func(t *testing.T) { + rdb := test.prepare() + + require.NoError(t, rdb.Init()) + + mx := rdb.Collect() + + require.Equal(t, test.wantMetrics, mx) + + assert.Equal(t, test.wantCharts, len(*rdb.Charts())) + + if len(test.wantMetrics) > 0 { + module.TestMetricsHasAllChartsDimsSkip(t, rdb.Charts(), mx, test.skipChart) + } + + if m, ok := rdb.rdb.(*mockRethinkdbConn); ok { + assert.False(t, m.disconnectCalled, "rdb close before cleanup") + rdb.Cleanup() + assert.True(t, m.disconnectCalled, "rdb close after cleanup") + } + }) + } +} + +func prepareCaseOk() *Rethinkdb { + rdb := New() + rdb.newConn = func(cfg Config) (rdbConn, error) { + return &mockRethinkdbConn{dataStats: dataStats}, nil + } + return rdb +} + +func prepareCaseErrOnStats() *Rethinkdb { + rdb := New() + rdb.newConn = func(cfg Config) (rdbConn, error) { + return &mockRethinkdbConn{errOnStats: true}, nil + } + return rdb +} + +func prepareCaseErrOnConnect() *Rethinkdb { + rdb := New() + rdb.newConn = func(cfg Config) (rdbConn, error) { + return nil, errors.New("mock failed to connect") + } + return rdb +} + +type mockRethinkdbConn struct { + dataStats []byte + errOnStats bool + disconnectCalled bool +} + +func (m *mockRethinkdbConn) stats() ([][]byte, error) { + if m.errOnStats { + return nil, fmt.Errorf("mock.stats() error") + } + return bytes.Split(bytes.TrimSpace(m.dataStats), []byte("\n")), nil +} + +func (m *mockRethinkdbConn) close() error { + m.disconnectCalled = true + return nil +} diff --git a/src/go/plugin/go.d/modules/rethinkdb/testdata/config.json b/src/go/plugin/go.d/modules/rethinkdb/testdata/config.json new file mode 100644 index 000000000..47f755ea4 --- /dev/null +++ b/src/go/plugin/go.d/modules/rethinkdb/testdata/config.json @@ -0,0 +1,7 @@ +{ + "update_every": 123, + "address": "ok", + "timeout": 123.123, + "username": "ok", + "password": "ok" +} diff --git a/src/go/plugin/go.d/modules/rethinkdb/testdata/config.yaml b/src/go/plugin/go.d/modules/rethinkdb/testdata/config.yaml new file mode 100644 index 000000000..6857aae7c --- /dev/null +++ b/src/go/plugin/go.d/modules/rethinkdb/testdata/config.yaml @@ -0,0 +1,5 @@ +update_every: 123 +address: "ok" +timeout: 123.123 +username: "ok" +password: "ok" diff --git a/src/go/plugin/go.d/modules/rethinkdb/testdata/v2.4.4/stats.txt b/src/go/plugin/go.d/modules/rethinkdb/testdata/v2.4.4/stats.txt new file mode 100644 index 000000000..0d3ab6a62 --- /dev/null +++ b/src/go/plugin/go.d/modules/rethinkdb/testdata/v2.4.4/stats.txt @@ -0,0 +1,4 @@ +{"id":["cluster"],"query_engine":{"client_connections":1,"clients_active":1,"queries_per_sec":1,"read_docs_per_sec":0,"written_docs_per_sec":0}} +{"id":["server","b7730db2-4303-4719-aef8-2a3c339c672b"],"query_engine":{"client_connections":1,"clients_active":1,"queries_per_sec":1,"queries_total":13,"read_docs_per_sec":0,"read_docs_total":1,"written_docs_per_sec":0,"written_docs_total":1},"server":"some_hostname_182"} +{"id":["server","f325e3c3-22d9-4005-b4b2-1f561d384edc"],"query_engine":{"client_connections":2,"clients_active":2,"queries_per_sec":1,"queries_total":14,"read_docs_per_sec":0,"read_docs_total":2,"written_docs_per_sec":0,"written_docs_total":2},"server":"pve_deb_work_183"} +{"id":["server","0f74c641-af5f-48d6-a005-35b8983c576a"],"server":"pve_deb_work_184","error":"Timed out. Unable to retrieve stats."} diff --git a/src/go/plugin/go.d/modules/riakkv/README.md b/src/go/plugin/go.d/modules/riakkv/README.md new file mode 120000 index 000000000..963843756 --- /dev/null +++ b/src/go/plugin/go.d/modules/riakkv/README.md @@ -0,0 +1 @@ +integrations/riak_kv.md
\ No newline at end of file diff --git a/src/go/plugin/go.d/modules/riakkv/charts.go b/src/go/plugin/go.d/modules/riakkv/charts.go new file mode 100644 index 000000000..345f01d69 --- /dev/null +++ b/src/go/plugin/go.d/modules/riakkv/charts.go @@ -0,0 +1,461 @@ +// SPDX-License-Identifier: GPL-3.0-or-later + +package riakkv + +import ( + "slices" + + "github.com/netdata/netdata/go/plugins/plugin/go.d/agent/module" +) + +const ( + prioKvNodeOperations = module.Priority + iota + prioDtVnodeUpdates + prioSearchQueries + prioSearchDocuments + prioConsistentOperations + + prioKvLatencyGet + prioKvLatencyPut + prioDtLatencyCounter + prioDtLatencySet + prioDtLatencyMap + prioSearchLatencyQuery + prioSearchLatencyIndex + prioConsistentLatencyGet + prioConsistentLatencyPut + + prioVmProcessesCount + prioVmProcessesMemory + + prioKvSiblingsEncounteredGet + prioKvObjSizeGet + prioSearchVnodeqSize + prioSearchIndexErrors + prioCorePbc + prioCoreRepairs + prioCoreFsmActive + prioCoreFsmREjected +) + +var charts = module.Charts{ + kvNodeOperationsChart.Copy(), + dtVnodeUpdatesChart.Copy(), + searchQueriesChart.Copy(), + searchDocumentsChart.Copy(), + consistentOperationsChart.Copy(), + + kvLatencyGetChart.Copy(), + kvLatencyPutChart.Copy(), + dtLatencyCounterChart.Copy(), + dtLatencySetChart.Copy(), + dtLatencyMapChart.Copy(), + searchLatencyQueryChart.Copy(), + searchLatencyIndexChart.Copy(), + consistentLatencyGetChart.Copy(), + consistentLatencyPutChart.Copy(), + + vmProcessesCountChart.Copy(), + vmProcessesMemoryChart.Copy(), + + kvSiblingsEncounteredGetChart.Copy(), + kvObjectSizeGetChart.Copy(), + searchVnodeqSizeChart.Copy(), + searchIndexErrorsChart.Copy(), + corePbsChart.Copy(), + coreRepairsChart.Copy(), + coreFsmActiveChart.Copy(), + coreFsmRejectedChart.Copy(), +} + +/* +Throughput metrics +https://docs.riak.com/riak/kv/latest/using/reference/statistics-monitoring/index.html#throughput-metrics + +Collected in totals +*/ +var ( + kvNodeOperationsChart = module.Chart{ + ID: "kv_node_operations", + Title: "Reads & writes coordinated by this node", + Units: "operations/s", + Fam: "throughput", + Ctx: "riak.kv.throughput", + Priority: prioKvNodeOperations, + Dims: module.Dims{ + {ID: "node_gets_total", Name: "gets", Algo: module.Incremental}, + {ID: "node_puts_total", Name: "puts", Algo: module.Incremental}, + }, + } + dtVnodeUpdatesChart = module.Chart{ + ID: "dt_vnode_updates", + Title: "Update operations coordinated by local vnodes by data type", + Units: "operations/s", + Fam: "throughput", + Ctx: "riak.dt.vnode_updates", + Priority: prioDtVnodeUpdates, + Dims: module.Dims{ + {ID: "vnode_counter_update_total", Name: "counters", Algo: module.Incremental}, + {ID: "vnode_set_update_total", Name: "sets", Algo: module.Incremental}, + {ID: "vnode_map_update_total", Name: "maps", Algo: module.Incremental}, + }, + } + searchQueriesChart = module.Chart{ + ID: "dt_vnode_updates", + Title: "Search queries on the node", + Units: "queries/s", + Fam: "throughput", + Ctx: "riak.search", + Priority: prioSearchQueries, + Dims: module.Dims{ + {ID: "search_query_throughput_count", Name: "queries", Algo: module.Incremental}, + }, + } + searchDocumentsChart = module.Chart{ + ID: "search_documents", + Title: "Documents indexed by search", + Units: "documents/s", + Fam: "throughput", + Ctx: "riak.search.documents", + Priority: prioSearchDocuments, + Dims: module.Dims{ + {ID: "search_index_throughput_count", Name: "indexed", Algo: module.Incremental}, + }, + } + consistentOperationsChart = module.Chart{ + ID: "consistent_operations", + Title: "Consistent node operations", + Units: "operations/s", + Fam: "throughput", + Ctx: "riak.consistent.operations", + Priority: prioConsistentOperations, + Dims: module.Dims{ + {ID: "consistent_gets_total", Name: "gets", Algo: module.Incremental}, + {ID: "consistent_puts_total", Name: "puts", Algo: module.Incremental}, + }, + } +) + +/* +Latency metrics +https://docs.riak.com/riak/kv/latest/using/reference/statistics-monitoring/index.html#throughput-metrics + +Collected for the past minute in milliseconds and +returned from Riak in microseconds. +*/ +var ( + kvLatencyGetChart = module.Chart{ + ID: "kv_latency_get", + Title: "Time between reception of a client GET request and subsequent response to client", + Units: "ms", + Fam: "latency", + Ctx: "riak.kv.latency.get", + Priority: prioKvLatencyGet, + Dims: module.Dims{ + {ID: "node_get_fsm_time_mean", Name: "mean", Div: 1000}, + {ID: "node_get_fsm_time_median", Name: "median", Div: 1000}, + {ID: "node_get_fsm_time_95", Name: "95", Div: 1000}, + {ID: "node_get_fsm_time_99", Name: "99", Div: 1000}, + {ID: "node_get_fsm_time_100", Name: "100", Div: 1000}, + }, + } + kvLatencyPutChart = module.Chart{ + ID: "kv_latency_put", + Title: "Time between reception of a client PUT request and subsequent response to client", + Units: "ms", + Fam: "latency", + Ctx: "riak.kv.latency.put", + Priority: prioKvLatencyPut, + Dims: module.Dims{ + {ID: "node_put_fsm_time_mean", Name: "mean", Div: 1000}, + {ID: "node_put_fsm_time_median", Name: "median", Div: 1000}, + {ID: "node_put_fsm_time_95", Name: "95", Div: 1000}, + {ID: "node_put_fsm_time_99", Name: "99", Div: 1000}, + {ID: "node_put_fsm_time_100", Name: "100", Div: 1000}, + }, + } + dtLatencyCounterChart = module.Chart{ + ID: "dt_latency_counter", + Title: "Time it takes to perform an Update Counter operation", + Units: "ms", + Fam: "latency", + Ctx: "riak.dt.latency.counter_merge", + Priority: prioDtLatencyCounter, + Dims: module.Dims{ + {ID: "object_counter_merge_time_mean", Name: "mean", Div: 1000}, + {ID: "object_counter_merge_time_median", Name: "median", Div: 1000}, + {ID: "object_counter_merge_time_95", Name: "95", Div: 1000}, + {ID: "object_counter_merge_time_99", Name: "99", Div: 1000}, + {ID: "object_counter_merge_time_100", Name: "100", Div: 1000}, + }, + } + dtLatencySetChart = module.Chart{ + ID: "dt_latency_counter", + Title: "Time it takes to perform an Update Set operation", + Units: "ms", + Fam: "latency", + Ctx: "riak.dt.latency.set_merge", + Priority: prioDtLatencySet, + Dims: module.Dims{ + {ID: "object_set_merge_time_mean", Name: "mean", Div: 1000}, + {ID: "object_set_merge_time_median", Name: "median", Div: 1000}, + {ID: "object_set_merge_time_95", Name: "95", Div: 1000}, + {ID: "object_set_merge_time_99", Name: "99", Div: 1000}, + {ID: "object_set_merge_time_100", Name: "100", Div: 1000}, + }, + } + dtLatencyMapChart = module.Chart{ + ID: "dt_latency_map", + Title: "Time it takes to perform an Update Map operation", + Units: "ms", + Fam: "latency", + Ctx: "riak.dt.latency.map_merge", + Priority: prioDtLatencyMap, + Dims: module.Dims{ + {ID: "object_map_merge_time_mean", Name: "mean", Div: 1000}, + {ID: "object_map_merge_time_median", Name: "median", Div: 1000}, + {ID: "object_map_merge_time_95", Name: "95", Div: 1000}, + {ID: "object_map_merge_time_99", Name: "99", Div: 1000}, + {ID: "object_map_merge_time_100", Name: "100", Div: 1000}, + }, + } + searchLatencyQueryChart = module.Chart{ + ID: "search_latency_query", + Title: "Search query latency", + Units: "ms", + Fam: "latency", + Ctx: "riak.search.latency.query", + Priority: prioSearchLatencyQuery, + Dims: module.Dims{ + {ID: "search_query_latency_median", Name: "median", Div: 1000}, + {ID: "search_query_latency_min", Name: "min", Div: 1000}, + {ID: "search_query_latency_95", Name: "95", Div: 1000}, + {ID: "search_query_latency_99", Name: "99", Div: 1000}, + {ID: "search_query_latency_999", Name: "999", Div: 1000}, + {ID: "search_query_latency_max", Name: "max", Div: 1000}, + }, + } + searchLatencyIndexChart = module.Chart{ + ID: "search_latency_index", + Title: "Time it takes Search to index a new document", + Units: "ms", + Fam: "latency", + Ctx: "riak.search.latency.index", + Priority: prioSearchLatencyIndex, + Dims: module.Dims{ + {ID: "search_index_latency_median", Name: "median", Div: 1000}, + {ID: "search_index_latency_min", Name: "min", Div: 1000}, + {ID: "search_index_latency_95", Name: "95", Div: 1000}, + {ID: "search_index_latency_99", Name: "99", Div: 1000}, + {ID: "search_index_latency_999", Name: "999", Div: 1000}, + {ID: "search_index_latency_max", Name: "max", Div: 1000}, + }, + } + consistentLatencyGetChart = module.Chart{ + ID: "consistent_latency_get", + Title: "Strongly consistent read latency", + Units: "ms", + Fam: "latency", + Ctx: "riak.consistent.latency.get", + Priority: prioConsistentLatencyGet, + Dims: module.Dims{ + {ID: "consistent_get_time_mean", Name: "mean", Div: 1000}, + {ID: "consistent_get_time_median", Name: "median", Div: 1000}, + {ID: "consistent_get_time_95", Name: "95", Div: 1000}, + {ID: "consistent_get_time_99", Name: "99", Div: 1000}, + {ID: "consistent_get_time_100", Name: "100", Div: 1000}, + }, + } + consistentLatencyPutChart = module.Chart{ + ID: "consistent_latency_put", + Title: "Strongly consistent write latency", + Units: "ms", + Fam: "latency", + Ctx: "riak.consistent.latency.put", + Priority: prioConsistentLatencyPut, + Dims: module.Dims{ + {ID: "consistent_put_time_mean", Name: "mean", Div: 1000}, + {ID: "consistent_put_time_median", Name: "median", Div: 1000}, + {ID: "consistent_put_time_95", Name: "95", Div: 1000}, + {ID: "consistent_put_time_99", Name: "99", Div: 1000}, + {ID: "consistent_put_time_100", Name: "100", Div: 1000}, + }, + } +) + +/* +Erlang's resource usage metrics +https://docs.riak.com/riak/kv/latest/using/reference/statistics-monitoring/index.html#erlang-resource-usage-metrics + +Processes collected as a gauge. +Memory collected as Megabytes, returned as bytes from Riak. +*/ +var ( + vmProcessesCountChart = module.Chart{ + ID: "vm_processes", + Title: "Total processes running in the Erlang VM", + Units: "processes", + Fam: "vm", + Ctx: "riak.vm.processes.count", + Priority: prioVmProcessesCount, + Dims: module.Dims{ + {ID: "sys_processes", Name: "processes"}, + }, + } + vmProcessesMemoryChart = module.Chart{ + ID: "vm_processes", + Title: "Memory allocated & used by Erlang processes", + Units: "bytes", + Fam: "vm", + Ctx: "riak.vm.processes.memory", + Priority: prioVmProcessesMemory, + Dims: module.Dims{ + {ID: "memory_processes", Name: "allocated"}, + {ID: "memory_processes_used", Name: "used"}, + }, + } +) + +/* +General Riak Load / Health metrics +https://docs.riak.com/riak/kv/latest/using/reference/statistics-monitoring/index.html#general-riak-load-health-metrics +*/ +var ( + // General Riak Load / Health metrics + // https://docs.riak.com/riak/kv/latest/using/reference/statistics-monitoring/index.html#general-riak-load-health-metrics + // Collected by Riak over the past minute + + kvSiblingsEncounteredGetChart = module.Chart{ + ID: "kv_siblings_encountered_get", + Title: "Siblings encountered during GET operations by this node during the past minute", + Units: "siblings", + Fam: "load", + Ctx: "riak.kv.siblings_encountered.get", + Priority: prioKvSiblingsEncounteredGet, + Dims: module.Dims{ + {ID: "node_get_fsm_siblings_mean", Name: "mean"}, + {ID: "node_get_fsm_siblings_median", Name: "median"}, + {ID: "node_get_fsm_siblings_95", Name: "95"}, + {ID: "node_get_fsm_siblings_99", Name: "99"}, + {ID: "node_get_fsm_siblings_100", Name: "100"}, + }, + } + kvObjectSizeGetChart = module.Chart{ + ID: "kv_siblings_encountered_get", + Title: "Object size encountered by this node during the past minute", + Units: "bytes", + Fam: "load", + Ctx: "riak.kv.objsize.get", + Priority: prioKvObjSizeGet, + Dims: module.Dims{ + {ID: "node_get_fsm_objsize_mean", Name: "mean"}, + {ID: "node_get_fsm_objsize_median", Name: "median"}, + {ID: "node_get_fsm_objsize_95", Name: "95"}, + {ID: "node_get_fsm_objsize_99", Name: "99"}, + {ID: "node_get_fsm_objsize_100", Name: "100"}, + }, + } + searchVnodeqSizeChart = module.Chart{ + ID: "kv_siblings_encountered_get", + Title: "Unprocessed messages in the vnode message queues of Search in the past minute", + Units: "messages", + Fam: "load", + Ctx: "riak.search.vnodeq_size", + Priority: prioSearchVnodeqSize, + Dims: module.Dims{ + {ID: "riak_search_vnodeq_mean", Name: "mean"}, + {ID: "riak_search_vnodeq_median", Name: "median"}, + {ID: "riak_search_vnodeq_95", Name: "95"}, + {ID: "riak_search_vnodeq_99", Name: "99"}, + {ID: "riak_search_vnodeq_100", Name: "100"}, + }, + } + + // General Riak Search Load / Health metrics + // https://docs.riak.com/riak/kv/latest/using/reference/statistics-monitoring/index.html#general-riak-search-load-health-metrics + // https://docs.riak.com/riak/kv/latest/using/reference/statistics-monitoring/index.html#general-riak-search-load-health-metrics + // Reported as counters. + + searchIndexErrorsChart = module.Chart{ + ID: "search_index_errors", + Title: "Errors encountered by Search", + Units: "errors", + Fam: "load", + Ctx: "riak.search.index.errors", + Priority: prioSearchIndexErrors, + Dims: module.Dims{ + {ID: "search_index_fail_count", Name: "index_fail"}, + {ID: "search_index_bad_entry_count", Name: "bad_entry"}, + {ID: "search_index_extract_fail_count", Name: "extract_fail"}, + }, + } + corePbsChart = module.Chart{ + ID: "core_pbc", + Title: "Protocol buffer connections by status", + Units: "connections", + Fam: "load", + Ctx: "riak.core.protobuf_connections", + Priority: prioCorePbc, + Dims: module.Dims{ + {ID: "pbc_active", Name: "active"}, + }, + } + coreRepairsChart = module.Chart{ + ID: "core_repairs", + Title: "Number of repair operations this node has coordinated", + Units: "repairs", + Fam: "load", + Ctx: "riak.core.protobuf_connections", + Priority: prioCoreRepairs, + Dims: module.Dims{ + {ID: "read_repairs", Name: "read"}, + }, + } + coreFsmActiveChart = module.Chart{ + ID: "core_fsm_active", + Title: "Active finite state machines by kind", + Units: "fsms", + Fam: "load", + Ctx: "riak.core.fsm_active", + Priority: prioCoreFsmActive, + Dims: module.Dims{ + {ID: "node_get_fsm_active", Name: "get"}, + {ID: "node_put_fsm_active", Name: "put"}, + {ID: "index_fsm_active", Name: "secondary_index"}, + {ID: "list_fsm_active", Name: "list_keys"}, + }, + } + coreFsmRejectedChart = module.Chart{ + ID: "core_fsm_rejected", + Title: "Finite state machines being rejected by Sidejobs overload protection", + Units: "fsms", + Fam: "load", + Ctx: "riak.core.fsm_rejected", + Priority: prioCoreFsmREjected, + Dims: module.Dims{ + {ID: "node_get_fsm_rejected", Name: "get"}, + {ID: "node_put_fsm_rejected", Name: "put"}, + }, + } +) + +func (r *RiakKv) adjustCharts(mx map[string]int64) { + var i int + for _, chart := range *r.Charts() { + chart.Dims = slices.DeleteFunc(chart.Dims, func(dim *module.Dim) bool { + _, ok := mx[dim.ID] + if !ok { + r.Debugf("removing dimension '%s' from chart '%s': metric not found", dim.ID, chart.ID) + } + return !ok + }) + + if len(chart.Dims) == 0 { + r.Debugf("removing chart '%s': no metrics found", chart.ID) + continue + } + + (*r.Charts())[i] = chart + i++ + } +} diff --git a/src/go/plugin/go.d/modules/riakkv/collect.go b/src/go/plugin/go.d/modules/riakkv/collect.go new file mode 100644 index 000000000..0b3be9438 --- /dev/null +++ b/src/go/plugin/go.d/modules/riakkv/collect.go @@ -0,0 +1,74 @@ +// SPDX-License-Identifier: GPL-3.0-or-later + +package riakkv + +import ( + "encoding/json" + "errors" + "fmt" + "io" + "net/http" + + "github.com/netdata/netdata/go/plugins/plugin/go.d/pkg/stm" + "github.com/netdata/netdata/go/plugins/plugin/go.d/pkg/web" +) + +func (r *RiakKv) collect() (map[string]int64, error) { + stats, err := r.getStats() + if err != nil { + return nil, err + } + + mx := stm.ToMap(stats) + + if len(mx) == 0 { + return nil, errors.New("no stats") + } + + r.once.Do(func() { r.adjustCharts(mx) }) + + return mx, nil +} + +func (r *RiakKv) getStats() (*riakStats, error) { + req, err := web.NewHTTPRequest(r.Request) + if err != nil { + return nil, err + } + + var stats riakStats + if err := r.doOKDecode(req, &stats); err != nil { + return nil, err + } + + return &stats, nil +} + +func (r *RiakKv) doOKDecode(req *http.Request, in interface{}) error { + resp, err := r.httpClient.Do(req) + if err != nil { + return fmt.Errorf("error on HTTP request '%s': %v", req.URL, err) + } + defer closeBody(resp) + + if resp.StatusCode != http.StatusOK { + msg := fmt.Sprintf("'%s' returned HTTP status code: %d", req.URL, resp.StatusCode) + if resp.StatusCode == http.StatusNotFound { + msg = fmt.Sprintf("%s (riak_kv_stat is not enabled)", msg) + } + return errors.New(msg) + } + + if err := json.NewDecoder(resp.Body).Decode(in); err != nil { + return fmt.Errorf("error on decoding response from '%s': %v", req.URL, err) + } + + return nil +} + +func closeBody(resp *http.Response) { + if resp != nil && resp.Body != nil { + _, _ = io.Copy(io.Discard, resp.Body) + _ = resp.Body.Close() + } +} diff --git a/src/go/plugin/go.d/modules/riakkv/config_schema.json b/src/go/plugin/go.d/modules/riakkv/config_schema.json new file mode 100644 index 000000000..402c2c106 --- /dev/null +++ b/src/go/plugin/go.d/modules/riakkv/config_schema.json @@ -0,0 +1,186 @@ +{ + "jsonSchema": { + "$schema": "http://json-schema.org/draft-07/schema#", + "title": "RiakKV collector configuration.", + "type": "object", + "properties": { + "update_every": { + "title": "Update every", + "description": "Data collection interval, measured in seconds.", + "type": "integer", + "minimum": 1, + "default": 2 + }, + "url": { + "title": "URL", + "description": "The URL of the RiakKV [Stat](https://docs.riak.com/riak/kv/2.2.3/developing/api/http/status.1.html) endpoint.", + "type": "string", + "default": "http://127.0.0.1:8098/stats", + "format": "uri" + }, + "timeout": { + "title": "Timeout", + "description": "The timeout in seconds for the HTTP request.", + "type": "number", + "minimum": 0.5, + "default": 1 + }, + "not_follow_redirects": { + "title": "Not follow redirects", + "description": "If set, the client will not follow HTTP redirects automatically.", + "type": "boolean" + }, + "username": { + "title": "Username", + "description": "The username for basic authentication.", + "type": "string", + "sensitive": true + }, + "password": { + "title": "Password", + "description": "The password for basic authentication.", + "type": "string", + "sensitive": true + }, + "proxy_url": { + "title": "Proxy URL", + "description": "The URL of the proxy server.", + "type": "string" + }, + "proxy_username": { + "title": "Proxy username", + "description": "The username for proxy authentication.", + "type": "string", + "sensitive": true + }, + "proxy_password": { + "title": "Proxy password", + "description": "The password for proxy authentication.", + "type": "string", + "sensitive": true + }, + "headers": { + "title": "Headers", + "description": "Additional HTTP headers to include in the request.", + "type": [ + "object", + "null" + ], + "additionalProperties": { + "type": "string" + } + }, + "tls_skip_verify": { + "title": "Skip TLS verification", + "description": "If set, TLS certificate verification will be skipped.", + "type": "boolean" + }, + "tls_ca": { + "title": "TLS CA", + "description": "The path to the CA certificate file for TLS verification.", + "type": "string", + "pattern": "^$|^/" + }, + "tls_cert": { + "title": "TLS certificate", + "description": "The path to the client certificate file for TLS authentication.", + "type": "string", + "pattern": "^$|^/" + }, + "tls_key": { + "title": "TLS key", + "description": "The path to the client key file for TLS authentication.", + "type": "string", + "pattern": "^$|^/" + }, + "body": { + "title": "Body", + "type": "string" + }, + "method": { + "title": "Method", + "type": "string" + } + }, + "required": [ + "url" + ], + "additionalProperties": false, + "patternProperties": { + "^name$": {} + } + }, + "uiSchema": { + "uiOptions": { + "fullPage": true + }, + "body": { + "ui:widget": "hidden" + }, + "method": { + "ui:widget": "hidden" + }, + "update_every": { + "ui:help": "Riak updates metrics on the `/stats` endpoint every second. To ensure accurate data representation, a polling interval of 2 seconds or more is suggested." + }, + "timeout": { + "ui:help": "Accepts decimals for precise control (e.g., type 1.5 for 1.5 seconds)." + }, + "username": { + "ui:widget": "password" + }, + "proxy_username": { + "ui:widget": "password" + }, + "password": { + "ui:widget": "password" + }, + "proxy_password": { + "ui:widget": "password" + }, + "ui:flavour": "tabs", + "ui:options": { + "tabs": [ + { + "title": "Base", + "fields": [ + "update_every", + "url", + "timeout", + "not_follow_redirects" + ] + }, + { + "title": "Auth", + "fields": [ + "username", + "password" + ] + }, + { + "title": "TLS", + "fields": [ + "tls_skip_verify", + "tls_ca", + "tls_cert", + "tls_key" + ] + }, + { + "title": "Proxy", + "fields": [ + "proxy_url", + "proxy_username", + "proxy_password" + ] + }, + { + "title": "Headers", + "fields": [ + "headers" + ] + } + ] + } + } +} diff --git a/src/go/plugin/go.d/modules/riakkv/integrations/riak_kv.md b/src/go/plugin/go.d/modules/riakkv/integrations/riak_kv.md new file mode 100644 index 000000000..872736277 --- /dev/null +++ b/src/go/plugin/go.d/modules/riakkv/integrations/riak_kv.md @@ -0,0 +1,283 @@ +<!--startmeta +custom_edit_url: "https://github.com/netdata/netdata/edit/master/src/go/plugin/go.d/modules/riakkv/README.md" +meta_yaml: "https://github.com/netdata/netdata/edit/master/src/go/plugin/go.d/modules/riakkv/metadata.yaml" +sidebar_label: "Riak KV" +learn_status: "Published" +learn_rel_path: "Collecting Metrics/Databases" +most_popular: False +message: "DO NOT EDIT THIS FILE DIRECTLY, IT IS GENERATED BY THE COLLECTOR'S metadata.yaml FILE" +endmeta--> + +# Riak KV + + +<img src="https://netdata.cloud/img/riak.svg" width="150"/> + + +Plugin: go.d.plugin +Module: riakkv + +<img src="https://img.shields.io/badge/maintained%20by-Netdata-%2300ab44" /> + +## Overview + +This collector monitors RiakKV metrics about throughput, latency, resources and more. + + +It sends HTTP requests to the Riak [/stats](https://docs.riak.com/riak/kv/2.2.3/developing/api/http/status.1.html) endpoint. + + +This collector is supported on all platforms. + +This collector supports collecting metrics from multiple instances of this integration, including remote instances. + + +### Default Behavior + +#### Auto-Detection + +By default, it detects Riak instances running on localhost that are listening on port 8098. +On startup, it tries to collect metrics from: + +- http://127.0.0.1:8098/stats + + +#### Limits + +The default configuration for this integration does not impose any limits on data collection. + +#### Performance Impact + +The default configuration for this integration is not expected to impose a significant performance impact on the system. + + +## Metrics + +Metrics grouped by *scope*. + +The scope defines the instance that the metric belongs to. An instance is uniquely identified by a set of labels. + + + +### Per Riak KV instance + +These metrics refer to the entire monitored application. + +This scope has no labels. + +Metrics: + +| Metric | Dimensions | Unit | +|:------|:----------|:----| +| riak.kv.throughput | gets, puts | operations/s | +| riak.dt.vnode_updates | counters, sets, maps | operations/s | +| riak.search | queries | queries/s | +| riak.search.documents | indexed | documents/s | +| riak.consistent.operations | gets, puts | operations/s | +| riak.kv.latency.get | mean, median, 95, 99, 100 | ms | +| riak.kv.latency.put | mean, median, 95, 99, 100 | ms | +| riak.dt.latency.counter_merge | mean, median, 95, 99, 100 | ms | +| riak.dt.latency.set_merge | mean, median, 95, 99, 100 | ms | +| riak.dt.latency.map_merge | mean, median, 95, 99, 100 | ms | +| riak.search.latency.query | median, min, 95, 99, 999, max | ms | +| riak.search.latency.index | median, min, 95, 99, 999, max | ms | +| riak.consistent.latency.get | mean, median, 95, 99, 100 | ms | +| riak.consistent.latency.put | mean, median, 95, 99, 100 | ms | +| riak.vm | processes | total | +| riak.vm.memory.processes | allocated, used | MB | +| riak.kv.siblings_encountered.get | mean, median, 95, 99, 100 | siblings | +| riak.kv.objsize.get | mean, median, 95, 99, 100 | KB | +| riak.search.vnodeq_size | mean, median, 95, 99, 100 | messages | +| riak.search.index | index_fail, bad_entry, extract_fail | errors | +| riak.core.protobuf_connections | active | connections | +| riak.core.repairs | read | repairs | +| riak.core.fsm_active | get, put, secondary index, list keys | fsms | +| riak.core.fsm_rejected | get, put | fsms | + + + +## Alerts + +There are no alerts configured by default for this integration. + + +## Setup + +### Prerequisites + +#### Enable /stats endpoint + +See the RiakKV [configuration reference](https://docs.riak.com/riak/kv/2.2.3/developing/api/http/status.1.html). + + + +### Configuration + +#### File + +The configuration file name for this integration is `go.d/riakkv.conf`. + + +You can edit the configuration file using the `edit-config` script from the +Netdata [config directory](/docs/netdata-agent/configuration/README.md#the-netdata-config-directory). + +```bash +cd /etc/netdata 2>/dev/null || cd /opt/netdata/etc/netdata +sudo ./edit-config go.d/riakkv.conf +``` +#### Options + +The following options can be defined globally: update_every, autodetection_retry. + + +<details open><summary>Config options</summary> + +| Name | Description | Default | Required | +|:----|:-----------|:-------|:--------:| +| update_every | Data collection frequency. | 1 | no | +| autodetection_retry | Recheck interval in seconds. Zero means no recheck will be scheduled. | 0 | no | +| url | Server URL. | http://127.0.0.1:8098/stats | yes | +| timeout | HTTP request timeout. | 1 | no | +| username | Username for basic HTTP authentication. | | no | +| password | Password for basic HTTP authentication. | | no | +| proxy_url | Proxy URL. | | no | +| proxy_username | Username for proxy basic HTTP authentication. | | no | +| proxy_password | Password for proxy basic HTTP authentication. | | no | +| method | HTTP request method. | GET | no | +| body | HTTP request body. | | no | +| headers | HTTP request headers. | | no | +| not_follow_redirects | Redirect handling policy. Controls whether the client follows redirects. | no | no | +| tls_skip_verify | Server certificate chain and hostname validation policy. Controls whether the client performs this check. | no | no | +| tls_ca | Certification authority that the client uses when verifying the server's certificates. | | no | +| tls_cert | Client TLS certificate. | | no | +| tls_key | Client TLS key. | | no | + +</details> + +#### Examples + +##### Basic + +A basic example configuration. + +```yaml +jobs: + - name: local + url: http://127.0.0.1:8098/stats + +``` +##### HTTP authentication + +Basic HTTP authentication. + +<details open><summary>Config</summary> + +```yaml +jobs: + - name: local + url: http://127.0.0.1:8098/stats + username: username + password: password + +``` +</details> + +##### HTTPS with self-signed certificate + +With enabled HTTPS and self-signed certificate. + +<details open><summary>Config</summary> + +```yaml +jobs: + - name: local + url: http://127.0.0.1:8098/stats + tls_skip_verify: yes + +``` +</details> + +##### Multi-instance + +> **Note**: When you define multiple jobs, their names must be unique. + +Collecting metrics from local and remote instances. + + +<details open><summary>Config</summary> + +```yaml +jobs: + - name: local + url: http://127.0.0.1:8098/stats + + - name: remote + url: http://192.0.2.1:8098/stats + +``` +</details> + + + +## Troubleshooting + +### Debug Mode + +**Important**: Debug mode is not supported for data collection jobs created via the UI using the Dyncfg feature. + +To troubleshoot issues with the `riakkv` collector, run the `go.d.plugin` with the debug option enabled. The output +should give you clues as to why the collector isn't working. + +- Navigate to the `plugins.d` directory, usually at `/usr/libexec/netdata/plugins.d/`. If that's not the case on + your system, open `netdata.conf` and look for the `plugins` setting under `[directories]`. + + ```bash + cd /usr/libexec/netdata/plugins.d/ + ``` + +- Switch to the `netdata` user. + + ```bash + sudo -u netdata -s + ``` + +- Run the `go.d.plugin` to debug the collector: + + ```bash + ./go.d.plugin -d -m riakkv + ``` + +### Getting Logs + +If you're encountering problems with the `riakkv` collector, follow these steps to retrieve logs and identify potential issues: + +- **Run the command** specific to your system (systemd, non-systemd, or Docker container). +- **Examine the output** for any warnings or error messages that might indicate issues. These messages should provide clues about the root cause of the problem. + +#### System with systemd + +Use the following command to view logs generated since the last Netdata service restart: + +```bash +journalctl _SYSTEMD_INVOCATION_ID="$(systemctl show --value --property=InvocationID netdata)" --namespace=netdata --grep riakkv +``` + +#### System without systemd + +Locate the collector log file, typically at `/var/log/netdata/collector.log`, and use `grep` to filter for collector's name: + +```bash +grep riakkv /var/log/netdata/collector.log +``` + +**Note**: This method shows logs from all restarts. Focus on the **latest entries** for troubleshooting current issues. + +#### Docker Container + +If your Netdata runs in a Docker container named "netdata" (replace if different), use this command: + +```bash +docker logs netdata 2>&1 | grep riakkv +``` + + diff --git a/src/collectors/python.d.plugin/riakkv/metadata.yaml b/src/go/plugin/go.d/modules/riakkv/metadata.yaml index d68e73053..435cc4f9b 100644 --- a/src/collectors/python.d.plugin/riakkv/metadata.yaml +++ b/src/go/plugin/go.d/modules/riakkv/metadata.yaml @@ -1,17 +1,19 @@ -plugin_name: python.d.plugin +plugin_name: go.d.plugin modules: - meta: - plugin_name: python.d.plugin + id: collector-go.d.plugin-riakkv + plugin_name: go.d.plugin module_name: riakkv monitored_instance: - name: RiakKV - link: "https://riak.com/products/riak-kv/index.html" + name: Riak KV + link: https://riak.com/products/riak-kv/index.html categories: - data-collection.database-servers icon_filename: "riak.svg" related_resources: integrations: list: [] + alternative_monitored_instances: [] info_provided_to_referring_integrations: description: "" keywords: @@ -22,119 +24,154 @@ modules: overview: data_collection: metrics_description: | - This collector monitors RiakKV metrics about throughput, latency, resources and more.' - method_description: "This collector reads the database stats from the `/stats` endpoint." - supported_platforms: - include: [] - exclude: [] - multi_instance: true - additional_permissions: - description: "" + This collector monitors RiakKV metrics about throughput, latency, resources and more. + method_description: | + It sends HTTP requests to the Riak [/stats](https://docs.riak.com/riak/kv/2.2.3/developing/api/http/status.1.html) endpoint. default_behavior: auto_detection: - description: "If the /stats endpoint is accessible, RiakKV instances on the local host running on port 8098 will be autodetected." + description: | + By default, it detects Riak instances running on localhost that are listening on port 8098. + On startup, it tries to collect metrics from: + + - http://127.0.0.1:8098/stats limits: description: "" performance_impact: description: "" + additional_permissions: + description: "" + multi_instance: true + supported_platforms: + include: [] + exclude: [] setup: prerequisites: list: - - title: Configure RiakKV to enable /stats endpoint + - title: Enable /stats endpoint description: | - You can follow the RiakKV configuration reference documentation for how to enable this. - - Source : https://docs.riak.com/riak/kv/2.2.3/configuring/reference/#client-interfaces + See the RiakKV [configuration reference](https://docs.riak.com/riak/kv/2.2.3/developing/api/http/status.1.html). configuration: file: - name: "python.d/riakkv.conf" + name: go.d/riakkv.conf options: description: | - There are 2 sections: - - * Global variables - * One or more JOBS that can define multiple different instances to monitor. - - The following options can be defined globally: priority, penalty, autodetection_retry, update_every, but can also be defined per JOB to override the global values. - - Additionally, the following collapsed table contains all the options that can be configured inside a JOB definition. - - Every configuration JOB starts with a `job_name` value which will appear in the dashboard, unless a `name` parameter is specified. + The following options can be defined globally: update_every, autodetection_retry. folding: - title: "Config options" + title: Config options enabled: true list: - name: update_every - description: Sets the default data collection frequency. - default_value: 5 - required: false - - name: priority - description: Controls the order of charts at the netdata dashboard. - default_value: 60000 + description: Data collection frequency. + default_value: 1 required: false - name: autodetection_retry - description: Sets the job re-check interval in seconds. + description: Recheck interval in seconds. Zero means no recheck will be scheduled. default_value: 0 required: false - - name: penalty - description: Indicates whether to apply penalty to update_every in case of failures. - default_value: yes - required: false - name: url - description: The url of the server - default_value: no + description: Server URL. + default_value: http://127.0.0.1:8098/stats required: true + - name: timeout + description: HTTP request timeout. + default_value: 1 + required: false + - name: username + description: Username for basic HTTP authentication. + default_value: "" + required: false + - name: password + description: Password for basic HTTP authentication. + default_value: "" + required: false + - name: proxy_url + description: Proxy URL. + default_value: "" + required: false + - name: proxy_username + description: Username for proxy basic HTTP authentication. + default_value: "" + required: false + - name: proxy_password + description: Password for proxy basic HTTP authentication. + default_value: "" + required: false + - name: method + description: HTTP request method. + default_value: GET + required: false + - name: body + description: HTTP request body. + default_value: "" + required: false + - name: headers + description: HTTP request headers. + default_value: "" + required: false + - name: not_follow_redirects + description: Redirect handling policy. Controls whether the client follows redirects. + default_value: false + required: false + - name: tls_skip_verify + description: Server certificate chain and hostname validation policy. Controls whether the client performs this check. + default_value: false + required: false + - name: tls_ca + description: Certification authority that the client uses when verifying the server's certificates. + default_value: "" + required: false + - name: tls_cert + description: Client TLS certificate. + default_value: "" + required: false + - name: tls_key + description: Client TLS key. + default_value: "" + required: false examples: folding: + title: Config enabled: true - title: "Config" list: - - name: Basic (default) + - name: Basic + description: A basic example configuration. folding: enabled: false - description: A basic example configuration per job config: | - local: - url: 'http://localhost:8098/stats' + jobs: + - name: local + url: http://127.0.0.1:8098/stats + - name: HTTP authentication + description: Basic HTTP authentication. + config: | + jobs: + - name: local + url: http://127.0.0.1:8098/stats + username: username + password: password + - name: HTTPS with self-signed certificate + description: With enabled HTTPS and self-signed certificate. + config: | + jobs: + - name: local + url: http://127.0.0.1:8098/stats + tls_skip_verify: yes - name: Multi-instance description: | > **Note**: When you define multiple jobs, their names must be unique. Collecting metrics from local and remote instances. config: | - local: - url: 'http://localhost:8098/stats' + jobs: + - name: local + url: http://127.0.0.1:8098/stats - remote: - url: 'http://192.0.2.1:8098/stats' + - name: remote + url: http://192.0.2.1:8098/stats troubleshooting: problems: list: [] - alerts: - - name: riakkv_1h_kv_get_mean_latency - link: https://github.com/netdata/netdata/blob/master/src/health/health.d/riakkv.conf - metric: riak.kv.latency.get - info: average time between reception of client GET request and subsequent response to client over the last hour - - name: riakkv_kv_get_slow - link: https://github.com/netdata/netdata/blob/master/src/health/health.d/riakkv.conf - metric: riak.kv.latency.get - info: average time between reception of client GET request and subsequent response to the client over the last 3 minutes, compared to the average over the last hour - - name: riakkv_1h_kv_put_mean_latency - link: https://github.com/netdata/netdata/blob/master/src/health/health.d/riakkv.conf - metric: riak.kv.latency.put - info: average time between reception of client PUT request and subsequent response to the client over the last hour - - name: riakkv_kv_put_slow - link: https://github.com/netdata/netdata/blob/master/src/health/health.d/riakkv.conf - metric: riak.kv.latency.put - info: average time between reception of client PUT request and subsequent response to the client over the last 3 minutes, compared to the average over the last hour - - name: riakkv_vm_high_process_count - link: https://github.com/netdata/netdata/blob/master/src/health/health.d/riakkv.conf - metric: riak.vm - info: number of processes running in the Erlang VM - - name: riakkv_list_keys_active - link: https://github.com/netdata/netdata/blob/master/src/health/health.d/riakkv.conf - metric: riak.core.fsm_active - info: number of currently running list keys finite state machines + alerts: [] metrics: folding: title: Metrics @@ -143,7 +180,7 @@ modules: availability: [] scopes: - name: global - description: "These metrics refer to the entire monitored application." + description: These metrics refer to the entire monitored application. labels: [] metrics: - name: riak.kv.throughput @@ -316,11 +353,13 @@ modules: - name: "99" - name: "100" - name: riak.search.index - description: Number of document index errors encountered by Search + description: Errors encountered by Search unit: "errors" chart_type: line dimensions: - - name: errors + - name: index_fail + - name: bad_entry + - name: extract_fail - name: riak.core.protobuf_connections description: Protocol buffer connections by status unit: "connections" @@ -349,10 +388,3 @@ modules: dimensions: - name: get - name: put - - name: riak.search.index - description: Number of writes to Search failed due to bad data format by reason - unit: "writes" - chart_type: line - dimensions: - - name: bad_entry - - name: extract_fail diff --git a/src/go/plugin/go.d/modules/riakkv/riakkv.go b/src/go/plugin/go.d/modules/riakkv/riakkv.go new file mode 100644 index 000000000..64aeda1c1 --- /dev/null +++ b/src/go/plugin/go.d/modules/riakkv/riakkv.go @@ -0,0 +1,122 @@ +// SPDX-License-Identifier: GPL-3.0-or-later + +package riakkv + +import ( + _ "embed" + "errors" + "net/http" + "sync" + "time" + + "github.com/netdata/netdata/go/plugins/plugin/go.d/agent/module" + "github.com/netdata/netdata/go/plugins/plugin/go.d/pkg/web" +) + +//go:embed "config_schema.json" +var configSchema string + +func init() { + module.Register("riakkv", module.Creator{ + Create: func() module.Module { return New() }, + // Riak updates the metrics on the /stats endpoint every 1 second. + // If we use 1 here, it means we might get weird jitter in the graph, + // so the default is set to 2 seconds to prevent that. + Defaults: module.Defaults{ + UpdateEvery: 2, + }, + JobConfigSchema: configSchema, + Config: func() any { return &Config{} }, + }) +} + +func New() *RiakKv { + return &RiakKv{ + Config: Config{ + HTTP: web.HTTP{ + Request: web.Request{ + // https://docs.riak.com/riak/kv/2.2.3/developing/api/http/status.1.html + URL: "http://127.0.0.1:8098/stats", + }, + Client: web.Client{ + Timeout: web.Duration(time.Second), + }, + }, + }, + once: &sync.Once{}, + charts: charts.Copy(), + } +} + +type Config struct { + UpdateEvery int `yaml:"update_every,omitempty" json:"update_every"` + web.HTTP `yaml:",inline" json:""` +} + +type RiakKv struct { + module.Base + Config `yaml:",inline" json:""` + + once *sync.Once + charts *module.Charts + + httpClient *http.Client +} + +func (r *RiakKv) Configuration() any { + return r.Config +} + +func (r *RiakKv) Init() error { + if r.URL == "" { + r.Errorf("url required but not set") + return errors.New("url not set") + } + + httpClient, err := web.NewHTTPClient(r.Client) + if err != nil { + r.Errorf("init HTTP client: %v", err) + return err + } + r.httpClient = httpClient + + r.Debugf("using URL %s", r.URL) + r.Debugf("using timeout: %s", r.Timeout) + + return nil +} + +func (r *RiakKv) Check() error { + mx, err := r.collect() + if err != nil { + r.Error(err) + return err + } + if len(mx) == 0 { + return errors.New("no metrics collected") + + } + return nil +} + +func (r *RiakKv) Charts() *module.Charts { + return r.charts +} + +func (r *RiakKv) Collect() map[string]int64 { + mx, err := r.collect() + if err != nil { + r.Error(err) + } + + if len(mx) == 0 { + return nil + } + return mx +} + +func (r *RiakKv) Cleanup() { + if r.httpClient != nil { + r.httpClient.CloseIdleConnections() + } +} diff --git a/src/go/plugin/go.d/modules/riakkv/riakkv_test.go b/src/go/plugin/go.d/modules/riakkv/riakkv_test.go new file mode 100644 index 000000000..de4e24092 --- /dev/null +++ b/src/go/plugin/go.d/modules/riakkv/riakkv_test.go @@ -0,0 +1,265 @@ +// SPDX-License-Identifier: GPL-3.0-or-later + +package riakkv + +import ( + "net/http" + "net/http/httptest" + "os" + "testing" + + "github.com/netdata/netdata/go/plugins/plugin/go.d/agent/module" + "github.com/netdata/netdata/go/plugins/plugin/go.d/pkg/web" + + "github.com/stretchr/testify/assert" + "github.com/stretchr/testify/require" +) + +var ( + dataConfigJSON, _ = os.ReadFile("testdata/config.json") + dataConfigYAML, _ = os.ReadFile("testdata/config.yaml") + + dataStats, _ = os.ReadFile("testdata/stats.json") +) + +func Test_testDataIsValid(t *testing.T) { + for name, data := range map[string][]byte{ + "dataConfigJSON": dataConfigJSON, + "dataConfigYAML": dataConfigYAML, + "dataStats": dataStats, + } { + require.NotNil(t, data, name) + + } +} + +func TestRiakKv_ConfigurationSerialize(t *testing.T) { + module.TestConfigurationSerialize(t, &RiakKv{}, dataConfigJSON, dataConfigYAML) +} + +func TestRiakKv_Init(t *testing.T) { + tests := map[string]struct { + wantFail bool + config Config + }{ + "success with default": { + wantFail: false, + config: New().Config, + }, + "fail when URL not set": { + wantFail: true, + config: Config{ + HTTP: web.HTTP{ + Request: web.Request{URL: ""}, + }, + }, + }, + } + + for name, test := range tests { + t.Run(name, func(t *testing.T) { + riak := New() + riak.Config = test.config + + if test.wantFail { + assert.Error(t, riak.Init()) + } else { + assert.NoError(t, riak.Init()) + } + }) + } +} + +func TestRiakKv_Check(t *testing.T) { + tests := map[string]struct { + wantFail bool + prepare func(t *testing.T) (riak *RiakKv, cleanup func()) + }{ + "success on valid response": { + wantFail: false, + prepare: caseOkResponse, + }, + "fail on invalid data response": { + wantFail: true, + prepare: caseInvalidDataResponse, + }, + "fail on connection refused": { + wantFail: true, + prepare: caseConnectionRefused, + }, + "fail on 404 response": { + wantFail: true, + prepare: case404, + }, + } + + for name, test := range tests { + t.Run(name, func(t *testing.T) { + riak, cleanup := test.prepare(t) + defer cleanup() + + if test.wantFail { + assert.Error(t, riak.Check()) + } else { + assert.NoError(t, riak.Check()) + } + }) + } +} + +func TestRiakKv_Charts(t *testing.T) { + assert.NotNil(t, New().Charts()) +} + +func TestRiakKv_Collect(t *testing.T) { + tests := map[string]struct { + prepare func(t *testing.T) (riak *RiakKv, cleanup func()) + wantMetrics map[string]int64 + }{ + "success on valid response": { + prepare: caseOkResponse, + wantMetrics: map[string]int64{ + "consistent_get_time_100": 1, + "consistent_get_time_95": 1, + "consistent_get_time_99": 1, + "consistent_get_time_mean": 1, + "consistent_get_time_median": 1, + "consistent_gets_total": 1, + "consistent_put_time_100": 1, + "consistent_put_time_95": 1, + "consistent_put_time_99": 1, + "consistent_put_time_mean": 1, + "consistent_put_time_median": 1, + "consistent_puts_total": 1, + "index_fsm_active": 1, + "list_fsm_active": 1, + "memory_processes": 274468041, + "memory_processes_used": 274337336, + "node_get_fsm_active": 1, + "node_get_fsm_objsize_100": 1037, + "node_get_fsm_objsize_95": 1, + "node_get_fsm_objsize_99": 1025, + "node_get_fsm_objsize_mean": 791, + "node_get_fsm_objsize_median": 669, + "node_get_fsm_rejected": 1, + "node_get_fsm_siblings_100": 1, + "node_get_fsm_siblings_95": 1, + "node_get_fsm_siblings_99": 1, + "node_get_fsm_siblings_mean": 1, + "node_get_fsm_siblings_median": 1, + "node_get_fsm_time_100": 678351, + "node_get_fsm_time_95": 1, + "node_get_fsm_time_99": 10148, + "node_get_fsm_time_mean": 2161, + "node_get_fsm_time_median": 1022, + "node_gets_total": 422626, + "node_put_fsm_active": 1, + "node_put_fsm_rejected": 1, + "node_put_fsm_time_100": 1049568, + "node_put_fsm_time_95": 19609, + "node_put_fsm_time_99": 37735, + "node_put_fsm_time_mean": 11828, + "node_put_fsm_time_median": 5017, + "node_puts_total": 490965, + "object_counter_merge_time_100": 1, + "object_counter_merge_time_95": 1, + "object_counter_merge_time_99": 1, + "object_counter_merge_time_mean": 1, + "object_counter_merge_time_median": 1, + "object_map_merge_time_100": 1, + "object_map_merge_time_95": 1, + "object_map_merge_time_99": 1, + "object_map_merge_time_mean": 1, + "object_map_merge_time_median": 1, + "object_set_merge_time_100": 1, + "object_set_merge_time_95": 1, + "object_set_merge_time_99": 1, + "object_set_merge_time_mean": 1, + "object_set_merge_time_median": 1, + "pbc_active": 46, + "read_repairs": 1, + "vnode_counter_update_total": 1, + "vnode_map_update_total": 1, + "vnode_set_update_total": 1, + }, + }, + "fail on invalid data response": { + prepare: caseInvalidDataResponse, + wantMetrics: nil, + }, + "fail on connection refused": { + prepare: caseConnectionRefused, + wantMetrics: nil, + }, + "fail on 404 response": { + prepare: case404, + wantMetrics: nil, + }, + } + + for name, test := range tests { + t.Run(name, func(t *testing.T) { + riak, cleanup := test.prepare(t) + defer cleanup() + + _ = riak.Check() + + mx := riak.Collect() + + require.Equal(t, test.wantMetrics, mx) + + if len(test.wantMetrics) > 0 { + require.True(t, len(*riak.Charts()) > 0, "charts > 0") + module.TestMetricsHasAllChartsDims(t, riak.Charts(), mx) + } + }) + } +} + +func caseOkResponse(t *testing.T) (*RiakKv, func()) { + t.Helper() + srv := httptest.NewServer(http.HandlerFunc( + func(w http.ResponseWriter, r *http.Request) { + _, _ = w.Write(dataStats) + })) + riak := New() + riak.URL = srv.URL + require.NoError(t, riak.Init()) + + return riak, srv.Close +} + +func caseInvalidDataResponse(t *testing.T) (*RiakKv, func()) { + t.Helper() + srv := httptest.NewServer(http.HandlerFunc( + func(w http.ResponseWriter, r *http.Request) { + _, _ = w.Write([]byte("hello and\n goodbye")) + })) + riak := New() + riak.URL = srv.URL + require.NoError(t, riak.Init()) + + return riak, srv.Close +} + +func caseConnectionRefused(t *testing.T) (*RiakKv, func()) { + t.Helper() + rk := New() + rk.URL = "http://127.0.0.1:65001" + require.NoError(t, rk.Init()) + + return rk, func() {} +} + +func case404(t *testing.T) (*RiakKv, func()) { + t.Helper() + srv := httptest.NewServer(http.HandlerFunc( + func(w http.ResponseWriter, r *http.Request) { + w.WriteHeader(http.StatusNotFound) + })) + riak := New() + riak.URL = srv.URL + require.NoError(t, riak.Init()) + + return riak, srv.Close +} diff --git a/src/go/plugin/go.d/modules/riakkv/stats.go b/src/go/plugin/go.d/modules/riakkv/stats.go new file mode 100644 index 000000000..ed2927583 --- /dev/null +++ b/src/go/plugin/go.d/modules/riakkv/stats.go @@ -0,0 +1,112 @@ +// SPDX-License-Identifier: GPL-3.0-or-later + +package riakkv + +// FIXME: old data (likely wrong) from https://github.com/netdata/netdata/issues/2413#issuecomment-500867044 +type riakStats struct { + NodeGetsTotal *int64 `json:"node_gets_total" stm:"node_gets_total"` + NodePutsTotal *int64 `json:"node_puts_total" stm:"node_puts_total"` + + VnodeCounterUpdateTotal *int64 `json:"vnode_counter_update_total" stm:"vnode_counter_update_total"` + VnodeSetUpdateTotal *int64 `json:"vnode_set_update_total" stm:"vnode_set_update_total"` + VnodeMapUpdateTotal *int64 `json:"vnode_map_update_total" stm:"vnode_map_update_total"` + + SearchQueryThroughputCount *int64 `json:"search_query_throughput_count" stm:"search_query_throughput_count"` + SearchIndexThroughputCount *int64 `json:"search_index_throughput_count" stm:"search_index_throughput_count"` + + ConsistentGetsTotal *int64 `json:"consistent_gets_total" stm:"consistent_gets_total"` + ConsistentPutsTotal *int64 `json:"consistent_puts_total" stm:"consistent_puts_total"` + + NodeGetFsmTimeMean *int64 `json:"node_get_fsm_time_mean" stm:"node_get_fsm_time_mean"` + NodeGetFsmTimeMedian *int64 `json:"node_get_fsm_time_median" stm:"node_get_fsm_time_median"` + NodeGetFsmTime95 *int64 `json:"node_get_fsm_time_95" stm:"node_get_fsm_time_95"` + NodeGetFsmTime99 *int64 `json:"node_get_fsm_time_99" stm:"node_get_fsm_time_99"` + NodeGetFsmTime100 *int64 `json:"node_get_fsm_time_100" stm:"node_get_fsm_time_100"` + + NodePutFsmTimeMean *int64 `json:"node_put_fsm_time_mean" stm:"node_put_fsm_time_mean"` + NodePutFsmTimeMedian *int64 `json:"node_put_fsm_time_median" stm:"node_put_fsm_time_median"` + NodePutFsmTime95 *int64 `json:"node_put_fsm_time_95" stm:"node_put_fsm_time_95"` + NodePutFsmTime99 *int64 `json:"node_put_fsm_time_99" stm:"node_put_fsm_time_99"` + NodePutFsmTime100 *int64 `json:"node_put_fsm_time_100" stm:"node_put_fsm_time_100"` + + ObjectCounterMergeTimeMean *int64 `json:"object_counter_merge_time_mean" stm:"object_counter_merge_time_mean"` + ObjectCounterMergeTimeMedian *int64 `json:"object_counter_merge_time_median" stm:"object_counter_merge_time_median"` + ObjectCounterMergeTime95 *int64 `json:"object_counter_merge_time_95" stm:"object_counter_merge_time_95"` + ObjectCounterMergeTime99 *int64 `json:"object_counter_merge_time_99" stm:"object_counter_merge_time_99"` + ObjectCounterMergeTime100 *int64 `json:"object_counter_merge_time_100" stm:"object_counter_merge_time_100"` + + ObjectSetMergeTimeMean *int64 `json:"object_set_merge_time_mean" stm:"object_set_merge_time_mean"` + ObjectSetMergeTimeMedian *int64 `json:"object_set_merge_time_median" stm:"object_set_merge_time_median"` + ObjectSetMergeTime95 *int64 `json:"object_set_merge_time_95" stm:"object_set_merge_time_95"` + ObjectSetMergeTime99 *int64 `json:"object_set_merge_time_99" stm:"object_set_merge_time_99"` + ObjectSetMergeTime100 *int64 `json:"object_set_merge_time_100" stm:"object_set_merge_time_100"` + + ObjectMapMergeTimeMean *int64 `json:"object_map_merge_time_mean" stm:"object_map_merge_time_mean"` + ObjectMapMergeTimeMedian *int64 `json:"object_map_merge_time_median" stm:"object_map_merge_time_median"` + ObjectMapMergeTime95 *int64 `json:"object_map_merge_time_95" stm:"object_map_merge_time_95"` + ObjectMapMergeTime99 *int64 `json:"object_map_merge_time_99" stm:"object_map_merge_time_99"` + ObjectMapMergeTime100 *int64 `json:"object_map_merge_time_100" stm:"object_map_merge_time_100"` + + SearchQueryLatencyMin *int64 `json:"search_query_latency_min" stm:"search_query_latency_min"` + SearchQueryLatencyMedian *int64 `json:"search_query_latency_median" stm:"search_query_latency_median"` + SearchQueryLatency95 *int64 `json:"search_query_latency_95" stm:"search_query_latency_95"` + SearchQueryLatency99 *int64 `json:"search_query_latency_99" stm:"search_query_latency_99"` + SearchQueryLatency999 *int64 `json:"search_query_latency_999" stm:"search_query_latency_999"` + SearchQueryLatencyMax *int64 `json:"search_query_latency_max" stm:"search_query_latency_max"` + + SearchIndexLatencyMin *int64 `json:"search_index_latency_min" stm:"search_index_latency_min"` + SearchIndexLatencyMedian *int64 `json:"search_index_latency_median" stm:"search_index_latency_median"` + SearchIndexLatency95 *int64 `json:"search_index_latency_95" stm:"search_index_latency_95"` + SearchIndexLatency99 *int64 `json:"search_index_latency_99" stm:"search_index_latency_99"` + SearchIndexLatency999 *int64 `json:"search_index_latency_999" stm:"search_index_latency_999"` + SearchIndexLatencyMax *int64 `json:"search_index_latency_max" stm:"search_index_latency_max"` + + ConsistentGetTimeMean *int64 `json:"consistent_get_time_mean" stm:"consistent_get_time_mean"` + ConsistentGetTimeMedian *int64 `json:"consistent_get_time_median" stm:"consistent_get_time_median"` + ConsistentGetTime95 *int64 `json:"consistent_get_time_95" stm:"consistent_get_time_95"` + ConsistentGetTime99 *int64 `json:"consistent_get_time_99" stm:"consistent_get_time_99"` + ConsistentGetTime100 *int64 `json:"consistent_get_time_100" stm:"consistent_get_time_100"` + + ConsistentPutTimeMean *int64 `json:"consistent_put_time_mean" stm:"consistent_put_time_mean"` + ConsistentPutTimeMedian *int64 `json:"consistent_put_time_median" stm:"consistent_put_time_median"` + ConsistentPutTime95 *int64 `json:"consistent_put_time_95" stm:"consistent_put_time_95"` + ConsistentPutTime99 *int64 `json:"consistent_put_time_99" stm:"consistent_put_time_99"` + ConsistentPutTime100 *int64 `json:"consistent_put_time_100" stm:"consistent_put_time_100"` + + SysProcesses *int64 `json:"sys_processes" stm:"sys_processes"` + MemoryProcesses *int64 `json:"memory_processes" stm:"memory_processes"` + MemoryProcessesUsed *int64 `json:"memory_processes_used" stm:"memory_processes_used"` + + NodeGetFsmSiblingsMean *int64 `json:"node_get_fsm_siblings_mean" stm:"node_get_fsm_siblings_mean"` + NodeGetFsmSiblingsMedian *int64 `json:"node_get_fsm_siblings_median" stm:"node_get_fsm_siblings_median"` + NodeGetFsmSiblings99 *int64 `json:"node_get_fsm_siblings_99" stm:"node_get_fsm_siblings_99"` + NodeGetFsmSiblings95 *int64 `json:"node_get_fsm_siblings_95" stm:"node_get_fsm_siblings_95"` + NodeGetFsmSiblings100 *int64 `json:"node_get_fsm_siblings_100" stm:"node_get_fsm_siblings_100"` + + NodeGetFsmObjsizeMean *int64 `json:"node_get_fsm_objsize_mean" stm:"node_get_fsm_objsize_mean"` + NodeGetFsmObjsizeMedian *int64 `json:"node_get_fsm_objsize_median" stm:"node_get_fsm_objsize_median"` + NodeGetFsmObjsize95 *int64 `json:"node_get_fsm_objsize_95" stm:"node_get_fsm_objsize_95"` + NodeGetFsmObjsize99 *int64 `json:"node_get_fsm_objsize_99" stm:"node_get_fsm_objsize_99"` + NodeGetFsmObjsize100 *int64 `json:"node_get_fsm_objsize_100" stm:"node_get_fsm_objsize_100"` + + RiakSearchVnodeqMean *int64 `json:"riak_search_vnodeq_mean" stm:"riak_search_vnodeq_mean"` + RiakSearchVnodeqMedian *int64 `json:"riak_search_vnodeq_median" stm:"riak_search_vnodeq_median"` + RiakSearchVnodeq95 *int64 `json:"riak_search_vnodeq_95" stm:"riak_search_vnodeq_95"` + RiakSearchVnodeq99 *int64 `json:"riak_search_vnodeq_99" stm:"riak_search_vnodeq_99"` + RiakSearchVnodeq100 *int64 `json:"riak_search_vnodeq_100" stm:"riak_search_vnodeq_100"` + + SearchIndexFailCount *int64 `json:"search_index_fail_count" stm:"search_index_fail_count"` + PbcActive *int64 `json:"pbc_active" stm:"pbc_active"` + ReadRepairs *int64 `json:"read_repairs" stm:"read_repairs"` + + NodeGetFsmActive *int64 `json:"node_get_fsm_active" stm:"node_get_fsm_active"` + NodePutFsmActive *int64 `json:"node_put_fsm_active" stm:"node_put_fsm_active"` + IndexFsmActive *int64 `json:"index_fsm_active" stm:"index_fsm_active"` + ListFsmActive *int64 `json:"list_fsm_active" stm:"list_fsm_active"` + + NodeGetFsmRejected *int64 `json:"node_get_fsm_rejected" stm:"node_get_fsm_rejected"` + NodePutFsmRejected *int64 `json:"node_put_fsm_rejected" stm:"node_put_fsm_rejected"` + + SearchIndexBadEntryCount *int64 `json:"search_index_bad_entry_count" stm:"search_index_bad_entry_count"` + SearchIndexExtractFailCount *int64 `json:"search_index_extract_fail_count" stm:"search_index_extract_fail_count"` +} diff --git a/src/go/collectors/go.d.plugin/modules/traefik/testdata/config.json b/src/go/plugin/go.d/modules/riakkv/testdata/config.json index 984c3ed6e..984c3ed6e 100644 --- a/src/go/collectors/go.d.plugin/modules/traefik/testdata/config.json +++ b/src/go/plugin/go.d/modules/riakkv/testdata/config.json diff --git a/src/go/collectors/go.d.plugin/modules/traefik/testdata/config.yaml b/src/go/plugin/go.d/modules/riakkv/testdata/config.yaml index 8558b61cc..8558b61cc 100644 --- a/src/go/collectors/go.d.plugin/modules/traefik/testdata/config.yaml +++ b/src/go/plugin/go.d/modules/riakkv/testdata/config.yaml diff --git a/src/go/plugin/go.d/modules/riakkv/testdata/stats.json b/src/go/plugin/go.d/modules/riakkv/testdata/stats.json new file mode 100644 index 000000000..8dd836f20 --- /dev/null +++ b/src/go/plugin/go.d/modules/riakkv/testdata/stats.json @@ -0,0 +1,478 @@ +{ + "connected_nodes": [], + "consistent_get_objsize_100": 1, + "consistent_get_objsize_95": 1, + "consistent_get_objsize_99": 1, + "consistent_get_objsize_mean": 1, + "consistent_get_objsize_median": 1, + "consistent_get_time_100": 1, + "consistent_get_time_95": 1, + "consistent_get_time_99": 1, + "consistent_get_time_mean": 1, + "consistent_get_time_median": 1, + "consistent_gets": 1, + "consistent_gets_total": 1, + "consistent_put_objsize_100": 1, + "consistent_put_objsize_95": 1, + "consistent_put_objsize_99": 1, + "consistent_put_objsize_mean": 1, + "consistent_put_objsize_median": 1, + "consistent_put_time_100": 1, + "consistent_put_time_95": 1, + "consistent_put_time_99": 1, + "consistent_put_time_mean": 1, + "consistent_put_time_median": 1, + "consistent_puts": 1, + "consistent_puts_total": 1, + "converge_delay_last": 1, + "converge_delay_max": 1, + "converge_delay_mean": 1, + "converge_delay_min": 1, + "coord_redirs_total": 1, + "counter_actor_counts_100": 1, + "counter_actor_counts_95": 1, + "counter_actor_counts_99": 1, + "counter_actor_counts_mean": 1, + "counter_actor_counts_median": 1, + "cpu_avg1": 2276, + "cpu_avg15": 661, + "cpu_avg5": 1267, + "cpu_nprocs": 1443, + "dropped_vnode_requests_total": 1, + "executing_mappers": 1, + "gossip_received": 1, + "handoff_timeouts": 1, + "hll_bytes": 1, + "hll_bytes_100": 1, + "hll_bytes_95": 1, + "hll_bytes_99": 1, + "hll_bytes_mean": 1, + "hll_bytes_median": 1, + "hll_bytes_total": 1, + "ignored_gossip_total": 1, + "index_fsm_active": 1, + "index_fsm_create": 1, + "index_fsm_create_error": 1, + "late_put_fsm_coordinator_ack": 1, + "leveldb_read_block_error": "undefined", + "list_fsm_active": 1, + "list_fsm_create": 1, + "list_fsm_create_error": 1, + "list_fsm_create_error_total": 1, + "list_fsm_create_total": 1, + "map_actor_counts_100": 1, + "map_actor_counts_95": 1, + "map_actor_counts_99": 1, + "map_actor_counts_mean": 1, + "map_actor_counts_median": 1, + "mem_allocated": 14529916928, + "mem_total": 16728453121, + "memory_atom": 695185, + "memory_atom_used": 670675, + "memory_binary": 15413608, + "memory_code": 15375111, + "memory_ets": 7728584, + "memory_processes": 274468041, + "memory_processes_used": 274337336, + "memory_system": 126058328, + "memory_total": 400526368, + "node_get_fsm_active": 1, + "node_get_fsm_active_60s": 20079, + "node_get_fsm_counter_objsize_100": 1, + "node_get_fsm_counter_objsize_95": 1, + "node_get_fsm_counter_objsize_99": 1, + "node_get_fsm_counter_objsize_mean": 1, + "node_get_fsm_counter_objsize_median": 1, + "node_get_fsm_counter_siblings_100": 1, + "node_get_fsm_counter_siblings_95": 1, + "node_get_fsm_counter_siblings_99": 1, + "node_get_fsm_counter_siblings_mean": 1, + "node_get_fsm_counter_siblings_median": 1, + "node_get_fsm_counter_time_100": 1, + "node_get_fsm_counter_time_95": 1, + "node_get_fsm_counter_time_99": 1, + "node_get_fsm_counter_time_mean": 1, + "node_get_fsm_counter_time_median": 1, + "node_get_fsm_errors": 1, + "node_get_fsm_errors_total": 1, + "node_get_fsm_hll_objsize_100": 1, + "node_get_fsm_hll_objsize_95": 1, + "node_get_fsm_hll_objsize_99": 1, + "node_get_fsm_hll_objsize_mean": 1, + "node_get_fsm_hll_objsize_median": 1, + "node_get_fsm_hll_siblings_100": 1, + "node_get_fsm_hll_siblings_95": 1, + "node_get_fsm_hll_siblings_99": 1, + "node_get_fsm_hll_siblings_mean": 1, + "node_get_fsm_hll_siblings_median": 1, + "node_get_fsm_hll_time_100": 1, + "node_get_fsm_hll_time_95": 1, + "node_get_fsm_hll_time_99": 1, + "node_get_fsm_hll_time_mean": 1, + "node_get_fsm_hll_time_median": 1, + "node_get_fsm_in_rate": 181, + "node_get_fsm_map_objsize_100": 1, + "node_get_fsm_map_objsize_95": 1, + "node_get_fsm_map_objsize_99": 1, + "node_get_fsm_map_objsize_mean": 1, + "node_get_fsm_map_objsize_median": 1, + "node_get_fsm_map_siblings_100": 1, + "node_get_fsm_map_siblings_95": 1, + "node_get_fsm_map_siblings_99": 1, + "node_get_fsm_map_siblings_mean": 1, + "node_get_fsm_map_siblings_median": 1, + "node_get_fsm_map_time_100": 1, + "node_get_fsm_map_time_95": 1, + "node_get_fsm_map_time_99": 1, + "node_get_fsm_map_time_mean": 1, + "node_get_fsm_map_time_median": 1, + "node_get_fsm_objsize_100": 1037, + "node_get_fsm_objsize_95": 1, + "node_get_fsm_objsize_99": 1025, + "node_get_fsm_objsize_mean": 791, + "node_get_fsm_objsize_median": 669, + "node_get_fsm_out_rate": 191, + "node_get_fsm_rejected": 1, + "node_get_fsm_rejected_60s": 1, + "node_get_fsm_rejected_total": 1, + "node_get_fsm_set_objsize_100": 1, + "node_get_fsm_set_objsize_95": 1, + "node_get_fsm_set_objsize_99": 1, + "node_get_fsm_set_objsize_mean": 1, + "node_get_fsm_set_objsize_median": 1, + "node_get_fsm_set_siblings_100": 1, + "node_get_fsm_set_siblings_95": 1, + "node_get_fsm_set_siblings_99": 1, + "node_get_fsm_set_siblings_mean": 1, + "node_get_fsm_set_siblings_median": 1, + "node_get_fsm_set_time_100": 1, + "node_get_fsm_set_time_95": 1, + "node_get_fsm_set_time_99": 1, + "node_get_fsm_set_time_mean": 1, + "node_get_fsm_set_time_median": 1, + "node_get_fsm_siblings_100": 1, + "node_get_fsm_siblings_95": 1, + "node_get_fsm_siblings_99": 1, + "node_get_fsm_siblings_mean": 1, + "node_get_fsm_siblings_median": 1, + "node_get_fsm_time_100": 678351, + "node_get_fsm_time_95": 1, + "node_get_fsm_time_99": 10148, + "node_get_fsm_time_mean": 2161, + "node_get_fsm_time_median": 1022, + "node_gets": 19875, + "node_gets_counter": 1, + "node_gets_counter_total": 1, + "node_gets_hll": 1, + "node_gets_hll_total": 1, + "node_gets_map": 1, + "node_gets_map_total": 1, + "node_gets_set": 1, + "node_gets_set_total": 1, + "node_gets_total": 422626, + "node_put_fsm_active": 1, + "node_put_fsm_active_60s": 10498, + "node_put_fsm_counter_time_100": 1, + "node_put_fsm_counter_time_95": 1, + "node_put_fsm_counter_time_99": 1, + "node_put_fsm_counter_time_mean": 1, + "node_put_fsm_counter_time_median": 1, + "node_put_fsm_hll_time_100": 1, + "node_put_fsm_hll_time_95": 1, + "node_put_fsm_hll_time_99": 1, + "node_put_fsm_hll_time_mean": 1, + "node_put_fsm_hll_time_median": 1, + "node_put_fsm_in_rate": 116, + "node_put_fsm_map_time_100": 1, + "node_put_fsm_map_time_95": 1, + "node_put_fsm_map_time_99": 1, + "node_put_fsm_map_time_mean": 1, + "node_put_fsm_map_time_median": 1, + "node_put_fsm_out_rate": 127, + "node_put_fsm_rejected": 1, + "node_put_fsm_rejected_60s": 1, + "node_put_fsm_rejected_total": 1, + "node_put_fsm_set_time_100": 1, + "node_put_fsm_set_time_95": 1, + "node_put_fsm_set_time_99": 1, + "node_put_fsm_set_time_mean": 1, + "node_put_fsm_set_time_median": 1, + "node_put_fsm_time_100": 1049568, + "node_put_fsm_time_95": 19609, + "node_put_fsm_time_99": 37735, + "node_put_fsm_time_mean": 11828, + "node_put_fsm_time_median": 5017, + "node_puts": 10283, + "node_puts_counter": 1, + "node_puts_counter_total": 1, + "node_puts_hll": 1, + "node_puts_hll_total": 1, + "node_puts_map": 1, + "node_puts_map_total": 1, + "node_puts_set": 1, + "node_puts_set_total": 1, + "node_puts_total": 490965, + "nodename": "riak@127.0.0.1", + "object_counter_merge": 1, + "object_counter_merge_time_100": 1, + "object_counter_merge_time_95": 1, + "object_counter_merge_time_99": 1, + "object_counter_merge_time_mean": 1, + "object_counter_merge_time_median": 1, + "object_counter_merge_total": 1, + "object_hll_merge": 1, + "object_hll_merge_time_100": 1, + "object_hll_merge_time_95": 1, + "object_hll_merge_time_99": 1, + "object_hll_merge_time_mean": 1, + "object_hll_merge_time_median": 1, + "object_hll_merge_total": 1, + "object_map_merge": 1, + "object_map_merge_time_100": 1, + "object_map_merge_time_95": 1, + "object_map_merge_time_99": 1, + "object_map_merge_time_mean": 1, + "object_map_merge_time_median": 1, + "object_map_merge_total": 1, + "object_merge": 1, + "object_merge_time_100": 1, + "object_merge_time_95": 1, + "object_merge_time_99": 1, + "object_merge_time_mean": 1, + "object_merge_time_median": 1, + "object_merge_total": 7167, + "object_set_merge": 1, + "object_set_merge_time_100": 1, + "object_set_merge_time_95": 1, + "object_set_merge_time_99": 1, + "object_set_merge_time_mean": 1, + "object_set_merge_time_median": 1, + "object_set_merge_total": 1, + "pbc_active": 46, + "pbc_connects": 1, + "pbc_connects_total": 48, + "pipeline_active": 1, + "pipeline_create_count": 1, + "pipeline_create_error_count": 1, + "pipeline_create_error_one": 1, + "pipeline_create_one": 1, + "postcommit_fail": 1, + "precommit_fail": 1, + "read_repairs": 1, + "read_repairs_counter": 1, + "read_repairs_counter_total": 1, + "read_repairs_fallback_notfound_count": "undefined", + "read_repairs_fallback_notfound_one": "undefined", + "read_repairs_fallback_outofdate_count": "undefined", + "read_repairs_fallback_outofdate_one": "undefined", + "read_repairs_hll": 1, + "read_repairs_hll_total": 1, + "read_repairs_map": 1, + "read_repairs_map_total": 1, + "read_repairs_primary_notfound_count": 186, + "read_repairs_primary_notfound_one": 1, + "read_repairs_primary_outofdate_count": 24, + "read_repairs_primary_outofdate_one": 1, + "read_repairs_set": 1, + "read_repairs_set_total": 1, + "read_repairs_total": 105, + "rebalance_delay_last": 1, + "rebalance_delay_max": 1, + "rebalance_delay_mean": 1, + "rebalance_delay_min": 1, + "rejected_handoffs": 1, + "riak_kv_vnodeq_max": 3, + "riak_kv_vnodeq_mean": 0.078125, + "riak_kv_vnodeq_median": 1, + "riak_kv_vnodeq_min": 1, + "riak_kv_vnodeq_total": 5, + "riak_kv_vnodes_running": 64, + "riak_pipe_vnodeq_max": 1, + "riak_pipe_vnodeq_mean": 1, + "riak_pipe_vnodeq_median": 1, + "riak_pipe_vnodeq_min": 1, + "riak_pipe_vnodeq_total": 1, + "riak_pipe_vnodes_running": 64, + "ring_creation_size": 64, + "ring_members": [ + "riak@127.0.0.1" + ], + "ring_num_partitions": 64, + "ring_ownership": "[{'riak@127.0.0.1',64}]", + "rings_reconciled": 1, + "rings_reconciled_total": 1, + "set_actor_counts_100": 1, + "set_actor_counts_95": 1, + "set_actor_counts_99": 1, + "set_actor_counts_mean": 1, + "set_actor_counts_median": 1, + "skipped_read_repairs": 1, + "skipped_read_repairs_total": 1, + "storage_backend": "riak_kv_bitcask_backend", + "sys_driver_version": "2.2", + "sys_global_heaps_size": "deprecated", + "sys_heap_type": "private", + "sys_logical_processors": 4, + "sys_monitor_count": 966, + "sys_otp_release": "R16B02_basho10", + "sys_port_count": 336, + "sys_process_count": 2169, + "sys_smp_support": true, + "sys_system_architecture": "x86_64-unknown-linux-gnu", + "sys_system_version": "Erlang R16B02_basho10 (erts-5.10.3) [source] [64-bit] [smp:4:4] [async-threads:64] [hipe] [kernel-poll:true] [frame-pointer]", + "sys_thread_pool_size": 64, + "sys_threads_enabled": true, + "sys_wordsize": 8, + "vnode_counter_update": 1, + "vnode_counter_update_time_100": 1, + "vnode_counter_update_time_95": 1, + "vnode_counter_update_time_99": 1, + "vnode_counter_update_time_mean": 1, + "vnode_counter_update_time_median": 1, + "vnode_counter_update_total": 1, + "vnode_get_fsm_time_100": 836988, + "vnode_get_fsm_time_95": 3415, + "vnode_get_fsm_time_99": 7394, + "vnode_get_fsm_time_mean": 1159, + "vnode_get_fsm_time_median": 461, + "vnode_gets": 59641, + "vnode_gets_total": 1267893, + "vnode_hll_update": 1, + "vnode_hll_update_time_100": 1, + "vnode_hll_update_time_95": 1, + "vnode_hll_update_time_99": 1, + "vnode_hll_update_time_mean": 1, + "vnode_hll_update_time_median": 1, + "vnode_hll_update_total": 1, + "vnode_index_deletes": 1, + "vnode_index_deletes_postings": 1, + "vnode_index_deletes_postings_total": 1, + "vnode_index_deletes_total": 1, + "vnode_index_reads": 1, + "vnode_index_reads_total": 1, + "vnode_index_refreshes": 1, + "vnode_index_refreshes_total": 1, + "vnode_index_writes": 1, + "vnode_index_writes_postings": 1, + "vnode_index_writes_postings_total": 1, + "vnode_index_writes_total": 1, + "vnode_map_update": 1, + "vnode_map_update_time_100": 1, + "vnode_map_update_time_95": 1, + "vnode_map_update_time_99": 1, + "vnode_map_update_time_mean": 1, + "vnode_map_update_time_median": 1, + "vnode_map_update_total": 1, + "vnode_put_fsm_time_100": 1034955, + "vnode_put_fsm_time_95": 10302, + "vnode_put_fsm_time_99": 16813, + "vnode_put_fsm_time_mean": 4511, + "vnode_put_fsm_time_median": 1927, + "vnode_puts": 30852, + "vnode_puts_total": 1473108, + "vnode_set_update": 1, + "vnode_set_update_time_100": 1, + "vnode_set_update_time_95": 1, + "vnode_set_update_time_99": 1, + "vnode_set_update_time_mean": 1, + "vnode_set_update_time_median": 1, + "vnode_set_update_total": 1, + "write_once_merge": 1, + "write_once_put_objsize_100": 1, + "write_once_put_objsize_95": 1, + "write_once_put_objsize_99": 1, + "write_once_put_objsize_mean": 1, + "write_once_put_objsize_median": 1, + "write_once_put_time_100": 1, + "write_once_put_time_95": 1, + "write_once_put_time_99": 1, + "write_once_put_time_mean": 1, + "write_once_put_time_median": 1, + "write_once_puts": 1, + "write_once_puts_total": 1, + "disk": [ + { + "id": "/", + "size": 488386584, + "used": 11 + }, + { + "id": "/dev", + "size": 65536, + "used": 0 + }, + { + "id": "/sys/fs/cgroup", + "size": 8168188, + "used": 0 + }, + { + "id": "/etc/hosts", + "size": 488386584, + "used": 11 + }, + { + "id": "/dev/shm", + "size": 65536, + "used": 0 + }, + { + "id": "/proc/asound", + "size": 8168188, + "used": 0 + }, + { + "id": "/proc/acpi", + "size": 8168188, + "used": 0 + }, + { + "id": "/sys/firmware", + "size": 8168188, + "used": 0 + } + ], + "riak_auth_mods_version": "2.1.0-0-g31b8b30", + "erlydtl_version": "0.7.0", + "riak_control_version": "2.1.6-0-gcbf605a", + "cluster_info_version": "2.0.5-0-gd61d055", + "yokozuna_version": "2.1.10-0-gb53d999", + "fuse_version": "2.1.0", + "ibrowse_version": "4.0.2", + "riak_search_version": "2.1.6-0-g0d398f2", + "merge_index_version": "2.0.4-0-gc5efac6", + "riak_kv_version": "2.1.7-0-gbd8e312", + "riak_api_version": "2.1.6-0-ga678e25", + "riak_pb_version": "2.2.0.0-0-gf5af9ff", + "protobuffs_version": "0.9.0-0-g0dde9d3", + "riak_dt_version": "2.1.3-0-g9450044", + "sidejob_version": "2.0.1-0-g8ac6803", + "riak_pipe_version": "2.1.5-0-g8b2c842", + "riak_core_version": "2.1.9-0-gb8a11b4", + "exometer_core_version": "1.0.0-basho9-0-gfcc8662", + "poolboy_version": "0.8.1p3-0-g8bb45fb", + "pbkdf2_version": "2.0.0-0-g7076584", + "eleveldb_version": "2.0.34-0-g55abc57", + "clique_version": "0.3.9-0-ge7114e9", + "bitcask_version": "2.0.3", + "basho_stats_version": "1.0.3", + "webmachine_version": "1.10.8-basho1-0-g494d14f", + "mochiweb_version": "2.9.0", + "inets_version": "5.9.6", + "xmerl_version": "1.3.4", + "erlang_js_version": "1.3.0-0-g07467d8", + "runtime_tools_version": "1.8.12", + "os_mon_version": "2.2.13", + "riak_sysmon_version": "2.1.5-0-g0ab94b3", + "ssl_version": "5.3.1", + "public_key_version": "0.20", + "crypto_version": "3.1", + "asn1_version": "2.0.3", + "sasl_version": "2.3.3", + "lager_version": "3.2.2", + "goldrush_version": "0.1.9", + "compiler_version": "4.9.3", + "syntax_tools_version": "1.6.11", + "stdlib_version": "1.19.3", + "kernel_version": "2.16.3" +} diff --git a/src/go/collectors/go.d.plugin/modules/rspamd/README.md b/src/go/plugin/go.d/modules/rspamd/README.md index b18fa0599..b18fa0599 120000 --- a/src/go/collectors/go.d.plugin/modules/rspamd/README.md +++ b/src/go/plugin/go.d/modules/rspamd/README.md diff --git a/src/go/collectors/go.d.plugin/modules/rspamd/charts.go b/src/go/plugin/go.d/modules/rspamd/charts.go index fcf21fb41..3d28ab21d 100644 --- a/src/go/collectors/go.d.plugin/modules/rspamd/charts.go +++ b/src/go/plugin/go.d/modules/rspamd/charts.go @@ -2,7 +2,7 @@ package rspamd -import "github.com/netdata/netdata/go/go.d.plugin/agent/module" +import "github.com/netdata/netdata/go/plugins/plugin/go.d/agent/module" const ( prioClassifications = module.Priority + iota diff --git a/src/go/collectors/go.d.plugin/modules/rspamd/collect.go b/src/go/plugin/go.d/modules/rspamd/collect.go index bb7f5710d..ecbe4a034 100644 --- a/src/go/collectors/go.d.plugin/modules/rspamd/collect.go +++ b/src/go/plugin/go.d/modules/rspamd/collect.go @@ -8,8 +8,8 @@ import ( "io" "net/http" - "github.com/netdata/netdata/go/go.d.plugin/pkg/stm" - "github.com/netdata/netdata/go/go.d.plugin/pkg/web" + "github.com/netdata/netdata/go/plugins/plugin/go.d/pkg/stm" + "github.com/netdata/netdata/go/plugins/plugin/go.d/pkg/web" ) type rspamdStats struct { @@ -50,13 +50,11 @@ func (r *Rspamd) collect() (map[string]int64, error) { } func (r *Rspamd) queryRspamdStats() (*rspamdStats, error) { - req, err := web.NewHTTPRequest(r.Request) + req, err := web.NewHTTPRequestWithPath(r.Request, "/stat") if err != nil { return nil, err } - req.URL.Path = "/stat" - var stats rspamdStats if err := r.doOKDecode(req, &stats); err != nil { return nil, err diff --git a/src/go/collectors/go.d.plugin/modules/rspamd/config_schema.json b/src/go/plugin/go.d/modules/rspamd/config_schema.json index 8ed494753..c7b866d87 100644 --- a/src/go/collectors/go.d.plugin/modules/rspamd/config_schema.json +++ b/src/go/plugin/go.d/modules/rspamd/config_schema.json @@ -123,6 +123,12 @@ "timeout": { "ui:help": "Accepts decimals for precise control (e.g., type 1.5 for 1.5 seconds)." }, + "username": { + "ui:widget": "password" + }, + "proxy_username": { + "ui:widget": "password" + }, "password": { "ui:widget": "password" }, diff --git a/src/go/collectors/go.d.plugin/modules/rspamd/integrations/rspamd.md b/src/go/plugin/go.d/modules/rspamd/integrations/rspamd.md index e72c12dd2..fe0949422 100644 --- a/src/go/collectors/go.d.plugin/modules/rspamd/integrations/rspamd.md +++ b/src/go/plugin/go.d/modules/rspamd/integrations/rspamd.md @@ -1,6 +1,6 @@ <!--startmeta -custom_edit_url: "https://github.com/netdata/netdata/edit/master/src/go/collectors/go.d.plugin/modules/rspamd/README.md" -meta_yaml: "https://github.com/netdata/netdata/edit/master/src/go/collectors/go.d.plugin/modules/rspamd/metadata.yaml" +custom_edit_url: "https://github.com/netdata/netdata/edit/master/src/go/plugin/go.d/modules/rspamd/README.md" +meta_yaml: "https://github.com/netdata/netdata/edit/master/src/go/plugin/go.d/modules/rspamd/metadata.yaml" sidebar_label: "Rspamd" learn_status: "Published" learn_rel_path: "Collecting Metrics/Security Systems" @@ -183,6 +183,8 @@ jobs: ### Debug Mode +**Important**: Debug mode is not supported for data collection jobs created via the UI using the Dyncfg feature. + To troubleshoot issues with the `rspamd` collector, run the `go.d.plugin` with the debug option enabled. The output should give you clues as to why the collector isn't working. @@ -205,4 +207,37 @@ should give you clues as to why the collector isn't working. ./go.d.plugin -d -m rspamd ``` +### Getting Logs + +If you're encountering problems with the `rspamd` collector, follow these steps to retrieve logs and identify potential issues: + +- **Run the command** specific to your system (systemd, non-systemd, or Docker container). +- **Examine the output** for any warnings or error messages that might indicate issues. These messages should provide clues about the root cause of the problem. + +#### System with systemd + +Use the following command to view logs generated since the last Netdata service restart: + +```bash +journalctl _SYSTEMD_INVOCATION_ID="$(systemctl show --value --property=InvocationID netdata)" --namespace=netdata --grep rspamd +``` + +#### System without systemd + +Locate the collector log file, typically at `/var/log/netdata/collector.log`, and use `grep` to filter for collector's name: + +```bash +grep rspamd /var/log/netdata/collector.log +``` + +**Note**: This method shows logs from all restarts. Focus on the **latest entries** for troubleshooting current issues. + +#### Docker Container + +If your Netdata runs in a Docker container named "netdata" (replace if different), use this command: + +```bash +docker logs netdata 2>&1 | grep rspamd +``` + diff --git a/src/go/collectors/go.d.plugin/modules/rspamd/metadata.yaml b/src/go/plugin/go.d/modules/rspamd/metadata.yaml index a8ab16b49..a8ab16b49 100644 --- a/src/go/collectors/go.d.plugin/modules/rspamd/metadata.yaml +++ b/src/go/plugin/go.d/modules/rspamd/metadata.yaml diff --git a/src/go/collectors/go.d.plugin/modules/rspamd/rspamd.go b/src/go/plugin/go.d/modules/rspamd/rspamd.go index 6972c9e91..0a5c4ffe5 100644 --- a/src/go/collectors/go.d.plugin/modules/rspamd/rspamd.go +++ b/src/go/plugin/go.d/modules/rspamd/rspamd.go @@ -8,8 +8,8 @@ import ( "net/http" "time" - "github.com/netdata/netdata/go/go.d.plugin/agent/module" - "github.com/netdata/netdata/go/go.d.plugin/pkg/web" + "github.com/netdata/netdata/go/plugins/plugin/go.d/agent/module" + "github.com/netdata/netdata/go/plugins/plugin/go.d/pkg/web" ) //go:embed "config_schema.json" diff --git a/src/go/collectors/go.d.plugin/modules/rspamd/rspamd_test.go b/src/go/plugin/go.d/modules/rspamd/rspamd_test.go index c5db42cec..0c8cc8e5b 100644 --- a/src/go/collectors/go.d.plugin/modules/rspamd/rspamd_test.go +++ b/src/go/plugin/go.d/modules/rspamd/rspamd_test.go @@ -8,8 +8,8 @@ import ( "os" "testing" - "github.com/netdata/netdata/go/go.d.plugin/agent/module" - "github.com/netdata/netdata/go/go.d.plugin/pkg/web" + "github.com/netdata/netdata/go/plugins/plugin/go.d/agent/module" + "github.com/netdata/netdata/go/plugins/plugin/go.d/pkg/web" "github.com/stretchr/testify/assert" "github.com/stretchr/testify/require" diff --git a/src/go/collectors/go.d.plugin/modules/vcsa/testdata/config.json b/src/go/plugin/go.d/modules/rspamd/testdata/config.json index 984c3ed6e..984c3ed6e 100644 --- a/src/go/collectors/go.d.plugin/modules/vcsa/testdata/config.json +++ b/src/go/plugin/go.d/modules/rspamd/testdata/config.json diff --git a/src/go/collectors/go.d.plugin/modules/vcsa/testdata/config.yaml b/src/go/plugin/go.d/modules/rspamd/testdata/config.yaml index 8558b61cc..8558b61cc 100644 --- a/src/go/collectors/go.d.plugin/modules/vcsa/testdata/config.yaml +++ b/src/go/plugin/go.d/modules/rspamd/testdata/config.yaml diff --git a/src/go/collectors/go.d.plugin/modules/rspamd/testdata/v3.4-stat.json b/src/go/plugin/go.d/modules/rspamd/testdata/v3.4-stat.json index 38145477e..38145477e 100644 --- a/src/go/collectors/go.d.plugin/modules/rspamd/testdata/v3.4-stat.json +++ b/src/go/plugin/go.d/modules/rspamd/testdata/v3.4-stat.json diff --git a/src/go/collectors/go.d.plugin/modules/scaleio/README.md b/src/go/plugin/go.d/modules/scaleio/README.md index 1836d2805..1836d2805 120000 --- a/src/go/collectors/go.d.plugin/modules/scaleio/README.md +++ b/src/go/plugin/go.d/modules/scaleio/README.md diff --git a/src/go/collectors/go.d.plugin/modules/scaleio/charts.go b/src/go/plugin/go.d/modules/scaleio/charts.go index a6ac24bd9..9efd52c77 100644 --- a/src/go/collectors/go.d.plugin/modules/scaleio/charts.go +++ b/src/go/plugin/go.d/modules/scaleio/charts.go @@ -5,9 +5,9 @@ package scaleio import ( "fmt" - "github.com/netdata/netdata/go/go.d.plugin/modules/scaleio/client" + "github.com/netdata/netdata/go/plugins/plugin/go.d/modules/scaleio/client" - "github.com/netdata/netdata/go/go.d.plugin/agent/module" + "github.com/netdata/netdata/go/plugins/plugin/go.d/agent/module" ) type ( diff --git a/src/go/collectors/go.d.plugin/modules/scaleio/client/client.go b/src/go/plugin/go.d/modules/scaleio/client/client.go index e60dfbf68..698b2d174 100644 --- a/src/go/collectors/go.d.plugin/modules/scaleio/client/client.go +++ b/src/go/plugin/go.d/modules/scaleio/client/client.go @@ -13,7 +13,7 @@ import ( "strings" "sync" - "github.com/netdata/netdata/go/go.d.plugin/pkg/web" + "github.com/netdata/netdata/go/plugins/plugin/go.d/pkg/web" ) /* diff --git a/src/go/collectors/go.d.plugin/modules/scaleio/client/client_test.go b/src/go/plugin/go.d/modules/scaleio/client/client_test.go index ea82814c2..02e1988b0 100644 --- a/src/go/collectors/go.d.plugin/modules/scaleio/client/client_test.go +++ b/src/go/plugin/go.d/modules/scaleio/client/client_test.go @@ -6,7 +6,7 @@ import ( "net/http/httptest" "testing" - "github.com/netdata/netdata/go/go.d.plugin/pkg/web" + "github.com/netdata/netdata/go/plugins/plugin/go.d/pkg/web" "github.com/stretchr/testify/assert" "github.com/stretchr/testify/require" diff --git a/src/go/collectors/go.d.plugin/modules/scaleio/client/server.go b/src/go/plugin/go.d/modules/scaleio/client/server.go index b7269d339..b7269d339 100644 --- a/src/go/collectors/go.d.plugin/modules/scaleio/client/server.go +++ b/src/go/plugin/go.d/modules/scaleio/client/server.go diff --git a/src/go/collectors/go.d.plugin/modules/scaleio/client/types.go b/src/go/plugin/go.d/modules/scaleio/client/types.go index c85bddf8d..c85bddf8d 100644 --- a/src/go/collectors/go.d.plugin/modules/scaleio/client/types.go +++ b/src/go/plugin/go.d/modules/scaleio/client/types.go diff --git a/src/go/collectors/go.d.plugin/modules/scaleio/collect.go b/src/go/plugin/go.d/modules/scaleio/collect.go index 93a0a609d..a7782a7d9 100644 --- a/src/go/collectors/go.d.plugin/modules/scaleio/collect.go +++ b/src/go/plugin/go.d/modules/scaleio/collect.go @@ -5,8 +5,8 @@ package scaleio import ( "time" - "github.com/netdata/netdata/go/go.d.plugin/modules/scaleio/client" - "github.com/netdata/netdata/go/go.d.plugin/pkg/stm" + "github.com/netdata/netdata/go/plugins/plugin/go.d/modules/scaleio/client" + "github.com/netdata/netdata/go/plugins/plugin/go.d/pkg/stm" ) const discoveryEvery = 5 diff --git a/src/go/collectors/go.d.plugin/modules/scaleio/collect_sdc.go b/src/go/plugin/go.d/modules/scaleio/collect_sdc.go index e840b781d..f62626707 100644 --- a/src/go/collectors/go.d.plugin/modules/scaleio/collect_sdc.go +++ b/src/go/plugin/go.d/modules/scaleio/collect_sdc.go @@ -2,7 +2,7 @@ package scaleio -import "github.com/netdata/netdata/go/go.d.plugin/modules/scaleio/client" +import "github.com/netdata/netdata/go/plugins/plugin/go.d/modules/scaleio/client" func (s *ScaleIO) collectSdc(ss map[string]client.SdcStatistics) map[string]sdcMetrics { ms := make(map[string]sdcMetrics, len(ss)) diff --git a/src/go/collectors/go.d.plugin/modules/scaleio/collect_storage_pool.go b/src/go/plugin/go.d/modules/scaleio/collect_storage_pool.go index 409be0bdb..4a347a64c 100644 --- a/src/go/collectors/go.d.plugin/modules/scaleio/collect_storage_pool.go +++ b/src/go/plugin/go.d/modules/scaleio/collect_storage_pool.go @@ -2,7 +2,7 @@ package scaleio -import "github.com/netdata/netdata/go/go.d.plugin/modules/scaleio/client" +import "github.com/netdata/netdata/go/plugins/plugin/go.d/modules/scaleio/client" func (s *ScaleIO) collectStoragePool(ss map[string]client.StoragePoolStatistics) map[string]storagePoolMetrics { ms := make(map[string]storagePoolMetrics, len(ss)) diff --git a/src/go/collectors/go.d.plugin/modules/scaleio/collect_system.go b/src/go/plugin/go.d/modules/scaleio/collect_system.go index b2c02db1b..ae6e89aa9 100644 --- a/src/go/collectors/go.d.plugin/modules/scaleio/collect_system.go +++ b/src/go/plugin/go.d/modules/scaleio/collect_system.go @@ -2,7 +2,7 @@ package scaleio -import "github.com/netdata/netdata/go/go.d.plugin/modules/scaleio/client" +import "github.com/netdata/netdata/go/plugins/plugin/go.d/modules/scaleio/client" func (s *ScaleIO) collectSystem(ss client.SystemStatistics) systemMetrics { var sm systemMetrics diff --git a/src/go/collectors/go.d.plugin/modules/scaleio/config_schema.json b/src/go/plugin/go.d/modules/scaleio/config_schema.json index ba1067325..97aea7faf 100644 --- a/src/go/collectors/go.d.plugin/modules/scaleio/config_schema.json +++ b/src/go/plugin/go.d/modules/scaleio/config_schema.json @@ -167,6 +167,12 @@ "timeout": { "ui:help": "Accepts decimals for precise control (e.g., type 1.5 for 1.5 seconds)." }, + "username": { + "ui:widget": "password" + }, + "proxy_username": { + "ui:widget": "password" + }, "password": { "ui:widget": "password" }, diff --git a/src/go/collectors/go.d.plugin/modules/scaleio/integrations/dell_emc_scaleio.md b/src/go/plugin/go.d/modules/scaleio/integrations/dell_emc_scaleio.md index c5a977600..36d022526 100644 --- a/src/go/collectors/go.d.plugin/modules/scaleio/integrations/dell_emc_scaleio.md +++ b/src/go/plugin/go.d/modules/scaleio/integrations/dell_emc_scaleio.md @@ -1,6 +1,6 @@ <!--startmeta -custom_edit_url: "https://github.com/netdata/netdata/edit/master/src/go/collectors/go.d.plugin/modules/scaleio/README.md" -meta_yaml: "https://github.com/netdata/netdata/edit/master/src/go/collectors/go.d.plugin/modules/scaleio/metadata.yaml" +custom_edit_url: "https://github.com/netdata/netdata/edit/master/src/go/plugin/go.d/modules/scaleio/README.md" +meta_yaml: "https://github.com/netdata/netdata/edit/master/src/go/plugin/go.d/modules/scaleio/metadata.yaml" sidebar_label: "Dell EMC ScaleIO" learn_status: "Published" learn_rel_path: "Collecting Metrics/Storage, Mount Points and Filesystems" @@ -230,6 +230,8 @@ jobs: ### Debug Mode +**Important**: Debug mode is not supported for data collection jobs created via the UI using the Dyncfg feature. + To troubleshoot issues with the `scaleio` collector, run the `go.d.plugin` with the debug option enabled. The output should give you clues as to why the collector isn't working. @@ -252,4 +254,37 @@ should give you clues as to why the collector isn't working. ./go.d.plugin -d -m scaleio ``` +### Getting Logs + +If you're encountering problems with the `scaleio` collector, follow these steps to retrieve logs and identify potential issues: + +- **Run the command** specific to your system (systemd, non-systemd, or Docker container). +- **Examine the output** for any warnings or error messages that might indicate issues. These messages should provide clues about the root cause of the problem. + +#### System with systemd + +Use the following command to view logs generated since the last Netdata service restart: + +```bash +journalctl _SYSTEMD_INVOCATION_ID="$(systemctl show --value --property=InvocationID netdata)" --namespace=netdata --grep scaleio +``` + +#### System without systemd + +Locate the collector log file, typically at `/var/log/netdata/collector.log`, and use `grep` to filter for collector's name: + +```bash +grep scaleio /var/log/netdata/collector.log +``` + +**Note**: This method shows logs from all restarts. Focus on the **latest entries** for troubleshooting current issues. + +#### Docker Container + +If your Netdata runs in a Docker container named "netdata" (replace if different), use this command: + +```bash +docker logs netdata 2>&1 | grep scaleio +``` + diff --git a/src/go/collectors/go.d.plugin/modules/scaleio/metadata.yaml b/src/go/plugin/go.d/modules/scaleio/metadata.yaml index edee6fc8b..edee6fc8b 100644 --- a/src/go/collectors/go.d.plugin/modules/scaleio/metadata.yaml +++ b/src/go/plugin/go.d/modules/scaleio/metadata.yaml diff --git a/src/go/collectors/go.d.plugin/modules/scaleio/metrics.go b/src/go/plugin/go.d/modules/scaleio/metrics.go index a5a9b9810..a5a9b9810 100644 --- a/src/go/collectors/go.d.plugin/modules/scaleio/metrics.go +++ b/src/go/plugin/go.d/modules/scaleio/metrics.go diff --git a/src/go/collectors/go.d.plugin/modules/scaleio/queries.go b/src/go/plugin/go.d/modules/scaleio/queries.go index 265c3b874..4f38f9976 100644 --- a/src/go/collectors/go.d.plugin/modules/scaleio/queries.go +++ b/src/go/plugin/go.d/modules/scaleio/queries.go @@ -2,7 +2,7 @@ package scaleio -import "github.com/netdata/netdata/go/go.d.plugin/modules/scaleio/client" +import "github.com/netdata/netdata/go/plugins/plugin/go.d/modules/scaleio/client" /* Starting from version 3 of ScaleIO/VxFlex API numOfScsiInitiators property is removed from the system selectedStatisticsQuery. diff --git a/src/go/collectors/go.d.plugin/modules/scaleio/scaleio.go b/src/go/plugin/go.d/modules/scaleio/scaleio.go index 4cc8e69a9..d32ccbffe 100644 --- a/src/go/collectors/go.d.plugin/modules/scaleio/scaleio.go +++ b/src/go/plugin/go.d/modules/scaleio/scaleio.go @@ -7,9 +7,9 @@ import ( "errors" "time" - "github.com/netdata/netdata/go/go.d.plugin/agent/module" - "github.com/netdata/netdata/go/go.d.plugin/modules/scaleio/client" - "github.com/netdata/netdata/go/go.d.plugin/pkg/web" + "github.com/netdata/netdata/go/plugins/plugin/go.d/agent/module" + "github.com/netdata/netdata/go/plugins/plugin/go.d/modules/scaleio/client" + "github.com/netdata/netdata/go/plugins/plugin/go.d/pkg/web" ) //go:embed "config_schema.json" diff --git a/src/go/collectors/go.d.plugin/modules/scaleio/scaleio_test.go b/src/go/plugin/go.d/modules/scaleio/scaleio_test.go index 970ee263d..bb906333e 100644 --- a/src/go/collectors/go.d.plugin/modules/scaleio/scaleio_test.go +++ b/src/go/plugin/go.d/modules/scaleio/scaleio_test.go @@ -8,8 +8,8 @@ import ( "os" "testing" - "github.com/netdata/netdata/go/go.d.plugin/agent/module" - "github.com/netdata/netdata/go/go.d.plugin/modules/scaleio/client" + "github.com/netdata/netdata/go/plugins/plugin/go.d/agent/module" + "github.com/netdata/netdata/go/plugins/plugin/go.d/modules/scaleio/client" "github.com/stretchr/testify/assert" "github.com/stretchr/testify/require" diff --git a/src/go/collectors/go.d.plugin/modules/vernemq/testdata/config.json b/src/go/plugin/go.d/modules/scaleio/testdata/config.json index 984c3ed6e..984c3ed6e 100644 --- a/src/go/collectors/go.d.plugin/modules/vernemq/testdata/config.json +++ b/src/go/plugin/go.d/modules/scaleio/testdata/config.json diff --git a/src/go/collectors/go.d.plugin/modules/vernemq/testdata/config.yaml b/src/go/plugin/go.d/modules/scaleio/testdata/config.yaml index 8558b61cc..8558b61cc 100644 --- a/src/go/collectors/go.d.plugin/modules/vernemq/testdata/config.yaml +++ b/src/go/plugin/go.d/modules/scaleio/testdata/config.yaml diff --git a/src/go/collectors/go.d.plugin/modules/scaleio/testdata/instances.json b/src/go/plugin/go.d/modules/scaleio/testdata/instances.json index bc8c6e8ac..bc8c6e8ac 100644 --- a/src/go/collectors/go.d.plugin/modules/scaleio/testdata/instances.json +++ b/src/go/plugin/go.d/modules/scaleio/testdata/instances.json diff --git a/src/go/collectors/go.d.plugin/modules/scaleio/testdata/selected_statistics.json b/src/go/plugin/go.d/modules/scaleio/testdata/selected_statistics.json index 0b141bbe6..0b141bbe6 100644 --- a/src/go/collectors/go.d.plugin/modules/scaleio/testdata/selected_statistics.json +++ b/src/go/plugin/go.d/modules/scaleio/testdata/selected_statistics.json diff --git a/src/go/collectors/go.d.plugin/modules/sensors/README.md b/src/go/plugin/go.d/modules/sensors/README.md index 4e92b0882..4e92b0882 120000 --- a/src/go/collectors/go.d.plugin/modules/sensors/README.md +++ b/src/go/plugin/go.d/modules/sensors/README.md diff --git a/src/go/collectors/go.d.plugin/modules/sensors/charts.go b/src/go/plugin/go.d/modules/sensors/charts.go index 20df057c8..05081e1ad 100644 --- a/src/go/collectors/go.d.plugin/modules/sensors/charts.go +++ b/src/go/plugin/go.d/modules/sensors/charts.go @@ -6,7 +6,7 @@ import ( "fmt" "strings" - "github.com/netdata/netdata/go/go.d.plugin/agent/module" + "github.com/netdata/netdata/go/plugins/plugin/go.d/agent/module" ) const ( diff --git a/src/go/collectors/go.d.plugin/modules/sensors/collect.go b/src/go/plugin/go.d/modules/sensors/collect.go index 46e900ad0..46e900ad0 100644 --- a/src/go/collectors/go.d.plugin/modules/sensors/collect.go +++ b/src/go/plugin/go.d/modules/sensors/collect.go diff --git a/src/go/collectors/go.d.plugin/modules/sensors/config_schema.json b/src/go/plugin/go.d/modules/sensors/config_schema.json index 6c12ca9b8..6c12ca9b8 100644 --- a/src/go/collectors/go.d.plugin/modules/sensors/config_schema.json +++ b/src/go/plugin/go.d/modules/sensors/config_schema.json diff --git a/src/go/collectors/go.d.plugin/modules/sensors/exec.go b/src/go/plugin/go.d/modules/sensors/exec.go index b920da66e..c386ddd7d 100644 --- a/src/go/collectors/go.d.plugin/modules/sensors/exec.go +++ b/src/go/plugin/go.d/modules/sensors/exec.go @@ -8,7 +8,7 @@ import ( "os/exec" "time" - "github.com/netdata/netdata/go/go.d.plugin/logger" + "github.com/netdata/netdata/go/plugins/logger" ) func newSensorsCliExec(binPath string, timeout time.Duration) *sensorsCliExec { diff --git a/src/go/collectors/go.d.plugin/modules/sensors/init.go b/src/go/plugin/go.d/modules/sensors/init.go index 6753693da..6753693da 100644 --- a/src/go/collectors/go.d.plugin/modules/sensors/init.go +++ b/src/go/plugin/go.d/modules/sensors/init.go diff --git a/src/go/collectors/go.d.plugin/modules/sensors/integrations/linux_sensors_lm-sensors.md b/src/go/plugin/go.d/modules/sensors/integrations/linux_sensors_lm-sensors.md index 6a50fafbf..d5e948c42 100644 --- a/src/go/collectors/go.d.plugin/modules/sensors/integrations/linux_sensors_lm-sensors.md +++ b/src/go/plugin/go.d/modules/sensors/integrations/linux_sensors_lm-sensors.md @@ -1,6 +1,6 @@ <!--startmeta -custom_edit_url: "https://github.com/netdata/netdata/edit/master/src/go/collectors/go.d.plugin/modules/sensors/README.md" -meta_yaml: "https://github.com/netdata/netdata/edit/master/src/go/collectors/go.d.plugin/modules/sensors/metadata.yaml" +custom_edit_url: "https://github.com/netdata/netdata/edit/master/src/go/plugin/go.d/modules/sensors/README.md" +meta_yaml: "https://github.com/netdata/netdata/edit/master/src/go/plugin/go.d/modules/sensors/metadata.yaml" sidebar_label: "Linux Sensors (lm-sensors)" learn_status: "Published" learn_rel_path: "Collecting Metrics/Hardware Devices and Sensors" @@ -155,6 +155,8 @@ jobs: ### Debug Mode +**Important**: Debug mode is not supported for data collection jobs created via the UI using the Dyncfg feature. + To troubleshoot issues with the `sensors` collector, run the `go.d.plugin` with the debug option enabled. The output should give you clues as to why the collector isn't working. @@ -177,4 +179,37 @@ should give you clues as to why the collector isn't working. ./go.d.plugin -d -m sensors ``` +### Getting Logs + +If you're encountering problems with the `sensors` collector, follow these steps to retrieve logs and identify potential issues: + +- **Run the command** specific to your system (systemd, non-systemd, or Docker container). +- **Examine the output** for any warnings or error messages that might indicate issues. These messages should provide clues about the root cause of the problem. + +#### System with systemd + +Use the following command to view logs generated since the last Netdata service restart: + +```bash +journalctl _SYSTEMD_INVOCATION_ID="$(systemctl show --value --property=InvocationID netdata)" --namespace=netdata --grep sensors +``` + +#### System without systemd + +Locate the collector log file, typically at `/var/log/netdata/collector.log`, and use `grep` to filter for collector's name: + +```bash +grep sensors /var/log/netdata/collector.log +``` + +**Note**: This method shows logs from all restarts. Focus on the **latest entries** for troubleshooting current issues. + +#### Docker Container + +If your Netdata runs in a Docker container named "netdata" (replace if different), use this command: + +```bash +docker logs netdata 2>&1 | grep sensors +``` + diff --git a/src/go/collectors/go.d.plugin/modules/sensors/metadata.yaml b/src/go/plugin/go.d/modules/sensors/metadata.yaml index 5ea94f398..5ea94f398 100644 --- a/src/go/collectors/go.d.plugin/modules/sensors/metadata.yaml +++ b/src/go/plugin/go.d/modules/sensors/metadata.yaml diff --git a/src/go/collectors/go.d.plugin/modules/sensors/sensors.go b/src/go/plugin/go.d/modules/sensors/sensors.go index 69f0c4dbc..379d44deb 100644 --- a/src/go/collectors/go.d.plugin/modules/sensors/sensors.go +++ b/src/go/plugin/go.d/modules/sensors/sensors.go @@ -7,8 +7,8 @@ import ( "errors" "time" - "github.com/netdata/netdata/go/go.d.plugin/agent/module" - "github.com/netdata/netdata/go/go.d.plugin/pkg/web" + "github.com/netdata/netdata/go/plugins/plugin/go.d/agent/module" + "github.com/netdata/netdata/go/plugins/plugin/go.d/pkg/web" ) //go:embed "config_schema.json" diff --git a/src/go/collectors/go.d.plugin/modules/sensors/sensors_test.go b/src/go/plugin/go.d/modules/sensors/sensors_test.go index d9b4242e7..a370d7500 100644 --- a/src/go/collectors/go.d.plugin/modules/sensors/sensors_test.go +++ b/src/go/plugin/go.d/modules/sensors/sensors_test.go @@ -7,7 +7,7 @@ import ( "os" "testing" - "github.com/netdata/netdata/go/go.d.plugin/agent/module" + "github.com/netdata/netdata/go/plugins/plugin/go.d/agent/module" "github.com/stretchr/testify/assert" "github.com/stretchr/testify/require" diff --git a/src/go/collectors/go.d.plugin/modules/zfspool/testdata/config.json b/src/go/plugin/go.d/modules/sensors/testdata/config.json index 095713193..095713193 100644 --- a/src/go/collectors/go.d.plugin/modules/zfspool/testdata/config.json +++ b/src/go/plugin/go.d/modules/sensors/testdata/config.json diff --git a/src/go/collectors/go.d.plugin/modules/zfspool/testdata/config.yaml b/src/go/plugin/go.d/modules/sensors/testdata/config.yaml index baf3bcd0b..baf3bcd0b 100644 --- a/src/go/collectors/go.d.plugin/modules/zfspool/testdata/config.yaml +++ b/src/go/plugin/go.d/modules/sensors/testdata/config.yaml diff --git a/src/go/collectors/go.d.plugin/modules/sensors/testdata/sensors-temp-in-curr-power-fan.txt b/src/go/plugin/go.d/modules/sensors/testdata/sensors-temp-in-curr-power-fan.txt index a38c7ab4e..a38c7ab4e 100644 --- a/src/go/collectors/go.d.plugin/modules/sensors/testdata/sensors-temp-in-curr-power-fan.txt +++ b/src/go/plugin/go.d/modules/sensors/testdata/sensors-temp-in-curr-power-fan.txt diff --git a/src/go/collectors/go.d.plugin/modules/sensors/testdata/sensors-temp.txt b/src/go/plugin/go.d/modules/sensors/testdata/sensors-temp.txt index decc7ee39..decc7ee39 100644 --- a/src/go/collectors/go.d.plugin/modules/sensors/testdata/sensors-temp.txt +++ b/src/go/plugin/go.d/modules/sensors/testdata/sensors-temp.txt diff --git a/src/go/collectors/go.d.plugin/modules/smartctl/README.md b/src/go/plugin/go.d/modules/smartctl/README.md index 63aad6c85..63aad6c85 120000 --- a/src/go/collectors/go.d.plugin/modules/smartctl/README.md +++ b/src/go/plugin/go.d/modules/smartctl/README.md diff --git a/src/go/collectors/go.d.plugin/modules/smartctl/charts.go b/src/go/plugin/go.d/modules/smartctl/charts.go index 2a5fea02b..461f73501 100644 --- a/src/go/collectors/go.d.plugin/modules/smartctl/charts.go +++ b/src/go/plugin/go.d/modules/smartctl/charts.go @@ -6,7 +6,7 @@ import ( "fmt" "strings" - "github.com/netdata/netdata/go/go.d.plugin/agent/module" + "github.com/netdata/netdata/go/plugins/plugin/go.d/agent/module" ) const ( @@ -16,6 +16,10 @@ const ( prioDeviceTemperature prioDevicePowerCycleCount + prioDeviceScsiReadErrors + prioDeviceScsiWriteErrors + prioDeviceScsiVerifyErrors + prioDeviceSmartAttributeDecoded prioDeviceSmartAttributeNormalized ) @@ -92,6 +96,54 @@ var ( } ) +var deviceScsiErrorLogChartsTmpl = module.Charts{ + deviceScsiReadErrorsChartTmpl.Copy(), + deviceScsiWriteErrorsChartTmpl.Copy(), + deviceScsiVerifyErrorsChartTmpl.Copy(), +} + +var ( + deviceScsiReadErrorsChartTmpl = module.Chart{ + ID: "device_%s_type_%s_read_errors_rate", + Title: "Device read errors", + Units: "errors/s", + Fam: "scsi errors", + Ctx: "smartctl.device_read_errors_rate", + Type: module.Line, + Priority: prioDeviceScsiReadErrors, + Dims: module.Dims{ + {ID: "device_%s_type_%s_scsi_error_log_read_total_errors_corrected", Name: "corrected", Algo: module.Incremental}, + {ID: "device_%s_type_%s_scsi_error_log_read_total_uncorrected_errors", Name: "uncorrected", Algo: module.Incremental}, + }, + } + deviceScsiWriteErrorsChartTmpl = module.Chart{ + ID: "device_%s_type_%s_write_errors_rate", + Title: "Device write errors", + Units: "errors/s", + Fam: "scsi errors", + Ctx: "smartctl.device_write_errors_rate", + Type: module.Line, + Priority: prioDeviceScsiWriteErrors, + Dims: module.Dims{ + {ID: "device_%s_type_%s_scsi_error_log_write_total_errors_corrected", Name: "corrected", Algo: module.Incremental}, + {ID: "device_%s_type_%s_scsi_error_log_read_total_uncorrected_errors", Name: "uncorrected", Algo: module.Incremental}, + }, + } + deviceScsiVerifyErrorsChartTmpl = module.Chart{ + ID: "device_%s_type_%s_verify_errors_rate", + Title: "Device verify errors", + Units: "errors/s", + Fam: "scsi errors", + Ctx: "smartctl.device_verify_errors_rate", + Type: module.Line, + Priority: prioDeviceScsiVerifyErrors, + Dims: module.Dims{ + {ID: "device_%s_type_%s_scsi_error_log_verify_total_errors_corrected", Name: "corrected", Algo: module.Incremental}, + {ID: "device_%s_type_%s_scsi_error_log_verify_total_uncorrected_errors", Name: "uncorrected", Algo: module.Incremental}, + }, + } +) + var ( deviceSmartAttributeDecodedChartTmpl = module.Chart{ ID: "device_%s_type_%s_smart_attr_%s", @@ -132,6 +184,11 @@ func (s *Smartctl) addDeviceCharts(dev *smartDevice) { s.Warning(err) } } + if cs := s.newDeviceScsiErrorLogCharts(dev); cs != nil && len(*cs) > 0 { + if err := charts.Add(*cs...); err != nil { + s.Warning(err) + } + } if err := s.Charts().Add(charts...); err != nil { s.Warning(err) @@ -235,6 +292,29 @@ func (s *Smartctl) newDeviceSmartAttrCharts(dev *smartDevice) *module.Charts { return &charts } +func (s *Smartctl) newDeviceScsiErrorLogCharts(dev *smartDevice) *module.Charts { + if dev.deviceType() != "scsi" || !dev.data.Get("scsi_error_counter_log").Exists() { + return nil + } + + charts := deviceScsiErrorLogChartsTmpl.Copy() + + for _, chart := range *charts { + chart.ID = fmt.Sprintf(chart.ID, dev.deviceName(), dev.deviceType()) + chart.Labels = []module.Label{ + {Key: "device_name", Value: dev.deviceName()}, + {Key: "device_type", Value: dev.deviceType()}, + {Key: "model_name", Value: dev.modelName()}, + {Key: "serial_number", Value: dev.serialNumber()}, + } + for _, dim := range chart.Dims { + dim.ID = fmt.Sprintf(dim.ID, dev.deviceName(), dev.deviceType()) + } + } + + return charts +} + var attrNameReplacer = strings.NewReplacer(" ", "_", "/", "_") func cleanAttributeName(attrName string) string { diff --git a/src/go/collectors/go.d.plugin/modules/smartctl/collect.go b/src/go/plugin/go.d/modules/smartctl/collect.go index 79cbb13d0..35585db62 100644 --- a/src/go/collectors/go.d.plugin/modules/smartctl/collect.go +++ b/src/go/plugin/go.d/modules/smartctl/collect.go @@ -42,7 +42,8 @@ func (s *Smartctl) collect() (map[string]int64, error) { // TODO: make it concurrent for _, d := range s.scannedDevices { if err := s.collectScannedDevice(mx, d); err != nil { - return nil, err + s.Warning(err) + continue } } @@ -57,7 +58,7 @@ func (s *Smartctl) collect() (map[string]int64, error) { func (s *Smartctl) collectScannedDevice(mx map[string]int64, scanDev *scanDevice) error { resp, err := s.exec.deviceInfo(scanDev.name, scanDev.typ, s.NoCheckPowerMode) if err != nil { - if resp != nil && isDeviceOpenFailedNoSuchDevice(resp) { + if resp != nil && isDeviceOpenFailedNoSuchDevice(resp) && !scanDev.extra { s.Infof("smartctl reported that device '%s' type '%s' no longer exists", scanDev.name, scanDev.typ) s.forceScan = true return nil @@ -136,10 +137,34 @@ func (s *Smartctl) collectSmartDevice(mx map[string]int64, dev *smartDevice) { } } } + + if dev.deviceType() == "scsi" { + sel := dev.data.Get("scsi_error_counter_log") + if !sel.Exists() { + return + } + + for _, v := range []string{"read", "write", "verify"} { + for _, n := range []string{ + //"errors_corrected_by_eccdelayed", + //"errors_corrected_by_eccfast", + //"errors_corrected_by_rereads_rewrites", + "total_errors_corrected", + "total_uncorrected_errors", + } { + key := fmt.Sprintf("%sscsi_error_log_%s_%s", px, v, n) + metric := fmt.Sprintf("%s.%s", v, n) + + if m := sel.Get(metric); m.Exists() { + mx[key] = m.Int() + } + } + } + } } func (s *Smartctl) isTimeToScan(now time.Time) bool { - return now.After(s.lastScanTime.Add(s.ScanEvery.Duration())) + return s.ScanEvery.Duration().Seconds() != 0 && now.After(s.lastScanTime.Add(s.ScanEvery.Duration())) } func (s *Smartctl) isTimeToPollDevices(now time.Time) bool { diff --git a/src/go/collectors/go.d.plugin/modules/smartctl/config_schema.json b/src/go/plugin/go.d/modules/smartctl/config_schema.json index 8093cc5f8..afe7ce1a9 100644 --- a/src/go/collectors/go.d.plugin/modules/smartctl/config_schema.json +++ b/src/go/plugin/go.d/modules/smartctl/config_schema.json @@ -20,7 +20,7 @@ }, "scan_every": { "title": "Scan interval", - "description": "Interval for discovering new devices using `smartctl --scan`, measured in seconds.", + "description": "Interval for discovering new devices using `smartctl --scan`, measured in seconds. Set to 0 to scan devices only once on startup.", "type": "number", "minimum": 1, "default": 900 @@ -50,6 +50,36 @@ "type": "string", "minimum": 1, "default": "*" + }, + "extra_devices": { + "title": "Extra devices", + "description": "Allows manual specification of devices not automatically detected by `smartctl --scan`. Each device entry must include both a name and a type.", + "type": [ + "array", + "null" + ], + "uniqueItems": true, + "items": { + "title": "Device", + "type": [ + "object", + "null" + ], + "required": [ + "name", + "type" + ], + "properties": { + "name": { + "title": "Name", + "type": "string" + }, + "type": { + "title": "Type", + "type": "string" + } + } + } } }, "additionalProperties": false, @@ -75,9 +105,10 @@ ] }, { - "title": "Filtering", + "title": "Devices", "fields": [ - "device_selector" + "device_selector", + "extra_devices" ] } ] @@ -94,6 +125,16 @@ }, "device_selector": { "ui:help": "Leave blank or use `*` to collect data for all devices." + }, + "extra_devices": { + "items": { + "name": { + "ui:placeholder": "/dev/sda" + }, + "type": { + "ui:placeholder": "jmb39x-q,3" + } + } } } } diff --git a/src/go/collectors/go.d.plugin/modules/smartctl/exec.go b/src/go/plugin/go.d/modules/smartctl/exec.go index a90e1b529..94974c0d3 100644 --- a/src/go/collectors/go.d.plugin/modules/smartctl/exec.go +++ b/src/go/plugin/go.d/modules/smartctl/exec.go @@ -9,7 +9,7 @@ import ( "os/exec" "time" - "github.com/netdata/netdata/go/go.d.plugin/logger" + "github.com/netdata/netdata/go/plugins/logger" "github.com/tidwall/gjson" ) @@ -29,7 +29,10 @@ type smartctlCliExec struct { timeout time.Duration } -func (e *smartctlCliExec) scan() (*gjson.Result, error) { +func (e *smartctlCliExec) scan(open bool) (*gjson.Result, error) { + if open { + return e.execute("smartctl-json-scan-open") + } return e.execute("smartctl-json-scan") } diff --git a/src/go/collectors/go.d.plugin/modules/smartctl/init.go b/src/go/plugin/go.d/modules/smartctl/init.go index b5d4ebfe3..6d3731a18 100644 --- a/src/go/collectors/go.d.plugin/modules/smartctl/init.go +++ b/src/go/plugin/go.d/modules/smartctl/init.go @@ -7,8 +7,8 @@ import ( "os" "path/filepath" - "github.com/netdata/netdata/go/go.d.plugin/agent/executable" - "github.com/netdata/netdata/go/go.d.plugin/pkg/matcher" + "github.com/netdata/netdata/go/plugins/pkg/executable" + "github.com/netdata/netdata/go/plugins/plugin/go.d/pkg/matcher" ) func (s *Smartctl) validateConfig() error { @@ -17,6 +17,13 @@ func (s *Smartctl) validateConfig() error { default: return fmt.Errorf("invalid power mode '%s'", s.NoCheckPowerMode) } + + for _, v := range s.ExtraDevices { + if v.Name == "" || v.Type == "" { + return fmt.Errorf("invalid extra device: name and type must both be provided, got name='%s' type='%s'", v.Name, v.Type) + } + } + return nil } diff --git a/src/go/collectors/go.d.plugin/modules/smartctl/integrations/s.m.a.r.t..md b/src/go/plugin/go.d/modules/smartctl/integrations/s.m.a.r.t..md index 482fedbd1..b9eb9f368 100644 --- a/src/go/collectors/go.d.plugin/modules/smartctl/integrations/s.m.a.r.t..md +++ b/src/go/plugin/go.d/modules/smartctl/integrations/s.m.a.r.t..md @@ -1,6 +1,6 @@ <!--startmeta -custom_edit_url: "https://github.com/netdata/netdata/edit/master/src/go/collectors/go.d.plugin/modules/smartctl/README.md" -meta_yaml: "https://github.com/netdata/netdata/edit/master/src/go/collectors/go.d.plugin/modules/smartctl/metadata.yaml" +custom_edit_url: "https://github.com/netdata/netdata/edit/master/src/go/plugin/go.d/modules/smartctl/README.md" +meta_yaml: "https://github.com/netdata/netdata/edit/master/src/go/plugin/go.d/modules/smartctl/metadata.yaml" sidebar_label: "S.M.A.R.T." learn_status: "Published" learn_rel_path: "Collecting Metrics/Hardware Devices and Sensors" @@ -83,6 +83,9 @@ Metrics: | smartctl.device_power_on_time | power_on_time | seconds | | smartctl.device_temperature | temperature | Celsius | | smartctl.device_power_cycles_count | power | cycles | +| smartctl.device_read_errors_rate | corrected, uncorrected | errors/s | +| smartctl.device_write_errors_rate | corrected, uncorrected | errors/s | +| smartctl.device_verify_errors_rate | corrected, uncorrected | errors/s | | smartctl.device_smart_attr_{attribute_name} | {attribute_name} | {attribute_unit} | | smartctl.device_smart_attr_{attribute_name}_normalized | {attribute_name} | value | @@ -102,6 +105,40 @@ There are no alerts configured by default for this integration. Install `smartmontools` version 7.0 or later using your distribution's package manager. Version 7.0 introduced the `--json` output mode, which is required for this collector to function properly. +#### For Netdata running in a Docker container + +1. **Install smartmontools**. + + Ensure `smartctl` is available in the container by setting the environment variable `NETDATA_EXTRA_DEB_PACKAGES=smartmontools` when starting the container. + +2. **Provide access to storage devices**. + + Netdata requires the `SYS_RAWIO` capability and access to the storage devices to run the `smartctl` collector inside a Docker container. Here's how you can achieve this: + + - `docker run` + + ```bash + docker run --cap-add SYS_RAWIO --device /dev/sda:/dev/sda ... + ``` + + - `docker-compose.yml` + + ```yaml + services: + netdata: + cap_add: + - SYS_PTRACE + - SYS_ADMIN + - SYS_RAWIO # smartctl + devices: + - "/dev/sda:/dev/sda" + ``` + + > **Multiple Devices**: These examples only show mapping of one device (/dev/sda). You'll need to add additional `--device` options (in docker run) or entries in the `devices` list (in docker-compose.yml) for each storage device you want Netdata's smartctl collector to monitor. + + > **NVMe Devices**: Do not map NVMe devices using this method. Netdata uses a [dedicated collector](https://github.com/netdata/netdata/tree/master/src/go/plugin/go.d/modules/nvme#readme) to monitor NVMe devices. + + ### Configuration @@ -128,9 +165,23 @@ The following options can be defined globally: update_every. |:----|:-----------|:-------|:--------:| | update_every | interval for updating Netdata charts, measured in seconds. Collector might use cached data if less than **Devices poll interval**. | 10 | no | | timeout | smartctl binary execution timeout. | 5 | no | -| scan_every | interval for discovering new devices using `smartctl --scan`, measured in seconds. | 900 | no | +| scan_every | interval for discovering new devices using `smartctl --scan`, measured in seconds. Set to 0 to scan devices only once on startup. | 900 | no | | poll_devices_every | interval for gathering data for every device, measured in seconds. Data is cached for this interval. | 300 | no | | device_selector | Specifies a pattern to match the 'info name' of devices as reported by `smartctl --scan --json`. | * | no | +| extra_devices | Allows manual specification of devices not automatically detected by `smartctl --scan`. Each device entry must include both a name and a type. See "Configuration Examples" for details. | [] | no | +| no_check_power_mode | Skip data collection when the device is in a low-power mode. Prevents unnecessary disk spin-up. | standby | no | + +##### no_check_power_mode + +The valid arguments to this option are: + +| Mode | Description | +|---------|----------------------------------------------------------------------------------------------------------------------------------------------------------------------------------------| +| never | Check the device always. | +| sleep | Check the device unless it is in SLEEP mode. | +| standby | Check the device unless it is in SLEEP or STANDBY mode. In these modes most disks are not spinning, so if you want to prevent a disk from spinning up, this is probably what you want. | +| idle | Check the device unless it is in SLEEP, STANDBY or IDLE mode. In the IDLE state, most disks are still spinning, so this is probably not what you want. | + </details> @@ -150,12 +201,31 @@ jobs: ``` </details> +##### Extra devices + +This example demonstrates using `extra_devices` to manually add a storage device (`/dev/sdc`) not automatically detected by `smartctl --scan`. + + +<details open><summary>Config</summary> + +```yaml +jobs: + - name: smartctl + extra_devices: + - name: /dev/sdc + type: jmb39x-q,3 + +``` +</details> + ## Troubleshooting ### Debug Mode +**Important**: Debug mode is not supported for data collection jobs created via the UI using the Dyncfg feature. + To troubleshoot issues with the `smartctl` collector, run the `go.d.plugin` with the debug option enabled. The output should give you clues as to why the collector isn't working. @@ -178,4 +248,37 @@ should give you clues as to why the collector isn't working. ./go.d.plugin -d -m smartctl ``` +### Getting Logs + +If you're encountering problems with the `smartctl` collector, follow these steps to retrieve logs and identify potential issues: + +- **Run the command** specific to your system (systemd, non-systemd, or Docker container). +- **Examine the output** for any warnings or error messages that might indicate issues. These messages should provide clues about the root cause of the problem. + +#### System with systemd + +Use the following command to view logs generated since the last Netdata service restart: + +```bash +journalctl _SYSTEMD_INVOCATION_ID="$(systemctl show --value --property=InvocationID netdata)" --namespace=netdata --grep smartctl +``` + +#### System without systemd + +Locate the collector log file, typically at `/var/log/netdata/collector.log`, and use `grep` to filter for collector's name: + +```bash +grep smartctl /var/log/netdata/collector.log +``` + +**Note**: This method shows logs from all restarts. Focus on the **latest entries** for troubleshooting current issues. + +#### Docker Container + +If your Netdata runs in a Docker container named "netdata" (replace if different), use this command: + +```bash +docker logs netdata 2>&1 | grep smartctl +``` + diff --git a/src/go/collectors/go.d.plugin/modules/smartctl/metadata.yaml b/src/go/plugin/go.d/modules/smartctl/metadata.yaml index 6d409ec56..e748e82ae 100644 --- a/src/go/collectors/go.d.plugin/modules/smartctl/metadata.yaml +++ b/src/go/plugin/go.d/modules/smartctl/metadata.yaml @@ -52,6 +52,38 @@ modules: - title: Install smartmontools (v7.0+) description: | Install `smartmontools` version 7.0 or later using your distribution's package manager. Version 7.0 introduced the `--json` output mode, which is required for this collector to function properly. + - title: For Netdata running in a Docker container + description: | + 1. **Install smartmontools**. + + Ensure `smartctl` is available in the container by setting the environment variable `NETDATA_EXTRA_DEB_PACKAGES=smartmontools` when starting the container. + + 2. **Provide access to storage devices**. + + Netdata requires the `SYS_RAWIO` capability and access to the storage devices to run the `smartctl` collector inside a Docker container. Here's how you can achieve this: + + - `docker run` + + ```bash + docker run --cap-add SYS_RAWIO --device /dev/sda:/dev/sda ... + ``` + + - `docker-compose.yml` + + ```yaml + services: + netdata: + cap_add: + - SYS_PTRACE + - SYS_ADMIN + - SYS_RAWIO # smartctl + devices: + - "/dev/sda:/dev/sda" + ``` + + > **Multiple Devices**: These examples only show mapping of one device (/dev/sda). You'll need to add additional `--device` options (in docker run) or entries in the `devices` list (in docker-compose.yml) for each storage device you want Netdata's smartctl collector to monitor. + + > **NVMe Devices**: Do not map NVMe devices using this method. Netdata uses a [dedicated collector](https://github.com/netdata/netdata/tree/master/src/go/plugin/go.d/modules/nvme#readme) to monitor NVMe devices. configuration: file: name: go.d/smartctl.conf @@ -71,7 +103,7 @@ modules: default_value: 5 required: false - name: scan_every - description: interval for discovering new devices using `smartctl --scan`, measured in seconds. + description: interval for discovering new devices using `smartctl --scan`, measured in seconds. Set to 0 to scan devices only once on startup. default_value: 900 required: false - name: poll_devices_every @@ -82,6 +114,23 @@ modules: description: "Specifies a pattern to match the 'info name' of devices as reported by `smartctl --scan --json`." default_value: "*" required: false + - name: extra_devices + description: "Allows manual specification of devices not automatically detected by `smartctl --scan`. Each device entry must include both a name and a type. See \"Configuration Examples\" for details." + default_value: "[]" + required: false + - name: no_check_power_mode + description: "Skip data collection when the device is in a low-power mode. Prevents unnecessary disk spin-up." + default_value: standby + required: false + detailed_description: | + The valid arguments to this option are: + + | Mode | Description | + |---------|----------------------------------------------------------------------------------------------------------------------------------------------------------------------------------------| + | never | Check the device always. | + | sleep | Check the device unless it is in SLEEP mode. | + | standby | Check the device unless it is in SLEEP or STANDBY mode. In these modes most disks are not spinning, so if you want to prevent a disk from spinning up, this is probably what you want. | + | idle | Check the device unless it is in SLEEP, STANDBY or IDLE mode. In the IDLE state, most disks are still spinning, so this is probably not what you want. | examples: folding: title: Config @@ -93,6 +142,15 @@ modules: jobs: - name: smartctl devices_poll_interval: 60 # Collect S.M.A.R.T statistics every 60 seconds + - name: Extra devices + description: | + This example demonstrates using `extra_devices` to manually add a storage device (`/dev/sdc`) not automatically detected by `smartctl --scan`. + config: | + jobs: + - name: smartctl + extra_devices: + - name: /dev/sdc + type: jmb39x-q,3 troubleshooting: problems: list: [] @@ -147,6 +205,27 @@ modules: chart_type: line dimensions: - name: power + - name: smartctl.device_read_errors_rate + description: Device read errors + unit: errors/s + chart_type: line + dimensions: + - name: corrected + - name: uncorrected + - name: smartctl.device_write_errors_rate + description: Device write errors + unit: errors/s + chart_type: line + dimensions: + - name: corrected + - name: uncorrected + - name: smartctl.device_verify_errors_rate + description: Device verify errors + unit: errors/s + chart_type: line + dimensions: + - name: corrected + - name: uncorrected - name: smartctl.device_smart_attr_{attribute_name} description: Device smart attribute {attribute_name} unit: '{attribute_unit}' diff --git a/src/go/collectors/go.d.plugin/modules/smartctl/scan.go b/src/go/plugin/go.d/modules/smartctl/scan.go index 9310938f6..5564897a4 100644 --- a/src/go/collectors/go.d.plugin/modules/smartctl/scan.go +++ b/src/go/plugin/go.d/modules/smartctl/scan.go @@ -12,6 +12,7 @@ type scanDevice struct { name string infoName string typ string + extra bool // added via config "extra_devices" } func (s *scanDevice) key() string { @@ -23,7 +24,15 @@ func (s *scanDevice) shortName() string { } func (s *Smartctl) scanDevices() (map[string]*scanDevice, error) { - resp, err := s.exec.scan() + // Issue on Discord: https://discord.com/channels/847502280503590932/1261747175361347644/1261747175361347644 + // "sat" devices being identified as "scsi" with --scan, and then later + // code attempts to validate the type by calling `smartctl` with the "scsi" type. + // This validation can trigger unintended "Enabling discard_zeroes_data" messages in system logs (dmesg). + // To address this specific issue we use `smartctl --scan-open` as a workaround. + // This method reliably identifies device types. + scanOpen := s.NoCheckPowerMode == "never" + + resp, err := s.exec.scan(scanOpen) if err != nil { return nil, fmt.Errorf("failed to scan devices: %v", err) } @@ -34,7 +43,7 @@ func (s *Smartctl) scanDevices() (map[string]*scanDevice, error) { dev := &scanDevice{ name: d.Get("name").String(), infoName: d.Get("info_name").String(), - typ: d.Get("type").String(), // guessed type (we do '--scan' not '--scan-open') + typ: d.Get("type").String(), } if dev.name == "" || dev.typ == "" { @@ -47,17 +56,13 @@ func (s *Smartctl) scanDevices() (map[string]*scanDevice, error) { continue } - if dev.typ == "scsi" { + if !scanOpen && dev.typ == "scsi" { // `smartctl --scan` attempts to guess the device type based on the path, but this can be unreliable. // Accurate device type information is crucial because we use the `--device` option to gather data. // Using the wrong type can lead to issues. // For example, using 'scsi' for 'sat' devices prevents `smartctl` from issuing the necessary ATA commands. - resp, _ := s.exec.deviceInfo(dev.name, dev.typ, s.NoCheckPowerMode) - if resp != nil && isExitStatusHasBit(resp, 2) { - correctType := "sat" - s.Debugf("changing device '%s' type '%s' -> '%s'", dev.name, dev.typ, correctType) - dev.typ = correctType - } + + s.handleGuessedScsiScannedDevice(dev) } s.Debugf("smartctl scan found device '%s' type '%s' info_name '%s'", dev.name, dev.typ, dev.infoName) @@ -65,11 +70,50 @@ func (s *Smartctl) scanDevices() (map[string]*scanDevice, error) { devices[dev.key()] = dev } + s.Debugf("smartctl scan found %d devices", len(devices)) + + for _, v := range s.ExtraDevices { + dev := &scanDevice{name: v.Name, typ: v.Type, extra: true} + + if _, ok := devices[dev.key()]; !ok { + devices[dev.key()] = dev + } + } + if len(devices) == 0 { return nil, errors.New("no devices found during scan") } - s.Debugf("smartctl scan found %d devices", len(devices)) - return devices, nil } + +func (s *Smartctl) handleGuessedScsiScannedDevice(dev *scanDevice) { + if dev.typ != "scsi" || s.hasScannedDevice(dev) { + return + } + + d := &scanDevice{name: dev.name, typ: "sat"} + + if s.hasScannedDevice(d) { + dev.typ = d.typ + return + } + + resp, _ := s.exec.deviceInfo(dev.name, "sat", s.NoCheckPowerMode) + if resp == nil || resp.Get("smartctl.exit_status").Int() != 0 { + return + } + + atts, ok := newSmartDevice(resp).ataSmartAttributeTable() + if !ok || len(atts) == 0 { + return + } + + s.Debugf("changing device '%s' type 'scsi' -> 'sat'", dev.name) + dev.typ = "sat" +} + +func (s *Smartctl) hasScannedDevice(d *scanDevice) bool { + _, ok := s.scannedDevices[d.key()] + return ok +} diff --git a/src/go/collectors/go.d.plugin/modules/smartctl/smart_device.go b/src/go/plugin/go.d/modules/smartctl/smart_device.go index 87306bab9..280281aad 100644 --- a/src/go/collectors/go.d.plugin/modules/smartctl/smart_device.go +++ b/src/go/plugin/go.d/modules/smartctl/smart_device.go @@ -27,10 +27,6 @@ func (d *smartDevice) deviceType() string { return d.data.Get("device.type").String() } -func (d *smartDevice) deviceProtocol() string { - return d.data.Get("device.protocol").String() -} - func (d *smartDevice) serialNumber() string { return d.data.Get("serial_number").String() } diff --git a/src/go/collectors/go.d.plugin/modules/smartctl/smartctl.go b/src/go/plugin/go.d/modules/smartctl/smartctl.go index 4fb70666b..36f390a37 100644 --- a/src/go/collectors/go.d.plugin/modules/smartctl/smartctl.go +++ b/src/go/plugin/go.d/modules/smartctl/smartctl.go @@ -7,9 +7,9 @@ import ( "errors" "time" - "github.com/netdata/netdata/go/go.d.plugin/agent/module" - "github.com/netdata/netdata/go/go.d.plugin/pkg/matcher" - "github.com/netdata/netdata/go/go.d.plugin/pkg/web" + "github.com/netdata/netdata/go/plugins/plugin/go.d/agent/module" + "github.com/netdata/netdata/go/plugins/plugin/go.d/pkg/matcher" + "github.com/netdata/netdata/go/plugins/plugin/go.d/pkg/web" "github.com/tidwall/gjson" ) @@ -38,19 +38,27 @@ func New() *Smartctl { DeviceSelector: "*", }, charts: &module.Charts{}, + forceScan: true, deviceSr: matcher.TRUE(), seenDevices: make(map[string]bool), } } -type Config struct { - UpdateEvery int `yaml:"update_every,omitempty" json:"update_every"` - Timeout web.Duration `yaml:"timeout,omitempty" json:"timeout"` - ScanEvery web.Duration `yaml:"scan_every,omitempty" json:"scan_every"` - PollDevicesEvery web.Duration `yaml:"poll_devices_every,omitempty" json:"poll_devices_every"` - NoCheckPowerMode string `yaml:"no_check_power_mode,omitempty" json:"no_check_power_mode"` - DeviceSelector string `yaml:"device_selector,omitempty" json:"device_selector"` -} +type ( + Config struct { + UpdateEvery int `yaml:"update_every,omitempty" json:"update_every"` + Timeout web.Duration `yaml:"timeout,omitempty" json:"timeout"` + ScanEvery web.Duration `yaml:"scan_every,omitempty" json:"scan_every"` + PollDevicesEvery web.Duration `yaml:"poll_devices_every,omitempty" json:"poll_devices_every"` + NoCheckPowerMode string `yaml:"no_check_power_mode,omitempty" json:"no_check_power_mode"` + DeviceSelector string `yaml:"device_selector,omitempty" json:"device_selector"` + ExtraDevices []ConfigExtraDevice `yaml:"extra_devices,omitempty" json:"extra_devices"` + } + ConfigExtraDevice struct { + Name string `yaml:"name" json:"name"` + Type string `yaml:"type" json:"type"` + } +) type ( Smartctl struct { @@ -74,7 +82,7 @@ type ( mx map[string]int64 } smartctlCli interface { - scan() (*gjson.Result, error) + scan(open bool) (*gjson.Result, error) deviceInfo(deviceName, deviceType, powerMode string) (*gjson.Result, error) } ) diff --git a/src/go/collectors/go.d.plugin/modules/smartctl/smartctl_test.go b/src/go/plugin/go.d/modules/smartctl/smartctl_test.go index 9666924bf..7c56605f6 100644 --- a/src/go/collectors/go.d.plugin/modules/smartctl/smartctl_test.go +++ b/src/go/plugin/go.d/modules/smartctl/smartctl_test.go @@ -8,8 +8,8 @@ import ( "testing" "time" - "github.com/netdata/netdata/go/go.d.plugin/agent/module" - "github.com/netdata/netdata/go/go.d.plugin/pkg/web" + "github.com/netdata/netdata/go/plugins/plugin/go.d/agent/module" + "github.com/netdata/netdata/go/plugins/plugin/go.d/pkg/web" "github.com/stretchr/testify/assert" "github.com/stretchr/testify/require" @@ -26,6 +26,10 @@ var ( dataTypeNvmeScan, _ = os.ReadFile("testdata/type-nvme/scan.json") dataTypeNvmeDeviceNvme0, _ = os.ReadFile("testdata/type-nvme/device-nvme0.json") + dataTypeNvmeDeviceNvme1, _ = os.ReadFile("testdata/type-nvme/device-nvme1.json") + + dataTypeScsiScan, _ = os.ReadFile("testdata/type-scsi/scan.json") + dataTypeScsiDeviceSda, _ = os.ReadFile("testdata/type-scsi/device-sda.json") ) func Test_testDataIsValid(t *testing.T) { @@ -39,6 +43,10 @@ func Test_testDataIsValid(t *testing.T) { "dataTypeNvmeScan": dataTypeNvmeScan, "dataTypeNvmeDeviceNvme0": dataTypeNvmeDeviceNvme0, + "dataTypeNvmeDeviceNvme1": dataTypeNvmeDeviceNvme1, + + "dataTypeScsiScan": dataTypeScsiScan, + "dataTypeScsiDeviceSda": dataTypeScsiDeviceSda, } { require.NotNil(t, data, name) } @@ -160,9 +168,10 @@ func TestSmartctl_Check(t *testing.T) { func TestSmartctl_Collect(t *testing.T) { tests := map[string]struct { - prepareMock func() *mockSmartctlCliExec - wantMetrics map[string]int64 - wantCharts int + prepareMock func() *mockSmartctlCliExec + prepareConfig func() Config + wantMetrics map[string]int64 + wantCharts int }{ "success type sata devices": { prepareMock: prepareMockOkTypeSata, @@ -289,6 +298,46 @@ func TestSmartctl_Collect(t *testing.T) { "device_nvme0_type_nvme_temperature": 39, }, }, + "success type nvme devices with extra": { + prepareMock: prepareMockOkTypeNvme, + prepareConfig: func() Config { + cfg := New().Config + cfg.ExtraDevices = []ConfigExtraDevice{ + {Name: "/dev/nvme1", Type: "nvme"}, + } + return cfg + }, + wantCharts: 8, + wantMetrics: map[string]int64{ + "device_nvme0_type_nvme_power_cycle_count": 2, + "device_nvme0_type_nvme_power_on_time": 11206800, + "device_nvme0_type_nvme_smart_status_failed": 0, + "device_nvme0_type_nvme_smart_status_passed": 1, + "device_nvme0_type_nvme_temperature": 39, + "device_nvme1_type_nvme_power_cycle_count": 5, + "device_nvme1_type_nvme_power_on_time": 17038800, + "device_nvme1_type_nvme_smart_status_failed": 0, + "device_nvme1_type_nvme_smart_status_passed": 1, + "device_nvme1_type_nvme_temperature": 36, + }, + }, + "success type scsi devices": { + prepareMock: prepareMockOkTypeScsi, + wantCharts: 7, + wantMetrics: map[string]int64{ + "device_sda_type_scsi_power_cycle_count": 4, + "device_sda_type_scsi_power_on_time": 5908920, + "device_sda_type_scsi_scsi_error_log_read_total_errors_corrected": 647736, + "device_sda_type_scsi_scsi_error_log_read_total_uncorrected_errors": 0, + "device_sda_type_scsi_scsi_error_log_verify_total_errors_corrected": 0, + "device_sda_type_scsi_scsi_error_log_verify_total_uncorrected_errors": 0, + "device_sda_type_scsi_scsi_error_log_write_total_errors_corrected": 0, + "device_sda_type_scsi_scsi_error_log_write_total_uncorrected_errors": 0, + "device_sda_type_scsi_smart_status_failed": 0, + "device_sda_type_scsi_smart_status_passed": 1, + "device_sda_type_scsi_temperature": 34, + }, + }, "error on scan": { prepareMock: prepareMockErrOnScan, }, @@ -303,6 +352,9 @@ func TestSmartctl_Collect(t *testing.T) { for name, test := range tests { t.Run(name, func(t *testing.T) { smart := New() + if test.prepareConfig != nil { + smart.Config = test.prepareConfig() + } mock := test.prepareMock() smart.exec = mock smart.ScanEvery = web.Duration(time.Microsecond * 1) @@ -367,6 +419,26 @@ func prepareMockOkTypeNvme() *mockSmartctlCliExec { switch deviceName { case "/dev/nvme0": return dataTypeNvmeDeviceNvme0, nil + case "/dev/nvme1": + return dataTypeNvmeDeviceNvme1, nil + default: + return nil, fmt.Errorf("unexpected device name %s", deviceName) + } + }, + } +} + +func prepareMockOkTypeScsi() *mockSmartctlCliExec { + return &mockSmartctlCliExec{ + errOnScan: false, + scanData: dataTypeScsiScan, + deviceDataFunc: func(deviceName, deviceType, powerMode string) ([]byte, error) { + if deviceType != "scsi" { + return nil, fmt.Errorf("unexpected device type %s", deviceType) + } + switch deviceName { + case "/dev/sda": + return dataTypeScsiDeviceSda, nil default: return nil, fmt.Errorf("unexpected device name %s", deviceName) } @@ -397,7 +469,7 @@ type mockSmartctlCliExec struct { deviceDataFunc func(deviceName, deviceType, powerMode string) ([]byte, error) } -func (m *mockSmartctlCliExec) scan() (*gjson.Result, error) { +func (m *mockSmartctlCliExec) scan(_ bool) (*gjson.Result, error) { if m.errOnScan { return nil, fmt.Errorf("mock.scan() error") } diff --git a/src/go/collectors/go.d.plugin/modules/smartctl/testdata/config.json b/src/go/plugin/go.d/modules/smartctl/testdata/config.json index ed26105ee..41c69da51 100644 --- a/src/go/collectors/go.d.plugin/modules/smartctl/testdata/config.json +++ b/src/go/plugin/go.d/modules/smartctl/testdata/config.json @@ -4,5 +4,11 @@ "scan_every": 123.123, "poll_devices_every": 123.123, "no_check_power_mode": "ok", - "device_selector": "ok" + "device_selector": "ok", + "extra_devices": [ + { + "name": "ok", + "type": "ok" + } + ] } diff --git a/src/go/collectors/go.d.plugin/modules/smartctl/testdata/config.yaml b/src/go/plugin/go.d/modules/smartctl/testdata/config.yaml index 94c9b0acd..b0b77d53d 100644 --- a/src/go/collectors/go.d.plugin/modules/smartctl/testdata/config.yaml +++ b/src/go/plugin/go.d/modules/smartctl/testdata/config.yaml @@ -3,4 +3,7 @@ timeout: 123.123 scan_every: 123.123 poll_devices_every: 123.123 no_check_power_mode: "ok" -"device_selector": "ok" +device_selector: "ok" +extra_devices: + - name: "ok" + type: "ok" diff --git a/src/go/collectors/go.d.plugin/modules/smartctl/testdata/type-nvme/device-nvme0.json b/src/go/plugin/go.d/modules/smartctl/testdata/type-nvme/device-nvme0.json index 1b31d322d..1b31d322d 100644 --- a/src/go/collectors/go.d.plugin/modules/smartctl/testdata/type-nvme/device-nvme0.json +++ b/src/go/plugin/go.d/modules/smartctl/testdata/type-nvme/device-nvme0.json diff --git a/src/go/plugin/go.d/modules/smartctl/testdata/type-nvme/device-nvme1.json b/src/go/plugin/go.d/modules/smartctl/testdata/type-nvme/device-nvme1.json new file mode 100644 index 000000000..37faf7cfe --- /dev/null +++ b/src/go/plugin/go.d/modules/smartctl/testdata/type-nvme/device-nvme1.json @@ -0,0 +1,113 @@ +{ + "json_format_version": [ + 1, + 0 + ], + "smartctl": { + "version": [ + 7, + 3 + ], + "svn_revision": "5338", + "platform_info": "REDACTED", + "build_info": "(local build)", + "argv": [ + "smartctl", + "--json", + "--all", + "/dev/nvme1", + "--device", + "nvme" + ], + "exit_status": 0 + }, + "local_time": { + "time_t": 1720897758, + "asctime": "Sat Jul 13 22:09:18 2024 EEST" + }, + "device": { + "name": "/dev/nvme1", + "info_name": "/dev/nvme1", + "type": "nvme", + "protocol": "NVMe" + }, + "model_name": "Seagate FireCuda 530 ZP4000GM30023", + "serial_number": "REDACTED", + "firmware_version": "REDACTED", + "nvme_pci_vendor": { + "id": 7089, + "subsystem_id": 7089 + }, + "nvme_ieee_oui_identifier": 6584743, + "nvme_total_capacity": 4000787030016, + "nvme_unallocated_capacity": 0, + "nvme_controller_id": 1, + "nvme_version": { + "string": "1.4", + "value": 66560 + }, + "nvme_number_of_namespaces": 1, + "nvme_namespaces": [ + { + "id": 1, + "size": { + "blocks": 7814037168, + "bytes": 4000787030016 + }, + "capacity": { + "blocks": 7814037168, + "bytes": 4000787030016 + }, + "utilization": { + "blocks": 7814037168, + "bytes": 4000787030016 + }, + "formatted_lba_size": 512, + "eui64": { + "oui": 6584743, + "ext_id": 553497146765 + } + } + ], + "user_capacity": { + "blocks": 7814037168, + "bytes": 4000787030016 + }, + "logical_block_size": 512, + "smart_support": { + "available": true, + "enabled": true + }, + "smart_status": { + "passed": true, + "nvme": { + "value": 0 + } + }, + "nvme_smart_health_information_log": { + "critical_warning": 0, + "temperature": 36, + "available_spare": 100, + "available_spare_threshold": 5, + "percentage_used": 0, + "data_units_read": 202, + "data_units_written": 0, + "host_reads": 2509, + "host_writes": 0, + "controller_busy_time": 0, + "power_cycles": 5, + "power_on_hours": 4733, + "unsafe_shutdowns": 2, + "media_errors": 0, + "num_err_log_entries": 20, + "warning_temp_time": 0, + "critical_comp_time": 0 + }, + "temperature": { + "current": 36 + }, + "power_cycle_count": 5, + "power_on_time": { + "hours": 4733 + } +} diff --git a/src/go/collectors/go.d.plugin/modules/smartctl/testdata/type-nvme/scan.json b/src/go/plugin/go.d/modules/smartctl/testdata/type-nvme/scan.json index b9f716cbd..b9f716cbd 100644 --- a/src/go/collectors/go.d.plugin/modules/smartctl/testdata/type-nvme/scan.json +++ b/src/go/plugin/go.d/modules/smartctl/testdata/type-nvme/scan.json diff --git a/src/go/collectors/go.d.plugin/modules/smartctl/testdata/type-sat/device-hdd-sda.json b/src/go/plugin/go.d/modules/smartctl/testdata/type-sat/device-hdd-sda.json index 55cfe15f5..55cfe15f5 100644 --- a/src/go/collectors/go.d.plugin/modules/smartctl/testdata/type-sat/device-hdd-sda.json +++ b/src/go/plugin/go.d/modules/smartctl/testdata/type-sat/device-hdd-sda.json diff --git a/src/go/collectors/go.d.plugin/modules/smartctl/testdata/type-sat/device-ssd-sdc.json b/src/go/plugin/go.d/modules/smartctl/testdata/type-sat/device-ssd-sdc.json index a2d8f0aaf..a2d8f0aaf 100644 --- a/src/go/collectors/go.d.plugin/modules/smartctl/testdata/type-sat/device-ssd-sdc.json +++ b/src/go/plugin/go.d/modules/smartctl/testdata/type-sat/device-ssd-sdc.json diff --git a/src/go/collectors/go.d.plugin/modules/smartctl/testdata/type-sat/scan.json b/src/go/plugin/go.d/modules/smartctl/testdata/type-sat/scan.json index c7a68ca8d..c7a68ca8d 100644 --- a/src/go/collectors/go.d.plugin/modules/smartctl/testdata/type-sat/scan.json +++ b/src/go/plugin/go.d/modules/smartctl/testdata/type-sat/scan.json diff --git a/src/go/plugin/go.d/modules/smartctl/testdata/type-scsi/device-sda.json b/src/go/plugin/go.d/modules/smartctl/testdata/type-scsi/device-sda.json new file mode 100644 index 000000000..0ab55d2c9 --- /dev/null +++ b/src/go/plugin/go.d/modules/smartctl/testdata/type-scsi/device-sda.json @@ -0,0 +1,128 @@ +{ + "json_format_version": [ + 1, + 0 + ], + "smartctl": { + "version": [ + 7, + 3 + ], + "svn_revision": "5338", + "platform_info": "REDACTED", + "build_info": "(local build)", + "argv": [ + "smartctl", + "--json", + "--all", + "/dev/sda", + "--device", + "scsi" + ], + "exit_status": 0 + }, + "local_time": { + "time_t": 1720689199, + "asctime": "Thu Jul 11 09:13:19 2024 UTC" + }, + "device": { + "name": "/dev/sda", + "info_name": "/dev/sda", + "type": "scsi", + "protocol": "SCSI" + }, + "scsi_vendor": "HGST", + "scsi_product": "REDACTED", + "scsi_model_name": "REDACTED", + "scsi_revision": "REDACTED", + "scsi_version": "REDACTED", + "user_capacity": { + "blocks": 7814037168, + "bytes": 4000787030016 + }, + "logical_block_size": 512, + "scsi_lb_provisioning": { + "name": "fully provisioned", + "value": 0, + "management_enabled": { + "name": "LBPME", + "value": 0 + }, + "read_zeros": { + "name": "LBPRZ", + "value": 0 + } + }, + "rotation_rate": 7200, + "form_factor": { + "scsi_value": 2, + "name": "3.5 inches" + }, + "logical_unit_id": "REDACTED", + "serial_number": "REDACTED", + "device_type": { + "scsi_terminology": "Peripheral Device Type [PDT]", + "scsi_value": 0, + "name": "disk" + }, + "scsi_transport_protocol": { + "name": "SAS (SPL-4)", + "value": 6 + }, + "smart_support": { + "available": true, + "enabled": true + }, + "temperature_warning": { + "enabled": true + }, + "smart_status": { + "passed": true + }, + "temperature": { + "current": 34, + "drive_trip": 85 + }, + "power_on_time": { + "hours": 1641, + "minutes": 22 + }, + "scsi_start_stop_cycle_counter": { + "year_of_manufacture": "2013", + "week_of_manufacture": "51", + "specified_cycle_count_over_device_lifetime": 50000, + "accumulated_start_stop_cycles": 4, + "specified_load_unload_count_over_device_lifetime": 600000, + "accumulated_load_unload_cycles": 119 + }, + "scsi_grown_defect_list": 0, + "scsi_error_counter_log": { + "read": { + "errors_corrected_by_eccfast": 647707, + "errors_corrected_by_eccdelayed": 29, + "errors_corrected_by_rereads_rewrites": 0, + "total_errors_corrected": 647736, + "correction_algorithm_invocations": 586730, + "gigabytes_processed": "36537.378", + "total_uncorrected_errors": 0 + }, + "write": { + "errors_corrected_by_eccfast": 0, + "errors_corrected_by_eccdelayed": 0, + "errors_corrected_by_rereads_rewrites": 0, + "total_errors_corrected": 0, + "correction_algorithm_invocations": 13549, + "gigabytes_processed": "2811.293", + "total_uncorrected_errors": 0 + }, + "verify": { + "errors_corrected_by_eccfast": 0, + "errors_corrected_by_eccdelayed": 0, + "errors_corrected_by_rereads_rewrites": 0, + "total_errors_corrected": 0, + "correction_algorithm_invocations": 2146, + "gigabytes_processed": "0.000", + "total_uncorrected_errors": 0 + } + } +} diff --git a/src/go/plugin/go.d/modules/smartctl/testdata/type-scsi/scan.json b/src/go/plugin/go.d/modules/smartctl/testdata/type-scsi/scan.json new file mode 100644 index 000000000..398f5f4af --- /dev/null +++ b/src/go/plugin/go.d/modules/smartctl/testdata/type-scsi/scan.json @@ -0,0 +1,29 @@ +{ + "json_format_version": [ + 1, + 0 + ], + "smartctl": { + "version": [ + 7, + 3 + ], + "svn_revision": "5338", + "platform_info": "REDACTED", + "build_info": "(local build)", + "argv": [ + "smartctl", + "--scan", + "--json" + ], + "exit_status": 0 + }, + "devices": [ + { + "name": "/dev/sda", + "info_name": "/dev/sda", + "type": "scsi", + "protocol": "SCSI" + } + ] +} diff --git a/src/go/collectors/go.d.plugin/modules/snmp/README.md b/src/go/plugin/go.d/modules/snmp/README.md index edf223bf9..edf223bf9 120000 --- a/src/go/collectors/go.d.plugin/modules/snmp/README.md +++ b/src/go/plugin/go.d/modules/snmp/README.md diff --git a/src/go/plugin/go.d/modules/snmp/charts.go b/src/go/plugin/go.d/modules/snmp/charts.go new file mode 100644 index 000000000..dd31f1cc7 --- /dev/null +++ b/src/go/plugin/go.d/modules/snmp/charts.go @@ -0,0 +1,309 @@ +// SPDX-License-Identifier: GPL-3.0-or-later + +package snmp + +import ( + "fmt" + "strings" + + "github.com/netdata/netdata/go/plugins/plugin/go.d/agent/module" +) + +const ( + prioNetIfaceTraffic = module.Priority + iota + prioNetIfaceUnicast + prioNetIfaceMulticast + prioNetIfaceBroadcast + prioNetIfaceErrors + prioNetIfaceDiscards + prioNetIfaceAdminStatus + prioNetIfaceOperStatus + prioSysUptime +) + +var netIfaceChartsTmpl = module.Charts{ + netIfaceTrafficChartTmpl.Copy(), + netIfacePacketsChartTmpl.Copy(), + netIfaceMulticastChartTmpl.Copy(), + netIfaceBroadcastChartTmpl.Copy(), + netIfaceErrorsChartTmpl.Copy(), + netIfaceDiscardsChartTmpl.Copy(), + netIfaceAdminStatusChartTmpl.Copy(), + netIfaceOperStatusChartTmpl.Copy(), +} + +var ( + netIfaceTrafficChartTmpl = module.Chart{ + ID: "snmp_device_net_iface_%s_traffic", + Title: "SNMP device network interface traffic", + Units: "kilobits/s", + Fam: "traffic", + Ctx: "snmp.device_net_interface_traffic", + Priority: prioNetIfaceTraffic, + Type: module.Area, + Dims: module.Dims{ + {ID: "net_iface_%s_traffic_in", Name: "received", Algo: module.Incremental}, + {ID: "net_iface_%s_traffic_out", Name: "sent", Mul: -1, Algo: module.Incremental}, + }, + } + + netIfacePacketsChartTmpl = module.Chart{ + ID: "snmp_device_net_iface_%s_unicast", + Title: "SNMP device network interface unicast packets", + Units: "packets/s", + Fam: "packets", + Ctx: "snmp.device_net_interface_unicast", + Priority: prioNetIfaceUnicast, + Dims: module.Dims{ + {ID: "net_iface_%s_ucast_in", Name: "received", Algo: module.Incremental}, + {ID: "net_iface_%s_ucast_out", Name: "sent", Mul: -1, Algo: module.Incremental}, + }, + } + netIfaceMulticastChartTmpl = module.Chart{ + ID: "snmp_device_net_iface_%s_multicast", + Title: "SNMP device network interface multicast packets", + Units: "packets/s", + Fam: "packets", + Ctx: "snmp.device_net_interface_multicast", + Priority: prioNetIfaceMulticast, + Dims: module.Dims{ + {ID: "net_iface_%s_mcast_in", Name: "received", Algo: module.Incremental}, + {ID: "net_iface_%s_mcast_out", Name: "sent", Mul: -1, Algo: module.Incremental}, + }, + } + netIfaceBroadcastChartTmpl = module.Chart{ + ID: "snmp_device_net_iface_%s_broadcast", + Title: "SNMP device network interface broadcast packets", + Units: "packets/s", + Fam: "packets", + Ctx: "snmp.device_net_interface_broadcast", + Priority: prioNetIfaceBroadcast, + Dims: module.Dims{ + {ID: "net_iface_%s_bcast_in", Name: "received", Algo: module.Incremental}, + {ID: "net_iface_%s_bcast_out", Name: "sent", Mul: -1, Algo: module.Incremental}, + }, + } + + netIfaceErrorsChartTmpl = module.Chart{ + ID: "snmp_device_net_iface_%s_errors", + Title: "SNMP device network interface errors", + Units: "errors/s", + Fam: "errors", + Ctx: "snmp.device_net_interface_errors", + Priority: prioNetIfaceErrors, + Dims: module.Dims{ + {ID: "net_iface_%s_errors_in", Name: "inbound", Algo: module.Incremental}, + {ID: "net_iface_%s_errors_out", Name: "outbound", Mul: -1, Algo: module.Incremental}, + }, + } + + netIfaceDiscardsChartTmpl = module.Chart{ + ID: "snmp_device_net_iface_%s_discards", + Title: "SNMP device network interface discards", + Units: "discards/s", + Fam: "discards", + Ctx: "snmp.device_net_interface_discards", + Priority: prioNetIfaceDiscards, + Dims: module.Dims{ + {ID: "net_iface_%s_discards_in", Name: "inbound", Algo: module.Incremental}, + {ID: "net_iface_%s_discards_out", Name: "outbound", Mul: -1, Algo: module.Incremental}, + }, + } + + netIfaceAdminStatusChartTmpl = module.Chart{ + ID: "snmp_device_net_iface_%s_admin_status", + Title: "SNMP device network interface administrative status", + Units: "status", + Fam: "status", + Ctx: "snmp.device_net_interface_admin_status", + Priority: prioNetIfaceAdminStatus, + Dims: module.Dims{ + {ID: "net_iface_%s_admin_status_up", Name: "up"}, + {ID: "net_iface_%s_admin_status_down", Name: "down"}, + {ID: "net_iface_%s_admin_status_testing", Name: "testing"}, + }, + } + netIfaceOperStatusChartTmpl = module.Chart{ + ID: "snmp_device_net_iface_%s_oper_status", + Title: "SNMP device network interface operational status", + Units: "status", + Fam: "status", + Ctx: "snmp.device_net_interface_oper_status", + Priority: prioNetIfaceOperStatus, + Dims: module.Dims{ + {ID: "net_iface_%s_oper_status_up", Name: "up"}, + {ID: "net_iface_%s_oper_status_down", Name: "down"}, + {ID: "net_iface_%s_oper_status_testing", Name: "testing"}, + {ID: "net_iface_%s_oper_status_unknown", Name: "unknown"}, + {ID: "net_iface_%s_oper_status_dormant", Name: "dormant"}, + {ID: "net_iface_%s_oper_status_notPresent", Name: "not_present"}, + {ID: "net_iface_%s_oper_status_lowerLayerDown", Name: "lower_layer_down"}, + }, + } +) + +var ( + uptimeChart = module.Chart{ + ID: "snmp_device_uptime", + Title: "SNMP device uptime", + Units: "seconds", + Fam: "uptime", + Ctx: "snmp.device_uptime", + Priority: prioSysUptime, + Dims: module.Dims{ + {ID: "uptime", Name: "uptime"}, + }, + } +) + +func (s *SNMP) addNetIfaceCharts(iface *netInterface) { + charts := netIfaceChartsTmpl.Copy() + + for _, chart := range *charts { + chart.ID = fmt.Sprintf(chart.ID, cleanIfaceName(iface.ifName)) + chart.Labels = []module.Label{ + {Key: "sysName", Value: s.sysName}, + {Key: "ifDescr", Value: iface.ifDescr}, + {Key: "ifName", Value: iface.ifName}, + {Key: "ifType", Value: ifTypeMapping[iface.ifType]}, + } + for _, dim := range chart.Dims { + dim.ID = fmt.Sprintf(dim.ID, iface.ifName) + } + } + + if err := s.Charts().Add(*charts...); err != nil { + s.Warning(err) + } +} + +func (s *SNMP) removeNetIfaceCharts(iface *netInterface) { + px := fmt.Sprintf("snmp_device_net_iface_%s_", cleanIfaceName(iface.ifName)) + for _, chart := range *s.Charts() { + if strings.HasPrefix(chart.ID, px) { + chart.MarkRemove() + chart.MarkNotCreated() + } + } +} + +func (s *SNMP) addSysUptimeChart() { + chart := uptimeChart.Copy() + chart.Labels = []module.Label{ + {Key: "sysName", Value: s.sysName}, + } + if err := s.Charts().Add(chart); err != nil { + s.Warning(err) + } +} + +func cleanIfaceName(name string) string { + r := strings.NewReplacer(".", "_", " ", "_") + return r.Replace(name) +} + +func newUserInputCharts(configs []ChartConfig) (*module.Charts, error) { + charts := &module.Charts{} + for _, cfg := range configs { + if len(cfg.IndexRange) == 2 { + cs, err := newUserInputChartsFromIndexRange(cfg) + if err != nil { + return nil, err + } + if err := charts.Add(*cs...); err != nil { + return nil, err + } + } else { + chart, err := newUserInputChart(cfg) + if err != nil { + return nil, err + } + if err = charts.Add(chart); err != nil { + return nil, err + } + } + } + return charts, nil +} + +func newUserInputChartsFromIndexRange(cfg ChartConfig) (*module.Charts, error) { + var addPrio int + charts := &module.Charts{} + for i := cfg.IndexRange[0]; i <= cfg.IndexRange[1]; i++ { + chart, err := newUserInputChartWithOIDIndex(i, cfg) + if err != nil { + return nil, err + } + chart.Priority += addPrio + addPrio += 1 + if err = charts.Add(chart); err != nil { + return nil, err + } + } + return charts, nil +} + +func newUserInputChartWithOIDIndex(oidIndex int, cfg ChartConfig) (*module.Chart, error) { + chart, err := newUserInputChart(cfg) + if err != nil { + return nil, err + } + + chart.ID = fmt.Sprintf("%s_%d", chart.ID, oidIndex) + chart.Title = fmt.Sprintf("%s %d", chart.Title, oidIndex) + for _, dim := range chart.Dims { + dim.ID = fmt.Sprintf("%s.%d", dim.ID, oidIndex) + } + + return chart, nil +} + +func newUserInputChart(cfg ChartConfig) (*module.Chart, error) { + chart := &module.Chart{ + ID: cfg.ID, + Title: cfg.Title, + Units: cfg.Units, + Fam: cfg.Family, + Ctx: fmt.Sprintf("snmp.%s", cfg.ID), + Type: module.ChartType(cfg.Type), + Priority: cfg.Priority, + } + + if chart.Title == "" { + chart.Title = "Untitled chart" + } + if chart.Units == "" { + chart.Units = "num" + } + if chart.Priority < module.Priority { + chart.Priority += module.Priority + } + + seen := make(map[string]struct{}) + var a string + for _, cfg := range cfg.Dimensions { + if cfg.Algorithm != "" { + seen[cfg.Algorithm] = struct{}{} + a = cfg.Algorithm + } + dim := &module.Dim{ + ID: strings.TrimPrefix(cfg.OID, "."), + Name: cfg.Name, + Algo: module.DimAlgo(cfg.Algorithm), + Mul: cfg.Multiplier, + Div: cfg.Divisor, + } + if err := chart.AddDim(dim); err != nil { + return nil, err + } + } + if len(seen) == 1 && a != "" && len(chart.Dims) > 1 { + for _, d := range chart.Dims { + if d.Algo == "" { + d.Algo = module.DimAlgo(a) + } + } + } + + return chart, nil +} diff --git a/src/go/plugin/go.d/modules/snmp/collect.go b/src/go/plugin/go.d/modules/snmp/collect.go new file mode 100644 index 000000000..24cc49dbc --- /dev/null +++ b/src/go/plugin/go.d/modules/snmp/collect.go @@ -0,0 +1,395 @@ +// SPDX-License-Identifier: GPL-3.0-or-later + +package snmp + +import ( + "errors" + "fmt" + "log/slog" + "sort" + "strings" + + "github.com/netdata/netdata/go/plugins/logger" + + "github.com/gosnmp/gosnmp" +) + +const ( + oidSysUptime = "1.3.6.1.2.1.1.3.0" + oidSysName = "1.3.6.1.2.1.1.5.0" + rootOidIfMibIfTable = "1.3.6.1.2.1.2.2" + rootOidIfMibIfXTable = "1.3.6.1.2.1.31.1.1" +) + +func (s *SNMP) collect() (map[string]int64, error) { + if s.sysName == "" { + sysName, err := s.getSysName() + if err != nil { + return nil, err + } + s.sysName = sysName + s.addSysUptimeChart() + } + + mx := make(map[string]int64) + + if err := s.collectSysUptime(mx); err != nil { + return nil, err + } + + if s.collectIfMib { + if err := s.collectNetworkInterfaces(mx); err != nil { + return nil, err + } + } + + if len(s.oids) > 0 { + if err := s.collectOIDs(mx); err != nil { + return nil, err + } + } + + return mx, nil +} + +func (s *SNMP) getSysName() (string, error) { + resp, err := s.snmpClient.Get([]string{oidSysName}) + if err != nil { + return "", err + } + if len(resp.Variables) == 0 { + return "", errors.New("no system name") + } + return pduToString(resp.Variables[0]) +} + +func (s *SNMP) collectSysUptime(mx map[string]int64) error { + resp, err := s.snmpClient.Get([]string{oidSysUptime}) + if err != nil { + return err + } + if len(resp.Variables) == 0 { + return errors.New("no system uptime") + } + v, err := pduToInt(resp.Variables[0]) + if err != nil { + return err + } + + mx["uptime"] = v / 100 // the time is in hundredths of a second + + return nil +} + +func (s *SNMP) collectNetworkInterfaces(mx map[string]int64) error { + if s.checkMaxReps { + ok, err := s.adjustMaxRepetitions() + if err != nil { + return err + } + + s.checkMaxReps = false + + if !ok { + s.collectIfMib = false + + if len(s.oids) == 0 { + return errors.New("no IF-MIB data returned") + } + + s.Warning("no IF-MIB data returned") + return nil + } + } + + ifMibTable, err := s.walkAll(rootOidIfMibIfTable) + if err != nil { + return err + } + + ifMibXTable, err := s.walkAll(rootOidIfMibIfXTable) + if err != nil { + return err + } + + if len(ifMibTable) == 0 && len(ifMibXTable) == 0 { + s.Warning("no IF-MIB data returned") + s.collectIfMib = false + return nil + } + + for _, i := range s.netInterfaces { + i.updated = false + } + + pdus := make([]gosnmp.SnmpPDU, 0, len(ifMibTable)+len(ifMibXTable)) + pdus = append(pdus, ifMibTable...) + pdus = append(pdus, ifMibXTable...) + + for _, pdu := range pdus { + i := strings.LastIndexByte(pdu.Name, '.') + if i == -1 { + continue + } + + idx := pdu.Name[i+1:] + oid := strings.TrimPrefix(pdu.Name[:i], ".") + + iface, ok := s.netInterfaces[idx] + if !ok { + iface = &netInterface{idx: idx} + } + + switch oid { + case oidIfIndex: + iface.ifIndex, err = pduToInt(pdu) + case oidIfDescr: + iface.ifDescr, err = pduToString(pdu) + case oidIfType: + iface.ifType, err = pduToInt(pdu) + case oidIfMtu: + iface.ifMtu, err = pduToInt(pdu) + case oidIfSpeed: + iface.ifSpeed, err = pduToInt(pdu) + case oidIfAdminStatus: + iface.ifAdminStatus, err = pduToInt(pdu) + case oidIfOperStatus: + iface.ifOperStatus, err = pduToInt(pdu) + case oidIfInOctets: + iface.ifInOctets, err = pduToInt(pdu) + case oidIfInUcastPkts: + iface.ifInUcastPkts, err = pduToInt(pdu) + case oidIfInNUcastPkts: + iface.ifInNUcastPkts, err = pduToInt(pdu) + case oidIfInDiscards: + iface.ifInDiscards, err = pduToInt(pdu) + case oidIfInErrors: + iface.ifInErrors, err = pduToInt(pdu) + case oidIfInUnknownProtos: + iface.ifInUnknownProtos, err = pduToInt(pdu) + case oidIfOutOctets: + iface.ifOutOctets, err = pduToInt(pdu) + case oidIfOutUcastPkts: + iface.ifOutUcastPkts, err = pduToInt(pdu) + case oidIfOutNUcastPkts: + iface.ifOutNUcastPkts, err = pduToInt(pdu) + case oidIfOutDiscards: + iface.ifOutDiscards, err = pduToInt(pdu) + case oidIfOutErrors: + iface.ifOutErrors, err = pduToInt(pdu) + case oidIfName: + iface.ifName, err = pduToString(pdu) + case oidIfInMulticastPkts: + iface.ifInMulticastPkts, err = pduToInt(pdu) + case oidIfInBroadcastPkts: + iface.ifInBroadcastPkts, err = pduToInt(pdu) + case oidIfOutMulticastPkts: + iface.ifOutMulticastPkts, err = pduToInt(pdu) + case oidIfOutBroadcastPkts: + iface.ifOutBroadcastPkts, err = pduToInt(pdu) + case oidIfHCInOctets: + iface.ifHCInOctets, err = pduToInt(pdu) + case oidIfHCInUcastPkts: + iface.ifHCInUcastPkts, err = pduToInt(pdu) + case oidIfHCInMulticastPkts: + iface.ifHCInMulticastPkts, err = pduToInt(pdu) + case oidIfHCInBroadcastPkts: + iface.ifHCInBroadcastPkts, err = pduToInt(pdu) + case oidIfHCOutOctets: + iface.ifHCOutOctets, err = pduToInt(pdu) + case oidIfHCOutUcastPkts: + iface.ifHCOutUcastPkts, err = pduToInt(pdu) + case oidIfHCOutMulticastPkts: + iface.ifHCOutMulticastPkts, err = pduToInt(pdu) + case oidIfHCOutBroadcastPkts: + iface.ifHCOutMulticastPkts, err = pduToInt(pdu) + case oidIfHighSpeed: + iface.ifHighSpeed, err = pduToInt(pdu) + case oidIfAlias: + iface.ifAlias, err = pduToString(pdu) + default: + continue + } + + if err != nil { + return fmt.Errorf("OID '%s': %v", pdu.Name, err) + } + + s.netInterfaces[idx] = iface + iface.updated = true + } + + for _, iface := range s.netInterfaces { + if iface.ifName == "" { + continue + } + + typeStr := ifTypeMapping[iface.ifType] + if s.netIfaceFilterByName.MatchString(iface.ifName) || s.netIfaceFilterByType.MatchString(typeStr) { + continue + } + + if !iface.updated { + delete(s.netInterfaces, iface.idx) + if iface.hasCharts { + s.removeNetIfaceCharts(iface) + } + continue + } + if !iface.hasCharts { + iface.hasCharts = true + s.addNetIfaceCharts(iface) + } + + px := fmt.Sprintf("net_iface_%s_", iface.ifName) + mx[px+"traffic_in"] = iface.ifHCInOctets * 8 / 1000 // kilobits + mx[px+"traffic_out"] = iface.ifHCOutOctets * 8 / 1000 // kilobits + mx[px+"ucast_in"] = iface.ifHCInUcastPkts + mx[px+"ucast_out"] = iface.ifHCOutUcastPkts + mx[px+"mcast_in"] = iface.ifHCInMulticastPkts + mx[px+"mcast_out"] = iface.ifHCOutMulticastPkts + mx[px+"bcast_in"] = iface.ifHCInBroadcastPkts + mx[px+"bcast_out"] = iface.ifHCOutBroadcastPkts + mx[px+"errors_in"] = iface.ifInErrors + mx[px+"errors_out"] = iface.ifOutErrors + mx[px+"discards_in"] = iface.ifInDiscards + mx[px+"discards_out"] = iface.ifOutDiscards + + for _, v := range ifAdminStatusMapping { + mx[px+"admin_status_"+v] = 0 + } + mx[px+"admin_status_"+ifAdminStatusMapping[iface.ifAdminStatus]] = 1 + + for _, v := range ifOperStatusMapping { + mx[px+"oper_status_"+v] = 0 + } + mx[px+"oper_status_"+ifOperStatusMapping[iface.ifOperStatus]] = 1 + } + + if logger.Level.Enabled(slog.LevelDebug) { + ifaces := make([]*netInterface, 0, len(s.netInterfaces)) + for _, nif := range s.netInterfaces { + ifaces = append(ifaces, nif) + } + sort.Slice(ifaces, func(i, j int) bool { return ifaces[i].ifIndex < ifaces[j].ifIndex }) + for _, iface := range ifaces { + s.Debugf("found %s", iface) + } + } + + return nil +} + +func (s *SNMP) adjustMaxRepetitions() (bool, error) { + orig := s.Config.Options.MaxRepetitions + maxReps := s.Config.Options.MaxRepetitions + + for { + v, err := s.walkAll(oidIfIndex) + if err != nil { + return false, err + } + + if len(v) > 0 { + if orig != maxReps { + s.Infof("changed 'max_repetitions' %d => %d", orig, maxReps) + } + return true, nil + } + + if maxReps > 5 { + maxReps = max(5, maxReps-5) + } else { + maxReps-- + } + + if maxReps <= 0 { + return false, nil + } + + s.Debugf("no IF-MIB data returned, trying to decrese 'max_repetitions' to %d", maxReps) + s.snmpClient.SetMaxRepetitions(uint32(maxReps)) + } +} + +func (s *SNMP) walkAll(rootOid string) ([]gosnmp.SnmpPDU, error) { + if s.snmpClient.Version() == gosnmp.Version1 { + return s.snmpClient.WalkAll(rootOid) + } + return s.snmpClient.BulkWalkAll(rootOid) +} + +func pduToString(pdu gosnmp.SnmpPDU) (string, error) { + switch pdu.Type { + case gosnmp.OctetString: + // TODO: this isn't reliable (e.g. physAddress we need hex.EncodeToString()) + bs, ok := pdu.Value.([]byte) + if !ok { + return "", fmt.Errorf("OctetString is not a []byte but %T", pdu.Value) + } + return strings.ToValidUTF8(string(bs), "�"), nil + case gosnmp.Counter32, gosnmp.Counter64, gosnmp.Integer, gosnmp.Gauge32: + return gosnmp.ToBigInt(pdu.Value).String(), nil + default: + return "", fmt.Errorf("unussported type: '%v'", pdu.Type) + } +} + +func pduToInt(pdu gosnmp.SnmpPDU) (int64, error) { + switch pdu.Type { + case gosnmp.Counter32, gosnmp.Counter64, gosnmp.Integer, gosnmp.Gauge32, gosnmp.TimeTicks: + return gosnmp.ToBigInt(pdu.Value).Int64(), nil + default: + return 0, fmt.Errorf("unussported type: '%v'", pdu.Type) + } +} + +//func physAddressToString(pdu gosnmp.SnmpPDU) (string, error) { +// address, ok := pdu.Value.([]uint8) +// if !ok { +// return "", errors.New("physAddress is not a []uint8") +// } +// parts := make([]string, 0, 6) +// for _, v := range address { +// parts = append(parts, fmt.Sprintf("%02X", v)) +// } +// return strings.Join(parts, ":"), nil +//} + +func (s *SNMP) collectOIDs(mx map[string]int64) error { + for i, end := 0, 0; i < len(s.oids); i += s.Options.MaxOIDs { + if end = i + s.Options.MaxOIDs; end > len(s.oids) { + end = len(s.oids) + } + + oids := s.oids[i:end] + resp, err := s.snmpClient.Get(oids) + if err != nil { + s.Errorf("cannot get SNMP data: %v", err) + return err + } + + for i, oid := range oids { + if i >= len(resp.Variables) { + continue + } + + switch v := resp.Variables[i]; v.Type { + case gosnmp.Boolean, + gosnmp.Counter32, + gosnmp.Counter64, + gosnmp.Gauge32, + gosnmp.TimeTicks, + gosnmp.Uinteger32, + gosnmp.OpaqueFloat, + gosnmp.OpaqueDouble, + gosnmp.Integer: + mx[oid] = gosnmp.ToBigInt(v.Value).Int64() + default: + s.Debugf("skipping OID '%s' (unsupported type '%s')", oid, v.Type) + } + } + } + + return nil +} diff --git a/src/go/plugin/go.d/modules/snmp/config.go b/src/go/plugin/go.d/modules/snmp/config.go new file mode 100644 index 000000000..631c47d39 --- /dev/null +++ b/src/go/plugin/go.d/modules/snmp/config.go @@ -0,0 +1,52 @@ +// SPDX-License-Identifier: GPL-3.0-or-later + +package snmp + +type ( + Config struct { + UpdateEvery int `yaml:"update_every,omitempty" json:"update_every"` + Hostname string `yaml:"hostname" json:"hostname"` + Community string `yaml:"community,omitempty" json:"community"` + User User `yaml:"user,omitempty" json:"user"` + Options Options `yaml:"options,omitempty" json:"options"` + ChartsInput []ChartConfig `yaml:"charts,omitempty" json:"charts"` + NetworkInterfaceFilter NetworkInterfaceFilter `yaml:"network_interface_filter,omitempty" json:"network_interface_filter"` + } + NetworkInterfaceFilter struct { + ByName string `yaml:"by_name,omitempty" json:"by_name"` + ByType string `yaml:"by_type,omitempty" json:"by_type"` + } + User struct { + Name string `yaml:"name,omitempty" json:"name"` + SecurityLevel string `yaml:"level,omitempty" json:"level"` + AuthProto string `yaml:"auth_proto,omitempty" json:"auth_proto"` + AuthKey string `yaml:"auth_key,omitempty" json:"auth_key"` + PrivProto string `yaml:"priv_proto,omitempty" json:"priv_proto"` + PrivKey string `yaml:"priv_key,omitempty" json:"priv_key"` + } + Options struct { + Port int `yaml:"port,omitempty" json:"port"` + Retries int `yaml:"retries,omitempty" json:"retries"` + Timeout int `yaml:"timeout,omitempty" json:"timeout"` + Version string `yaml:"version,omitempty" json:"version"` + MaxOIDs int `yaml:"max_request_size,omitempty" json:"max_request_size"` + MaxRepetitions int `yaml:"max_repetitions,omitempty" json:"max_repetitions"` + } + ChartConfig struct { + ID string `yaml:"id" json:"id"` + Title string `yaml:"title" json:"title"` + Units string `yaml:"units" json:"units"` + Family string `yaml:"family" json:"family"` + Type string `yaml:"type" json:"type"` + Priority int `yaml:"priority" json:"priority"` + IndexRange []int `yaml:"multiply_range,omitempty" json:"multiply_range"` + Dimensions []DimensionConfig `yaml:"dimensions" json:"dimensions"` + } + DimensionConfig struct { + OID string `yaml:"oid" json:"oid"` + Name string `yaml:"name" json:"name"` + Algorithm string `yaml:"algorithm" json:"algorithm"` + Multiplier int `yaml:"multiplier" json:"multiplier"` + Divisor int `yaml:"divisor" json:"divisor"` + } +) diff --git a/src/go/collectors/go.d.plugin/modules/snmp/config_schema.json b/src/go/plugin/go.d/modules/snmp/config_schema.json index a83a2da36..8deb4f6c8 100644 --- a/src/go/collectors/go.d.plugin/modules/snmp/config_schema.json +++ b/src/go/plugin/go.d/modules/snmp/config_schema.json @@ -8,7 +8,7 @@ "description": "Data collection interval, measured in seconds.", "type": "integer", "minimum": 1, - "default": 1 + "default": 10 }, "hostname": { "title": "Hostname", @@ -21,6 +21,26 @@ "type": "string", "default": "public" }, + "network_interface_filter": { + "title": "Network interface filter", + "description": "Configuration for filtering specific network interfaces. If left empty, no interfaces will be filtered. You can filter interfaces by name or type using [simple patterns](/src/libnetdata/simple_pattern/README.md#simple-patterns).", + "type": [ + "object", + "null" + ], + "properties": { + "by_name": { + "title": "By Name", + "description": "Specify the interface name or a pattern to match against the [ifName](https://cric.grenoble.cnrs.fr/Administrateurs/Outils/MIBS/?oid=1.3.6.1.2.1.31.1.1.1.1) label.", + "type": "string" + }, + "by_type": { + "title": "By Type", + "description": "Specify the interface type or a pattern to match against the [ifType](https://cric.grenoble.cnrs.fr/Administrateurs/Outils/MIBS/?oid=1.3.6.1.2.1.2.2.1.3) label.", + "type": "string" + } + } + }, "options": { "title": "Options", "description": "Configuration options for SNMP monitoring.", @@ -46,23 +66,30 @@ "exclusiveMinimum": 0, "default": 161 }, + "timeout": { + "title": "Timeout", + "description": "The timeout duration in seconds for SNMP requests.", + "type": "integer", + "minimum": 1, + "default": 5 + }, "retries": { "title": "Retries", "description": "The number of retries to attempt for SNMP requests.", "type": "integer", "minimum": 0, - "default": 161 + "default": 1 }, - "timeout": { - "title": "Timeout", - "description": "The timeout duration in seconds for SNMP requests.", + "max_repetitions": { + "title": "Max repetitions", + "description": "Controls how many SNMP variables to retrieve in a single GETBULK request.", "type": "integer", "minimum": 1, - "default": 1 + "default": 25 }, "max_request_size": { - "title": "Max OIDs in request", - "description": "The maximum number of OIDs allowed in a single SNMP request.", + "title": "Max OIDs", + "description": "The maximum number of OIDs allowed in a single GET request.", "type": "integer", "minimum": 1, "default": 60 @@ -144,7 +171,6 @@ "null" ], "uniqueItems": true, - "minItems": 1, "items": { "title": "Chart", "type": [ @@ -284,8 +310,7 @@ "required": [ "hostname", "community", - "options", - "charts" + "options" ], "additionalProperties": false, "patternProperties": { @@ -296,15 +321,27 @@ "uiOptions": { "fullPage": true }, + "network_interface_filter": { + "ui:collapsible": true + }, + "community": { + "ui:widget": "password" + }, "options": { "version": { "ui:widget": "radio", "ui:options": { "inline": true } + }, + "max_repetitions": { + "ui:help": "A higher value retrieves more data in fewer round trips, potentially improving efficiency. This reduces network overhead compared to sending multiple individual requests. **Important**: Setting a value too high might cause the target device to return no data." } }, "user": { + "name": { + "ui:widget": "password" + }, "level": { "ui:widget": "radio", "ui:options": { @@ -357,7 +394,13 @@ "fields": [ "update_every", "hostname", - "community", + "community" + ] + }, + { + "title": "Options", + "fields": [ + "network_interface_filter", "options" ] }, diff --git a/src/go/plugin/go.d/modules/snmp/init.go b/src/go/plugin/go.d/modules/snmp/init.go new file mode 100644 index 000000000..acde4b9b8 --- /dev/null +++ b/src/go/plugin/go.d/modules/snmp/init.go @@ -0,0 +1,175 @@ +// SPDX-License-Identifier: GPL-3.0-or-later + +package snmp + +import ( + "errors" + "fmt" + "strings" + "time" + + "github.com/netdata/netdata/go/plugins/plugin/go.d/pkg/matcher" + + "github.com/gosnmp/gosnmp" +) + +func (s *SNMP) validateConfig() error { + if s.Hostname == "" { + return errors.New("SNMP hostname is required") + } + return nil +} + +func (s *SNMP) initSNMPClient() (gosnmp.Handler, error) { + client := s.newSnmpClient() + + client.SetTarget(s.Hostname) + client.SetPort(uint16(s.Options.Port)) + client.SetRetries(s.Options.Retries) + client.SetTimeout(time.Duration(s.Options.Timeout) * time.Second) + client.SetMaxOids(s.Options.MaxOIDs) + client.SetMaxRepetitions(uint32(s.Options.MaxRepetitions)) + + ver := parseSNMPVersion(s.Options.Version) + comm := s.Community + + switch ver { + case gosnmp.Version1: + client.SetCommunity(comm) + client.SetVersion(gosnmp.Version1) + case gosnmp.Version2c: + client.SetCommunity(comm) + client.SetVersion(gosnmp.Version2c) + case gosnmp.Version3: + if s.User.Name == "" { + return nil, errors.New("username is required for SNMPv3") + } + client.SetVersion(gosnmp.Version3) + client.SetSecurityModel(gosnmp.UserSecurityModel) + client.SetMsgFlags(parseSNMPv3SecurityLevel(s.User.SecurityLevel)) + client.SetSecurityParameters(&gosnmp.UsmSecurityParameters{ + UserName: s.User.Name, + AuthenticationProtocol: parseSNMPv3AuthProtocol(s.User.AuthProto), + AuthenticationPassphrase: s.User.AuthKey, + PrivacyProtocol: parseSNMPv3PrivProtocol(s.User.PrivProto), + PrivacyPassphrase: s.User.PrivKey, + }) + default: + return nil, fmt.Errorf("invalid SNMP version: %s", s.Options.Version) + } + + s.Info(snmpClientConnInfo(client)) + + return client, nil +} + +func (s *SNMP) initNetIfaceFilters() (matcher.Matcher, matcher.Matcher, error) { + byName, byType := matcher.FALSE(), matcher.FALSE() + + if v := s.NetworkInterfaceFilter.ByName; v != "" { + m, err := matcher.NewSimplePatternsMatcher(v) + if err != nil { + return nil, nil, err + } + byName = m + } + + if v := s.NetworkInterfaceFilter.ByType; v != "" { + m, err := matcher.NewSimplePatternsMatcher(v) + if err != nil { + return nil, nil, err + } + byType = m + } + + return byName, byType, nil +} + +func (s *SNMP) initOIDs() (oids []string) { + for _, c := range *s.charts { + for _, d := range c.Dims { + oids = append(oids, d.ID) + } + } + return oids +} + +func parseSNMPVersion(version string) gosnmp.SnmpVersion { + switch version { + case "0", "1": + return gosnmp.Version1 + case "2", "2c", "": + return gosnmp.Version2c + case "3": + return gosnmp.Version3 + default: + return gosnmp.Version2c + } +} + +func parseSNMPv3SecurityLevel(level string) gosnmp.SnmpV3MsgFlags { + switch level { + case "1", "none", "noAuthNoPriv", "": + return gosnmp.NoAuthNoPriv + case "2", "authNoPriv": + return gosnmp.AuthNoPriv + case "3", "authPriv": + return gosnmp.AuthPriv + default: + return gosnmp.NoAuthNoPriv + } +} + +func parseSNMPv3AuthProtocol(protocol string) gosnmp.SnmpV3AuthProtocol { + switch protocol { + case "1", "none", "noAuth", "": + return gosnmp.NoAuth + case "2", "md5": + return gosnmp.MD5 + case "3", "sha": + return gosnmp.SHA + case "4", "sha224": + return gosnmp.SHA224 + case "5", "sha256": + return gosnmp.SHA256 + case "6", "sha384": + return gosnmp.SHA384 + case "7", "sha512": + return gosnmp.SHA512 + default: + return gosnmp.NoAuth + } +} + +func parseSNMPv3PrivProtocol(protocol string) gosnmp.SnmpV3PrivProtocol { + switch protocol { + case "1", "none", "noPriv", "": + return gosnmp.NoPriv + case "2", "des": + return gosnmp.DES + case "3", "aes": + return gosnmp.AES + case "4", "aes192": + return gosnmp.AES192 + case "5", "aes256": + return gosnmp.AES256 + case "6", "aes192c": + return gosnmp.AES192C + case "7", "aes256c": + return gosnmp.AES256C + default: + return gosnmp.NoPriv + } +} + +func snmpClientConnInfo(c gosnmp.Handler) string { + var info strings.Builder + info.WriteString(fmt.Sprintf("hostname='%s',port='%d',snmp_version='%s'", c.Target(), c.Port(), c.Version())) + switch c.Version() { + case gosnmp.Version1, gosnmp.Version2c: + info.WriteString(fmt.Sprintf(",community='%s'", c.Community())) + case gosnmp.Version3: + info.WriteString(fmt.Sprintf(",security_level='%d,%s'", c.MsgFlags(), c.SecurityParameters().Description())) + } + return info.String() +} diff --git a/src/go/collectors/go.d.plugin/modules/snmp/integrations/snmp_devices.md b/src/go/plugin/go.d/modules/snmp/integrations/snmp_devices.md index cc15a6960..a2431b006 100644 --- a/src/go/collectors/go.d.plugin/modules/snmp/integrations/snmp_devices.md +++ b/src/go/plugin/go.d/modules/snmp/integrations/snmp_devices.md @@ -1,6 +1,6 @@ <!--startmeta -custom_edit_url: "https://github.com/netdata/netdata/edit/master/src/go/collectors/go.d.plugin/modules/snmp/README.md" -meta_yaml: "https://github.com/netdata/netdata/edit/master/src/go/collectors/go.d.plugin/modules/snmp/metadata.yaml" +custom_edit_url: "https://github.com/netdata/netdata/edit/master/src/go/plugin/go.d/modules/snmp/README.md" +meta_yaml: "https://github.com/netdata/netdata/edit/master/src/go/plugin/go.d/modules/snmp/metadata.yaml" sidebar_label: "SNMP devices" learn_status: "Published" learn_rel_path: "Collecting Metrics/Generic Collecting Metrics" @@ -21,22 +21,22 @@ Module: snmp ## Overview -This collector monitors any SNMP devices and uses the [gosnmp](https://github.com/gosnmp/gosnmp) package. +This SNMP collector discovers and gathers statistics for network interfaces on SNMP-enabled devices: -It supports: +- Traffic +- Packets (unicast, multicast, broadcast) +- Errors +- Discards +- Administrative and operational status -- all SNMP versions: SNMPv1, SNMPv2c and SNMPv3. -- any number of SNMP devices. -- each SNMP device can be used to collect data for any number of charts. -- each chart may have any number of dimensions. -- each SNMP device may have a different update frequency. -- each SNMP device will accept one or more batches to report values (you can set `max_request_size` per SNMP server, to control the size of batches). +Additionally, it collects overall device uptime. -Keep in mind that many SNMP switches and routers are very slow. They may not be able to report values per second. -`go.d.plugin` reports the time it took for the SNMP device to respond when executed in the debug mode. +It is compatible with all SNMP versions (v1, v2c, and v3) and uses the [gosnmp](https://github.com/gosnmp/gosnmp) package. -Also, if many SNMP clients are used on the same SNMP device at the same time, values may be skipped. -This is a problem of the SNMP device, not this collector. In this case, consider reducing the frequency of data collection (increasing `update_every`). +**For advanced users**: + +- You can manually specify custom OIDs (Object Identifiers) to retrieve specific data points beyond the default metrics. +- However, defining custom charts with dimensions for these OIDs requires manual configuration. @@ -58,39 +58,75 @@ The default configuration for this integration does not impose any limits on dat #### Performance Impact -The default configuration for this integration is not expected to impose a significant performance impact on the system. +**Device limitations**: Many SNMP switches and routers have limited processing power. They might not be able to report data as frequently as desired. You can monitor response times using go.d.plugin in debug mode to identify potential bottlenecks. + +**Concurrent access**: If multiple collectors or tools access the same SNMP device simultaneously, data points might be skipped. This is a limitation of the device itself, not this collector. To mitigate this, consider increasing the collection interval (update_every) to reduce the frequency of requests. + ## Metrics +Metrics grouped by *scope*. + +The scope defines the instance that the metric belongs to. An instance is uniquely identified by a set of labels. + The metrics that will be collected are defined in the configuration file. +### Per snmp device -## Alerts +These metrics refer to the SNMP device. -There are no alerts configured by default for this integration. +Labels: +| Label | Description | +|:-----------|:----------------| +| sysName | SNMP device's system name (OID: [1.3.6.1.2.1.1.5](https://oidref.com/1.3.6.1.2.1.1.5)). | -## Setup +Metrics: -### Prerequisites +| Metric | Dimensions | Unit | +|:------|:----------|:----| +| snmp.device_uptime | uptime | seconds | -#### Find OIDs +### Per network interface -Use `snmpwalk`, like this: +Network interfaces of the SNMP device being monitored. These metrics refer to each interface. -```sh -snmpwalk -t 20 -O fn -v 2c -c public 192.0.2.1 -``` +Labels: + +| Label | Description | +|:-----------|:----------------| +| sysName | SNMP device's system name (OID: [1.3.6.1.2.1.1.5](https://oidref.com/1.3.6.1.2.1.1.5)). | +| ifDescr | Network interface description (OID: [1.3.6.1.2.1.2.2.1.2](https://cric.grenoble.cnrs.fr/Administrateurs/Outils/MIBS/?oid=1.3.6.1.2.1.2.2.1.2)). | +| ifName | Network interface name (OID: [1.3.6.1.2.1.2.2.1.2](https://cric.grenoble.cnrs.fr/Administrateurs/Outils/MIBS/?oid=1.3.6.1.2.1.31.1.1.1.1)). | +| ifType | Network interface type (OID: [1.3.6.1.2.1.2.2.1.2](https://cric.grenoble.cnrs.fr/Administrateurs/Outils/MIBS/?oid=1.3.6.1.2.1.2.2.1.3)). | + +Metrics: -- `-t 20` is the timeout in seconds. -- `-O fn` will display full OIDs in numeric format. -- `-v 2c` is the SNMP version. -- `-c public` is the SNMP community. -- `192.0.2.1` is the SNMP device. +| Metric | Dimensions | Unit | +|:------|:----------|:----| +| snmp.device_net_interface_traffic | received, sent | kilobits/s | +| snmp.device_net_interface_unicast | received, sent | packets/s | +| snmp.device_net_interface_multicast | received, sent | packets/s | +| snmp.device_net_interface_broadcast | received, sent | packets/s | +| snmp.device_net_interface_errors | inbound, outbound | errors/s | +| snmp.device_net_interface_discards | inbound, outbound | discards/s | +| snmp.device_net_interface_admin_status | up, down, testing | status | +| snmp.device_net_interface_oper_status | up, down, testing, unknown, dormant, not_present, lower_layer_down | status | +## Alerts + +There are no alerts configured by default for this integration. + + +## Setup + +### Prerequisites + +No action required. + ### Configuration #### File @@ -114,15 +150,18 @@ The following options can be defined globally: update_every, autodetection_retry | Name | Description | Default | Required | |:----|:-----------|:-------|:--------:| -| update_every | Data collection frequency. | 1 | no | +| update_every | Data collection frequency. | 10 | no | | autodetection_retry | Recheck interval in seconds. Zero means no recheck will be scheduled. | 0 | no | -| hostname | Target ipv4 address. | 127.0.0.1 | yes | +| hostname | Target ipv4 address. | | yes | | community | SNMPv1/2 community string. | public | no | | options.version | SNMP version. Available versions: 1, 2, 3. | 2 | no | | options.port | Target port. | 161 | no | | options.retries | Retries to attempt. | 1 | no | -| options.timeout | SNMP request/response timeout. | 10 | no | -| options.max_request_size | Maximum number of OIDs allowed in one one SNMP request. | 60 | no | +| options.timeout | SNMP request/response timeout. | 5 | no | +| options.max_repetitions | Controls how many SNMP variables to retrieve in a single GETBULK request. | 25 | no | +| options.max_request_size | Maximum number of OIDs allowed in a single GET request. | 60 | no | +| network_interface_filter.by_name | Filter interfaces by their names using [simple patterns](/src/libnetdata/simple_pattern/README.md#simple-patterns). | | no | +| network_interface_filter.by_type | Filter interfaces by their types using [simple patterns](/src/libnetdata/simple_pattern/README.md#simple-patterns). | | no | | user.name | SNMPv3 user name. | | no | | user.name | Security level of SNMPv3 messages. | | no | | user.auth_proto | Security level of SNMPv3 messages. | | no | @@ -198,10 +237,58 @@ In this example: - the SNMP version is `2`. - the SNMP community is `public`. - we will update the values every 10 seconds. -- we define 2 charts `bandwidth_port1` and `bandwidth_port2`, each having 2 dimensions: `in` and `out`. -> **SNMPv1**: just set `options.version` to 1. -> **Note**: the algorithm chosen is `incremental`, because the collected values show the total number of bytes transferred, which we need to transform into kbps. To chart gauges (e.g. temperature), use `absolute` instead. + +<details open><summary>Config</summary> + +```yaml +jobs: + - name: switch + update_every: 10 + hostname: 192.0.2.1 + community: public + options: + version: 2 + +``` +</details> + +##### SNMPv3 + +To use SNMPv3: + +- use `user` instead of `community`. +- set `options.version` to 3. + + +<details open><summary>Config</summary> + +```yaml +jobs: + - name: switch + update_every: 10 + hostname: 192.0.2.1 + options: + version: 3 + user: + name: username + level: authPriv + auth_proto: sha256 + auth_key: auth_protocol_passphrase + priv_proto: aes256 + priv_key: priv_protocol_passphrase + +``` +</details> + +##### Custom OIDs + +In this example: + +- the SNMP device is `192.0.2.1`. +- the SNMP version is `2`. +- the SNMP community is `public`. +- we will update the values every 10 seconds. <details open><summary>Config</summary> @@ -249,37 +336,7 @@ jobs: ``` </details> -##### SNMPv3 - -To use SNMPv3: - -- use `user` instead of `community`. -- set `options.version` to 3. - -The rest of the configuration is the same as in the SNMPv1/2 example. - - -<details open><summary>Config</summary> - -```yaml -jobs: - - name: switch - update_every: 10 - hostname: 192.0.2.1 - options: - version: 3 - user: - name: username - level: authPriv - auth_proto: sha256 - auth_key: auth_protocol_passphrase - priv_proto: aes256 - priv_key: priv_protocol_passphrase - -``` -</details> - -##### Multiply range +##### Custom OIDs with multiply range If you need to define many charts using incremental OIDs, you can use the `charts.multiply_range` option. @@ -379,6 +436,8 @@ jobs: ### Debug Mode +**Important**: Debug mode is not supported for data collection jobs created via the UI using the Dyncfg feature. + To troubleshoot issues with the `snmp` collector, run the `go.d.plugin` with the debug option enabled. The output should give you clues as to why the collector isn't working. @@ -401,4 +460,37 @@ should give you clues as to why the collector isn't working. ./go.d.plugin -d -m snmp ``` +### Getting Logs + +If you're encountering problems with the `snmp` collector, follow these steps to retrieve logs and identify potential issues: + +- **Run the command** specific to your system (systemd, non-systemd, or Docker container). +- **Examine the output** for any warnings or error messages that might indicate issues. These messages should provide clues about the root cause of the problem. + +#### System with systemd + +Use the following command to view logs generated since the last Netdata service restart: + +```bash +journalctl _SYSTEMD_INVOCATION_ID="$(systemctl show --value --property=InvocationID netdata)" --namespace=netdata --grep snmp +``` + +#### System without systemd + +Locate the collector log file, typically at `/var/log/netdata/collector.log`, and use `grep` to filter for collector's name: + +```bash +grep snmp /var/log/netdata/collector.log +``` + +**Note**: This method shows logs from all restarts. Focus on the **latest entries** for troubleshooting current issues. + +#### Docker Container + +If your Netdata runs in a Docker container named "netdata" (replace if different), use this command: + +```bash +docker logs netdata 2>&1 | grep snmp +``` + diff --git a/src/go/collectors/go.d.plugin/modules/snmp/metadata.yaml b/src/go/plugin/go.d/modules/snmp/metadata.yaml index a35b3190d..0475a2f21 100644 --- a/src/go/collectors/go.d.plugin/modules/snmp/metadata.yaml +++ b/src/go/plugin/go.d/modules/snmp/metadata.yaml @@ -21,22 +21,22 @@ modules: overview: data_collection: metrics_description: | - This collector monitors any SNMP devices and uses the [gosnmp](https://github.com/gosnmp/gosnmp) package. - - It supports: + This SNMP collector discovers and gathers statistics for network interfaces on SNMP-enabled devices: + + - Traffic + - Packets (unicast, multicast, broadcast) + - Errors + - Discards + - Administrative and operational status - - all SNMP versions: SNMPv1, SNMPv2c and SNMPv3. - - any number of SNMP devices. - - each SNMP device can be used to collect data for any number of charts. - - each chart may have any number of dimensions. - - each SNMP device may have a different update frequency. - - each SNMP device will accept one or more batches to report values (you can set `max_request_size` per SNMP server, to control the size of batches). + Additionally, it collects overall device uptime. - Keep in mind that many SNMP switches and routers are very slow. They may not be able to report values per second. - `go.d.plugin` reports the time it took for the SNMP device to respond when executed in the debug mode. + It is compatible with all SNMP versions (v1, v2c, and v3) and uses the [gosnmp](https://github.com/gosnmp/gosnmp) package. - Also, if many SNMP clients are used on the same SNMP device at the same time, values may be skipped. - This is a problem of the SNMP device, not this collector. In this case, consider reducing the frequency of data collection (increasing `update_every`). + **For advanced users**: + + - You can manually specify custom OIDs (Object Identifiers) to retrieve specific data points beyond the default metrics. + - However, defining custom charts with dimensions for these OIDs requires manual configuration. method_description: "" supported_platforms: include: [] @@ -50,23 +50,13 @@ modules: limits: description: "" performance_impact: - description: "" + description: | + **Device limitations**: Many SNMP switches and routers have limited processing power. They might not be able to report data as frequently as desired. You can monitor response times using go.d.plugin in debug mode to identify potential bottlenecks. + + **Concurrent access**: If multiple collectors or tools access the same SNMP device simultaneously, data points might be skipped. This is a limitation of the device itself, not this collector. To mitigate this, consider increasing the collection interval (update_every) to reduce the frequency of requests. setup: prerequisites: - list: - - title: Find OIDs - description: | - Use `snmpwalk`, like this: - - ```sh - snmpwalk -t 20 -O fn -v 2c -c public 192.0.2.1 - ``` - - - `-t 20` is the timeout in seconds. - - `-O fn` will display full OIDs in numeric format. - - `-v 2c` is the SNMP version. - - `-c public` is the SNMP community. - - `192.0.2.1` is the SNMP device. + list: [] configuration: file: name: go.d/snmp.conf @@ -79,7 +69,7 @@ modules: list: - name: update_every description: Data collection frequency. - default_value: 1 + default_value: 10 required: false - name: autodetection_retry description: Recheck interval in seconds. Zero means no recheck will be scheduled. @@ -87,7 +77,7 @@ modules: required: false - name: hostname description: Target ipv4 address. - default_value: 127.0.0.1 + default_value: "" required: true - name: community description: SNMPv1/2 community string. @@ -107,12 +97,24 @@ modules: required: false - name: options.timeout description: SNMP request/response timeout. - default_value: 10 + default_value: 5 + required: false + - name: options.max_repetitions + description: Controls how many SNMP variables to retrieve in a single GETBULK request. + default_value: 25 required: false - name: options.max_request_size - description: Maximum number of OIDs allowed in one one SNMP request. + description: Maximum number of OIDs allowed in a single GET request. default_value: 60 required: false + - name: network_interface_filter.by_name + description: "Filter interfaces by their names using [simple patterns](/src/libnetdata/simple_pattern/README.md#simple-patterns)." + default_value: "" + required: false + - name: network_interface_filter.by_type + description: "Filter interfaces by their types using [simple patterns](/src/libnetdata/simple_pattern/README.md#simple-patterns)." + default_value: "" + required: false - name: user.name description: SNMPv3 user name. default_value: "" @@ -242,10 +244,42 @@ modules: - the SNMP version is `2`. - the SNMP community is `public`. - we will update the values every 10 seconds. - - we define 2 charts `bandwidth_port1` and `bandwidth_port2`, each having 2 dimensions: `in` and `out`. + config: | + jobs: + - name: switch + update_every: 10 + hostname: 192.0.2.1 + community: public + options: + version: 2 + - name: SNMPv3 + description: | + To use SNMPv3: - > **SNMPv1**: just set `options.version` to 1. - > **Note**: the algorithm chosen is `incremental`, because the collected values show the total number of bytes transferred, which we need to transform into kbps. To chart gauges (e.g. temperature), use `absolute` instead. + - use `user` instead of `community`. + - set `options.version` to 3. + config: | + jobs: + - name: switch + update_every: 10 + hostname: 192.0.2.1 + options: + version: 3 + user: + name: username + level: authPriv + auth_proto: sha256 + auth_key: auth_protocol_passphrase + priv_proto: aes256 + priv_key: priv_protocol_passphrase + - name: Custom OIDs + description: | + In this example: + + - the SNMP device is `192.0.2.1`. + - the SNMP version is `2`. + - the SNMP community is `public`. + - we will update the values every 10 seconds. config: | jobs: - name: switch @@ -285,29 +319,7 @@ modules: oid: "1.3.6.1.2.1.2.2.1.16.2" multiplier: -8 divisor: 1000 - - name: SNMPv3 - description: | - To use SNMPv3: - - - use `user` instead of `community`. - - set `options.version` to 3. - - The rest of the configuration is the same as in the SNMPv1/2 example. - config: | - jobs: - - name: switch - update_every: 10 - hostname: 192.0.2.1 - options: - version: 3 - user: - name: username - level: authPriv - auth_proto: sha256 - auth_key: auth_protocol_passphrase - priv_proto: aes256 - priv_key: priv_protocol_passphrase - - name: Multiply range + - name: Custom OIDs with multiply range description: | If you need to define many charts using incremental OIDs, you can use the `charts.multiply_range` option. @@ -395,4 +407,90 @@ modules: enabled: false description: The metrics that will be collected are defined in the configuration file. availability: [] - scopes: [] + scopes: + - name: snmp device + description: These metrics refer to the SNMP device. + labels: + - name: sysName + description: "SNMP device's system name (OID: [1.3.6.1.2.1.1.5](https://oidref.com/1.3.6.1.2.1.1.5))." + metrics: + - name: snmp.device_uptime + description: SNMP device uptime + unit: seconds + chart_type: line + dimensions: + - name: uptime + - name: network interface + description: Network interfaces of the SNMP device being monitored. These metrics refer to each interface. + labels: + - name: sysName + description: "SNMP device's system name (OID: [1.3.6.1.2.1.1.5](https://oidref.com/1.3.6.1.2.1.1.5))." + - name: ifDescr + description: "Network interface description (OID: [1.3.6.1.2.1.2.2.1.2](https://cric.grenoble.cnrs.fr/Administrateurs/Outils/MIBS/?oid=1.3.6.1.2.1.2.2.1.2))." + - name: ifName + description: "Network interface name (OID: [1.3.6.1.2.1.2.2.1.2](https://cric.grenoble.cnrs.fr/Administrateurs/Outils/MIBS/?oid=1.3.6.1.2.1.31.1.1.1.1))." + - name: ifType + description: "Network interface type (OID: [1.3.6.1.2.1.2.2.1.2](https://cric.grenoble.cnrs.fr/Administrateurs/Outils/MIBS/?oid=1.3.6.1.2.1.2.2.1.3))." + metrics: + - name: snmp.device_net_interface_traffic + description: SNMP device network interface traffic + unit: kilobits/s + chart_type: area + dimensions: + - name: received + - name: sent + - name: snmp.device_net_interface_unicast + description: SNMP device network interface unicast packets + unit: packets/s + chart_type: line + dimensions: + - name: received + - name: sent + - name: snmp.device_net_interface_multicast + description: SNMP device network interface multicast packets + unit: packets/s + chart_type: line + dimensions: + - name: received + - name: sent + - name: snmp.device_net_interface_broadcast + description: SNMP device network interface broadcast packets + unit: packets/s + chart_type: line + dimensions: + - name: received + - name: sent + - name: snmp.device_net_interface_errors + description: SNMP device network interface errors + unit: errors/s + chart_type: line + dimensions: + - name: inbound + - name: outbound + - name: snmp.device_net_interface_discards + description: SNMP device network interface discards + unit: discards/s + chart_type: line + dimensions: + - name: inbound + - name: outbound + - name: snmp.device_net_interface_admin_status + description: SNMP device network interface administrative status + unit: status + chart_type: line + dimensions: + - name: up + - name: down + - name: testing + - name: snmp.device_net_interface_oper_status + description: SNMP device network interface operational status + unit: status + chart_type: line + dimensions: + - name: up + - name: down + - name: testing + - name: unknown + - name: dormant + - name: not_present + - name: lower_layer_down diff --git a/src/go/plugin/go.d/modules/snmp/netif.go b/src/go/plugin/go.d/modules/snmp/netif.go new file mode 100644 index 000000000..1345e5ee4 --- /dev/null +++ b/src/go/plugin/go.d/modules/snmp/netif.go @@ -0,0 +1,412 @@ +// SPDX-License-Identifier: GPL-3.0-or-later + +package snmp + +import ( + "fmt" + "strings" +) + +const ( + oidIfIndex = "1.3.6.1.2.1.2.2.1.1" + oidIfDescr = "1.3.6.1.2.1.2.2.1.2" + oidIfType = "1.3.6.1.2.1.2.2.1.3" + oidIfMtu = "1.3.6.1.2.1.2.2.1.4" + oidIfSpeed = "1.3.6.1.2.1.2.2.1.5" + oidIfPhysAddress = "1.3.6.1.2.1.2.2.1.6" + oidIfAdminStatus = "1.3.6.1.2.1.2.2.1.7" + oidIfOperStatus = "1.3.6.1.2.1.2.2.1.8" + oidIfLastChange = "1.3.6.1.2.1.2.2.1.9" + oidIfInOctets = "1.3.6.1.2.1.2.2.1.10" + oidIfInUcastPkts = "1.3.6.1.2.1.2.2.1.11" + oidIfInNUcastPkts = "1.3.6.1.2.1.2.2.1.12" + oidIfInDiscards = "1.3.6.1.2.1.2.2.1.13" + oidIfInErrors = "1.3.6.1.2.1.2.2.1.14" + oidIfInUnknownProtos = "1.3.6.1.2.1.2.2.1.15" + oidIfOutOctets = "1.3.6.1.2.1.2.2.1.16" + oidIfOutUcastPkts = "1.3.6.1.2.1.2.2.1.17" + oidIfOutNUcastPkts = "1.3.6.1.2.1.2.2.1.18" + oidIfOutDiscards = "1.3.6.1.2.1.2.2.1.19" + oidIfOutErrors = "1.3.6.1.2.1.2.2.1.20" + + oidIfName = "1.3.6.1.2.1.31.1.1.1.1" + oidIfInMulticastPkts = "1.3.6.1.2.1.31.1.1.1.2" + oidIfInBroadcastPkts = "1.3.6.1.2.1.31.1.1.1.3" + oidIfOutMulticastPkts = "1.3.6.1.2.1.31.1.1.1.4" + oidIfOutBroadcastPkts = "1.3.6.1.2.1.31.1.1.1.5" + oidIfHCInOctets = "1.3.6.1.2.1.31.1.1.1.6" + oidIfHCInUcastPkts = "1.3.6.1.2.1.31.1.1.1.7" + oidIfHCInMulticastPkts = "1.3.6.1.2.1.31.1.1.1.8" + oidIfHCInBroadcastPkts = "1.3.6.1.2.1.31.1.1.1.9" + oidIfHCOutOctets = "1.3.6.1.2.1.31.1.1.1.10" + oidIfHCOutUcastPkts = "1.3.6.1.2.1.31.1.1.1.11" + oidIfHCOutMulticastPkts = "1.3.6.1.2.1.31.1.1.1.12" + oidIfHCOutBroadcastPkts = "1.3.6.1.2.1.31.1.1.1.13" + oidIfHighSpeed = "1.3.6.1.2.1.31.1.1.1.15" + oidIfAlias = "1.3.6.1.2.1.31.1.1.1.18" +) + +type netInterface struct { + updated bool + hasCharts bool + idx string + + ifIndex int64 + ifDescr string + ifType int64 + ifMtu int64 + ifSpeed int64 + //ifPhysAddress string + ifAdminStatus int64 + ifOperStatus int64 + //ifLastChange string + ifInOctets int64 + ifInUcastPkts int64 + ifInNUcastPkts int64 + ifInDiscards int64 + ifInErrors int64 + ifInUnknownProtos int64 + ifOutOctets int64 + ifOutUcastPkts int64 + ifOutNUcastPkts int64 + ifOutDiscards int64 + ifOutErrors int64 + ifName string + ifInMulticastPkts int64 + ifInBroadcastPkts int64 + ifOutMulticastPkts int64 + ifOutBroadcastPkts int64 + ifHCInOctets int64 + ifHCInUcastPkts int64 + ifHCInMulticastPkts int64 + ifHCInBroadcastPkts int64 + ifHCOutOctets int64 + ifHCOutUcastPkts int64 + ifHCOutMulticastPkts int64 + ifHCOutBroadcastPkts int64 + ifHighSpeed int64 + ifAlias string +} + +func (n *netInterface) String() string { + return fmt.Sprintf("iface index='%d',type='%s',name='%s',descr='%s',alias='%s'", + n.ifIndex, ifTypeMapping[n.ifType], n.ifName, n.ifDescr, strings.ReplaceAll(n.ifAlias, "\n", "\\n")) +} + +var ifAdminStatusMapping = map[int64]string{ + 1: "up", + 2: "down", + 3: "testing", +} + +var ifOperStatusMapping = map[int64]string{ + 1: "up", + 2: "down", + 3: "testing", + 4: "unknown", + 5: "dormant", + 6: "notPresent", + 7: "lowerLayerDown", +} + +var ifTypeMapping = map[int64]string{ + 1: "other", + 2: "regular1822", + 3: "hdh1822", + 4: "ddnX25", + 5: "rfc877x25", + 6: "ethernetCsmacd", + 7: "iso88023Csmacd", + 8: "iso88024TokenBus", + 9: "iso88025TokenRing", + 10: "iso88026Man", + 11: "starLan", + 12: "proteon10Mbit", + 13: "proteon80Mbit", + 14: "hyperchannel", + 15: "fddi", + 16: "lapb", + 17: "sdlc", + 18: "ds1", + 19: "e1", + 20: "basicISDN", + 21: "primaryISDN", + 22: "propPointToPointSerial", + 23: "ppp", + 24: "softwareLoopback", + 25: "eon", + 26: "ethernet3Mbit", + 27: "nsip", + 28: "slip", + 29: "ultra", + 30: "ds3", + 31: "sip", + 32: "frameRelay", + 33: "rs232", + 34: "para", + 35: "arcnet", + 36: "arcnetPlus", + 37: "atm", + 38: "miox25", + 39: "sonet", + 40: "x25ple", + 41: "iso88022llc", + 42: "localTalk", + 43: "smdsDxi", + 44: "frameRelayService", + 45: "v35", + 46: "hssi", + 47: "hippi", + 48: "modem", + 49: "aal5", + 50: "sonetPath", + 51: "sonetVT", + 52: "smdsIcip", + 53: "propVirtual", + 54: "propMultiplexor", + 55: "ieee80212", + 56: "fibreChannel", + 57: "hippiInterface", + 58: "frameRelayInterconnect", + 59: "aflane8023", + 60: "aflane8025", + 61: "cctEmul", + 62: "fastEther", + 63: "isdn", + 64: "v11", + 65: "v36", + 66: "g703at64k", + 67: "g703at2mb", + 68: "qllc", + 69: "fastEtherFX", + 70: "channel", + 71: "ieee80211", + 72: "ibm370parChan", + 73: "escon", + 74: "dlsw", + 75: "isdns", + 76: "isdnu", + 77: "lapd", + 78: "ipSwitch", + 79: "rsrb", + 80: "atmLogical", + 81: "ds0", + 82: "ds0Bundle", + 83: "bsc", + 84: "async", + 85: "cnr", + 86: "iso88025Dtr", + 87: "eplrs", + 88: "arap", + 89: "propCnls", + 90: "hostPad", + 91: "termPad", + 92: "frameRelayMPI", + 93: "x213", + 94: "adsl", + 95: "radsl", + 96: "sdsl", + 97: "vdsl", + 98: "iso88025CRFPInt", + 99: "myrinet", + 100: "voiceEM", + 101: "voiceFXO", + 102: "voiceFXS", + 103: "voiceEncap", + 104: "voiceOverIp", + 105: "atmDxi", + 106: "atmFuni", + 107: "atmIma", + 108: "pppMultilinkBundle", + 109: "ipOverCdlc", + 110: "ipOverClaw", + 111: "stackToStack", + 112: "virtualIpAddress", + 113: "mpc", + 114: "ipOverAtm", + 115: "iso88025Fiber", + 116: "tdlc", + 117: "gigabitEthernet", + 118: "hdlc", + 119: "lapf", + 120: "v37", + 121: "x25mlp", + 122: "x25huntGroup", + 123: "transpHdlc", + 124: "interleave", + 125: "fast", + 126: "ip", + 127: "docsCableMaclayer", + 128: "docsCableDownstream", + 129: "docsCableUpstream", + 130: "a12MppSwitch", + 131: "tunnel", + 132: "coffee", + 133: "ces", + 134: "atmSubInterface", + 135: "l2vlan", + 136: "l3ipvlan", + 137: "l3ipxvlan", + 138: "digitalPowerline", + 139: "mediaMailOverIp", + 140: "dtm", + 141: "dcn", + 142: "ipForward", + 143: "msdsl", + 144: "ieee1394", + 145: "if-gsn", + 146: "dvbRccMacLayer", + 147: "dvbRccDownstream", + 148: "dvbRccUpstream", + 149: "atmVirtual", + 150: "mplsTunnel", + 151: "srp", + 152: "voiceOverAtm", + 153: "voiceOverFrameRelay", + 154: "idsl", + 155: "compositeLink", + 156: "ss7SigLink", + 157: "propWirelessP2P", + 158: "frForward", + 159: "rfc1483", + 160: "usb", + 161: "ieee8023adLag", + 162: "bgppolicyaccounting", + 163: "frf16MfrBundle", + 164: "h323Gatekeeper", + 165: "h323Proxy", + 166: "mpls", + 167: "mfSigLink", + 168: "hdsl2", + 169: "shdsl", + 170: "ds1FDL", + 171: "pos", + 172: "dvbAsiIn", + 173: "dvbAsiOut", + 174: "plc", + 175: "nfas", + 176: "tr008", + 177: "gr303RDT", + 178: "gr303IDT", + 179: "isup", + 180: "propDocsWirelessMaclayer", + 181: "propDocsWirelessDownstream", + 182: "propDocsWirelessUpstream", + 183: "hiperlan2", + 184: "propBWAp2Mp", + 185: "sonetOverheadChannel", + 186: "digitalWrapperOverheadChannel", + 187: "aal2", + 188: "radioMAC", + 189: "atmRadio", + 190: "imt", + 191: "mvl", + 192: "reachDSL", + 193: "frDlciEndPt", + 194: "atmVciEndPt", + 195: "opticalChannel", + 196: "opticalTransport", + 197: "propAtm", + 198: "voiceOverCable", + 199: "infiniband", + 200: "teLink", + 201: "q2931", + 202: "virtualTg", + 203: "sipTg", + 204: "sipSig", + 205: "docsCableUpstreamChannel", + 206: "econet", + 207: "pon155", + 208: "pon622", + 209: "bridge", + 210: "linegroup", + 211: "voiceEMFGD", + 212: "voiceFGDEANA", + 213: "voiceDID", + 214: "mpegTransport", + 215: "sixToFour", + 216: "gtp", + 217: "pdnEtherLoop1", + 218: "pdnEtherLoop2", + 219: "opticalChannelGroup", + 220: "homepna", + 221: "gfp", + 222: "ciscoISLvlan", + 223: "actelisMetaLOOP", + 224: "fcipLink", + 225: "rpr", + 226: "qam", + 227: "lmp", + 228: "cblVectaStar", + 229: "docsCableMCmtsDownstream", + 230: "adsl2", + 231: "macSecControlledIF", + 232: "macSecUncontrolledIF", + 233: "aviciOpticalEther", + 234: "atmbond", + 235: "voiceFGDOS", + 236: "mocaVersion1", + 237: "ieee80216WMAN", + 238: "adsl2plus", + 239: "dvbRcsMacLayer", + 240: "dvbTdm", + 241: "dvbRcsTdma", + 242: "x86Laps", + 243: "wwanPP", + 244: "wwanPP2", + 245: "voiceEBS", + 246: "ifPwType", + 247: "ilan", + 248: "pip", + 249: "aluELP", + 250: "gpon", + 251: "vdsl2", + 252: "capwapDot11Profile", + 253: "capwapDot11Bss", + 254: "capwapWtpVirtualRadio", + 255: "bits", + 256: "docsCableUpstreamRfPort", + 257: "cableDownstreamRfPort", + 258: "vmwareVirtualNic", + 259: "ieee802154", + 260: "otnOdu", + 261: "otnOtu", + 262: "ifVfiType", + 263: "g9981", + 264: "g9982", + 265: "g9983", + 266: "aluEpon", + 267: "aluEponOnu", + 268: "aluEponPhysicalUni", + 269: "aluEponLogicalLink", + 270: "aluGponOnu", + 271: "aluGponPhysicalUni", + 272: "vmwareNicTeam", + 277: "docsOfdmDownstream", + 278: "docsOfdmaUpstream", + 279: "gfast", + 280: "sdci", + 281: "xboxWireless", + 282: "fastdsl", + 283: "docsCableScte55d1FwdOob", + 284: "docsCableScte55d1RetOob", + 285: "docsCableScte55d2DsOob", + 286: "docsCableScte55d2UsOob", + 287: "docsCableNdf", + 288: "docsCableNdr", + 289: "ptm", + 290: "ghn", + 291: "otnOtsi", + 292: "otnOtuc", + 293: "otnOduc", + 294: "otnOtsig", + 295: "microwaveCarrierTermination", + 296: "microwaveRadioLinkTerminal", + 297: "ieee8021axDrni", + 298: "ax25", + 299: "ieee19061nanocom", + 300: "cpri", + 301: "omni", + 302: "roe", + 303: "p2pOverLan", +} diff --git a/src/go/plugin/go.d/modules/snmp/snmp.go b/src/go/plugin/go.d/modules/snmp/snmp.go new file mode 100644 index 000000000..253d9f50d --- /dev/null +++ b/src/go/plugin/go.d/modules/snmp/snmp.go @@ -0,0 +1,155 @@ +// SPDX-License-Identifier: GPL-3.0-or-later + +package snmp + +import ( + _ "embed" + "errors" + + "github.com/netdata/netdata/go/plugins/plugin/go.d/agent/module" + "github.com/netdata/netdata/go/plugins/plugin/go.d/pkg/matcher" + + "github.com/gosnmp/gosnmp" +) + +//go:embed "config_schema.json" +var configSchema string + +func init() { + module.Register("snmp", module.Creator{ + JobConfigSchema: configSchema, + Defaults: module.Defaults{ + UpdateEvery: 10, + }, + Create: func() module.Module { return New() }, + Config: func() any { return &Config{} }, + }) +} + +func New() *SNMP { + return &SNMP{ + Config: Config{ + Community: "public", + Options: Options{ + Port: 161, + Retries: 1, + Timeout: 5, + Version: gosnmp.Version2c.String(), + MaxOIDs: 60, + MaxRepetitions: 25, + }, + User: User{ + SecurityLevel: "authPriv", + AuthProto: "sha512", + PrivProto: "aes192c", + }, + }, + + newSnmpClient: gosnmp.NewHandler, + + checkMaxReps: true, + collectIfMib: true, + netInterfaces: make(map[string]*netInterface), + } +} + +type SNMP struct { + module.Base + Config `yaml:",inline" json:""` + + charts *module.Charts + + newSnmpClient func() gosnmp.Handler + snmpClient gosnmp.Handler + + netIfaceFilterByName matcher.Matcher + netIfaceFilterByType matcher.Matcher + + checkMaxReps bool + collectIfMib bool + netInterfaces map[string]*netInterface + sysName string + + oids []string +} + +func (s *SNMP) Configuration() any { + return s.Config +} + +func (s *SNMP) Init() error { + err := s.validateConfig() + if err != nil { + s.Errorf("config validation failed: %v", err) + return err + } + + snmpClient, err := s.initSNMPClient() + if err != nil { + s.Errorf("failed to initialize SNMP client: %v", err) + return err + } + + err = snmpClient.Connect() + if err != nil { + s.Errorf("SNMP client connection failed: %v", err) + return err + } + s.snmpClient = snmpClient + + byName, byType, err := s.initNetIfaceFilters() + if err != nil { + s.Errorf("failed to initialize network interface filters: %v", err) + return err + } + s.netIfaceFilterByName = byName + s.netIfaceFilterByType = byType + + charts, err := newUserInputCharts(s.ChartsInput) + if err != nil { + s.Errorf("failed to create user charts: %v", err) + return err + } + s.charts = charts + + s.oids = s.initOIDs() + + return nil +} + +func (s *SNMP) Check() error { + mx, err := s.collect() + if err != nil { + s.Error(err) + return err + } + + if len(mx) == 0 { + return errors.New("no metrics collected") + } + + return nil +} + +func (s *SNMP) Charts() *module.Charts { + return s.charts +} + +func (s *SNMP) Collect() map[string]int64 { + mx, err := s.collect() + if err != nil { + s.Error(err) + } + + if len(mx) == 0 { + return nil + } + + return mx +} + +func (s *SNMP) Cleanup() { + if s.snmpClient != nil { + _ = s.snmpClient.Close() + } +} diff --git a/src/go/plugin/go.d/modules/snmp/snmp_test.go b/src/go/plugin/go.d/modules/snmp/snmp_test.go new file mode 100644 index 000000000..1841235f1 --- /dev/null +++ b/src/go/plugin/go.d/modules/snmp/snmp_test.go @@ -0,0 +1,754 @@ +// SPDX-License-Identifier: GPL-3.0-or-later + +package snmp + +import ( + "encoding/hex" + "errors" + "fmt" + "os" + "strings" + "testing" + + "github.com/netdata/netdata/go/plugins/plugin/go.d/agent/module" + + "github.com/golang/mock/gomock" + "github.com/gosnmp/gosnmp" + snmpmock "github.com/gosnmp/gosnmp/mocks" + "github.com/stretchr/testify/assert" + "github.com/stretchr/testify/require" +) + +var ( + dataConfigJSON, _ = os.ReadFile("testdata/config.json") + dataConfigYAML, _ = os.ReadFile("testdata/config.yaml") +) + +func Test_testDataIsValid(t *testing.T) { + for name, data := range map[string][]byte{ + "dataConfigJSON": dataConfigJSON, + "dataConfigYAML": dataConfigYAML, + } { + require.NotNil(t, data, name) + } +} + +func TestSNMP_ConfigurationSerialize(t *testing.T) { + module.TestConfigurationSerialize(t, &SNMP{}, dataConfigJSON, dataConfigYAML) +} + +func TestSNMP_Init(t *testing.T) { + tests := map[string]struct { + prepareSNMP func() *SNMP + wantFail bool + }{ + "fail with default config": { + wantFail: true, + prepareSNMP: func() *SNMP { + return New() + }, + }, + "fail when using SNMPv3 but 'user.name' not set": { + wantFail: true, + prepareSNMP: func() *SNMP { + snmp := New() + snmp.Config = prepareV3Config() + snmp.User.Name = "" + return snmp + }, + }, + "success when using SNMPv1 with valid config": { + wantFail: false, + prepareSNMP: func() *SNMP { + snmp := New() + snmp.Config = prepareV1Config() + return snmp + }, + }, + "success when using SNMPv2 with valid config": { + wantFail: false, + prepareSNMP: func() *SNMP { + snmp := New() + snmp.Config = prepareV2Config() + return snmp + }, + }, + "success when using SNMPv3 with valid config": { + wantFail: false, + prepareSNMP: func() *SNMP { + snmp := New() + snmp.Config = prepareV3Config() + return snmp + }, + }, + } + + for name, test := range tests { + t.Run(name, func(t *testing.T) { + snmp := test.prepareSNMP() + + if test.wantFail { + assert.Error(t, snmp.Init()) + } else { + assert.NoError(t, snmp.Init()) + } + }) + } +} + +func TestSNMP_Cleanup(t *testing.T) { + tests := map[string]struct { + prepareSNMP func(t *testing.T, m *snmpmock.MockHandler) *SNMP + }{ + "cleanup call if snmpClient initialized": { + prepareSNMP: func(t *testing.T, m *snmpmock.MockHandler) *SNMP { + snmp := New() + snmp.Config = prepareV2Config() + snmp.newSnmpClient = func() gosnmp.Handler { return m } + setMockClientInitExpect(m) + + require.NoError(t, snmp.Init()) + + m.EXPECT().Close().Times(1) + + return snmp + }, + }, + "cleanup call does not panic if snmpClient not initialized": { + prepareSNMP: func(t *testing.T, m *snmpmock.MockHandler) *SNMP { + snmp := New() + snmp.Config = prepareV2Config() + snmp.newSnmpClient = func() gosnmp.Handler { return m } + setMockClientInitExpect(m) + + require.NoError(t, snmp.Init()) + + snmp.snmpClient = nil + + return snmp + }, + }, + } + + for name, test := range tests { + t.Run(name, func(t *testing.T) { + mockSNMP, cleanup := mockInit(t) + defer cleanup() + + snmp := test.prepareSNMP(t, mockSNMP) + + assert.NotPanics(t, snmp.Cleanup) + }) + } +} + +func TestSNMP_Charts(t *testing.T) { + tests := map[string]struct { + prepareSNMP func(t *testing.T, m *snmpmock.MockHandler) *SNMP + wantNumCharts int + doCollect bool + }{ + "if-mib, no custom": { + doCollect: true, + wantNumCharts: len(netIfaceChartsTmpl)*4 + 1, + prepareSNMP: func(t *testing.T, m *snmpmock.MockHandler) *SNMP { + snmp := New() + snmp.Config = prepareV2Config() + setMockClientSysExpect(m) + setMockClientIfMibExpect(m) + + return snmp + }, + }, + "custom, no if-mib": { + wantNumCharts: 10, + prepareSNMP: func(t *testing.T, m *snmpmock.MockHandler) *SNMP { + snmp := New() + snmp.Config = prepareConfigWithUserCharts(prepareV2Config(), 0, 9) + snmp.collectIfMib = false + + return snmp + }, + }, + } + + for name, test := range tests { + t.Run(name, func(t *testing.T) { + mockSNMP, cleanup := mockInit(t) + defer cleanup() + + setMockClientInitExpect(mockSNMP) + + snmp := test.prepareSNMP(t, mockSNMP) + snmp.newSnmpClient = func() gosnmp.Handler { return mockSNMP } + + require.NoError(t, snmp.Init()) + + if test.doCollect { + _ = snmp.Collect() + } + + assert.Equal(t, test.wantNumCharts, len(*snmp.Charts())) + }) + } +} + +func TestSNMP_Check(t *testing.T) { + tests := map[string]struct { + wantFail bool + prepareSNMP func(m *snmpmock.MockHandler) *SNMP + }{ + "success when collecting IF-MIB": { + wantFail: false, + prepareSNMP: func(m *snmpmock.MockHandler) *SNMP { + snmp := New() + snmp.Config = prepareV2Config() + setMockClientIfMibExpect(m) + + return snmp + }, + }, + "success only custom OIDs supported type": { + wantFail: false, + prepareSNMP: func(m *snmpmock.MockHandler) *SNMP { + snmp := New() + snmp.Config = prepareConfigWithUserCharts(prepareV2Config(), 0, 3) + snmp.collectIfMib = false + + m.EXPECT().Get(gomock.Any()).Return(&gosnmp.SnmpPacket{ + Variables: []gosnmp.SnmpPDU{ + {Value: 10, Type: gosnmp.Counter32}, + {Value: 20, Type: gosnmp.Counter64}, + {Value: 30, Type: gosnmp.Gauge32}, + {Value: 1, Type: gosnmp.Boolean}, + {Value: 40, Type: gosnmp.Gauge32}, + {Value: 50, Type: gosnmp.TimeTicks}, + {Value: 60, Type: gosnmp.Uinteger32}, + {Value: 70, Type: gosnmp.Integer}, + }, + }, nil).Times(1) + + return snmp + }, + }, + "fail when snmp client Get fails": { + wantFail: true, + prepareSNMP: func(m *snmpmock.MockHandler) *SNMP { + snmp := New() + snmp.Config = prepareConfigWithUserCharts(prepareV2Config(), 0, 3) + snmp.collectIfMib = false + + m.EXPECT().Get(gomock.Any()).Return(nil, errors.New("mock Get() error")).Times(1) + + return snmp + }, + }, + } + + for name, test := range tests { + t.Run(name, func(t *testing.T) { + mockSNMP, cleanup := mockInit(t) + defer cleanup() + + setMockClientInitExpect(mockSNMP) + setMockClientSysExpect(mockSNMP) + + snmp := test.prepareSNMP(mockSNMP) + snmp.newSnmpClient = func() gosnmp.Handler { return mockSNMP } + + require.NoError(t, snmp.Init()) + + if test.wantFail { + assert.Error(t, snmp.Check()) + } else { + assert.NoError(t, snmp.Check()) + } + }) + } +} + +func TestSNMP_Collect(t *testing.T) { + tests := map[string]struct { + prepareSNMP func(m *snmpmock.MockHandler) *SNMP + wantCollected map[string]int64 + }{ + "success only IF-MIB": { + prepareSNMP: func(m *snmpmock.MockHandler) *SNMP { + snmp := New() + snmp.Config = prepareV2Config() + + setMockClientIfMibExpect(m) + + return snmp + }, + wantCollected: map[string]int64{ + "net_iface_ether1_admin_status_down": 0, + "net_iface_ether1_admin_status_testing": 0, + "net_iface_ether1_admin_status_up": 1, + "net_iface_ether1_bcast_in": 0, + "net_iface_ether1_bcast_out": 0, + "net_iface_ether1_discards_in": 0, + "net_iface_ether1_discards_out": 0, + "net_iface_ether1_errors_in": 0, + "net_iface_ether1_errors_out": 0, + "net_iface_ether1_mcast_in": 0, + "net_iface_ether1_mcast_out": 0, + "net_iface_ether1_oper_status_dormant": 0, + "net_iface_ether1_oper_status_down": 1, + "net_iface_ether1_oper_status_lowerLayerDown": 0, + "net_iface_ether1_oper_status_notPresent": 0, + "net_iface_ether1_oper_status_testing": 0, + "net_iface_ether1_oper_status_unknown": 0, + "net_iface_ether1_oper_status_up": 0, + "net_iface_ether1_traffic_in": 0, + "net_iface_ether1_traffic_out": 0, + "net_iface_ether1_ucast_in": 0, + "net_iface_ether1_ucast_out": 0, + "net_iface_ether2_admin_status_down": 0, + "net_iface_ether2_admin_status_testing": 0, + "net_iface_ether2_admin_status_up": 1, + "net_iface_ether2_bcast_in": 0, + "net_iface_ether2_bcast_out": 0, + "net_iface_ether2_discards_in": 0, + "net_iface_ether2_discards_out": 0, + "net_iface_ether2_errors_in": 0, + "net_iface_ether2_errors_out": 0, + "net_iface_ether2_mcast_in": 1891, + "net_iface_ether2_mcast_out": 7386, + "net_iface_ether2_oper_status_dormant": 0, + "net_iface_ether2_oper_status_down": 0, + "net_iface_ether2_oper_status_lowerLayerDown": 0, + "net_iface_ether2_oper_status_notPresent": 0, + "net_iface_ether2_oper_status_testing": 0, + "net_iface_ether2_oper_status_unknown": 0, + "net_iface_ether2_oper_status_up": 1, + "net_iface_ether2_traffic_in": 615057509, + "net_iface_ether2_traffic_out": 159677206, + "net_iface_ether2_ucast_in": 71080332, + "net_iface_ether2_ucast_out": 39509661, + "net_iface_sfp-sfpplus1_admin_status_down": 0, + "net_iface_sfp-sfpplus1_admin_status_testing": 0, + "net_iface_sfp-sfpplus1_admin_status_up": 1, + "net_iface_sfp-sfpplus1_bcast_in": 0, + "net_iface_sfp-sfpplus1_bcast_out": 0, + "net_iface_sfp-sfpplus1_discards_in": 0, + "net_iface_sfp-sfpplus1_discards_out": 0, + "net_iface_sfp-sfpplus1_errors_in": 0, + "net_iface_sfp-sfpplus1_errors_out": 0, + "net_iface_sfp-sfpplus1_mcast_in": 0, + "net_iface_sfp-sfpplus1_mcast_out": 0, + "net_iface_sfp-sfpplus1_oper_status_dormant": 0, + "net_iface_sfp-sfpplus1_oper_status_down": 0, + "net_iface_sfp-sfpplus1_oper_status_lowerLayerDown": 0, + "net_iface_sfp-sfpplus1_oper_status_notPresent": 1, + "net_iface_sfp-sfpplus1_oper_status_testing": 0, + "net_iface_sfp-sfpplus1_oper_status_unknown": 0, + "net_iface_sfp-sfpplus1_oper_status_up": 0, + "net_iface_sfp-sfpplus1_traffic_in": 0, + "net_iface_sfp-sfpplus1_traffic_out": 0, + "net_iface_sfp-sfpplus1_ucast_in": 0, + "net_iface_sfp-sfpplus1_ucast_out": 0, + "net_iface_sfp-sfpplus2_admin_status_down": 0, + "net_iface_sfp-sfpplus2_admin_status_testing": 0, + "net_iface_sfp-sfpplus2_admin_status_up": 1, + "net_iface_sfp-sfpplus2_bcast_in": 0, + "net_iface_sfp-sfpplus2_bcast_out": 0, + "net_iface_sfp-sfpplus2_discards_in": 0, + "net_iface_sfp-sfpplus2_discards_out": 0, + "net_iface_sfp-sfpplus2_errors_in": 0, + "net_iface_sfp-sfpplus2_errors_out": 0, + "net_iface_sfp-sfpplus2_mcast_in": 0, + "net_iface_sfp-sfpplus2_mcast_out": 0, + "net_iface_sfp-sfpplus2_oper_status_dormant": 0, + "net_iface_sfp-sfpplus2_oper_status_down": 0, + "net_iface_sfp-sfpplus2_oper_status_lowerLayerDown": 0, + "net_iface_sfp-sfpplus2_oper_status_notPresent": 1, + "net_iface_sfp-sfpplus2_oper_status_testing": 0, + "net_iface_sfp-sfpplus2_oper_status_unknown": 0, + "net_iface_sfp-sfpplus2_oper_status_up": 0, + "net_iface_sfp-sfpplus2_traffic_in": 0, + "net_iface_sfp-sfpplus2_traffic_out": 0, + "net_iface_sfp-sfpplus2_ucast_in": 0, + "net_iface_sfp-sfpplus2_ucast_out": 0, + "uptime": 60, + }, + }, + "success only custom OIDs supported type": { + prepareSNMP: func(m *snmpmock.MockHandler) *SNMP { + snmp := New() + snmp.Config = prepareConfigWithUserCharts(prepareV2Config(), 0, 3) + snmp.collectIfMib = false + + m.EXPECT().Get(gomock.Any()).Return(&gosnmp.SnmpPacket{ + Variables: []gosnmp.SnmpPDU{ + {Value: 10, Type: gosnmp.Counter32}, + {Value: 20, Type: gosnmp.Counter64}, + {Value: 30, Type: gosnmp.Gauge32}, + {Value: 1, Type: gosnmp.Boolean}, + {Value: 40, Type: gosnmp.Gauge32}, + {Value: 50, Type: gosnmp.TimeTicks}, + {Value: 60, Type: gosnmp.Uinteger32}, + {Value: 70, Type: gosnmp.Integer}, + }, + }, nil).Times(1) + + return snmp + }, + wantCollected: map[string]int64{ + "1.3.6.1.2.1.2.2.1.10.0": 10, + "1.3.6.1.2.1.2.2.1.16.0": 20, + "1.3.6.1.2.1.2.2.1.10.1": 30, + "1.3.6.1.2.1.2.2.1.16.1": 1, + "1.3.6.1.2.1.2.2.1.10.2": 40, + "1.3.6.1.2.1.2.2.1.16.2": 50, + "1.3.6.1.2.1.2.2.1.10.3": 60, + "1.3.6.1.2.1.2.2.1.16.3": 70, + "uptime": 60, + }, + }, + "success only custom OIDs supported and unsupported type": { + prepareSNMP: func(m *snmpmock.MockHandler) *SNMP { + snmp := New() + snmp.Config = prepareConfigWithUserCharts(prepareV2Config(), 0, 2) + snmp.collectIfMib = false + + m.EXPECT().Get(gomock.Any()).Return(&gosnmp.SnmpPacket{ + Variables: []gosnmp.SnmpPDU{ + {Value: 10, Type: gosnmp.Counter32}, + {Value: 20, Type: gosnmp.Counter64}, + {Value: 30, Type: gosnmp.Gauge32}, + {Value: nil, Type: gosnmp.NoSuchInstance}, + {Value: nil, Type: gosnmp.NoSuchInstance}, + {Value: nil, Type: gosnmp.NoSuchInstance}, + }, + }, nil).Times(1) + + return snmp + }, + wantCollected: map[string]int64{ + "1.3.6.1.2.1.2.2.1.10.0": 10, + "1.3.6.1.2.1.2.2.1.16.0": 20, + "1.3.6.1.2.1.2.2.1.10.1": 30, + "uptime": 60, + }, + }, + "success only custom OIDs unsupported type": { + prepareSNMP: func(m *snmpmock.MockHandler) *SNMP { + snmp := New() + snmp.Config = prepareConfigWithUserCharts(prepareV2Config(), 0, 2) + snmp.collectIfMib = false + + m.EXPECT().Get(gomock.Any()).Return(&gosnmp.SnmpPacket{ + Variables: []gosnmp.SnmpPDU{ + {Value: nil, Type: gosnmp.NoSuchInstance}, + {Value: nil, Type: gosnmp.NoSuchInstance}, + {Value: nil, Type: gosnmp.NoSuchObject}, + {Value: "192.0.2.0", Type: gosnmp.NsapAddress}, + {Value: []uint8{118, 101, 116}, Type: gosnmp.OctetString}, + {Value: ".1.3.6.1.2.1.4.32.1.5.2.1.4.10.19.0.0.16", Type: gosnmp.ObjectIdentifier}, + }, + }, nil).Times(1) + + return snmp + }, + wantCollected: map[string]int64{ + "uptime": 60, + }, + }, + } + + for name, test := range tests { + t.Run(name, func(t *testing.T) { + mockSNMP, cleanup := mockInit(t) + defer cleanup() + + setMockClientInitExpect(mockSNMP) + setMockClientSysExpect(mockSNMP) + + snmp := test.prepareSNMP(mockSNMP) + snmp.newSnmpClient = func() gosnmp.Handler { return mockSNMP } + + require.NoError(t, snmp.Init()) + + mx := snmp.Collect() + + assert.Equal(t, test.wantCollected, mx) + }) + } +} + +func mockInit(t *testing.T) (*snmpmock.MockHandler, func()) { + mockCtl := gomock.NewController(t) + cleanup := func() { mockCtl.Finish() } + mockSNMP := snmpmock.NewMockHandler(mockCtl) + + return mockSNMP, cleanup +} + +func prepareV3Config() Config { + cfg := prepareV2Config() + cfg.Options.Version = gosnmp.Version3.String() + cfg.User = User{ + Name: "name", + SecurityLevel: "authPriv", + AuthProto: strings.ToLower(gosnmp.MD5.String()), + AuthKey: "auth_key", + PrivProto: strings.ToLower(gosnmp.AES.String()), + PrivKey: "priv_key", + } + return cfg +} + +func prepareV2Config() Config { + cfg := prepareV1Config() + cfg.Options.Version = gosnmp.Version2c.String() + return cfg +} + +func prepareV1Config() Config { + return Config{ + UpdateEvery: 1, + Hostname: "192.0.2.1", + Community: "public", + Options: Options{ + Port: 161, + Retries: 1, + Timeout: 5, + Version: gosnmp.Version1.String(), + MaxOIDs: 60, + MaxRepetitions: 25, + }, + } +} + +func prepareConfigWithUserCharts(cfg Config, start, end int) Config { + if start > end || start < 0 || end < 1 { + panic(fmt.Sprintf("invalid index range ('%d'-'%d')", start, end)) + } + cfg.ChartsInput = []ChartConfig{ + { + ID: "test_chart1", + Title: "This is Test Chart1", + Units: "kilobits/s", + Family: "family", + Type: module.Area.String(), + Priority: module.Priority, + Dimensions: []DimensionConfig{ + { + OID: "1.3.6.1.2.1.2.2.1.10", + Name: "in", + Algorithm: module.Incremental.String(), + Multiplier: 8, + Divisor: 1000, + }, + { + OID: "1.3.6.1.2.1.2.2.1.16", + Name: "out", + Algorithm: module.Incremental.String(), + Multiplier: 8, + Divisor: 1000, + }, + }, + }, + } + + for i := range cfg.ChartsInput { + cfg.ChartsInput[i].IndexRange = []int{start, end} + } + + return cfg +} + +func setMockClientInitExpect(m *snmpmock.MockHandler) { + m.EXPECT().Target().AnyTimes() + m.EXPECT().Port().AnyTimes() + m.EXPECT().Version().AnyTimes() + m.EXPECT().Community().AnyTimes() + m.EXPECT().SetTarget(gomock.Any()).AnyTimes() + m.EXPECT().SetPort(gomock.Any()).AnyTimes() + m.EXPECT().SetRetries(gomock.Any()).AnyTimes() + m.EXPECT().SetMaxRepetitions(gomock.Any()).AnyTimes() + m.EXPECT().SetMaxOids(gomock.Any()).AnyTimes() + m.EXPECT().SetLogger(gomock.Any()).AnyTimes() + m.EXPECT().SetTimeout(gomock.Any()).AnyTimes() + m.EXPECT().SetCommunity(gomock.Any()).AnyTimes() + m.EXPECT().SetVersion(gomock.Any()).AnyTimes() + m.EXPECT().SetSecurityModel(gomock.Any()).AnyTimes() + m.EXPECT().SetMsgFlags(gomock.Any()).AnyTimes() + m.EXPECT().SetSecurityParameters(gomock.Any()).AnyTimes() + m.EXPECT().Connect().Return(nil).AnyTimes() +} + +func setMockClientSysExpect(m *snmpmock.MockHandler) { + m.EXPECT().Get([]string{oidSysName}).Return(&gosnmp.SnmpPacket{ + Variables: []gosnmp.SnmpPDU{ + {Value: []uint8("mock-host"), Type: gosnmp.OctetString}, + }, + }, nil).MinTimes(1) + + m.EXPECT().Get([]string{oidSysUptime}).Return(&gosnmp.SnmpPacket{ + Variables: []gosnmp.SnmpPDU{ + {Value: uint32(6048), Type: gosnmp.TimeTicks}, + }, + }, nil).MinTimes(1) +} + +func setMockClientIfMibExpect(m *snmpmock.MockHandler) { + m.EXPECT().WalkAll(oidIfIndex).Return([]gosnmp.SnmpPDU{ + {Name: oidIfIndex + ".1", Value: 1, Type: gosnmp.Integer}, + {Name: oidIfIndex + ".2", Value: 2, Type: gosnmp.Integer}, + {Name: oidIfIndex + ".17", Value: 17, Type: gosnmp.Integer}, + {Name: oidIfIndex + ".18", Value: 18, Type: gosnmp.Integer}, + }, nil).MinTimes(1) + m.EXPECT().WalkAll(rootOidIfMibIfTable).Return([]gosnmp.SnmpPDU{ + {Name: oidIfIndex + ".1", Value: 1, Type: gosnmp.Integer}, + {Name: oidIfIndex + ".2", Value: 2, Type: gosnmp.Integer}, + {Name: oidIfIndex + ".17", Value: 17, Type: gosnmp.Integer}, + {Name: oidIfIndex + ".18", Value: 18, Type: gosnmp.Integer}, + {Name: oidIfDescr + ".1", Value: []uint8("ether1"), Type: gosnmp.OctetString}, + {Name: oidIfDescr + ".2", Value: []uint8("ether2"), Type: gosnmp.OctetString}, + {Name: oidIfDescr + ".17", Value: []uint8("sfp-sfpplus2"), Type: gosnmp.OctetString}, + {Name: oidIfDescr + ".18", Value: []uint8("sfp-sfpplus1"), Type: gosnmp.OctetString}, + {Name: oidIfType + ".1", Value: 6, Type: gosnmp.Integer}, + {Name: oidIfType + ".2", Value: 6, Type: gosnmp.Integer}, + {Name: oidIfType + ".17", Value: 6, Type: gosnmp.Integer}, + {Name: oidIfType + ".18", Value: 6, Type: gosnmp.Integer}, + {Name: oidIfMtu + ".1", Value: 1500, Type: gosnmp.Integer}, + {Name: oidIfMtu + ".2", Value: 1500, Type: gosnmp.Integer}, + {Name: oidIfMtu + ".17", Value: 1500, Type: gosnmp.Integer}, + {Name: oidIfMtu + ".18", Value: 1500, Type: gosnmp.Integer}, + {Name: oidIfSpeed + ".1", Value: 0, Type: gosnmp.Gauge32}, + {Name: oidIfSpeed + ".2", Value: 1000000000, Type: gosnmp.Gauge32}, + {Name: oidIfSpeed + ".17", Value: 0, Type: gosnmp.Gauge32}, + {Name: oidIfSpeed + ".18", Value: 0, Type: gosnmp.Gauge32}, + {Name: oidIfPhysAddress + ".1", Value: decodePhysAddr("18:fd:74:7e:c5:80"), Type: gosnmp.OctetString}, + {Name: oidIfPhysAddress + ".2", Value: decodePhysAddr("18:fd:74:7e:c5:81"), Type: gosnmp.OctetString}, + {Name: oidIfPhysAddress + ".17", Value: decodePhysAddr("18:fd:74:7e:c5:90"), Type: gosnmp.OctetString}, + {Name: oidIfPhysAddress + ".18", Value: decodePhysAddr("18:fd:74:7e:c5:91"), Type: gosnmp.OctetString}, + {Name: oidIfAdminStatus + ".1", Value: 1, Type: gosnmp.Integer}, + {Name: oidIfAdminStatus + ".2", Value: 1, Type: gosnmp.Integer}, + {Name: oidIfAdminStatus + ".17", Value: 1, Type: gosnmp.Integer}, + {Name: oidIfAdminStatus + ".18", Value: 1, Type: gosnmp.Integer}, + {Name: oidIfOperStatus + ".1", Value: 2, Type: gosnmp.Integer}, + {Name: oidIfOperStatus + ".2", Value: 1, Type: gosnmp.Integer}, + {Name: oidIfOperStatus + ".17", Value: 6, Type: gosnmp.Integer}, + {Name: oidIfOperStatus + ".18", Value: 6, Type: gosnmp.Integer}, + {Name: oidIfLastChange + ".1", Value: 0, Type: gosnmp.TimeTicks}, + {Name: oidIfLastChange + ".2", Value: 3243, Type: gosnmp.TimeTicks}, + {Name: oidIfLastChange + ".17", Value: 0, Type: gosnmp.TimeTicks}, + {Name: oidIfLastChange + ".18", Value: 0, Type: gosnmp.TimeTicks}, + {Name: oidIfInOctets + ".1", Value: 0, Type: gosnmp.Counter32}, + {Name: oidIfInOctets + ".2", Value: 3827243723, Type: gosnmp.Counter32}, + {Name: oidIfInOctets + ".17", Value: 0, Type: gosnmp.Counter32}, + {Name: oidIfInOctets + ".18", Value: 0, Type: gosnmp.Counter32}, + {Name: oidIfInUcastPkts + ".1", Value: 0, Type: gosnmp.Counter32}, + {Name: oidIfInUcastPkts + ".2", Value: 71035992, Type: gosnmp.Counter32}, + {Name: oidIfInUcastPkts + ".17", Value: 0, Type: gosnmp.Counter32}, + {Name: oidIfInUcastPkts + ".18", Value: 0, Type: gosnmp.Counter32}, + {Name: oidIfInNUcastPkts + ".1", Value: 0, Type: gosnmp.Counter32}, + {Name: oidIfInNUcastPkts + ".2", Value: 0, Type: gosnmp.Counter32}, + {Name: oidIfInNUcastPkts + ".17", Value: 0, Type: gosnmp.Counter32}, + {Name: oidIfInNUcastPkts + ".18", Value: 0, Type: gosnmp.Counter32}, + {Name: oidIfInDiscards + ".1", Value: 0, Type: gosnmp.Counter32}, + {Name: oidIfInDiscards + ".2", Value: 0, Type: gosnmp.Counter32}, + {Name: oidIfInDiscards + ".17", Value: 0, Type: gosnmp.Counter32}, + {Name: oidIfInDiscards + ".18", Value: 0, Type: gosnmp.Counter32}, + {Name: oidIfInErrors + ".1", Value: 0, Type: gosnmp.Counter32}, + {Name: oidIfInErrors + ".2", Value: 0, Type: gosnmp.Counter32}, + {Name: oidIfInErrors + ".17", Value: 0, Type: gosnmp.Counter32}, + {Name: oidIfInErrors + ".18", Value: 0, Type: gosnmp.Counter32}, + {Name: oidIfInUnknownProtos + ".1", Value: 0, Type: gosnmp.Counter32}, + {Name: oidIfInUnknownProtos + ".2", Value: 0, Type: gosnmp.Counter32}, + {Name: oidIfInUnknownProtos + ".17", Value: 0, Type: gosnmp.Counter32}, + {Name: oidIfInUnknownProtos + ".18", Value: 0, Type: gosnmp.Counter32}, + {Name: oidIfOutOctets + ".1", Value: 0, Type: gosnmp.Counter32}, + {Name: oidIfOutOctets + ".2", Value: 2769838772, Type: gosnmp.Counter32}, + {Name: oidIfOutOctets + ".17", Value: 0, Type: gosnmp.Counter32}, + {Name: oidIfOutOctets + ".18", Value: 0, Type: gosnmp.Counter32}, + {Name: oidIfOutUcastPkts + ".1", Value: 0, Type: gosnmp.Counter32}, + {Name: oidIfOutUcastPkts + ".2", Value: 39482929, Type: gosnmp.Counter32}, + {Name: oidIfOutUcastPkts + ".17", Value: 0, Type: gosnmp.Counter32}, + {Name: oidIfOutUcastPkts + ".18", Value: 0, Type: gosnmp.Counter32}, + {Name: oidIfOutNUcastPkts + ".1", Value: 0, Type: gosnmp.Counter32}, + {Name: oidIfOutNUcastPkts + ".2", Value: 0, Type: gosnmp.Counter32}, + {Name: oidIfOutNUcastPkts + ".17", Value: 0, Type: gosnmp.Counter32}, + {Name: oidIfOutNUcastPkts + ".18", Value: 0, Type: gosnmp.Counter32}, + {Name: oidIfOutDiscards + ".1", Value: 0, Type: gosnmp.Counter32}, + {Name: oidIfOutDiscards + ".2", Value: 0, Type: gosnmp.Counter32}, + {Name: oidIfOutDiscards + ".17", Value: 0, Type: gosnmp.Counter32}, + {Name: oidIfOutDiscards + ".18", Value: 0, Type: gosnmp.Counter32}, + {Name: oidIfOutErrors + ".1", Value: 0, Type: gosnmp.Counter32}, + {Name: oidIfOutErrors + ".2", Value: 0, Type: gosnmp.Counter32}, + {Name: oidIfOutErrors + ".17", Value: 0, Type: gosnmp.Counter32}, + {Name: oidIfOutErrors + ".18", Value: 0, Type: gosnmp.Counter32}, + }, nil).MinTimes(1) + + m.EXPECT().WalkAll(rootOidIfMibIfXTable).Return([]gosnmp.SnmpPDU{ + {Name: oidIfName + ".1", Value: []uint8("ether1"), Type: gosnmp.OctetString}, + {Name: oidIfName + ".2", Value: []uint8("ether2"), Type: gosnmp.OctetString}, + {Name: oidIfName + ".17", Value: []uint8("sfp-sfpplus2"), Type: gosnmp.OctetString}, + {Name: oidIfName + ".18", Value: []uint8("sfp-sfpplus1"), Type: gosnmp.OctetString}, + {Name: oidIfInMulticastPkts + ".1", Value: 0, Type: gosnmp.Counter32}, + {Name: oidIfInMulticastPkts + ".2", Value: 0, Type: gosnmp.Counter32}, + {Name: oidIfInMulticastPkts + ".17", Value: 0, Type: gosnmp.Counter32}, + {Name: oidIfInMulticastPkts + ".18", Value: 0, Type: gosnmp.Counter32}, + {Name: oidIfInBroadcastPkts + ".1", Value: 0, Type: gosnmp.Counter32}, + {Name: oidIfInBroadcastPkts + ".2", Value: 0, Type: gosnmp.Counter32}, + {Name: oidIfInBroadcastPkts + ".17", Value: 0, Type: gosnmp.Counter32}, + {Name: oidIfInBroadcastPkts + ".18", Value: 0, Type: gosnmp.Counter32}, + {Name: oidIfOutMulticastPkts + ".1", Value: 0, Type: gosnmp.Counter32}, + {Name: oidIfOutMulticastPkts + ".2", Value: 0, Type: gosnmp.Counter32}, + {Name: oidIfOutMulticastPkts + ".17", Value: 0, Type: gosnmp.Counter32}, + {Name: oidIfOutMulticastPkts + ".18", Value: 0, Type: gosnmp.Counter32}, + {Name: oidIfOutBroadcastPkts + ".1", Value: 0, Type: gosnmp.Counter32}, + {Name: oidIfOutBroadcastPkts + ".2", Value: 0, Type: gosnmp.Counter32}, + {Name: oidIfOutBroadcastPkts + ".17", Value: 0, Type: gosnmp.Counter32}, + {Name: oidIfOutBroadcastPkts + ".18", Value: 0, Type: gosnmp.Counter32}, + {Name: oidIfHCInOctets + ".1", Value: 0, Type: gosnmp.Counter64}, + {Name: oidIfHCInOctets + ".2", Value: 76882188712, Type: gosnmp.Counter64}, + {Name: oidIfHCInOctets + ".17", Value: 0, Type: gosnmp.Counter64}, + {Name: oidIfHCInOctets + ".18", Value: 0, Type: gosnmp.Counter64}, + {Name: oidIfHCInUcastPkts + ".1", Value: 0, Type: gosnmp.Counter64}, + {Name: oidIfHCInUcastPkts + ".2", Value: 71080332, Type: gosnmp.Counter64}, + {Name: oidIfHCInUcastPkts + ".17", Value: 0, Type: gosnmp.Counter64}, + {Name: oidIfHCInUcastPkts + ".18", Value: 0, Type: gosnmp.Counter64}, + {Name: oidIfHCInMulticastPkts + ".1", Value: 0, Type: gosnmp.Counter64}, + {Name: oidIfHCInMulticastPkts + ".2", Value: 1891, Type: gosnmp.Counter64}, + {Name: oidIfHCInMulticastPkts + ".17", Value: 0, Type: gosnmp.Counter64}, + {Name: oidIfHCInMulticastPkts + ".18", Value: 0, Type: gosnmp.Counter64}, + {Name: oidIfHCInBroadcastPkts + ".1", Value: 0, Type: gosnmp.Counter64}, + {Name: oidIfHCInBroadcastPkts + ".2", Value: 0, Type: gosnmp.Counter64}, + {Name: oidIfHCInBroadcastPkts + ".17", Value: 0, Type: gosnmp.Counter64}, + {Name: oidIfHCInBroadcastPkts + ".18", Value: 0, Type: gosnmp.Counter64}, + {Name: oidIfHCOutOctets + ".1", Value: 0, Type: gosnmp.Counter64}, + {Name: oidIfHCOutOctets + ".2", Value: 19959650810, Type: gosnmp.Counter64}, + {Name: oidIfHCOutOctets + ".17", Value: 0, Type: gosnmp.Counter64}, + {Name: oidIfHCOutOctets + ".18", Value: 0, Type: gosnmp.Counter64}, + {Name: oidIfHCOutUcastPkts + ".1", Value: 0, Type: gosnmp.Counter64}, + {Name: oidIfHCOutUcastPkts + ".2", Value: 39509661, Type: gosnmp.Counter64}, + {Name: oidIfHCOutUcastPkts + ".17", Value: 0, Type: gosnmp.Counter64}, + {Name: oidIfHCOutUcastPkts + ".18", Value: 0, Type: gosnmp.Counter64}, + {Name: oidIfHCOutMulticastPkts + ".1", Value: 0, Type: gosnmp.Counter64}, + {Name: oidIfHCOutMulticastPkts + ".2", Value: 28844, Type: gosnmp.Counter64}, + {Name: oidIfHCOutMulticastPkts + ".17", Value: 0, Type: gosnmp.Counter64}, + {Name: oidIfHCOutMulticastPkts + ".18", Value: 0, Type: gosnmp.Counter64}, + {Name: oidIfHCOutBroadcastPkts + ".1", Value: 0, Type: gosnmp.Counter64}, + {Name: oidIfHCOutBroadcastPkts + ".2", Value: 7386, Type: gosnmp.Counter64}, + {Name: oidIfHCOutBroadcastPkts + ".17", Value: 0, Type: gosnmp.Counter64}, + {Name: oidIfHCOutBroadcastPkts + ".18", Value: 0, Type: gosnmp.Counter64}, + {Name: oidIfHighSpeed + ".1", Value: 0, Type: gosnmp.Gauge32}, + {Name: oidIfHighSpeed + ".2", Value: 1000, Type: gosnmp.Gauge32}, + {Name: oidIfHighSpeed + ".17", Value: 0, Type: gosnmp.Gauge32}, + {Name: oidIfHighSpeed + ".18", Value: 0, Type: gosnmp.Gauge32}, + {Name: oidIfAlias + ".1", Value: []uint8(""), Type: gosnmp.OctetString}, + {Name: oidIfAlias + ".2", Value: []uint8("UPLINK2 (2.1)"), Type: gosnmp.OctetString}, + {Name: oidIfAlias + ".17", Value: []uint8(""), Type: gosnmp.OctetString}, + {Name: oidIfAlias + ".18", Value: []uint8(""), Type: gosnmp.OctetString}, + }, nil).MinTimes(1) +} + +func decodePhysAddr(s string) []uint8 { + s = strings.ReplaceAll(s, ":", "") + v, _ := hex.DecodeString(s) + return v +} diff --git a/src/go/collectors/go.d.plugin/modules/snmp/testdata/config.json b/src/go/plugin/go.d/modules/snmp/testdata/config.json index c0fff4868..b88ac1c25 100644 --- a/src/go/collectors/go.d.plugin/modules/snmp/testdata/config.json +++ b/src/go/plugin/go.d/modules/snmp/testdata/config.json @@ -2,6 +2,10 @@ "update_every": 123, "hostname": "ok", "community": "ok", + "network_interface_filter": { + "by_name": "ok", + "by_type": "ok" + }, "user": { "name": "ok", "level": "ok", @@ -15,7 +19,8 @@ "retries": 123, "timeout": 123, "version": "ok", - "max_request_size": 123 + "max_request_size": 123, + "max_repetitions": 123 }, "charts": [ { diff --git a/src/go/collectors/go.d.plugin/modules/snmp/testdata/config.yaml b/src/go/plugin/go.d/modules/snmp/testdata/config.yaml index 98620fb9c..f4ddbf91c 100644 --- a/src/go/collectors/go.d.plugin/modules/snmp/testdata/config.yaml +++ b/src/go/plugin/go.d/modules/snmp/testdata/config.yaml @@ -1,6 +1,9 @@ update_every: 123 hostname: "ok" community: "ok" +network_interface_filter: + by_name: "ok" + by_type: "ok" user: name: "ok" level: "ok" @@ -14,6 +17,7 @@ options: timeout: 123 version: "ok" max_request_size: 123 + max_repetitions: 123 charts: - id: "ok" title: "ok" diff --git a/src/collectors/python.d.plugin/squid/README.md b/src/go/plugin/go.d/modules/squid/README.md index c4e5a03d7..c4e5a03d7 120000 --- a/src/collectors/python.d.plugin/squid/README.md +++ b/src/go/plugin/go.d/modules/squid/README.md diff --git a/src/go/plugin/go.d/modules/squid/charts.go b/src/go/plugin/go.d/modules/squid/charts.go new file mode 100644 index 000000000..47bab60f4 --- /dev/null +++ b/src/go/plugin/go.d/modules/squid/charts.go @@ -0,0 +1,81 @@ +// SPDX-License-Identifier: GPL-3.0-or-later + +package squid + +import ( + "github.com/netdata/netdata/go/plugins/plugin/go.d/agent/module" +) + +const ( + prioClientsNet = module.Priority + iota + prioClientsRequests + prioServersNet + prioServersRequests +) + +var charts = module.Charts{ + clientsNetChart.Copy(), + clientsRequestsChart.Copy(), + serversNetChart.Copy(), + serversRequestsChart.Copy(), +} + +var ( + clientsNetChart = module.Chart{ + ID: "clients_net", + Title: "Squid Client Bandwidth", + Units: "kilobits/s", + Fam: "clients", + Ctx: "squid.clients_net", + Type: module.Area, + Priority: prioClientsNet, + Dims: module.Dims{ + {ID: "client_http.kbytes_in", Name: "in", Algo: module.Incremental, Mul: 8}, + {ID: "client_http.kbytes_out", Name: "out", Algo: module.Incremental, Mul: -8}, + {ID: "client_http.hit_kbytes_out", Name: "hits", Algo: module.Incremental, Mul: -8}, + }, + } + + clientsRequestsChart = module.Chart{ + ID: "clients_requests", + Title: "Squid Client Requests", + Units: "requests/s", + Fam: "clients", + Ctx: "squid.clients_requests", + Type: module.Line, + Priority: prioClientsRequests, + Dims: module.Dims{ + {ID: "client_http.requests", Name: "requests", Algo: module.Incremental}, + {ID: "client_http.hits", Name: "hits", Algo: module.Incremental}, + {ID: "client_http.errors", Name: "errors", Algo: module.Incremental, Mul: -1}, + }, + } + + serversNetChart = module.Chart{ + ID: "servers_net", + Title: "Squid Server Bandwidth", + Units: "kilobits/s", + Fam: "servers", + Ctx: "squid.servers_net", + Type: module.Area, + Priority: prioServersNet, + Dims: module.Dims{ + {ID: "server.all.kbytes_in", Name: "in", Algo: module.Incremental, Mul: 8}, + {ID: "server.all.kbytes_out", Name: "out", Algo: module.Incremental, Mul: -8}, + }, + } + + serversRequestsChart = module.Chart{ + ID: "servers_requests", + Title: "Squid Server Requests", + Units: "requests/s", + Fam: "servers", + Ctx: "squid.servers_requests", + Type: module.Line, + Priority: prioServersRequests, + Dims: module.Dims{ + {ID: "server.all.requests", Name: "requests", Algo: module.Incremental}, + {ID: "server.all.errors", Name: "errors", Algo: module.Incremental, Mul: -1}, + }, + } +) diff --git a/src/go/plugin/go.d/modules/squid/collect.go b/src/go/plugin/go.d/modules/squid/collect.go new file mode 100644 index 000000000..bb0cf1ab4 --- /dev/null +++ b/src/go/plugin/go.d/modules/squid/collect.go @@ -0,0 +1,105 @@ +// SPDX-License-Identifier: GPL-3.0-or-later + +package squid + +import ( + "bufio" + "fmt" + "io" + "net/http" + "strconv" + "strings" + + "github.com/netdata/netdata/go/plugins/plugin/go.d/pkg/web" +) + +const ( + // https://wiki.squid-cache.org/Features/CacheManager/Index#controlling-access-to-the-cache-manager + urlPathServerStats = "/squid-internal-mgr/counters" +) + +var statsCounters = map[string]bool{ + "client_http.kbytes_in": true, + "client_http.kbytes_out": true, + "server.all.errors": true, + "server.all.requests": true, + "server.all.kbytes_out": true, + "server.all.kbytes_in": true, + "client_http.errors": true, + "client_http.hits": true, + "client_http.requests": true, + "client_http.hit_kbytes_out": true, +} + +func (s *Squid) collect() (map[string]int64, error) { + mx := make(map[string]int64) + + if err := s.collectCounters(mx); err != nil { + return nil, err + } + + return mx, nil +} + +func (s *Squid) collectCounters(mx map[string]int64) error { + req, err := web.NewHTTPRequestWithPath(s.Request, urlPathServerStats) + if err != nil { + return err + } + + if err := s.doOK(req, func(body io.Reader) error { + sc := bufio.NewScanner(body) + + for sc.Scan() { + key, value, ok := strings.Cut(sc.Text(), "=") + if !ok { + continue + } + + key, value = strings.TrimSpace(key), strings.TrimSpace(value) + + if !statsCounters[key] { + continue + } + + v, err := strconv.ParseInt(value, 10, 64) + if err != nil { + s.Debugf("failed to parse key %s value %s: %v", key, value, err) + continue + } + + mx[key] = v + } + return nil + }); err != nil { + return err + } + + if len(mx) == 0 { + return fmt.Errorf("unexpected response from '%s': no metrics found", req.URL) + } + + return nil +} + +func (s *Squid) doOK(req *http.Request, parse func(body io.Reader) error) error { + resp, err := s.httpClient.Do(req) + if err != nil { + return fmt.Errorf("error on HTTP request '%s': %v", req.URL, err) + } + + defer closeBody(resp) + + if resp.StatusCode != http.StatusOK { + return fmt.Errorf("'%s' returned HTTP status code: %d", req.URL, resp.StatusCode) + } + + return parse(resp.Body) +} + +func closeBody(resp *http.Response) { + if resp != nil && resp.Body != nil { + _, _ = io.Copy(io.Discard, resp.Body) + _ = resp.Body.Close() + } +} diff --git a/src/go/plugin/go.d/modules/squid/config_schema.json b/src/go/plugin/go.d/modules/squid/config_schema.json new file mode 100644 index 000000000..b1264b2b1 --- /dev/null +++ b/src/go/plugin/go.d/modules/squid/config_schema.json @@ -0,0 +1,177 @@ +{ + "jsonSchema": { + "$schema": "http://json-schema.org/draft-07/schema#", + "title": "Squid collector configuration.", + "type": "object", + "properties": { + "update_every": { + "title": "Update every", + "description": "Data collection interval, measured in seconds.", + "type": "integer", + "minimum": 1, + "default": 1 + }, + "url": { + "title": "URL", + "description": "The base URL where the Squid endpoint can be accessed.", + "type": "string", + "default": "http://127.0.0.1:1328", + "format": "uri" + }, + "timeout": { + "title": "Timeout", + "description": "The timeout in seconds for the HTTP request.", + "type": "number", + "minimum": 0.5, + "default": 1 + }, + "not_follow_redirects": { + "title": "Not follow redirects", + "description": "If set, the client will not follow HTTP redirects automatically.", + "type": "boolean" + }, + "username": { + "title": "Username", + "description": "The username for basic authentication.", + "type": "string", + "sensitive": true + }, + "password": { + "title": "Password", + "description": "The password for basic authentication.", + "type": "string", + "sensitive": true + }, + "proxy_url": { + "title": "Proxy URL", + "description": "The URL of the proxy server.", + "type": "string" + }, + "proxy_username": { + "title": "Proxy username", + "description": "The username for proxy authentication.", + "type": "string", + "sensitive": true + }, + "proxy_password": { + "title": "Proxy password", + "description": "The password for proxy authentication.", + "type": "string", + "sensitive": true + }, + "headers": { + "title": "Headers", + "description": "Additional HTTP headers to include in the request.", + "type": [ + "object", + "null" + ], + "additionalProperties": { + "type": "string" + } + }, + "tls_skip_verify": { + "title": "Skip TLS verification", + "description": "If set, TLS certificate verification will be skipped.", + "type": "boolean" + }, + "tls_ca": { + "title": "TLS CA", + "description": "The path to the CA certificate file for TLS verification.", + "type": "string", + "pattern": "^$|^/" + }, + "tls_cert": { + "title": "TLS certificate", + "description": "The path to the client certificate file for TLS authentication.", + "type": "string", + "pattern": "^$|^/" + }, + "tls_key": { + "title": "TLS key", + "description": "The path to the client key file for TLS authentication.", + "type": "string", + "pattern": "^$|^/" + }, + "body": { + "title": "Body", + "type": "string" + }, + "method": { + "title": "Method", + "type": "string" + } + }, + "required": [ + "url" + ], + "additionalProperties": false, + "patternProperties": { + "^name$": {} + } + }, + "uiSchema": { + "uiOptions": { + "fullPage": true + }, + "body": { + "ui:widget": "hidden" + }, + "method": { + "ui:widget": "hidden" + }, + "timeout": { + "ui:help": "Accepts decimals for precise control (e.g., type 1.5 for 1.5 seconds)." + }, + "password": { + "ui:widget": "password" + }, + "proxy_password": { + "ui:widget": "password" + }, + "ui:flavour": "tabs", + "ui:options": { + "tabs": [ + { + "title": "Base", + "fields": [ + "update_every", + "url", + "timeout", + "not_follow_redirects" + ] + }, + { + "title": "Auth", + "fields": [ + "username", + "password" + ] + }, + { + "title": "TLS", + "fields": [ + "tls_skip_verify", + "tls_ca", + "tls_cert", + "tls_key" + ] + }, + { + "title": "Proxy", + "fields": [ + "proxy_url", + "proxy_username", + "proxy_password" + ] + }, + { + "title": "Headers", + "fields": [ + "headers" + ] + } + ] + } + } +} diff --git a/src/go/plugin/go.d/modules/squid/integrations/squid.md b/src/go/plugin/go.d/modules/squid/integrations/squid.md new file mode 100644 index 000000000..1a448de35 --- /dev/null +++ b/src/go/plugin/go.d/modules/squid/integrations/squid.md @@ -0,0 +1,227 @@ +<!--startmeta +custom_edit_url: "https://github.com/netdata/netdata/edit/master/src/go/plugin/go.d/modules/squid/README.md" +meta_yaml: "https://github.com/netdata/netdata/edit/master/src/go/plugin/go.d/modules/squid/metadata.yaml" +sidebar_label: "Squid" +learn_status: "Published" +learn_rel_path: "Collecting Metrics/Web Servers and Web Proxies" +most_popular: False +message: "DO NOT EDIT THIS FILE DIRECTLY, IT IS GENERATED BY THE COLLECTOR'S metadata.yaml FILE" +endmeta--> + +# Squid + + +<img src="https://netdata.cloud/img/squid.png" width="150"/> + + +Plugin: go.d.plugin +Module: squid + +<img src="https://img.shields.io/badge/maintained%20by-Netdata-%2300ab44" /> + +## Overview + +This collector monitors statistics about the Squid Clients and Servers, like bandwidth and requests. + + +It collects metrics from the `squid-internal-mgr/counters` endpoint. + +This collector is supported on all platforms. + +This collector supports collecting metrics from multiple instances of this integration, including remote instances. + + +### Default Behavior + +#### Auto-Detection + +By default, it detects Squid instances running on localhost that are listening on port 3128. +On startup, it tries to collect metrics from: + +- https://127.0.0.1:3128 + + +#### Limits + +The default configuration for this integration does not impose any limits on data collection. + +#### Performance Impact + +The default configuration for this integration is not expected to impose a significant performance impact on the system. + + +## Metrics + +Metrics grouped by *scope*. + +The scope defines the instance that the metric belongs to. An instance is uniquely identified by a set of labels. + + + +### Per Squid instance + +These metrics refer to each monitored Squid instance. + +This scope has no labels. + +Metrics: + +| Metric | Dimensions | Unit | +|:------|:----------|:----| +| squid.clients_net | in, out, hits | kilobits/s | +| squid.clients_requests | requests, hits, errors | requests/s | +| squid.servers_net | in, out | kilobits/s | +| squid.servers_requests | requests, errors | requests/s | + + + +## Alerts + +There are no alerts configured by default for this integration. + + +## Setup + +### Prerequisites + +No action required. + +### Configuration + +#### File + +The configuration file name for this integration is `go.d/squid.conf`. + + +You can edit the configuration file using the `edit-config` script from the +Netdata [config directory](/docs/netdata-agent/configuration/README.md#the-netdata-config-directory). + +```bash +cd /etc/netdata 2>/dev/null || cd /opt/netdata/etc/netdata +sudo ./edit-config go.d/squid.conf +``` +#### Options + +The following options can be defined globally: update_every, autodetection_retry. + + +<details open><summary>Config options</summary> + +| Name | Description | Default | Required | +|:----|:-----------|:-------|:--------:| +| update_every | Data collection frequency. | 1 | no | +| autodetection_retry | Recheck interval in seconds. Zero means no recheck will be scheduled. | 0 | no | +| url | Server URL. | http://127.0.0.1:3128 | yes | +| timeout | HTTP request timeout. | 1 | no | +| username | Username for basic HTTP authentication. | | no | +| password | Password for basic HTTP authentication. | | no | +| proxy_url | Proxy URL. | | no | +| proxy_username | Username for proxy basic HTTP authentication. | | no | +| proxy_password | Password for proxy basic HTTP authentication. | | no | +| method | HTTP request method. | POST | no | +| body | HTTP request body. | | no | +| headers | HTTP request headers. | | no | +| not_follow_redirects | Redirect handling policy. Controls whether the client follows redirects. | no | no | +| tls_skip_verify | Server certificate chain and hostname validation policy. Controls whether the client performs this check. | no | no | +| tls_ca | Certification authority that the client uses when verifying the server's certificates. | | no | +| tls_cert | Client TLS certificate. | | no | +| tls_key | Client TLS key. | | no | + +</details> + +#### Examples + +##### Basic + +A basic example configuration. + +```yaml +jobs: + - name: local + url: http://127.0.0.1:3128 + +``` +##### Multi-instance + +> **Note**: When you define multiple jobs, their names must be unique. + +Collecting metrics from local and remote instances. + + +<details open><summary>Config</summary> + +```yaml +jobs: + - name: local + url: http://127.0.0.1:3128 + + - name: remote + url: http://192.0.2.1:3128 + +``` +</details> + + + +## Troubleshooting + +### Debug Mode + +**Important**: Debug mode is not supported for data collection jobs created via the UI using the Dyncfg feature. + +To troubleshoot issues with the `squid` collector, run the `go.d.plugin` with the debug option enabled. The output +should give you clues as to why the collector isn't working. + +- Navigate to the `plugins.d` directory, usually at `/usr/libexec/netdata/plugins.d/`. If that's not the case on + your system, open `netdata.conf` and look for the `plugins` setting under `[directories]`. + + ```bash + cd /usr/libexec/netdata/plugins.d/ + ``` + +- Switch to the `netdata` user. + + ```bash + sudo -u netdata -s + ``` + +- Run the `go.d.plugin` to debug the collector: + + ```bash + ./go.d.plugin -d -m squid + ``` + +### Getting Logs + +If you're encountering problems with the `squid` collector, follow these steps to retrieve logs and identify potential issues: + +- **Run the command** specific to your system (systemd, non-systemd, or Docker container). +- **Examine the output** for any warnings or error messages that might indicate issues. These messages should provide clues about the root cause of the problem. + +#### System with systemd + +Use the following command to view logs generated since the last Netdata service restart: + +```bash +journalctl _SYSTEMD_INVOCATION_ID="$(systemctl show --value --property=InvocationID netdata)" --namespace=netdata --grep squid +``` + +#### System without systemd + +Locate the collector log file, typically at `/var/log/netdata/collector.log`, and use `grep` to filter for collector's name: + +```bash +grep squid /var/log/netdata/collector.log +``` + +**Note**: This method shows logs from all restarts. Focus on the **latest entries** for troubleshooting current issues. + +#### Docker Container + +If your Netdata runs in a Docker container named "netdata" (replace if different), use this command: + +```bash +docker logs netdata 2>&1 | grep squid +``` + + diff --git a/src/collectors/python.d.plugin/squid/metadata.yaml b/src/go/plugin/go.d/modules/squid/metadata.yaml index d0c5b3ecc..fbe0202ee 100644 --- a/src/collectors/python.d.plugin/squid/metadata.yaml +++ b/src/go/plugin/go.d/modules/squid/metadata.yaml @@ -1,11 +1,12 @@ -plugin_name: python.d.plugin +plugin_name: go.d.plugin modules: - meta: - plugin_name: python.d.plugin + id: collector-go.d.plugin-squid + plugin_name: go.d.plugin module_name: squid monitored_instance: name: Squid - link: "http://www.squid-cache.org/" + link: "https://www.squid-cache.org/" categories: - data-collection.web-servers-and-web-proxies icon_filename: "squid.png" @@ -23,7 +24,7 @@ modules: data_collection: metrics_description: | This collector monitors statistics about the Squid Clients and Servers, like bandwidth and requests. - method_description: "It collects metrics from the endpoint where Squid exposes its `counters` data." + method_description: "It collects metrics from the `squid-internal-mgr/counters` endpoint." supported_platforms: include: [] exclude: [] @@ -32,101 +33,121 @@ modules: description: "" default_behavior: auto_detection: - description: "By default, this collector will try to autodetect where Squid presents its `counters` data, by trying various configurations." + description: | + By default, it detects Squid instances running on localhost that are listening on port 3128. + On startup, it tries to collect metrics from: + + - https://127.0.0.1:3128 limits: description: "" performance_impact: description: "" setup: prerequisites: - list: - - title: Configure Squid's Cache Manager - description: | - Take a look at [Squid's official documentation](https://wiki.squid-cache.org/Features/CacheManager/Index#controlling-access-to-the-cache-manager) on how to configure access to the Cache Manager. + list: [] configuration: file: - name: "python.d/squid.conf" + name: "go.d/squid.conf" options: description: | - There are 2 sections: - - * Global variables - * One or more JOBS that can define multiple different instances to monitor. - - The following options can be defined globally: priority, penalty, autodetection_retry, update_every, but can also be defined per JOB to override the global values. - - Additionally, the following collapsed table contains all the options that can be configured inside a JOB definition. - - Every configuration JOB starts with a `job_name` value which will appear in the dashboard, unless a `name` parameter is specified. + The following options can be defined globally: update_every, autodetection_retry. folding: title: "Config options" enabled: true list: - name: update_every - description: Sets the default data collection frequency. + description: Data collection frequency. default_value: 1 required: false - - name: priority - description: Controls the order of charts at the netdata dashboard. - default_value: 60000 - required: false - name: autodetection_retry - description: Sets the job re-check interval in seconds. + description: Recheck interval in seconds. Zero means no recheck will be scheduled. default_value: 0 required: false - - name: penalty - description: Indicates whether to apply penalty to update_every in case of failures. - default_value: yes + - name: url + description: Server URL. + default_value: http://127.0.0.1:3128 + required: true + - name: timeout + description: HTTP request timeout. + default_value: 1 required: false - - name: name - description: > - Job name. This value will overwrite the `job_name` value. JOBS with the same name are mutually exclusive. Only one of them will be allowed running at any time. This allows autodetection to try several alternatives and pick the one that works. - default_value: "local" + - name: username + description: Username for basic HTTP authentication. + default_value: "" required: false - - name: host - description: The host to connect to. + - name: password + description: Password for basic HTTP authentication. default_value: "" - required: true - - name: port - description: The port to connect to. + required: false + - name: proxy_url + description: Proxy URL. default_value: "" - required: true - - name: request - description: The URL to request from Squid. + required: false + - name: proxy_username + description: Username for proxy basic HTTP authentication. default_value: "" - required: true + required: false + - name: proxy_password + description: Password for proxy basic HTTP authentication. + default_value: "" + required: false + - name: method + description: HTTP request method. + default_value: POST + required: false + - name: body + description: HTTP request body. + default_value: "" + required: false + - name: headers + description: HTTP request headers. + default_value: "" + required: false + - name: not_follow_redirects + description: Redirect handling policy. Controls whether the client follows redirects. + default_value: false + required: false + - name: tls_skip_verify + description: Server certificate chain and hostname validation policy. Controls whether the client performs this check. + default_value: false + required: false + - name: tls_ca + description: Certification authority that the client uses when verifying the server's certificates. + default_value: "" + required: false + - name: tls_cert + description: Client TLS certificate. + default_value: "" + required: false + - name: tls_key + description: Client TLS key. + default_value: "" + required: false examples: folding: enabled: true - title: "Config" + title: Config list: - name: Basic - description: A basic configuration example. + description: A basic example configuration. folding: enabled: false config: | - example_job_name: - name: 'local' - host: 'localhost' - port: 3128 - request: 'cache_object://localhost:3128/counters' + jobs: + - name: local + url: http://127.0.0.1:3128 - name: Multi-instance description: | > **Note**: When you define multiple jobs, their names must be unique. - + Collecting metrics from local and remote instances. config: | - local_job: - name: 'local' - host: '127.0.0.1' - port: 3128 - request: 'cache_object://127.0.0.1:3128/counters' - - remote_job: - name: 'remote' - host: '192.0.2.1' - port: 3128 - request: 'cache_object://192.0.2.1:3128/counters' + jobs: + - name: local + url: http://127.0.0.1:3128 + + - name: remote + url: http://192.0.2.1:3128 troubleshooting: problems: list: [] diff --git a/src/go/plugin/go.d/modules/squid/squid.go b/src/go/plugin/go.d/modules/squid/squid.go new file mode 100644 index 000000000..fe9c15ecb --- /dev/null +++ b/src/go/plugin/go.d/modules/squid/squid.go @@ -0,0 +1,114 @@ +// SPDX-License-Identifier: GPL-3.0-or-later + +package squid + +import ( + _ "embed" + "errors" + "net/http" + "time" + + "github.com/netdata/netdata/go/plugins/plugin/go.d/agent/module" + "github.com/netdata/netdata/go/plugins/plugin/go.d/pkg/web" +) + +//go:embed "config_schema.json" +var configSchema string + +func init() { + module.Register("squid", module.Creator{ + JobConfigSchema: configSchema, + Create: func() module.Module { return New() }, + Config: func() any { return &Config{} }, + }) +} + +func New() *Squid { + return &Squid{ + Config: Config{ + HTTP: web.HTTP{ + Request: web.Request{ + URL: "http://127.0.0.1:3128", + }, + Client: web.Client{ + Timeout: web.Duration(time.Second * 1), + }, + }, + }, + charts: charts.Copy(), + } +} + +type Config struct { + UpdateEvery int `yaml:"update_every,omitempty" json:"update_every"` + web.HTTP `yaml:",inline" json:""` +} + +type Squid struct { + module.Base + Config `yaml:",inline" json:""` + + charts *module.Charts + + httpClient *http.Client +} + +func (s *Squid) Configuration() any { + return s.Config +} + +func (s *Squid) Init() error { + if s.URL == "" { + s.Error("URL not set") + return errors.New("url not set") + } + + client, err := web.NewHTTPClient(s.Client) + if err != nil { + s.Error(err) + return err + } + s.httpClient = client + + s.Debugf("using URL %s", s.URL) + s.Debugf("using timeout: %s", s.Timeout) + + return nil +} + +func (s *Squid) Check() error { + mx, err := s.collect() + if err != nil { + s.Error(err) + return err + } + + if len(mx) == 0 { + return errors.New("no metrics collected") + } + + return nil +} + +func (s *Squid) Charts() *module.Charts { + return s.charts +} + +func (s *Squid) Collect() map[string]int64 { + mx, err := s.collect() + if err != nil { + s.Error(err) + } + + if len(mx) == 0 { + return nil + } + + return mx +} + +func (s *Squid) Cleanup() { + if s.httpClient != nil { + s.httpClient.CloseIdleConnections() + } +} diff --git a/src/go/plugin/go.d/modules/squid/squid_test.go b/src/go/plugin/go.d/modules/squid/squid_test.go new file mode 100644 index 000000000..c0856f89d --- /dev/null +++ b/src/go/plugin/go.d/modules/squid/squid_test.go @@ -0,0 +1,223 @@ +// SPDX-License-Identifier: GPL-3.0-or-later + +package squid + +import ( + "net/http" + "net/http/httptest" + "os" + "testing" + + "github.com/netdata/netdata/go/plugins/plugin/go.d/agent/module" + "github.com/netdata/netdata/go/plugins/plugin/go.d/pkg/web" + + "github.com/stretchr/testify/assert" + "github.com/stretchr/testify/require" +) + +var ( + dataConfigJSON, _ = os.ReadFile("testdata/config.json") + dataConfigYAML, _ = os.ReadFile("testdata/config.yaml") + dataCounters, _ = os.ReadFile("testdata/counters.txt") +) + +func Test_testDataIsValid(t *testing.T) { + for name, data := range map[string][]byte{ + "dataConfigJSON": dataConfigJSON, + "dataConfigYAML": dataConfigYAML, + "dataCounters": dataCounters, + } { + require.NotNil(t, data, name) + } +} + +func TestSquid_ConfigurationSerialize(t *testing.T) { + module.TestConfigurationSerialize(t, &Squid{}, dataConfigJSON, dataConfigYAML) +} + +func TestSquid_Init(t *testing.T) { + tests := map[string]struct { + wantFail bool + config Config + }{ + "success with default": { + wantFail: false, + config: New().Config, + }, + "fail when URL not set": { + wantFail: true, + config: Config{ + HTTP: web.HTTP{ + Request: web.Request{URL: ""}, + }, + }, + }, + } + + for name, test := range tests { + t.Run(name, func(t *testing.T) { + squid := New() + squid.Config = test.config + + if test.wantFail { + assert.Error(t, squid.Init()) + } else { + assert.NoError(t, squid.Init()) + } + }) + } +} + +func TestSquid_Charts(t *testing.T) { + assert.NotNil(t, New().Charts()) +} + +func TestSquid_Check(t *testing.T) { + tests := map[string]struct { + wantFail bool + prepare func(t *testing.T) (*Squid, func()) + }{ + "success case": { + wantFail: false, + prepare: prepareCaseSuccess, + }, + "fails on unexpected response": { + wantFail: true, + prepare: prepareCaseUnexpectedResponse, + }, + "fails on empty response": { + wantFail: true, + prepare: prepareCaseEmptyResponse, + }, + "fails on connection refused": { + wantFail: true, + prepare: prepareCaseConnectionRefused, + }, + } + + for name, test := range tests { + t.Run(name, func(t *testing.T) { + squid, cleanup := test.prepare(t) + defer cleanup() + + if test.wantFail { + assert.Error(t, squid.Check()) + } else { + assert.NoError(t, squid.Check()) + } + }) + } +} + +func TestSquid_Collect(t *testing.T) { + tests := map[string]struct { + prepare func(t *testing.T) (*Squid, func()) + wantMetrics map[string]int64 + wantCharts int + }{ + "success case": { + prepare: prepareCaseSuccess, + wantCharts: len(charts), + wantMetrics: map[string]int64{ + "client_http.errors": 5, + "client_http.hit_kbytes_out": 11, + "client_http.hits": 1, + "client_http.kbytes_in": 566, + "client_http.kbytes_out": 16081, + "client_http.requests": 9019, + "server.all.errors": 0, + "server.all.kbytes_in": 0, + "server.all.kbytes_out": 0, + "server.all.requests": 0, + }, + }, + "fails on unexpected response": { + prepare: prepareCaseUnexpectedResponse, + }, + "fails on empty response": { + prepare: prepareCaseEmptyResponse, + }, + "fails on connection refused": { + prepare: prepareCaseConnectionRefused, + }, + } + + for name, test := range tests { + t.Run(name, func(t *testing.T) { + squid, cleanup := test.prepare(t) + defer cleanup() + + mx := squid.Collect() + + require.Equal(t, test.wantMetrics, mx) + + if len(test.wantMetrics) > 0 { + assert.Equal(t, test.wantCharts, len(*squid.Charts())) + module.TestMetricsHasAllChartsDims(t, squid.Charts(), mx) + } + }) + } +} + +func prepareCaseSuccess(t *testing.T) (*Squid, func()) { + t.Helper() + srv := httptest.NewServer(http.HandlerFunc( + func(w http.ResponseWriter, r *http.Request) { + switch r.URL.Path { + case urlPathServerStats: + _, _ = w.Write(dataCounters) + default: + w.WriteHeader(http.StatusNotFound) + } + })) + + squid := New() + squid.URL = srv.URL + require.NoError(t, squid.Init()) + + return squid, srv.Close +} + +func prepareCaseUnexpectedResponse(t *testing.T) (*Squid, func()) { + t.Helper() + resp := []byte(` +Lorem ipsum dolor sit amet, consectetur adipiscing elit. +Nulla malesuada erat id magna mattis, eu viverra tellus rhoncus. +Fusce et felis pulvinar, posuere sem non, porttitor eros.`) + + srv := httptest.NewServer(http.HandlerFunc( + func(w http.ResponseWriter, r *http.Request) { + _, _ = w.Write([]byte(resp)) + })) + + squid := New() + squid.URL = srv.URL + require.NoError(t, squid.Init()) + + return squid, srv.Close +} + +func prepareCaseEmptyResponse(t *testing.T) (*Squid, func()) { + t.Helper() + resp := []byte(``) + + srv := httptest.NewServer(http.HandlerFunc( + func(w http.ResponseWriter, r *http.Request) { + _, _ = w.Write([]byte(resp)) + })) + + squid := New() + squid.URL = srv.URL + require.NoError(t, squid.Init()) + + return squid, srv.Close +} + +func prepareCaseConnectionRefused(t *testing.T) (*Squid, func()) { + t.Helper() + squid := New() + squid.URL = "http://127.0.0.1:65001" + require.NoError(t, squid.Init()) + + return squid, func() {} +} diff --git a/src/go/plugin/go.d/modules/squid/testdata/config.json b/src/go/plugin/go.d/modules/squid/testdata/config.json new file mode 100644 index 000000000..984c3ed6e --- /dev/null +++ b/src/go/plugin/go.d/modules/squid/testdata/config.json @@ -0,0 +1,20 @@ +{ + "update_every": 123, + "url": "ok", + "body": "ok", + "method": "ok", + "headers": { + "ok": "ok" + }, + "username": "ok", + "password": "ok", + "proxy_url": "ok", + "proxy_username": "ok", + "proxy_password": "ok", + "timeout": 123.123, + "not_follow_redirects": true, + "tls_ca": "ok", + "tls_cert": "ok", + "tls_key": "ok", + "tls_skip_verify": true +} diff --git a/src/go/plugin/go.d/modules/squid/testdata/config.yaml b/src/go/plugin/go.d/modules/squid/testdata/config.yaml new file mode 100644 index 000000000..8558b61cc --- /dev/null +++ b/src/go/plugin/go.d/modules/squid/testdata/config.yaml @@ -0,0 +1,17 @@ +update_every: 123 +url: "ok" +body: "ok" +method: "ok" +headers: + ok: "ok" +username: "ok" +password: "ok" +proxy_url: "ok" +proxy_username: "ok" +proxy_password: "ok" +timeout: 123.123 +not_follow_redirects: yes +tls_ca: "ok" +tls_cert: "ok" +tls_key: "ok" +tls_skip_verify: yes diff --git a/src/go/plugin/go.d/modules/squid/testdata/counters.txt b/src/go/plugin/go.d/modules/squid/testdata/counters.txt new file mode 100644 index 000000000..250a003d3 --- /dev/null +++ b/src/go/plugin/go.d/modules/squid/testdata/counters.txt @@ -0,0 +1,59 @@ +sample_time = 1723030944.784818 (Wed, 07 Aug 2024 11:42:24 GMT) +client_http.requests = 9019 +client_http.hits = 1 +client_http.errors = 5 +client_http.kbytes_in = 566 +client_http.kbytes_out = 16081 +client_http.hit_kbytes_out = 11 +server.all.requests = 0 +server.all.errors = 0 +server.all.kbytes_in = 0 +server.all.kbytes_out = 0 +server.http.requests = 0 +server.http.errors = 0 +server.http.kbytes_in = 0 +server.http.kbytes_out = 0 +server.ftp.requests = 0 +server.ftp.errors = 0 +server.ftp.kbytes_in = 0 +server.ftp.kbytes_out = 0 +server.other.requests = 0 +server.other.errors = 0 +server.other.kbytes_in = 0 +server.other.kbytes_out = 0 +icp.pkts_sent = 0 +icp.pkts_recv = 0 +icp.queries_sent = 0 +icp.replies_sent = 0 +icp.queries_recv = 0 +icp.replies_recv = 0 +icp.query_timeouts = 0 +icp.replies_queued = 0 +icp.kbytes_sent = 0 +icp.kbytes_recv = 0 +icp.q_kbytes_sent = 0 +icp.r_kbytes_sent = 0 +icp.q_kbytes_recv = 0 +icp.r_kbytes_recv = 0 +icp.times_used = 0 +cd.times_used = 0 +cd.msgs_sent = 0 +cd.msgs_recv = 0 +cd.memory = 0 +cd.local_memory = 0 +cd.kbytes_sent = 0 +cd.kbytes_recv = 0 +unlink.requests = 0 +page_faults = 874 +select_loops = 91146 +cpu_time = 8.501572 +wall_time = 13.524214 +swap.outs = 0 +swap.ins = 0 +swap.files_cleaned = 0 +aborted_requests = 0 +hit_validation.attempts = 0 +hit_validation.refusals.due_to_locking = 0 +hit_validation.refusals.due_to_zeroSize = 0 +hit_validation.refusals.due_to_timeLimit = 0 +hit_validation.failures = 0 diff --git a/src/go/collectors/go.d.plugin/modules/squidlog/README.md b/src/go/plugin/go.d/modules/squidlog/README.md index 876d4b47a..876d4b47a 120000 --- a/src/go/collectors/go.d.plugin/modules/squidlog/README.md +++ b/src/go/plugin/go.d/modules/squidlog/README.md diff --git a/src/go/collectors/go.d.plugin/modules/squidlog/charts.go b/src/go/plugin/go.d/modules/squidlog/charts.go index dfac22498..92875eaf9 100644 --- a/src/go/collectors/go.d.plugin/modules/squidlog/charts.go +++ b/src/go/plugin/go.d/modules/squidlog/charts.go @@ -5,7 +5,7 @@ package squidlog import ( "errors" - "github.com/netdata/netdata/go/go.d.plugin/agent/module" + "github.com/netdata/netdata/go/plugins/plugin/go.d/agent/module" ) type ( diff --git a/src/go/collectors/go.d.plugin/modules/squidlog/collect.go b/src/go/plugin/go.d/modules/squidlog/collect.go index e0ebb6eb4..ee548b5be 100644 --- a/src/go/collectors/go.d.plugin/modules/squidlog/collect.go +++ b/src/go/plugin/go.d/modules/squidlog/collect.go @@ -8,10 +8,10 @@ import ( "strconv" "strings" - "github.com/netdata/netdata/go/go.d.plugin/pkg/logs" - "github.com/netdata/netdata/go/go.d.plugin/pkg/stm" + "github.com/netdata/netdata/go/plugins/plugin/go.d/pkg/logs" + "github.com/netdata/netdata/go/plugins/plugin/go.d/pkg/stm" - "github.com/netdata/netdata/go/go.d.plugin/agent/module" + "github.com/netdata/netdata/go/plugins/plugin/go.d/agent/module" ) func (s *SquidLog) logPanicStackIfAny() { diff --git a/src/go/collectors/go.d.plugin/modules/squidlog/config_schema.json b/src/go/plugin/go.d/modules/squidlog/config_schema.json index 47e55b09b..47e55b09b 100644 --- a/src/go/collectors/go.d.plugin/modules/squidlog/config_schema.json +++ b/src/go/plugin/go.d/modules/squidlog/config_schema.json diff --git a/src/go/collectors/go.d.plugin/modules/squidlog/init.go b/src/go/plugin/go.d/modules/squidlog/init.go index b995b3e65..fd3a76c9a 100644 --- a/src/go/collectors/go.d.plugin/modules/squidlog/init.go +++ b/src/go/plugin/go.d/modules/squidlog/init.go @@ -3,11 +3,10 @@ package squidlog import ( - "bytes" "fmt" "strings" - "github.com/netdata/netdata/go/go.d.plugin/pkg/logs" + "github.com/netdata/netdata/go/plugins/plugin/go.d/pkg/logs" ) func (s *SquidLog) createLogReader() error { @@ -26,28 +25,48 @@ func (s *SquidLog) createLogReader() error { func (s *SquidLog) createParser() error { s.Debug("starting parser creating") - lastLine, err := logs.ReadLastLine(s.file.CurrentFilename(), 0) - if err != nil { - return fmt.Errorf("read last line: %v", err) - } - lastLine = bytes.TrimRight(lastLine, "\n") - s.Debugf("last line: '%s'", string(lastLine)) + const readLastLinesNum = 100 - s.parser, err = logs.NewParser(s.ParserConfig, s.file) + lines, err := logs.ReadLastLines(s.file.CurrentFilename(), readLastLinesNum) if err != nil { - return fmt.Errorf("create parser: %v", err) + return fmt.Errorf("failed to read last lines: %v", err) } - s.Debugf("created parser: %s", s.parser.Info()) - err = s.parser.Parse(lastLine, s.line) - if err != nil { - return fmt.Errorf("parse last line: %v (%s)", err, string(lastLine)) + var found bool + for _, line := range lines { + if line = strings.TrimSpace(line); line == "" { + continue + } + + s.Debugf("last line: '%s'", line) + + s.parser, err = logs.NewParser(s.ParserConfig, s.file) + if err != nil { + s.Debugf("failed to create parser from line: %v", err) + continue + } + + s.line.reset() + + if err = s.parser.Parse([]byte(line), s.line); err != nil { + s.Debugf("failed to parse line: %v", err) + continue + } + + if err = s.line.verify(); err != nil { + s.Debugf("failed to verify line: %v", err) + continue + } + + found = true + break } - if err = s.line.verify(); err != nil { - return fmt.Errorf("verify last line: %v (%s)", err, string(lastLine)) + if !found { + return fmt.Errorf("failed to create log parser (file '%s')", s.file.CurrentFilename()) } + return nil } diff --git a/src/go/collectors/go.d.plugin/modules/squidlog/integrations/squid_log_files.md b/src/go/plugin/go.d/modules/squidlog/integrations/squid_log_files.md index 0cf064b23..7d1e4799e 100644 --- a/src/go/collectors/go.d.plugin/modules/squidlog/integrations/squid_log_files.md +++ b/src/go/plugin/go.d/modules/squidlog/integrations/squid_log_files.md @@ -1,6 +1,6 @@ <!--startmeta -custom_edit_url: "https://github.com/netdata/netdata/edit/master/src/go/collectors/go.d.plugin/modules/squidlog/README.md" -meta_yaml: "https://github.com/netdata/netdata/edit/master/src/go/collectors/go.d.plugin/modules/squidlog/metadata.yaml" +custom_edit_url: "https://github.com/netdata/netdata/edit/master/src/go/plugin/go.d/modules/squidlog/README.md" +meta_yaml: "https://github.com/netdata/netdata/edit/master/src/go/plugin/go.d/modules/squidlog/metadata.yaml" sidebar_label: "Squid log files" learn_status: "Published" learn_rel_path: "Collecting Metrics/Web Servers and Web Proxies" @@ -224,6 +224,8 @@ There are no configuration examples. ### Debug Mode +**Important**: Debug mode is not supported for data collection jobs created via the UI using the Dyncfg feature. + To troubleshoot issues with the `squidlog` collector, run the `go.d.plugin` with the debug option enabled. The output should give you clues as to why the collector isn't working. @@ -246,4 +248,37 @@ should give you clues as to why the collector isn't working. ./go.d.plugin -d -m squidlog ``` +### Getting Logs + +If you're encountering problems with the `squidlog` collector, follow these steps to retrieve logs and identify potential issues: + +- **Run the command** specific to your system (systemd, non-systemd, or Docker container). +- **Examine the output** for any warnings or error messages that might indicate issues. These messages should provide clues about the root cause of the problem. + +#### System with systemd + +Use the following command to view logs generated since the last Netdata service restart: + +```bash +journalctl _SYSTEMD_INVOCATION_ID="$(systemctl show --value --property=InvocationID netdata)" --namespace=netdata --grep squidlog +``` + +#### System without systemd + +Locate the collector log file, typically at `/var/log/netdata/collector.log`, and use `grep` to filter for collector's name: + +```bash +grep squidlog /var/log/netdata/collector.log +``` + +**Note**: This method shows logs from all restarts. Focus on the **latest entries** for troubleshooting current issues. + +#### Docker Container + +If your Netdata runs in a Docker container named "netdata" (replace if different), use this command: + +```bash +docker logs netdata 2>&1 | grep squidlog +``` + diff --git a/src/go/collectors/go.d.plugin/modules/squidlog/logline.go b/src/go/plugin/go.d/modules/squidlog/logline.go index e3d200eaf..47a8bf8f9 100644 --- a/src/go/collectors/go.d.plugin/modules/squidlog/logline.go +++ b/src/go/plugin/go.d/modules/squidlog/logline.go @@ -245,10 +245,16 @@ func (l *logLine) assignMimeType(mime string) error { } // format: type/subtype, type/subtype;parameter=value i := strings.IndexByte(mime, '/') - if i <= 0 || !isMimeTypeValid(mime[:i]) { + if i <= 0 { return fmt.Errorf("assign '%s': %w", mime, errBadMimeType) } + + if !isMimeTypeValid(mime[:i]) { + return nil + } + l.mimeType = mime[:i] // drop subtype + return nil } @@ -345,7 +351,7 @@ func isRespTimeValid(time int) bool { // isCacheCodeValid does not guarantee cache result code is valid, but it is very likely. func isCacheCodeValid(code string) bool { // https://wiki.squid-cache.org/SquidFaq/SquidLogs#Squid_result_codes - if code == "NONE" { + if code == "NONE" || code == "NONE_NONE" { return true } return len(code) > 5 && (code[:4] == "TCP_" || code[:4] == "UDP_") diff --git a/src/go/collectors/go.d.plugin/modules/squidlog/logline_test.go b/src/go/plugin/go.d/modules/squidlog/logline_test.go index 4a9069e3f..cb3f399fe 100644 --- a/src/go/collectors/go.d.plugin/modules/squidlog/logline_test.go +++ b/src/go/plugin/go.d/modules/squidlog/logline_test.go @@ -60,6 +60,7 @@ func TestLogLine_Assign(t *testing.T) { {input: "UDP_MISS_NOFETCH", wantLine: logLine{cacheCode: "UDP_MISS_NOFETCH"}}, {input: "UDP_INVALID", wantLine: logLine{cacheCode: "UDP_INVALID"}}, {input: "NONE", wantLine: logLine{cacheCode: "NONE"}}, + {input: "NONE_NONE", wantLine: logLine{cacheCode: "NONE_NONE"}}, {input: emptyStr, wantLine: emptyLogLine}, {input: hyphen, wantLine: emptyLogLine, wantErr: errBadCacheCode}, {input: "TCP", wantLine: emptyLogLine, wantErr: errBadCacheCode}, @@ -173,8 +174,8 @@ func TestLogLine_Assign(t *testing.T) { {input: "video/3gpp", wantLine: logLine{mimeType: "video"}}, {input: emptyStr, wantLine: emptyLogLine}, {input: hyphen, wantLine: emptyLogLine}, - {input: "example/example", wantLine: emptyLogLine, wantErr: errBadMimeType}, - {input: "unknown/example", wantLine: emptyLogLine, wantErr: errBadMimeType}, + {input: "example/example", wantLine: emptyLogLine}, + {input: "unknown/example", wantLine: emptyLogLine}, {input: "audio", wantLine: emptyLogLine, wantErr: errBadMimeType}, {input: "/", wantLine: emptyLogLine, wantErr: errBadMimeType}, }, @@ -274,6 +275,7 @@ func TestLogLine_verify(t *testing.T) { {input: "UDP_MISS_NOFETCH"}, {input: "UDP_INVALID"}, {input: "NONE"}, + {input: "NONE_NONE"}, {input: emptyStr}, {input: "TCP", wantErr: errBadCacheCode}, {input: "UDP", wantErr: errBadCacheCode}, diff --git a/src/go/collectors/go.d.plugin/modules/squidlog/metadata.yaml b/src/go/plugin/go.d/modules/squidlog/metadata.yaml index 82712f9e5..82712f9e5 100644 --- a/src/go/collectors/go.d.plugin/modules/squidlog/metadata.yaml +++ b/src/go/plugin/go.d/modules/squidlog/metadata.yaml diff --git a/src/go/collectors/go.d.plugin/modules/squidlog/metrics.go b/src/go/plugin/go.d/modules/squidlog/metrics.go index 3754e022b..031f832a1 100644 --- a/src/go/collectors/go.d.plugin/modules/squidlog/metrics.go +++ b/src/go/plugin/go.d/modules/squidlog/metrics.go @@ -2,7 +2,7 @@ package squidlog -import "github.com/netdata/netdata/go/go.d.plugin/pkg/metrics" +import "github.com/netdata/netdata/go/plugins/plugin/go.d/pkg/metrics" func newSummary() metrics.Summary { return &summary{metrics.NewSummary()} diff --git a/src/go/collectors/go.d.plugin/modules/squidlog/squidlog.go b/src/go/plugin/go.d/modules/squidlog/squidlog.go index 6b5d36263..e2e743c69 100644 --- a/src/go/collectors/go.d.plugin/modules/squidlog/squidlog.go +++ b/src/go/plugin/go.d/modules/squidlog/squidlog.go @@ -5,8 +5,8 @@ package squidlog import ( _ "embed" - "github.com/netdata/netdata/go/go.d.plugin/agent/module" - "github.com/netdata/netdata/go/go.d.plugin/pkg/logs" + "github.com/netdata/netdata/go/plugins/plugin/go.d/agent/module" + "github.com/netdata/netdata/go/plugins/plugin/go.d/pkg/logs" ) //go:embed "config_schema.json" diff --git a/src/go/collectors/go.d.plugin/modules/squidlog/squidlog_test.go b/src/go/plugin/go.d/modules/squidlog/squidlog_test.go index 5cc8a7285..eb5ce635f 100644 --- a/src/go/collectors/go.d.plugin/modules/squidlog/squidlog_test.go +++ b/src/go/plugin/go.d/modules/squidlog/squidlog_test.go @@ -7,10 +7,10 @@ import ( "os" "testing" - "github.com/netdata/netdata/go/go.d.plugin/pkg/logs" - "github.com/netdata/netdata/go/go.d.plugin/pkg/metrics" + "github.com/netdata/netdata/go/plugins/plugin/go.d/pkg/logs" + "github.com/netdata/netdata/go/plugins/plugin/go.d/pkg/metrics" - "github.com/netdata/netdata/go/go.d.plugin/agent/module" + "github.com/netdata/netdata/go/plugins/plugin/go.d/agent/module" "github.com/stretchr/testify/assert" "github.com/stretchr/testify/require" ) diff --git a/src/go/collectors/go.d.plugin/modules/squidlog/testdata/access.log b/src/go/plugin/go.d/modules/squidlog/testdata/access.log index 64a23d35b..64a23d35b 100644 --- a/src/go/collectors/go.d.plugin/modules/squidlog/testdata/access.log +++ b/src/go/plugin/go.d/modules/squidlog/testdata/access.log diff --git a/src/go/collectors/go.d.plugin/modules/squidlog/testdata/config.json b/src/go/plugin/go.d/modules/squidlog/testdata/config.json index 5d563cc7e..5d563cc7e 100644 --- a/src/go/collectors/go.d.plugin/modules/squidlog/testdata/config.json +++ b/src/go/plugin/go.d/modules/squidlog/testdata/config.json diff --git a/src/go/collectors/go.d.plugin/modules/squidlog/testdata/config.yaml b/src/go/plugin/go.d/modules/squidlog/testdata/config.yaml index 701205e23..701205e23 100644 --- a/src/go/collectors/go.d.plugin/modules/squidlog/testdata/config.yaml +++ b/src/go/plugin/go.d/modules/squidlog/testdata/config.yaml diff --git a/src/go/collectors/go.d.plugin/modules/squidlog/testdata/unknown.log b/src/go/plugin/go.d/modules/squidlog/testdata/unknown.log index 0478a5c18..0478a5c18 100644 --- a/src/go/collectors/go.d.plugin/modules/squidlog/testdata/unknown.log +++ b/src/go/plugin/go.d/modules/squidlog/testdata/unknown.log diff --git a/src/go/collectors/go.d.plugin/modules/storcli/README.md b/src/go/plugin/go.d/modules/storcli/README.md index 482049b19..482049b19 120000 --- a/src/go/collectors/go.d.plugin/modules/storcli/README.md +++ b/src/go/plugin/go.d/modules/storcli/README.md diff --git a/src/go/collectors/go.d.plugin/modules/storcli/charts.go b/src/go/plugin/go.d/modules/storcli/charts.go index 9730c14e7..3e0c07c1d 100644 --- a/src/go/collectors/go.d.plugin/modules/storcli/charts.go +++ b/src/go/plugin/go.d/modules/storcli/charts.go @@ -7,7 +7,7 @@ import ( "strconv" "strings" - "github.com/netdata/netdata/go/go.d.plugin/agent/module" + "github.com/netdata/netdata/go/plugins/plugin/go.d/agent/module" ) const ( diff --git a/src/go/collectors/go.d.plugin/modules/storcli/collect.go b/src/go/plugin/go.d/modules/storcli/collect.go index df2b09d87..df2b09d87 100644 --- a/src/go/collectors/go.d.plugin/modules/storcli/collect.go +++ b/src/go/plugin/go.d/modules/storcli/collect.go diff --git a/src/go/collectors/go.d.plugin/modules/storcli/collect_controllers.go b/src/go/plugin/go.d/modules/storcli/collect_controllers.go index 64d615946..64d615946 100644 --- a/src/go/collectors/go.d.plugin/modules/storcli/collect_controllers.go +++ b/src/go/plugin/go.d/modules/storcli/collect_controllers.go diff --git a/src/go/collectors/go.d.plugin/modules/storcli/collect_drives.go b/src/go/plugin/go.d/modules/storcli/collect_drives.go index 5c2ecb387..5c2ecb387 100644 --- a/src/go/collectors/go.d.plugin/modules/storcli/collect_drives.go +++ b/src/go/plugin/go.d/modules/storcli/collect_drives.go diff --git a/src/go/collectors/go.d.plugin/modules/storcli/config_schema.json b/src/go/plugin/go.d/modules/storcli/config_schema.json index 226a370f4..226a370f4 100644 --- a/src/go/collectors/go.d.plugin/modules/storcli/config_schema.json +++ b/src/go/plugin/go.d/modules/storcli/config_schema.json diff --git a/src/go/collectors/go.d.plugin/modules/storcli/exec.go b/src/go/plugin/go.d/modules/storcli/exec.go index 3375ddbe4..5be88a899 100644 --- a/src/go/collectors/go.d.plugin/modules/storcli/exec.go +++ b/src/go/plugin/go.d/modules/storcli/exec.go @@ -8,7 +8,7 @@ import ( "os/exec" "time" - "github.com/netdata/netdata/go/go.d.plugin/logger" + "github.com/netdata/netdata/go/plugins/logger" ) func newStorCliExec(ndsudoPath string, timeout time.Duration, log *logger.Logger) *storCliExec { diff --git a/src/go/collectors/go.d.plugin/modules/storcli/init.go b/src/go/plugin/go.d/modules/storcli/init.go index 297f7c8c3..d35ad07db 100644 --- a/src/go/collectors/go.d.plugin/modules/storcli/init.go +++ b/src/go/plugin/go.d/modules/storcli/init.go @@ -7,7 +7,7 @@ import ( "os" "path/filepath" - "github.com/netdata/netdata/go/go.d.plugin/agent/executable" + "github.com/netdata/netdata/go/plugins/pkg/executable" ) func (s *StorCli) initStorCliExec() (storCli, error) { diff --git a/src/go/collectors/go.d.plugin/modules/storcli/integrations/storecli_raid.md b/src/go/plugin/go.d/modules/storcli/integrations/storecli_raid.md index f6197b4e3..9b8b28480 100644 --- a/src/go/collectors/go.d.plugin/modules/storcli/integrations/storecli_raid.md +++ b/src/go/plugin/go.d/modules/storcli/integrations/storecli_raid.md @@ -1,6 +1,6 @@ <!--startmeta -custom_edit_url: "https://github.com/netdata/netdata/edit/master/src/go/collectors/go.d.plugin/modules/storcli/README.md" -meta_yaml: "https://github.com/netdata/netdata/edit/master/src/go/collectors/go.d.plugin/modules/storcli/metadata.yaml" +custom_edit_url: "https://github.com/netdata/netdata/edit/master/src/go/plugin/go.d/modules/storcli/README.md" +meta_yaml: "https://github.com/netdata/netdata/edit/master/src/go/plugin/go.d/modules/storcli/metadata.yaml" sidebar_label: "StoreCLI RAID" learn_status: "Published" learn_rel_path: "Collecting Metrics/Storage, Mount Points and Filesystems" @@ -192,6 +192,8 @@ jobs: ### Debug Mode +**Important**: Debug mode is not supported for data collection jobs created via the UI using the Dyncfg feature. + To troubleshoot issues with the `storcli` collector, run the `go.d.plugin` with the debug option enabled. The output should give you clues as to why the collector isn't working. @@ -214,4 +216,37 @@ should give you clues as to why the collector isn't working. ./go.d.plugin -d -m storcli ``` +### Getting Logs + +If you're encountering problems with the `storcli` collector, follow these steps to retrieve logs and identify potential issues: + +- **Run the command** specific to your system (systemd, non-systemd, or Docker container). +- **Examine the output** for any warnings or error messages that might indicate issues. These messages should provide clues about the root cause of the problem. + +#### System with systemd + +Use the following command to view logs generated since the last Netdata service restart: + +```bash +journalctl _SYSTEMD_INVOCATION_ID="$(systemctl show --value --property=InvocationID netdata)" --namespace=netdata --grep storcli +``` + +#### System without systemd + +Locate the collector log file, typically at `/var/log/netdata/collector.log`, and use `grep` to filter for collector's name: + +```bash +grep storcli /var/log/netdata/collector.log +``` + +**Note**: This method shows logs from all restarts. Focus on the **latest entries** for troubleshooting current issues. + +#### Docker Container + +If your Netdata runs in a Docker container named "netdata" (replace if different), use this command: + +```bash +docker logs netdata 2>&1 | grep storcli +``` + diff --git a/src/go/collectors/go.d.plugin/modules/storcli/metadata.yaml b/src/go/plugin/go.d/modules/storcli/metadata.yaml index 7e807f056..7e807f056 100644 --- a/src/go/collectors/go.d.plugin/modules/storcli/metadata.yaml +++ b/src/go/plugin/go.d/modules/storcli/metadata.yaml diff --git a/src/go/collectors/go.d.plugin/modules/storcli/storcli.go b/src/go/plugin/go.d/modules/storcli/storcli.go index 7dd650d6c..0133c4700 100644 --- a/src/go/collectors/go.d.plugin/modules/storcli/storcli.go +++ b/src/go/plugin/go.d/modules/storcli/storcli.go @@ -7,8 +7,8 @@ import ( "errors" "time" - "github.com/netdata/netdata/go/go.d.plugin/agent/module" - "github.com/netdata/netdata/go/go.d.plugin/pkg/web" + "github.com/netdata/netdata/go/plugins/plugin/go.d/agent/module" + "github.com/netdata/netdata/go/plugins/plugin/go.d/pkg/web" ) //go:embed "config_schema.json" diff --git a/src/go/collectors/go.d.plugin/modules/storcli/storcli_test.go b/src/go/plugin/go.d/modules/storcli/storcli_test.go index ad1b43f0e..63ee54b56 100644 --- a/src/go/collectors/go.d.plugin/modules/storcli/storcli_test.go +++ b/src/go/plugin/go.d/modules/storcli/storcli_test.go @@ -7,7 +7,7 @@ import ( "os" "testing" - "github.com/netdata/netdata/go/go.d.plugin/agent/module" + "github.com/netdata/netdata/go/plugins/plugin/go.d/agent/module" "github.com/stretchr/testify/assert" "github.com/stretchr/testify/require" diff --git a/src/go/plugin/go.d/modules/storcli/testdata/config.json b/src/go/plugin/go.d/modules/storcli/testdata/config.json new file mode 100644 index 000000000..291ecee3d --- /dev/null +++ b/src/go/plugin/go.d/modules/storcli/testdata/config.json @@ -0,0 +1,4 @@ +{ + "update_every": 123, + "timeout": 123.123 +} diff --git a/src/go/plugin/go.d/modules/storcli/testdata/config.yaml b/src/go/plugin/go.d/modules/storcli/testdata/config.yaml new file mode 100644 index 000000000..25b0b4c78 --- /dev/null +++ b/src/go/plugin/go.d/modules/storcli/testdata/config.yaml @@ -0,0 +1,2 @@ +update_every: 123 +timeout: 123.123 diff --git a/src/go/collectors/go.d.plugin/modules/storcli/testdata/megaraid-controllers-info.json b/src/go/plugin/go.d/modules/storcli/testdata/megaraid-controllers-info.json index e4e988d10..e4e988d10 100644 --- a/src/go/collectors/go.d.plugin/modules/storcli/testdata/megaraid-controllers-info.json +++ b/src/go/plugin/go.d/modules/storcli/testdata/megaraid-controllers-info.json diff --git a/src/go/collectors/go.d.plugin/modules/storcli/testdata/megaraid-drives-info.json b/src/go/plugin/go.d/modules/storcli/testdata/megaraid-drives-info.json index b8735d6a3..b8735d6a3 100644 --- a/src/go/collectors/go.d.plugin/modules/storcli/testdata/megaraid-drives-info.json +++ b/src/go/plugin/go.d/modules/storcli/testdata/megaraid-drives-info.json diff --git a/src/go/collectors/go.d.plugin/modules/storcli/testdata/mpt3sas-controllers-info.json b/src/go/plugin/go.d/modules/storcli/testdata/mpt3sas-controllers-info.json index 02eefd719..02eefd719 100644 --- a/src/go/collectors/go.d.plugin/modules/storcli/testdata/mpt3sas-controllers-info.json +++ b/src/go/plugin/go.d/modules/storcli/testdata/mpt3sas-controllers-info.json diff --git a/src/go/collectors/go.d.plugin/modules/supervisord/README.md b/src/go/plugin/go.d/modules/supervisord/README.md index a8b743484..a8b743484 120000 --- a/src/go/collectors/go.d.plugin/modules/supervisord/README.md +++ b/src/go/plugin/go.d/modules/supervisord/README.md diff --git a/src/go/collectors/go.d.plugin/modules/supervisord/charts.go b/src/go/plugin/go.d/modules/supervisord/charts.go index 2c7f08f04..c0f7c9018 100644 --- a/src/go/collectors/go.d.plugin/modules/supervisord/charts.go +++ b/src/go/plugin/go.d/modules/supervisord/charts.go @@ -5,7 +5,7 @@ package supervisord import ( "fmt" - "github.com/netdata/netdata/go/go.d.plugin/agent/module" + "github.com/netdata/netdata/go/plugins/plugin/go.d/agent/module" ) const ( diff --git a/src/go/collectors/go.d.plugin/modules/supervisord/client.go b/src/go/plugin/go.d/modules/supervisord/client.go index da62ca21c..da62ca21c 100644 --- a/src/go/collectors/go.d.plugin/modules/supervisord/client.go +++ b/src/go/plugin/go.d/modules/supervisord/client.go diff --git a/src/go/collectors/go.d.plugin/modules/supervisord/collect.go b/src/go/plugin/go.d/modules/supervisord/collect.go index e04e32131..31a0d394b 100644 --- a/src/go/collectors/go.d.plugin/modules/supervisord/collect.go +++ b/src/go/plugin/go.d/modules/supervisord/collect.go @@ -6,7 +6,7 @@ import ( "fmt" "strings" - "github.com/netdata/netdata/go/go.d.plugin/agent/module" + "github.com/netdata/netdata/go/plugins/plugin/go.d/agent/module" ) func (s *Supervisord) collect() (map[string]int64, error) { diff --git a/src/go/collectors/go.d.plugin/modules/supervisord/config_schema.json b/src/go/plugin/go.d/modules/supervisord/config_schema.json index 8d3c4e943..8d3c4e943 100644 --- a/src/go/collectors/go.d.plugin/modules/supervisord/config_schema.json +++ b/src/go/plugin/go.d/modules/supervisord/config_schema.json diff --git a/src/go/collectors/go.d.plugin/modules/supervisord/init.go b/src/go/plugin/go.d/modules/supervisord/init.go index b4cc36382..c7ccc06b5 100644 --- a/src/go/collectors/go.d.plugin/modules/supervisord/init.go +++ b/src/go/plugin/go.d/modules/supervisord/init.go @@ -7,7 +7,7 @@ import ( "fmt" "net/url" - "github.com/netdata/netdata/go/go.d.plugin/pkg/web" + "github.com/netdata/netdata/go/plugins/plugin/go.d/pkg/web" ) func (s *Supervisord) verifyConfig() error { diff --git a/src/go/collectors/go.d.plugin/modules/supervisord/integrations/supervisor.md b/src/go/plugin/go.d/modules/supervisord/integrations/supervisor.md index 0cbb13242..ba302e4a0 100644 --- a/src/go/collectors/go.d.plugin/modules/supervisord/integrations/supervisor.md +++ b/src/go/plugin/go.d/modules/supervisord/integrations/supervisor.md @@ -1,6 +1,6 @@ <!--startmeta -custom_edit_url: "https://github.com/netdata/netdata/edit/master/src/go/collectors/go.d.plugin/modules/supervisord/README.md" -meta_yaml: "https://github.com/netdata/netdata/edit/master/src/go/collectors/go.d.plugin/modules/supervisord/metadata.yaml" +custom_edit_url: "https://github.com/netdata/netdata/edit/master/src/go/plugin/go.d/modules/supervisord/README.md" +meta_yaml: "https://github.com/netdata/netdata/edit/master/src/go/plugin/go.d/modules/supervisord/metadata.yaml" sidebar_label: "Supervisor" learn_status: "Published" learn_rel_path: "Collecting Metrics/Processes and System Services" @@ -189,6 +189,8 @@ jobs: ### Debug Mode +**Important**: Debug mode is not supported for data collection jobs created via the UI using the Dyncfg feature. + To troubleshoot issues with the `supervisord` collector, run the `go.d.plugin` with the debug option enabled. The output should give you clues as to why the collector isn't working. @@ -211,4 +213,37 @@ should give you clues as to why the collector isn't working. ./go.d.plugin -d -m supervisord ``` +### Getting Logs + +If you're encountering problems with the `supervisord` collector, follow these steps to retrieve logs and identify potential issues: + +- **Run the command** specific to your system (systemd, non-systemd, or Docker container). +- **Examine the output** for any warnings or error messages that might indicate issues. These messages should provide clues about the root cause of the problem. + +#### System with systemd + +Use the following command to view logs generated since the last Netdata service restart: + +```bash +journalctl _SYSTEMD_INVOCATION_ID="$(systemctl show --value --property=InvocationID netdata)" --namespace=netdata --grep supervisord +``` + +#### System without systemd + +Locate the collector log file, typically at `/var/log/netdata/collector.log`, and use `grep` to filter for collector's name: + +```bash +grep supervisord /var/log/netdata/collector.log +``` + +**Note**: This method shows logs from all restarts. Focus on the **latest entries** for troubleshooting current issues. + +#### Docker Container + +If your Netdata runs in a Docker container named "netdata" (replace if different), use this command: + +```bash +docker logs netdata 2>&1 | grep supervisord +``` + diff --git a/src/go/collectors/go.d.plugin/modules/supervisord/metadata.yaml b/src/go/plugin/go.d/modules/supervisord/metadata.yaml index b5c81dd04..b5c81dd04 100644 --- a/src/go/collectors/go.d.plugin/modules/supervisord/metadata.yaml +++ b/src/go/plugin/go.d/modules/supervisord/metadata.yaml diff --git a/src/go/collectors/go.d.plugin/modules/supervisord/supervisord.go b/src/go/plugin/go.d/modules/supervisord/supervisord.go index 4c1bc8e84..0988cfc88 100644 --- a/src/go/collectors/go.d.plugin/modules/supervisord/supervisord.go +++ b/src/go/plugin/go.d/modules/supervisord/supervisord.go @@ -7,8 +7,8 @@ import ( "errors" "time" - "github.com/netdata/netdata/go/go.d.plugin/agent/module" - "github.com/netdata/netdata/go/go.d.plugin/pkg/web" + "github.com/netdata/netdata/go/plugins/plugin/go.d/agent/module" + "github.com/netdata/netdata/go/plugins/plugin/go.d/pkg/web" ) //go:embed "config_schema.json" diff --git a/src/go/collectors/go.d.plugin/modules/supervisord/supervisord_test.go b/src/go/plugin/go.d/modules/supervisord/supervisord_test.go index 521811b11..7eb5df53a 100644 --- a/src/go/collectors/go.d.plugin/modules/supervisord/supervisord_test.go +++ b/src/go/plugin/go.d/modules/supervisord/supervisord_test.go @@ -7,7 +7,7 @@ import ( "os" "testing" - "github.com/netdata/netdata/go/go.d.plugin/agent/module" + "github.com/netdata/netdata/go/plugins/plugin/go.d/agent/module" "github.com/stretchr/testify/assert" "github.com/stretchr/testify/require" diff --git a/src/go/collectors/go.d.plugin/modules/supervisord/testdata/config.json b/src/go/plugin/go.d/modules/supervisord/testdata/config.json index 825b0c394..825b0c394 100644 --- a/src/go/collectors/go.d.plugin/modules/supervisord/testdata/config.json +++ b/src/go/plugin/go.d/modules/supervisord/testdata/config.json diff --git a/src/go/collectors/go.d.plugin/modules/supervisord/testdata/config.yaml b/src/go/plugin/go.d/modules/supervisord/testdata/config.yaml index e1a01abd7..e1a01abd7 100644 --- a/src/go/collectors/go.d.plugin/modules/supervisord/testdata/config.yaml +++ b/src/go/plugin/go.d/modules/supervisord/testdata/config.yaml diff --git a/src/go/collectors/go.d.plugin/modules/systemdunits/README.md b/src/go/plugin/go.d/modules/systemdunits/README.md index 68dd433bf..68dd433bf 120000 --- a/src/go/collectors/go.d.plugin/modules/systemdunits/README.md +++ b/src/go/plugin/go.d/modules/systemdunits/README.md diff --git a/src/go/collectors/go.d.plugin/modules/systemdunits/charts.go b/src/go/plugin/go.d/modules/systemdunits/charts.go index 18d8838fb..9f1f56b70 100644 --- a/src/go/collectors/go.d.plugin/modules/systemdunits/charts.go +++ b/src/go/plugin/go.d/modules/systemdunits/charts.go @@ -10,7 +10,7 @@ import ( "path/filepath" "strings" - "github.com/netdata/netdata/go/go.d.plugin/agent/module" + "github.com/netdata/netdata/go/plugins/plugin/go.d/agent/module" "golang.org/x/text/cases" "golang.org/x/text/language" diff --git a/src/go/collectors/go.d.plugin/modules/systemdunits/client.go b/src/go/plugin/go.d/modules/systemdunits/client.go index e6363d132..e6363d132 100644 --- a/src/go/collectors/go.d.plugin/modules/systemdunits/client.go +++ b/src/go/plugin/go.d/modules/systemdunits/client.go diff --git a/src/go/collectors/go.d.plugin/modules/systemdunits/collect.go b/src/go/plugin/go.d/modules/systemdunits/collect.go index 0d61c9998..0d61c9998 100644 --- a/src/go/collectors/go.d.plugin/modules/systemdunits/collect.go +++ b/src/go/plugin/go.d/modules/systemdunits/collect.go diff --git a/src/go/collectors/go.d.plugin/modules/systemdunits/collect_unit_files.go b/src/go/plugin/go.d/modules/systemdunits/collect_unit_files.go index eff2d6ecb..eff2d6ecb 100644 --- a/src/go/collectors/go.d.plugin/modules/systemdunits/collect_unit_files.go +++ b/src/go/plugin/go.d/modules/systemdunits/collect_unit_files.go diff --git a/src/go/collectors/go.d.plugin/modules/systemdunits/collect_units.go b/src/go/plugin/go.d/modules/systemdunits/collect_units.go index 0cf97af03..0cf97af03 100644 --- a/src/go/collectors/go.d.plugin/modules/systemdunits/collect_units.go +++ b/src/go/plugin/go.d/modules/systemdunits/collect_units.go diff --git a/src/go/collectors/go.d.plugin/modules/systemdunits/config_schema.json b/src/go/plugin/go.d/modules/systemdunits/config_schema.json index 016e984ce..016e984ce 100644 --- a/src/go/collectors/go.d.plugin/modules/systemdunits/config_schema.json +++ b/src/go/plugin/go.d/modules/systemdunits/config_schema.json diff --git a/src/go/collectors/go.d.plugin/modules/systemdunits/doc.go b/src/go/plugin/go.d/modules/systemdunits/doc.go index 8bb45fab9..8bb45fab9 100644 --- a/src/go/collectors/go.d.plugin/modules/systemdunits/doc.go +++ b/src/go/plugin/go.d/modules/systemdunits/doc.go diff --git a/src/go/collectors/go.d.plugin/modules/systemdunits/init.go b/src/go/plugin/go.d/modules/systemdunits/init.go index ea3d21d37..8a1b579c1 100644 --- a/src/go/collectors/go.d.plugin/modules/systemdunits/init.go +++ b/src/go/plugin/go.d/modules/systemdunits/init.go @@ -9,7 +9,7 @@ import ( "errors" "strings" - "github.com/netdata/netdata/go/go.d.plugin/pkg/matcher" + "github.com/netdata/netdata/go/plugins/plugin/go.d/pkg/matcher" ) func (s *SystemdUnits) validateConfig() error { diff --git a/src/go/collectors/go.d.plugin/modules/systemdunits/integrations/systemd_units.md b/src/go/plugin/go.d/modules/systemdunits/integrations/systemd_units.md index 431f084ba..a2ff90b0d 100644 --- a/src/go/collectors/go.d.plugin/modules/systemdunits/integrations/systemd_units.md +++ b/src/go/plugin/go.d/modules/systemdunits/integrations/systemd_units.md @@ -1,6 +1,6 @@ <!--startmeta -custom_edit_url: "https://github.com/netdata/netdata/edit/master/src/go/collectors/go.d.plugin/modules/systemdunits/README.md" -meta_yaml: "https://github.com/netdata/netdata/edit/master/src/go/collectors/go.d.plugin/modules/systemdunits/metadata.yaml" +custom_edit_url: "https://github.com/netdata/netdata/edit/master/src/go/plugin/go.d/modules/systemdunits/README.md" +meta_yaml: "https://github.com/netdata/netdata/edit/master/src/go/plugin/go.d/modules/systemdunits/metadata.yaml" sidebar_label: "Systemd Units" learn_status: "Published" learn_rel_path: "Collecting Metrics/Systemd" @@ -264,6 +264,8 @@ jobs: ### Debug Mode +**Important**: Debug mode is not supported for data collection jobs created via the UI using the Dyncfg feature. + To troubleshoot issues with the `systemdunits` collector, run the `go.d.plugin` with the debug option enabled. The output should give you clues as to why the collector isn't working. @@ -286,4 +288,37 @@ should give you clues as to why the collector isn't working. ./go.d.plugin -d -m systemdunits ``` +### Getting Logs + +If you're encountering problems with the `systemdunits` collector, follow these steps to retrieve logs and identify potential issues: + +- **Run the command** specific to your system (systemd, non-systemd, or Docker container). +- **Examine the output** for any warnings or error messages that might indicate issues. These messages should provide clues about the root cause of the problem. + +#### System with systemd + +Use the following command to view logs generated since the last Netdata service restart: + +```bash +journalctl _SYSTEMD_INVOCATION_ID="$(systemctl show --value --property=InvocationID netdata)" --namespace=netdata --grep systemdunits +``` + +#### System without systemd + +Locate the collector log file, typically at `/var/log/netdata/collector.log`, and use `grep` to filter for collector's name: + +```bash +grep systemdunits /var/log/netdata/collector.log +``` + +**Note**: This method shows logs from all restarts. Focus on the **latest entries** for troubleshooting current issues. + +#### Docker Container + +If your Netdata runs in a Docker container named "netdata" (replace if different), use this command: + +```bash +docker logs netdata 2>&1 | grep systemdunits +``` + diff --git a/src/go/collectors/go.d.plugin/modules/systemdunits/metadata.yaml b/src/go/plugin/go.d/modules/systemdunits/metadata.yaml index 791e58400..791e58400 100644 --- a/src/go/collectors/go.d.plugin/modules/systemdunits/metadata.yaml +++ b/src/go/plugin/go.d/modules/systemdunits/metadata.yaml diff --git a/src/go/collectors/go.d.plugin/modules/systemdunits/systemdunits.go b/src/go/plugin/go.d/modules/systemdunits/systemdunits.go index 367fa2a44..9a3478768 100644 --- a/src/go/collectors/go.d.plugin/modules/systemdunits/systemdunits.go +++ b/src/go/plugin/go.d/modules/systemdunits/systemdunits.go @@ -10,9 +10,9 @@ import ( "errors" "time" - "github.com/netdata/netdata/go/go.d.plugin/agent/module" - "github.com/netdata/netdata/go/go.d.plugin/pkg/matcher" - "github.com/netdata/netdata/go/go.d.plugin/pkg/web" + "github.com/netdata/netdata/go/plugins/plugin/go.d/agent/module" + "github.com/netdata/netdata/go/plugins/plugin/go.d/pkg/matcher" + "github.com/netdata/netdata/go/plugins/plugin/go.d/pkg/web" "github.com/coreos/go-systemd/v22/dbus" ) diff --git a/src/go/collectors/go.d.plugin/modules/systemdunits/systemdunits_test.go b/src/go/plugin/go.d/modules/systemdunits/systemdunits_test.go index 89c0a92dd..7074e186e 100644 --- a/src/go/collectors/go.d.plugin/modules/systemdunits/systemdunits_test.go +++ b/src/go/plugin/go.d/modules/systemdunits/systemdunits_test.go @@ -15,7 +15,7 @@ import ( "strings" "testing" - "github.com/netdata/netdata/go/go.d.plugin/agent/module" + "github.com/netdata/netdata/go/plugins/plugin/go.d/agent/module" "github.com/coreos/go-systemd/v22/dbus" "github.com/stretchr/testify/assert" diff --git a/src/go/collectors/go.d.plugin/modules/systemdunits/testdata/config.json b/src/go/plugin/go.d/modules/systemdunits/testdata/config.json index 1ab5b47ea..1ab5b47ea 100644 --- a/src/go/collectors/go.d.plugin/modules/systemdunits/testdata/config.json +++ b/src/go/plugin/go.d/modules/systemdunits/testdata/config.json diff --git a/src/go/collectors/go.d.plugin/modules/systemdunits/testdata/config.yaml b/src/go/plugin/go.d/modules/systemdunits/testdata/config.yaml index d1894aea1..d1894aea1 100644 --- a/src/go/collectors/go.d.plugin/modules/systemdunits/testdata/config.yaml +++ b/src/go/plugin/go.d/modules/systemdunits/testdata/config.yaml diff --git a/src/go/collectors/go.d.plugin/modules/tengine/README.md b/src/go/plugin/go.d/modules/tengine/README.md index e016ea0c7..e016ea0c7 120000 --- a/src/go/collectors/go.d.plugin/modules/tengine/README.md +++ b/src/go/plugin/go.d/modules/tengine/README.md diff --git a/src/go/collectors/go.d.plugin/modules/tengine/apiclient.go b/src/go/plugin/go.d/modules/tengine/apiclient.go index 4f0251050..e91b99769 100644 --- a/src/go/collectors/go.d.plugin/modules/tengine/apiclient.go +++ b/src/go/plugin/go.d/modules/tengine/apiclient.go @@ -10,7 +10,7 @@ import ( "strconv" "strings" - "github.com/netdata/netdata/go/go.d.plugin/pkg/web" + "github.com/netdata/netdata/go/plugins/plugin/go.d/pkg/web" ) const ( diff --git a/src/go/collectors/go.d.plugin/modules/tengine/charts.go b/src/go/plugin/go.d/modules/tengine/charts.go index 59b191dd5..bd0564aa2 100644 --- a/src/go/collectors/go.d.plugin/modules/tengine/charts.go +++ b/src/go/plugin/go.d/modules/tengine/charts.go @@ -2,7 +2,7 @@ package tengine -import "github.com/netdata/netdata/go/go.d.plugin/agent/module" +import "github.com/netdata/netdata/go/plugins/plugin/go.d/agent/module" type ( // Charts is an alias for module.Charts diff --git a/src/go/collectors/go.d.plugin/modules/tengine/collect.go b/src/go/plugin/go.d/modules/tengine/collect.go index 83dcba177..ffa39019e 100644 --- a/src/go/collectors/go.d.plugin/modules/tengine/collect.go +++ b/src/go/plugin/go.d/modules/tengine/collect.go @@ -3,7 +3,7 @@ package tengine import ( - "github.com/netdata/netdata/go/go.d.plugin/pkg/stm" + "github.com/netdata/netdata/go/plugins/plugin/go.d/pkg/stm" ) func (t *Tengine) collect() (map[string]int64, error) { diff --git a/src/go/collectors/go.d.plugin/modules/tengine/config_schema.json b/src/go/plugin/go.d/modules/tengine/config_schema.json index 5493997a3..44f6968e1 100644 --- a/src/go/collectors/go.d.plugin/modules/tengine/config_schema.json +++ b/src/go/plugin/go.d/modules/tengine/config_schema.json @@ -167,6 +167,12 @@ "timeout": { "ui:help": "Accepts decimals for precise control (e.g., type 1.5 for 1.5 seconds)." }, + "username": { + "ui:widget": "password" + }, + "proxy_username": { + "ui:widget": "password" + }, "password": { "ui:widget": "password" }, diff --git a/src/go/collectors/go.d.plugin/modules/tengine/integrations/tengine.md b/src/go/plugin/go.d/modules/tengine/integrations/tengine.md index a4e6c5f95..44bec575b 100644 --- a/src/go/collectors/go.d.plugin/modules/tengine/integrations/tengine.md +++ b/src/go/plugin/go.d/modules/tengine/integrations/tengine.md @@ -1,6 +1,6 @@ <!--startmeta -custom_edit_url: "https://github.com/netdata/netdata/edit/master/src/go/collectors/go.d.plugin/modules/tengine/README.md" -meta_yaml: "https://github.com/netdata/netdata/edit/master/src/go/collectors/go.d.plugin/modules/tengine/metadata.yaml" +custom_edit_url: "https://github.com/netdata/netdata/edit/master/src/go/plugin/go.d/modules/tengine/README.md" +meta_yaml: "https://github.com/netdata/netdata/edit/master/src/go/plugin/go.d/modules/tengine/metadata.yaml" sidebar_label: "Tengine" learn_status: "Published" learn_rel_path: "Collecting Metrics/Web Servers and Web Proxies" @@ -207,6 +207,8 @@ jobs: ### Debug Mode +**Important**: Debug mode is not supported for data collection jobs created via the UI using the Dyncfg feature. + To troubleshoot issues with the `tengine` collector, run the `go.d.plugin` with the debug option enabled. The output should give you clues as to why the collector isn't working. @@ -229,4 +231,37 @@ should give you clues as to why the collector isn't working. ./go.d.plugin -d -m tengine ``` +### Getting Logs + +If you're encountering problems with the `tengine` collector, follow these steps to retrieve logs and identify potential issues: + +- **Run the command** specific to your system (systemd, non-systemd, or Docker container). +- **Examine the output** for any warnings or error messages that might indicate issues. These messages should provide clues about the root cause of the problem. + +#### System with systemd + +Use the following command to view logs generated since the last Netdata service restart: + +```bash +journalctl _SYSTEMD_INVOCATION_ID="$(systemctl show --value --property=InvocationID netdata)" --namespace=netdata --grep tengine +``` + +#### System without systemd + +Locate the collector log file, typically at `/var/log/netdata/collector.log`, and use `grep` to filter for collector's name: + +```bash +grep tengine /var/log/netdata/collector.log +``` + +**Note**: This method shows logs from all restarts. Focus on the **latest entries** for troubleshooting current issues. + +#### Docker Container + +If your Netdata runs in a Docker container named "netdata" (replace if different), use this command: + +```bash +docker logs netdata 2>&1 | grep tengine +``` + diff --git a/src/go/collectors/go.d.plugin/modules/tengine/metadata.yaml b/src/go/plugin/go.d/modules/tengine/metadata.yaml index b0778c9fc..b0778c9fc 100644 --- a/src/go/collectors/go.d.plugin/modules/tengine/metadata.yaml +++ b/src/go/plugin/go.d/modules/tengine/metadata.yaml diff --git a/src/go/collectors/go.d.plugin/modules/tengine/metrics.go b/src/go/plugin/go.d/modules/tengine/metrics.go index 425559479..425559479 100644 --- a/src/go/collectors/go.d.plugin/modules/tengine/metrics.go +++ b/src/go/plugin/go.d/modules/tengine/metrics.go diff --git a/src/go/collectors/go.d.plugin/modules/tengine/tengine.go b/src/go/plugin/go.d/modules/tengine/tengine.go index f70e4eded..8f67fae46 100644 --- a/src/go/collectors/go.d.plugin/modules/tengine/tengine.go +++ b/src/go/plugin/go.d/modules/tengine/tengine.go @@ -7,8 +7,8 @@ import ( "errors" "time" - "github.com/netdata/netdata/go/go.d.plugin/agent/module" - "github.com/netdata/netdata/go/go.d.plugin/pkg/web" + "github.com/netdata/netdata/go/plugins/plugin/go.d/agent/module" + "github.com/netdata/netdata/go/plugins/plugin/go.d/pkg/web" ) //go:embed "config_schema.json" diff --git a/src/go/collectors/go.d.plugin/modules/tengine/tengine_test.go b/src/go/plugin/go.d/modules/tengine/tengine_test.go index d8b8ec997..e87e62b0c 100644 --- a/src/go/collectors/go.d.plugin/modules/tengine/tengine_test.go +++ b/src/go/plugin/go.d/modules/tengine/tengine_test.go @@ -8,7 +8,7 @@ import ( "os" "testing" - "github.com/netdata/netdata/go/go.d.plugin/agent/module" + "github.com/netdata/netdata/go/plugins/plugin/go.d/agent/module" "github.com/stretchr/testify/assert" "github.com/stretchr/testify/require" diff --git a/src/go/plugin/go.d/modules/tengine/testdata/config.json b/src/go/plugin/go.d/modules/tengine/testdata/config.json new file mode 100644 index 000000000..984c3ed6e --- /dev/null +++ b/src/go/plugin/go.d/modules/tengine/testdata/config.json @@ -0,0 +1,20 @@ +{ + "update_every": 123, + "url": "ok", + "body": "ok", + "method": "ok", + "headers": { + "ok": "ok" + }, + "username": "ok", + "password": "ok", + "proxy_url": "ok", + "proxy_username": "ok", + "proxy_password": "ok", + "timeout": 123.123, + "not_follow_redirects": true, + "tls_ca": "ok", + "tls_cert": "ok", + "tls_key": "ok", + "tls_skip_verify": true +} diff --git a/src/go/plugin/go.d/modules/tengine/testdata/config.yaml b/src/go/plugin/go.d/modules/tengine/testdata/config.yaml new file mode 100644 index 000000000..8558b61cc --- /dev/null +++ b/src/go/plugin/go.d/modules/tengine/testdata/config.yaml @@ -0,0 +1,17 @@ +update_every: 123 +url: "ok" +body: "ok" +method: "ok" +headers: + ok: "ok" +username: "ok" +password: "ok" +proxy_url: "ok" +proxy_username: "ok" +proxy_password: "ok" +timeout: 123.123 +not_follow_redirects: yes +tls_ca: "ok" +tls_cert: "ok" +tls_key: "ok" +tls_skip_verify: yes diff --git a/src/go/collectors/go.d.plugin/modules/tengine/testdata/status.txt b/src/go/plugin/go.d/modules/tengine/testdata/status.txt index dff2ec2d6..dff2ec2d6 100644 --- a/src/go/collectors/go.d.plugin/modules/tengine/testdata/status.txt +++ b/src/go/plugin/go.d/modules/tengine/testdata/status.txt diff --git a/src/collectors/python.d.plugin/tomcat/README.md b/src/go/plugin/go.d/modules/tomcat/README.md index 997090c35..997090c35 120000 --- a/src/collectors/python.d.plugin/tomcat/README.md +++ b/src/go/plugin/go.d/modules/tomcat/README.md diff --git a/src/go/plugin/go.d/modules/tomcat/charts.go b/src/go/plugin/go.d/modules/tomcat/charts.go new file mode 100644 index 000000000..137f700b2 --- /dev/null +++ b/src/go/plugin/go.d/modules/tomcat/charts.go @@ -0,0 +1,196 @@ +// SPDX-License-Identifier: GPL-3.0-or-later + +package tomcat + +import ( + "fmt" + "strings" + + "github.com/netdata/netdata/go/plugins/plugin/go.d/agent/module" +) + +const ( + prioConnectorRequestsCount = module.Priority + iota + prioConnectorRequestsBandwidth + prioConnectorRequestsProcessingTime + prioConnectorRequestsErrors + + prioConnectorRequestThreads + + prioJvmMemoryUsage + + prioJvmMemoryPoolMemoryUsage +) + +var ( + defaultCharts = module.Charts{ + jvmMemoryUsageChart.Copy(), + } + + jvmMemoryUsageChart = module.Chart{ + ID: "jvm_memory_usage", + Title: "JVM Memory Usage", + Units: "bytes", + Fam: "memory", + Ctx: "tomcat.jvm_memory_usage", + Type: module.Stacked, + Priority: prioJvmMemoryUsage, + Dims: module.Dims{ + {ID: "jvm_memory_free", Name: "free"}, + {ID: "jvm_memory_used", Name: "used"}, + }, + } +) + +var ( + connectorChartsTmpl = module.Charts{ + connectorRequestsCountChartTmpl.Copy(), + connectorRequestsBandwidthChartTmpl.Copy(), + connectorRequestsProcessingTimeChartTmpl.Copy(), + connectorRequestsErrorsChartTmpl.Copy(), + connectorRequestThreadsChartTmpl.Copy(), + } + + connectorRequestsCountChartTmpl = module.Chart{ + ID: "connector_%_requests", + Title: "Connector Requests", + Units: "requests/s", + Fam: "requests", + Ctx: "tomcat.connector_requests", + Type: module.Line, + Priority: prioConnectorRequestsCount, + Dims: module.Dims{ + {ID: "connector_%s_request_info_request_count", Name: "requests", Algo: module.Incremental}, + }, + } + connectorRequestsBandwidthChartTmpl = module.Chart{ + ID: "connector_%s_requests_bandwidth", + Title: "Connector Requests Bandwidth", + Units: "bytes/s", + Fam: "requests", + Ctx: "tomcat.connector_bandwidth", + Type: module.Area, + Priority: prioConnectorRequestsBandwidth, + Dims: module.Dims{ + {ID: "connector_%s_request_info_bytes_received", Name: "received", Algo: module.Incremental}, + {ID: "connector_%s_request_info_bytes_sent", Name: "sent", Mul: -1, Algo: module.Incremental}, + }, + } + connectorRequestsProcessingTimeChartTmpl = module.Chart{ + ID: "connector_%_requests_processing_time", + Title: "Connector Requests Processing Time", + Units: "milliseconds", + Fam: "requests", + Ctx: "tomcat.connector_requests_processing_time", + Type: module.Line, + Priority: prioConnectorRequestsProcessingTime, + Dims: module.Dims{ + {ID: "connector_%s_request_info_processing_time", Name: "processing_time", Algo: module.Incremental}, + }, + } + connectorRequestsErrorsChartTmpl = module.Chart{ + ID: "connector_%_errors", + Title: "Connector Errors", + Units: "errors/s", + Fam: "requests", + Ctx: "tomcat.connector_errors", + Type: module.Line, + Priority: prioConnectorRequestsErrors, + Dims: module.Dims{ + {ID: "connector_%s_request_info_error_count", Name: "errors", Algo: module.Incremental}, + }, + } + + connectorRequestThreadsChartTmpl = module.Chart{ + ID: "connector_%s_request_threads", + Title: "Connector Request Threads", + Units: "threads", + Fam: "threads", + Ctx: "tomcat.connector_request_threads", + Type: module.Stacked, + Priority: prioConnectorRequestThreads, + Dims: module.Dims{ + {ID: "connector_%s_thread_info_idle", Name: "idle"}, + {ID: "connector_%s_thread_info_busy", Name: "busy"}, + }, + } +) + +var ( + jvmMemoryPoolChartsTmpl = module.Charts{ + jvmMemoryPoolMemoryUsageChartTmpl.Copy(), + } + + jvmMemoryPoolMemoryUsageChartTmpl = module.Chart{ + ID: "jvm_mem_pool_%s_memory_usage", + Title: "JVM Mem Pool Memory Usage", + Units: "bytes", + Fam: "memory", + Ctx: "tomcat.jvm_mem_pool_memory_usage", + Type: module.Area, + Priority: prioJvmMemoryPoolMemoryUsage, + Dims: module.Dims{ + {ID: "jvm_memorypool_%s_commited", Name: "commited"}, + {ID: "jvm_memorypool_%s_used", Name: "used"}, + {ID: "jvm_memorypool_%s_max", Name: "max"}, + }, + } +) + +func (t *Tomcat) addConnectorCharts(name string) { + charts := connectorChartsTmpl.Copy() + + for _, chart := range *charts { + chart.ID = fmt.Sprintf(chart.ID, cleanName(name)) + chart.Labels = []module.Label{ + {Key: "connector_name", Value: strings.Trim(name, "\"")}, + } + for _, dim := range chart.Dims { + dim.ID = fmt.Sprintf(dim.ID, cleanName(name)) + } + } + + if err := t.Charts().Add(*charts...); err != nil { + t.Warning(err) + } +} + +func (t *Tomcat) addMemPoolCharts(name, typ string) { + name = strings.ReplaceAll(name, "'", "") + + charts := jvmMemoryPoolChartsTmpl.Copy() + + for _, chart := range *charts { + chart.ID = fmt.Sprintf(chart.ID, cleanName(name)) + chart.Labels = []module.Label{ + {Key: "mempool_name", Value: name}, + {Key: "mempool_type", Value: typ}, + } + for _, dim := range chart.Dims { + dim.ID = fmt.Sprintf(dim.ID, cleanName(name)) + } + } + + if err := t.Charts().Add(*charts...); err != nil { + t.Warning(err) + } +} + +func (t *Tomcat) removeConnectorCharts(name string) { + px := fmt.Sprintf("connector_%s_", cleanName(name)) + t.removeCharts(px) +} + +func (t *Tomcat) removeMemoryPoolCharts(name string) { + px := fmt.Sprintf("jvm_mem_pool_%s_", cleanName(name)) + t.removeCharts(px) +} + +func (t *Tomcat) removeCharts(prefix string) { + for _, chart := range *t.Charts() { + if strings.HasPrefix(chart.ID, prefix) { + chart.MarkRemove() + chart.MarkNotCreated() + } + } +} diff --git a/src/go/plugin/go.d/modules/tomcat/collect.go b/src/go/plugin/go.d/modules/tomcat/collect.go new file mode 100644 index 000000000..c6e2a74bd --- /dev/null +++ b/src/go/plugin/go.d/modules/tomcat/collect.go @@ -0,0 +1,130 @@ +// SPDX-License-Identifier: GPL-3.0-or-later + +package tomcat + +import ( + "encoding/xml" + "errors" + "fmt" + "io" + "net/http" + "net/url" + "strings" + + "github.com/netdata/netdata/go/plugins/plugin/go.d/pkg/stm" + "github.com/netdata/netdata/go/plugins/plugin/go.d/pkg/web" +) + +var ( + urlPathServerStatus = "/manager/status" + urlQueryServerStatus = url.Values{"XML": {"true"}}.Encode() +) + +func (t *Tomcat) collect() (map[string]int64, error) { + mx, err := t.collectServerStatus() + if err != nil { + return nil, err + } + + return mx, nil +} + +func (t *Tomcat) collectServerStatus() (map[string]int64, error) { + resp, err := t.queryServerStatus() + if err != nil { + return nil, err + } + + if len(resp.Connectors) == 0 { + return nil, errors.New("unexpected response: not tomcat server status data") + } + + seenConns, seenPools := make(map[string]bool), make(map[string]bool) + + for i, v := range resp.Connectors { + resp.Connectors[i].STMKey = cleanName(v.Name) + ti := &resp.Connectors[i].ThreadInfo + ti.CurrentThreadsIdle = ti.CurrentThreadCount - ti.CurrentThreadsBusy + + seenConns[v.Name] = true + if !t.seenConnectors[v.Name] { + t.seenConnectors[v.Name] = true + t.addConnectorCharts(v.Name) + } + } + + for i, v := range resp.JVM.MemoryPools { + resp.JVM.MemoryPools[i].STMKey = cleanName(v.Name) + + seenPools[v.Name] = true + if !t.seenMemPools[v.Name] { + t.seenMemPools[v.Name] = true + t.addMemPoolCharts(v.Name, v.Type) + } + } + + for name := range t.seenConnectors { + if !seenConns[name] { + delete(t.seenConnectors, name) + t.removeConnectorCharts(name) + } + } + + for name := range t.seenMemPools { + if !seenPools[name] { + delete(t.seenMemPools, name) + t.removeMemoryPoolCharts(name) + } + } + + resp.JVM.Memory.Used = resp.JVM.Memory.Total - resp.JVM.Memory.Free + + return stm.ToMap(resp), nil +} + +func cleanName(name string) string { + r := strings.NewReplacer(" ", "_", ".", "_", "\"", "", "'", "") + return strings.ToLower(r.Replace(name)) +} + +func (t *Tomcat) queryServerStatus() (*serverStatusResponse, error) { + req, err := web.NewHTTPRequestWithPath(t.Request, urlPathServerStatus) + if err != nil { + return nil, err + } + + req.URL.RawQuery = urlQueryServerStatus + + var status serverStatusResponse + + if err := t.doOKDecode(req, &status); err != nil { + return nil, err + } + + return &status, nil +} + +func (t *Tomcat) doOKDecode(req *http.Request, in interface{}) error { + resp, err := t.httpClient.Do(req) + if err != nil { + return fmt.Errorf("error on HTTP request '%s': %v", req.URL, err) + } + defer closeBody(resp) + + if resp.StatusCode != http.StatusOK { + return fmt.Errorf("'%s' returned HTTP status code: %d", req.URL, resp.StatusCode) + } + + if err := xml.NewDecoder(resp.Body).Decode(in); err != nil { + return fmt.Errorf("error decoding XML response from '%s': %v", req.URL, err) + } + + return nil +} + +func closeBody(resp *http.Response) { + if resp != nil && resp.Body != nil { + _, _ = io.Copy(io.Discard, resp.Body) + _ = resp.Body.Close() + } +} diff --git a/src/go/plugin/go.d/modules/tomcat/config_schema.json b/src/go/plugin/go.d/modules/tomcat/config_schema.json new file mode 100644 index 000000000..91d7096ee --- /dev/null +++ b/src/go/plugin/go.d/modules/tomcat/config_schema.json @@ -0,0 +1,183 @@ +{ + "jsonSchema": { + "$schema": "http://json-schema.org/draft-07/schema#", + "title": "Tomcat collector configuration.", + "type": "object", + "properties": { + "update_every": { + "title": "Update every", + "description": "Data collection interval, measured in seconds.", + "type": "integer", + "minimum": 1, + "default": 1 + }, + "url": { + "title": "URL", + "description": "The base URL of the Tomcat server.", + "type": "string", + "default": "http://127.0.0.1:8080", + "format": "uri" + }, + "timeout": { + "title": "Timeout", + "description": "The timeout in seconds for the HTTP request.", + "type": "number", + "minimum": 0.5, + "default": 1 + }, + "not_follow_redirects": { + "title": "Not follow redirects", + "description": "If set, the client will not follow HTTP redirects automatically.", + "type": "boolean" + }, + "username": { + "title": "Username", + "description": "The username for basic authentication.", + "type": "string", + "sensitive": true + }, + "password": { + "title": "Password", + "description": "The password for basic authentication.", + "type": "string", + "sensitive": true + }, + "proxy_url": { + "title": "Proxy URL", + "description": "The URL of the proxy server.", + "type": "string" + }, + "proxy_username": { + "title": "Proxy username", + "description": "The username for proxy authentication.", + "type": "string", + "sensitive": true + }, + "proxy_password": { + "title": "Proxy password", + "description": "The password for proxy authentication.", + "type": "string", + "sensitive": true + }, + "headers": { + "title": "Headers", + "description": "Additional HTTP headers to include in the request.", + "type": [ + "object", + "null" + ], + "additionalProperties": { + "type": "string" + } + }, + "tls_skip_verify": { + "title": "Skip TLS verification", + "description": "If set, TLS certificate verification will be skipped.", + "type": "boolean" + }, + "tls_ca": { + "title": "TLS CA", + "description": "The path to the CA certificate file for TLS verification.", + "type": "string", + "pattern": "^$|^/" + }, + "tls_cert": { + "title": "TLS certificate", + "description": "The path to the client certificate file for TLS authentication.", + "type": "string", + "pattern": "^$|^/" + }, + "tls_key": { + "title": "TLS key", + "description": "The path to the client key file for TLS authentication.", + "type": "string", + "pattern": "^$|^/" + }, + "body": { + "title": "Body", + "type": "string" + }, + "method": { + "title": "Method", + "type": "string" + } + }, + "required": [ + "url" + ], + "additionalProperties": false, + "patternProperties": { + "^name$": {} + } + }, + "uiSchema": { + "uiOptions": { + "fullPage": true + }, + "body": { + "ui:widget": "hidden" + }, + "method": { + "ui:widget": "hidden" + }, + "timeout": { + "ui:help": "Accepts decimals for precise control (e.g., type 1.5 for 1.5 seconds)." + }, + "username": { + "ui:widget": "password" + }, + "proxy_username": { + "ui:widget": "password" + }, + "password": { + "ui:widget": "password" + }, + "proxy_password": { + "ui:widget": "password" + }, + "ui:flavour": "tabs", + "ui:options": { + "tabs": [ + { + "title": "Base", + "fields": [ + "update_every", + "url", + "timeout", + "not_follow_redirects" + ] + }, + { + "title": "Auth", + "fields": [ + "username", + "password" + ] + }, + { + "title": "TLS", + "fields": [ + "tls_skip_verify", + "tls_ca", + "tls_cert", + "tls_key" + ] + }, + { + "title": "Proxy", + "fields": [ + "proxy_url", + "proxy_username", + "proxy_password" + ] + }, + { + "title": "Headers", + "fields": [ + "headers" + ] + } + ] + } + } +} diff --git a/src/go/plugin/go.d/modules/tomcat/init.go b/src/go/plugin/go.d/modules/tomcat/init.go new file mode 100644 index 000000000..2c2ee29e4 --- /dev/null +++ b/src/go/plugin/go.d/modules/tomcat/init.go @@ -0,0 +1,21 @@ +// SPDX-License-Identifier: GPL-3.0-or-later + +package tomcat + +import ( + "fmt" + "net/http" + + "github.com/netdata/netdata/go/plugins/plugin/go.d/pkg/web" +) + +func (t *Tomcat) validateConfig() error { + if t.URL == "" { + return fmt.Errorf("url not set") + } + return nil +} + +func (t *Tomcat) initHTTPClient() (*http.Client, error) { + return web.NewHTTPClient(t.Client) +} diff --git a/src/go/plugin/go.d/modules/tomcat/integrations/tomcat.md b/src/go/plugin/go.d/modules/tomcat/integrations/tomcat.md new file mode 100644 index 000000000..b404e66e2 --- /dev/null +++ b/src/go/plugin/go.d/modules/tomcat/integrations/tomcat.md @@ -0,0 +1,275 @@ +<!--startmeta +custom_edit_url: "https://github.com/netdata/netdata/edit/master/src/go/plugin/go.d/modules/tomcat/README.md" +meta_yaml: "https://github.com/netdata/netdata/edit/master/src/go/plugin/go.d/modules/tomcat/metadata.yaml" +sidebar_label: "Tomcat" +learn_status: "Published" +learn_rel_path: "Collecting Metrics/Web Servers and Web Proxies" +most_popular: False +message: "DO NOT EDIT THIS FILE DIRECTLY, IT IS GENERATED BY THE COLLECTOR'S metadata.yaml FILE" +endmeta--> + +# Tomcat + + +<img src="https://netdata.cloud/img/tomcat.svg" width="150"/> + + +Plugin: go.d.plugin +Module: tomcat + +<img src="https://img.shields.io/badge/maintained%20by-Netdata-%2300ab44" /> + +## Overview + +This collector monitors Tomcat metrics about bandwidth, processing time, threads and more. + + +It parses the information provided by the [Server Status](https://tomcat.apache.org/tomcat-10.0-doc/manager-howto.html#Server_Status) HTTP endpoint. + + +This collector is supported on all platforms. + +This collector supports collecting metrics from multiple instances of this integration, including remote instances. + +By default, this Tomcat collector cannot access the server's status page. To enable data collection, you will need to configure access credentials with appropriate permissions. + + +### Default Behavior + +#### Auto-Detection + +If the Netdata agent and Tomcat are on the same host, the collector will attempt to connect to the Tomcat server's status page at `http://localhost:8080/manager/status?XML=true`. + + +#### Limits + +The default configuration for this integration does not impose any limits on data collection. + +#### Performance Impact + +The default configuration for this integration is not expected to impose a significant performance impact on the system. + + +## Metrics + +Metrics grouped by *scope*. + +The scope defines the instance that the metric belongs to. An instance is uniquely identified by a set of labels. + + + +### Per Tomcat instance + +These metrics refer to the entire monitored application. + +This scope has no labels. + +Metrics: + +| Metric | Dimensions | Unit | +|:------|:----------|:----| +| tomcat.jvm_memory_usage | free, used | bytes | + +### Per jvm memory pool + +These metrics refer to the JVM memory pool. + +Labels: + +| Label | Description | +|:-----------|:----------------| +| mempool_name | Memory Pool name. | +| mempool_type | Memory Pool type. | + +Metrics: + +| Metric | Dimensions | Unit | +|:------|:----------|:----| +| tomcat.jvm_mem_pool_memory_usage | commited, used, max | bytes | + +### Per connector + +These metrics refer to the connector. + +Labels: + +| Label | Description | +|:-----------|:----------------| +| connector_name | Connector name. | + +Metrics: + +| Metric | Dimensions | Unit | +|:------|:----------|:----| +| tomcat.connector_requests | requests | requests/s | +| tomcat.connector_bandwidth | received, sent | bytes/s | +| tomcat.connector_requests_processing_time | processing_time | milliseconds | +| tomcat.connector_errors | errors | errors/s | +| tomcat.connector_request_threads | idle, busy | threads | + + + +## Alerts + +There are no alerts configured by default for this integration. + + +## Setup + +### Prerequisites + +#### Access to Tomcat Status Endpoint + +The Netdata agent needs read-only access to its status endpoint to collect data from the Tomcat server. + +You can achieve this by creating a dedicated user named `netdata` with read-only permissions specifically for accessing the [Server Status](https://tomcat.apache.org/tomcat-10.0-doc/manager-howto.html#Server_Status) endpoint. + +Once you've created the `netdata` user, you'll need to configure the username and password in the collector configuration file. + + + +### Configuration + +#### File + +The configuration file name for this integration is `go.d/tomcat.conf`. + + +You can edit the configuration file using the `edit-config` script from the +Netdata [config directory](/docs/netdata-agent/configuration/README.md#the-netdata-config-directory). + +```bash +cd /etc/netdata 2>/dev/null || cd /opt/netdata/etc/netdata +sudo ./edit-config go.d/tomcat.conf +``` +#### Options + +The following options can be defined globally: update_every, autodetection_retry. + + +<details open><summary>Config options</summary> + +| Name | Description | Default | Required | +|:----|:-----------|:-------|:--------:| +| update_every | Data collection frequency. | 1 | no | +| autodetection_retry | Recheck interval in seconds. Zero means no recheck will be scheduled. | 0 | no | +| url | Server URL. | http://127.0.0.1:8080 | yes | +| timeout | HTTP request timeout. | 1 | no | +| username | Username for basic HTTP authentication. | | no | +| password | Password for basic HTTP authentication. | | no | +| proxy_url | Proxy URL. | | no | +| proxy_username | Username for proxy basic HTTP authentication. | | no | +| proxy_password | Password for proxy basic HTTP authentication. | | no | +| method | HTTP request method. | POST | no | +| body | HTTP request body. | | no | +| headers | HTTP request headers. | | no | +| not_follow_redirects | Redirect handling policy. Controls whether the client follows redirects. | no | no | +| tls_skip_verify | Server certificate chain and hostname validation policy. Controls whether the client performs this check. | no | no | +| tls_ca | Certification authority that the client uses when verifying the server's certificates. | | no | +| tls_cert | Client TLS certificate. | | no | +| tls_key | Client TLS key. | | no | + +</details> + +#### Examples + +##### Basic + +A basic example configuration. + +```yaml +jobs: + - name: local + url: http://127.0.0.1:8080 + username: John + password: Doe + +``` +##### Multi-instance + +> **Note**: When you define multiple jobs, their names must be unique. + +Collecting metrics from local and remote instances. + + +<details open><summary>Config</summary> + +```yaml +jobs: + - name: local + url: http://127.0.0.1:8080 + username: admin1 + password: hackme1 + + - name: remote + url: http://192.0.2.1:8080 + username: admin2 + password: hackme2 + +``` +</details> + + + +## Troubleshooting + +### Debug Mode + +**Important**: Debug mode is not supported for data collection jobs created via the UI using the Dyncfg feature. + +To troubleshoot issues with the `tomcat` collector, run the `go.d.plugin` with the debug option enabled. The output +should give you clues as to why the collector isn't working. + +- Navigate to the `plugins.d` directory, usually at `/usr/libexec/netdata/plugins.d/`. If that's not the case on + your system, open `netdata.conf` and look for the `plugins` setting under `[directories]`. + + ```bash + cd /usr/libexec/netdata/plugins.d/ + ``` + +- Switch to the `netdata` user. + + ```bash + sudo -u netdata -s + ``` + +- Run the `go.d.plugin` to debug the collector: + + ```bash + ./go.d.plugin -d -m tomcat + ``` + +### Getting Logs + +If you're encountering problems with the `tomcat` collector, follow these steps to retrieve logs and identify potential issues: + +- **Run the command** specific to your system (systemd, non-systemd, or Docker container). +- **Examine the output** for any warnings or error messages that might indicate issues. These messages should provide clues about the root cause of the problem. + +#### System with systemd + +Use the following command to view logs generated since the last Netdata service restart: + +```bash +journalctl _SYSTEMD_INVOCATION_ID="$(systemctl show --value --property=InvocationID netdata)" --namespace=netdata --grep tomcat +``` + +#### System without systemd + +Locate the collector log file, typically at `/var/log/netdata/collector.log`, and use `grep` to filter for collector's name: + +```bash +grep tomcat /var/log/netdata/collector.log +``` + +**Note**: This method shows logs from all restarts. Focus on the **latest entries** for troubleshooting current issues. + +#### Docker Container + +If your Netdata runs in a Docker container named "netdata" (replace if different), use this command: + +```bash +docker logs netdata 2>&1 | grep tomcat +``` + + diff --git a/src/go/plugin/go.d/modules/tomcat/metadata.yaml b/src/go/plugin/go.d/modules/tomcat/metadata.yaml new file mode 100644 index 000000000..d5815cf70 --- /dev/null +++ b/src/go/plugin/go.d/modules/tomcat/metadata.yaml @@ -0,0 +1,241 @@ +plugin_name: go.d.plugin +modules: + - meta: + plugin_name: go.d.plugin + module_name: tomcat + monitored_instance: + name: Tomcat + link: "https://tomcat.apache.org/" + categories: + - data-collection.web-servers-and-web-proxies + icon_filename: "tomcat.svg" + related_resources: + integrations: + list: [] + info_provided_to_referring_integrations: + description: "" + keywords: + - apache + - tomcat + - webserver + - websocket + - jakarta + - javaEE + most_popular: false + overview: + data_collection: + metrics_description: | + This collector monitors Tomcat metrics about bandwidth, processing time, threads and more. + method_description: | + It parses the information provided by the [Server Status](https://tomcat.apache.org/tomcat-10.0-doc/manager-howto.html#Server_Status) HTTP endpoint. + supported_platforms: + include: [] + exclude: [] + multi_instance: true + additional_permissions: + description: > + By default, this Tomcat collector cannot access the server's status page. + To enable data collection, you will need to configure access credentials with appropriate permissions. + default_behavior: + auto_detection: + description: > + If the Netdata agent and Tomcat are on the same host, the collector will attempt to connect to the Tomcat server's status page at `http://localhost:8080/manager/status?XML=true`. + limits: + description: "" + performance_impact: + description: "" + setup: + prerequisites: + list: + - title: Access to Tomcat Status Endpoint + description: | + The Netdata agent needs read-only access to its status endpoint to collect data from the Tomcat server. + + You can achieve this by creating a dedicated user named `netdata` with read-only permissions specifically for accessing the [Server Status](https://tomcat.apache.org/tomcat-10.0-doc/manager-howto.html#Server_Status) endpoint. + + Once you've created the `netdata` user, you'll need to configure the username and password in the collector configuration file. + configuration: + file: + name: "go.d/tomcat.conf" + options: + description: | + The following options can be defined globally: update_every, autodetection_retry. + folding: + title: "Config options" + enabled: true + list: + - name: update_every + description: Data collection frequency. + default_value: 1 + required: false + - name: autodetection_retry + description: Recheck interval in seconds. Zero means no recheck will be scheduled. + default_value: 0 + required: false + - name: url + description: Server URL. + default_value: http://127.0.0.1:8080 + required: true + - name: timeout + description: HTTP request timeout. + default_value: 1 + required: false + - name: username + description: Username for basic HTTP authentication. + default_value: "" + required: false + - name: password + description: Password for basic HTTP authentication. + default_value: "" + required: false + - name: proxy_url + description: Proxy URL. + default_value: "" + required: false + - name: proxy_username + description: Username for proxy basic HTTP authentication. + default_value: "" + required: false + - name: proxy_password + description: Password for proxy basic HTTP authentication. + default_value: "" + required: false + - name: method + description: HTTP request method. + default_value: POST + required: false + - name: body + description: HTTP request body. + default_value: "" + required: false + - name: headers + description: HTTP request headers. + default_value: "" + required: false + - name: not_follow_redirects + description: Redirect handling policy. Controls whether the client follows redirects. + default_value: false + required: false + - name: tls_skip_verify + description: Server certificate chain and hostname validation policy. Controls whether the client performs this check. + default_value: false + required: false + - name: tls_ca + description: Certification authority that the client uses when verifying the server's certificates. + default_value: "" + required: false + - name: tls_cert + description: Client TLS certificate. + default_value: "" + required: false + - name: tls_key + description: Client TLS key. + default_value: "" + required: false + examples: + folding: + enabled: true + title: "Config" + list: + - name: Basic + description: A basic example configuration. + folding: + enabled: false + config: | + jobs: + - name: local + url: http://127.0.0.1:8080 + username: John + password: Doe + - name: Multi-instance + description: | + > **Note**: When you define multiple jobs, their names must be unique. + + Collecting metrics from local and remote instances. + config: | + jobs: + - name: local + url: http://127.0.0.1:8080 + username: admin1 + password: hackme1 + + - name: remote + url: http://192.0.2.1:8080 + username: admin2 + password: hackme2 + troubleshooting: + problems: + list: [] + alerts: [] + metrics: + folding: + title: Metrics + enabled: false + description: "" + availability: [] + scopes: + - name: global + description: "These metrics refer to the entire monitored application." + labels: [] + metrics: + - name: tomcat.jvm_memory_usage + description: Requests + unit: bytes + chart_type: stacked + dimensions: + - name: free + - name: used + - name: jvm memory pool + description: "These metrics refer to the JVM memory pool." + labels: + - name: mempool_name + description: Memory Pool name. + - name: mempool_type + description: Memory Pool type. + metrics: + - name: tomcat.jvm_mem_pool_memory_usage + description: JVM Mem Pool Memory Usage + unit: bytes + chart_type: area + dimensions: + - name: commited + - name: used + - name: max + - name: connector + description: "These metrics refer to the connector." + labels: + - name: connector_name + description: Connector name. + metrics: + - name: tomcat.connector_requests + description: Connector Requests + unit: requests/s + chart_type: line + dimensions: + - name: requests + - name: tomcat.connector_bandwidth + description: Connector Bandwidth + unit: bytes/s + chart_type: area + dimensions: + - name: received + - name: sent + - name: tomcat.connector_requests_processing_time + description: Connector Requests Processing Time + unit: milliseconds + chart_type: line + dimensions: + - name: processing_time + - name: tomcat.connector_errors + description: Connector Errors + unit: errors/s + chart_type: line + dimensions: + - name: errors + - name: tomcat.connector_request_threads + description: Connector Request Threads + unit: threads + chart_type: stacked + dimensions: + - name: idle + - name: busy diff --git a/src/go/plugin/go.d/modules/tomcat/status_response.go b/src/go/plugin/go.d/modules/tomcat/status_response.go new file mode 100644 index 000000000..1459bd56d --- /dev/null +++ b/src/go/plugin/go.d/modules/tomcat/status_response.go @@ -0,0 +1,51 @@ +// SPDX-License-Identifier: GPL-3.0-or-later + +package tomcat + +import "encoding/xml" + +type serverStatusResponse struct { + XMLName xml.Name `xml:"status"` + + JVM struct { + Memory struct { + Used int64 `stm:"used"` // calculated manually + Free int64 `xml:"free,attr" stm:"free"` + Total int64 `xml:"total,attr" stm:"total"` + Max int64 `xml:"max,attr"` + } `xml:"memory" stm:"memory"` + + MemoryPools []struct { + STMKey string + + Name string `xml:"name,attr"` + Type string `xml:"type,attr"` + UsageInit int64 `xml:"usageInit,attr"` + UsageCommitted int64 `xml:"usageCommitted,attr" stm:"commited"` + UsageMax int64 `xml:"usageMax,attr" stm:"max"` + UsageUsed int64 `xml:"usageUsed,attr" stm:"used"` + } `xml:"memorypool" stm:"memorypool"` + } `xml:"jvm" stm:"jvm"` + + Connectors []struct { + STMKey string + + Name string `xml:"name,attr"` + + ThreadInfo struct { + MaxThreads int64 `xml:"maxThreads,attr"` + CurrentThreadCount int64 `xml:"currentThreadCount,attr" stm:"count"` + CurrentThreadsBusy int64 `xml:"currentThreadsBusy,attr" stm:"busy"` + CurrentThreadsIdle int64 `stm:"idle"` // calculated manually + } `xml:"threadInfo" stm:"thread_info"` + + RequestInfo struct { + MaxTime int64 `xml:"maxTime,attr"` + ProcessingTime int64 `xml:"processingTime,attr" stm:"processing_time"` + RequestCount int64 `xml:"requestCount,attr" stm:"request_count"` + ErrorCount int64 `xml:"errorCount,attr" stm:"error_count"` + BytesReceived int64 `xml:"bytesReceived,attr" stm:"bytes_received"` + BytesSent int64 `xml:"bytesSent,attr" stm:"bytes_sent"` + } `xml:"requestInfo" stm:"request_info"` + } `xml:"connector" stm:"connector"` +} diff --git a/src/go/plugin/go.d/modules/tomcat/testdata/config.json b/src/go/plugin/go.d/modules/tomcat/testdata/config.json new file mode 100644 index 000000000..984c3ed6e --- /dev/null +++ b/src/go/plugin/go.d/modules/tomcat/testdata/config.json @@ -0,0 +1,20 @@ +{ + "update_every": 123, + "url": "ok", + "body": "ok", + "method": "ok", + "headers": { + "ok": "ok" + }, + "username": "ok", + "password": "ok", + "proxy_url": "ok", + "proxy_username": "ok", + "proxy_password": "ok", + "timeout": 123.123, + "not_follow_redirects": true, + "tls_ca": "ok", + "tls_cert": "ok", + "tls_key": "ok", + "tls_skip_verify": true +} diff --git a/src/go/plugin/go.d/modules/tomcat/testdata/config.yaml b/src/go/plugin/go.d/modules/tomcat/testdata/config.yaml new file mode 100644 index 000000000..8558b61cc --- /dev/null +++ b/src/go/plugin/go.d/modules/tomcat/testdata/config.yaml @@ -0,0 +1,17 @@ +update_every: 123 +url: "ok" +body: "ok" +method: "ok" +headers: + ok: "ok" +username: "ok" +password: "ok" +proxy_url: "ok" +proxy_username: "ok" +proxy_password: "ok" +timeout: 123.123 +not_follow_redirects: yes +tls_ca: "ok" +tls_cert: "ok" +tls_key: "ok" +tls_skip_verify: yes diff --git a/src/go/plugin/go.d/modules/tomcat/testdata/server_status.xml b/src/go/plugin/go.d/modules/tomcat/testdata/server_status.xml new file mode 100644 index 000000000..e4d54f4e8 --- /dev/null +++ b/src/go/plugin/go.d/modules/tomcat/testdata/server_status.xml @@ -0,0 +1,54 @@ +<?xml version="1.0" encoding="utf-8"?><?xml-stylesheet type="text/xsl" href="/manager/xform.xsl" ?> +<status> + <jvm> + <memory free='144529816' total='179306496' max='1914699776'/> + <memorypool name='G1 Eden Space' type='Heap memory' usageInit='24117248' usageCommitted='108003328' + usageMax='-1' usageUsed='23068672'/> + <memorypool name='G1 Old Gen' type='Heap memory' usageInit='97517568' usageCommitted='66060288' + usageMax='1914699776' usageUsed='6175120'/> + <memorypool name='G1 Survivor Space' type='Heap memory' usageInit='0' usageCommitted='5242880' usageMax='-1' + usageUsed='5040192'/> + <memorypool name='CodeHeap 'non-nmethods'' type='Non-heap memory' usageInit='2555904' + usageCommitted='2555904' usageMax='5840896' usageUsed='1477888'/> + <memorypool name='CodeHeap 'non-profiled nmethods'' type='Non-heap memory' usageInit='2555904' + usageCommitted='4587520' usageMax='122908672' usageUsed='4536704'/> + <memorypool name='CodeHeap 'profiled nmethods'' type='Non-heap memory' usageInit='2555904' + usageCommitted='13172736' usageMax='122908672' usageUsed='13132032'/> + <memorypool name='Compressed Class Space' type='Non-heap memory' usageInit='0' usageCommitted='1900544' + usageMax='1073741824' usageUsed='1712872'/> + <memorypool name='Metaspace' type='Non-heap memory' usageInit='0' usageCommitted='18939904' usageMax='-1' + usageUsed='18537336'/> + </jvm> + <connector name='"http-nio-8080"'> + <threadInfo maxThreads="200" currentThreadCount="10" currentThreadsBusy="1"/> + <requestInfo maxTime="247" processingTime="28326" requestCount="4838" errorCount="24" bytesReceived="0" + bytesSent="12174519"/> + <workers> + <worker stage="R" requestProcessingTime="0" requestBytesSent="0" requestBytesReceived="0" remoteAddr="?" + virtualHost="?" method="?" currentUri="?" currentQueryString="?" protocol="?"/> + <worker stage="R" requestProcessingTime="0" requestBytesSent="0" requestBytesReceived="0" remoteAddr="?" + virtualHost="?" method="?" currentUri="?" currentQueryString="?" protocol="?"/> + <worker stage="R" requestProcessingTime="0" requestBytesSent="0" requestBytesReceived="0" remoteAddr="?" + virtualHost="?" method="?" currentUri="?" currentQueryString="?" protocol="?"/> + <worker stage="S" requestProcessingTime="30" requestBytesSent="0" requestBytesReceived="0" + remoteAddr="127.0.0.1" virtualHost="127.0.0.1" method="GET" currentUri="/manager/status" + currentQueryString="XML=true" protocol="HTTP/1.1"/> + </workers> + </connector> + <connector name='"http-nio-8081"'> + <threadInfo maxThreads="200" currentThreadCount="10" currentThreadsBusy="1"/> + <requestInfo maxTime="247" processingTime="28326" requestCount="4838" errorCount="24" bytesReceived="0" + bytesSent="12174519"/> + <workers> + <worker stage="R" requestProcessingTime="0" requestBytesSent="0" requestBytesReceived="0" remoteAddr="?" + virtualHost="?" method="?" currentUri="?" currentQueryString="?" protocol="?"/> + <worker stage="R" requestProcessingTime="0" requestBytesSent="0" requestBytesReceived="0" remoteAddr="?" + virtualHost="?" method="?" currentUri="?" currentQueryString="?" protocol="?"/> + <worker stage="R" requestProcessingTime="0" requestBytesSent="0" requestBytesReceived="0" remoteAddr="?" + virtualHost="?" method="?" currentUri="?" currentQueryString="?" protocol="?"/> + <worker stage="S" requestProcessingTime="30" requestBytesSent="0" requestBytesReceived="0" + remoteAddr="127.0.0.1" virtualHost="127.0.0.1" method="GET" currentUri="/manager/status" + currentQueryString="XML=true" protocol="HTTP/1.1"/> + </workers> + </connector> +</status> diff --git a/src/go/plugin/go.d/modules/tomcat/tomcat.go b/src/go/plugin/go.d/modules/tomcat/tomcat.go new file mode 100644 index 000000000..540247063 --- /dev/null +++ b/src/go/plugin/go.d/modules/tomcat/tomcat.go @@ -0,0 +1,120 @@ +// SPDX-License-Identifier: GPL-3.0-or-later + +package tomcat + +import ( + _ "embed" + "errors" + "net/http" + "time" + + "github.com/netdata/netdata/go/plugins/plugin/go.d/agent/module" + "github.com/netdata/netdata/go/plugins/plugin/go.d/pkg/web" +) + +//go:embed "config_schema.json" +var configSchema string + +func init() { + module.Register("tomcat", module.Creator{ + JobConfigSchema: configSchema, + Create: func() module.Module { return New() }, + Config: func() any { return &Config{} }, + }) +} + +func New() *Tomcat { + return &Tomcat{ + Config: Config{ + HTTP: web.HTTP{ + Request: web.Request{ + URL: "http://127.0.0.1:8080", + }, + Client: web.Client{ + Timeout: web.Duration(time.Second * 1), + }, + }, + }, + charts: defaultCharts.Copy(), + seenConnectors: make(map[string]bool), + seenMemPools: make(map[string]bool), + } +} + +type Config struct { + UpdateEvery int `yaml:"update_every,omitempty" json:"update_every"` + web.HTTP `yaml:",inline" json:""` +} + +type Tomcat struct { + module.Base + Config `yaml:",inline" json:""` + + charts *module.Charts + + httpClient *http.Client + + seenConnectors map[string]bool + seenMemPools map[string]bool +} + +func (t *Tomcat) Configuration() any { + return t.Config +} + +func (t *Tomcat) Init() error { + if err := t.validateConfig(); err != nil { + t.Errorf("config validation: %v", err) + return err + } + + httpClient, err := t.initHTTPClient() + if err != nil { + t.Errorf("init HTTP client: %v", err) + return err + } + + t.httpClient = httpClient + + t.Debugf("using URL %s", t.URL) + t.Debugf("using timeout: %s", t.Timeout) + + return nil +} + +func (t *Tomcat) Check() error { + mx, err := t.collect() + if err != nil { + t.Error(err) + return err + } + + if len(mx) == 0 { + return errors.New("no metrics collected") + } + + return nil +} + +func (t *Tomcat) Charts() *module.Charts { + return t.charts +} + +func (t *Tomcat) Collect() map[string]int64 { + mx, err := t.collect() + if err != nil { + t.Error(err) + } + + if len(mx) == 0 { + return nil + } + + return mx +} + +func (t *Tomcat) Cleanup() { + if t.httpClient != nil { + t.httpClient.CloseIdleConnections() + } +} diff --git a/src/go/plugin/go.d/modules/tomcat/tomcat_test.go b/src/go/plugin/go.d/modules/tomcat/tomcat_test.go new file mode 100644 index 000000000..7dfb6ff1a --- /dev/null +++ b/src/go/plugin/go.d/modules/tomcat/tomcat_test.go @@ -0,0 +1,272 @@ +// SPDX-License-Identifier: GPL-3.0-or-later + +package tomcat + +import ( + "net/http" + "net/http/httptest" + "os" + "testing" + + "github.com/netdata/netdata/go/plugins/plugin/go.d/agent/module" + "github.com/netdata/netdata/go/plugins/plugin/go.d/pkg/web" + + "github.com/stretchr/testify/assert" + "github.com/stretchr/testify/require" +) + +var ( + dataConfigJSON, _ = os.ReadFile("testdata/config.json") + dataConfigYAML, _ = os.ReadFile("testdata/config.yaml") + + dataServerStatus, _ = os.ReadFile("testdata/server_status.xml") +) + +func Test_testDataIsValid(t *testing.T) { + for name, data := range map[string][]byte{ + "dataConfigJSON": dataConfigJSON, + "dataConfigYAML": dataConfigYAML, + "dataServerStatus": dataServerStatus, + } { + require.NotNil(t, data, name) + } +} + +func TestTomcat_ConfigurationSerialize(t *testing.T) { + module.TestConfigurationSerialize(t, &Tomcat{}, dataConfigJSON, dataConfigYAML) +} + +func TestTomcat_Init(t *testing.T) { + tests := map[string]struct { + wantFail bool + config Config + }{ + "success with default": { + wantFail: false, + config: New().Config, + }, + "fail when URL not set": { + wantFail: true, + config: Config{ + HTTP: web.HTTP{ + Request: web.Request{URL: ""}, + }, + }, + }, + } + + for name, test := range tests { + t.Run(name, func(t *testing.T) { + tomcat := New() + tomcat.Config = test.config + + if test.wantFail { + assert.Error(t, tomcat.Init()) + } else { + assert.NoError(t, tomcat.Init()) + } + }) + } +} + +func TestTomcat_Charts(t *testing.T) { + assert.NotNil(t, New().Charts()) +} + +func TestTomcat_Check(t *testing.T) { + tests := map[string]struct { + wantFail bool + prepare func(t *testing.T) (*Tomcat, func()) + }{ + "success case": { + wantFail: false, + prepare: prepareCaseSuccess, + }, + "fails on unexpected xml response": { + wantFail: true, + prepare: prepareCaseUnexpectedXMLResponse, + }, + "fails on invalid format response": { + wantFail: true, + prepare: prepareCaseInvalidFormatResponse, + }, + "fails on connection refused": { + wantFail: true, + prepare: prepareCaseConnectionRefused, + }, + } + + for name, test := range tests { + t.Run(name, func(t *testing.T) { + tomcat, cleanup := test.prepare(t) + defer cleanup() + + if test.wantFail { + assert.Error(t, tomcat.Check()) + } else { + assert.NoError(t, tomcat.Check()) + } + }) + } +} + +func TestTomcat_Collect(t *testing.T) { + tests := map[string]struct { + prepare func(t *testing.T) (tomcat *Tomcat, cleanup func()) + wantMetrics map[string]int64 + wantCharts int + }{ + "success case": { + prepare: prepareCaseSuccess, + wantCharts: len(defaultCharts) + len(jvmMemoryPoolChartsTmpl)*8 + len(connectorChartsTmpl)*2, + wantMetrics: map[string]int64{ + "connector_http-nio-8080_request_info_bytes_received": 0, + "connector_http-nio-8080_request_info_bytes_sent": 12174519, + "connector_http-nio-8080_request_info_error_count": 24, + "connector_http-nio-8080_request_info_processing_time": 28326, + "connector_http-nio-8080_request_info_request_count": 4838, + "connector_http-nio-8080_thread_info_busy": 1, + "connector_http-nio-8080_thread_info_count": 10, + "connector_http-nio-8080_thread_info_idle": 9, + "connector_http-nio-8081_request_info_bytes_received": 0, + "connector_http-nio-8081_request_info_bytes_sent": 12174519, + "connector_http-nio-8081_request_info_error_count": 24, + "connector_http-nio-8081_request_info_processing_time": 28326, + "connector_http-nio-8081_request_info_request_count": 4838, + "connector_http-nio-8081_thread_info_busy": 1, + "connector_http-nio-8081_thread_info_count": 10, + "connector_http-nio-8081_thread_info_idle": 9, + "jvm_memory_free": 144529816, + "jvm_memory_total": 179306496, + "jvm_memory_used": 34776680, + "jvm_memorypool_codeheap_non-nmethods_commited": 2555904, + "jvm_memorypool_codeheap_non-nmethods_max": 5840896, + "jvm_memorypool_codeheap_non-nmethods_used": 1477888, + "jvm_memorypool_codeheap_non-profiled_nmethods_commited": 4587520, + "jvm_memorypool_codeheap_non-profiled_nmethods_max": 122908672, + "jvm_memorypool_codeheap_non-profiled_nmethods_used": 4536704, + "jvm_memorypool_codeheap_profiled_nmethods_commited": 13172736, + "jvm_memorypool_codeheap_profiled_nmethods_max": 122908672, + "jvm_memorypool_codeheap_profiled_nmethods_used": 13132032, + "jvm_memorypool_compressed_class_space_commited": 1900544, + "jvm_memorypool_compressed_class_space_max": 1073741824, + "jvm_memorypool_compressed_class_space_used": 1712872, + "jvm_memorypool_g1_eden_space_commited": 108003328, + "jvm_memorypool_g1_eden_space_max": -1, + "jvm_memorypool_g1_eden_space_used": 23068672, + "jvm_memorypool_g1_old_gen_commited": 66060288, + "jvm_memorypool_g1_old_gen_max": 1914699776, + "jvm_memorypool_g1_old_gen_used": 6175120, + "jvm_memorypool_g1_survivor_space_commited": 5242880, + "jvm_memorypool_g1_survivor_space_max": -1, + "jvm_memorypool_g1_survivor_space_used": 5040192, + "jvm_memorypool_metaspace_commited": 18939904, + "jvm_memorypool_metaspace_max": -1, + "jvm_memorypool_metaspace_used": 18537336, + }, + }, + "fails on unexpected xml response": { + prepare: prepareCaseUnexpectedXMLResponse, + }, + "fails on invalid format response": { + prepare: prepareCaseInvalidFormatResponse, + }, + "fails on connection refused": { + prepare: prepareCaseConnectionRefused, + }, + } + + for name, test := range tests { + t.Run(name, func(t *testing.T) { + tomcat, cleanup := test.prepare(t) + defer cleanup() + + mx := tomcat.Collect() + + require.Equal(t, test.wantMetrics, mx) + + if len(test.wantMetrics) > 0 { + assert.Equal(t, test.wantCharts, len(*tomcat.Charts())) + module.TestMetricsHasAllChartsDims(t, tomcat.Charts(), mx) + } + }) + } +} + +func prepareCaseSuccess(t *testing.T) (*Tomcat, func()) { + t.Helper() + srv := httptest.NewServer(http.HandlerFunc( + func(w http.ResponseWriter, r *http.Request) { + switch r.URL.Path { + case urlPathServerStatus: + if r.URL.RawQuery != urlQueryServerStatus { + w.WriteHeader(http.StatusNotFound) + } else { + _, _ = w.Write(dataServerStatus) + } + default: + w.WriteHeader(http.StatusNotFound) + } + })) + tomcat := New() + tomcat.URL = srv.URL + require.NoError(t, tomcat.Init()) + + return tomcat, srv.Close +} + +func prepareCaseConnectionRefused(t *testing.T) (*Tomcat, func()) { + t.Helper() + tomcat := New() + tomcat.URL = "http://127.0.0.1:65001" + require.NoError(t, tomcat.Init()) + + return tomcat, func() {} +} + +func prepareCaseUnexpectedXMLResponse(t *testing.T) (*Tomcat, func()) { + t.Helper() + resp := ` +<?xml version="1.0" encoding="UTF-8" ?> + <root> + <elephant> + <burn>false</burn> + <mountain>true</mountain> + <fog>false</fog> + <skin>-1561907625</skin> + <burst>anyway</burst> + <shadow>1558616893</shadow> + </elephant> + <start>ever</start> + <base>2093056027</base> + <mission>-2007590351</mission> + <victory>999053756</victory> + <die>false</die> + </root> + +` + srv := httptest.NewServer(http.HandlerFunc( + func(w http.ResponseWriter, r *http.Request) { + _, _ = w.Write([]byte(resp)) + })) + + tomcat := New() + tomcat.URL = srv.URL + require.NoError(t, tomcat.Init()) + + return tomcat, srv.Close +} + +func prepareCaseInvalidFormatResponse(t *testing.T) (*Tomcat, func()) { + t.Helper() + srv := httptest.NewServer(http.HandlerFunc( + func(w http.ResponseWriter, r *http.Request) { + _, _ = w.Write([]byte("hello and\n goodbye")) + })) + + tomcat := New() + tomcat.URL = srv.URL + require.NoError(t, tomcat.Init()) + + return tomcat, srv.Close +} diff --git a/src/collectors/python.d.plugin/tor/README.md b/src/go/plugin/go.d/modules/tor/README.md index 7c20cd40a..7c20cd40a 120000 --- a/src/collectors/python.d.plugin/tor/README.md +++ b/src/go/plugin/go.d/modules/tor/README.md diff --git a/src/go/plugin/go.d/modules/tor/charts.go b/src/go/plugin/go.d/modules/tor/charts.go new file mode 100644 index 000000000..1e2a1ef97 --- /dev/null +++ b/src/go/plugin/go.d/modules/tor/charts.go @@ -0,0 +1,43 @@ +// SPDX-License-Identifier: GPL-3.0-or-later + +package tor + +import ( + "github.com/netdata/netdata/go/plugins/plugin/go.d/agent/module" +) + +const ( + prioTraffic = module.Priority + iota + prioUptime +) + +var charts = module.Charts{ + trafficChart.Copy(), + uptimeChart.Copy(), +} + +var trafficChart = module.Chart{ + ID: "traffic", + Title: "Tor Traffic", + Units: "KiB/s", + Fam: "traffic", + Ctx: "tor.traffic", + Type: module.Area, + Priority: prioTraffic, + Dims: module.Dims{ + {ID: "traffic/read", Name: "read", Algo: module.Incremental, Div: 1024}, + {ID: "traffic/written", Name: "write", Algo: module.Incremental, Mul: -1, Div: 1024}, + }, +} + +var uptimeChart = module.Chart{ + ID: "uptime", + Title: "Tor Uptime", + Units: "seconds", + Fam: "uptime", + Ctx: "tor.uptime", + Priority: prioUptime, + Dims: module.Dims{ + {ID: "uptime"}, + }, +} diff --git a/src/go/plugin/go.d/modules/tor/client.go b/src/go/plugin/go.d/modules/tor/client.go new file mode 100644 index 000000000..e4a8045a9 --- /dev/null +++ b/src/go/plugin/go.d/modules/tor/client.go @@ -0,0 +1,117 @@ +// SPDX-License-Identifier: GPL-3.0-or-later + +package tor + +import ( + "bytes" + "errors" + "fmt" + "strings" + + "github.com/netdata/netdata/go/plugins/plugin/go.d/pkg/socket" +) + +// https://spec.torproject.org/control-spec/index.html +// https://github.com/torproject/stem/blob/master/stem/control.py + +const ( + cmdAuthenticate = "AUTHENTICATE" + cmdQuit = "QUIT" + cmdGetInfo = "GETINFO" +) + +type controlConn interface { + connect() error + disconnect() + + getInfo(...string) ([]byte, error) +} + +func newControlConn(conf Config) controlConn { + return &torControlClient{ + password: conf.Password, + conn: socket.New(socket.Config{ + Address: conf.Address, + ConnectTimeout: conf.Timeout.Duration(), + ReadTimeout: conf.Timeout.Duration(), + WriteTimeout: conf.Timeout.Duration(), + })} +} + +type torControlClient struct { + password string + conn socket.Client +} + +func (c *torControlClient) connect() error { + if err := c.conn.Connect(); err != nil { + return err + } + + return c.authenticate() +} + +func (c *torControlClient) authenticate() error { + // https://spec.torproject.org/control-spec/commands.html#authenticate + + cmd := cmdAuthenticate + if c.password != "" { + cmd = fmt.Sprintf("%s \"%s\"", cmdAuthenticate, c.password) + } + + var s string + err := c.conn.Command(cmd+"\n", func(bs []byte) bool { + s = string(bs) + return false + }) + if err != nil { + return fmt.Errorf("authentication failed: %v", err) + } + if !strings.HasPrefix(s, "250") { + return fmt.Errorf("authentication failed: %s", s) + } + return nil +} + +func (c *torControlClient) disconnect() { + // https://spec.torproject.org/control-spec/commands.html#quit + + _ = c.conn.Command(cmdQuit+"\n", func(bs []byte) bool { return false }) + _ = c.conn.Disconnect() +} + +func (c *torControlClient) getInfo(keywords ...string) ([]byte, error) { + // https://spec.torproject.org/control-spec/commands.html#getinfo + + if len(keywords) == 0 { + return nil, errors.New("no keywords specified") + } + cmd := fmt.Sprintf("%s %s", cmdGetInfo, strings.Join(keywords, " ")) + + var buf bytes.Buffer + var err error + + clientErr := c.conn.Command(cmd+"\n", func(bs []byte) bool { + s := string(bs) + + switch { + case strings.HasPrefix(s, "250-"): + buf.WriteString(strings.TrimPrefix(s, "250-")) + buf.WriteByte('\n') + return true + case strings.HasPrefix(s, "250 "): + return false + default: + err = errors.New(s) + return false + } + }) + if clientErr != nil { + return nil, fmt.Errorf("command '%s' failed: %v", cmd, clientErr) + } + if err != nil { + return nil, fmt.Errorf("command '%s' failed: %v", cmd, err) + } + + return buf.Bytes(), nil +} diff --git a/src/go/plugin/go.d/modules/tor/collect.go b/src/go/plugin/go.d/modules/tor/collect.go new file mode 100644 index 000000000..6e6078df3 --- /dev/null +++ b/src/go/plugin/go.d/modules/tor/collect.go @@ -0,0 +1,65 @@ +// SPDX-License-Identifier: GPL-3.0-or-later + +package tor + +import ( + "bufio" + "bytes" + "fmt" + "strconv" + "strings" +) + +func (t *Tor) collect() (map[string]int64, error) { + if t.conn == nil { + conn, err := t.establishConnection() + if err != nil { + return nil, err + } + t.conn = conn + } + + mx := make(map[string]int64) + if err := t.collectServerInfo(mx); err != nil { + t.Cleanup() + return nil, err + } + + return mx, nil +} + +func (t *Tor) collectServerInfo(mx map[string]int64) error { + resp, err := t.conn.getInfo("traffic/read", "traffic/written", "uptime") + if err != nil { + return err + } + + sc := bufio.NewScanner(bytes.NewReader(resp)) + + for sc.Scan() { + line := sc.Text() + + key, value, ok := strings.Cut(line, "=") + if !ok { + return fmt.Errorf("failed to parse metric: %s", line) + } + + v, err := strconv.ParseInt(value, 10, 64) + if err != nil { + return fmt.Errorf("failed to parse metric %s value: %v", line, err) + } + mx[key] = v + } + + return nil +} + +func (t *Tor) establishConnection() (controlConn, error) { + conn := t.newConn(t.Config) + + if err := conn.connect(); err != nil { + return nil, err + } + + return conn, nil +} diff --git a/src/go/plugin/go.d/modules/tor/config_schema.json b/src/go/plugin/go.d/modules/tor/config_schema.json new file mode 100644 index 000000000..abfc40d95 --- /dev/null +++ b/src/go/plugin/go.d/modules/tor/config_schema.json @@ -0,0 +1,53 @@ +{ + "jsonSchema": { + "$schema": "http://json-schema.org/draft-07/schema#", + "title": "Tor collector configuration.", + "type": "object", + "properties": { + "update_every": { + "title": "Update every", + "description": "Data collection interval, measured in seconds.", + "type": "integer", + "minimum": 1, + "default": 1 + }, + "address": { + "title": "Address", + "description": "The IP address and port where the Tor's Control Port listens for connections.", + "type": "string", + "default": "127.0.0.1:9051" + }, + "timeout": { + "title": "Timeout", + "description": "Timeout for establishing a connection and communication (reading and writing) in seconds.", + "type": "number", + "minimum": 0.5, + "default": 1 + }, + "password": { + "title": "Password", + "description": "The password for authentication.", + "type": "string", + "sensitive": true + } + }, + "required": [ + "address" + ], + "additionalProperties": false, + "patternProperties": { + "^name$": {} + } + }, + "uiSchema": { + "uiOptions": { + "fullPage": true + }, + "timeout": { + "ui:help": "Accepts decimals for precise control (e.g., type 1.5 for 1.5 seconds)." + }, + "password": { + "ui:widget": "password" + } + } +} diff --git a/src/go/plugin/go.d/modules/tor/integrations/tor.md b/src/go/plugin/go.d/modules/tor/integrations/tor.md new file mode 100644 index 000000000..54b5a428c --- /dev/null +++ b/src/go/plugin/go.d/modules/tor/integrations/tor.md @@ -0,0 +1,225 @@ +<!--startmeta +custom_edit_url: "https://github.com/netdata/netdata/edit/master/src/go/plugin/go.d/modules/tor/README.md" +meta_yaml: "https://github.com/netdata/netdata/edit/master/src/go/plugin/go.d/modules/tor/metadata.yaml" +sidebar_label: "Tor" +learn_status: "Published" +learn_rel_path: "Collecting Metrics/VPNs" +most_popular: False +message: "DO NOT EDIT THIS FILE DIRECTLY, IT IS GENERATED BY THE COLLECTOR'S metadata.yaml FILE" +endmeta--> + +# Tor + + +<img src="https://netdata.cloud/img/tor.svg" width="150"/> + + +Plugin: go.d.plugin +Module: tor + +<img src="https://img.shields.io/badge/maintained%20by-Netdata-%2300ab44" /> + +## Overview + +Tracks Tor's download and upload traffic, as well as its uptime. + + +It reads the server's response to the [GETINFO](https://spec.torproject.org/control-spec/commands.html#getinfo) command. + + +This collector is supported on all platforms. + +This collector supports collecting metrics from multiple instances of this integration, including remote instances. + + +### Default Behavior + +#### Auto-Detection + +By default, it detects Tor instances running on localhost that are listening on port 9051. +On startup, it tries to collect metrics from: + +- 127.0.0.1:9051 + + +#### Limits + +The default configuration for this integration does not impose any limits on data collection. + +#### Performance Impact + +The default configuration for this integration is not expected to impose a significant performance impact on the system. + + +## Metrics + +Metrics grouped by *scope*. + +The scope defines the instance that the metric belongs to. An instance is uniquely identified by a set of labels. + + + +### Per Tor instance + +These metrics refer to the entire monitored application. + +This scope has no labels. + +Metrics: + +| Metric | Dimensions | Unit | +|:------|:----------|:----| +| tor.traffic | read, write | KiB/s | +| tor.uptime | uptime | seconds | + + + +## Alerts + +There are no alerts configured by default for this integration. + + +## Setup + +### Prerequisites + +#### Enable Control Port + +Enable `ControlPort` in `/etc/tor/torrc`. + + + +### Configuration + +#### File + +The configuration file name for this integration is `go.d/tor.conf`. + + +You can edit the configuration file using the `edit-config` script from the +Netdata [config directory](/docs/netdata-agent/configuration/README.md#the-netdata-config-directory). + +```bash +cd /etc/netdata 2>/dev/null || cd /opt/netdata/etc/netdata +sudo ./edit-config go.d/tor.conf +``` +#### Options + +The following options can be defined globally: update_every, autodetection_retry. + + +<details open><summary>Config options</summary> + +| Name | Description | Default | Required | +|:----|:-----------|:-------|:--------:| +| update_every | Data collection frequency. | 1 | no | +| autodetection_retry | Recheck interval in seconds. Zero means no recheck will be scheduled. | 0 | no | +| address | The IP address and port where the Tor's Control Port listens for connections. | 127.0.0.1:9051 | yes | +| timeout | Connection, read, and write timeout duration in seconds. The timeout includes name resolution. | 1 | no | +| password | Password for authentication. | | no | + +</details> + +#### Examples + +##### Basic + +A basic example configuration. + +<details open><summary>Config</summary> + +```yaml +jobs: + - name: local + address: 127.0.0.1:9051 + password: somePassword + +``` +</details> + +##### Multi-instance + +> **Note**: When you define multiple jobs, their names must be unique. + +Collecting metrics from local and remote instances. + + +<details open><summary>Config</summary> + +```yaml +jobs: + - name: local + address: 127.0.0.1:9051 + password: somePassword + + - name: remote + address: 203.0.113.0:9051 + password: somePassword + +``` +</details> + + + +## Troubleshooting + +### Debug Mode + +**Important**: Debug mode is not supported for data collection jobs created via the UI using the Dyncfg feature. + +To troubleshoot issues with the `tor` collector, run the `go.d.plugin` with the debug option enabled. The output +should give you clues as to why the collector isn't working. + +- Navigate to the `plugins.d` directory, usually at `/usr/libexec/netdata/plugins.d/`. If that's not the case on + your system, open `netdata.conf` and look for the `plugins` setting under `[directories]`. + + ```bash + cd /usr/libexec/netdata/plugins.d/ + ``` + +- Switch to the `netdata` user. + + ```bash + sudo -u netdata -s + ``` + +- Run the `go.d.plugin` to debug the collector: + + ```bash + ./go.d.plugin -d -m tor + ``` + +### Getting Logs + +If you're encountering problems with the `tor` collector, follow these steps to retrieve logs and identify potential issues: + +- **Run the command** specific to your system (systemd, non-systemd, or Docker container). +- **Examine the output** for any warnings or error messages that might indicate issues. These messages should provide clues about the root cause of the problem. + +#### System with systemd + +Use the following command to view logs generated since the last Netdata service restart: + +```bash +journalctl _SYSTEMD_INVOCATION_ID="$(systemctl show --value --property=InvocationID netdata)" --namespace=netdata --grep tor +``` + +#### System without systemd + +Locate the collector log file, typically at `/var/log/netdata/collector.log`, and use `grep` to filter for collector's name: + +```bash +grep tor /var/log/netdata/collector.log +``` + +**Note**: This method shows logs from all restarts. Focus on the **latest entries** for troubleshooting current issues. + +#### Docker Container + +If your Netdata runs in a Docker container named "netdata" (replace if different), use this command: + +```bash +docker logs netdata 2>&1 | grep tor +``` + + diff --git a/src/go/plugin/go.d/modules/tor/metadata.yaml b/src/go/plugin/go.d/modules/tor/metadata.yaml new file mode 100644 index 000000000..7df589346 --- /dev/null +++ b/src/go/plugin/go.d/modules/tor/metadata.yaml @@ -0,0 +1,135 @@ +plugin_name: go.d.plugin +modules: + - meta: + id: collector-go.d.plugin-tor + plugin_name: go.d.plugin + module_name: tor + monitored_instance: + name: Tor + link: https://www.torproject.org/ + categories: + - data-collection.vpns + icon_filename: "tor.svg" + related_resources: + integrations: + list: [] + info_provided_to_referring_integrations: + description: "" + keywords: + - tor + - traffic + - vpn + most_popular: false + overview: + data_collection: + metrics_description: | + Tracks Tor's download and upload traffic, as well as its uptime. + method_description: | + It reads the server's response to the [GETINFO](https://spec.torproject.org/control-spec/commands.html#getinfo) command. + supported_platforms: + include: [] + exclude: [] + multi_instance: true + additional_permissions: + description: "" + default_behavior: + auto_detection: + description: | + By default, it detects Tor instances running on localhost that are listening on port 9051. + On startup, it tries to collect metrics from: + + - 127.0.0.1:9051 + limits: + description: "" + performance_impact: + description: "" + setup: + prerequisites: + list: + - title: Enable Control Port + description: | + Enable `ControlPort` in `/etc/tor/torrc`. + configuration: + file: + name: go.d/tor.conf + options: + description: | + The following options can be defined globally: update_every, autodetection_retry. + folding: + title: Config options + enabled: true + list: + - name: update_every + description: Data collection frequency. + default_value: 1 + required: false + - name: autodetection_retry + description: Recheck interval in seconds. Zero means no recheck will be scheduled. + default_value: 0 + required: false + - name: address + description: The IP address and port where the Tor's Control Port listens for connections. + default_value: 127.0.0.1:9051 + required: true + - name: timeout + description: Connection, read, and write timeout duration in seconds. The timeout includes name resolution. + default_value: 1 + required: false + - name: password + description: Password for authentication. + default_value: "" + required: false + examples: + folding: + title: Config + enabled: true + list: + - name: Basic + description: A basic example configuration. + config: | + jobs: + - name: local + address: 127.0.0.1:9051 + password: somePassword + - name: Multi-instance + description: | + > **Note**: When you define multiple jobs, their names must be unique. + + Collecting metrics from local and remote instances. + config: | + jobs: + - name: local + address: 127.0.0.1:9051 + password: somePassword + + - name: remote + address: 203.0.113.0:9051 + password: somePassword + troubleshooting: + problems: + list: [] + alerts: [] + metrics: + folding: + title: Metrics + enabled: false + description: "" + availability: [] + scopes: + - name: global + description: "These metrics refer to the entire monitored application." + labels: [] + metrics: + - name: tor.traffic + description: Tor Traffic + unit: "KiB/s" + chart_type: area + dimensions: + - name: read + - name: write + - name: tor.uptime + description: Tor Uptime + unit: "seconds" + chart_type: line + dimensions: + - name: uptime diff --git a/src/go/plugin/go.d/modules/tor/testdata/config.json b/src/go/plugin/go.d/modules/tor/testdata/config.json new file mode 100644 index 000000000..76769305c --- /dev/null +++ b/src/go/plugin/go.d/modules/tor/testdata/config.json @@ -0,0 +1,6 @@ +{ + "update_every": 123, + "address": "ok", + "timeout": 123.123, + "password": "ok" +} diff --git a/src/go/plugin/go.d/modules/tor/testdata/config.yaml b/src/go/plugin/go.d/modules/tor/testdata/config.yaml new file mode 100644 index 000000000..95ba970ba --- /dev/null +++ b/src/go/plugin/go.d/modules/tor/testdata/config.yaml @@ -0,0 +1,4 @@ +update_every: 123 +address: "ok" +timeout: 123.123 +password: "ok" diff --git a/src/go/plugin/go.d/modules/tor/tor.go b/src/go/plugin/go.d/modules/tor/tor.go new file mode 100644 index 000000000..bb6cacab1 --- /dev/null +++ b/src/go/plugin/go.d/modules/tor/tor.go @@ -0,0 +1,102 @@ +// SPDX-License-Identifier: GPL-3.0-or-later + +package tor + +import ( + _ "embed" + "errors" + "time" + + "github.com/netdata/netdata/go/plugins/plugin/go.d/agent/module" + "github.com/netdata/netdata/go/plugins/plugin/go.d/pkg/web" +) + +//go:embed "config_schema.json" +var configSchema string + +func init() { + module.Register("tor", module.Creator{ + JobConfigSchema: configSchema, + Create: func() module.Module { return New() }, + Config: func() any { return &Config{} }, + }) +} + +func New() *Tor { + return &Tor{ + Config: Config{ + Address: "127.0.0.1:9051", + Timeout: web.Duration(time.Second * 1), + }, + newConn: newControlConn, + charts: charts.Copy(), + } +} + +type Config struct { + UpdateEvery int `yaml:"update_every,omitempty" json:"update_every"` + Address string `yaml:"address" json:"address"` + Timeout web.Duration `yaml:"timeout" json:"timeout"` + Password string `yaml:"password" json:"password"` +} + +type Tor struct { + module.Base + Config `yaml:",inline" json:""` + + charts *module.Charts + + newConn func(Config) controlConn + conn controlConn +} + +func (t *Tor) Configuration() any { + return t.Config +} + +func (t *Tor) Init() error { + if t.Address == "" { + t.Error("config: 'address' not set") + return errors.New("address not set") + } + + return nil +} + +func (t *Tor) Check() error { + mx, err := t.collect() + if err != nil { + t.Error(err) + return err + } + + if len(mx) == 0 { + return errors.New("no metrics collected") + } + + return nil +} + +func (t *Tor) Charts() *module.Charts { + return t.charts +} + +func (t *Tor) Collect() map[string]int64 { + mx, err := t.collect() + if err != nil { + t.Error(err) + } + + if len(mx) == 0 { + return nil + } + + return mx +} + +func (t *Tor) Cleanup() { + if t.conn != nil { + t.conn.disconnect() + t.conn = nil + } +} diff --git a/src/go/plugin/go.d/modules/tor/tor_test.go b/src/go/plugin/go.d/modules/tor/tor_test.go new file mode 100644 index 000000000..35001c39a --- /dev/null +++ b/src/go/plugin/go.d/modules/tor/tor_test.go @@ -0,0 +1,328 @@ +// SPDX-License-Identifier: GPL-3.0-or-later + +package tor + +import ( + "bufio" + "errors" + "fmt" + "io" + "net" + "os" + "strings" + "testing" + "time" + + "github.com/netdata/netdata/go/plugins/plugin/go.d/agent/module" + + "github.com/stretchr/testify/assert" + "github.com/stretchr/testify/require" +) + +var ( + dataConfigJSON, _ = os.ReadFile("testdata/config.json") + dataConfigYAML, _ = os.ReadFile("testdata/config.yaml") +) + +func Test_testDataIsValid(t *testing.T) { + for name, data := range map[string][]byte{ + "dataConfigJSON": dataConfigJSON, + "dataConfigYAML": dataConfigYAML, + } { + require.NotNil(t, data, name) + } +} + +func TestTor_ConfigurationSerialize(t *testing.T) { + module.TestConfigurationSerialize(t, &Tor{}, dataConfigJSON, dataConfigYAML) +} + +func TestTor_Init(t *testing.T) { + tests := map[string]struct { + config Config + wantFail bool + }{ + "success with default config": { + wantFail: false, + config: New().Config, + }, + "fails if address not set": { + wantFail: true, + config: func() Config { + conf := New().Config + conf.Address = "" + return conf + }(), + }, + } + + for name, test := range tests { + t.Run(name, func(t *testing.T) { + tor := New() + tor.Config = test.config + + if test.wantFail { + assert.Error(t, tor.Init()) + } else { + assert.NoError(t, tor.Init()) + } + }) + } +} + +func TestTor_Charts(t *testing.T) { + assert.NotNil(t, New().Charts()) +} + +func TestTor_Check(t *testing.T) { + tests := map[string]struct { + prepare func() (*Tor, *mockTorDaemon) + wantFail bool + }{ + "success on valid response": { + wantFail: false, + prepare: prepareCaseOk, + }, + "fails on connection refused": { + wantFail: true, + prepare: prepareCaseConnectionRefused, + }, + } + for name, test := range tests { + t.Run(name, func(t *testing.T) { + tor, daemon := test.prepare() + + defer func() { + assert.NoError(t, daemon.Close(), "daemon.Close()") + }() + go func() { + assert.NoError(t, daemon.Run(), "daemon.Run()") + }() + + select { + case <-daemon.started: + case <-time.After(time.Second * 3): + t.Errorf("mock tor daemon start timed out") + } + + require.NoError(t, tor.Init()) + + if test.wantFail { + assert.Error(t, tor.Check()) + } else { + assert.NoError(t, tor.Check()) + } + + tor.Cleanup() + + select { + case <-daemon.stopped: + case <-time.After(time.Second * 3): + t.Errorf("mock tor daemon stop timed out") + } + }) + } +} + +func TestTor_Collect(t *testing.T) { + tests := map[string]struct { + prepare func() (*Tor, *mockTorDaemon) + wantMetrics map[string]int64 + wantCharts int + }{ + "success on valid response": { + prepare: prepareCaseOk, + wantCharts: len(charts), + wantMetrics: map[string]int64{ + "traffic/read": 100, + "traffic/written": 100, + "uptime": 100, + }, + }, + "fails on connection refused": { + prepare: prepareCaseConnectionRefused, + wantCharts: len(charts), + }, + } + + for name, test := range tests { + t.Run(name, func(t *testing.T) { + tor, daemon := test.prepare() + + defer func() { + assert.NoError(t, daemon.Close(), "daemon.Close()") + }() + go func() { + assert.NoError(t, daemon.Run(), "daemon.Run()") + }() + + select { + case <-daemon.started: + case <-time.After(time.Second * 3): + t.Errorf("mock tor daemon start timed out") + } + + require.NoError(t, tor.Init()) + + mx := tor.Collect() + + require.Equal(t, test.wantMetrics, mx) + + assert.Equal(t, test.wantCharts, len(*tor.Charts()), "want charts") + + if len(test.wantMetrics) > 0 { + module.TestMetricsHasAllChartsDims(t, tor.Charts(), mx) + } + + tor.Cleanup() + + select { + case <-daemon.stopped: + case <-time.After(time.Second * 3): + t.Errorf("mock tordaemon stop timed out") + } + }) + } +} + +func prepareCaseOk() (*Tor, *mockTorDaemon) { + daemon := &mockTorDaemon{ + addr: "127.0.0.1:65001", + started: make(chan struct{}), + stopped: make(chan struct{}), + } + + tor := New() + tor.Address = daemon.addr + + return tor, daemon +} + +func prepareCaseConnectionRefused() (*Tor, *mockTorDaemon) { + ch := make(chan struct{}) + close(ch) + + daemon := &mockTorDaemon{ + addr: "127.0.0.1:65001", + dontStart: true, + started: ch, + stopped: ch, + } + + tor := New() + tor.Address = daemon.addr + + return tor, daemon +} + +type mockTorDaemon struct { + addr string + srv net.Listener + started chan struct{} + stopped chan struct{} + dontStart bool + authenticated bool +} + +func (m *mockTorDaemon) Run() error { + if m.dontStart { + return nil + } + + srv, err := net.Listen("tcp", m.addr) + if err != nil { + return err + } + + m.srv = srv + + close(m.started) + defer close(m.stopped) + + return m.handleConnections() +} + +func (m *mockTorDaemon) Close() error { + if m.srv != nil { + err := m.srv.Close() + m.srv = nil + return err + } + return nil +} + +func (m *mockTorDaemon) handleConnections() error { + conn, err := m.srv.Accept() + if err != nil || conn == nil { + return errors.New("could not accept connection") + } + return m.handleConnection(conn) +} + +func (m *mockTorDaemon) handleConnection(conn net.Conn) error { + defer func() { _ = conn.Close() }() + + rw := bufio.NewReadWriter(bufio.NewReader(conn), bufio.NewWriter(conn)) + var line string + var err error + + for { + if line, err = rw.ReadString('\n'); err != nil { + return fmt.Errorf("error reading from connection: %v", err) + } + + line = strings.TrimSpace(line) + + cmd, param, _ := strings.Cut(line, " ") + + switch cmd { + case cmdQuit: + return m.handleQuit(conn) + case cmdAuthenticate: + err = m.handleAuthenticate(conn) + case cmdGetInfo: + err = m.handleGetInfo(conn, param) + default: + s := fmt.Sprintf("510 Unrecognized command \"%s\"\n", cmd) + _, _ = rw.WriteString(s) + return fmt.Errorf("unexpected command: %s", line) + } + + _ = rw.Flush() + + if err != nil { + return err + } + } +} + +func (m *mockTorDaemon) handleQuit(conn io.Writer) error { + _, err := conn.Write([]byte("250 closing connection\n")) + return err +} + +func (m *mockTorDaemon) handleAuthenticate(conn io.Writer) error { + m.authenticated = true + _, err := conn.Write([]byte("250 OK\n")) + return err +} + +func (m *mockTorDaemon) handleGetInfo(conn io.Writer, keywords string) error { + if !m.authenticated { + _, _ = conn.Write([]byte("514 Authentication required\n")) + return errors.New("authentication required") + } + + keywords = strings.Trim(keywords, "\"") + + for _, k := range strings.Fields(keywords) { + s := fmt.Sprintf("250-%s=%d\n", k, 100) + + if _, err := conn.Write([]byte(s)); err != nil { + return err + } + } + + _, err := conn.Write([]byte("250 OK\n")) + return err +} diff --git a/src/go/collectors/go.d.plugin/modules/traefik/README.md b/src/go/plugin/go.d/modules/traefik/README.md index da5abad23..da5abad23 120000 --- a/src/go/collectors/go.d.plugin/modules/traefik/README.md +++ b/src/go/plugin/go.d/modules/traefik/README.md diff --git a/src/go/collectors/go.d.plugin/modules/traefik/charts.go b/src/go/plugin/go.d/modules/traefik/charts.go index e4f50baf2..7d67ef684 100644 --- a/src/go/collectors/go.d.plugin/modules/traefik/charts.go +++ b/src/go/plugin/go.d/modules/traefik/charts.go @@ -5,7 +5,7 @@ package traefik import ( "fmt" - "github.com/netdata/netdata/go/go.d.plugin/agent/module" + "github.com/netdata/netdata/go/plugins/plugin/go.d/agent/module" ) var chartTmplEntrypointRequests = module.Chart{ diff --git a/src/go/collectors/go.d.plugin/modules/traefik/collect.go b/src/go/plugin/go.d/modules/traefik/collect.go index 3ceb845ec..3f2556060 100644 --- a/src/go/collectors/go.d.plugin/modules/traefik/collect.go +++ b/src/go/plugin/go.d/modules/traefik/collect.go @@ -6,8 +6,8 @@ import ( "errors" "strings" - "github.com/netdata/netdata/go/go.d.plugin/agent/module" - "github.com/netdata/netdata/go/go.d.plugin/pkg/prometheus" + "github.com/netdata/netdata/go/plugins/plugin/go.d/agent/module" + "github.com/netdata/netdata/go/plugins/plugin/go.d/pkg/prometheus" ) const ( diff --git a/src/go/collectors/go.d.plugin/modules/traefik/config_schema.json b/src/go/plugin/go.d/modules/traefik/config_schema.json index f3ddc375b..f027f20a0 100644 --- a/src/go/collectors/go.d.plugin/modules/traefik/config_schema.json +++ b/src/go/plugin/go.d/modules/traefik/config_schema.json @@ -167,6 +167,12 @@ "timeout": { "ui:help": "Accepts decimals for precise control (e.g., type 1.5 for 1.5 seconds)." }, + "username": { + "ui:widget": "password" + }, + "proxy_username": { + "ui:widget": "password" + }, "password": { "ui:widget": "password" }, diff --git a/src/go/collectors/go.d.plugin/modules/traefik/init.go b/src/go/plugin/go.d/modules/traefik/init.go index 99ab731ef..02c1dde0d 100644 --- a/src/go/collectors/go.d.plugin/modules/traefik/init.go +++ b/src/go/plugin/go.d/modules/traefik/init.go @@ -5,9 +5,9 @@ package traefik import ( "errors" - "github.com/netdata/netdata/go/go.d.plugin/pkg/prometheus" - "github.com/netdata/netdata/go/go.d.plugin/pkg/prometheus/selector" - "github.com/netdata/netdata/go/go.d.plugin/pkg/web" + "github.com/netdata/netdata/go/plugins/plugin/go.d/pkg/prometheus" + "github.com/netdata/netdata/go/plugins/plugin/go.d/pkg/prometheus/selector" + "github.com/netdata/netdata/go/plugins/plugin/go.d/pkg/web" ) func (t *Traefik) validateConfig() error { diff --git a/src/go/collectors/go.d.plugin/modules/traefik/integrations/traefik.md b/src/go/plugin/go.d/modules/traefik/integrations/traefik.md index 411dd9d0b..f5dc10eb9 100644 --- a/src/go/collectors/go.d.plugin/modules/traefik/integrations/traefik.md +++ b/src/go/plugin/go.d/modules/traefik/integrations/traefik.md @@ -1,6 +1,6 @@ <!--startmeta -custom_edit_url: "https://github.com/netdata/netdata/edit/master/src/go/collectors/go.d.plugin/modules/traefik/README.md" -meta_yaml: "https://github.com/netdata/netdata/edit/master/src/go/collectors/go.d.plugin/modules/traefik/metadata.yaml" +custom_edit_url: "https://github.com/netdata/netdata/edit/master/src/go/plugin/go.d/modules/traefik/README.md" +meta_yaml: "https://github.com/netdata/netdata/edit/master/src/go/plugin/go.d/modules/traefik/metadata.yaml" sidebar_label: "Traefik" learn_status: "Published" learn_rel_path: "Collecting Metrics/Web Servers and Web Proxies" @@ -186,6 +186,8 @@ jobs: ### Debug Mode +**Important**: Debug mode is not supported for data collection jobs created via the UI using the Dyncfg feature. + To troubleshoot issues with the `traefik` collector, run the `go.d.plugin` with the debug option enabled. The output should give you clues as to why the collector isn't working. @@ -208,4 +210,37 @@ should give you clues as to why the collector isn't working. ./go.d.plugin -d -m traefik ``` +### Getting Logs + +If you're encountering problems with the `traefik` collector, follow these steps to retrieve logs and identify potential issues: + +- **Run the command** specific to your system (systemd, non-systemd, or Docker container). +- **Examine the output** for any warnings or error messages that might indicate issues. These messages should provide clues about the root cause of the problem. + +#### System with systemd + +Use the following command to view logs generated since the last Netdata service restart: + +```bash +journalctl _SYSTEMD_INVOCATION_ID="$(systemctl show --value --property=InvocationID netdata)" --namespace=netdata --grep traefik +``` + +#### System without systemd + +Locate the collector log file, typically at `/var/log/netdata/collector.log`, and use `grep` to filter for collector's name: + +```bash +grep traefik /var/log/netdata/collector.log +``` + +**Note**: This method shows logs from all restarts. Focus on the **latest entries** for troubleshooting current issues. + +#### Docker Container + +If your Netdata runs in a Docker container named "netdata" (replace if different), use this command: + +```bash +docker logs netdata 2>&1 | grep traefik +``` + diff --git a/src/go/collectors/go.d.plugin/modules/traefik/metadata.yaml b/src/go/plugin/go.d/modules/traefik/metadata.yaml index 7fe182ea3..7fe182ea3 100644 --- a/src/go/collectors/go.d.plugin/modules/traefik/metadata.yaml +++ b/src/go/plugin/go.d/modules/traefik/metadata.yaml diff --git a/src/go/plugin/go.d/modules/traefik/testdata/config.json b/src/go/plugin/go.d/modules/traefik/testdata/config.json new file mode 100644 index 000000000..984c3ed6e --- /dev/null +++ b/src/go/plugin/go.d/modules/traefik/testdata/config.json @@ -0,0 +1,20 @@ +{ + "update_every": 123, + "url": "ok", + "body": "ok", + "method": "ok", + "headers": { + "ok": "ok" + }, + "username": "ok", + "password": "ok", + "proxy_url": "ok", + "proxy_username": "ok", + "proxy_password": "ok", + "timeout": 123.123, + "not_follow_redirects": true, + "tls_ca": "ok", + "tls_cert": "ok", + "tls_key": "ok", + "tls_skip_verify": true +} diff --git a/src/go/plugin/go.d/modules/traefik/testdata/config.yaml b/src/go/plugin/go.d/modules/traefik/testdata/config.yaml new file mode 100644 index 000000000..8558b61cc --- /dev/null +++ b/src/go/plugin/go.d/modules/traefik/testdata/config.yaml @@ -0,0 +1,17 @@ +update_every: 123 +url: "ok" +body: "ok" +method: "ok" +headers: + ok: "ok" +username: "ok" +password: "ok" +proxy_url: "ok" +proxy_username: "ok" +proxy_password: "ok" +timeout: 123.123 +not_follow_redirects: yes +tls_ca: "ok" +tls_cert: "ok" +tls_key: "ok" +tls_skip_verify: yes diff --git a/src/go/collectors/go.d.plugin/modules/traefik/testdata/v2.2.1/metrics.txt b/src/go/plugin/go.d/modules/traefik/testdata/v2.2.1/metrics.txt index 947a365c0..947a365c0 100644 --- a/src/go/collectors/go.d.plugin/modules/traefik/testdata/v2.2.1/metrics.txt +++ b/src/go/plugin/go.d/modules/traefik/testdata/v2.2.1/metrics.txt diff --git a/src/go/collectors/go.d.plugin/modules/traefik/traefik.go b/src/go/plugin/go.d/modules/traefik/traefik.go index 6e20863ce..e38ff9699 100644 --- a/src/go/collectors/go.d.plugin/modules/traefik/traefik.go +++ b/src/go/plugin/go.d/modules/traefik/traefik.go @@ -7,9 +7,9 @@ import ( "errors" "time" - "github.com/netdata/netdata/go/go.d.plugin/agent/module" - "github.com/netdata/netdata/go/go.d.plugin/pkg/prometheus" - "github.com/netdata/netdata/go/go.d.plugin/pkg/web" + "github.com/netdata/netdata/go/plugins/plugin/go.d/agent/module" + "github.com/netdata/netdata/go/plugins/plugin/go.d/pkg/prometheus" + "github.com/netdata/netdata/go/plugins/plugin/go.d/pkg/web" ) //go:embed "config_schema.json" diff --git a/src/go/collectors/go.d.plugin/modules/traefik/traefik_test.go b/src/go/plugin/go.d/modules/traefik/traefik_test.go index b6b77cfb8..f3ef024b8 100644 --- a/src/go/collectors/go.d.plugin/modules/traefik/traefik_test.go +++ b/src/go/plugin/go.d/modules/traefik/traefik_test.go @@ -8,9 +8,9 @@ import ( "os" "testing" - "github.com/netdata/netdata/go/go.d.plugin/agent/module" - "github.com/netdata/netdata/go/go.d.plugin/pkg/tlscfg" - "github.com/netdata/netdata/go/go.d.plugin/pkg/web" + "github.com/netdata/netdata/go/plugins/plugin/go.d/agent/module" + "github.com/netdata/netdata/go/plugins/plugin/go.d/pkg/tlscfg" + "github.com/netdata/netdata/go/plugins/plugin/go.d/pkg/web" "github.com/stretchr/testify/assert" "github.com/stretchr/testify/require" diff --git a/src/go/collectors/go.d.plugin/modules/unbound/README.md b/src/go/plugin/go.d/modules/unbound/README.md index 5b0f42b04..5b0f42b04 120000 --- a/src/go/collectors/go.d.plugin/modules/unbound/README.md +++ b/src/go/plugin/go.d/modules/unbound/README.md diff --git a/src/go/collectors/go.d.plugin/modules/unbound/charts.go b/src/go/plugin/go.d/modules/unbound/charts.go index 0f0607664..f0ac8b082 100644 --- a/src/go/collectors/go.d.plugin/modules/unbound/charts.go +++ b/src/go/plugin/go.d/modules/unbound/charts.go @@ -6,7 +6,7 @@ import ( "fmt" "strings" - "github.com/netdata/netdata/go/go.d.plugin/agent/module" + "github.com/netdata/netdata/go/plugins/plugin/go.d/agent/module" "golang.org/x/text/cases" "golang.org/x/text/language" diff --git a/src/go/collectors/go.d.plugin/modules/unbound/collect.go b/src/go/plugin/go.d/modules/unbound/collect.go index 125f206ae..125f206ae 100644 --- a/src/go/collectors/go.d.plugin/modules/unbound/collect.go +++ b/src/go/plugin/go.d/modules/unbound/collect.go diff --git a/src/go/collectors/go.d.plugin/modules/unbound/config/config.go b/src/go/plugin/go.d/modules/unbound/config/config.go index 69dc5c219..69dc5c219 100644 --- a/src/go/collectors/go.d.plugin/modules/unbound/config/config.go +++ b/src/go/plugin/go.d/modules/unbound/config/config.go diff --git a/src/go/collectors/go.d.plugin/modules/unbound/config/config_test.go b/src/go/plugin/go.d/modules/unbound/config/config_test.go index 0375c1368..0375c1368 100644 --- a/src/go/collectors/go.d.plugin/modules/unbound/config/config_test.go +++ b/src/go/plugin/go.d/modules/unbound/config/config_test.go diff --git a/src/go/collectors/go.d.plugin/modules/unbound/config/parse.go b/src/go/plugin/go.d/modules/unbound/config/parse.go index 99a632d50..99a632d50 100644 --- a/src/go/collectors/go.d.plugin/modules/unbound/config/parse.go +++ b/src/go/plugin/go.d/modules/unbound/config/parse.go diff --git a/src/go/collectors/go.d.plugin/modules/unbound/config/parse_test.go b/src/go/plugin/go.d/modules/unbound/config/parse_test.go index 72542a861..72542a861 100644 --- a/src/go/collectors/go.d.plugin/modules/unbound/config/parse_test.go +++ b/src/go/plugin/go.d/modules/unbound/config/parse_test.go diff --git a/src/go/collectors/go.d.plugin/modules/unbound/config/testdata/infinite_rec.conf b/src/go/plugin/go.d/modules/unbound/config/testdata/infinite_rec.conf index 904f75b30..904f75b30 100644 --- a/src/go/collectors/go.d.plugin/modules/unbound/config/testdata/infinite_rec.conf +++ b/src/go/plugin/go.d/modules/unbound/config/testdata/infinite_rec.conf diff --git a/src/go/collectors/go.d.plugin/modules/unbound/config/testdata/non_existent_glob_include.conf b/src/go/plugin/go.d/modules/unbound/config/testdata/non_existent_glob_include.conf index 21620f7d5..21620f7d5 100644 --- a/src/go/collectors/go.d.plugin/modules/unbound/config/testdata/non_existent_glob_include.conf +++ b/src/go/plugin/go.d/modules/unbound/config/testdata/non_existent_glob_include.conf diff --git a/src/go/collectors/go.d.plugin/modules/unbound/config/testdata/non_existent_include.conf b/src/go/plugin/go.d/modules/unbound/config/testdata/non_existent_include.conf index e493e35bb..e493e35bb 100644 --- a/src/go/collectors/go.d.plugin/modules/unbound/config/testdata/non_existent_include.conf +++ b/src/go/plugin/go.d/modules/unbound/config/testdata/non_existent_include.conf diff --git a/src/go/collectors/go.d.plugin/modules/unbound/config/testdata/valid_glob.conf b/src/go/plugin/go.d/modules/unbound/config/testdata/valid_glob.conf index f020c580a..f020c580a 100644 --- a/src/go/collectors/go.d.plugin/modules/unbound/config/testdata/valid_glob.conf +++ b/src/go/plugin/go.d/modules/unbound/config/testdata/valid_glob.conf diff --git a/src/go/collectors/go.d.plugin/modules/unbound/config/testdata/valid_glob2.conf b/src/go/plugin/go.d/modules/unbound/config/testdata/valid_glob2.conf index 85bd80e0d..85bd80e0d 100644 --- a/src/go/collectors/go.d.plugin/modules/unbound/config/testdata/valid_glob2.conf +++ b/src/go/plugin/go.d/modules/unbound/config/testdata/valid_glob2.conf diff --git a/src/go/collectors/go.d.plugin/modules/unbound/config/testdata/valid_glob3.conf b/src/go/plugin/go.d/modules/unbound/config/testdata/valid_glob3.conf index f20eacf1a..f20eacf1a 100644 --- a/src/go/collectors/go.d.plugin/modules/unbound/config/testdata/valid_glob3.conf +++ b/src/go/plugin/go.d/modules/unbound/config/testdata/valid_glob3.conf diff --git a/src/go/collectors/go.d.plugin/modules/unbound/config/testdata/valid_include.conf b/src/go/plugin/go.d/modules/unbound/config/testdata/valid_include.conf index 1974f6178..1974f6178 100644 --- a/src/go/collectors/go.d.plugin/modules/unbound/config/testdata/valid_include.conf +++ b/src/go/plugin/go.d/modules/unbound/config/testdata/valid_include.conf diff --git a/src/go/collectors/go.d.plugin/modules/unbound/config/testdata/valid_include2.conf b/src/go/plugin/go.d/modules/unbound/config/testdata/valid_include2.conf index c956d44d5..c956d44d5 100644 --- a/src/go/collectors/go.d.plugin/modules/unbound/config/testdata/valid_include2.conf +++ b/src/go/plugin/go.d/modules/unbound/config/testdata/valid_include2.conf diff --git a/src/go/collectors/go.d.plugin/modules/unbound/config/testdata/valid_include3.conf b/src/go/plugin/go.d/modules/unbound/config/testdata/valid_include3.conf index f20eacf1a..f20eacf1a 100644 --- a/src/go/collectors/go.d.plugin/modules/unbound/config/testdata/valid_include3.conf +++ b/src/go/plugin/go.d/modules/unbound/config/testdata/valid_include3.conf diff --git a/src/go/collectors/go.d.plugin/modules/unbound/config/testdata/valid_include_toplevel.conf b/src/go/plugin/go.d/modules/unbound/config/testdata/valid_include_toplevel.conf index 9e5675e10..9e5675e10 100644 --- a/src/go/collectors/go.d.plugin/modules/unbound/config/testdata/valid_include_toplevel.conf +++ b/src/go/plugin/go.d/modules/unbound/config/testdata/valid_include_toplevel.conf diff --git a/src/go/collectors/go.d.plugin/modules/unbound/config/testdata/valid_include_toplevel2.conf b/src/go/plugin/go.d/modules/unbound/config/testdata/valid_include_toplevel2.conf index f3f69470d..f3f69470d 100644 --- a/src/go/collectors/go.d.plugin/modules/unbound/config/testdata/valid_include_toplevel2.conf +++ b/src/go/plugin/go.d/modules/unbound/config/testdata/valid_include_toplevel2.conf diff --git a/src/go/collectors/go.d.plugin/modules/unbound/config/testdata/valid_include_toplevel3.conf b/src/go/plugin/go.d/modules/unbound/config/testdata/valid_include_toplevel3.conf index d30778c01..d30778c01 100644 --- a/src/go/collectors/go.d.plugin/modules/unbound/config/testdata/valid_include_toplevel3.conf +++ b/src/go/plugin/go.d/modules/unbound/config/testdata/valid_include_toplevel3.conf diff --git a/src/go/collectors/go.d.plugin/modules/unbound/config_schema.json b/src/go/plugin/go.d/modules/unbound/config_schema.json index 500b60169..500b60169 100644 --- a/src/go/collectors/go.d.plugin/modules/unbound/config_schema.json +++ b/src/go/plugin/go.d/modules/unbound/config_schema.json diff --git a/src/go/collectors/go.d.plugin/modules/unbound/init.go b/src/go/plugin/go.d/modules/unbound/init.go index 066315400..88e5e5ab0 100644 --- a/src/go/collectors/go.d.plugin/modules/unbound/init.go +++ b/src/go/plugin/go.d/modules/unbound/init.go @@ -7,9 +7,9 @@ import ( "errors" "net" - "github.com/netdata/netdata/go/go.d.plugin/modules/unbound/config" - "github.com/netdata/netdata/go/go.d.plugin/pkg/socket" - "github.com/netdata/netdata/go/go.d.plugin/pkg/tlscfg" + "github.com/netdata/netdata/go/plugins/plugin/go.d/modules/unbound/config" + "github.com/netdata/netdata/go/plugins/plugin/go.d/pkg/socket" + "github.com/netdata/netdata/go/plugins/plugin/go.d/pkg/tlscfg" ) func (u *Unbound) initConfig() (enabled bool) { diff --git a/src/go/collectors/go.d.plugin/modules/unbound/integrations/unbound.md b/src/go/plugin/go.d/modules/unbound/integrations/unbound.md index f934e6660..df6412270 100644 --- a/src/go/collectors/go.d.plugin/modules/unbound/integrations/unbound.md +++ b/src/go/plugin/go.d/modules/unbound/integrations/unbound.md @@ -1,6 +1,6 @@ <!--startmeta -custom_edit_url: "https://github.com/netdata/netdata/edit/master/src/go/collectors/go.d.plugin/modules/unbound/README.md" -meta_yaml: "https://github.com/netdata/netdata/edit/master/src/go/collectors/go.d.plugin/modules/unbound/metadata.yaml" +custom_edit_url: "https://github.com/netdata/netdata/edit/master/src/go/plugin/go.d/modules/unbound/README.md" +meta_yaml: "https://github.com/netdata/netdata/edit/master/src/go/plugin/go.d/modules/unbound/metadata.yaml" sidebar_label: "Unbound" learn_status: "Published" learn_rel_path: "Collecting Metrics/DNS and DHCP Servers" @@ -245,6 +245,8 @@ jobs: ### Debug Mode +**Important**: Debug mode is not supported for data collection jobs created via the UI using the Dyncfg feature. + To troubleshoot issues with the `unbound` collector, run the `go.d.plugin` with the debug option enabled. The output should give you clues as to why the collector isn't working. @@ -267,4 +269,37 @@ should give you clues as to why the collector isn't working. ./go.d.plugin -d -m unbound ``` +### Getting Logs + +If you're encountering problems with the `unbound` collector, follow these steps to retrieve logs and identify potential issues: + +- **Run the command** specific to your system (systemd, non-systemd, or Docker container). +- **Examine the output** for any warnings or error messages that might indicate issues. These messages should provide clues about the root cause of the problem. + +#### System with systemd + +Use the following command to view logs generated since the last Netdata service restart: + +```bash +journalctl _SYSTEMD_INVOCATION_ID="$(systemctl show --value --property=InvocationID netdata)" --namespace=netdata --grep unbound +``` + +#### System without systemd + +Locate the collector log file, typically at `/var/log/netdata/collector.log`, and use `grep` to filter for collector's name: + +```bash +grep unbound /var/log/netdata/collector.log +``` + +**Note**: This method shows logs from all restarts. Focus on the **latest entries** for troubleshooting current issues. + +#### Docker Container + +If your Netdata runs in a Docker container named "netdata" (replace if different), use this command: + +```bash +docker logs netdata 2>&1 | grep unbound +``` + diff --git a/src/go/collectors/go.d.plugin/modules/unbound/metadata.yaml b/src/go/plugin/go.d/modules/unbound/metadata.yaml index ec6e6538d..ec6e6538d 100644 --- a/src/go/collectors/go.d.plugin/modules/unbound/metadata.yaml +++ b/src/go/plugin/go.d/modules/unbound/metadata.yaml diff --git a/src/go/collectors/go.d.plugin/modules/unbound/testdata/config.json b/src/go/plugin/go.d/modules/unbound/testdata/config.json index 9874de180..9874de180 100644 --- a/src/go/collectors/go.d.plugin/modules/unbound/testdata/config.json +++ b/src/go/plugin/go.d/modules/unbound/testdata/config.json diff --git a/src/go/collectors/go.d.plugin/modules/unbound/testdata/config.yaml b/src/go/plugin/go.d/modules/unbound/testdata/config.yaml index 68326cabc..68326cabc 100644 --- a/src/go/collectors/go.d.plugin/modules/unbound/testdata/config.yaml +++ b/src/go/plugin/go.d/modules/unbound/testdata/config.yaml diff --git a/src/go/collectors/go.d.plugin/modules/unbound/testdata/stats/common.txt b/src/go/plugin/go.d/modules/unbound/testdata/stats/common.txt index 7a1f91a31..7a1f91a31 100644 --- a/src/go/collectors/go.d.plugin/modules/unbound/testdata/stats/common.txt +++ b/src/go/plugin/go.d/modules/unbound/testdata/stats/common.txt diff --git a/src/go/collectors/go.d.plugin/modules/unbound/testdata/stats/extended.txt b/src/go/plugin/go.d/modules/unbound/testdata/stats/extended.txt index 578794fad..578794fad 100644 --- a/src/go/collectors/go.d.plugin/modules/unbound/testdata/stats/extended.txt +++ b/src/go/plugin/go.d/modules/unbound/testdata/stats/extended.txt diff --git a/src/go/collectors/go.d.plugin/modules/unbound/testdata/stats/lifecycle/cumulative/extended1.txt b/src/go/plugin/go.d/modules/unbound/testdata/stats/lifecycle/cumulative/extended1.txt index 53bd7f955..53bd7f955 100644 --- a/src/go/collectors/go.d.plugin/modules/unbound/testdata/stats/lifecycle/cumulative/extended1.txt +++ b/src/go/plugin/go.d/modules/unbound/testdata/stats/lifecycle/cumulative/extended1.txt diff --git a/src/go/collectors/go.d.plugin/modules/unbound/testdata/stats/lifecycle/cumulative/extended2.txt b/src/go/plugin/go.d/modules/unbound/testdata/stats/lifecycle/cumulative/extended2.txt index 939ba75de..939ba75de 100644 --- a/src/go/collectors/go.d.plugin/modules/unbound/testdata/stats/lifecycle/cumulative/extended2.txt +++ b/src/go/plugin/go.d/modules/unbound/testdata/stats/lifecycle/cumulative/extended2.txt diff --git a/src/go/collectors/go.d.plugin/modules/unbound/testdata/stats/lifecycle/cumulative/extended3.txt b/src/go/plugin/go.d/modules/unbound/testdata/stats/lifecycle/cumulative/extended3.txt index e9448f7d7..e9448f7d7 100644 --- a/src/go/collectors/go.d.plugin/modules/unbound/testdata/stats/lifecycle/cumulative/extended3.txt +++ b/src/go/plugin/go.d/modules/unbound/testdata/stats/lifecycle/cumulative/extended3.txt diff --git a/src/go/collectors/go.d.plugin/modules/unbound/testdata/stats/lifecycle/reset/extended1.txt b/src/go/plugin/go.d/modules/unbound/testdata/stats/lifecycle/reset/extended1.txt index 8be40ecb2..8be40ecb2 100644 --- a/src/go/collectors/go.d.plugin/modules/unbound/testdata/stats/lifecycle/reset/extended1.txt +++ b/src/go/plugin/go.d/modules/unbound/testdata/stats/lifecycle/reset/extended1.txt diff --git a/src/go/collectors/go.d.plugin/modules/unbound/testdata/stats/lifecycle/reset/extended2.txt b/src/go/plugin/go.d/modules/unbound/testdata/stats/lifecycle/reset/extended2.txt index 08ff128b3..08ff128b3 100644 --- a/src/go/collectors/go.d.plugin/modules/unbound/testdata/stats/lifecycle/reset/extended2.txt +++ b/src/go/plugin/go.d/modules/unbound/testdata/stats/lifecycle/reset/extended2.txt diff --git a/src/go/collectors/go.d.plugin/modules/unbound/testdata/stats/lifecycle/reset/extended3.txt b/src/go/plugin/go.d/modules/unbound/testdata/stats/lifecycle/reset/extended3.txt index 45324bef9..45324bef9 100644 --- a/src/go/collectors/go.d.plugin/modules/unbound/testdata/stats/lifecycle/reset/extended3.txt +++ b/src/go/plugin/go.d/modules/unbound/testdata/stats/lifecycle/reset/extended3.txt diff --git a/src/go/collectors/go.d.plugin/modules/unbound/testdata/unbound.conf b/src/go/plugin/go.d/modules/unbound/testdata/unbound.conf index a061a3476..a061a3476 100644 --- a/src/go/collectors/go.d.plugin/modules/unbound/testdata/unbound.conf +++ b/src/go/plugin/go.d/modules/unbound/testdata/unbound.conf diff --git a/src/go/collectors/go.d.plugin/modules/unbound/testdata/unbound_disabled.conf b/src/go/plugin/go.d/modules/unbound/testdata/unbound_disabled.conf index 1cef549f8..1cef549f8 100644 --- a/src/go/collectors/go.d.plugin/modules/unbound/testdata/unbound_disabled.conf +++ b/src/go/plugin/go.d/modules/unbound/testdata/unbound_disabled.conf diff --git a/src/go/collectors/go.d.plugin/modules/unbound/testdata/unbound_empty.conf b/src/go/plugin/go.d/modules/unbound/testdata/unbound_empty.conf index a2d158376..a2d158376 100644 --- a/src/go/collectors/go.d.plugin/modules/unbound/testdata/unbound_empty.conf +++ b/src/go/plugin/go.d/modules/unbound/testdata/unbound_empty.conf diff --git a/src/go/collectors/go.d.plugin/modules/unbound/unbound.go b/src/go/plugin/go.d/modules/unbound/unbound.go index 7536aed3c..fa071bb0f 100644 --- a/src/go/collectors/go.d.plugin/modules/unbound/unbound.go +++ b/src/go/plugin/go.d/modules/unbound/unbound.go @@ -7,10 +7,10 @@ import ( "errors" "time" - "github.com/netdata/netdata/go/go.d.plugin/agent/module" - "github.com/netdata/netdata/go/go.d.plugin/pkg/socket" - "github.com/netdata/netdata/go/go.d.plugin/pkg/tlscfg" - "github.com/netdata/netdata/go/go.d.plugin/pkg/web" + "github.com/netdata/netdata/go/plugins/plugin/go.d/agent/module" + "github.com/netdata/netdata/go/plugins/plugin/go.d/pkg/socket" + "github.com/netdata/netdata/go/plugins/plugin/go.d/pkg/tlscfg" + "github.com/netdata/netdata/go/plugins/plugin/go.d/pkg/web" ) //go:embed "config_schema.json" diff --git a/src/go/collectors/go.d.plugin/modules/unbound/unbound_test.go b/src/go/plugin/go.d/modules/unbound/unbound_test.go index 2d24b67b1..f9ed73afe 100644 --- a/src/go/collectors/go.d.plugin/modules/unbound/unbound_test.go +++ b/src/go/plugin/go.d/modules/unbound/unbound_test.go @@ -11,9 +11,9 @@ import ( "strings" "testing" - "github.com/netdata/netdata/go/go.d.plugin/agent/module" - "github.com/netdata/netdata/go/go.d.plugin/pkg/socket" - "github.com/netdata/netdata/go/go.d.plugin/pkg/tlscfg" + "github.com/netdata/netdata/go/plugins/plugin/go.d/agent/module" + "github.com/netdata/netdata/go/plugins/plugin/go.d/pkg/socket" + "github.com/netdata/netdata/go/plugins/plugin/go.d/pkg/tlscfg" "github.com/stretchr/testify/assert" "github.com/stretchr/testify/require" diff --git a/src/go/collectors/go.d.plugin/modules/upsd/README.md b/src/go/plugin/go.d/modules/upsd/README.md index 8dcef84dd..8dcef84dd 120000 --- a/src/go/collectors/go.d.plugin/modules/upsd/README.md +++ b/src/go/plugin/go.d/modules/upsd/README.md diff --git a/src/go/collectors/go.d.plugin/modules/upsd/charts.go b/src/go/plugin/go.d/modules/upsd/charts.go index 72bd69f4f..909c111d1 100644 --- a/src/go/collectors/go.d.plugin/modules/upsd/charts.go +++ b/src/go/plugin/go.d/modules/upsd/charts.go @@ -6,7 +6,7 @@ import ( "fmt" "strings" - "github.com/netdata/netdata/go/go.d.plugin/agent/module" + "github.com/netdata/netdata/go/plugins/plugin/go.d/agent/module" ) const ( diff --git a/src/go/collectors/go.d.plugin/modules/upsd/client.go b/src/go/plugin/go.d/modules/upsd/client.go index a1b8f288e..a708bdcaf 100644 --- a/src/go/collectors/go.d.plugin/modules/upsd/client.go +++ b/src/go/plugin/go.d/modules/upsd/client.go @@ -8,7 +8,7 @@ import ( "fmt" "strings" - "github.com/netdata/netdata/go/go.d.plugin/pkg/socket" + "github.com/netdata/netdata/go/plugins/plugin/go.d/pkg/socket" ) const ( diff --git a/src/go/collectors/go.d.plugin/modules/upsd/collect.go b/src/go/plugin/go.d/modules/upsd/collect.go index 39e3d1b55..39e3d1b55 100644 --- a/src/go/collectors/go.d.plugin/modules/upsd/collect.go +++ b/src/go/plugin/go.d/modules/upsd/collect.go diff --git a/src/go/collectors/go.d.plugin/modules/upsd/config_schema.json b/src/go/plugin/go.d/modules/upsd/config_schema.json index 564c0179c..564c0179c 100644 --- a/src/go/collectors/go.d.plugin/modules/upsd/config_schema.json +++ b/src/go/plugin/go.d/modules/upsd/config_schema.json diff --git a/src/go/collectors/go.d.plugin/modules/upsd/integrations/ups_nut.md b/src/go/plugin/go.d/modules/upsd/integrations/ups_nut.md index c02eafc70..002617bdf 100644 --- a/src/go/collectors/go.d.plugin/modules/upsd/integrations/ups_nut.md +++ b/src/go/plugin/go.d/modules/upsd/integrations/ups_nut.md @@ -1,6 +1,6 @@ <!--startmeta -custom_edit_url: "https://github.com/netdata/netdata/edit/master/src/go/collectors/go.d.plugin/modules/upsd/README.md" -meta_yaml: "https://github.com/netdata/netdata/edit/master/src/go/collectors/go.d.plugin/modules/upsd/metadata.yaml" +custom_edit_url: "https://github.com/netdata/netdata/edit/master/src/go/plugin/go.d/modules/upsd/README.md" +meta_yaml: "https://github.com/netdata/netdata/edit/master/src/go/plugin/go.d/modules/upsd/metadata.yaml" sidebar_label: "UPS (NUT)" learn_status: "Published" learn_rel_path: "Collecting Metrics/UPS" @@ -186,6 +186,8 @@ jobs: ### Debug Mode +**Important**: Debug mode is not supported for data collection jobs created via the UI using the Dyncfg feature. + To troubleshoot issues with the `upsd` collector, run the `go.d.plugin` with the debug option enabled. The output should give you clues as to why the collector isn't working. @@ -208,4 +210,37 @@ should give you clues as to why the collector isn't working. ./go.d.plugin -d -m upsd ``` +### Getting Logs + +If you're encountering problems with the `upsd` collector, follow these steps to retrieve logs and identify potential issues: + +- **Run the command** specific to your system (systemd, non-systemd, or Docker container). +- **Examine the output** for any warnings or error messages that might indicate issues. These messages should provide clues about the root cause of the problem. + +#### System with systemd + +Use the following command to view logs generated since the last Netdata service restart: + +```bash +journalctl _SYSTEMD_INVOCATION_ID="$(systemctl show --value --property=InvocationID netdata)" --namespace=netdata --grep upsd +``` + +#### System without systemd + +Locate the collector log file, typically at `/var/log/netdata/collector.log`, and use `grep` to filter for collector's name: + +```bash +grep upsd /var/log/netdata/collector.log +``` + +**Note**: This method shows logs from all restarts. Focus on the **latest entries** for troubleshooting current issues. + +#### Docker Container + +If your Netdata runs in a Docker container named "netdata" (replace if different), use this command: + +```bash +docker logs netdata 2>&1 | grep upsd +``` + diff --git a/src/go/collectors/go.d.plugin/modules/upsd/metadata.yaml b/src/go/plugin/go.d/modules/upsd/metadata.yaml index 070b33852..070b33852 100644 --- a/src/go/collectors/go.d.plugin/modules/upsd/metadata.yaml +++ b/src/go/plugin/go.d/modules/upsd/metadata.yaml diff --git a/src/go/collectors/go.d.plugin/modules/upsd/testdata/config.json b/src/go/plugin/go.d/modules/upsd/testdata/config.json index ab7a8654c..ab7a8654c 100644 --- a/src/go/collectors/go.d.plugin/modules/upsd/testdata/config.json +++ b/src/go/plugin/go.d/modules/upsd/testdata/config.json diff --git a/src/go/collectors/go.d.plugin/modules/upsd/testdata/config.yaml b/src/go/plugin/go.d/modules/upsd/testdata/config.yaml index 276370415..276370415 100644 --- a/src/go/collectors/go.d.plugin/modules/upsd/testdata/config.yaml +++ b/src/go/plugin/go.d/modules/upsd/testdata/config.yaml diff --git a/src/go/collectors/go.d.plugin/modules/upsd/upsd.go b/src/go/plugin/go.d/modules/upsd/upsd.go index be734bc5a..752697faa 100644 --- a/src/go/collectors/go.d.plugin/modules/upsd/upsd.go +++ b/src/go/plugin/go.d/modules/upsd/upsd.go @@ -7,8 +7,8 @@ import ( "errors" "time" - "github.com/netdata/netdata/go/go.d.plugin/agent/module" - "github.com/netdata/netdata/go/go.d.plugin/pkg/web" + "github.com/netdata/netdata/go/plugins/plugin/go.d/agent/module" + "github.com/netdata/netdata/go/plugins/plugin/go.d/pkg/web" ) //go:embed "config_schema.json" diff --git a/src/go/collectors/go.d.plugin/modules/upsd/upsd_test.go b/src/go/plugin/go.d/modules/upsd/upsd_test.go index 1dffdd0f5..e654aa90e 100644 --- a/src/go/collectors/go.d.plugin/modules/upsd/upsd_test.go +++ b/src/go/plugin/go.d/modules/upsd/upsd_test.go @@ -8,7 +8,7 @@ import ( "os" "testing" - "github.com/netdata/netdata/go/go.d.plugin/agent/module" + "github.com/netdata/netdata/go/plugins/plugin/go.d/agent/module" "github.com/stretchr/testify/assert" "github.com/stretchr/testify/require" diff --git a/src/go/collectors/go.d.plugin/modules/upsd/variables.go b/src/go/plugin/go.d/modules/upsd/variables.go index 9792e62b9..9792e62b9 100644 --- a/src/go/collectors/go.d.plugin/modules/upsd/variables.go +++ b/src/go/plugin/go.d/modules/upsd/variables.go diff --git a/src/collectors/python.d.plugin/uwsgi/README.md b/src/go/plugin/go.d/modules/uwsgi/README.md index 44b855949..44b855949 120000 --- a/src/collectors/python.d.plugin/uwsgi/README.md +++ b/src/go/plugin/go.d/modules/uwsgi/README.md diff --git a/src/go/plugin/go.d/modules/uwsgi/charts.go b/src/go/plugin/go.d/modules/uwsgi/charts.go new file mode 100644 index 000000000..d79b3938b --- /dev/null +++ b/src/go/plugin/go.d/modules/uwsgi/charts.go @@ -0,0 +1,275 @@ +// SPDX-License-Identifier: GPL-3.0-or-later + +package uwsgi + +import ( + "fmt" + "strconv" + "strings" + + "github.com/netdata/netdata/go/plugins/plugin/go.d/agent/module" +) + +const ( + prioTransmittedData = module.Priority + iota + prioRequests + prioHarakiris + prioExceptions + prioRespawns + + prioWorkerTransmittedData + prioWorkerRequests + prioWorkerDeltaRequests + prioWorkerAvgRequestTime + prioWorkerHarakiris + prioWorkerExceptions + prioWorkerStatus + prioWorkerRequestHandlingStatus + prioWorkerRespawns + prioWorkerMemoryRss + prioWorkerMemoryVsz +) + +var charts = module.Charts{ + transmittedDataChart.Copy(), + requestsChart.Copy(), + harakirisChart.Copy(), + exceptionsChart.Copy(), + respawnsChart.Copy(), +} + +var ( + transmittedDataChart = module.Chart{ + ID: "transmitted_data", + Title: "UWSGI Transmitted Data", + Units: "bytes/s", + Fam: "workers", + Ctx: "uwsgi.transmitted_data", + Priority: prioTransmittedData, + Type: module.Area, + Dims: module.Dims{ + {ID: "workers_tx", Name: "tx", Algo: module.Incremental}, + }, + } + requestsChart = module.Chart{ + ID: "requests", + Title: "UWSGI Requests", + Units: "requests/s", + Fam: "workers", + Ctx: "uwsgi.requests", + Priority: prioRequests, + Dims: module.Dims{ + {ID: "workers_requests", Name: "requests", Algo: module.Incremental}, + }, + } + harakirisChart = module.Chart{ + ID: "harakiris", + Title: "UWSGI Dropped Requests", + Units: "harakiris/s", + Fam: "workers", + Ctx: "uwsgi.harakiris", + Priority: prioHarakiris, + Dims: module.Dims{ + {ID: "workers_harakiris", Name: "harakiris", Algo: module.Incremental}, + }, + } + exceptionsChart = module.Chart{ + ID: "exceptions", + Title: "UWSGI Raised Exceptions", + Units: "exceptions/s", + Fam: "workers", + Ctx: "uwsgi.exceptions", + Priority: prioExceptions, + Dims: module.Dims{ + {ID: "workers_exceptions", Name: "exceptions", Algo: module.Incremental}, + }, + } + respawnsChart = module.Chart{ + ID: "respawns", + Title: "UWSGI Respawns", + Units: "respawns/s", + Fam: "workers", + Ctx: "uwsgi.respawns", + Priority: prioRespawns, + Dims: module.Dims{ + {ID: "workers_respawns", Name: "respawns", Algo: module.Incremental}, + }, + } +) + +var workerChartsTmpl = module.Charts{ + workerTransmittedDataChartTmpl.Copy(), + workerRequestsChartTmpl.Copy(), + workerDeltaRequestsChartTmpl.Copy(), + workerAvgRequestTimeChartTmpl.Copy(), + workerHarakirisChartTmpl.Copy(), + workerExceptionsChartTmpl.Copy(), + workerStatusChartTmpl.Copy(), + workerRequestHandlingStatusChartTmpl.Copy(), + workerRespawnsChartTmpl.Copy(), + workerMemoryRssChartTmpl.Copy(), + workerMemoryVszChartTmpl.Copy(), +} + +var ( + workerTransmittedDataChartTmpl = module.Chart{ + ID: "worker_%s_transmitted_data", + Title: "UWSGI Worker Transmitted Data", + Units: "bytes/s", + Fam: "wrk transmitted data", + Ctx: "uwsgi.worker_transmitted_data", + Priority: prioWorkerTransmittedData, + Type: module.Area, + Dims: module.Dims{ + {ID: "worker_%s_tx", Name: "tx", Algo: module.Incremental}, + }, + } + workerRequestsChartTmpl = module.Chart{ + ID: "worker_%s_requests", + Title: "UWSGI Worker Requests", + Units: "requests/s", + Fam: "wrk requests", + Ctx: "uwsgi.worker_requests", + Priority: prioWorkerRequests, + Dims: module.Dims{ + {ID: "worker_%s_requests", Name: "requests", Algo: module.Incremental}, + }, + } + workerDeltaRequestsChartTmpl = module.Chart{ + ID: "worker_%s_delta_requests", + Title: "UWSGI Worker Delta Requests", + Units: "requests/s", + Fam: "wrk requests", + Ctx: "uwsgi.worker_delta_requests", + Priority: prioWorkerDeltaRequests, + Dims: module.Dims{ + {ID: "worker_%s_delta_requests", Name: "delta_requests", Algo: module.Incremental}, + }, + } + workerAvgRequestTimeChartTmpl = module.Chart{ + ID: "worker_%s_average_request_time", + Title: "UWSGI Worker Average Request Time", + Units: "milliseconds", + Fam: "wrk request time", + Ctx: "uwsgi.worker_average_request_time", + Priority: prioWorkerAvgRequestTime, + Dims: module.Dims{ + {ID: "worker_%s_average_request_time", Name: "avg"}, + }, + } + workerHarakirisChartTmpl = module.Chart{ + ID: "worker_%s_harakiris", + Title: "UWSGI Worker Dropped Requests", + Units: "harakiris/s", + Fam: "wrk harakiris", + Ctx: "uwsgi.worker_harakiris", + Priority: prioWorkerHarakiris, + Dims: module.Dims{ + {ID: "worker_%s_harakiris", Name: "harakiris", Algo: module.Incremental}, + }, + } + workerExceptionsChartTmpl = module.Chart{ + ID: "worker_%s_exceptions", + Title: "UWSGI Worker Raised Exceptions", + Units: "exceptions/s", + Fam: "wrk exceptions", + Ctx: "uwsgi.worker_exceptions", + Priority: prioWorkerExceptions, + Dims: module.Dims{ + {ID: "worker_%s_exceptions", Name: "exceptions", Algo: module.Incremental}, + }, + } + workerStatusChartTmpl = module.Chart{ + ID: "worker_%s_status", + Title: "UWSGI Worker Status", + Units: "status", + Fam: "wrk status", + Ctx: "uwsgi.status", + Priority: prioWorkerStatus, + Dims: module.Dims{ + {ID: "worker_%s_status_idle", Name: "idle"}, + {ID: "worker_%s_status_busy", Name: "busy"}, + {ID: "worker_%s_status_cheap", Name: "cheap"}, + {ID: "worker_%s_status_pause", Name: "pause"}, + {ID: "worker_%s_status_sig", Name: "sig"}, + }, + } + workerRequestHandlingStatusChartTmpl = module.Chart{ + ID: "worker_%s_request_handling_status", + Title: "UWSGI Worker Request Handling Status", + Units: "status", + Fam: "wrk status", + Ctx: "uwsgi.request_handling_status", + Priority: prioWorkerRequestHandlingStatus, + Dims: module.Dims{ + {ID: "worker_%s_request_handling_status_accepting", Name: "accepting"}, + {ID: "worker_%s_request_handling_status_not_accepting", Name: "not_accepting"}, + }, + } + workerRespawnsChartTmpl = module.Chart{ + ID: "worker_%s_respawns", + Title: "UWSGI Worker Respawns", + Units: "respawns/s", + Fam: "wrk respawns", + Ctx: "uwsgi.worker_respawns", + Priority: prioWorkerRespawns, + Dims: module.Dims{ + {ID: "worker_%s_respawns", Name: "respawns", Algo: module.Incremental}, + }, + } + workerMemoryRssChartTmpl = module.Chart{ + ID: "worker_%s_memory_rss", + Title: "UWSGI Worker Memory RSS (Resident Set Size)", + Units: "bytes", + Fam: "wrk memory", + Ctx: "uwsgi.worker_memory_rss", + Priority: prioWorkerMemoryRss, + Type: module.Area, + Dims: module.Dims{ + {ID: "worker_%s_memory_rss", Name: "rss"}, + }, + } + workerMemoryVszChartTmpl = module.Chart{ + ID: "worker_%s_memory_vsz", + Title: "UWSGI Worker Memory VSZ (Virtual Memory Size)", + Units: "bytes", + Fam: "wrk memory", + Ctx: "uwsgi.worker_memory_vsz", + Priority: prioWorkerMemoryVsz, + Type: module.Area, + Dims: module.Dims{ + {ID: "worker_%s_memory_vsz", Name: "vsz"}, + }, + } +) + +func (u *Uwsgi) addWorkerCharts(workerID int) { + charts := workerChartsTmpl.Copy() + + id := strconv.Itoa(workerID) + + for _, chart := range *charts { + chart.ID = fmt.Sprintf(chart.ID, id) + chart.Labels = []module.Label{ + {Key: "worker_id", Value: id}, + } + for _, dim := range chart.Dims { + dim.ID = fmt.Sprintf(dim.ID, id) + } + } + + if err := u.Charts().Add(*charts...); err != nil { + u.Warning(err) + } +} + +func (u *Uwsgi) removeWorkerCharts(workerID int) { + px := fmt.Sprintf("worker_%d_", workerID) + + for _, chart := range *u.Charts() { + if strings.HasPrefix(chart.ID, px) { + chart.MarkRemove() + chart.MarkNotCreated() + } + } +} diff --git a/src/go/plugin/go.d/modules/uwsgi/client.go b/src/go/plugin/go.d/modules/uwsgi/client.go new file mode 100644 index 000000000..403680743 --- /dev/null +++ b/src/go/plugin/go.d/modules/uwsgi/client.go @@ -0,0 +1,64 @@ +// SPDX-License-Identifier: GPL-3.0-or-later + +package uwsgi + +import ( + "bytes" + "fmt" + + "github.com/netdata/netdata/go/plugins/plugin/go.d/pkg/socket" +) + +type uwsgiConn interface { + connect() error + disconnect() + queryStats() ([]byte, error) +} + +func newUwsgiConn(conf Config) uwsgiConn { + return &uwsgiClient{conn: socket.New(socket.Config{ + Address: conf.Address, + ConnectTimeout: conf.Timeout.Duration(), + ReadTimeout: conf.Timeout.Duration(), + WriteTimeout: conf.Timeout.Duration(), + })} +} + +type uwsgiClient struct { + conn socket.Client +} + +func (c *uwsgiClient) connect() error { + return c.conn.Connect() +} + +func (c *uwsgiClient) disconnect() { + _ = c.conn.Disconnect() +} + +func (c *uwsgiClient) queryStats() ([]byte, error) { + var b bytes.Buffer + var n int64 + var err error + const readLineLimit = 1000 * 10 + + clientErr := c.conn.Command("", func(bs []byte) bool { + b.Write(bs) + b.WriteByte('\n') + + if n++; n >= readLineLimit { + err = fmt.Errorf("read line limit exceeded %d", readLineLimit) + return false + } + // The server will close the connection when it has finished sending data. + return true + }) + if clientErr != nil { + return nil, clientErr + } + if err != nil { + return nil, err + } + + return b.Bytes(), nil +} diff --git a/src/go/plugin/go.d/modules/uwsgi/collect.go b/src/go/plugin/go.d/modules/uwsgi/collect.go new file mode 100644 index 000000000..3f4405354 --- /dev/null +++ b/src/go/plugin/go.d/modules/uwsgi/collect.go @@ -0,0 +1,128 @@ +// SPDX-License-Identifier: GPL-3.0-or-later + +package uwsgi + +import ( + "encoding/json" + "fmt" +) + +type statsResponse struct { + Workers []workerStats `json:"workers"` +} + +type workerStats struct { + ID int `json:"id"` + Accepting int64 `json:"accepting"` + Requests int64 `json:"requests"` + DeltaRequests int64 `json:"delta_requests"` + Exceptions int64 `json:"exceptions"` + HarakiriCount int64 `json:"harakiri_count"` + Status string `json:"status"` + RSS int64 `json:"rss"` + VSZ int64 `json:"vsz"` + RespawnCount int64 `json:"respawn_count"` + TX int64 `json:"tx"` + AvgRT int64 `json:"avg_rt"` +} + +func (u *Uwsgi) collect() (map[string]int64, error) { + conn, err := u.establishConn() + if err != nil { + return nil, fmt.Errorf("failed to connect: %v", err) + } + + defer conn.disconnect() + + stats, err := conn.queryStats() + if err != nil { + return nil, fmt.Errorf("failed to query stats: %v", err) + } + + mx := make(map[string]int64) + + if err := u.collectStats(mx, stats); err != nil { + return nil, err + } + + return mx, nil +} + +func (u *Uwsgi) collectStats(mx map[string]int64, stats []byte) error { + var resp statsResponse + if err := json.Unmarshal(stats, &resp); err != nil { + return fmt.Errorf("failed to json decode stats response: %v", err) + } + + // stats server returns an empty array if there are no workers + if resp.Workers == nil { + return fmt.Errorf("unexpected stats response: no workers found") + } + + seen := make(map[int]bool) + + mx["workers_tx"] = 0 + mx["workers_requests"] = 0 + mx["workers_harakiris"] = 0 + mx["workers_exceptions"] = 0 + mx["workers_respawns"] = 0 + + for _, w := range resp.Workers { + mx["workers_tx"] += w.TX + mx["workers_requests"] += w.Requests + mx["workers_harakiris"] += w.HarakiriCount + mx["workers_exceptions"] += w.Exceptions + mx["workers_respawns"] += w.RespawnCount + + seen[w.ID] = true + + if !u.seenWorkers[w.ID] { + u.seenWorkers[w.ID] = true + u.addWorkerCharts(w.ID) + } + + px := fmt.Sprintf("worker_%d_", w.ID) + + mx[px+"tx"] = w.TX + mx[px+"requests"] = w.Requests + mx[px+"delta_requests"] = w.DeltaRequests + mx[px+"average_request_time"] = w.AvgRT + mx[px+"harakiris"] = w.HarakiriCount + mx[px+"exceptions"] = w.Exceptions + mx[px+"respawns"] = w.RespawnCount + mx[px+"memory_rss"] = w.RSS + mx[px+"memory_vsz"] = w.VSZ + + for _, v := range []string{"idle", "busy", "cheap", "pause", "sig"} { + mx[px+"status_"+v] = boolToInt(w.Status == v) + } + mx[px+"request_handling_status_accepting"] = boolToInt(w.Accepting == 1) + mx[px+"request_handling_status_not_accepting"] = boolToInt(w.Accepting == 0) + } + + for id := range u.seenWorkers { + if !seen[id] { + delete(u.seenWorkers, id) + u.removeWorkerCharts(id) + } + } + + return nil +} + +func (u *Uwsgi) establishConn() (uwsgiConn, error) { + conn := u.newConn(u.Config) + + if err := conn.connect(); err != nil { + return nil, err + } + + return conn, nil +} + +func boolToInt(b bool) int64 { + if b { + return 1 + } + return 0 +} diff --git a/src/go/plugin/go.d/modules/uwsgi/config_schema.json b/src/go/plugin/go.d/modules/uwsgi/config_schema.json new file mode 100644 index 000000000..14c750432 --- /dev/null +++ b/src/go/plugin/go.d/modules/uwsgi/config_schema.json @@ -0,0 +1,44 @@ +{ + "jsonSchema": { + "$schema": "http://json-schema.org/draft-07/schema#", + "title": "UWSGI collector configuration.", + "type": "object", + "properties": { + "update_every": { + "title": "Update every", + "description": "Data collection interval, measured in seconds.", + "type": "integer", + "minimum": 1, + "default": 1 + }, + "address": { + "title": "Address", + "description": "The IP address and port where the UWSGI [Stats Server](https://uwsgi-docs.readthedocs.io/en/latest/StatsServer.html) listens for connections.", + "type": "string", + "default": "127.0.0.1:1717" + }, + "timeout": { + "title": "Timeout", + "description": "Timeout for establishing a connection and communication (reading and writing) in seconds.", + "type": "number", + "minimum": 0.5, + "default": 1 + } + }, + "required": [ + "address" + ], + "additionalProperties": false, + "patternProperties": { + "^name$": {} + } + }, + "uiSchema": { + "uiOptions": { + "fullPage": true + }, + "timeout": { + "ui:help": "Accepts decimals for precise control (e.g., type 1.5 for 1.5 seconds)." + } + } +} diff --git a/src/go/plugin/go.d/modules/uwsgi/init.go b/src/go/plugin/go.d/modules/uwsgi/init.go new file mode 100644 index 000000000..ab5999708 --- /dev/null +++ b/src/go/plugin/go.d/modules/uwsgi/init.go @@ -0,0 +1,3 @@ +// SPDX-License-Identifier: GPL-3.0-or-later + +package uwsgi diff --git a/src/go/plugin/go.d/modules/uwsgi/integrations/uwsgi.md b/src/go/plugin/go.d/modules/uwsgi/integrations/uwsgi.md new file mode 100644 index 000000000..6fe19263e --- /dev/null +++ b/src/go/plugin/go.d/modules/uwsgi/integrations/uwsgi.md @@ -0,0 +1,248 @@ +<!--startmeta +custom_edit_url: "https://github.com/netdata/netdata/edit/master/src/go/plugin/go.d/modules/uwsgi/README.md" +meta_yaml: "https://github.com/netdata/netdata/edit/master/src/go/plugin/go.d/modules/uwsgi/metadata.yaml" +sidebar_label: "uWSGI" +learn_status: "Published" +learn_rel_path: "Collecting Metrics/Web Servers and Web Proxies" +most_popular: False +message: "DO NOT EDIT THIS FILE DIRECTLY, IT IS GENERATED BY THE COLLECTOR'S metadata.yaml FILE" +endmeta--> + +# uWSGI + + +<img src="https://netdata.cloud/img/uwsgi.svg" width="150"/> + + +Plugin: go.d.plugin +Module: uwsgi + +<img src="https://img.shields.io/badge/maintained%20by-Netdata-%2300ab44" /> + +## Overview + +Monitors UWSGI worker health and performance by collecting metrics like requests, transmitted data, exceptions, and harakiris. + + +It fetches [Stats Server](https://uwsgi-docs.readthedocs.io/en/latest/StatsServer.html) statistics over TCP. + + +This collector is supported on all platforms. + +This collector supports collecting metrics from multiple instances of this integration, including remote instances. + + +### Default Behavior + +#### Auto-Detection + +Automatically discovers and collects UWSGI statistics from the following default locations: + +- localhost:1717 + + +#### Limits + +The default configuration for this integration does not impose any limits on data collection. + +#### Performance Impact + +The default configuration for this integration is not expected to impose a significant performance impact on the system. + + +## Metrics + +Metrics grouped by *scope*. + +The scope defines the instance that the metric belongs to. An instance is uniquely identified by a set of labels. + + + +### Per uWSGI instance + +These metrics refer to the entire monitored application. + +This scope has no labels. + +Metrics: + +| Metric | Dimensions | Unit | +|:------|:----------|:----| +| uwsgi.transmitted_data | tx | bytes/s | +| uwsgi.requests | requests | requests/s | +| uwsgi.harakiris | harakiris | harakiris/s | +| uwsgi.respawns | respawns | respawns/s | + +### Per worker + +These metrics refer to the Worker process. + +Labels: + +| Label | Description | +|:-----------|:----------------| +| worker_id | Worker ID. | + +Metrics: + +| Metric | Dimensions | Unit | +|:------|:----------|:----| +| uwsgi.worker_transmitted_data | tx | bytes/s | +| uwsgi.worker_requests | requests | requests/s | +| uwsgi.worker_delta_requests | delta_requests | requests/s | +| uwsgi.worker_average_request_time | avg | milliseconds | +| uwsgi.worker_harakiris | harakiris | harakiris/s | +| uwsgi.worker_exceptions | exceptions | exceptions/s | +| uwsgi.worker_status | idle, busy, cheap, pause, sig | status | +| uwsgi.worker_request_handling_status | accepting, not_accepting | status | +| uwsgi.worker_respawns | respawns | respawns/s | +| uwsgi.worker_memory_rss | rss | bytes | +| uwsgi.worker_memory_vsz | vsz | bytes | + + + +## Alerts + +There are no alerts configured by default for this integration. + + +## Setup + +### Prerequisites + +#### Enable the uWSGI Stats Server + +See [Stats Server](https://uwsgi-docs.readthedocs.io/en/latest/StatsServer.html) for details. + + + +### Configuration + +#### File + +The configuration file name for this integration is `go.d/uwsgi.conf`. + + +You can edit the configuration file using the `edit-config` script from the +Netdata [config directory](/docs/netdata-agent/configuration/README.md#the-netdata-config-directory). + +```bash +cd /etc/netdata 2>/dev/null || cd /opt/netdata/etc/netdata +sudo ./edit-config go.d/uwsgi.conf +``` +#### Options + +The following options can be defined globally: update_every, autodetection_retry. + + +<details open><summary>Config options</summary> + +| Name | Description | Default | Required | +|:----|:-----------|:-------|:--------:| +| update_every | Data collection frequency. | 1 | no | +| autodetection_retry | Recheck interval in seconds. Zero means no recheck will be scheduled. | 0 | no | +| address | The IP address and port where the UWSGI [Stats Server](https://uwsgi-docs.readthedocs.io/en/latest/StatsServer.html) listens for connections. | 127.0.0.1:1717 | yes | +| timeout | Connection, read, and write timeout duration in seconds. The timeout includes name resolution. | 1 | no | + +</details> + +#### Examples + +##### Basic + +A basic example configuration. + +<details open><summary>Config</summary> + +```yaml +jobs: + - name: local + address: 127.0.0.1:1717 + +``` +</details> + +##### Multi-instance + +> **Note**: When you define multiple jobs, their names must be unique. + +Collecting metrics from local and remote instances. + + +<details open><summary>Config</summary> + +```yaml +jobs: + - name: local + address: 127.0.0.1:1717 + + - name: remote + address: 203.0.113.0:1717 + +``` +</details> + + + +## Troubleshooting + +### Debug Mode + +**Important**: Debug mode is not supported for data collection jobs created via the UI using the Dyncfg feature. + +To troubleshoot issues with the `uwsgi` collector, run the `go.d.plugin` with the debug option enabled. The output +should give you clues as to why the collector isn't working. + +- Navigate to the `plugins.d` directory, usually at `/usr/libexec/netdata/plugins.d/`. If that's not the case on + your system, open `netdata.conf` and look for the `plugins` setting under `[directories]`. + + ```bash + cd /usr/libexec/netdata/plugins.d/ + ``` + +- Switch to the `netdata` user. + + ```bash + sudo -u netdata -s + ``` + +- Run the `go.d.plugin` to debug the collector: + + ```bash + ./go.d.plugin -d -m uwsgi + ``` + +### Getting Logs + +If you're encountering problems with the `uwsgi` collector, follow these steps to retrieve logs and identify potential issues: + +- **Run the command** specific to your system (systemd, non-systemd, or Docker container). +- **Examine the output** for any warnings or error messages that might indicate issues. These messages should provide clues about the root cause of the problem. + +#### System with systemd + +Use the following command to view logs generated since the last Netdata service restart: + +```bash +journalctl _SYSTEMD_INVOCATION_ID="$(systemctl show --value --property=InvocationID netdata)" --namespace=netdata --grep uwsgi +``` + +#### System without systemd + +Locate the collector log file, typically at `/var/log/netdata/collector.log`, and use `grep` to filter for collector's name: + +```bash +grep uwsgi /var/log/netdata/collector.log +``` + +**Note**: This method shows logs from all restarts. Focus on the **latest entries** for troubleshooting current issues. + +#### Docker Container + +If your Netdata runs in a Docker container named "netdata" (replace if different), use this command: + +```bash +docker logs netdata 2>&1 | grep uwsgi +``` + + diff --git a/src/go/plugin/go.d/modules/uwsgi/metadata.yaml b/src/go/plugin/go.d/modules/uwsgi/metadata.yaml new file mode 100644 index 000000000..698d6abbf --- /dev/null +++ b/src/go/plugin/go.d/modules/uwsgi/metadata.yaml @@ -0,0 +1,215 @@ +plugin_name: go.d.plugin +modules: + - meta: + id: collector-go.d.plugin-uwsgi + plugin_name: go.d.plugin + module_name: uwsgi + monitored_instance: + name: uWSGI + link: https://uwsgi-docs.readthedocs.io/en/latest/ + categories: + - data-collection.web-servers-and-web-proxies + icon_filename: "uwsgi.svg" + related_resources: + integrations: + list: [] + info_provided_to_referring_integrations: + description: "" + keywords: + - application server + - python + - web applications + most_popular: false + overview: + data_collection: + metrics_description: | + Monitors UWSGI worker health and performance by collecting metrics like requests, transmitted data, exceptions, and harakiris. + method_description: | + It fetches [Stats Server](https://uwsgi-docs.readthedocs.io/en/latest/StatsServer.html) statistics over TCP. + supported_platforms: + include: [] + exclude: [] + multi_instance: true + additional_permissions: + description: "" + default_behavior: + auto_detection: + description: | + Automatically discovers and collects UWSGI statistics from the following default locations: + + - localhost:1717 + limits: + description: "" + performance_impact: + description: "" + setup: + prerequisites: + list: + - title: Enable the uWSGI Stats Server + description: | + See [Stats Server](https://uwsgi-docs.readthedocs.io/en/latest/StatsServer.html) for details. + configuration: + file: + name: go.d/uwsgi.conf + options: + description: | + The following options can be defined globally: update_every, autodetection_retry. + folding: + title: Config options + enabled: true + list: + - name: update_every + description: Data collection frequency. + default_value: 1 + required: false + - name: autodetection_retry + description: Recheck interval in seconds. Zero means no recheck will be scheduled. + default_value: 0 + required: false + - name: address + description: "The IP address and port where the UWSGI [Stats Server](https://uwsgi-docs.readthedocs.io/en/latest/StatsServer.html) listens for connections." + default_value: 127.0.0.1:1717 + required: true + - name: timeout + description: Connection, read, and write timeout duration in seconds. The timeout includes name resolution. + default_value: 1 + required: false + examples: + folding: + title: Config + enabled: true + list: + - name: Basic + description: A basic example configuration. + config: | + jobs: + - name: local + address: 127.0.0.1:1717 + - name: Multi-instance + description: | + > **Note**: When you define multiple jobs, their names must be unique. + + Collecting metrics from local and remote instances. + config: | + jobs: + - name: local + address: 127.0.0.1:1717 + + - name: remote + address: 203.0.113.0:1717 + troubleshooting: + problems: + list: [] + alerts: [] + metrics: + folding: + title: Metrics + enabled: false + description: "" + availability: [] + scopes: + - name: global + description: "These metrics refer to the entire monitored application." + labels: [] + metrics: + - name: uwsgi.transmitted_data + description: UWSGI Transmitted Data + unit: "bytes/s" + chart_type: area + dimensions: + - name: tx + - name: uwsgi.requests + description: UWSGI Requests + unit: "requests/s" + chart_type: line + dimensions: + - name: requests + - name: uwsgi.harakiris + description: UWSGI Dropped Requests + unit: "harakiris/s" + chart_type: line + dimensions: + - name: harakiris + - name: uwsgi.respawns + description: UWSGI Respawns + unit: "respawns/s" + chart_type: line + dimensions: + - name: respawns + - name: worker + description: "These metrics refer to the Worker process." + labels: + - name: "worker_id" + description: Worker ID. + metrics: + - name: uwsgi.worker_transmitted_data + description: UWSGI Worker Transmitted Data + unit: "bytes/s" + chart_type: area + dimensions: + - name: tx + - name: uwsgi.worker_requests + description: UWSGI Worker Requests + unit: "requests/s" + chart_type: line + dimensions: + - name: requests + - name: uwsgi.worker_delta_requests + description: UWSGI Worker Delta Requests + unit: "requests/s" + chart_type: line + dimensions: + - name: delta_requests + - name: uwsgi.worker_average_request_time + description: UWSGI Worker Average Request Time + unit: "milliseconds" + chart_type: line + dimensions: + - name: avg + - name: uwsgi.worker_harakiris + description: UWSGI Worker Dropped Requests + unit: "harakiris/s" + chart_type: line + dimensions: + - name: harakiris + - name: uwsgi.worker_exceptions + description: UWSGI Worker Raised Exceptions + unit: "exceptions/s" + chart_type: line + dimensions: + - name: exceptions + - name: uwsgi.worker_status + description: UWSGI Worker Status + unit: "status" + chart_type: line + dimensions: + - name: idle + - name: busy + - name: cheap + - name: pause + - name: sig + - name: uwsgi.worker_request_handling_status + description: UWSGI Worker Request Handling Status + unit: "status" + chart_type: line + dimensions: + - name: accepting + - name: not_accepting + - name: uwsgi.worker_respawns + description: UWSGI Worker Respawns + unit: "respawns/s" + chart_type: line + dimensions: + - name: respawns + - name: uwsgi.worker_memory_rss + description: UWSGI Worker Memory RSS (Resident Set Size) + unit: "bytes" + chart_type: area + dimensions: + - name: rss + - name: uwsgi.worker_memory_vsz + description: UWSGI Worker Memory VSZ (Virtual Memory Size) + unit: "bytes" + chart_type: area + dimensions: + - name: vsz diff --git a/src/go/plugin/go.d/modules/uwsgi/testdata/config.json b/src/go/plugin/go.d/modules/uwsgi/testdata/config.json new file mode 100644 index 000000000..e86834720 --- /dev/null +++ b/src/go/plugin/go.d/modules/uwsgi/testdata/config.json @@ -0,0 +1,5 @@ +{ + "update_every": 123, + "address": "ok", + "timeout": 123.123 +} diff --git a/src/go/plugin/go.d/modules/uwsgi/testdata/config.yaml b/src/go/plugin/go.d/modules/uwsgi/testdata/config.yaml new file mode 100644 index 000000000..1b81d09eb --- /dev/null +++ b/src/go/plugin/go.d/modules/uwsgi/testdata/config.yaml @@ -0,0 +1,3 @@ +update_every: 123 +address: "ok" +timeout: 123.123 diff --git a/src/go/plugin/go.d/modules/uwsgi/testdata/stats.json b/src/go/plugin/go.d/modules/uwsgi/testdata/stats.json new file mode 100644 index 000000000..d00a340ba --- /dev/null +++ b/src/go/plugin/go.d/modules/uwsgi/testdata/stats.json @@ -0,0 +1,117 @@ +{ + "version": "2.1.21-debian", + "listen_queue": 1, + "listen_queue_errors": 1, + "signal_queue": 1, + "load": 1, + "pid": 859919, + "uid": 1111, + "gid": 1111, + "cwd": "/home/ilyam", + "locks": [ + { + "user 1": 1 + }, + { + "signal": 1 + }, + { + "filemon": 1 + }, + { + "timer": 1 + }, + { + "rbtimer": 1 + }, + { + "cron": 1 + }, + { + "rpc": 1 + }, + { + "snmp": 1 + } + ], + "sockets": [ + { + "name": ":3131", + "proto": "uwsgi", + "queue": 1, + "max_queue": 111, + "shared": 1, + "can_offload": 1 + } + ], + "workers": [ + { + "id": 1, + "pid": 859911, + "accepting": 1, + "requests": 1, + "delta_requests": 1, + "exceptions": 1, + "harakiri_count": 1, + "signals": 1, + "signal_queue": 1, + "status": "idle", + "rss": 1, + "vsz": 1, + "running_time": 1, + "last_spawn": 1723542786, + "respawn_count": 1, + "tx": 1, + "avg_rt": 1, + "apps": [], + "cores": [ + { + "id": 1, + "requests": 1, + "static_requests": 1, + "routed_requests": 1, + "offloaded_requests": 1, + "write_errors": 1, + "read_errors": 1, + "in_request": 1, + "vars": [], + "req_info": {} + } + ] + }, + { + "id": 2, + "pid": 859911, + "accepting": 1, + "requests": 1, + "delta_requests": 1, + "exceptions": 1, + "harakiri_count": 1, + "signals": 1, + "signal_queue": 1, + "status": "idle", + "rss": 1, + "vsz": 1, + "running_time": 1, + "last_spawn": 1723542786, + "respawn_count": 1, + "tx": 1, + "avg_rt": 1, + "apps": [], + "cores": [ + { + "id": 1, + "requests": 1, + "static_requests": 1, + "routed_requests": 1, + "offloaded_requests": 1, + "write_errors": 1, + "read_errors": 1, + "in_request": 1, + "vars": [], + "req_info": {} + } + ] + } + ] +} diff --git a/src/go/plugin/go.d/modules/uwsgi/testdata/stats_no_workers.json b/src/go/plugin/go.d/modules/uwsgi/testdata/stats_no_workers.json new file mode 100644 index 000000000..8b8c782fd --- /dev/null +++ b/src/go/plugin/go.d/modules/uwsgi/testdata/stats_no_workers.json @@ -0,0 +1,49 @@ +{ + "version": "2.0.21-debian", + "listen_queue": 0, + "listen_queue_errors": 0, + "signal_queue": 0, + "load": 0, + "pid": 1267323, + "uid": 1001, + "gid": 1001, + "cwd": "/home/ilyam", + "locks": [ + { + "user 0": 0 + }, + { + "signal": 0 + }, + { + "filemon": 0 + }, + { + "timer": 0 + }, + { + "rbtimer": 0 + }, + { + "cron": 0 + }, + { + "rpc": 0 + }, + { + "snmp": 0 + } + ], + "sockets": [ + { + "name": ":3031", + "proto": "uwsgi", + "queue": 0, + "max_queue": 100, + "shared": 0, + "can_offload": 0 + } + ], + "workers": [ + ] +} diff --git a/src/go/plugin/go.d/modules/uwsgi/uwsgi.go b/src/go/plugin/go.d/modules/uwsgi/uwsgi.go new file mode 100644 index 000000000..7fe98503e --- /dev/null +++ b/src/go/plugin/go.d/modules/uwsgi/uwsgi.go @@ -0,0 +1,98 @@ +// SPDX-License-Identifier: GPL-3.0-or-later + +package uwsgi + +import ( + _ "embed" + "errors" + "time" + + "github.com/netdata/netdata/go/plugins/plugin/go.d/agent/module" + "github.com/netdata/netdata/go/plugins/plugin/go.d/pkg/web" +) + +//go:embed "config_schema.json" +var configSchema string + +func init() { + module.Register("uwsgi", module.Creator{ + JobConfigSchema: configSchema, + Create: func() module.Module { return New() }, + Config: func() any { return &Config{} }, + }) +} + +func New() *Uwsgi { + return &Uwsgi{ + Config: Config{ + Address: "127.0.0.1:1717", + Timeout: web.Duration(time.Second * 1), + }, + newConn: newUwsgiConn, + charts: charts.Copy(), + seenWorkers: make(map[int]bool), + } +} + +type Config struct { + UpdateEvery int `yaml:"update_every,omitempty" json:"update_every"` + Address string `yaml:"address" json:"address"` + Timeout web.Duration `yaml:"timeout" json:"timeout"` +} + +type Uwsgi struct { + module.Base + Config `yaml:",inline" json:""` + + charts *module.Charts + + newConn func(Config) uwsgiConn + + seenWorkers map[int]bool +} + +func (u *Uwsgi) Configuration() any { + return u.Config +} + +func (u *Uwsgi) Init() error { + if u.Address == "" { + u.Error("config: 'address' not set") + return errors.New("address not set") + } + + return nil +} + +func (u *Uwsgi) Check() error { + mx, err := u.collect() + if err != nil { + u.Error(err) + return err + } + + if len(mx) == 0 { + return errors.New("no metrics collected") + } + + return nil +} + +func (u *Uwsgi) Charts() *module.Charts { + return u.charts +} + +func (u *Uwsgi) Collect() map[string]int64 { + mx, err := u.collect() + if err != nil { + u.Error(err) + } + + if len(mx) == 0 { + return nil + } + + return mx +} + +func (u *Uwsgi) Cleanup() {} diff --git a/src/go/plugin/go.d/modules/uwsgi/uwsgi_test.go b/src/go/plugin/go.d/modules/uwsgi/uwsgi_test.go new file mode 100644 index 000000000..900c48538 --- /dev/null +++ b/src/go/plugin/go.d/modules/uwsgi/uwsgi_test.go @@ -0,0 +1,325 @@ +// SPDX-License-Identifier: GPL-3.0-or-later + +package uwsgi + +import ( + "errors" + "os" + "testing" + + "github.com/netdata/netdata/go/plugins/plugin/go.d/agent/module" + + "github.com/stretchr/testify/assert" + "github.com/stretchr/testify/require" +) + +var ( + dataConfigJSON, _ = os.ReadFile("testdata/config.json") + dataConfigYAML, _ = os.ReadFile("testdata/config.yaml") + + dataStats, _ = os.ReadFile("testdata/stats.json") + dataStatsNoWorkers, _ = os.ReadFile("testdata/stats_no_workers.json") +) + +func Test_testDataIsValid(t *testing.T) { + for name, data := range map[string][]byte{ + "dataConfigJSON": dataConfigJSON, + "dataConfigYAML": dataConfigYAML, + "dataStats": dataStats, + "dataStatsNoWorkers": dataStatsNoWorkers, + } { + require.NotNil(t, data, name) + } +} + +func TestUwsgi_ConfigurationSerialize(t *testing.T) { + module.TestConfigurationSerialize(t, &Uwsgi{}, dataConfigJSON, dataConfigYAML) +} + +func TestUwsgi_Init(t *testing.T) { + tests := map[string]struct { + config Config + wantFail bool + }{ + "success with default config": { + wantFail: false, + config: New().Config, + }, + "fails if address not set": { + wantFail: true, + config: func() Config { + conf := New().Config + conf.Address = "" + return conf + }(), + }, + } + + for name, test := range tests { + t.Run(name, func(t *testing.T) { + uw := New() + uw.Config = test.config + + if test.wantFail { + assert.Error(t, uw.Init()) + } else { + assert.NoError(t, uw.Init()) + } + }) + } +} + +func TestUwsgi_Cleanup(t *testing.T) { + tests := map[string]struct { + prepare func() *Uwsgi + }{ + "not initialized": { + prepare: func() *Uwsgi { + return New() + }, + }, + "after check": { + prepare: func() *Uwsgi { + uw := New() + uw.newConn = func(config Config) uwsgiConn { return prepareMockOk() } + _ = uw.Check() + return uw + }, + }, + "after collect": { + prepare: func() *Uwsgi { + uw := New() + uw.newConn = func(config Config) uwsgiConn { return prepareMockOk() } + _ = uw.Collect() + return uw + }, + }, + } + + for name, test := range tests { + t.Run(name, func(t *testing.T) { + uw := test.prepare() + + assert.NotPanics(t, uw.Cleanup) + }) + } +} + +func TestUwsgi_Charts(t *testing.T) { + assert.NotNil(t, New().Charts()) +} + +func TestUwsgi_Check(t *testing.T) { + tests := map[string]struct { + prepareMock func() *mockUwsgiConn + wantFail bool + }{ + "success case": { + wantFail: false, + prepareMock: prepareMockOk, + }, + "success case no workers": { + wantFail: false, + prepareMock: prepareMockOkNoWorkers, + }, + "err on connect": { + wantFail: true, + prepareMock: prepareMockErrOnConnect, + }, + "unexpected response": { + wantFail: true, + prepareMock: prepareMockUnexpectedResponse, + }, + "empty response": { + wantFail: true, + prepareMock: prepareMockEmptyResponse, + }, + } + + for name, test := range tests { + t.Run(name, func(t *testing.T) { + uw := New() + mock := test.prepareMock() + uw.newConn = func(config Config) uwsgiConn { return mock } + + if test.wantFail { + assert.Error(t, uw.Check()) + } else { + assert.NoError(t, uw.Check()) + } + }) + } +} + +func TestUwsgi_Collect(t *testing.T) { + tests := map[string]struct { + prepareMock func() *mockUwsgiConn + wantMetrics map[string]int64 + wantCharts int + disconnectBeforeCleanup bool + disconnectAfterCleanup bool + }{ + "success case": { + prepareMock: prepareMockOk, + wantCharts: len(charts) + len(workerChartsTmpl)*2, + disconnectBeforeCleanup: true, + disconnectAfterCleanup: true, + wantMetrics: map[string]int64{ + "worker_1_average_request_time": 1, + "worker_1_delta_requests": 1, + "worker_1_exceptions": 1, + "worker_1_harakiris": 1, + "worker_1_memory_rss": 1, + "worker_1_memory_vsz": 1, + "worker_1_request_handling_status_accepting": 1, + "worker_1_request_handling_status_not_accepting": 0, + "worker_1_requests": 1, + "worker_1_respawns": 1, + "worker_1_status_busy": 0, + "worker_1_status_cheap": 0, + "worker_1_status_idle": 1, + "worker_1_status_pause": 0, + "worker_1_status_sig": 0, + "worker_1_tx": 1, + "worker_2_average_request_time": 1, + "worker_2_delta_requests": 1, + "worker_2_exceptions": 1, + "worker_2_harakiris": 1, + "worker_2_memory_rss": 1, + "worker_2_memory_vsz": 1, + "worker_2_request_handling_status_accepting": 1, + "worker_2_request_handling_status_not_accepting": 0, + "worker_2_requests": 1, + "worker_2_respawns": 1, + "worker_2_status_busy": 0, + "worker_2_status_cheap": 0, + "worker_2_status_idle": 1, + "worker_2_status_pause": 0, + "worker_2_status_sig": 0, + "worker_2_tx": 1, + "workers_exceptions": 2, + "workers_harakiris": 2, + "workers_requests": 2, + "workers_respawns": 2, + "workers_tx": 2, + }, + }, + "success case no workers": { + prepareMock: prepareMockOkNoWorkers, + wantCharts: len(charts), + wantMetrics: map[string]int64{ + "workers_exceptions": 0, + "workers_harakiris": 0, + "workers_requests": 0, + "workers_respawns": 0, + "workers_tx": 0, + }, + disconnectBeforeCleanup: true, + disconnectAfterCleanup: true, + }, + "unexpected response": { + prepareMock: prepareMockUnexpectedResponse, + wantCharts: len(charts), + disconnectBeforeCleanup: true, + disconnectAfterCleanup: true, + }, + "empty response": { + prepareMock: prepareMockEmptyResponse, + wantCharts: len(charts), + disconnectBeforeCleanup: true, + disconnectAfterCleanup: true, + }, + "err on connect": { + prepareMock: prepareMockErrOnConnect, + wantCharts: len(charts), + disconnectBeforeCleanup: false, + disconnectAfterCleanup: false, + }, + "err on query stats": { + prepareMock: prepareMockErrOnQueryStats, + wantCharts: len(charts), + disconnectBeforeCleanup: true, + disconnectAfterCleanup: true, + }, + } + + for name, test := range tests { + t.Run(name, func(t *testing.T) { + uw := New() + mock := test.prepareMock() + uw.newConn = func(config Config) uwsgiConn { return mock } + + mx := uw.Collect() + + require.Equal(t, test.wantMetrics, mx) + + if len(test.wantMetrics) > 0 { + module.TestMetricsHasAllChartsDims(t, uw.Charts(), mx) + } + assert.Equal(t, test.wantCharts, len(*uw.Charts()), "want charts") + + assert.Equal(t, test.disconnectBeforeCleanup, mock.disconnectCalled, "disconnect before cleanup") + uw.Cleanup() + assert.Equal(t, test.disconnectAfterCleanup, mock.disconnectCalled, "disconnect after cleanup") + }) + } +} + +func prepareMockOk() *mockUwsgiConn { + return &mockUwsgiConn{ + statsResponse: dataStats, + } +} + +func prepareMockOkNoWorkers() *mockUwsgiConn { + return &mockUwsgiConn{ + statsResponse: dataStatsNoWorkers, + } +} + +func prepareMockErrOnConnect() *mockUwsgiConn { + return &mockUwsgiConn{ + errOnConnect: true, + } +} + +func prepareMockErrOnQueryStats() *mockUwsgiConn { + return &mockUwsgiConn{ + errOnQueryStats: true, + } +} + +func prepareMockUnexpectedResponse() *mockUwsgiConn { + return &mockUwsgiConn{ + statsResponse: []byte("Lorem ipsum dolor sit amet, consectetur adipiscing elit."), + } +} + +func prepareMockEmptyResponse() *mockUwsgiConn { + return &mockUwsgiConn{} +} + +type mockUwsgiConn struct { + errOnConnect bool + errOnQueryStats bool + statsResponse []byte + disconnectCalled bool +} + +func (m *mockUwsgiConn) connect() error { + if m.errOnConnect { + return errors.New("mock.connect() error") + } + return nil +} + +func (m *mockUwsgiConn) disconnect() { + m.disconnectCalled = true +} + +func (m *mockUwsgiConn) queryStats() ([]byte, error) { + if m.errOnQueryStats { + return nil, errors.New("mock.queryStats() error") + } + return m.statsResponse, nil +} diff --git a/src/go/collectors/go.d.plugin/modules/vcsa/README.md b/src/go/plugin/go.d/modules/vcsa/README.md index 0d00f4673..0d00f4673 120000 --- a/src/go/collectors/go.d.plugin/modules/vcsa/README.md +++ b/src/go/plugin/go.d/modules/vcsa/README.md diff --git a/src/go/collectors/go.d.plugin/modules/vcsa/charts.go b/src/go/plugin/go.d/modules/vcsa/charts.go index 306b6a57b..8d4103a10 100644 --- a/src/go/collectors/go.d.plugin/modules/vcsa/charts.go +++ b/src/go/plugin/go.d/modules/vcsa/charts.go @@ -2,7 +2,7 @@ package vcsa -import "github.com/netdata/netdata/go/go.d.plugin/agent/module" +import "github.com/netdata/netdata/go/plugins/plugin/go.d/agent/module" var ( vcsaHealthCharts = module.Charts{ diff --git a/src/go/collectors/go.d.plugin/modules/vcsa/client/client.go b/src/go/plugin/go.d/modules/vcsa/client/client.go index 64f53ff44..ea0dd1618 100644 --- a/src/go/collectors/go.d.plugin/modules/vcsa/client/client.go +++ b/src/go/plugin/go.d/modules/vcsa/client/client.go @@ -9,7 +9,7 @@ import ( "net/http" "sync" - "github.com/netdata/netdata/go/go.d.plugin/pkg/web" + "github.com/netdata/netdata/go/plugins/plugin/go.d/pkg/web" ) // Session: https://vmware.github.io/vsphere-automation-sdk-rest/vsphere/index.html#SVC_com.vmware.cis.session diff --git a/src/go/collectors/go.d.plugin/modules/vcsa/client/client_test.go b/src/go/plugin/go.d/modules/vcsa/client/client_test.go index 379644b89..379644b89 100644 --- a/src/go/collectors/go.d.plugin/modules/vcsa/client/client_test.go +++ b/src/go/plugin/go.d/modules/vcsa/client/client_test.go diff --git a/src/go/collectors/go.d.plugin/modules/vcsa/collect.go b/src/go/plugin/go.d/modules/vcsa/collect.go index 8a734d9e8..8a734d9e8 100644 --- a/src/go/collectors/go.d.plugin/modules/vcsa/collect.go +++ b/src/go/plugin/go.d/modules/vcsa/collect.go diff --git a/src/go/collectors/go.d.plugin/modules/vcsa/config_schema.json b/src/go/plugin/go.d/modules/vcsa/config_schema.json index 809ab97ce..3302794c6 100644 --- a/src/go/collectors/go.d.plugin/modules/vcsa/config_schema.json +++ b/src/go/plugin/go.d/modules/vcsa/config_schema.json @@ -170,7 +170,11 @@ "ui:help": "Accepts decimals for precise control (e.g., type 1.5 for 1.5 seconds)." }, "username": { - "ui:placeholder": "admin@vsphere.local" + "ui:placeholder": "admin@vsphere.local", + "ui:widget": "password" + }, + "proxy_username": { + "ui:widget": "password" }, "password": { "ui:widget": "password" diff --git a/src/go/collectors/go.d.plugin/modules/vcsa/init.go b/src/go/plugin/go.d/modules/vcsa/init.go index 112239428..20631ab48 100644 --- a/src/go/collectors/go.d.plugin/modules/vcsa/init.go +++ b/src/go/plugin/go.d/modules/vcsa/init.go @@ -5,8 +5,8 @@ package vcsa import ( "errors" - "github.com/netdata/netdata/go/go.d.plugin/modules/vcsa/client" - "github.com/netdata/netdata/go/go.d.plugin/pkg/web" + "github.com/netdata/netdata/go/plugins/plugin/go.d/modules/vcsa/client" + "github.com/netdata/netdata/go/plugins/plugin/go.d/pkg/web" ) func (vc *VCSA) validateConfig() error { diff --git a/src/go/collectors/go.d.plugin/modules/vcsa/integrations/vcenter_server_appliance.md b/src/go/plugin/go.d/modules/vcsa/integrations/vcenter_server_appliance.md index 2fd72657a..99517af3e 100644 --- a/src/go/collectors/go.d.plugin/modules/vcsa/integrations/vcenter_server_appliance.md +++ b/src/go/plugin/go.d/modules/vcsa/integrations/vcenter_server_appliance.md @@ -1,6 +1,6 @@ <!--startmeta -custom_edit_url: "https://github.com/netdata/netdata/edit/master/src/go/collectors/go.d.plugin/modules/vcsa/README.md" -meta_yaml: "https://github.com/netdata/netdata/edit/master/src/go/collectors/go.d.plugin/modules/vcsa/metadata.yaml" +custom_edit_url: "https://github.com/netdata/netdata/edit/master/src/go/plugin/go.d/modules/vcsa/README.md" +meta_yaml: "https://github.com/netdata/netdata/edit/master/src/go/plugin/go.d/modules/vcsa/metadata.yaml" sidebar_label: "vCenter Server Appliance" learn_status: "Published" learn_rel_path: "Collecting Metrics/Containers and VMs" @@ -232,6 +232,8 @@ jobs: ### Debug Mode +**Important**: Debug mode is not supported for data collection jobs created via the UI using the Dyncfg feature. + To troubleshoot issues with the `vcsa` collector, run the `go.d.plugin` with the debug option enabled. The output should give you clues as to why the collector isn't working. @@ -254,4 +256,37 @@ should give you clues as to why the collector isn't working. ./go.d.plugin -d -m vcsa ``` +### Getting Logs + +If you're encountering problems with the `vcsa` collector, follow these steps to retrieve logs and identify potential issues: + +- **Run the command** specific to your system (systemd, non-systemd, or Docker container). +- **Examine the output** for any warnings or error messages that might indicate issues. These messages should provide clues about the root cause of the problem. + +#### System with systemd + +Use the following command to view logs generated since the last Netdata service restart: + +```bash +journalctl _SYSTEMD_INVOCATION_ID="$(systemctl show --value --property=InvocationID netdata)" --namespace=netdata --grep vcsa +``` + +#### System without systemd + +Locate the collector log file, typically at `/var/log/netdata/collector.log`, and use `grep` to filter for collector's name: + +```bash +grep vcsa /var/log/netdata/collector.log +``` + +**Note**: This method shows logs from all restarts. Focus on the **latest entries** for troubleshooting current issues. + +#### Docker Container + +If your Netdata runs in a Docker container named "netdata" (replace if different), use this command: + +```bash +docker logs netdata 2>&1 | grep vcsa +``` + diff --git a/src/go/collectors/go.d.plugin/modules/vcsa/metadata.yaml b/src/go/plugin/go.d/modules/vcsa/metadata.yaml index d619f3d96..d619f3d96 100644 --- a/src/go/collectors/go.d.plugin/modules/vcsa/metadata.yaml +++ b/src/go/plugin/go.d/modules/vcsa/metadata.yaml diff --git a/src/go/plugin/go.d/modules/vcsa/testdata/config.json b/src/go/plugin/go.d/modules/vcsa/testdata/config.json new file mode 100644 index 000000000..984c3ed6e --- /dev/null +++ b/src/go/plugin/go.d/modules/vcsa/testdata/config.json @@ -0,0 +1,20 @@ +{ + "update_every": 123, + "url": "ok", + "body": "ok", + "method": "ok", + "headers": { + "ok": "ok" + }, + "username": "ok", + "password": "ok", + "proxy_url": "ok", + "proxy_username": "ok", + "proxy_password": "ok", + "timeout": 123.123, + "not_follow_redirects": true, + "tls_ca": "ok", + "tls_cert": "ok", + "tls_key": "ok", + "tls_skip_verify": true +} diff --git a/src/go/plugin/go.d/modules/vcsa/testdata/config.yaml b/src/go/plugin/go.d/modules/vcsa/testdata/config.yaml new file mode 100644 index 000000000..8558b61cc --- /dev/null +++ b/src/go/plugin/go.d/modules/vcsa/testdata/config.yaml @@ -0,0 +1,17 @@ +update_every: 123 +url: "ok" +body: "ok" +method: "ok" +headers: + ok: "ok" +username: "ok" +password: "ok" +proxy_url: "ok" +proxy_username: "ok" +proxy_password: "ok" +timeout: 123.123 +not_follow_redirects: yes +tls_ca: "ok" +tls_cert: "ok" +tls_key: "ok" +tls_skip_verify: yes diff --git a/src/go/collectors/go.d.plugin/modules/vcsa/vcsa.go b/src/go/plugin/go.d/modules/vcsa/vcsa.go index e13503bdb..aa12d7c60 100644 --- a/src/go/collectors/go.d.plugin/modules/vcsa/vcsa.go +++ b/src/go/plugin/go.d/modules/vcsa/vcsa.go @@ -7,8 +7,8 @@ import ( "errors" "time" - "github.com/netdata/netdata/go/go.d.plugin/agent/module" - "github.com/netdata/netdata/go/go.d.plugin/pkg/web" + "github.com/netdata/netdata/go/plugins/plugin/go.d/agent/module" + "github.com/netdata/netdata/go/plugins/plugin/go.d/pkg/web" ) //go:embed "config_schema.json" diff --git a/src/go/collectors/go.d.plugin/modules/vcsa/vcsa_test.go b/src/go/plugin/go.d/modules/vcsa/vcsa_test.go index ccd659665..2c51723d4 100644 --- a/src/go/collectors/go.d.plugin/modules/vcsa/vcsa_test.go +++ b/src/go/plugin/go.d/modules/vcsa/vcsa_test.go @@ -7,7 +7,7 @@ import ( "os" "testing" - "github.com/netdata/netdata/go/go.d.plugin/agent/module" + "github.com/netdata/netdata/go/plugins/plugin/go.d/agent/module" "github.com/stretchr/testify/assert" "github.com/stretchr/testify/require" diff --git a/src/go/collectors/go.d.plugin/modules/vernemq/README.md b/src/go/plugin/go.d/modules/vernemq/README.md index 3d984de71..3d984de71 120000 --- a/src/go/collectors/go.d.plugin/modules/vernemq/README.md +++ b/src/go/plugin/go.d/modules/vernemq/README.md diff --git a/src/go/collectors/go.d.plugin/modules/vernemq/charts.go b/src/go/plugin/go.d/modules/vernemq/charts.go index f94be0823..5d81a26bc 100644 --- a/src/go/collectors/go.d.plugin/modules/vernemq/charts.go +++ b/src/go/plugin/go.d/modules/vernemq/charts.go @@ -2,7 +2,7 @@ package vernemq -import "github.com/netdata/netdata/go/go.d.plugin/agent/module" +import "github.com/netdata/netdata/go/plugins/plugin/go.d/agent/module" type ( Charts = module.Charts diff --git a/src/go/collectors/go.d.plugin/modules/vernemq/collect.go b/src/go/plugin/go.d/modules/vernemq/collect.go index 4ec6a1bf2..c6fb3ecb9 100644 --- a/src/go/collectors/go.d.plugin/modules/vernemq/collect.go +++ b/src/go/plugin/go.d/modules/vernemq/collect.go @@ -6,8 +6,8 @@ import ( "errors" "strings" - "github.com/netdata/netdata/go/go.d.plugin/pkg/prometheus" - "github.com/netdata/netdata/go/go.d.plugin/pkg/stm" + "github.com/netdata/netdata/go/plugins/plugin/go.d/pkg/prometheus" + "github.com/netdata/netdata/go/plugins/plugin/go.d/pkg/stm" ) func isValidVerneMQMetrics(pms prometheus.Series) bool { diff --git a/src/go/collectors/go.d.plugin/modules/vernemq/config_schema.json b/src/go/plugin/go.d/modules/vernemq/config_schema.json index aa89d52f2..092d7f417 100644 --- a/src/go/collectors/go.d.plugin/modules/vernemq/config_schema.json +++ b/src/go/plugin/go.d/modules/vernemq/config_schema.json @@ -167,6 +167,12 @@ "timeout": { "ui:help": "Accepts decimals for precise control (e.g., type 1.5 for 1.5 seconds)." }, + "username": { + "ui:widget": "password" + }, + "proxy_username": { + "ui:widget": "password" + }, "password": { "ui:widget": "password" }, diff --git a/src/go/collectors/go.d.plugin/modules/vernemq/init.go b/src/go/plugin/go.d/modules/vernemq/init.go index 24d077fbd..64ed3418c 100644 --- a/src/go/collectors/go.d.plugin/modules/vernemq/init.go +++ b/src/go/plugin/go.d/modules/vernemq/init.go @@ -5,8 +5,8 @@ package vernemq import ( "errors" - "github.com/netdata/netdata/go/go.d.plugin/pkg/prometheus" - "github.com/netdata/netdata/go/go.d.plugin/pkg/web" + "github.com/netdata/netdata/go/plugins/plugin/go.d/pkg/prometheus" + "github.com/netdata/netdata/go/plugins/plugin/go.d/pkg/web" ) func (v *VerneMQ) validateConfig() error { diff --git a/src/go/collectors/go.d.plugin/modules/vernemq/integrations/vernemq.md b/src/go/plugin/go.d/modules/vernemq/integrations/vernemq.md index 883cec26e..f3b4c2877 100644 --- a/src/go/collectors/go.d.plugin/modules/vernemq/integrations/vernemq.md +++ b/src/go/plugin/go.d/modules/vernemq/integrations/vernemq.md @@ -1,6 +1,6 @@ <!--startmeta -custom_edit_url: "https://github.com/netdata/netdata/edit/master/src/go/collectors/go.d.plugin/modules/vernemq/README.md" -meta_yaml: "https://github.com/netdata/netdata/edit/master/src/go/collectors/go.d.plugin/modules/vernemq/metadata.yaml" +custom_edit_url: "https://github.com/netdata/netdata/edit/master/src/go/plugin/go.d/modules/vernemq/README.md" +meta_yaml: "https://github.com/netdata/netdata/edit/master/src/go/plugin/go.d/modules/vernemq/metadata.yaml" sidebar_label: "VerneMQ" learn_status: "Published" learn_rel_path: "Collecting Metrics/Message Brokers" @@ -272,6 +272,8 @@ jobs: ### Debug Mode +**Important**: Debug mode is not supported for data collection jobs created via the UI using the Dyncfg feature. + To troubleshoot issues with the `vernemq` collector, run the `go.d.plugin` with the debug option enabled. The output should give you clues as to why the collector isn't working. @@ -294,4 +296,37 @@ should give you clues as to why the collector isn't working. ./go.d.plugin -d -m vernemq ``` +### Getting Logs + +If you're encountering problems with the `vernemq` collector, follow these steps to retrieve logs and identify potential issues: + +- **Run the command** specific to your system (systemd, non-systemd, or Docker container). +- **Examine the output** for any warnings or error messages that might indicate issues. These messages should provide clues about the root cause of the problem. + +#### System with systemd + +Use the following command to view logs generated since the last Netdata service restart: + +```bash +journalctl _SYSTEMD_INVOCATION_ID="$(systemctl show --value --property=InvocationID netdata)" --namespace=netdata --grep vernemq +``` + +#### System without systemd + +Locate the collector log file, typically at `/var/log/netdata/collector.log`, and use `grep` to filter for collector's name: + +```bash +grep vernemq /var/log/netdata/collector.log +``` + +**Note**: This method shows logs from all restarts. Focus on the **latest entries** for troubleshooting current issues. + +#### Docker Container + +If your Netdata runs in a Docker container named "netdata" (replace if different), use this command: + +```bash +docker logs netdata 2>&1 | grep vernemq +``` + diff --git a/src/go/collectors/go.d.plugin/modules/vernemq/metadata.yaml b/src/go/plugin/go.d/modules/vernemq/metadata.yaml index 2ec25fb77..2ec25fb77 100644 --- a/src/go/collectors/go.d.plugin/modules/vernemq/metadata.yaml +++ b/src/go/plugin/go.d/modules/vernemq/metadata.yaml diff --git a/src/go/collectors/go.d.plugin/modules/vernemq/metrics.go b/src/go/plugin/go.d/modules/vernemq/metrics.go index 863cc6355..863cc6355 100644 --- a/src/go/collectors/go.d.plugin/modules/vernemq/metrics.go +++ b/src/go/plugin/go.d/modules/vernemq/metrics.go diff --git a/src/go/plugin/go.d/modules/vernemq/testdata/config.json b/src/go/plugin/go.d/modules/vernemq/testdata/config.json new file mode 100644 index 000000000..984c3ed6e --- /dev/null +++ b/src/go/plugin/go.d/modules/vernemq/testdata/config.json @@ -0,0 +1,20 @@ +{ + "update_every": 123, + "url": "ok", + "body": "ok", + "method": "ok", + "headers": { + "ok": "ok" + }, + "username": "ok", + "password": "ok", + "proxy_url": "ok", + "proxy_username": "ok", + "proxy_password": "ok", + "timeout": 123.123, + "not_follow_redirects": true, + "tls_ca": "ok", + "tls_cert": "ok", + "tls_key": "ok", + "tls_skip_verify": true +} diff --git a/src/go/plugin/go.d/modules/vernemq/testdata/config.yaml b/src/go/plugin/go.d/modules/vernemq/testdata/config.yaml new file mode 100644 index 000000000..8558b61cc --- /dev/null +++ b/src/go/plugin/go.d/modules/vernemq/testdata/config.yaml @@ -0,0 +1,17 @@ +update_every: 123 +url: "ok" +body: "ok" +method: "ok" +headers: + ok: "ok" +username: "ok" +password: "ok" +proxy_url: "ok" +proxy_username: "ok" +proxy_password: "ok" +timeout: 123.123 +not_follow_redirects: yes +tls_ca: "ok" +tls_cert: "ok" +tls_key: "ok" +tls_skip_verify: yes diff --git a/src/go/collectors/go.d.plugin/modules/vernemq/testdata/metrics-v1.10.1-mqtt5.txt b/src/go/plugin/go.d/modules/vernemq/testdata/metrics-v1.10.1-mqtt5.txt index 2e98a3e94..2e98a3e94 100644 --- a/src/go/collectors/go.d.plugin/modules/vernemq/testdata/metrics-v1.10.1-mqtt5.txt +++ b/src/go/plugin/go.d/modules/vernemq/testdata/metrics-v1.10.1-mqtt5.txt diff --git a/src/go/collectors/go.d.plugin/modules/vernemq/testdata/non_vernemq.txt b/src/go/plugin/go.d/modules/vernemq/testdata/non_vernemq.txt index f5f0ae082..f5f0ae082 100644 --- a/src/go/collectors/go.d.plugin/modules/vernemq/testdata/non_vernemq.txt +++ b/src/go/plugin/go.d/modules/vernemq/testdata/non_vernemq.txt diff --git a/src/go/collectors/go.d.plugin/modules/vernemq/vernemq.go b/src/go/plugin/go.d/modules/vernemq/vernemq.go index d5ea9e38e..2f1de38ff 100644 --- a/src/go/collectors/go.d.plugin/modules/vernemq/vernemq.go +++ b/src/go/plugin/go.d/modules/vernemq/vernemq.go @@ -7,9 +7,9 @@ import ( "errors" "time" - "github.com/netdata/netdata/go/go.d.plugin/agent/module" - "github.com/netdata/netdata/go/go.d.plugin/pkg/prometheus" - "github.com/netdata/netdata/go/go.d.plugin/pkg/web" + "github.com/netdata/netdata/go/plugins/plugin/go.d/agent/module" + "github.com/netdata/netdata/go/plugins/plugin/go.d/pkg/prometheus" + "github.com/netdata/netdata/go/plugins/plugin/go.d/pkg/web" ) //go:embed "config_schema.json" diff --git a/src/go/collectors/go.d.plugin/modules/vernemq/vernemq_test.go b/src/go/plugin/go.d/modules/vernemq/vernemq_test.go index 74974a26b..13eb3dceb 100644 --- a/src/go/collectors/go.d.plugin/modules/vernemq/vernemq_test.go +++ b/src/go/plugin/go.d/modules/vernemq/vernemq_test.go @@ -8,7 +8,7 @@ import ( "os" "testing" - "github.com/netdata/netdata/go/go.d.plugin/agent/module" + "github.com/netdata/netdata/go/plugins/plugin/go.d/agent/module" "github.com/stretchr/testify/assert" "github.com/stretchr/testify/require" diff --git a/src/go/collectors/go.d.plugin/modules/vsphere/README.md b/src/go/plugin/go.d/modules/vsphere/README.md index 0a6b0146e..0a6b0146e 120000 --- a/src/go/collectors/go.d.plugin/modules/vsphere/README.md +++ b/src/go/plugin/go.d/modules/vsphere/README.md diff --git a/src/go/collectors/go.d.plugin/modules/vsphere/charts.go b/src/go/plugin/go.d/modules/vsphere/charts.go index ed4db941d..3cc21bef4 100644 --- a/src/go/collectors/go.d.plugin/modules/vsphere/charts.go +++ b/src/go/plugin/go.d/modules/vsphere/charts.go @@ -6,8 +6,8 @@ import ( "fmt" "strings" - "github.com/netdata/netdata/go/go.d.plugin/agent/module" - rs "github.com/netdata/netdata/go/go.d.plugin/modules/vsphere/resources" + "github.com/netdata/netdata/go/plugins/plugin/go.d/agent/module" + rs "github.com/netdata/netdata/go/plugins/plugin/go.d/modules/vsphere/resources" ) const ( diff --git a/src/go/collectors/go.d.plugin/modules/vsphere/client/client.go b/src/go/plugin/go.d/modules/vsphere/client/client.go index 827351cf8..ba74eca94 100644 --- a/src/go/collectors/go.d.plugin/modules/vsphere/client/client.go +++ b/src/go/plugin/go.d/modules/vsphere/client/client.go @@ -8,7 +8,7 @@ import ( "net/url" "time" - "github.com/netdata/netdata/go/go.d.plugin/pkg/tlscfg" + "github.com/netdata/netdata/go/plugins/plugin/go.d/pkg/tlscfg" "github.com/vmware/govmomi" "github.com/vmware/govmomi/performance" diff --git a/src/go/collectors/go.d.plugin/modules/vsphere/client/client_test.go b/src/go/plugin/go.d/modules/vsphere/client/client_test.go index 163829f41..c82ce1993 100644 --- a/src/go/collectors/go.d.plugin/modules/vsphere/client/client_test.go +++ b/src/go/plugin/go.d/modules/vsphere/client/client_test.go @@ -8,7 +8,7 @@ import ( "testing" "time" - "github.com/netdata/netdata/go/go.d.plugin/pkg/tlscfg" + "github.com/netdata/netdata/go/plugins/plugin/go.d/pkg/tlscfg" "github.com/stretchr/testify/assert" "github.com/stretchr/testify/require" diff --git a/src/go/collectors/go.d.plugin/modules/vsphere/client/keepalive.go b/src/go/plugin/go.d/modules/vsphere/client/keepalive.go index 0ce1ef5c0..0ce1ef5c0 100644 --- a/src/go/collectors/go.d.plugin/modules/vsphere/client/keepalive.go +++ b/src/go/plugin/go.d/modules/vsphere/client/keepalive.go diff --git a/src/go/collectors/go.d.plugin/modules/vsphere/collect.go b/src/go/plugin/go.d/modules/vsphere/collect.go index 1aa9af9c1..e5672d3fd 100644 --- a/src/go/collectors/go.d.plugin/modules/vsphere/collect.go +++ b/src/go/plugin/go.d/modules/vsphere/collect.go @@ -7,7 +7,7 @@ import ( "fmt" "time" - rs "github.com/netdata/netdata/go/go.d.plugin/modules/vsphere/resources" + rs "github.com/netdata/netdata/go/plugins/plugin/go.d/modules/vsphere/resources" "github.com/vmware/govmomi/performance" ) diff --git a/src/go/collectors/go.d.plugin/modules/vsphere/config_schema.json b/src/go/plugin/go.d/modules/vsphere/config_schema.json index b338102c2..8902e73ed 100644 --- a/src/go/collectors/go.d.plugin/modules/vsphere/config_schema.json +++ b/src/go/plugin/go.d/modules/vsphere/config_schema.json @@ -220,6 +220,9 @@ "method": { "ui:widget": "hidden" }, + "update_every": { + "ui:help": "**Important**: vSphere generates real-time statistics every 20 seconds. Setting this value lower won't improve data accuracy. For larger vSphere deployments, consider increasing this value to ensure complete data collection during each cycle. To find the optimal value, run the collector in debug mode and see how long it takes to collect metrics." + }, "url": { "ui:placeholder": "https://203.0.113.0" }, @@ -233,7 +236,11 @@ "ui:listFlavour": "list" }, "username": { - "ui:placeholder": "admin@vsphere.local" + "ui:placeholder": "admin@vsphere.local", + "ui:widget": "password" + }, + "proxy_username": { + "ui:widget": "password" }, "password": { "ui:widget": "password" diff --git a/src/go/collectors/go.d.plugin/modules/vsphere/discover.go b/src/go/plugin/go.d/modules/vsphere/discover.go index 1ea0a4d6e..1ea0a4d6e 100644 --- a/src/go/collectors/go.d.plugin/modules/vsphere/discover.go +++ b/src/go/plugin/go.d/modules/vsphere/discover.go diff --git a/src/go/collectors/go.d.plugin/modules/vsphere/discover/build.go b/src/go/plugin/go.d/modules/vsphere/discover/build.go index 3bf9bfb48..dbd0baab2 100644 --- a/src/go/collectors/go.d.plugin/modules/vsphere/discover/build.go +++ b/src/go/plugin/go.d/modules/vsphere/discover/build.go @@ -5,7 +5,7 @@ package discover import ( "time" - rs "github.com/netdata/netdata/go/go.d.plugin/modules/vsphere/resources" + rs "github.com/netdata/netdata/go/plugins/plugin/go.d/modules/vsphere/resources" "github.com/vmware/govmomi/vim25/mo" ) diff --git a/src/go/collectors/go.d.plugin/modules/vsphere/discover/discover.go b/src/go/plugin/go.d/modules/vsphere/discover/discover.go index 0d68b71c3..f73c58c66 100644 --- a/src/go/collectors/go.d.plugin/modules/vsphere/discover/discover.go +++ b/src/go/plugin/go.d/modules/vsphere/discover/discover.go @@ -7,10 +7,10 @@ import ( "strings" "time" - "github.com/netdata/netdata/go/go.d.plugin/modules/vsphere/match" - rs "github.com/netdata/netdata/go/go.d.plugin/modules/vsphere/resources" + "github.com/netdata/netdata/go/plugins/plugin/go.d/modules/vsphere/match" + rs "github.com/netdata/netdata/go/plugins/plugin/go.d/modules/vsphere/resources" - "github.com/netdata/netdata/go/go.d.plugin/logger" + "github.com/netdata/netdata/go/plugins/logger" "github.com/vmware/govmomi/vim25/mo" "github.com/vmware/govmomi/vim25/types" ) diff --git a/src/go/collectors/go.d.plugin/modules/vsphere/discover/discover_test.go b/src/go/plugin/go.d/modules/vsphere/discover/discover_test.go index 01f83fd38..9d0df6077 100644 --- a/src/go/collectors/go.d.plugin/modules/vsphere/discover/discover_test.go +++ b/src/go/plugin/go.d/modules/vsphere/discover/discover_test.go @@ -8,9 +8,9 @@ import ( "testing" "time" - "github.com/netdata/netdata/go/go.d.plugin/modules/vsphere/client" - rs "github.com/netdata/netdata/go/go.d.plugin/modules/vsphere/resources" - "github.com/netdata/netdata/go/go.d.plugin/pkg/tlscfg" + "github.com/netdata/netdata/go/plugins/plugin/go.d/modules/vsphere/client" + rs "github.com/netdata/netdata/go/plugins/plugin/go.d/modules/vsphere/resources" + "github.com/netdata/netdata/go/plugins/plugin/go.d/pkg/tlscfg" "github.com/stretchr/testify/assert" "github.com/stretchr/testify/require" diff --git a/src/go/collectors/go.d.plugin/modules/vsphere/discover/filter.go b/src/go/plugin/go.d/modules/vsphere/discover/filter.go index 73c1481e3..f9fb5ba95 100644 --- a/src/go/collectors/go.d.plugin/modules/vsphere/discover/filter.go +++ b/src/go/plugin/go.d/modules/vsphere/discover/filter.go @@ -5,7 +5,7 @@ package discover import ( "time" - rs "github.com/netdata/netdata/go/go.d.plugin/modules/vsphere/resources" + rs "github.com/netdata/netdata/go/plugins/plugin/go.d/modules/vsphere/resources" ) func (d Discoverer) matchHost(host *rs.Host) bool { diff --git a/src/go/collectors/go.d.plugin/modules/vsphere/discover/hierarchy.go b/src/go/plugin/go.d/modules/vsphere/discover/hierarchy.go index 4cea75dcd..0f84da2df 100644 --- a/src/go/collectors/go.d.plugin/modules/vsphere/discover/hierarchy.go +++ b/src/go/plugin/go.d/modules/vsphere/discover/hierarchy.go @@ -5,7 +5,7 @@ package discover import ( "time" - rs "github.com/netdata/netdata/go/go.d.plugin/modules/vsphere/resources" + rs "github.com/netdata/netdata/go/plugins/plugin/go.d/modules/vsphere/resources" ) func (d Discoverer) setHierarchy(res *rs.Resources) error { diff --git a/src/go/collectors/go.d.plugin/modules/vsphere/discover/metric_lists.go b/src/go/plugin/go.d/modules/vsphere/discover/metric_lists.go index 0eecb81ea..03ae6d53a 100644 --- a/src/go/collectors/go.d.plugin/modules/vsphere/discover/metric_lists.go +++ b/src/go/plugin/go.d/modules/vsphere/discover/metric_lists.go @@ -6,7 +6,7 @@ import ( "sort" "time" - rs "github.com/netdata/netdata/go/go.d.plugin/modules/vsphere/resources" + rs "github.com/netdata/netdata/go/plugins/plugin/go.d/modules/vsphere/resources" "github.com/vmware/govmomi/performance" "github.com/vmware/govmomi/vim25/types" diff --git a/src/go/collectors/go.d.plugin/modules/vsphere/init.go b/src/go/plugin/go.d/modules/vsphere/init.go index eb98e92df..e9bfc4e5a 100644 --- a/src/go/collectors/go.d.plugin/modules/vsphere/init.go +++ b/src/go/plugin/go.d/modules/vsphere/init.go @@ -5,9 +5,9 @@ package vsphere import ( "errors" - "github.com/netdata/netdata/go/go.d.plugin/modules/vsphere/client" - "github.com/netdata/netdata/go/go.d.plugin/modules/vsphere/discover" - "github.com/netdata/netdata/go/go.d.plugin/modules/vsphere/scrape" + "github.com/netdata/netdata/go/plugins/plugin/go.d/modules/vsphere/client" + "github.com/netdata/netdata/go/plugins/plugin/go.d/modules/vsphere/discover" + "github.com/netdata/netdata/go/plugins/plugin/go.d/modules/vsphere/scrape" ) func (vs *VSphere) validateConfig() error { diff --git a/src/go/collectors/go.d.plugin/modules/vsphere/integrations/vmware_vcenter_server.md b/src/go/plugin/go.d/modules/vsphere/integrations/vmware_vcenter_server.md index 6d7465554..3f05eadfd 100644 --- a/src/go/collectors/go.d.plugin/modules/vsphere/integrations/vmware_vcenter_server.md +++ b/src/go/plugin/go.d/modules/vsphere/integrations/vmware_vcenter_server.md @@ -1,6 +1,6 @@ <!--startmeta -custom_edit_url: "https://github.com/netdata/netdata/edit/master/src/go/collectors/go.d.plugin/modules/vsphere/README.md" -meta_yaml: "https://github.com/netdata/netdata/edit/master/src/go/collectors/go.d.plugin/modules/vsphere/metadata.yaml" +custom_edit_url: "https://github.com/netdata/netdata/edit/master/src/go/plugin/go.d/modules/vsphere/README.md" +meta_yaml: "https://github.com/netdata/netdata/edit/master/src/go/plugin/go.d/modules/vsphere/metadata.yaml" sidebar_label: "VMware vCenter Server" learn_status: "Published" learn_rel_path: "Collecting Metrics/Containers and VMs" @@ -297,6 +297,8 @@ jobs: ### Debug Mode +**Important**: Debug mode is not supported for data collection jobs created via the UI using the Dyncfg feature. + To troubleshoot issues with the `vsphere` collector, run the `go.d.plugin` with the debug option enabled. The output should give you clues as to why the collector isn't working. @@ -319,4 +321,37 @@ should give you clues as to why the collector isn't working. ./go.d.plugin -d -m vsphere ``` +### Getting Logs + +If you're encountering problems with the `vsphere` collector, follow these steps to retrieve logs and identify potential issues: + +- **Run the command** specific to your system (systemd, non-systemd, or Docker container). +- **Examine the output** for any warnings or error messages that might indicate issues. These messages should provide clues about the root cause of the problem. + +#### System with systemd + +Use the following command to view logs generated since the last Netdata service restart: + +```bash +journalctl _SYSTEMD_INVOCATION_ID="$(systemctl show --value --property=InvocationID netdata)" --namespace=netdata --grep vsphere +``` + +#### System without systemd + +Locate the collector log file, typically at `/var/log/netdata/collector.log`, and use `grep` to filter for collector's name: + +```bash +grep vsphere /var/log/netdata/collector.log +``` + +**Note**: This method shows logs from all restarts. Focus on the **latest entries** for troubleshooting current issues. + +#### Docker Container + +If your Netdata runs in a Docker container named "netdata" (replace if different), use this command: + +```bash +docker logs netdata 2>&1 | grep vsphere +``` + diff --git a/src/go/collectors/go.d.plugin/modules/vsphere/match/match.go b/src/go/plugin/go.d/modules/vsphere/match/match.go index 846e6f371..969b5d7c5 100644 --- a/src/go/collectors/go.d.plugin/modules/vsphere/match/match.go +++ b/src/go/plugin/go.d/modules/vsphere/match/match.go @@ -6,8 +6,8 @@ import ( "fmt" "strings" - rs "github.com/netdata/netdata/go/go.d.plugin/modules/vsphere/resources" - "github.com/netdata/netdata/go/go.d.plugin/pkg/matcher" + rs "github.com/netdata/netdata/go/plugins/plugin/go.d/modules/vsphere/resources" + "github.com/netdata/netdata/go/plugins/plugin/go.d/pkg/matcher" ) type HostMatcher interface { diff --git a/src/go/collectors/go.d.plugin/modules/vsphere/match/match_test.go b/src/go/plugin/go.d/modules/vsphere/match/match_test.go index 6bfe91853..c11697783 100644 --- a/src/go/collectors/go.d.plugin/modules/vsphere/match/match_test.go +++ b/src/go/plugin/go.d/modules/vsphere/match/match_test.go @@ -6,8 +6,8 @@ import ( "strings" "testing" - "github.com/netdata/netdata/go/go.d.plugin/modules/vsphere/resources" - "github.com/netdata/netdata/go/go.d.plugin/pkg/matcher" + "github.com/netdata/netdata/go/plugins/plugin/go.d/modules/vsphere/resources" + "github.com/netdata/netdata/go/plugins/plugin/go.d/pkg/matcher" "github.com/stretchr/testify/assert" ) diff --git a/src/go/collectors/go.d.plugin/modules/vsphere/metadata.yaml b/src/go/plugin/go.d/modules/vsphere/metadata.yaml index b40c7af93..b40c7af93 100644 --- a/src/go/collectors/go.d.plugin/modules/vsphere/metadata.yaml +++ b/src/go/plugin/go.d/modules/vsphere/metadata.yaml diff --git a/src/go/collectors/go.d.plugin/modules/vsphere/metrics.txt b/src/go/plugin/go.d/modules/vsphere/metrics.txt index 30c1f55e2..30c1f55e2 100644 --- a/src/go/collectors/go.d.plugin/modules/vsphere/metrics.txt +++ b/src/go/plugin/go.d/modules/vsphere/metrics.txt diff --git a/src/go/collectors/go.d.plugin/modules/vsphere/resources/resources.go b/src/go/plugin/go.d/modules/vsphere/resources/resources.go index 8f967f16c..8f967f16c 100644 --- a/src/go/collectors/go.d.plugin/modules/vsphere/resources/resources.go +++ b/src/go/plugin/go.d/modules/vsphere/resources/resources.go diff --git a/src/go/collectors/go.d.plugin/modules/vsphere/scrape/scrape.go b/src/go/plugin/go.d/modules/vsphere/scrape/scrape.go index adda665cc..ef882d73e 100644 --- a/src/go/collectors/go.d.plugin/modules/vsphere/scrape/scrape.go +++ b/src/go/plugin/go.d/modules/vsphere/scrape/scrape.go @@ -9,9 +9,9 @@ import ( "sync" "time" - rs "github.com/netdata/netdata/go/go.d.plugin/modules/vsphere/resources" + rs "github.com/netdata/netdata/go/plugins/plugin/go.d/modules/vsphere/resources" - "github.com/netdata/netdata/go/go.d.plugin/logger" + "github.com/netdata/netdata/go/plugins/logger" "github.com/vmware/govmomi/performance" "github.com/vmware/govmomi/vim25/types" ) diff --git a/src/go/collectors/go.d.plugin/modules/vsphere/scrape/scrape_test.go b/src/go/plugin/go.d/modules/vsphere/scrape/scrape_test.go index 0576850f6..d6232ff66 100644 --- a/src/go/collectors/go.d.plugin/modules/vsphere/scrape/scrape_test.go +++ b/src/go/plugin/go.d/modules/vsphere/scrape/scrape_test.go @@ -8,10 +8,10 @@ import ( "testing" "time" - "github.com/netdata/netdata/go/go.d.plugin/modules/vsphere/client" - "github.com/netdata/netdata/go/go.d.plugin/modules/vsphere/discover" - rs "github.com/netdata/netdata/go/go.d.plugin/modules/vsphere/resources" - "github.com/netdata/netdata/go/go.d.plugin/pkg/tlscfg" + "github.com/netdata/netdata/go/plugins/plugin/go.d/modules/vsphere/client" + "github.com/netdata/netdata/go/plugins/plugin/go.d/modules/vsphere/discover" + rs "github.com/netdata/netdata/go/plugins/plugin/go.d/modules/vsphere/resources" + "github.com/netdata/netdata/go/plugins/plugin/go.d/pkg/tlscfg" "github.com/stretchr/testify/assert" "github.com/stretchr/testify/require" diff --git a/src/go/collectors/go.d.plugin/modules/vsphere/scrape/throttled_caller.go b/src/go/plugin/go.d/modules/vsphere/scrape/throttled_caller.go index 5127c28c1..5127c28c1 100644 --- a/src/go/collectors/go.d.plugin/modules/vsphere/scrape/throttled_caller.go +++ b/src/go/plugin/go.d/modules/vsphere/scrape/throttled_caller.go diff --git a/src/go/collectors/go.d.plugin/modules/vsphere/scrape/throttled_caller_test.go b/src/go/plugin/go.d/modules/vsphere/scrape/throttled_caller_test.go index 545ed1603..545ed1603 100644 --- a/src/go/collectors/go.d.plugin/modules/vsphere/scrape/throttled_caller_test.go +++ b/src/go/plugin/go.d/modules/vsphere/scrape/throttled_caller_test.go diff --git a/src/go/collectors/go.d.plugin/modules/vsphere/task.go b/src/go/plugin/go.d/modules/vsphere/task.go index 103ca1ed6..103ca1ed6 100644 --- a/src/go/collectors/go.d.plugin/modules/vsphere/task.go +++ b/src/go/plugin/go.d/modules/vsphere/task.go diff --git a/src/go/collectors/go.d.plugin/modules/vsphere/task_test.go b/src/go/plugin/go.d/modules/vsphere/task_test.go index ed55a28a3..ed55a28a3 100644 --- a/src/go/collectors/go.d.plugin/modules/vsphere/task_test.go +++ b/src/go/plugin/go.d/modules/vsphere/task_test.go diff --git a/src/go/collectors/go.d.plugin/modules/vsphere/testdata/config.json b/src/go/plugin/go.d/modules/vsphere/testdata/config.json index 3e4a77396..3e4a77396 100644 --- a/src/go/collectors/go.d.plugin/modules/vsphere/testdata/config.json +++ b/src/go/plugin/go.d/modules/vsphere/testdata/config.json diff --git a/src/go/collectors/go.d.plugin/modules/vsphere/testdata/config.yaml b/src/go/plugin/go.d/modules/vsphere/testdata/config.yaml index d15e2346f..d15e2346f 100644 --- a/src/go/collectors/go.d.plugin/modules/vsphere/testdata/config.yaml +++ b/src/go/plugin/go.d/modules/vsphere/testdata/config.yaml diff --git a/src/go/collectors/go.d.plugin/modules/vsphere/vsphere.go b/src/go/plugin/go.d/modules/vsphere/vsphere.go index 6473ac58d..8df3ce6f0 100644 --- a/src/go/collectors/go.d.plugin/modules/vsphere/vsphere.go +++ b/src/go/plugin/go.d/modules/vsphere/vsphere.go @@ -7,10 +7,10 @@ import ( "sync" "time" - "github.com/netdata/netdata/go/go.d.plugin/agent/module" - "github.com/netdata/netdata/go/go.d.plugin/modules/vsphere/match" - rs "github.com/netdata/netdata/go/go.d.plugin/modules/vsphere/resources" - "github.com/netdata/netdata/go/go.d.plugin/pkg/web" + "github.com/netdata/netdata/go/plugins/plugin/go.d/agent/module" + "github.com/netdata/netdata/go/plugins/plugin/go.d/modules/vsphere/match" + rs "github.com/netdata/netdata/go/plugins/plugin/go.d/modules/vsphere/resources" + "github.com/netdata/netdata/go/plugins/plugin/go.d/pkg/web" "github.com/vmware/govmomi/performance" ) diff --git a/src/go/plugin/go.d/modules/vsphere/vsphere_test.go b/src/go/plugin/go.d/modules/vsphere/vsphere_test.go new file mode 100644 index 000000000..c7a91e253 --- /dev/null +++ b/src/go/plugin/go.d/modules/vsphere/vsphere_test.go @@ -0,0 +1,489 @@ +// SPDX-License-Identifier: GPL-3.0-or-later +package vsphere + +import ( + "crypto/tls" + "os" + "strings" + "testing" + "time" + + "github.com/netdata/netdata/go/plugins/plugin/go.d/agent/module" + "github.com/netdata/netdata/go/plugins/plugin/go.d/modules/vsphere/discover" + "github.com/netdata/netdata/go/plugins/plugin/go.d/modules/vsphere/match" + rs "github.com/netdata/netdata/go/plugins/plugin/go.d/modules/vsphere/resources" + "github.com/netdata/netdata/go/plugins/plugin/go.d/pkg/web" + + "github.com/stretchr/testify/assert" + "github.com/stretchr/testify/require" + "github.com/vmware/govmomi/performance" + "github.com/vmware/govmomi/simulator" +) + +var ( + dataConfigJSON, _ = os.ReadFile("testdata/config.json") + dataConfigYAML, _ = os.ReadFile("testdata/config.yaml") +) + +func Test_testDataIsValid(t *testing.T) { + for name, data := range map[string][]byte{ + "dataConfigJSON": dataConfigJSON, + "dataConfigYAML": dataConfigYAML, + } { + require.NotNil(t, data, name) + } +} + +func TestVSphere_ConfigurationSerialize(t *testing.T) { + module.TestConfigurationSerialize(t, &VSphere{}, dataConfigJSON, dataConfigYAML) +} + +func TestVSphere_Init(t *testing.T) { + vSphere, _, teardown := prepareVSphereSim(t) + defer teardown() + + assert.NoError(t, vSphere.Init()) + assert.NotNil(t, vSphere.discoverer) + assert.NotNil(t, vSphere.scraper) + assert.NotNil(t, vSphere.resources) + assert.NotNil(t, vSphere.discoveryTask) + assert.True(t, vSphere.discoveryTask.isRunning()) +} + +func TestVSphere_Init_ReturnsFalseIfURLNotSet(t *testing.T) { + vSphere, _, teardown := prepareVSphereSim(t) + defer teardown() + vSphere.URL = "" + + assert.Error(t, vSphere.Init()) +} + +func TestVSphere_Init_ReturnsFalseIfUsernameNotSet(t *testing.T) { + vSphere, _, teardown := prepareVSphereSim(t) + defer teardown() + vSphere.Username = "" + + assert.Error(t, vSphere.Init()) +} + +func TestVSphere_Init_ReturnsFalseIfPasswordNotSet(t *testing.T) { + vSphere, _, teardown := prepareVSphereSim(t) + defer teardown() + vSphere.Password = "" + + assert.Error(t, vSphere.Init()) +} + +func TestVSphere_Init_ReturnsFalseIfClientWrongTLSCA(t *testing.T) { + vSphere, _, teardown := prepareVSphereSim(t) + defer teardown() + vSphere.Client.TLSConfig.TLSCA = "testdata/tls" + + assert.Error(t, vSphere.Init()) +} + +func TestVSphere_Init_ReturnsFalseIfConnectionRefused(t *testing.T) { + vSphere, _, teardown := prepareVSphereSim(t) + defer teardown() + vSphere.URL = "http://127.0.0.1:32001" + + assert.Error(t, vSphere.Init()) +} + +func TestVSphere_Init_ReturnsFalseIfInvalidHostVMIncludeFormat(t *testing.T) { + vSphere, _, teardown := prepareVSphereSim(t) + defer teardown() + + vSphere.HostsInclude = match.HostIncludes{"invalid"} + assert.Error(t, vSphere.Init()) + + vSphere.HostsInclude = vSphere.HostsInclude[:0] + + vSphere.VMsInclude = match.VMIncludes{"invalid"} + assert.Error(t, vSphere.Init()) +} + +func TestVSphere_Check(t *testing.T) { + assert.NoError(t, New().Check()) +} + +func TestVSphere_Charts(t *testing.T) { + assert.NotNil(t, New().Charts()) +} + +func TestVSphere_Cleanup(t *testing.T) { + vSphere, _, teardown := prepareVSphereSim(t) + defer teardown() + + require.NoError(t, vSphere.Init()) + + vSphere.Cleanup() + time.Sleep(time.Second) + assert.True(t, vSphere.discoveryTask.isStopped()) + assert.False(t, vSphere.discoveryTask.isRunning()) +} + +func TestVSphere_Cleanup_NotPanicsIfNotInitialized(t *testing.T) { + assert.NotPanics(t, New().Cleanup) +} + +func TestVSphere_Collect(t *testing.T) { + vSphere, model, teardown := prepareVSphereSim(t) + defer teardown() + + require.NoError(t, vSphere.Init()) + + vSphere.scraper = mockScraper{vSphere.scraper} + + expected := map[string]int64{ + "host-22_cpu.usage.average": 100, + "host-22_disk.maxTotalLatency.latest": 100, + "host-22_disk.read.average": 100, + "host-22_disk.write.average": 100, + "host-22_mem.active.average": 100, + "host-22_mem.consumed.average": 100, + "host-22_mem.granted.average": 100, + "host-22_mem.shared.average": 100, + "host-22_mem.sharedcommon.average": 100, + "host-22_mem.swapinRate.average": 100, + "host-22_mem.swapoutRate.average": 100, + "host-22_mem.usage.average": 100, + "host-22_net.bytesRx.average": 100, + "host-22_net.bytesTx.average": 100, + "host-22_net.droppedRx.summation": 100, + "host-22_net.droppedTx.summation": 100, + "host-22_net.errorsRx.summation": 100, + "host-22_net.errorsTx.summation": 100, + "host-22_net.packetsRx.summation": 100, + "host-22_net.packetsTx.summation": 100, + "host-22_overall.status.gray": 1, + "host-22_overall.status.green": 0, + "host-22_overall.status.red": 0, + "host-22_overall.status.yellow": 0, + "host-22_sys.uptime.latest": 100, + "host-38_cpu.usage.average": 100, + "host-38_disk.maxTotalLatency.latest": 100, + "host-38_disk.read.average": 100, + "host-38_disk.write.average": 100, + "host-38_mem.active.average": 100, + "host-38_mem.consumed.average": 100, + "host-38_mem.granted.average": 100, + "host-38_mem.shared.average": 100, + "host-38_mem.sharedcommon.average": 100, + "host-38_mem.swapinRate.average": 100, + "host-38_mem.swapoutRate.average": 100, + "host-38_mem.usage.average": 100, + "host-38_net.bytesRx.average": 100, + "host-38_net.bytesTx.average": 100, + "host-38_net.droppedRx.summation": 100, + "host-38_net.droppedTx.summation": 100, + "host-38_net.errorsRx.summation": 100, + "host-38_net.errorsTx.summation": 100, + "host-38_net.packetsRx.summation": 100, + "host-38_net.packetsTx.summation": 100, + "host-38_overall.status.gray": 1, + "host-38_overall.status.green": 0, + "host-38_overall.status.red": 0, + "host-38_overall.status.yellow": 0, + "host-38_sys.uptime.latest": 100, + "host-48_cpu.usage.average": 100, + "host-48_disk.maxTotalLatency.latest": 100, + "host-48_disk.read.average": 100, + "host-48_disk.write.average": 100, + "host-48_mem.active.average": 100, + "host-48_mem.consumed.average": 100, + "host-48_mem.granted.average": 100, + "host-48_mem.shared.average": 100, + "host-48_mem.sharedcommon.average": 100, + "host-48_mem.swapinRate.average": 100, + "host-48_mem.swapoutRate.average": 100, + "host-48_mem.usage.average": 100, + "host-48_net.bytesRx.average": 100, + "host-48_net.bytesTx.average": 100, + "host-48_net.droppedRx.summation": 100, + "host-48_net.droppedTx.summation": 100, + "host-48_net.errorsRx.summation": 100, + "host-48_net.errorsTx.summation": 100, + "host-48_net.packetsRx.summation": 100, + "host-48_net.packetsTx.summation": 100, + "host-48_overall.status.gray": 1, + "host-48_overall.status.green": 0, + "host-48_overall.status.red": 0, + "host-48_overall.status.yellow": 0, + "host-48_sys.uptime.latest": 100, + "host-58_cpu.usage.average": 100, + "host-58_disk.maxTotalLatency.latest": 100, + "host-58_disk.read.average": 100, + "host-58_disk.write.average": 100, + "host-58_mem.active.average": 100, + "host-58_mem.consumed.average": 100, + "host-58_mem.granted.average": 100, + "host-58_mem.shared.average": 100, + "host-58_mem.sharedcommon.average": 100, + "host-58_mem.swapinRate.average": 100, + "host-58_mem.swapoutRate.average": 100, + "host-58_mem.usage.average": 100, + "host-58_net.bytesRx.average": 100, + "host-58_net.bytesTx.average": 100, + "host-58_net.droppedRx.summation": 100, + "host-58_net.droppedTx.summation": 100, + "host-58_net.errorsRx.summation": 100, + "host-58_net.errorsTx.summation": 100, + "host-58_net.packetsRx.summation": 100, + "host-58_net.packetsTx.summation": 100, + "host-58_overall.status.gray": 1, + "host-58_overall.status.green": 0, + "host-58_overall.status.red": 0, + "host-58_overall.status.yellow": 0, + "host-58_sys.uptime.latest": 100, + "vm-63_cpu.usage.average": 200, + "vm-63_disk.maxTotalLatency.latest": 200, + "vm-63_disk.read.average": 200, + "vm-63_disk.write.average": 200, + "vm-63_mem.active.average": 200, + "vm-63_mem.consumed.average": 200, + "vm-63_mem.granted.average": 200, + "vm-63_mem.shared.average": 200, + "vm-63_mem.swapinRate.average": 200, + "vm-63_mem.swapoutRate.average": 200, + "vm-63_mem.swapped.average": 200, + "vm-63_mem.usage.average": 200, + "vm-63_net.bytesRx.average": 200, + "vm-63_net.bytesTx.average": 200, + "vm-63_net.droppedRx.summation": 200, + "vm-63_net.droppedTx.summation": 200, + "vm-63_net.packetsRx.summation": 200, + "vm-63_net.packetsTx.summation": 200, + "vm-63_overall.status.gray": 0, + "vm-63_overall.status.green": 1, + "vm-63_overall.status.red": 0, + "vm-63_overall.status.yellow": 0, + "vm-63_sys.uptime.latest": 200, + "vm-66_cpu.usage.average": 200, + "vm-66_disk.maxTotalLatency.latest": 200, + "vm-66_disk.read.average": 200, + "vm-66_disk.write.average": 200, + "vm-66_mem.active.average": 200, + "vm-66_mem.consumed.average": 200, + "vm-66_mem.granted.average": 200, + "vm-66_mem.shared.average": 200, + "vm-66_mem.swapinRate.average": 200, + "vm-66_mem.swapoutRate.average": 200, + "vm-66_mem.swapped.average": 200, + "vm-66_mem.usage.average": 200, + "vm-66_net.bytesRx.average": 200, + "vm-66_net.bytesTx.average": 200, + "vm-66_net.droppedRx.summation": 200, + "vm-66_net.droppedTx.summation": 200, + "vm-66_net.packetsRx.summation": 200, + "vm-66_net.packetsTx.summation": 200, + "vm-66_overall.status.gray": 0, + "vm-66_overall.status.green": 1, + "vm-66_overall.status.red": 0, + "vm-66_overall.status.yellow": 0, + "vm-66_sys.uptime.latest": 200, + "vm-69_cpu.usage.average": 200, + "vm-69_disk.maxTotalLatency.latest": 200, + "vm-69_disk.read.average": 200, + "vm-69_disk.write.average": 200, + "vm-69_mem.active.average": 200, + "vm-69_mem.consumed.average": 200, + "vm-69_mem.granted.average": 200, + "vm-69_mem.shared.average": 200, + "vm-69_mem.swapinRate.average": 200, + "vm-69_mem.swapoutRate.average": 200, + "vm-69_mem.swapped.average": 200, + "vm-69_mem.usage.average": 200, + "vm-69_net.bytesRx.average": 200, + "vm-69_net.bytesTx.average": 200, + "vm-69_net.droppedRx.summation": 200, + "vm-69_net.droppedTx.summation": 200, + "vm-69_net.packetsRx.summation": 200, + "vm-69_net.packetsTx.summation": 200, + "vm-69_overall.status.gray": 0, + "vm-69_overall.status.green": 1, + "vm-69_overall.status.red": 0, + "vm-69_overall.status.yellow": 0, + "vm-69_sys.uptime.latest": 200, + "vm-72_cpu.usage.average": 200, + "vm-72_disk.maxTotalLatency.latest": 200, + "vm-72_disk.read.average": 200, + "vm-72_disk.write.average": 200, + "vm-72_mem.active.average": 200, + "vm-72_mem.consumed.average": 200, + "vm-72_mem.granted.average": 200, + "vm-72_mem.shared.average": 200, + "vm-72_mem.swapinRate.average": 200, + "vm-72_mem.swapoutRate.average": 200, + "vm-72_mem.swapped.average": 200, + "vm-72_mem.usage.average": 200, + "vm-72_net.bytesRx.average": 200, + "vm-72_net.bytesTx.average": 200, + "vm-72_net.droppedRx.summation": 200, + "vm-72_net.droppedTx.summation": 200, + "vm-72_net.packetsRx.summation": 200, + "vm-72_net.packetsTx.summation": 200, + "vm-72_overall.status.gray": 0, + "vm-72_overall.status.green": 1, + "vm-72_overall.status.red": 0, + "vm-72_overall.status.yellow": 0, + "vm-72_sys.uptime.latest": 200, + } + + collected := vSphere.Collect() + + require.Equal(t, expected, collected) + + count := model.Count() + assert.Len(t, vSphere.discoveredHosts, count.Host) + assert.Len(t, vSphere.discoveredVMs, count.Machine) + assert.Len(t, vSphere.charted, count.Host+count.Machine) + + assert.Len(t, *vSphere.Charts(), count.Host*len(hostChartsTmpl)+count.Machine*len(vmChartsTmpl)) + ensureCollectedHasAllChartsDimsVarsIDs(t, vSphere, collected) +} + +func TestVSphere_Collect_RemoveHostsVMsInRuntime(t *testing.T) { + vSphere, _, teardown := prepareVSphereSim(t) + defer teardown() + + require.NoError(t, vSphere.Init()) + require.NoError(t, vSphere.Check()) + + okHostID := "host-58" + okVMID := "vm-63" + vSphere.discoverer.(*discover.Discoverer).HostMatcher = mockHostMatcher{okHostID} + vSphere.discoverer.(*discover.Discoverer).VMMatcher = mockVMMatcher{okVMID} + + require.NoError(t, vSphere.discoverOnce()) + + numOfRuns := 5 + for i := 0; i < numOfRuns; i++ { + vSphere.Collect() + } + + host := vSphere.resources.Hosts.Get(okHostID) + for k, v := range vSphere.discoveredHosts { + if k == host.ID { + assert.Equal(t, 0, v) + } else { + assert.Equal(t, numOfRuns, v) + } + } + + vm := vSphere.resources.VMs.Get(okVMID) + for id, fails := range vSphere.discoveredVMs { + if id == vm.ID { + assert.Equal(t, 0, fails) + } else { + assert.Equal(t, numOfRuns, fails) + } + + } + + for i := numOfRuns; i < failedUpdatesLimit; i++ { + vSphere.Collect() + } + + assert.Len(t, vSphere.discoveredHosts, 1) + assert.Len(t, vSphere.discoveredVMs, 1) + assert.Len(t, vSphere.charted, 2) + + for _, c := range *vSphere.Charts() { + if strings.HasPrefix(c.ID, okHostID) || strings.HasPrefix(c.ID, okVMID) { + assert.False(t, c.Obsolete) + } else { + assert.True(t, c.Obsolete) + } + } +} + +func TestVSphere_Collect_Run(t *testing.T) { + vSphere, model, teardown := prepareVSphereSim(t) + defer teardown() + + vSphere.DiscoveryInterval = web.Duration(time.Second * 2) + require.NoError(t, vSphere.Init()) + require.NoError(t, vSphere.Check()) + + runs := 20 + for i := 0; i < runs; i++ { + assert.True(t, len(vSphere.Collect()) > 0) + if i < 6 { + time.Sleep(time.Second) + } + } + + count := model.Count() + assert.Len(t, vSphere.discoveredHosts, count.Host) + assert.Len(t, vSphere.discoveredVMs, count.Machine) + assert.Len(t, vSphere.charted, count.Host+count.Machine) + assert.Len(t, *vSphere.charts, count.Host*len(hostChartsTmpl)+count.Machine*len(vmChartsTmpl)) +} + +func ensureCollectedHasAllChartsDimsVarsIDs(t *testing.T, vSphere *VSphere, collected map[string]int64) { + for _, chart := range *vSphere.Charts() { + for _, dim := range chart.Dims { + _, ok := collected[dim.ID] + assert.Truef(t, ok, "collected metrics has no data for dim '%s' chart '%s'", dim.ID, chart.ID) + } + for _, v := range chart.Vars { + _, ok := collected[v.ID] + assert.Truef(t, ok, "collected metrics has no data for var '%s' chart '%s'", v.ID, chart.ID) + } + } +} + +func prepareVSphereSim(t *testing.T) (vSphere *VSphere, model *simulator.Model, teardown func()) { + model, srv := createSim(t) + vSphere = New() + teardown = func() { model.Remove(); srv.Close(); vSphere.Cleanup() } + + vSphere.Username = "administrator" + vSphere.Password = "password" + vSphere.URL = srv.URL.String() + vSphere.TLSConfig.InsecureSkipVerify = true + + return vSphere, model, teardown +} + +func createSim(t *testing.T) (*simulator.Model, *simulator.Server) { + model := simulator.VPX() + err := model.Create() + require.NoError(t, err) + model.Service.TLS = new(tls.Config) + return model, model.Service.NewServer() +} + +type mockScraper struct { + scraper +} + +func (s mockScraper) ScrapeHosts(hosts rs.Hosts) []performance.EntityMetric { + ms := s.scraper.ScrapeHosts(hosts) + return populateMetrics(ms, 100) +} +func (s mockScraper) ScrapeVMs(vms rs.VMs) []performance.EntityMetric { + ms := s.scraper.ScrapeVMs(vms) + return populateMetrics(ms, 200) +} + +func populateMetrics(ms []performance.EntityMetric, value int64) []performance.EntityMetric { + for i := range ms { + for ii := range ms[i].Value { + v := &ms[i].Value[ii].Value + if *v == nil { + *v = append(*v, value) + } else { + (*v)[0] = value + } + } + } + return ms +} + +type mockHostMatcher struct{ name string } +type mockVMMatcher struct{ name string } + +func (m mockHostMatcher) Match(host *rs.Host) bool { return m.name == host.ID } +func (m mockVMMatcher) Match(vm *rs.VM) bool { return m.name == vm.ID } diff --git a/src/go/collectors/go.d.plugin/modules/weblog/README.md b/src/go/plugin/go.d/modules/weblog/README.md index 9da3f21c2..9da3f21c2 120000 --- a/src/go/collectors/go.d.plugin/modules/weblog/README.md +++ b/src/go/plugin/go.d/modules/weblog/README.md diff --git a/src/go/collectors/go.d.plugin/modules/weblog/charts.go b/src/go/plugin/go.d/modules/weblog/charts.go index 749a26ce7..c7d5a7673 100644 --- a/src/go/collectors/go.d.plugin/modules/weblog/charts.go +++ b/src/go/plugin/go.d/modules/weblog/charts.go @@ -6,7 +6,7 @@ import ( "errors" "fmt" - "github.com/netdata/netdata/go/go.d.plugin/agent/module" + "github.com/netdata/netdata/go/plugins/plugin/go.d/agent/module" ) type ( diff --git a/src/go/collectors/go.d.plugin/modules/weblog/collect.go b/src/go/plugin/go.d/modules/weblog/collect.go index fd7993f26..8f6bceb0f 100644 --- a/src/go/collectors/go.d.plugin/modules/weblog/collect.go +++ b/src/go/plugin/go.d/modules/weblog/collect.go @@ -10,10 +10,10 @@ import ( "strconv" "strings" - "github.com/netdata/netdata/go/go.d.plugin/pkg/logs" - "github.com/netdata/netdata/go/go.d.plugin/pkg/stm" + "github.com/netdata/netdata/go/plugins/plugin/go.d/pkg/logs" + "github.com/netdata/netdata/go/plugins/plugin/go.d/pkg/stm" - "github.com/netdata/netdata/go/go.d.plugin/agent/module" + "github.com/netdata/netdata/go/plugins/plugin/go.d/agent/module" ) func (w *WebLog) logPanicStackIfAny() { diff --git a/src/go/collectors/go.d.plugin/modules/weblog/config_schema.json b/src/go/plugin/go.d/modules/weblog/config_schema.json index 845eecf46..61da661a4 100644 --- a/src/go/collectors/go.d.plugin/modules/weblog/config_schema.json +++ b/src/go/plugin/go.d/modules/weblog/config_schema.json @@ -71,7 +71,7 @@ }, "match": { "title": "Pattern", - "description": "The [pattern string](https://github.com/netdata/netdata/tree/master/src/go/collectors/go.d.plugin/pkg/matcher#readme) used to match against the full original request URI.", + "description": "The [pattern string](https://github.com/netdata/netdata/tree/master/src/go/plugin/go.d/pkg/matcher#readme) used to match against the full original request URI.", "type": "string" } }, @@ -123,7 +123,7 @@ }, "match": { "title": "Pattern", - "description": "The [pattern string](https://github.com/netdata/netdata/tree/master/src/go/collectors/go.d.plugin/pkg/matcher#readme) used to match against the field value.", + "description": "The [pattern string](https://github.com/netdata/netdata/tree/master/src/go/plugin/go.d/pkg/matcher#readme) used to match against the field value.", "type": "string" } }, diff --git a/src/go/collectors/go.d.plugin/modules/weblog/init.go b/src/go/plugin/go.d/modules/weblog/init.go index b456c817a..c76e43f30 100644 --- a/src/go/collectors/go.d.plugin/modules/weblog/init.go +++ b/src/go/plugin/go.d/modules/weblog/init.go @@ -7,8 +7,8 @@ import ( "fmt" "strings" - "github.com/netdata/netdata/go/go.d.plugin/pkg/logs" - "github.com/netdata/netdata/go/go.d.plugin/pkg/matcher" + "github.com/netdata/netdata/go/plugins/plugin/go.d/pkg/logs" + "github.com/netdata/netdata/go/plugins/plugin/go.d/pkg/matcher" ) type pattern struct { diff --git a/src/go/collectors/go.d.plugin/modules/weblog/integrations/web_server_log_files.md b/src/go/plugin/go.d/modules/weblog/integrations/web_server_log_files.md index a433c6dd2..740af5f1d 100644 --- a/src/go/collectors/go.d.plugin/modules/weblog/integrations/web_server_log_files.md +++ b/src/go/plugin/go.d/modules/weblog/integrations/web_server_log_files.md @@ -1,6 +1,6 @@ <!--startmeta -custom_edit_url: "https://github.com/netdata/netdata/edit/master/src/go/collectors/go.d.plugin/modules/weblog/README.md" -meta_yaml: "https://github.com/netdata/netdata/edit/master/src/go/collectors/go.d.plugin/modules/weblog/metadata.yaml" +custom_edit_url: "https://github.com/netdata/netdata/edit/master/src/go/plugin/go.d/modules/weblog/README.md" +meta_yaml: "https://github.com/netdata/netdata/edit/master/src/go/plugin/go.d/modules/weblog/metadata.yaml" sidebar_label: "Web server log files" learn_status: "Published" learn_rel_path: "Collecting Metrics/Web Servers and Web Proxies" @@ -216,20 +216,19 @@ Notes: | exclude_path | Path to exclude. | *.gz | no | | url_patterns | List of URL patterns. | [] | no | | url_patterns.name | Used as a dimension name. | | yes | -| url_patterns.pattern | Used to match against full original request URI. Pattern syntax in [matcher](https://github.com/netdata/netdata/tree/master/src/go/collectors/go.d.plugin/pkg/matcher#supported-format). | | yes | -| parser | Log parser configuration. | | no | -| parser.log_type | Log parser type. | auto | no | -| parser.csv_config | CSV log parser config. | | no | -| parser.csv_config.delimiter | CSV field delimiter. | , | no | -| parser.csv_config.format | CSV log format. | | no | -| parser.ltsv_config | LTSV log parser config. | | no | -| parser.ltsv_config.field_delimiter | LTSV field delimiter. | \t | no | -| parser.ltsv_config.value_delimiter | LTSV value delimiter. | : | no | -| parser.ltsv_config.mapping | LTSV fields mapping to **known fields**. | | yes | -| parser.json_config | JSON log parser config. | | no | -| parser.json_config.mapping | JSON fields mapping to **known fields**. | | yes | -| parser.regexp_config | RegExp log parser config. | | no | -| parser.regexp_config.pattern | RegExp pattern with named groups. | | yes | +| url_patterns.pattern | Used to match against full original request URI. Pattern syntax in [matcher](https://github.com/netdata/netdata/tree/master/src/go/plugin/go.d/pkg/matcher#supported-format). | | yes | +| log_type | Log parser type. | auto | no | +| csv_config | CSV log parser config. | | no | +| csv_config.delimiter | CSV field delimiter. | , | no | +| csv_config.format | CSV log format. | | no | +| ltsv_config | LTSV log parser config. | | no | +| ltsv_config.field_delimiter | LTSV field delimiter. | \t | no | +| ltsv_config.value_delimiter | LTSV value delimiter. | : | no | +| ltsv_config.mapping | LTSV fields mapping to **known fields**. | | yes | +| json_config | JSON log parser config. | | no | +| json_config.mapping | JSON fields mapping to **known fields**. | | yes | +| regexp_config | RegExp log parser config. | | no | +| regexp_config.pattern | RegExp pattern with named groups. | | yes | ##### url_patterns @@ -246,7 +245,7 @@ url_patterns: ``` -##### parser.log_type +##### log_type Weblog supports 5 different log parsers: @@ -261,8 +260,7 @@ Weblog supports 5 different log parsers: Syntax: ```yaml -parser: - log_type: auto +log_type: auto ``` If `log_type` parameter set to `auto` (which is default), weblog will try to auto-detect appropriate log parser and log format using the last line of the log file. @@ -287,43 +285,41 @@ If `log_type` parameter set to `auto` (which is default), weblog will try to aut If you're using the default Apache/NGINX log format, auto-detect will work for you. If it doesn't work you need to set the format manually. -##### parser.csv_config.format +##### csv_config.format -##### parser.ltsv_config.mapping +##### ltsv_config.mapping The mapping is a dictionary where the key is a field, as in logs, and the value is the corresponding **known field**. > **Note**: don't use `$` and `%` prefixes for mapped field names. ```yaml -parser: - log_type: ltsv - ltsv_config: - mapping: - label1: field1 - label2: field2 +log_type: ltsv +ltsv_config: + mapping: + label1: field1 + label2: field2 ``` -##### parser.json_config.mapping +##### json_config.mapping The mapping is a dictionary where the key is a field, as in logs, and the value is the corresponding **known field**. > **Note**: don't use `$` and `%` prefixes for mapped field names. ```yaml -parser: - log_type: json - json_config: - mapping: - label1: field1 - label2: field2 +log_type: json +json_config: + mapping: + label1: field1 + label2: field2 ``` -##### parser.regexp_config.pattern +##### regexp_config.pattern Use pattern with subexpressions names. These names should be **known fields**. @@ -332,10 +328,9 @@ Use pattern with subexpressions names. These names should be **known fields**. Syntax: ```yaml -parser: - log_type: regexp - regexp_config: - pattern: PATTERN +log_type: regexp +regexp_config: + pattern: PATTERN ``` @@ -350,6 +345,8 @@ There are no configuration examples. ### Debug Mode +**Important**: Debug mode is not supported for data collection jobs created via the UI using the Dyncfg feature. + To troubleshoot issues with the `web_log` collector, run the `go.d.plugin` with the debug option enabled. The output should give you clues as to why the collector isn't working. @@ -372,4 +369,37 @@ should give you clues as to why the collector isn't working. ./go.d.plugin -d -m web_log ``` +### Getting Logs + +If you're encountering problems with the `web_log` collector, follow these steps to retrieve logs and identify potential issues: + +- **Run the command** specific to your system (systemd, non-systemd, or Docker container). +- **Examine the output** for any warnings or error messages that might indicate issues. These messages should provide clues about the root cause of the problem. + +#### System with systemd + +Use the following command to view logs generated since the last Netdata service restart: + +```bash +journalctl _SYSTEMD_INVOCATION_ID="$(systemctl show --value --property=InvocationID netdata)" --namespace=netdata --grep web_log +``` + +#### System without systemd + +Locate the collector log file, typically at `/var/log/netdata/collector.log`, and use `grep` to filter for collector's name: + +```bash +grep web_log /var/log/netdata/collector.log +``` + +**Note**: This method shows logs from all restarts. Focus on the **latest entries** for troubleshooting current issues. + +#### Docker Container + +If your Netdata runs in a Docker container named "netdata" (replace if different), use this command: + +```bash +docker logs netdata 2>&1 | grep web_log +``` + diff --git a/src/go/collectors/go.d.plugin/modules/weblog/logline.go b/src/go/plugin/go.d/modules/weblog/logline.go index 5a69593b9..5a69593b9 100644 --- a/src/go/collectors/go.d.plugin/modules/weblog/logline.go +++ b/src/go/plugin/go.d/modules/weblog/logline.go diff --git a/src/go/collectors/go.d.plugin/modules/weblog/logline_test.go b/src/go/plugin/go.d/modules/weblog/logline_test.go index d3055863a..d3055863a 100644 --- a/src/go/collectors/go.d.plugin/modules/weblog/logline_test.go +++ b/src/go/plugin/go.d/modules/weblog/logline_test.go diff --git a/src/go/collectors/go.d.plugin/modules/weblog/metadata.yaml b/src/go/plugin/go.d/modules/weblog/metadata.yaml index 1cb4820a3..7608b936c 100644 --- a/src/go/collectors/go.d.plugin/modules/weblog/metadata.yaml +++ b/src/go/plugin/go.d/modules/weblog/metadata.yaml @@ -124,14 +124,10 @@ modules: default_value: "" required: true - name: url_patterns.pattern - description: Used to match against full original request URI. Pattern syntax in [matcher](https://github.com/netdata/netdata/tree/master/src/go/collectors/go.d.plugin/pkg/matcher#supported-format). + description: Used to match against full original request URI. Pattern syntax in [matcher](https://github.com/netdata/netdata/tree/master/src/go/plugin/go.d/pkg/matcher#supported-format). default_value: "" required: true - - name: parser - description: Log parser configuration. - default_value: "" - required: false - - name: parser.log_type + - name: log_type description: Log parser type. default_value: auto required: false @@ -149,8 +145,7 @@ modules: Syntax: ```yaml - parser: - log_type: auto + log_type: auto ``` If `log_type` parameter set to `auto` (which is default), weblog will try to auto-detect appropriate log parser and log format using the last line of the log file. @@ -173,32 +168,32 @@ modules: ``` If you're using the default Apache/NGINX log format, auto-detect will work for you. If it doesn't work you need to set the format manually. - - name: parser.csv_config + - name: csv_config description: CSV log parser config. default_value: "" required: false - - name: parser.csv_config.delimiter + - name: csv_config.delimiter description: CSV field delimiter. default_value: "," required: false - - name: parser.csv_config.format + - name: csv_config.format description: CSV log format. default_value: "" required: false detailed_description: "" - - name: parser.ltsv_config + - name: ltsv_config description: LTSV log parser config. default_value: "" required: false - - name: parser.ltsv_config.field_delimiter + - name: ltsv_config.field_delimiter description: LTSV field delimiter. default_value: "\\t" required: false - - name: parser.ltsv_config.value_delimiter + - name: ltsv_config.value_delimiter description: LTSV value delimiter. default_value: ":" required: false - - name: parser.ltsv_config.mapping + - name: ltsv_config.mapping description: LTSV fields mapping to **known fields**. default_value: "" required: true @@ -208,18 +203,17 @@ modules: > **Note**: don't use `$` and `%` prefixes for mapped field names. ```yaml - parser: - log_type: ltsv - ltsv_config: - mapping: - label1: field1 - label2: field2 + log_type: ltsv + ltsv_config: + mapping: + label1: field1 + label2: field2 ``` - - name: parser.json_config + - name: json_config description: JSON log parser config. default_value: "" required: false - - name: parser.json_config.mapping + - name: json_config.mapping description: JSON fields mapping to **known fields**. default_value: "" required: true @@ -229,18 +223,17 @@ modules: > **Note**: don't use `$` and `%` prefixes for mapped field names. ```yaml - parser: - log_type: json - json_config: - mapping: - label1: field1 - label2: field2 + log_type: json + json_config: + mapping: + label1: field1 + label2: field2 ``` - - name: parser.regexp_config + - name: regexp_config description: RegExp log parser config. default_value: "" required: false - - name: parser.regexp_config.pattern + - name: regexp_config.pattern description: RegExp pattern with named groups. default_value: "" required: true @@ -252,10 +245,9 @@ modules: Syntax: ```yaml - parser: - log_type: regexp - regexp_config: - pattern: PATTERN + log_type: regexp + regexp_config: + pattern: PATTERN ``` examples: folding: diff --git a/src/go/collectors/go.d.plugin/modules/weblog/metrics.go b/src/go/plugin/go.d/modules/weblog/metrics.go index 651221a99..30618df8a 100644 --- a/src/go/collectors/go.d.plugin/modules/weblog/metrics.go +++ b/src/go/plugin/go.d/modules/weblog/metrics.go @@ -3,7 +3,7 @@ package weblog import ( - "github.com/netdata/netdata/go/go.d.plugin/pkg/metrics" + "github.com/netdata/netdata/go/plugins/plugin/go.d/pkg/metrics" ) func newWebLogSummary() metrics.Summary { diff --git a/src/go/collectors/go.d.plugin/modules/weblog/parser.go b/src/go/plugin/go.d/modules/weblog/parser.go index b152e4129..f765b1e03 100644 --- a/src/go/collectors/go.d.plugin/modules/weblog/parser.go +++ b/src/go/plugin/go.d/modules/weblog/parser.go @@ -8,7 +8,7 @@ import ( "regexp" "strings" - "github.com/netdata/netdata/go/go.d.plugin/pkg/logs" + "github.com/netdata/netdata/go/plugins/plugin/go.d/pkg/logs" ) /* diff --git a/src/go/collectors/go.d.plugin/modules/weblog/parser_test.go b/src/go/plugin/go.d/modules/weblog/parser_test.go index 501df22ae..1ccbc020d 100644 --- a/src/go/collectors/go.d.plugin/modules/weblog/parser_test.go +++ b/src/go/plugin/go.d/modules/weblog/parser_test.go @@ -6,7 +6,7 @@ import ( "fmt" "testing" - "github.com/netdata/netdata/go/go.d.plugin/pkg/logs" + "github.com/netdata/netdata/go/plugins/plugin/go.d/pkg/logs" "github.com/stretchr/testify/assert" "github.com/stretchr/testify/require" diff --git a/src/go/collectors/go.d.plugin/modules/weblog/testdata/common.log b/src/go/plugin/go.d/modules/weblog/testdata/common.log index 6860d13e8..6860d13e8 100644 --- a/src/go/collectors/go.d.plugin/modules/weblog/testdata/common.log +++ b/src/go/plugin/go.d/modules/weblog/testdata/common.log diff --git a/src/go/collectors/go.d.plugin/modules/weblog/testdata/config.json b/src/go/plugin/go.d/modules/weblog/testdata/config.json index 80b51736d..80b51736d 100644 --- a/src/go/collectors/go.d.plugin/modules/weblog/testdata/config.json +++ b/src/go/plugin/go.d/modules/weblog/testdata/config.json diff --git a/src/go/collectors/go.d.plugin/modules/weblog/testdata/config.yaml b/src/go/plugin/go.d/modules/weblog/testdata/config.yaml index 64f60763a..64f60763a 100644 --- a/src/go/collectors/go.d.plugin/modules/weblog/testdata/config.yaml +++ b/src/go/plugin/go.d/modules/weblog/testdata/config.yaml diff --git a/src/go/collectors/go.d.plugin/modules/weblog/testdata/custom.log b/src/go/plugin/go.d/modules/weblog/testdata/custom.log index f2ea80bdb..f2ea80bdb 100644 --- a/src/go/collectors/go.d.plugin/modules/weblog/testdata/custom.log +++ b/src/go/plugin/go.d/modules/weblog/testdata/custom.log diff --git a/src/go/collectors/go.d.plugin/modules/weblog/testdata/custom_time_fields.log b/src/go/plugin/go.d/modules/weblog/testdata/custom_time_fields.log index 9d01fb9bc..9d01fb9bc 100644 --- a/src/go/collectors/go.d.plugin/modules/weblog/testdata/custom_time_fields.log +++ b/src/go/plugin/go.d/modules/weblog/testdata/custom_time_fields.log diff --git a/src/go/collectors/go.d.plugin/modules/weblog/testdata/full.log b/src/go/plugin/go.d/modules/weblog/testdata/full.log index 460e62127..460e62127 100644 --- a/src/go/collectors/go.d.plugin/modules/weblog/testdata/full.log +++ b/src/go/plugin/go.d/modules/weblog/testdata/full.log diff --git a/src/go/collectors/go.d.plugin/modules/weblog/testdata/u_ex221107.log b/src/go/plugin/go.d/modules/weblog/testdata/u_ex221107.log index 38fa91cdc..38fa91cdc 100644 --- a/src/go/collectors/go.d.plugin/modules/weblog/testdata/u_ex221107.log +++ b/src/go/plugin/go.d/modules/weblog/testdata/u_ex221107.log diff --git a/src/go/collectors/go.d.plugin/modules/weblog/weblog.go b/src/go/plugin/go.d/modules/weblog/weblog.go index 09a07cc57..242999e68 100644 --- a/src/go/collectors/go.d.plugin/modules/weblog/weblog.go +++ b/src/go/plugin/go.d/modules/weblog/weblog.go @@ -5,8 +5,8 @@ package weblog import ( _ "embed" - "github.com/netdata/netdata/go/go.d.plugin/agent/module" - "github.com/netdata/netdata/go/go.d.plugin/pkg/logs" + "github.com/netdata/netdata/go/plugins/plugin/go.d/agent/module" + "github.com/netdata/netdata/go/plugins/plugin/go.d/pkg/logs" ) //go:embed "config_schema.json" diff --git a/src/go/collectors/go.d.plugin/modules/weblog/weblog_test.go b/src/go/plugin/go.d/modules/weblog/weblog_test.go index a756b6fb5..1e36bbf68 100644 --- a/src/go/collectors/go.d.plugin/modules/weblog/weblog_test.go +++ b/src/go/plugin/go.d/modules/weblog/weblog_test.go @@ -11,9 +11,9 @@ import ( "strings" "testing" - "github.com/netdata/netdata/go/go.d.plugin/agent/module" - "github.com/netdata/netdata/go/go.d.plugin/pkg/logs" - "github.com/netdata/netdata/go/go.d.plugin/pkg/metrics" + "github.com/netdata/netdata/go/plugins/plugin/go.d/agent/module" + "github.com/netdata/netdata/go/plugins/plugin/go.d/pkg/logs" + "github.com/netdata/netdata/go/plugins/plugin/go.d/pkg/metrics" "github.com/stretchr/testify/assert" "github.com/stretchr/testify/require" diff --git a/src/go/collectors/go.d.plugin/modules/whoisquery/README.md b/src/go/plugin/go.d/modules/whoisquery/README.md index 8661481d1..8661481d1 120000 --- a/src/go/collectors/go.d.plugin/modules/whoisquery/README.md +++ b/src/go/plugin/go.d/modules/whoisquery/README.md diff --git a/src/go/collectors/go.d.plugin/modules/whoisquery/charts.go b/src/go/plugin/go.d/modules/whoisquery/charts.go index 49c508992..c234fcc56 100644 --- a/src/go/collectors/go.d.plugin/modules/whoisquery/charts.go +++ b/src/go/plugin/go.d/modules/whoisquery/charts.go @@ -2,7 +2,7 @@ package whoisquery -import "github.com/netdata/netdata/go/go.d.plugin/agent/module" +import "github.com/netdata/netdata/go/plugins/plugin/go.d/agent/module" var baseCharts = module.Charts{ { diff --git a/src/go/collectors/go.d.plugin/modules/whoisquery/collect.go b/src/go/plugin/go.d/modules/whoisquery/collect.go index 7bd8ed70f..7bd8ed70f 100644 --- a/src/go/collectors/go.d.plugin/modules/whoisquery/collect.go +++ b/src/go/plugin/go.d/modules/whoisquery/collect.go diff --git a/src/go/collectors/go.d.plugin/modules/whoisquery/config_schema.json b/src/go/plugin/go.d/modules/whoisquery/config_schema.json index e59fa8859..fd3ef4955 100644 --- a/src/go/collectors/go.d.plugin/modules/whoisquery/config_schema.json +++ b/src/go/plugin/go.d/modules/whoisquery/config_schema.json @@ -28,14 +28,14 @@ "description": "Number of days before the alarm status is set to warning.", "type": "integer", "minimum": 1, - "default": 90 + "default": 30 }, "days_until_expiration_critical": { "title": "Days until critical", "description": "Number of days before the alarm status is set to critical.", "type": "integer", "minimum": 1, - "default": 30 + "default": 15 } }, "required": [ diff --git a/src/go/collectors/go.d.plugin/modules/whoisquery/init.go b/src/go/plugin/go.d/modules/whoisquery/init.go index d42002095..a0560b73d 100644 --- a/src/go/collectors/go.d.plugin/modules/whoisquery/init.go +++ b/src/go/plugin/go.d/modules/whoisquery/init.go @@ -5,7 +5,7 @@ package whoisquery import ( "errors" - "github.com/netdata/netdata/go/go.d.plugin/agent/module" + "github.com/netdata/netdata/go/plugins/plugin/go.d/agent/module" ) func (w *WhoisQuery) validateConfig() error { diff --git a/src/go/collectors/go.d.plugin/modules/whoisquery/integrations/domain_expiration_date.md b/src/go/plugin/go.d/modules/whoisquery/integrations/domain_expiration_date.md index 727a508f9..78508e960 100644 --- a/src/go/collectors/go.d.plugin/modules/whoisquery/integrations/domain_expiration_date.md +++ b/src/go/plugin/go.d/modules/whoisquery/integrations/domain_expiration_date.md @@ -1,6 +1,6 @@ <!--startmeta -custom_edit_url: "https://github.com/netdata/netdata/edit/master/src/go/collectors/go.d.plugin/modules/whoisquery/README.md" -meta_yaml: "https://github.com/netdata/netdata/edit/master/src/go/collectors/go.d.plugin/modules/whoisquery/metadata.yaml" +custom_edit_url: "https://github.com/netdata/netdata/edit/master/src/go/plugin/go.d/modules/whoisquery/README.md" +meta_yaml: "https://github.com/netdata/netdata/edit/master/src/go/plugin/go.d/modules/whoisquery/metadata.yaml" sidebar_label: "Domain expiration date" learn_status: "Published" learn_rel_path: "Collecting Metrics/Synthetic Checks" @@ -162,6 +162,8 @@ jobs: ### Debug Mode +**Important**: Debug mode is not supported for data collection jobs created via the UI using the Dyncfg feature. + To troubleshoot issues with the `whoisquery` collector, run the `go.d.plugin` with the debug option enabled. The output should give you clues as to why the collector isn't working. @@ -184,4 +186,37 @@ should give you clues as to why the collector isn't working. ./go.d.plugin -d -m whoisquery ``` +### Getting Logs + +If you're encountering problems with the `whoisquery` collector, follow these steps to retrieve logs and identify potential issues: + +- **Run the command** specific to your system (systemd, non-systemd, or Docker container). +- **Examine the output** for any warnings or error messages that might indicate issues. These messages should provide clues about the root cause of the problem. + +#### System with systemd + +Use the following command to view logs generated since the last Netdata service restart: + +```bash +journalctl _SYSTEMD_INVOCATION_ID="$(systemctl show --value --property=InvocationID netdata)" --namespace=netdata --grep whoisquery +``` + +#### System without systemd + +Locate the collector log file, typically at `/var/log/netdata/collector.log`, and use `grep` to filter for collector's name: + +```bash +grep whoisquery /var/log/netdata/collector.log +``` + +**Note**: This method shows logs from all restarts. Focus on the **latest entries** for troubleshooting current issues. + +#### Docker Container + +If your Netdata runs in a Docker container named "netdata" (replace if different), use this command: + +```bash +docker logs netdata 2>&1 | grep whoisquery +``` + diff --git a/src/go/collectors/go.d.plugin/modules/whoisquery/metadata.yaml b/src/go/plugin/go.d/modules/whoisquery/metadata.yaml index eb826ebde..eb826ebde 100644 --- a/src/go/collectors/go.d.plugin/modules/whoisquery/metadata.yaml +++ b/src/go/plugin/go.d/modules/whoisquery/metadata.yaml diff --git a/src/go/collectors/go.d.plugin/modules/whoisquery/provider.go b/src/go/plugin/go.d/modules/whoisquery/provider.go index f6164da7c..f6164da7c 100644 --- a/src/go/collectors/go.d.plugin/modules/whoisquery/provider.go +++ b/src/go/plugin/go.d/modules/whoisquery/provider.go diff --git a/src/go/collectors/go.d.plugin/modules/whoisquery/testdata/config.json b/src/go/plugin/go.d/modules/whoisquery/testdata/config.json index e633bd4ed..e633bd4ed 100644 --- a/src/go/collectors/go.d.plugin/modules/whoisquery/testdata/config.json +++ b/src/go/plugin/go.d/modules/whoisquery/testdata/config.json diff --git a/src/go/collectors/go.d.plugin/modules/whoisquery/testdata/config.yaml b/src/go/plugin/go.d/modules/whoisquery/testdata/config.yaml index ad4c501c0..ad4c501c0 100644 --- a/src/go/collectors/go.d.plugin/modules/whoisquery/testdata/config.yaml +++ b/src/go/plugin/go.d/modules/whoisquery/testdata/config.yaml diff --git a/src/go/collectors/go.d.plugin/modules/whoisquery/whoisquery.go b/src/go/plugin/go.d/modules/whoisquery/whoisquery.go index 1982f910d..1f59779b3 100644 --- a/src/go/collectors/go.d.plugin/modules/whoisquery/whoisquery.go +++ b/src/go/plugin/go.d/modules/whoisquery/whoisquery.go @@ -7,8 +7,8 @@ import ( "errors" "time" - "github.com/netdata/netdata/go/go.d.plugin/agent/module" - "github.com/netdata/netdata/go/go.d.plugin/pkg/web" + "github.com/netdata/netdata/go/plugins/plugin/go.d/agent/module" + "github.com/netdata/netdata/go/plugins/plugin/go.d/pkg/web" ) //go:embed "config_schema.json" diff --git a/src/go/collectors/go.d.plugin/modules/whoisquery/whoisquery_test.go b/src/go/plugin/go.d/modules/whoisquery/whoisquery_test.go index 59ec659b1..4979c7f57 100644 --- a/src/go/collectors/go.d.plugin/modules/whoisquery/whoisquery_test.go +++ b/src/go/plugin/go.d/modules/whoisquery/whoisquery_test.go @@ -7,7 +7,7 @@ import ( "os" "testing" - "github.com/netdata/netdata/go/go.d.plugin/agent/module" + "github.com/netdata/netdata/go/plugins/plugin/go.d/agent/module" "github.com/stretchr/testify/assert" "github.com/stretchr/testify/require" diff --git a/src/go/collectors/go.d.plugin/modules/windows/README.md b/src/go/plugin/go.d/modules/windows/README.md index 802d61bd1..802d61bd1 120000 --- a/src/go/collectors/go.d.plugin/modules/windows/README.md +++ b/src/go/plugin/go.d/modules/windows/README.md diff --git a/src/go/collectors/go.d.plugin/modules/windows/charts.go b/src/go/plugin/go.d/modules/windows/charts.go index 8ed5848c6..cedc33fa7 100644 --- a/src/go/collectors/go.d.plugin/modules/windows/charts.go +++ b/src/go/plugin/go.d/modules/windows/charts.go @@ -6,7 +6,7 @@ import ( "fmt" "strings" - "github.com/netdata/netdata/go/go.d.plugin/agent/module" + "github.com/netdata/netdata/go/plugins/plugin/go.d/agent/module" ) const ( diff --git a/src/go/collectors/go.d.plugin/modules/windows/collect.go b/src/go/plugin/go.d/modules/windows/collect.go index b20b08c27..22421e221 100644 --- a/src/go/collectors/go.d.plugin/modules/windows/collect.go +++ b/src/go/plugin/go.d/modules/windows/collect.go @@ -3,7 +3,7 @@ package windows import ( - "github.com/netdata/netdata/go/go.d.plugin/pkg/prometheus" + "github.com/netdata/netdata/go/plugins/plugin/go.d/pkg/prometheus" ) const precision = 1000 diff --git a/src/go/collectors/go.d.plugin/modules/windows/collect_ad.go b/src/go/plugin/go.d/modules/windows/collect_ad.go index 3c07a9112..5a99ce5c8 100644 --- a/src/go/collectors/go.d.plugin/modules/windows/collect_ad.go +++ b/src/go/plugin/go.d/modules/windows/collect_ad.go @@ -2,7 +2,7 @@ package windows -import "github.com/netdata/netdata/go/go.d.plugin/pkg/prometheus" +import "github.com/netdata/netdata/go/plugins/plugin/go.d/pkg/prometheus" // Windows exporter: // https://github.com/prometheus-community/windows_exporter/blob/master/docs/collector.ad.md diff --git a/src/go/collectors/go.d.plugin/modules/windows/collect_adcs.go b/src/go/plugin/go.d/modules/windows/collect_adcs.go index 0142fcb9c..115eddee5 100644 --- a/src/go/collectors/go.d.plugin/modules/windows/collect_adcs.go +++ b/src/go/plugin/go.d/modules/windows/collect_adcs.go @@ -5,7 +5,7 @@ package windows import ( "strings" - "github.com/netdata/netdata/go/go.d.plugin/pkg/prometheus" + "github.com/netdata/netdata/go/plugins/plugin/go.d/pkg/prometheus" ) const ( diff --git a/src/go/collectors/go.d.plugin/modules/windows/collect_adfs.go b/src/go/plugin/go.d/modules/windows/collect_adfs.go index 4ce0717ba..1802a609a 100644 --- a/src/go/collectors/go.d.plugin/modules/windows/collect_adfs.go +++ b/src/go/plugin/go.d/modules/windows/collect_adfs.go @@ -5,7 +5,7 @@ package windows import ( "strings" - "github.com/netdata/netdata/go/go.d.plugin/pkg/prometheus" + "github.com/netdata/netdata/go/plugins/plugin/go.d/pkg/prometheus" ) const ( diff --git a/src/go/collectors/go.d.plugin/modules/windows/collect_collector.go b/src/go/plugin/go.d/modules/windows/collect_collector.go index 6950ff575..f182b9af5 100644 --- a/src/go/collectors/go.d.plugin/modules/windows/collect_collector.go +++ b/src/go/plugin/go.d/modules/windows/collect_collector.go @@ -3,7 +3,7 @@ package windows import ( - "github.com/netdata/netdata/go/go.d.plugin/pkg/prometheus" + "github.com/netdata/netdata/go/plugins/plugin/go.d/pkg/prometheus" ) const ( diff --git a/src/go/collectors/go.d.plugin/modules/windows/collect_cpu.go b/src/go/plugin/go.d/modules/windows/collect_cpu.go index fc1412e3d..6a324e5ef 100644 --- a/src/go/collectors/go.d.plugin/modules/windows/collect_cpu.go +++ b/src/go/plugin/go.d/modules/windows/collect_cpu.go @@ -3,7 +3,7 @@ package windows import ( - "github.com/netdata/netdata/go/go.d.plugin/pkg/prometheus" + "github.com/netdata/netdata/go/plugins/plugin/go.d/pkg/prometheus" ) const ( diff --git a/src/go/collectors/go.d.plugin/modules/windows/collect_exchange.go b/src/go/plugin/go.d/modules/windows/collect_exchange.go index 040bae1e2..bbbbfd533 100644 --- a/src/go/collectors/go.d.plugin/modules/windows/collect_exchange.go +++ b/src/go/plugin/go.d/modules/windows/collect_exchange.go @@ -5,7 +5,7 @@ package windows import ( "strings" - "github.com/netdata/netdata/go/go.d.plugin/pkg/prometheus" + "github.com/netdata/netdata/go/plugins/plugin/go.d/pkg/prometheus" ) const ( diff --git a/src/go/collectors/go.d.plugin/modules/windows/collect_hyperv.go b/src/go/plugin/go.d/modules/windows/collect_hyperv.go index 8fecbf8f5..f7cf2c60a 100644 --- a/src/go/collectors/go.d.plugin/modules/windows/collect_hyperv.go +++ b/src/go/plugin/go.d/modules/windows/collect_hyperv.go @@ -5,7 +5,7 @@ package windows import ( "strings" - "github.com/netdata/netdata/go/go.d.plugin/pkg/prometheus" + "github.com/netdata/netdata/go/plugins/plugin/go.d/pkg/prometheus" ) const ( diff --git a/src/go/collectors/go.d.plugin/modules/windows/collect_iis.go b/src/go/plugin/go.d/modules/windows/collect_iis.go index 3b15b6e89..5218e64e1 100644 --- a/src/go/collectors/go.d.plugin/modules/windows/collect_iis.go +++ b/src/go/plugin/go.d/modules/windows/collect_iis.go @@ -5,7 +5,7 @@ package windows import ( "strings" - "github.com/netdata/netdata/go/go.d.plugin/pkg/prometheus" + "github.com/netdata/netdata/go/plugins/plugin/go.d/pkg/prometheus" ) const ( diff --git a/src/go/collectors/go.d.plugin/modules/windows/collect_logical_disk.go b/src/go/plugin/go.d/modules/windows/collect_logical_disk.go index 9f5dab15b..0db52f8cd 100644 --- a/src/go/collectors/go.d.plugin/modules/windows/collect_logical_disk.go +++ b/src/go/plugin/go.d/modules/windows/collect_logical_disk.go @@ -5,7 +5,7 @@ package windows import ( "strings" - "github.com/netdata/netdata/go/go.d.plugin/pkg/prometheus" + "github.com/netdata/netdata/go/plugins/plugin/go.d/pkg/prometheus" ) const ( diff --git a/src/go/collectors/go.d.plugin/modules/windows/collect_logon.go b/src/go/plugin/go.d/modules/windows/collect_logon.go index a4e14d109..7db0024ca 100644 --- a/src/go/collectors/go.d.plugin/modules/windows/collect_logon.go +++ b/src/go/plugin/go.d/modules/windows/collect_logon.go @@ -3,7 +3,7 @@ package windows import ( - "github.com/netdata/netdata/go/go.d.plugin/pkg/prometheus" + "github.com/netdata/netdata/go/plugins/plugin/go.d/pkg/prometheus" ) const ( diff --git a/src/go/collectors/go.d.plugin/modules/windows/collect_memory.go b/src/go/plugin/go.d/modules/windows/collect_memory.go index 5b4ed191d..36123e4dd 100644 --- a/src/go/collectors/go.d.plugin/modules/windows/collect_memory.go +++ b/src/go/plugin/go.d/modules/windows/collect_memory.go @@ -3,7 +3,7 @@ package windows import ( - "github.com/netdata/netdata/go/go.d.plugin/pkg/prometheus" + "github.com/netdata/netdata/go/plugins/plugin/go.d/pkg/prometheus" ) const ( diff --git a/src/go/collectors/go.d.plugin/modules/windows/collect_mssql.go b/src/go/plugin/go.d/modules/windows/collect_mssql.go index 53d88f578..2a6078f28 100644 --- a/src/go/collectors/go.d.plugin/modules/windows/collect_mssql.go +++ b/src/go/plugin/go.d/modules/windows/collect_mssql.go @@ -5,7 +5,7 @@ package windows import ( "strings" - "github.com/netdata/netdata/go/go.d.plugin/pkg/prometheus" + "github.com/netdata/netdata/go/plugins/plugin/go.d/pkg/prometheus" ) const ( diff --git a/src/go/collectors/go.d.plugin/modules/windows/collect_net.go b/src/go/plugin/go.d/modules/windows/collect_net.go index e72bf646f..4fe5dd7d6 100644 --- a/src/go/collectors/go.d.plugin/modules/windows/collect_net.go +++ b/src/go/plugin/go.d/modules/windows/collect_net.go @@ -5,7 +5,7 @@ package windows import ( "strings" - "github.com/netdata/netdata/go/go.d.plugin/pkg/prometheus" + "github.com/netdata/netdata/go/plugins/plugin/go.d/pkg/prometheus" ) const ( diff --git a/src/go/collectors/go.d.plugin/modules/windows/collect_netframework.go b/src/go/plugin/go.d/modules/windows/collect_netframework.go index 84012f71e..aab9364d3 100644 --- a/src/go/collectors/go.d.plugin/modules/windows/collect_netframework.go +++ b/src/go/plugin/go.d/modules/windows/collect_netframework.go @@ -3,7 +3,7 @@ package windows import ( - "github.com/netdata/netdata/go/go.d.plugin/pkg/prometheus" + "github.com/netdata/netdata/go/plugins/plugin/go.d/pkg/prometheus" ) const ( diff --git a/src/go/collectors/go.d.plugin/modules/windows/collect_os.go b/src/go/plugin/go.d/modules/windows/collect_os.go index 17617f480..99113e973 100644 --- a/src/go/collectors/go.d.plugin/modules/windows/collect_os.go +++ b/src/go/plugin/go.d/modules/windows/collect_os.go @@ -3,7 +3,7 @@ package windows import ( - "github.com/netdata/netdata/go/go.d.plugin/pkg/prometheus" + "github.com/netdata/netdata/go/plugins/plugin/go.d/pkg/prometheus" ) const ( diff --git a/src/go/collectors/go.d.plugin/modules/windows/collect_process.go b/src/go/plugin/go.d/modules/windows/collect_process.go index b1c729f30..373db6c08 100644 --- a/src/go/collectors/go.d.plugin/modules/windows/collect_process.go +++ b/src/go/plugin/go.d/modules/windows/collect_process.go @@ -5,7 +5,7 @@ package windows import ( "strings" - "github.com/netdata/netdata/go/go.d.plugin/pkg/prometheus" + "github.com/netdata/netdata/go/plugins/plugin/go.d/pkg/prometheus" ) const ( diff --git a/src/go/collectors/go.d.plugin/modules/windows/collect_service.go b/src/go/plugin/go.d/modules/windows/collect_service.go index fb58128ee..c6d77c99e 100644 --- a/src/go/collectors/go.d.plugin/modules/windows/collect_service.go +++ b/src/go/plugin/go.d/modules/windows/collect_service.go @@ -5,7 +5,7 @@ package windows import ( "strings" - "github.com/netdata/netdata/go/go.d.plugin/pkg/prometheus" + "github.com/netdata/netdata/go/plugins/plugin/go.d/pkg/prometheus" ) const ( diff --git a/src/go/collectors/go.d.plugin/modules/windows/collect_system.go b/src/go/plugin/go.d/modules/windows/collect_system.go index 5f0bc9131..8758e8476 100644 --- a/src/go/collectors/go.d.plugin/modules/windows/collect_system.go +++ b/src/go/plugin/go.d/modules/windows/collect_system.go @@ -5,7 +5,7 @@ package windows import ( "time" - "github.com/netdata/netdata/go/go.d.plugin/pkg/prometheus" + "github.com/netdata/netdata/go/plugins/plugin/go.d/pkg/prometheus" ) const ( diff --git a/src/go/collectors/go.d.plugin/modules/windows/collect_tcp.go b/src/go/plugin/go.d/modules/windows/collect_tcp.go index 20c8f8df7..7b4621835 100644 --- a/src/go/collectors/go.d.plugin/modules/windows/collect_tcp.go +++ b/src/go/plugin/go.d/modules/windows/collect_tcp.go @@ -2,7 +2,7 @@ package windows -import "github.com/netdata/netdata/go/go.d.plugin/pkg/prometheus" +import "github.com/netdata/netdata/go/plugins/plugin/go.d/pkg/prometheus" const ( metricTCPConnectionFailure = "windows_tcp_connection_failures_total" diff --git a/src/go/collectors/go.d.plugin/modules/windows/collect_thermalzone.go b/src/go/plugin/go.d/modules/windows/collect_thermalzone.go index 578ebef9f..6dccb9fed 100644 --- a/src/go/collectors/go.d.plugin/modules/windows/collect_thermalzone.go +++ b/src/go/plugin/go.d/modules/windows/collect_thermalzone.go @@ -5,7 +5,7 @@ package windows import ( "strings" - "github.com/netdata/netdata/go/go.d.plugin/pkg/prometheus" + "github.com/netdata/netdata/go/plugins/plugin/go.d/pkg/prometheus" ) const ( diff --git a/src/go/collectors/go.d.plugin/modules/windows/config_schema.json b/src/go/plugin/go.d/modules/windows/config_schema.json index c112abe66..e1011e876 100644 --- a/src/go/collectors/go.d.plugin/modules/windows/config_schema.json +++ b/src/go/plugin/go.d/modules/windows/config_schema.json @@ -174,6 +174,12 @@ "timeout": { "ui:help": "Accepts decimals for precise control (e.g., type 1.5 for 1.5 seconds)." }, + "username": { + "ui:widget": "password" + }, + "proxy_username": { + "ui:widget": "password" + }, "password": { "ui:widget": "password" }, diff --git a/src/go/collectors/go.d.plugin/modules/windows/init.go b/src/go/plugin/go.d/modules/windows/init.go index 1e9a6a4e4..87faf40bd 100644 --- a/src/go/collectors/go.d.plugin/modules/windows/init.go +++ b/src/go/plugin/go.d/modules/windows/init.go @@ -5,8 +5,8 @@ package windows import ( "errors" - "github.com/netdata/netdata/go/go.d.plugin/pkg/prometheus" - "github.com/netdata/netdata/go/go.d.plugin/pkg/web" + "github.com/netdata/netdata/go/plugins/plugin/go.d/pkg/prometheus" + "github.com/netdata/netdata/go/plugins/plugin/go.d/pkg/web" ) func (w *Windows) validateConfig() error { diff --git a/src/go/collectors/go.d.plugin/modules/windows/integrations/active_directory.md b/src/go/plugin/go.d/modules/windows/integrations/active_directory.md index 4449fa942..6d255aba8 100644 --- a/src/go/collectors/go.d.plugin/modules/windows/integrations/active_directory.md +++ b/src/go/plugin/go.d/modules/windows/integrations/active_directory.md @@ -1,6 +1,6 @@ <!--startmeta -custom_edit_url: "https://github.com/netdata/netdata/edit/master/src/go/collectors/go.d.plugin/modules/windows/integrations/active_directory.md" -meta_yaml: "https://github.com/netdata/netdata/edit/master/src/go/collectors/go.d.plugin/modules/windows/metadata.yaml" +custom_edit_url: "https://github.com/netdata/netdata/edit/master/src/go/plugin/go.d/modules/windows/integrations/active_directory.md" +meta_yaml: "https://github.com/netdata/netdata/edit/master/src/go/plugin/go.d/modules/windows/metadata.yaml" sidebar_label: "Active Directory" learn_status: "Published" learn_rel_path: "Collecting Metrics/Windows Systems" @@ -783,6 +783,8 @@ jobs: ### Debug Mode +**Important**: Debug mode is not supported for data collection jobs created via the UI using the Dyncfg feature. + To troubleshoot issues with the `windows` collector, run the `go.d.plugin` with the debug option enabled. The output should give you clues as to why the collector isn't working. @@ -805,4 +807,37 @@ should give you clues as to why the collector isn't working. ./go.d.plugin -d -m windows ``` +### Getting Logs + +If you're encountering problems with the `windows` collector, follow these steps to retrieve logs and identify potential issues: + +- **Run the command** specific to your system (systemd, non-systemd, or Docker container). +- **Examine the output** for any warnings or error messages that might indicate issues. These messages should provide clues about the root cause of the problem. + +#### System with systemd + +Use the following command to view logs generated since the last Netdata service restart: + +```bash +journalctl _SYSTEMD_INVOCATION_ID="$(systemctl show --value --property=InvocationID netdata)" --namespace=netdata --grep windows +``` + +#### System without systemd + +Locate the collector log file, typically at `/var/log/netdata/collector.log`, and use `grep` to filter for collector's name: + +```bash +grep windows /var/log/netdata/collector.log +``` + +**Note**: This method shows logs from all restarts. Focus on the **latest entries** for troubleshooting current issues. + +#### Docker Container + +If your Netdata runs in a Docker container named "netdata" (replace if different), use this command: + +```bash +docker logs netdata 2>&1 | grep windows +``` + diff --git a/src/go/collectors/go.d.plugin/modules/windows/integrations/hyperv.md b/src/go/plugin/go.d/modules/windows/integrations/hyperv.md index 3af02fb8a..42e4f308d 100644 --- a/src/go/collectors/go.d.plugin/modules/windows/integrations/hyperv.md +++ b/src/go/plugin/go.d/modules/windows/integrations/hyperv.md @@ -1,6 +1,6 @@ <!--startmeta -custom_edit_url: "https://github.com/netdata/netdata/edit/master/src/go/collectors/go.d.plugin/modules/windows/integrations/hyperv.md" -meta_yaml: "https://github.com/netdata/netdata/edit/master/src/go/collectors/go.d.plugin/modules/windows/metadata.yaml" +custom_edit_url: "https://github.com/netdata/netdata/edit/master/src/go/plugin/go.d/modules/windows/integrations/hyperv.md" +meta_yaml: "https://github.com/netdata/netdata/edit/master/src/go/plugin/go.d/modules/windows/metadata.yaml" sidebar_label: "HyperV" learn_status: "Published" learn_rel_path: "Collecting Metrics/Windows Systems" @@ -783,6 +783,8 @@ jobs: ### Debug Mode +**Important**: Debug mode is not supported for data collection jobs created via the UI using the Dyncfg feature. + To troubleshoot issues with the `windows` collector, run the `go.d.plugin` with the debug option enabled. The output should give you clues as to why the collector isn't working. @@ -805,4 +807,37 @@ should give you clues as to why the collector isn't working. ./go.d.plugin -d -m windows ``` +### Getting Logs + +If you're encountering problems with the `windows` collector, follow these steps to retrieve logs and identify potential issues: + +- **Run the command** specific to your system (systemd, non-systemd, or Docker container). +- **Examine the output** for any warnings or error messages that might indicate issues. These messages should provide clues about the root cause of the problem. + +#### System with systemd + +Use the following command to view logs generated since the last Netdata service restart: + +```bash +journalctl _SYSTEMD_INVOCATION_ID="$(systemctl show --value --property=InvocationID netdata)" --namespace=netdata --grep windows +``` + +#### System without systemd + +Locate the collector log file, typically at `/var/log/netdata/collector.log`, and use `grep` to filter for collector's name: + +```bash +grep windows /var/log/netdata/collector.log +``` + +**Note**: This method shows logs from all restarts. Focus on the **latest entries** for troubleshooting current issues. + +#### Docker Container + +If your Netdata runs in a Docker container named "netdata" (replace if different), use this command: + +```bash +docker logs netdata 2>&1 | grep windows +``` + diff --git a/src/go/collectors/go.d.plugin/modules/windows/integrations/ms_exchange.md b/src/go/plugin/go.d/modules/windows/integrations/ms_exchange.md index 740f68dec..24d416021 100644 --- a/src/go/collectors/go.d.plugin/modules/windows/integrations/ms_exchange.md +++ b/src/go/plugin/go.d/modules/windows/integrations/ms_exchange.md @@ -1,6 +1,6 @@ <!--startmeta -custom_edit_url: "https://github.com/netdata/netdata/edit/master/src/go/collectors/go.d.plugin/modules/windows/integrations/ms_exchange.md" -meta_yaml: "https://github.com/netdata/netdata/edit/master/src/go/collectors/go.d.plugin/modules/windows/metadata.yaml" +custom_edit_url: "https://github.com/netdata/netdata/edit/master/src/go/plugin/go.d/modules/windows/integrations/ms_exchange.md" +meta_yaml: "https://github.com/netdata/netdata/edit/master/src/go/plugin/go.d/modules/windows/metadata.yaml" sidebar_label: "MS Exchange" learn_status: "Published" learn_rel_path: "Collecting Metrics/Windows Systems" @@ -783,6 +783,8 @@ jobs: ### Debug Mode +**Important**: Debug mode is not supported for data collection jobs created via the UI using the Dyncfg feature. + To troubleshoot issues with the `windows` collector, run the `go.d.plugin` with the debug option enabled. The output should give you clues as to why the collector isn't working. @@ -805,4 +807,37 @@ should give you clues as to why the collector isn't working. ./go.d.plugin -d -m windows ``` +### Getting Logs + +If you're encountering problems with the `windows` collector, follow these steps to retrieve logs and identify potential issues: + +- **Run the command** specific to your system (systemd, non-systemd, or Docker container). +- **Examine the output** for any warnings or error messages that might indicate issues. These messages should provide clues about the root cause of the problem. + +#### System with systemd + +Use the following command to view logs generated since the last Netdata service restart: + +```bash +journalctl _SYSTEMD_INVOCATION_ID="$(systemctl show --value --property=InvocationID netdata)" --namespace=netdata --grep windows +``` + +#### System without systemd + +Locate the collector log file, typically at `/var/log/netdata/collector.log`, and use `grep` to filter for collector's name: + +```bash +grep windows /var/log/netdata/collector.log +``` + +**Note**: This method shows logs from all restarts. Focus on the **latest entries** for troubleshooting current issues. + +#### Docker Container + +If your Netdata runs in a Docker container named "netdata" (replace if different), use this command: + +```bash +docker logs netdata 2>&1 | grep windows +``` + diff --git a/src/go/collectors/go.d.plugin/modules/windows/integrations/ms_sql_server.md b/src/go/plugin/go.d/modules/windows/integrations/ms_sql_server.md index f12ae825d..1dd59c30e 100644 --- a/src/go/collectors/go.d.plugin/modules/windows/integrations/ms_sql_server.md +++ b/src/go/plugin/go.d/modules/windows/integrations/ms_sql_server.md @@ -1,6 +1,6 @@ <!--startmeta -custom_edit_url: "https://github.com/netdata/netdata/edit/master/src/go/collectors/go.d.plugin/modules/windows/integrations/ms_sql_server.md" -meta_yaml: "https://github.com/netdata/netdata/edit/master/src/go/collectors/go.d.plugin/modules/windows/metadata.yaml" +custom_edit_url: "https://github.com/netdata/netdata/edit/master/src/go/plugin/go.d/modules/windows/integrations/ms_sql_server.md" +meta_yaml: "https://github.com/netdata/netdata/edit/master/src/go/plugin/go.d/modules/windows/metadata.yaml" sidebar_label: "MS SQL Server" learn_status: "Published" learn_rel_path: "Collecting Metrics/Windows Systems" @@ -783,6 +783,8 @@ jobs: ### Debug Mode +**Important**: Debug mode is not supported for data collection jobs created via the UI using the Dyncfg feature. + To troubleshoot issues with the `windows` collector, run the `go.d.plugin` with the debug option enabled. The output should give you clues as to why the collector isn't working. @@ -805,4 +807,37 @@ should give you clues as to why the collector isn't working. ./go.d.plugin -d -m windows ``` +### Getting Logs + +If you're encountering problems with the `windows` collector, follow these steps to retrieve logs and identify potential issues: + +- **Run the command** specific to your system (systemd, non-systemd, or Docker container). +- **Examine the output** for any warnings or error messages that might indicate issues. These messages should provide clues about the root cause of the problem. + +#### System with systemd + +Use the following command to view logs generated since the last Netdata service restart: + +```bash +journalctl _SYSTEMD_INVOCATION_ID="$(systemctl show --value --property=InvocationID netdata)" --namespace=netdata --grep windows +``` + +#### System without systemd + +Locate the collector log file, typically at `/var/log/netdata/collector.log`, and use `grep` to filter for collector's name: + +```bash +grep windows /var/log/netdata/collector.log +``` + +**Note**: This method shows logs from all restarts. Focus on the **latest entries** for troubleshooting current issues. + +#### Docker Container + +If your Netdata runs in a Docker container named "netdata" (replace if different), use this command: + +```bash +docker logs netdata 2>&1 | grep windows +``` + diff --git a/src/go/collectors/go.d.plugin/modules/windows/integrations/net_framework.md b/src/go/plugin/go.d/modules/windows/integrations/net_framework.md index 94262b166..01879ddea 100644 --- a/src/go/collectors/go.d.plugin/modules/windows/integrations/net_framework.md +++ b/src/go/plugin/go.d/modules/windows/integrations/net_framework.md @@ -1,6 +1,6 @@ <!--startmeta -custom_edit_url: "https://github.com/netdata/netdata/edit/master/src/go/collectors/go.d.plugin/modules/windows/integrations/net_framework.md" -meta_yaml: "https://github.com/netdata/netdata/edit/master/src/go/collectors/go.d.plugin/modules/windows/metadata.yaml" +custom_edit_url: "https://github.com/netdata/netdata/edit/master/src/go/plugin/go.d/modules/windows/integrations/net_framework.md" +meta_yaml: "https://github.com/netdata/netdata/edit/master/src/go/plugin/go.d/modules/windows/metadata.yaml" sidebar_label: "NET Framework" learn_status: "Published" learn_rel_path: "Collecting Metrics/Windows Systems" @@ -783,6 +783,8 @@ jobs: ### Debug Mode +**Important**: Debug mode is not supported for data collection jobs created via the UI using the Dyncfg feature. + To troubleshoot issues with the `windows` collector, run the `go.d.plugin` with the debug option enabled. The output should give you clues as to why the collector isn't working. @@ -805,4 +807,37 @@ should give you clues as to why the collector isn't working. ./go.d.plugin -d -m windows ``` +### Getting Logs + +If you're encountering problems with the `windows` collector, follow these steps to retrieve logs and identify potential issues: + +- **Run the command** specific to your system (systemd, non-systemd, or Docker container). +- **Examine the output** for any warnings or error messages that might indicate issues. These messages should provide clues about the root cause of the problem. + +#### System with systemd + +Use the following command to view logs generated since the last Netdata service restart: + +```bash +journalctl _SYSTEMD_INVOCATION_ID="$(systemctl show --value --property=InvocationID netdata)" --namespace=netdata --grep windows +``` + +#### System without systemd + +Locate the collector log file, typically at `/var/log/netdata/collector.log`, and use `grep` to filter for collector's name: + +```bash +grep windows /var/log/netdata/collector.log +``` + +**Note**: This method shows logs from all restarts. Focus on the **latest entries** for troubleshooting current issues. + +#### Docker Container + +If your Netdata runs in a Docker container named "netdata" (replace if different), use this command: + +```bash +docker logs netdata 2>&1 | grep windows +``` + diff --git a/src/go/collectors/go.d.plugin/modules/windows/integrations/windows.md b/src/go/plugin/go.d/modules/windows/integrations/windows.md index 7c821585d..60a3b7f30 100644 --- a/src/go/collectors/go.d.plugin/modules/windows/integrations/windows.md +++ b/src/go/plugin/go.d/modules/windows/integrations/windows.md @@ -1,6 +1,6 @@ <!--startmeta -custom_edit_url: "https://github.com/netdata/netdata/edit/master/src/go/collectors/go.d.plugin/modules/windows/integrations/windows.md" -meta_yaml: "https://github.com/netdata/netdata/edit/master/src/go/collectors/go.d.plugin/modules/windows/metadata.yaml" +custom_edit_url: "https://github.com/netdata/netdata/edit/master/src/go/plugin/go.d/modules/windows/integrations/windows.md" +meta_yaml: "https://github.com/netdata/netdata/edit/master/src/go/plugin/go.d/modules/windows/metadata.yaml" sidebar_label: "Windows" learn_status: "Published" learn_rel_path: "Collecting Metrics/Windows Systems" @@ -783,6 +783,8 @@ jobs: ### Debug Mode +**Important**: Debug mode is not supported for data collection jobs created via the UI using the Dyncfg feature. + To troubleshoot issues with the `windows` collector, run the `go.d.plugin` with the debug option enabled. The output should give you clues as to why the collector isn't working. @@ -805,4 +807,37 @@ should give you clues as to why the collector isn't working. ./go.d.plugin -d -m windows ``` +### Getting Logs + +If you're encountering problems with the `windows` collector, follow these steps to retrieve logs and identify potential issues: + +- **Run the command** specific to your system (systemd, non-systemd, or Docker container). +- **Examine the output** for any warnings or error messages that might indicate issues. These messages should provide clues about the root cause of the problem. + +#### System with systemd + +Use the following command to view logs generated since the last Netdata service restart: + +```bash +journalctl _SYSTEMD_INVOCATION_ID="$(systemctl show --value --property=InvocationID netdata)" --namespace=netdata --grep windows +``` + +#### System without systemd + +Locate the collector log file, typically at `/var/log/netdata/collector.log`, and use `grep` to filter for collector's name: + +```bash +grep windows /var/log/netdata/collector.log +``` + +**Note**: This method shows logs from all restarts. Focus on the **latest entries** for troubleshooting current issues. + +#### Docker Container + +If your Netdata runs in a Docker container named "netdata" (replace if different), use this command: + +```bash +docker logs netdata 2>&1 | grep windows +``` + diff --git a/src/go/collectors/go.d.plugin/modules/windows/metadata.yaml b/src/go/plugin/go.d/modules/windows/metadata.yaml index 87ac4cf63..87ac4cf63 100644 --- a/src/go/collectors/go.d.plugin/modules/windows/metadata.yaml +++ b/src/go/plugin/go.d/modules/windows/metadata.yaml diff --git a/src/go/collectors/go.d.plugin/modules/windows/testdata/config.json b/src/go/plugin/go.d/modules/windows/testdata/config.json index 6f8c1084e..6f8c1084e 100644 --- a/src/go/collectors/go.d.plugin/modules/windows/testdata/config.json +++ b/src/go/plugin/go.d/modules/windows/testdata/config.json diff --git a/src/go/collectors/go.d.plugin/modules/windows/testdata/config.yaml b/src/go/plugin/go.d/modules/windows/testdata/config.yaml index 4bbb7474d..4bbb7474d 100644 --- a/src/go/collectors/go.d.plugin/modules/windows/testdata/config.yaml +++ b/src/go/plugin/go.d/modules/windows/testdata/config.yaml diff --git a/src/go/collectors/go.d.plugin/modules/windows/testdata/v0.20.0/metrics.txt b/src/go/plugin/go.d/modules/windows/testdata/v0.20.0/metrics.txt index 02b68c3f8..02b68c3f8 100644 --- a/src/go/collectors/go.d.plugin/modules/windows/testdata/v0.20.0/metrics.txt +++ b/src/go/plugin/go.d/modules/windows/testdata/v0.20.0/metrics.txt diff --git a/src/go/collectors/go.d.plugin/modules/windows/windows.go b/src/go/plugin/go.d/modules/windows/windows.go index 99bfecf1d..555990784 100644 --- a/src/go/collectors/go.d.plugin/modules/windows/windows.go +++ b/src/go/plugin/go.d/modules/windows/windows.go @@ -7,9 +7,9 @@ import ( "errors" "time" - "github.com/netdata/netdata/go/go.d.plugin/agent/module" - "github.com/netdata/netdata/go/go.d.plugin/pkg/prometheus" - "github.com/netdata/netdata/go/go.d.plugin/pkg/web" + "github.com/netdata/netdata/go/plugins/plugin/go.d/agent/module" + "github.com/netdata/netdata/go/plugins/plugin/go.d/pkg/prometheus" + "github.com/netdata/netdata/go/plugins/plugin/go.d/pkg/web" ) //go:embed "config_schema.json" diff --git a/src/go/collectors/go.d.plugin/modules/windows/windows_test.go b/src/go/plugin/go.d/modules/windows/windows_test.go index 6322b0981..052950248 100644 --- a/src/go/collectors/go.d.plugin/modules/windows/windows_test.go +++ b/src/go/plugin/go.d/modules/windows/windows_test.go @@ -10,8 +10,8 @@ import ( "strings" "testing" - "github.com/netdata/netdata/go/go.d.plugin/agent/module" - "github.com/netdata/netdata/go/go.d.plugin/pkg/web" + "github.com/netdata/netdata/go/plugins/plugin/go.d/agent/module" + "github.com/netdata/netdata/go/plugins/plugin/go.d/pkg/web" "github.com/stretchr/testify/assert" "github.com/stretchr/testify/require" diff --git a/src/go/collectors/go.d.plugin/modules/wireguard/README.md b/src/go/plugin/go.d/modules/wireguard/README.md index 389e494d7..389e494d7 120000 --- a/src/go/collectors/go.d.plugin/modules/wireguard/README.md +++ b/src/go/plugin/go.d/modules/wireguard/README.md diff --git a/src/go/collectors/go.d.plugin/modules/wireguard/charts.go b/src/go/plugin/go.d/modules/wireguard/charts.go index fe7f89e9b..c2defa9b3 100644 --- a/src/go/collectors/go.d.plugin/modules/wireguard/charts.go +++ b/src/go/plugin/go.d/modules/wireguard/charts.go @@ -6,7 +6,7 @@ import ( "fmt" "strings" - "github.com/netdata/netdata/go/go.d.plugin/agent/module" + "github.com/netdata/netdata/go/plugins/plugin/go.d/agent/module" ) const ( diff --git a/src/go/collectors/go.d.plugin/modules/wireguard/collect.go b/src/go/plugin/go.d/modules/wireguard/collect.go index cbcc180ec..cbcc180ec 100644 --- a/src/go/collectors/go.d.plugin/modules/wireguard/collect.go +++ b/src/go/plugin/go.d/modules/wireguard/collect.go diff --git a/src/go/collectors/go.d.plugin/modules/wireguard/config_schema.json b/src/go/plugin/go.d/modules/wireguard/config_schema.json index 5ff8ff717..5ff8ff717 100644 --- a/src/go/collectors/go.d.plugin/modules/wireguard/config_schema.json +++ b/src/go/plugin/go.d/modules/wireguard/config_schema.json diff --git a/src/go/collectors/go.d.plugin/modules/wireguard/integrations/wireguard.md b/src/go/plugin/go.d/modules/wireguard/integrations/wireguard.md index 11ff605b6..2460cc839 100644 --- a/src/go/collectors/go.d.plugin/modules/wireguard/integrations/wireguard.md +++ b/src/go/plugin/go.d/modules/wireguard/integrations/wireguard.md @@ -1,6 +1,6 @@ <!--startmeta -custom_edit_url: "https://github.com/netdata/netdata/edit/master/src/go/collectors/go.d.plugin/modules/wireguard/README.md" -meta_yaml: "https://github.com/netdata/netdata/edit/master/src/go/collectors/go.d.plugin/modules/wireguard/metadata.yaml" +custom_edit_url: "https://github.com/netdata/netdata/edit/master/src/go/plugin/go.d/modules/wireguard/README.md" +meta_yaml: "https://github.com/netdata/netdata/edit/master/src/go/plugin/go.d/modules/wireguard/metadata.yaml" sidebar_label: "WireGuard" learn_status: "Published" learn_rel_path: "Collecting Metrics/VPNs" @@ -144,6 +144,8 @@ There are no configuration examples. ### Debug Mode +**Important**: Debug mode is not supported for data collection jobs created via the UI using the Dyncfg feature. + To troubleshoot issues with the `wireguard` collector, run the `go.d.plugin` with the debug option enabled. The output should give you clues as to why the collector isn't working. @@ -166,4 +168,37 @@ should give you clues as to why the collector isn't working. ./go.d.plugin -d -m wireguard ``` +### Getting Logs + +If you're encountering problems with the `wireguard` collector, follow these steps to retrieve logs and identify potential issues: + +- **Run the command** specific to your system (systemd, non-systemd, or Docker container). +- **Examine the output** for any warnings or error messages that might indicate issues. These messages should provide clues about the root cause of the problem. + +#### System with systemd + +Use the following command to view logs generated since the last Netdata service restart: + +```bash +journalctl _SYSTEMD_INVOCATION_ID="$(systemctl show --value --property=InvocationID netdata)" --namespace=netdata --grep wireguard +``` + +#### System without systemd + +Locate the collector log file, typically at `/var/log/netdata/collector.log`, and use `grep` to filter for collector's name: + +```bash +grep wireguard /var/log/netdata/collector.log +``` + +**Note**: This method shows logs from all restarts. Focus on the **latest entries** for troubleshooting current issues. + +#### Docker Container + +If your Netdata runs in a Docker container named "netdata" (replace if different), use this command: + +```bash +docker logs netdata 2>&1 | grep wireguard +``` + diff --git a/src/go/collectors/go.d.plugin/modules/wireguard/metadata.yaml b/src/go/plugin/go.d/modules/wireguard/metadata.yaml index 0ac680d58..0ac680d58 100644 --- a/src/go/collectors/go.d.plugin/modules/wireguard/metadata.yaml +++ b/src/go/plugin/go.d/modules/wireguard/metadata.yaml diff --git a/src/go/collectors/go.d.plugin/modules/wireguard/testdata/config.json b/src/go/plugin/go.d/modules/wireguard/testdata/config.json index 0e3f7c403..0e3f7c403 100644 --- a/src/go/collectors/go.d.plugin/modules/wireguard/testdata/config.json +++ b/src/go/plugin/go.d/modules/wireguard/testdata/config.json diff --git a/src/go/collectors/go.d.plugin/modules/wireguard/testdata/config.yaml b/src/go/plugin/go.d/modules/wireguard/testdata/config.yaml index f21a3a7a0..f21a3a7a0 100644 --- a/src/go/collectors/go.d.plugin/modules/wireguard/testdata/config.yaml +++ b/src/go/plugin/go.d/modules/wireguard/testdata/config.yaml diff --git a/src/go/collectors/go.d.plugin/modules/wireguard/wireguard.go b/src/go/plugin/go.d/modules/wireguard/wireguard.go index 59d3a5bc9..fdd42e193 100644 --- a/src/go/collectors/go.d.plugin/modules/wireguard/wireguard.go +++ b/src/go/plugin/go.d/modules/wireguard/wireguard.go @@ -7,7 +7,7 @@ import ( "errors" "time" - "github.com/netdata/netdata/go/go.d.plugin/agent/module" + "github.com/netdata/netdata/go/plugins/plugin/go.d/agent/module" "golang.zx2c4.com/wireguard/wgctrl" "golang.zx2c4.com/wireguard/wgctrl/wgtypes" diff --git a/src/go/collectors/go.d.plugin/modules/wireguard/wireguard_test.go b/src/go/plugin/go.d/modules/wireguard/wireguard_test.go index 6f13d3375..c9d27cbd0 100644 --- a/src/go/collectors/go.d.plugin/modules/wireguard/wireguard_test.go +++ b/src/go/plugin/go.d/modules/wireguard/wireguard_test.go @@ -10,7 +10,7 @@ import ( "testing" "time" - "github.com/netdata/netdata/go/go.d.plugin/agent/module" + "github.com/netdata/netdata/go/plugins/plugin/go.d/agent/module" "github.com/stretchr/testify/assert" "github.com/stretchr/testify/require" diff --git a/src/go/collectors/go.d.plugin/modules/x509check/README.md b/src/go/plugin/go.d/modules/x509check/README.md index 28978ccf7..28978ccf7 120000 --- a/src/go/collectors/go.d.plugin/modules/x509check/README.md +++ b/src/go/plugin/go.d/modules/x509check/README.md diff --git a/src/go/collectors/go.d.plugin/modules/x509check/charts.go b/src/go/plugin/go.d/modules/x509check/charts.go index 2a497dfe0..5105c6d17 100644 --- a/src/go/collectors/go.d.plugin/modules/x509check/charts.go +++ b/src/go/plugin/go.d/modules/x509check/charts.go @@ -2,7 +2,7 @@ package x509check -import "github.com/netdata/netdata/go/go.d.plugin/agent/module" +import "github.com/netdata/netdata/go/plugins/plugin/go.d/agent/module" var ( baseCharts = module.Charts{ @@ -36,6 +36,7 @@ var ( Ctx: "x509check.revocation_status", Opts: module.Opts{StoreFirst: true}, Dims: module.Dims{ + {ID: "not_revoked"}, {ID: "revoked"}, }, } diff --git a/src/go/collectors/go.d.plugin/modules/x509check/collect.go b/src/go/plugin/go.d/modules/x509check/collect.go index 3b5eebdb2..fc98e3a26 100644 --- a/src/go/collectors/go.d.plugin/modules/x509check/collect.go +++ b/src/go/plugin/go.d/modules/x509check/collect.go @@ -46,9 +46,13 @@ func (x *X509Check) collectRevocation(mx map[string]int64, certs []*x509.Certifi if !ok { return } + + mx["revoked"] = 0 + mx["not_revoked"] = 0 + if rev { mx["revoked"] = 1 } else { - mx["revoked"] = 0 + mx["not_revoked"] = 1 } } diff --git a/src/go/collectors/go.d.plugin/modules/x509check/config_schema.json b/src/go/plugin/go.d/modules/x509check/config_schema.json index 7246cfa7a..7246cfa7a 100644 --- a/src/go/collectors/go.d.plugin/modules/x509check/config_schema.json +++ b/src/go/plugin/go.d/modules/x509check/config_schema.json diff --git a/src/go/collectors/go.d.plugin/modules/x509check/init.go b/src/go/plugin/go.d/modules/x509check/init.go index f0df7fdef..8d6dece2f 100644 --- a/src/go/collectors/go.d.plugin/modules/x509check/init.go +++ b/src/go/plugin/go.d/modules/x509check/init.go @@ -5,7 +5,7 @@ package x509check import ( "errors" - "github.com/netdata/netdata/go/go.d.plugin/agent/module" + "github.com/netdata/netdata/go/plugins/plugin/go.d/agent/module" ) func (x *X509Check) validateConfig() error { diff --git a/src/go/collectors/go.d.plugin/modules/x509check/integrations/x.509_certificate.md b/src/go/plugin/go.d/modules/x509check/integrations/x.509_certificate.md index 6269d9773..ccbe12948 100644 --- a/src/go/collectors/go.d.plugin/modules/x509check/integrations/x.509_certificate.md +++ b/src/go/plugin/go.d/modules/x509check/integrations/x.509_certificate.md @@ -1,6 +1,6 @@ <!--startmeta -custom_edit_url: "https://github.com/netdata/netdata/edit/master/src/go/collectors/go.d.plugin/modules/x509check/README.md" -meta_yaml: "https://github.com/netdata/netdata/edit/master/src/go/collectors/go.d.plugin/modules/x509check/metadata.yaml" +custom_edit_url: "https://github.com/netdata/netdata/edit/master/src/go/plugin/go.d/modules/x509check/README.md" +meta_yaml: "https://github.com/netdata/netdata/edit/master/src/go/plugin/go.d/modules/x509check/metadata.yaml" sidebar_label: "X.509 certificate" learn_status: "Published" learn_rel_path: "Collecting Metrics/Synthetic Checks" @@ -69,7 +69,7 @@ Metrics: | Metric | Dimensions | Unit | |:------|:----------|:----| | x509check.time_until_expiration | expiry | seconds | -| x509check.revocation_status | revoked | boolean | +| x509check.revocation_status | not_revoked, revoked | boolean | @@ -80,8 +80,8 @@ The following alerts are available: | Alert name | On metric | Description | |:------------|:----------|:------------| -| [ x509check_days_until_expiration ](https://github.com/netdata/netdata/blob/master/src/health/health.d/x509check.conf) | x509check.time_until_expiration | time until x509 certificate expires | -| [ x509check_revocation_status ](https://github.com/netdata/netdata/blob/master/src/health/health.d/x509check.conf) | x509check.revocation_status | x509 certificate revocation status (0: revoked, 1: valid) | +| [ x509check_days_until_expiration ](https://github.com/netdata/netdata/blob/master/src/health/health.d/x509check.conf) | x509check.time_until_expiration | Time until x509 certificate expires for ${label:source} | +| [ x509check_revocation_status ](https://github.com/netdata/netdata/blob/master/src/health/health.d/x509check.conf) | x509check.revocation_status | x509 certificate revocation status for ${label:source} | ## Setup @@ -200,6 +200,8 @@ jobs: ### Debug Mode +**Important**: Debug mode is not supported for data collection jobs created via the UI using the Dyncfg feature. + To troubleshoot issues with the `x509check` collector, run the `go.d.plugin` with the debug option enabled. The output should give you clues as to why the collector isn't working. @@ -222,4 +224,37 @@ should give you clues as to why the collector isn't working. ./go.d.plugin -d -m x509check ``` +### Getting Logs + +If you're encountering problems with the `x509check` collector, follow these steps to retrieve logs and identify potential issues: + +- **Run the command** specific to your system (systemd, non-systemd, or Docker container). +- **Examine the output** for any warnings or error messages that might indicate issues. These messages should provide clues about the root cause of the problem. + +#### System with systemd + +Use the following command to view logs generated since the last Netdata service restart: + +```bash +journalctl _SYSTEMD_INVOCATION_ID="$(systemctl show --value --property=InvocationID netdata)" --namespace=netdata --grep x509check +``` + +#### System without systemd + +Locate the collector log file, typically at `/var/log/netdata/collector.log`, and use `grep` to filter for collector's name: + +```bash +grep x509check /var/log/netdata/collector.log +``` + +**Note**: This method shows logs from all restarts. Focus on the **latest entries** for troubleshooting current issues. + +#### Docker Container + +If your Netdata runs in a Docker container named "netdata" (replace if different), use this command: + +```bash +docker logs netdata 2>&1 | grep x509check +``` + diff --git a/src/go/collectors/go.d.plugin/modules/x509check/metadata.yaml b/src/go/plugin/go.d/modules/x509check/metadata.yaml index c9136822e..e373f33d7 100644 --- a/src/go/collectors/go.d.plugin/modules/x509check/metadata.yaml +++ b/src/go/plugin/go.d/modules/x509check/metadata.yaml @@ -138,11 +138,11 @@ modules: alerts: - name: x509check_days_until_expiration metric: x509check.time_until_expiration - info: time until x509 certificate expires + info: "Time until x509 certificate expires for ${label:source}" link: https://github.com/netdata/netdata/blob/master/src/health/health.d/x509check.conf - name: x509check_revocation_status metric: x509check.revocation_status - info: "x509 certificate revocation status (0: revoked, 1: valid)" + info: "x509 certificate revocation status for ${label:source}" link: https://github.com/netdata/netdata/blob/master/src/health/health.d/x509check.conf metrics: folding: @@ -168,4 +168,5 @@ modules: unit: boolean chart_type: line dimensions: + - name: not_revoked - name: revoked diff --git a/src/go/collectors/go.d.plugin/modules/x509check/provider.go b/src/go/plugin/go.d/modules/x509check/provider.go index 73e1e257d..4a0635704 100644 --- a/src/go/collectors/go.d.plugin/modules/x509check/provider.go +++ b/src/go/plugin/go.d/modules/x509check/provider.go @@ -13,7 +13,7 @@ import ( "os" "time" - "github.com/netdata/netdata/go/go.d.plugin/pkg/tlscfg" + "github.com/netdata/netdata/go/plugins/plugin/go.d/pkg/tlscfg" ) type provider interface { diff --git a/src/go/collectors/go.d.plugin/modules/x509check/testdata/config.json b/src/go/plugin/go.d/modules/x509check/testdata/config.json index 9bb2dade4..9bb2dade4 100644 --- a/src/go/collectors/go.d.plugin/modules/x509check/testdata/config.json +++ b/src/go/plugin/go.d/modules/x509check/testdata/config.json diff --git a/src/go/collectors/go.d.plugin/modules/x509check/testdata/config.yaml b/src/go/plugin/go.d/modules/x509check/testdata/config.yaml index e1f273f56..e1f273f56 100644 --- a/src/go/collectors/go.d.plugin/modules/x509check/testdata/config.yaml +++ b/src/go/plugin/go.d/modules/x509check/testdata/config.yaml diff --git a/src/go/collectors/go.d.plugin/modules/x509check/x509check.go b/src/go/plugin/go.d/modules/x509check/x509check.go index 3ed1f1bb2..c4fa70eac 100644 --- a/src/go/collectors/go.d.plugin/modules/x509check/x509check.go +++ b/src/go/plugin/go.d/modules/x509check/x509check.go @@ -7,11 +7,11 @@ import ( "errors" "time" - "github.com/netdata/netdata/go/go.d.plugin/pkg/tlscfg" - "github.com/netdata/netdata/go/go.d.plugin/pkg/web" + "github.com/netdata/netdata/go/plugins/plugin/go.d/pkg/tlscfg" + "github.com/netdata/netdata/go/plugins/plugin/go.d/pkg/web" cfssllog "github.com/cloudflare/cfssl/log" - "github.com/netdata/netdata/go/go.d.plugin/agent/module" + "github.com/netdata/netdata/go/plugins/plugin/go.d/agent/module" ) //go:embed "config_schema.json" diff --git a/src/go/collectors/go.d.plugin/modules/x509check/x509check_test.go b/src/go/plugin/go.d/modules/x509check/x509check_test.go index 6d93bd3e4..e0b287251 100644 --- a/src/go/collectors/go.d.plugin/modules/x509check/x509check_test.go +++ b/src/go/plugin/go.d/modules/x509check/x509check_test.go @@ -8,8 +8,8 @@ import ( "os" "testing" - "github.com/netdata/netdata/go/go.d.plugin/agent/module" - "github.com/netdata/netdata/go/go.d.plugin/pkg/tlscfg" + "github.com/netdata/netdata/go/plugins/plugin/go.d/agent/module" + "github.com/netdata/netdata/go/plugins/plugin/go.d/pkg/tlscfg" "github.com/stretchr/testify/assert" "github.com/stretchr/testify/require" diff --git a/src/go/collectors/go.d.plugin/modules/zfspool/README.md b/src/go/plugin/go.d/modules/zfspool/README.md index 8a292336d..8a292336d 120000 --- a/src/go/collectors/go.d.plugin/modules/zfspool/README.md +++ b/src/go/plugin/go.d/modules/zfspool/README.md diff --git a/src/go/collectors/go.d.plugin/modules/zfspool/charts.go b/src/go/plugin/go.d/modules/zfspool/charts.go index 45943c656..92a7d53bd 100644 --- a/src/go/collectors/go.d.plugin/modules/zfspool/charts.go +++ b/src/go/plugin/go.d/modules/zfspool/charts.go @@ -6,26 +6,48 @@ import ( "fmt" "strings" - "github.com/netdata/netdata/go/go.d.plugin/agent/module" + "github.com/netdata/netdata/go/plugins/plugin/go.d/agent/module" ) const ( - prioZpoolSpaceUtilization = 2820 + iota + prioZpoolHealthState = 2820 + iota + prioVdevHealthState + + prioZpoolSpaceUtilization prioZpoolSpaceUsage + prioZpoolFragmentation - prioZpoolHealthState ) var zpoolChartsTmpl = module.Charts{ + zpoolHealthStateChartTmpl.Copy(), + zpoolSpaceUtilizationChartTmpl.Copy(), zpoolSpaceUsageChartTmpl.Copy(), zpoolFragmentationChartTmpl.Copy(), - - zpoolHealthStateChartTmpl.Copy(), } var ( + zpoolHealthStateChartTmpl = module.Chart{ + ID: "zfspool_%s_health_state", + Title: "Zpool health state", + Units: "state", + Fam: "health", + Ctx: "zfspool.pool_health_state", + Type: module.Line, + Priority: prioZpoolHealthState, + Dims: module.Dims{ + {ID: "zpool_%s_health_state_online", Name: "online"}, + {ID: "zpool_%s_health_state_degraded", Name: "degraded"}, + {ID: "zpool_%s_health_state_faulted", Name: "faulted"}, + {ID: "zpool_%s_health_state_offline", Name: "offline"}, + {ID: "zpool_%s_health_state_unavail", Name: "unavail"}, + {ID: "zpool_%s_health_state_removed", Name: "removed"}, + {ID: "zpool_%s_health_state_suspended", Name: "suspended"}, + }, + } + zpoolSpaceUtilizationChartTmpl = module.Chart{ ID: "zfspool_%s_space_utilization", Title: "Zpool space utilization", @@ -64,23 +86,29 @@ var ( {ID: "zpool_%s_frag", Name: "fragmentation"}, }, } +) - zpoolHealthStateChartTmpl = module.Chart{ - ID: "zfspool_%s_health_state", - Title: "Zpool health state", +var vdevChartsTmpl = module.Charts{ + vdevHealthStateChartTmpl.Copy(), +} + +var ( + vdevHealthStateChartTmpl = module.Chart{ + ID: "vdev_%s_health_state", + Title: "Zpool Vdev health state", Units: "state", Fam: "health", - Ctx: "zfspool.pool_health_state", + Ctx: "zfspool.vdev_health_state", Type: module.Line, - Priority: prioZpoolHealthState, + Priority: prioVdevHealthState, Dims: module.Dims{ - {ID: "zpool_%s_health_state_online", Name: "online"}, - {ID: "zpool_%s_health_state_degraded", Name: "degraded"}, - {ID: "zpool_%s_health_state_faulted", Name: "faulted"}, - {ID: "zpool_%s_health_state_offline", Name: "offline"}, - {ID: "zpool_%s_health_state_unavail", Name: "unavail"}, - {ID: "zpool_%s_health_state_removed", Name: "removed"}, - {ID: "zpool_%s_health_state_suspended", Name: "suspended"}, + {ID: "vdev_%s_health_state_online", Name: "online"}, + {ID: "vdev_%s_health_state_degraded", Name: "degraded"}, + {ID: "vdev_%s_health_state_faulted", Name: "faulted"}, + {ID: "vdev_%s_health_state_offline", Name: "offline"}, + {ID: "vdev_%s_health_state_unavail", Name: "unavail"}, + {ID: "vdev_%s_health_state_removed", Name: "removed"}, + {ID: "vdev_%s_health_state_suspended", Name: "suspended"}, }, } ) @@ -104,8 +132,35 @@ func (z *ZFSPool) addZpoolCharts(name string) { } func (z *ZFSPool) removeZpoolCharts(name string) { - px := fmt.Sprintf("zpool_%s_", name) + px := fmt.Sprintf("zfspool_%s_", name) + z.removeCharts(px) +} +func (z *ZFSPool) addVdevCharts(pool, vdev string) { + charts := vdevChartsTmpl.Copy() + + for _, chart := range *charts { + chart.ID = fmt.Sprintf(chart.ID, cleanVdev(vdev)) + chart.Labels = []module.Label{ + {Key: "pool", Value: pool}, + {Key: "vdev", Value: vdev}, + } + for _, dim := range chart.Dims { + dim.ID = fmt.Sprintf(dim.ID, vdev) + } + } + + if err := z.Charts().Add(*charts...); err != nil { + z.Warning(err) + } +} + +func (z *ZFSPool) removeVdevCharts(vdev string) { + px := fmt.Sprintf("vdev_%s_", cleanVdev(vdev)) + z.removeCharts(px) +} + +func (z *ZFSPool) removeCharts(px string) { for _, chart := range *z.Charts() { if strings.HasPrefix(chart.ID, px) { chart.MarkRemove() @@ -113,3 +168,8 @@ func (z *ZFSPool) removeZpoolCharts(name string) { } } } + +func cleanVdev(vdev string) string { + r := strings.NewReplacer(".", "_") + return r.Replace(vdev) +} diff --git a/src/go/plugin/go.d/modules/zfspool/collect.go b/src/go/plugin/go.d/modules/zfspool/collect.go new file mode 100644 index 000000000..b9b29058b --- /dev/null +++ b/src/go/plugin/go.d/modules/zfspool/collect.go @@ -0,0 +1,27 @@ +// SPDX-License-Identifier: GPL-3.0-or-later + +package zfspool + +var zpoolHealthStates = []string{ + "online", + "degraded", + "faulted", + "offline", + "removed", + "unavail", + "suspended", +} + +func (z *ZFSPool) collect() (map[string]int64, error) { + + mx := make(map[string]int64) + + if err := z.collectZpoolList(mx); err != nil { + return nil, err + } + if err := z.collectZpoolListVdev(mx); err != nil { + return mx, err + } + + return mx, nil +} diff --git a/src/go/collectors/go.d.plugin/modules/zfspool/collect.go b/src/go/plugin/go.d/modules/zfspool/collect_zpool_list.go index 43994bfc1..f5e1c0812 100644 --- a/src/go/collectors/go.d.plugin/modules/zfspool/collect.go +++ b/src/go/plugin/go.d/modules/zfspool/collect_zpool_list.go @@ -5,22 +5,13 @@ package zfspool import ( "bufio" "bytes" + "errors" "fmt" "strconv" "strings" ) -var zpoolHealthStates = []string{ - "online", - "degraded", - "faulted", - "offline", - "removed", - "unavail", - "suspended", -} - -type zpoolStats struct { +type zpoolEntry struct { name string sizeBytes string allocBytes string @@ -31,33 +22,25 @@ type zpoolStats struct { health string } -func (z *ZFSPool) collect() (map[string]int64, error) { +func (z *ZFSPool) collectZpoolList(mx map[string]int64) error { bs, err := z.exec.list() if err != nil { - return nil, err + return err } zpools, err := parseZpoolListOutput(bs) if err != nil { - return nil, err + return fmt.Errorf("bad zpool list output: %v", err) } - mx := make(map[string]int64) - - z.collectZpoolListStats(mx, zpools) - - return mx, nil -} - -func (z *ZFSPool) collectZpoolListStats(mx map[string]int64, zpools []zpoolStats) { seen := make(map[string]bool) for _, zpool := range zpools { seen[zpool.name] = true - if !z.zpools[zpool.name] { + if !z.seenZpools[zpool.name] { z.addZpoolCharts(zpool.name) - z.zpools[zpool.name] = true + z.seenZpools[zpool.name] = true } px := "zpool_" + zpool.name + "_" @@ -83,34 +66,17 @@ func (z *ZFSPool) collectZpoolListStats(mx map[string]int64, zpools []zpoolStats mx[px+"health_state_"+zpool.health] = 1 } - for name := range z.zpools { + for name := range z.seenZpools { if !seen[name] { z.removeZpoolCharts(name) - delete(z.zpools, name) - } - } -} - -func parseZpoolListOutput(bs []byte) ([]zpoolStats, error) { - var lines []string - sc := bufio.NewScanner(bytes.NewReader(bs)) - for sc.Scan() { - if text := strings.TrimSpace(sc.Text()); text != "" { - lines = append(lines, text) + delete(z.seenZpools, name) } - - } - if len(lines) < 2 { - return nil, fmt.Errorf("unexpected data: wanted >= 2 lines, got %d", len(lines)) } - headers := strings.Fields(lines[0]) - if len(headers) == 0 { - return nil, fmt.Errorf("unexpected data: missing headers") - } - - var zpools []zpoolStats + return nil +} +func parseZpoolListOutput(bs []byte) ([]zpoolEntry, error) { /* # zpool list -p NAME SIZE ALLOC FREE EXPANDSZ FRAG CAP DEDUP HEALTH ALTROOT @@ -118,13 +84,30 @@ func parseZpoolListOutput(bs []byte) ([]zpoolStats, error) { zion - - - - - - - FAULTED - */ - for _, line := range lines[1:] { + var headers []string + var zpools []zpoolEntry + sc := bufio.NewScanner(bytes.NewReader(bs)) + + for sc.Scan() { + line := strings.TrimSpace(sc.Text()) + if line == "" { + continue + } + + if len(headers) == 0 { + if !strings.HasPrefix(line, "NAME") { + return nil, fmt.Errorf("missing headers (line '%s')", line) + } + headers = strings.Fields(line) + continue + } + values := strings.Fields(line) if len(values) != len(headers) { return nil, fmt.Errorf("unequal columns: headers(%d) != values(%d)", len(headers), len(values)) } - var zpool zpoolStats + var zpool zpoolEntry for i, v := range values { v = strings.TrimSpace(v) @@ -146,15 +129,15 @@ func parseZpoolListOutput(bs []byte) ([]zpoolStats, error) { case "health": zpool.health = strings.ToLower(v) } + } - if last := i+1 == len(headers); last && zpool.name != "" && zpool.health != "" { - zpools = append(zpools, zpool) - } + if zpool.name != "" && zpool.health != "" { + zpools = append(zpools, zpool) } } if len(zpools) == 0 { - return nil, fmt.Errorf("unexpected data: missing pools") + return nil, errors.New("no pools found") } return zpools, nil diff --git a/src/go/plugin/go.d/modules/zfspool/collect_zpool_list_vdev.go b/src/go/plugin/go.d/modules/zfspool/collect_zpool_list_vdev.go new file mode 100644 index 000000000..30e1fe4e1 --- /dev/null +++ b/src/go/plugin/go.d/modules/zfspool/collect_zpool_list_vdev.go @@ -0,0 +1,138 @@ +// SPDX-License-Identifier: GPL-3.0-or-later + +package zfspool + +import ( + "bufio" + "bytes" + "fmt" + "strings" +) + +type vdevEntry struct { + name string + vdev string // The full path of the vdev within the zpool hierarchy. + health string + + // Represents the nesting level of the vdev within the zpool hierarchy, based on indentation. + // A level of -1 indicates the root vdev (the pool itself). + level int +} + +func (z *ZFSPool) collectZpoolListVdev(mx map[string]int64) error { + seen := make(map[string]bool) + + for pool := range z.seenZpools { + bs, err := z.exec.listWithVdev(pool) + if err != nil { + return err + } + + vdevs, err := parseZpoolListVdevOutput(bs) + if err != nil { + return fmt.Errorf("bad zpool list vdev output (pool '%s'): %v", pool, err) + } + + for _, vdev := range vdevs { + if vdev.health == "" || vdev.health == "-" { + continue + } + + seen[vdev.vdev] = true + if !z.seenVdevs[vdev.vdev] { + z.seenVdevs[vdev.vdev] = true + z.addVdevCharts(pool, vdev.vdev) + } + + px := fmt.Sprintf("vdev_%s_", vdev.vdev) + + for _, s := range zpoolHealthStates { + mx[px+"health_state_"+s] = 0 + } + mx[px+"health_state_"+vdev.health] = 1 + } + } + + for name := range z.seenVdevs { + if !seen[name] { + z.removeVdevCharts(name) + delete(z.seenVdevs, name) + } + } + + return nil +} + +func parseZpoolListVdevOutput(bs []byte) ([]vdevEntry, error) { + var headers []string + var vdevs []vdevEntry + sc := bufio.NewScanner(bytes.NewReader(bs)) + + for sc.Scan() { + line := sc.Text() + if line == "" { + continue + } + + if len(headers) == 0 { + if !strings.HasPrefix(line, "NAME") { + return nil, fmt.Errorf("missing headers (line '%s')", line) + } + headers = strings.Fields(line) + continue + } + + values := strings.Fields(line) + if len(values) == 0 || len(values) > len(headers) { + return nil, fmt.Errorf("unexpected columns: headers(%d) values(%d) (line '%s')", len(headers), len(values), line) + } + + vdev := vdevEntry{ + level: len(line) - len(strings.TrimLeft(line, " ")), + } + + for i, v := range values { + switch strings.ToLower(headers[i]) { + case "name": + vdev.name = v + case "health": + vdev.health = strings.ToLower(v) + } + } + + if vdev.name != "" { + if len(vdevs) == 0 { + vdev.level = -1 // Pool + } + vdevs = append(vdevs, vdev) + } + } + + // set parent/child relationships + for i := range vdevs { + v := &vdevs[i] + + switch i { + case 0: + v.vdev = v.name + default: + // find parent with a lower level + for j := i - 1; j >= 0; j-- { + if vdevs[j].level < v.level { + v.vdev = fmt.Sprintf("%s/%s", vdevs[j].vdev, v.name) + break + } + } + if v.vdev == "" { + return nil, fmt.Errorf("no parent for vdev '%s'", v.name) + } + } + } + + // first is Pool + if len(vdevs) < 2 { + return nil, fmt.Errorf("no vdevs found") + } + + return vdevs[1:], nil +} diff --git a/src/go/collectors/go.d.plugin/modules/zfspool/config_schema.json b/src/go/plugin/go.d/modules/zfspool/config_schema.json index fcfcff1d4..fcfcff1d4 100644 --- a/src/go/collectors/go.d.plugin/modules/zfspool/config_schema.json +++ b/src/go/plugin/go.d/modules/zfspool/config_schema.json diff --git a/src/go/collectors/go.d.plugin/modules/zfspool/exec.go b/src/go/plugin/go.d/modules/zfspool/exec.go index 0c155872e..1a2bcf203 100644 --- a/src/go/collectors/go.d.plugin/modules/zfspool/exec.go +++ b/src/go/plugin/go.d/modules/zfspool/exec.go @@ -8,7 +8,7 @@ import ( "os/exec" "time" - "github.com/netdata/netdata/go/go.d.plugin/logger" + "github.com/netdata/netdata/go/plugins/logger" ) func newZpoolCLIExec(binPath string, timeout time.Duration) *zpoolCLIExec { @@ -39,3 +39,18 @@ func (e *zpoolCLIExec) list() ([]byte, error) { return bs, nil } + +func (e *zpoolCLIExec) listWithVdev(pool string) ([]byte, error) { + ctx, cancel := context.WithTimeout(context.Background(), e.timeout) + defer cancel() + + cmd := exec.CommandContext(ctx, e.binPath, "list", "-p", "-v", "-L", pool) + e.Debugf("executing '%s'", cmd) + + bs, err := cmd.Output() + if err != nil { + return nil, fmt.Errorf("error on '%s': %v", cmd, err) + } + + return bs, nil +} diff --git a/src/go/collectors/go.d.plugin/modules/zfspool/init.go b/src/go/plugin/go.d/modules/zfspool/init.go index f640801dd..f640801dd 100644 --- a/src/go/collectors/go.d.plugin/modules/zfspool/init.go +++ b/src/go/plugin/go.d/modules/zfspool/init.go diff --git a/src/go/collectors/go.d.plugin/modules/zfspool/integrations/zfs_pools.md b/src/go/plugin/go.d/modules/zfspool/integrations/zfs_pools.md index 827ae9111..060e4fb71 100644 --- a/src/go/collectors/go.d.plugin/modules/zfspool/integrations/zfs_pools.md +++ b/src/go/plugin/go.d/modules/zfspool/integrations/zfs_pools.md @@ -1,6 +1,6 @@ <!--startmeta -custom_edit_url: "https://github.com/netdata/netdata/edit/master/src/go/collectors/go.d.plugin/modules/zfspool/README.md" -meta_yaml: "https://github.com/netdata/netdata/edit/master/src/go/collectors/go.d.plugin/modules/zfspool/metadata.yaml" +custom_edit_url: "https://github.com/netdata/netdata/edit/master/src/go/plugin/go.d/modules/zfspool/README.md" +meta_yaml: "https://github.com/netdata/netdata/edit/master/src/go/plugin/go.d/modules/zfspool/metadata.yaml" sidebar_label: "ZFS Pools" learn_status: "Published" learn_rel_path: "Collecting Metrics/Storage, Mount Points and Filesystems" @@ -73,6 +73,23 @@ Metrics: | zfspool.pool_fragmentation | fragmentation | % | | zfspool.pool_health_state | online, degraded, faulted, offline, unavail, removed, suspended | state | +### Per zfs pool vdev + +These metrics refer to the ZFS pool virtual device. + +Labels: + +| Label | Description | +|:-----------|:----------------| +| pool | Zpool name | +| vdev | Unique identifier for a virtual device (vdev) within a ZFS pool. | + +Metrics: + +| Metric | Dimensions | Unit | +|:------|:----------|:----| +| zfspool.vdev_health_state | online, degraded, faulted, offline, unavail, removed, suspended | state | + ## Alerts @@ -85,6 +102,7 @@ The following alerts are available: | [ zfs_pool_space_utilization ](https://github.com/netdata/netdata/blob/master/src/health/health.d/zfs.conf) | zfspool.pool_space_utilization | ZFS pool ${label:pool} is nearing capacity. Current space usage is above the threshold. | | [ zfs_pool_health_state_warn ](https://github.com/netdata/netdata/blob/master/src/health/health.d/zfs.conf) | zfspool.pool_health_state | ZFS pool ${label:pool} state is degraded | | [ zfs_pool_health_state_crit ](https://github.com/netdata/netdata/blob/master/src/health/health.d/zfs.conf) | zfspool.pool_health_state | ZFS pool ${label:pool} state is faulted or unavail | +| [ zfs_vdev_health_state ](https://github.com/netdata/netdata/blob/master/src/health/health.d/zfs.conf) | zfspool.vdev_health_state | ZFS vdev ${label:vdev} state is faulted or degraded | ## Setup @@ -144,6 +162,8 @@ jobs: ### Debug Mode +**Important**: Debug mode is not supported for data collection jobs created via the UI using the Dyncfg feature. + To troubleshoot issues with the `zfspool` collector, run the `go.d.plugin` with the debug option enabled. The output should give you clues as to why the collector isn't working. @@ -166,4 +186,37 @@ should give you clues as to why the collector isn't working. ./go.d.plugin -d -m zfspool ``` +### Getting Logs + +If you're encountering problems with the `zfspool` collector, follow these steps to retrieve logs and identify potential issues: + +- **Run the command** specific to your system (systemd, non-systemd, or Docker container). +- **Examine the output** for any warnings or error messages that might indicate issues. These messages should provide clues about the root cause of the problem. + +#### System with systemd + +Use the following command to view logs generated since the last Netdata service restart: + +```bash +journalctl _SYSTEMD_INVOCATION_ID="$(systemctl show --value --property=InvocationID netdata)" --namespace=netdata --grep zfspool +``` + +#### System without systemd + +Locate the collector log file, typically at `/var/log/netdata/collector.log`, and use `grep` to filter for collector's name: + +```bash +grep zfspool /var/log/netdata/collector.log +``` + +**Note**: This method shows logs from all restarts. Focus on the **latest entries** for troubleshooting current issues. + +#### Docker Container + +If your Netdata runs in a Docker container named "netdata" (replace if different), use this command: + +```bash +docker logs netdata 2>&1 | grep zfspool +``` + diff --git a/src/go/collectors/go.d.plugin/modules/zfspool/metadata.yaml b/src/go/plugin/go.d/modules/zfspool/metadata.yaml index 847ee483e..21cc307ca 100644 --- a/src/go/collectors/go.d.plugin/modules/zfspool/metadata.yaml +++ b/src/go/plugin/go.d/modules/zfspool/metadata.yaml @@ -92,6 +92,10 @@ modules: metric: zfspool.pool_health_state info: "ZFS pool ${label:pool} state is faulted or unavail" link: https://github.com/netdata/netdata/blob/master/src/health/health.d/zfs.conf + - name: zfs_vdev_health_state + metric: zfspool.vdev_health_state + info: "ZFS vdev ${label:vdev} state is faulted or degraded" + link: https://github.com/netdata/netdata/blob/master/src/health/health.d/zfs.conf metrics: folding: title: Metrics @@ -136,3 +140,23 @@ modules: - name: unavail - name: removed - name: suspended + - name: zfs pool vdev + description: These metrics refer to the ZFS pool virtual device. + labels: + - name: pool + description: Zpool name + - name: vdev + description: Unique identifier for a virtual device (vdev) within a ZFS pool. + metrics: + - name: zfspool.vdev_health_state + description: Zpool Vdev health state + unit: 'state' + chart_type: line + dimensions: + - name: online + - name: degraded + - name: faulted + - name: offline + - name: unavail + - name: removed + - name: suspended diff --git a/src/go/plugin/go.d/modules/zfspool/testdata/config.json b/src/go/plugin/go.d/modules/zfspool/testdata/config.json new file mode 100644 index 000000000..095713193 --- /dev/null +++ b/src/go/plugin/go.d/modules/zfspool/testdata/config.json @@ -0,0 +1,5 @@ +{ + "update_every": 123, + "timeout": 123.123, + "binary_path": "ok" +} diff --git a/src/go/plugin/go.d/modules/zfspool/testdata/config.yaml b/src/go/plugin/go.d/modules/zfspool/testdata/config.yaml new file mode 100644 index 000000000..baf3bcd0b --- /dev/null +++ b/src/go/plugin/go.d/modules/zfspool/testdata/config.yaml @@ -0,0 +1,3 @@ +update_every: 123 +timeout: 123.123 +binary_path: "ok" diff --git a/src/go/plugin/go.d/modules/zfspool/testdata/zpool-list-vdev-logs-cache.txt b/src/go/plugin/go.d/modules/zfspool/testdata/zpool-list-vdev-logs-cache.txt new file mode 100644 index 000000000..061ca6ccd --- /dev/null +++ b/src/go/plugin/go.d/modules/zfspool/testdata/zpool-list-vdev-logs-cache.txt @@ -0,0 +1,12 @@ +NAME SIZE ALLOC FREE CKPOINT EXPANDSZ FRAG CAP DEDUP HEALTH ALTROOT +rpool 9981503995904 3046188658688 6935315337216 - - 9 30 1.00 DEGRADED - + mirror-0 9981503995904 3046188658688 6935315337216 - - 9 30 - ONLINE + sdc2 9998683602944 - - - - - - - ONLINE + sdd2 9998683602944 - - - - - - - ONLINE +logs - - - - - - - - - + mirror-1 17716740096 393216 17716346880 - - 0 0 - DEGRADED + sdb1 17951621120 - - - - - - - ONLINE + 14807975228228307538 - - - - - - - - UNAVAIL +cache - - - - - - - - - + sdb2 99000254464 98755866624 239665152 - - 0 99 - ONLINE + wwn-0x500151795954c095-part2 - - - - - - - - UNAVAIL diff --git a/src/go/plugin/go.d/modules/zfspool/testdata/zpool-list-vdev.txt b/src/go/plugin/go.d/modules/zfspool/testdata/zpool-list-vdev.txt new file mode 100644 index 000000000..ff78f8df0 --- /dev/null +++ b/src/go/plugin/go.d/modules/zfspool/testdata/zpool-list-vdev.txt @@ -0,0 +1,5 @@ +NAME SIZE ALLOC FREE CKPOINT EXPANDSZ FRAG CAP DEDUP HEALTH ALTROOT +rpool 3985729650688 1647130456064 2338599194624 - - 55 41 1.00 ONLINE - + mirror-0 3985729650688 1647130456064 2338599194624 - - 55 41 - ONLINE + nvme2n1p3 4000249020416 - - - - - - - ONLINE + nvme0n1p3 4000249020416 - - - - - - - ONLINE diff --git a/src/go/collectors/go.d.plugin/modules/zfspool/testdata/zpool-list.txt b/src/go/plugin/go.d/modules/zfspool/testdata/zpool-list.txt index 06d9915c2..06d9915c2 100644 --- a/src/go/collectors/go.d.plugin/modules/zfspool/testdata/zpool-list.txt +++ b/src/go/plugin/go.d/modules/zfspool/testdata/zpool-list.txt diff --git a/src/go/collectors/go.d.plugin/modules/zfspool/zfspool.go b/src/go/plugin/go.d/modules/zfspool/zfspool.go index 154aacb20..02f1f7ce9 100644 --- a/src/go/collectors/go.d.plugin/modules/zfspool/zfspool.go +++ b/src/go/plugin/go.d/modules/zfspool/zfspool.go @@ -7,8 +7,8 @@ import ( "errors" "time" - "github.com/netdata/netdata/go/go.d.plugin/agent/module" - "github.com/netdata/netdata/go/go.d.plugin/pkg/web" + "github.com/netdata/netdata/go/plugins/plugin/go.d/agent/module" + "github.com/netdata/netdata/go/plugins/plugin/go.d/pkg/web" ) //go:embed "config_schema.json" @@ -31,8 +31,9 @@ func New() *ZFSPool { BinaryPath: "/usr/bin/zpool", Timeout: web.Duration(time.Second * 2), }, - charts: &module.Charts{}, - zpools: make(map[string]bool), + charts: &module.Charts{}, + seenZpools: make(map[string]bool), + seenVdevs: make(map[string]bool), } } @@ -51,10 +52,12 @@ type ( exec zpoolCLI - zpools map[string]bool + seenZpools map[string]bool + seenVdevs map[string]bool } zpoolCLI interface { list() ([]byte, error) + listWithVdev(pool string) ([]byte, error) } ) diff --git a/src/go/plugin/go.d/modules/zfspool/zfspool_test.go b/src/go/plugin/go.d/modules/zfspool/zfspool_test.go new file mode 100644 index 000000000..bf64d1713 --- /dev/null +++ b/src/go/plugin/go.d/modules/zfspool/zfspool_test.go @@ -0,0 +1,546 @@ +// SPDX-License-Identifier: GPL-3.0-or-later + +package zfspool + +import ( + "errors" + "os" + "strings" + "testing" + + "github.com/netdata/netdata/go/plugins/plugin/go.d/agent/module" + + "github.com/stretchr/testify/assert" + "github.com/stretchr/testify/require" +) + +var ( + dataConfigJSON, _ = os.ReadFile("testdata/config.json") + dataConfigYAML, _ = os.ReadFile("testdata/config.yaml") + + dataZpoolList, _ = os.ReadFile("testdata/zpool-list.txt") + dataZpoolListWithVdev, _ = os.ReadFile("testdata/zpool-list-vdev.txt") + dataZpoolListWithVdevLogsCache, _ = os.ReadFile("testdata/zpool-list-vdev-logs-cache.txt") +) + +func Test_testDataIsValid(t *testing.T) { + for name, data := range map[string][]byte{ + "dataConfigJSON": dataConfigJSON, + "dataConfigYAML": dataConfigYAML, + + "dataZpoolList": dataZpoolList, + "dataZpoolListWithVdev": dataZpoolListWithVdev, + "dataZpoolListWithVdevLogsCache": dataZpoolListWithVdevLogsCache, + } { + require.NotNil(t, data, name) + + } +} + +func TestZFSPool_Configuration(t *testing.T) { + module.TestConfigurationSerialize(t, &ZFSPool{}, dataConfigJSON, dataConfigYAML) +} + +func TestZFSPool_Init(t *testing.T) { + tests := map[string]struct { + config Config + wantFail bool + }{ + "fails if 'binary_path' is not set": { + wantFail: true, + config: Config{ + BinaryPath: "", + }, + }, + "fails if failed to find binary": { + wantFail: true, + config: Config{ + BinaryPath: "zpool!!!", + }, + }, + } + + for name, test := range tests { + t.Run(name, func(t *testing.T) { + zp := New() + zp.Config = test.config + + if test.wantFail { + assert.Error(t, zp.Init()) + } else { + assert.NoError(t, zp.Init()) + } + }) + } +} + +func TestZFSPool_Cleanup(t *testing.T) { + tests := map[string]struct { + prepare func() *ZFSPool + }{ + "not initialized exec": { + prepare: func() *ZFSPool { + return New() + }, + }, + "after check": { + prepare: func() *ZFSPool { + zp := New() + zp.exec = prepareMockOk() + _ = zp.Check() + return zp + }, + }, + "after collect": { + prepare: func() *ZFSPool { + zp := New() + zp.exec = prepareMockOk() + _ = zp.Collect() + return zp + }, + }, + } + + for name, test := range tests { + t.Run(name, func(t *testing.T) { + zp := test.prepare() + + assert.NotPanics(t, zp.Cleanup) + }) + } +} + +func TestZFSPool_Charts(t *testing.T) { + assert.NotNil(t, New().Charts()) +} + +func TestZFSPool_Check(t *testing.T) { + tests := map[string]struct { + prepareMock func() *mockZpoolCLIExec + wantFail bool + }{ + "success case": { + prepareMock: prepareMockOk, + wantFail: false, + }, + "error on list call": { + prepareMock: prepareMockErrOnList, + wantFail: true, + }, + "empty response": { + prepareMock: prepareMockEmptyResponse, + wantFail: true, + }, + "unexpected response": { + prepareMock: prepareMockUnexpectedResponse, + wantFail: true, + }, + } + + for name, test := range tests { + t.Run(name, func(t *testing.T) { + zp := New() + mock := test.prepareMock() + zp.exec = mock + + if test.wantFail { + assert.Error(t, zp.Check()) + } else { + assert.NoError(t, zp.Check()) + } + }) + } +} + +func TestZFSPool_Collect(t *testing.T) { + tests := map[string]struct { + prepareMock func() *mockZpoolCLIExec + wantMetrics map[string]int64 + }{ + "success case": { + prepareMock: prepareMockOk, + wantMetrics: map[string]int64{ + "vdev_rpool/mirror-0/nvme0n1p3_health_state_degraded": 0, + "vdev_rpool/mirror-0/nvme0n1p3_health_state_faulted": 0, + "vdev_rpool/mirror-0/nvme0n1p3_health_state_offline": 0, + "vdev_rpool/mirror-0/nvme0n1p3_health_state_online": 1, + "vdev_rpool/mirror-0/nvme0n1p3_health_state_removed": 0, + "vdev_rpool/mirror-0/nvme0n1p3_health_state_suspended": 0, + "vdev_rpool/mirror-0/nvme0n1p3_health_state_unavail": 0, + "vdev_rpool/mirror-0/nvme2n1p3_health_state_degraded": 0, + "vdev_rpool/mirror-0/nvme2n1p3_health_state_faulted": 0, + "vdev_rpool/mirror-0/nvme2n1p3_health_state_offline": 0, + "vdev_rpool/mirror-0/nvme2n1p3_health_state_online": 1, + "vdev_rpool/mirror-0/nvme2n1p3_health_state_removed": 0, + "vdev_rpool/mirror-0/nvme2n1p3_health_state_suspended": 0, + "vdev_rpool/mirror-0/nvme2n1p3_health_state_unavail": 0, + "vdev_rpool/mirror-0_health_state_degraded": 0, + "vdev_rpool/mirror-0_health_state_faulted": 0, + "vdev_rpool/mirror-0_health_state_offline": 0, + "vdev_rpool/mirror-0_health_state_online": 1, + "vdev_rpool/mirror-0_health_state_removed": 0, + "vdev_rpool/mirror-0_health_state_suspended": 0, + "vdev_rpool/mirror-0_health_state_unavail": 0, + "vdev_zion/mirror-0/nvme0n1p3_health_state_degraded": 0, + "vdev_zion/mirror-0/nvme0n1p3_health_state_faulted": 0, + "vdev_zion/mirror-0/nvme0n1p3_health_state_offline": 0, + "vdev_zion/mirror-0/nvme0n1p3_health_state_online": 1, + "vdev_zion/mirror-0/nvme0n1p3_health_state_removed": 0, + "vdev_zion/mirror-0/nvme0n1p3_health_state_suspended": 0, + "vdev_zion/mirror-0/nvme0n1p3_health_state_unavail": 0, + "vdev_zion/mirror-0/nvme2n1p3_health_state_degraded": 0, + "vdev_zion/mirror-0/nvme2n1p3_health_state_faulted": 0, + "vdev_zion/mirror-0/nvme2n1p3_health_state_offline": 0, + "vdev_zion/mirror-0/nvme2n1p3_health_state_online": 1, + "vdev_zion/mirror-0/nvme2n1p3_health_state_removed": 0, + "vdev_zion/mirror-0/nvme2n1p3_health_state_suspended": 0, + "vdev_zion/mirror-0/nvme2n1p3_health_state_unavail": 0, + "vdev_zion/mirror-0_health_state_degraded": 0, + "vdev_zion/mirror-0_health_state_faulted": 0, + "vdev_zion/mirror-0_health_state_offline": 0, + "vdev_zion/mirror-0_health_state_online": 1, + "vdev_zion/mirror-0_health_state_removed": 0, + "vdev_zion/mirror-0_health_state_suspended": 0, + "vdev_zion/mirror-0_health_state_unavail": 0, + "zpool_rpool_alloc": 9051643576, + "zpool_rpool_cap": 42, + "zpool_rpool_frag": 33, + "zpool_rpool_free": 12240656794, + "zpool_rpool_health_state_degraded": 0, + "zpool_rpool_health_state_faulted": 0, + "zpool_rpool_health_state_offline": 0, + "zpool_rpool_health_state_online": 1, + "zpool_rpool_health_state_removed": 0, + "zpool_rpool_health_state_suspended": 0, + "zpool_rpool_health_state_unavail": 0, + "zpool_rpool_size": 21367462298, + "zpool_zion_health_state_degraded": 0, + "zpool_zion_health_state_faulted": 1, + "zpool_zion_health_state_offline": 0, + "zpool_zion_health_state_online": 0, + "zpool_zion_health_state_removed": 0, + "zpool_zion_health_state_suspended": 0, + "zpool_zion_health_state_unavail": 0, + }, + }, + "success case vdev logs and cache": { + prepareMock: prepareMockOkVdevLogsCache, + wantMetrics: map[string]int64{ + "vdev_rpool/cache/sdb2_health_state_degraded": 0, + "vdev_rpool/cache/sdb2_health_state_faulted": 0, + "vdev_rpool/cache/sdb2_health_state_offline": 0, + "vdev_rpool/cache/sdb2_health_state_online": 1, + "vdev_rpool/cache/sdb2_health_state_removed": 0, + "vdev_rpool/cache/sdb2_health_state_suspended": 0, + "vdev_rpool/cache/sdb2_health_state_unavail": 0, + "vdev_rpool/cache/wwn-0x500151795954c095-part2_health_state_degraded": 0, + "vdev_rpool/cache/wwn-0x500151795954c095-part2_health_state_faulted": 0, + "vdev_rpool/cache/wwn-0x500151795954c095-part2_health_state_offline": 0, + "vdev_rpool/cache/wwn-0x500151795954c095-part2_health_state_online": 0, + "vdev_rpool/cache/wwn-0x500151795954c095-part2_health_state_removed": 0, + "vdev_rpool/cache/wwn-0x500151795954c095-part2_health_state_suspended": 0, + "vdev_rpool/cache/wwn-0x500151795954c095-part2_health_state_unavail": 1, + "vdev_rpool/logs/mirror-1/14807975228228307538_health_state_degraded": 0, + "vdev_rpool/logs/mirror-1/14807975228228307538_health_state_faulted": 0, + "vdev_rpool/logs/mirror-1/14807975228228307538_health_state_offline": 0, + "vdev_rpool/logs/mirror-1/14807975228228307538_health_state_online": 0, + "vdev_rpool/logs/mirror-1/14807975228228307538_health_state_removed": 0, + "vdev_rpool/logs/mirror-1/14807975228228307538_health_state_suspended": 0, + "vdev_rpool/logs/mirror-1/14807975228228307538_health_state_unavail": 1, + "vdev_rpool/logs/mirror-1/sdb1_health_state_degraded": 0, + "vdev_rpool/logs/mirror-1/sdb1_health_state_faulted": 0, + "vdev_rpool/logs/mirror-1/sdb1_health_state_offline": 0, + "vdev_rpool/logs/mirror-1/sdb1_health_state_online": 1, + "vdev_rpool/logs/mirror-1/sdb1_health_state_removed": 0, + "vdev_rpool/logs/mirror-1/sdb1_health_state_suspended": 0, + "vdev_rpool/logs/mirror-1/sdb1_health_state_unavail": 0, + "vdev_rpool/logs/mirror-1_health_state_degraded": 1, + "vdev_rpool/logs/mirror-1_health_state_faulted": 0, + "vdev_rpool/logs/mirror-1_health_state_offline": 0, + "vdev_rpool/logs/mirror-1_health_state_online": 0, + "vdev_rpool/logs/mirror-1_health_state_removed": 0, + "vdev_rpool/logs/mirror-1_health_state_suspended": 0, + "vdev_rpool/logs/mirror-1_health_state_unavail": 0, + "vdev_rpool/mirror-0/sdc2_health_state_degraded": 0, + "vdev_rpool/mirror-0/sdc2_health_state_faulted": 0, + "vdev_rpool/mirror-0/sdc2_health_state_offline": 0, + "vdev_rpool/mirror-0/sdc2_health_state_online": 1, + "vdev_rpool/mirror-0/sdc2_health_state_removed": 0, + "vdev_rpool/mirror-0/sdc2_health_state_suspended": 0, + "vdev_rpool/mirror-0/sdc2_health_state_unavail": 0, + "vdev_rpool/mirror-0/sdd2_health_state_degraded": 0, + "vdev_rpool/mirror-0/sdd2_health_state_faulted": 0, + "vdev_rpool/mirror-0/sdd2_health_state_offline": 0, + "vdev_rpool/mirror-0/sdd2_health_state_online": 1, + "vdev_rpool/mirror-0/sdd2_health_state_removed": 0, + "vdev_rpool/mirror-0/sdd2_health_state_suspended": 0, + "vdev_rpool/mirror-0/sdd2_health_state_unavail": 0, + "vdev_rpool/mirror-0_health_state_degraded": 0, + "vdev_rpool/mirror-0_health_state_faulted": 0, + "vdev_rpool/mirror-0_health_state_offline": 0, + "vdev_rpool/mirror-0_health_state_online": 1, + "vdev_rpool/mirror-0_health_state_removed": 0, + "vdev_rpool/mirror-0_health_state_suspended": 0, + "vdev_rpool/mirror-0_health_state_unavail": 0, + "vdev_zion/cache/sdb2_health_state_degraded": 0, + "vdev_zion/cache/sdb2_health_state_faulted": 0, + "vdev_zion/cache/sdb2_health_state_offline": 0, + "vdev_zion/cache/sdb2_health_state_online": 1, + "vdev_zion/cache/sdb2_health_state_removed": 0, + "vdev_zion/cache/sdb2_health_state_suspended": 0, + "vdev_zion/cache/sdb2_health_state_unavail": 0, + "vdev_zion/cache/wwn-0x500151795954c095-part2_health_state_degraded": 0, + "vdev_zion/cache/wwn-0x500151795954c095-part2_health_state_faulted": 0, + "vdev_zion/cache/wwn-0x500151795954c095-part2_health_state_offline": 0, + "vdev_zion/cache/wwn-0x500151795954c095-part2_health_state_online": 0, + "vdev_zion/cache/wwn-0x500151795954c095-part2_health_state_removed": 0, + "vdev_zion/cache/wwn-0x500151795954c095-part2_health_state_suspended": 0, + "vdev_zion/cache/wwn-0x500151795954c095-part2_health_state_unavail": 1, + "vdev_zion/logs/mirror-1/14807975228228307538_health_state_degraded": 0, + "vdev_zion/logs/mirror-1/14807975228228307538_health_state_faulted": 0, + "vdev_zion/logs/mirror-1/14807975228228307538_health_state_offline": 0, + "vdev_zion/logs/mirror-1/14807975228228307538_health_state_online": 0, + "vdev_zion/logs/mirror-1/14807975228228307538_health_state_removed": 0, + "vdev_zion/logs/mirror-1/14807975228228307538_health_state_suspended": 0, + "vdev_zion/logs/mirror-1/14807975228228307538_health_state_unavail": 1, + "vdev_zion/logs/mirror-1/sdb1_health_state_degraded": 0, + "vdev_zion/logs/mirror-1/sdb1_health_state_faulted": 0, + "vdev_zion/logs/mirror-1/sdb1_health_state_offline": 0, + "vdev_zion/logs/mirror-1/sdb1_health_state_online": 1, + "vdev_zion/logs/mirror-1/sdb1_health_state_removed": 0, + "vdev_zion/logs/mirror-1/sdb1_health_state_suspended": 0, + "vdev_zion/logs/mirror-1/sdb1_health_state_unavail": 0, + "vdev_zion/logs/mirror-1_health_state_degraded": 1, + "vdev_zion/logs/mirror-1_health_state_faulted": 0, + "vdev_zion/logs/mirror-1_health_state_offline": 0, + "vdev_zion/logs/mirror-1_health_state_online": 0, + "vdev_zion/logs/mirror-1_health_state_removed": 0, + "vdev_zion/logs/mirror-1_health_state_suspended": 0, + "vdev_zion/logs/mirror-1_health_state_unavail": 0, + "vdev_zion/mirror-0/sdc2_health_state_degraded": 0, + "vdev_zion/mirror-0/sdc2_health_state_faulted": 0, + "vdev_zion/mirror-0/sdc2_health_state_offline": 0, + "vdev_zion/mirror-0/sdc2_health_state_online": 1, + "vdev_zion/mirror-0/sdc2_health_state_removed": 0, + "vdev_zion/mirror-0/sdc2_health_state_suspended": 0, + "vdev_zion/mirror-0/sdc2_health_state_unavail": 0, + "vdev_zion/mirror-0/sdd2_health_state_degraded": 0, + "vdev_zion/mirror-0/sdd2_health_state_faulted": 0, + "vdev_zion/mirror-0/sdd2_health_state_offline": 0, + "vdev_zion/mirror-0/sdd2_health_state_online": 1, + "vdev_zion/mirror-0/sdd2_health_state_removed": 0, + "vdev_zion/mirror-0/sdd2_health_state_suspended": 0, + "vdev_zion/mirror-0/sdd2_health_state_unavail": 0, + "vdev_zion/mirror-0_health_state_degraded": 0, + "vdev_zion/mirror-0_health_state_faulted": 0, + "vdev_zion/mirror-0_health_state_offline": 0, + "vdev_zion/mirror-0_health_state_online": 1, + "vdev_zion/mirror-0_health_state_removed": 0, + "vdev_zion/mirror-0_health_state_suspended": 0, + "vdev_zion/mirror-0_health_state_unavail": 0, + "zpool_rpool_alloc": 9051643576, + "zpool_rpool_cap": 42, + "zpool_rpool_frag": 33, + "zpool_rpool_free": 12240656794, + "zpool_rpool_health_state_degraded": 0, + "zpool_rpool_health_state_faulted": 0, + "zpool_rpool_health_state_offline": 0, + "zpool_rpool_health_state_online": 1, + "zpool_rpool_health_state_removed": 0, + "zpool_rpool_health_state_suspended": 0, + "zpool_rpool_health_state_unavail": 0, + "zpool_rpool_size": 21367462298, + "zpool_zion_health_state_degraded": 0, + "zpool_zion_health_state_faulted": 1, + "zpool_zion_health_state_offline": 0, + "zpool_zion_health_state_online": 0, + "zpool_zion_health_state_removed": 0, + "zpool_zion_health_state_suspended": 0, + "zpool_zion_health_state_unavail": 0, + }, + }, + "error on list call": { + prepareMock: prepareMockErrOnList, + wantMetrics: nil, + }, + "empty response": { + prepareMock: prepareMockEmptyResponse, + wantMetrics: nil, + }, + "unexpected response": { + prepareMock: prepareMockUnexpectedResponse, + wantMetrics: nil, + }, + } + + for name, test := range tests { + t.Run(name, func(t *testing.T) { + zp := New() + mock := test.prepareMock() + zp.exec = mock + + mx := zp.Collect() + + assert.Equal(t, test.wantMetrics, mx) + + if len(test.wantMetrics) > 0 { + want := len(zpoolChartsTmpl)*len(zp.seenZpools) + len(vdevChartsTmpl)*len(zp.seenVdevs) + + assert.Len(t, *zp.Charts(), want, "want charts") + + module.TestMetricsHasAllChartsDimsSkip(t, zp.Charts(), mx, func(chart *module.Chart) bool { + return strings.HasPrefix(chart.ID, "zfspool_zion") && !strings.HasSuffix(chart.ID, "health_state") + }) + } + }) + } +} + +func TestZFSPool_parseZpoolListDevOutput(t *testing.T) { + tests := map[string]struct { + input string + want []vdevEntry + }{ + "": { + input: ` +NAME SIZE ALLOC FREE CKPOINT EXPANDSZ FRAG CAP DEDUP HEALTH ALTROOT +store 9981503995904 3046188658688 6935315337216 - - 9 30 1.00 DEGRADED - + mirror-0 9981503995904 3046188658688 6935315337216 - - 9 30 - ONLINE + sdc2 9998683602944 - - - - - - - ONLINE + sdd2 9998683602944 - - - - - - - ONLINE +logs - - - - - - - - - + mirror-1 17716740096 393216 17716346880 - - 0 0 - DEGRADED + sdb1 17951621120 - - - - - - - ONLINE + 14807975228228307538 - - - - - - - - UNAVAIL +cache - - - - - - - - - + sdb2 99000254464 98755866624 239665152 - - 0 99 - ONLINE + wwn-0x500151795954c095-part2 - - - - - - - - UNAVAIL +`, + want: []vdevEntry{ + { + name: "mirror-0", + health: "online", + vdev: "store/mirror-0", + level: 2, + }, + { + name: "sdc2", + health: "online", + vdev: "store/mirror-0/sdc2", + level: 4, + }, + { + name: "sdd2", + health: "online", + vdev: "store/mirror-0/sdd2", + level: 4, + }, + { + name: "logs", + health: "-", + vdev: "store/logs", + level: 0, + }, + { + name: "mirror-1", + health: "degraded", + vdev: "store/logs/mirror-1", + level: 2, + }, + { + name: "sdb1", + health: "online", + vdev: "store/logs/mirror-1/sdb1", + level: 4, + }, + { + name: "14807975228228307538", + health: "unavail", + vdev: "store/logs/mirror-1/14807975228228307538", + level: 4, + }, + { + name: "cache", + health: "-", + vdev: "store/cache", + level: 0, + }, + { + name: "sdb2", + health: "online", + vdev: "store/cache/sdb2", + level: 2, + }, + { + name: "wwn-0x500151795954c095-part2", + health: "unavail", + vdev: "store/cache/wwn-0x500151795954c095-part2", + level: 2, + }, + }, + }, + } + + for name, test := range tests { + t.Run(name, func(t *testing.T) { + v, err := parseZpoolListVdevOutput([]byte(test.input)) + require.NoError(t, err) + assert.Equal(t, test.want, v) + }) + } +} + +func prepareMockOk() *mockZpoolCLIExec { + return &mockZpoolCLIExec{ + listData: dataZpoolList, + listWithVdevData: dataZpoolListWithVdev, + } +} + +func prepareMockOkVdevLogsCache() *mockZpoolCLIExec { + return &mockZpoolCLIExec{ + listData: dataZpoolList, + listWithVdevData: dataZpoolListWithVdevLogsCache, + } +} + +func prepareMockErrOnList() *mockZpoolCLIExec { + return &mockZpoolCLIExec{ + errOnList: true, + } +} + +func prepareMockEmptyResponse() *mockZpoolCLIExec { + return &mockZpoolCLIExec{} +} + +func prepareMockUnexpectedResponse() *mockZpoolCLIExec { + return &mockZpoolCLIExec{ + listData: []byte(` +Lorem ipsum dolor sit amet, consectetur adipiscing elit. +Nulla malesuada erat id magna mattis, eu viverra tellus rhoncus. +Fusce et felis pulvinar, posuere sem non, porttitor eros. +`), + } +} + +type mockZpoolCLIExec struct { + errOnList bool + listData []byte + listWithVdevData []byte +} + +func (m *mockZpoolCLIExec) list() ([]byte, error) { + if m.errOnList { + return nil, errors.New("mock.list() error") + } + + return m.listData, nil +} + +func (m *mockZpoolCLIExec) listWithVdev(pool string) ([]byte, error) { + s := string(m.listWithVdevData) + s = strings.Replace(s, "rpool", pool, 1) + + return []byte(s), nil +} diff --git a/src/go/collectors/go.d.plugin/modules/zookeeper/README.md b/src/go/plugin/go.d/modules/zookeeper/README.md index ae81b3714..ae81b3714 120000 --- a/src/go/collectors/go.d.plugin/modules/zookeeper/README.md +++ b/src/go/plugin/go.d/modules/zookeeper/README.md diff --git a/src/go/collectors/go.d.plugin/modules/zookeeper/charts.go b/src/go/plugin/go.d/modules/zookeeper/charts.go index 2c2cf6a05..9f081a9c2 100644 --- a/src/go/collectors/go.d.plugin/modules/zookeeper/charts.go +++ b/src/go/plugin/go.d/modules/zookeeper/charts.go @@ -2,7 +2,7 @@ package zookeeper -import "github.com/netdata/netdata/go/go.d.plugin/agent/module" +import "github.com/netdata/netdata/go/plugins/plugin/go.d/agent/module" type ( Charts = module.Charts diff --git a/src/go/collectors/go.d.plugin/modules/zookeeper/collect.go b/src/go/plugin/go.d/modules/zookeeper/collect.go index 86491e1b1..86491e1b1 100644 --- a/src/go/collectors/go.d.plugin/modules/zookeeper/collect.go +++ b/src/go/plugin/go.d/modules/zookeeper/collect.go diff --git a/src/go/collectors/go.d.plugin/modules/zookeeper/config_schema.json b/src/go/plugin/go.d/modules/zookeeper/config_schema.json index e07a27c29..e07a27c29 100644 --- a/src/go/collectors/go.d.plugin/modules/zookeeper/config_schema.json +++ b/src/go/plugin/go.d/modules/zookeeper/config_schema.json diff --git a/src/go/collectors/go.d.plugin/modules/zookeeper/fetcher.go b/src/go/plugin/go.d/modules/zookeeper/fetcher.go index be821e622..a6611b506 100644 --- a/src/go/collectors/go.d.plugin/modules/zookeeper/fetcher.go +++ b/src/go/plugin/go.d/modules/zookeeper/fetcher.go @@ -7,7 +7,7 @@ import ( "fmt" "unsafe" - "github.com/netdata/netdata/go/go.d.plugin/pkg/socket" + "github.com/netdata/netdata/go/plugins/plugin/go.d/pkg/socket" ) const limitReadLines = 2000 diff --git a/src/go/collectors/go.d.plugin/modules/zookeeper/fetcher_test.go b/src/go/plugin/go.d/modules/zookeeper/fetcher_test.go index dbc5174b9..d0931abb9 100644 --- a/src/go/collectors/go.d.plugin/modules/zookeeper/fetcher_test.go +++ b/src/go/plugin/go.d/modules/zookeeper/fetcher_test.go @@ -5,7 +5,7 @@ package zookeeper import ( "testing" - "github.com/netdata/netdata/go/go.d.plugin/pkg/socket" + "github.com/netdata/netdata/go/plugins/plugin/go.d/pkg/socket" "github.com/stretchr/testify/assert" ) diff --git a/src/go/collectors/go.d.plugin/modules/zookeeper/init.go b/src/go/plugin/go.d/modules/zookeeper/init.go index 1910e9a0b..380f4bb33 100644 --- a/src/go/collectors/go.d.plugin/modules/zookeeper/init.go +++ b/src/go/plugin/go.d/modules/zookeeper/init.go @@ -7,8 +7,8 @@ import ( "errors" "fmt" - "github.com/netdata/netdata/go/go.d.plugin/pkg/socket" - "github.com/netdata/netdata/go/go.d.plugin/pkg/tlscfg" + "github.com/netdata/netdata/go/plugins/plugin/go.d/pkg/socket" + "github.com/netdata/netdata/go/plugins/plugin/go.d/pkg/tlscfg" ) func (z *Zookeeper) verifyConfig() error { diff --git a/src/go/collectors/go.d.plugin/modules/zookeeper/integrations/zookeeper.md b/src/go/plugin/go.d/modules/zookeeper/integrations/zookeeper.md index 45eeb0fc9..8481ff8c8 100644 --- a/src/go/collectors/go.d.plugin/modules/zookeeper/integrations/zookeeper.md +++ b/src/go/plugin/go.d/modules/zookeeper/integrations/zookeeper.md @@ -1,6 +1,6 @@ <!--startmeta -custom_edit_url: "https://github.com/netdata/netdata/edit/master/src/go/collectors/go.d.plugin/modules/zookeeper/README.md" -meta_yaml: "https://github.com/netdata/netdata/edit/master/src/go/collectors/go.d.plugin/modules/zookeeper/metadata.yaml" +custom_edit_url: "https://github.com/netdata/netdata/edit/master/src/go/plugin/go.d/modules/zookeeper/README.md" +meta_yaml: "https://github.com/netdata/netdata/edit/master/src/go/plugin/go.d/modules/zookeeper/metadata.yaml" sidebar_label: "ZooKeeper" learn_status: "Published" learn_rel_path: "Collecting Metrics/Service Discovery / Registry" @@ -190,6 +190,8 @@ jobs: ### Debug Mode +**Important**: Debug mode is not supported for data collection jobs created via the UI using the Dyncfg feature. + To troubleshoot issues with the `zookeeper` collector, run the `go.d.plugin` with the debug option enabled. The output should give you clues as to why the collector isn't working. @@ -212,4 +214,37 @@ should give you clues as to why the collector isn't working. ./go.d.plugin -d -m zookeeper ``` +### Getting Logs + +If you're encountering problems with the `zookeeper` collector, follow these steps to retrieve logs and identify potential issues: + +- **Run the command** specific to your system (systemd, non-systemd, or Docker container). +- **Examine the output** for any warnings or error messages that might indicate issues. These messages should provide clues about the root cause of the problem. + +#### System with systemd + +Use the following command to view logs generated since the last Netdata service restart: + +```bash +journalctl _SYSTEMD_INVOCATION_ID="$(systemctl show --value --property=InvocationID netdata)" --namespace=netdata --grep zookeeper +``` + +#### System without systemd + +Locate the collector log file, typically at `/var/log/netdata/collector.log`, and use `grep` to filter for collector's name: + +```bash +grep zookeeper /var/log/netdata/collector.log +``` + +**Note**: This method shows logs from all restarts. Focus on the **latest entries** for troubleshooting current issues. + +#### Docker Container + +If your Netdata runs in a Docker container named "netdata" (replace if different), use this command: + +```bash +docker logs netdata 2>&1 | grep zookeeper +``` + diff --git a/src/go/collectors/go.d.plugin/modules/zookeeper/metadata.yaml b/src/go/plugin/go.d/modules/zookeeper/metadata.yaml index 527a55fb4..527a55fb4 100644 --- a/src/go/collectors/go.d.plugin/modules/zookeeper/metadata.yaml +++ b/src/go/plugin/go.d/modules/zookeeper/metadata.yaml diff --git a/src/go/collectors/go.d.plugin/modules/zookeeper/testdata/config.json b/src/go/plugin/go.d/modules/zookeeper/testdata/config.json index 0cf6c4727..0cf6c4727 100644 --- a/src/go/collectors/go.d.plugin/modules/zookeeper/testdata/config.json +++ b/src/go/plugin/go.d/modules/zookeeper/testdata/config.json diff --git a/src/go/collectors/go.d.plugin/modules/zookeeper/testdata/config.yaml b/src/go/plugin/go.d/modules/zookeeper/testdata/config.yaml index 54456cc80..54456cc80 100644 --- a/src/go/collectors/go.d.plugin/modules/zookeeper/testdata/config.yaml +++ b/src/go/plugin/go.d/modules/zookeeper/testdata/config.yaml diff --git a/src/go/collectors/go.d.plugin/modules/zookeeper/testdata/mntr.txt b/src/go/plugin/go.d/modules/zookeeper/testdata/mntr.txt index 8e10c287d..8e10c287d 100644 --- a/src/go/collectors/go.d.plugin/modules/zookeeper/testdata/mntr.txt +++ b/src/go/plugin/go.d/modules/zookeeper/testdata/mntr.txt diff --git a/src/go/collectors/go.d.plugin/modules/zookeeper/testdata/mntr_notinwhitelist.txt b/src/go/plugin/go.d/modules/zookeeper/testdata/mntr_notinwhitelist.txt index 1fd1983b7..1fd1983b7 100644 --- a/src/go/collectors/go.d.plugin/modules/zookeeper/testdata/mntr_notinwhitelist.txt +++ b/src/go/plugin/go.d/modules/zookeeper/testdata/mntr_notinwhitelist.txt diff --git a/src/go/collectors/go.d.plugin/modules/zookeeper/zookeeper.go b/src/go/plugin/go.d/modules/zookeeper/zookeeper.go index bf2a43310..6d004a405 100644 --- a/src/go/collectors/go.d.plugin/modules/zookeeper/zookeeper.go +++ b/src/go/plugin/go.d/modules/zookeeper/zookeeper.go @@ -7,9 +7,9 @@ import ( "errors" "time" - "github.com/netdata/netdata/go/go.d.plugin/agent/module" - "github.com/netdata/netdata/go/go.d.plugin/pkg/tlscfg" - "github.com/netdata/netdata/go/go.d.plugin/pkg/web" + "github.com/netdata/netdata/go/plugins/plugin/go.d/agent/module" + "github.com/netdata/netdata/go/plugins/plugin/go.d/pkg/tlscfg" + "github.com/netdata/netdata/go/plugins/plugin/go.d/pkg/web" ) //go:embed "config_schema.json" diff --git a/src/go/collectors/go.d.plugin/modules/zookeeper/zookeeper_test.go b/src/go/plugin/go.d/modules/zookeeper/zookeeper_test.go index d33673fc3..3fc8ad5b4 100644 --- a/src/go/collectors/go.d.plugin/modules/zookeeper/zookeeper_test.go +++ b/src/go/plugin/go.d/modules/zookeeper/zookeeper_test.go @@ -9,7 +9,7 @@ import ( "os" "testing" - "github.com/netdata/netdata/go/go.d.plugin/agent/module" + "github.com/netdata/netdata/go/plugins/plugin/go.d/agent/module" "github.com/stretchr/testify/assert" "github.com/stretchr/testify/require" diff --git a/src/go/collectors/go.d.plugin/pkg/README.md b/src/go/plugin/go.d/pkg/README.md index 35ce81cc6..34561395f 100644 --- a/src/go/collectors/go.d.plugin/pkg/README.md +++ b/src/go/plugin/go.d/pkg/README.md @@ -1,6 +1,6 @@ <!-- title: "Helper Packages" -custom_edit_url: "/src/go/collectors/go.d.plugin/pkg/README.md" +custom_edit_url: "/src/go/plugin/go.d/pkg/README.md" sidebar_label: "Helper Packages" learn_status: "Published" learn_rel_path: "Developers/External plugins/go.d.plugin/Helper Packages" @@ -9,14 +9,14 @@ learn_rel_path: "Developers/External plugins/go.d.plugin/Helper Packages" # Helper Packages - if you need IP ranges consider to - use [`iprange`](/src/go/collectors/go.d.plugin/pkg/iprange/README.md). -- if you parse an application log files, then [`log`](https://github.com/netdata/netdata/tree/master/src/go/collectors/go.d.plugin/pkg/logs) is + use [`iprange`](/src/go/plugin/go.d/pkg/iprange). +- if you parse an application log files, then [`log`](https://github.com/netdata/netdata/tree/master/src/go/plugin/go.d/pkg/logs) is handy. - if you need filtering - check [`matcher`](/src/go/collectors/go.d.plugin/pkg/matcher/README.md). -- if you collect metrics from an HTTP endpoint use [`web`](https://github.com/netdata/netdata/tree/master/src/go/collectors/go.d.plugin/pkg/web). + check [`matcher`](/src/go/plugin/go.d/pkg/matcher). +- if you collect metrics from an HTTP endpoint use [`web`](https://github.com/netdata/netdata/tree/master/src/go/plugin/go.d/pkg/web). - if you collect metrics from a prometheus endpoint, - then [`prometheus`](https://github.com/netdata/netdata/tree/master/src/go/collectors/go.d.plugin/pkg/prometheus) - and [`web`](https://github.com/netdata/netdata/tree/master/src/go/collectors/go.d.plugin/pkg/web) is what you need. -- [`tlscfg`](https://github.com/netdata/netdata/tree/master/src/go/collectors/go.d.plugin/pkg/tlscfg) provides TLS support. -- [`stm`](https://github.com/netdata/netdata/tree/master/src/go/collectors/go.d.plugin/pkg/stm) helps you to convert any struct to a `map[string]int64`. + then [`prometheus`](https://github.com/netdata/netdata/tree/master/src/go/plugin/go.d/pkg/prometheus) + and [`web`](https://github.com/netdata/netdata/tree/master/src/go/plugin/go.d/pkg/web) is what you need. +- [`tlscfg`](https://github.com/netdata/netdata/tree/master/src/go/plugin/go.d/pkg/tlscfg) provides TLS support. +- [`stm`](https://github.com/netdata/netdata/tree/master/src/go/plugin/go.d/pkg/stm) helps you to convert any struct to a `map[string]int64`. diff --git a/src/go/collectors/go.d.plugin/pkg/dockerhost/dockerhost.go b/src/go/plugin/go.d/pkg/dockerhost/dockerhost.go index eb26b18fa..eb26b18fa 100644 --- a/src/go/collectors/go.d.plugin/pkg/dockerhost/dockerhost.go +++ b/src/go/plugin/go.d/pkg/dockerhost/dockerhost.go diff --git a/src/go/collectors/go.d.plugin/pkg/iprange/README.md b/src/go/plugin/go.d/pkg/iprange/README.md index 0b9bdbeec..ee777989d 100644 --- a/src/go/collectors/go.d.plugin/pkg/iprange/README.md +++ b/src/go/plugin/go.d/pkg/iprange/README.md @@ -1,6 +1,6 @@ <!-- title: "iprange" -custom_edit_url: "/src/go/collectors/go.d.plugin/pkg/iprange/README.md" +custom_edit_url: "/src/go/plugin/go.d/pkg/iprange/README.md" sidebar_label: "iprange" learn_status: "Published" learn_rel_path: "Developers/External plugins/go.d.plugin/Helper Packages" diff --git a/src/go/collectors/go.d.plugin/pkg/iprange/parse.go b/src/go/plugin/go.d/pkg/iprange/parse.go index 3471702a1..3471702a1 100644 --- a/src/go/collectors/go.d.plugin/pkg/iprange/parse.go +++ b/src/go/plugin/go.d/pkg/iprange/parse.go diff --git a/src/go/collectors/go.d.plugin/pkg/iprange/parse_test.go b/src/go/plugin/go.d/pkg/iprange/parse_test.go index 8b4ab96b3..8b4ab96b3 100644 --- a/src/go/collectors/go.d.plugin/pkg/iprange/parse_test.go +++ b/src/go/plugin/go.d/pkg/iprange/parse_test.go diff --git a/src/go/collectors/go.d.plugin/pkg/iprange/pool.go b/src/go/plugin/go.d/pkg/iprange/pool.go index 48ba5689b..48ba5689b 100644 --- a/src/go/collectors/go.d.plugin/pkg/iprange/pool.go +++ b/src/go/plugin/go.d/pkg/iprange/pool.go diff --git a/src/go/collectors/go.d.plugin/pkg/iprange/pool_test.go b/src/go/plugin/go.d/pkg/iprange/pool_test.go index 2864b6711..2864b6711 100644 --- a/src/go/collectors/go.d.plugin/pkg/iprange/pool_test.go +++ b/src/go/plugin/go.d/pkg/iprange/pool_test.go diff --git a/src/go/collectors/go.d.plugin/pkg/iprange/range.go b/src/go/plugin/go.d/pkg/iprange/range.go index 1fe02eace..1fe02eace 100644 --- a/src/go/collectors/go.d.plugin/pkg/iprange/range.go +++ b/src/go/plugin/go.d/pkg/iprange/range.go diff --git a/src/go/collectors/go.d.plugin/pkg/iprange/range_test.go b/src/go/plugin/go.d/pkg/iprange/range_test.go index 631d012e0..631d012e0 100644 --- a/src/go/collectors/go.d.plugin/pkg/iprange/range_test.go +++ b/src/go/plugin/go.d/pkg/iprange/range_test.go diff --git a/src/go/collectors/go.d.plugin/pkg/k8sclient/k8sclient.go b/src/go/plugin/go.d/pkg/k8sclient/k8sclient.go index 079239c1c..079239c1c 100644 --- a/src/go/collectors/go.d.plugin/pkg/k8sclient/k8sclient.go +++ b/src/go/plugin/go.d/pkg/k8sclient/k8sclient.go diff --git a/src/go/collectors/go.d.plugin/pkg/logs/csv.go b/src/go/plugin/go.d/pkg/logs/csv.go index 4057b8c2f..4057b8c2f 100644 --- a/src/go/collectors/go.d.plugin/pkg/logs/csv.go +++ b/src/go/plugin/go.d/pkg/logs/csv.go diff --git a/src/go/collectors/go.d.plugin/pkg/logs/csv_test.go b/src/go/plugin/go.d/pkg/logs/csv_test.go index d7baaa1b5..d7baaa1b5 100644 --- a/src/go/collectors/go.d.plugin/pkg/logs/csv_test.go +++ b/src/go/plugin/go.d/pkg/logs/csv_test.go diff --git a/src/go/collectors/go.d.plugin/pkg/logs/json.go b/src/go/plugin/go.d/pkg/logs/json.go index ceb32e272..ceb32e272 100644 --- a/src/go/collectors/go.d.plugin/pkg/logs/json.go +++ b/src/go/plugin/go.d/pkg/logs/json.go diff --git a/src/go/collectors/go.d.plugin/pkg/logs/json_test.go b/src/go/plugin/go.d/pkg/logs/json_test.go index b82850031..b82850031 100644 --- a/src/go/collectors/go.d.plugin/pkg/logs/json_test.go +++ b/src/go/plugin/go.d/pkg/logs/json_test.go diff --git a/src/go/collectors/go.d.plugin/pkg/logs/lastline.go b/src/go/plugin/go.d/pkg/logs/lastline.go index 911dbf497..911dbf497 100644 --- a/src/go/collectors/go.d.plugin/pkg/logs/lastline.go +++ b/src/go/plugin/go.d/pkg/logs/lastline.go diff --git a/src/go/collectors/go.d.plugin/pkg/logs/lastline_test.go b/src/go/plugin/go.d/pkg/logs/lastline_test.go index ea0a75e9e..ea0a75e9e 100644 --- a/src/go/collectors/go.d.plugin/pkg/logs/lastline_test.go +++ b/src/go/plugin/go.d/pkg/logs/lastline_test.go diff --git a/src/go/collectors/go.d.plugin/pkg/logs/ltsv.go b/src/go/plugin/go.d/pkg/logs/ltsv.go index b7fbceb14..b7fbceb14 100644 --- a/src/go/collectors/go.d.plugin/pkg/logs/ltsv.go +++ b/src/go/plugin/go.d/pkg/logs/ltsv.go diff --git a/src/go/collectors/go.d.plugin/pkg/logs/ltsv_test.go b/src/go/plugin/go.d/pkg/logs/ltsv_test.go index f6d5ec2bd..f6d5ec2bd 100644 --- a/src/go/collectors/go.d.plugin/pkg/logs/ltsv_test.go +++ b/src/go/plugin/go.d/pkg/logs/ltsv_test.go diff --git a/src/go/collectors/go.d.plugin/pkg/logs/parser.go b/src/go/plugin/go.d/pkg/logs/parser.go index f22047b0c..f22047b0c 100644 --- a/src/go/collectors/go.d.plugin/pkg/logs/parser.go +++ b/src/go/plugin/go.d/pkg/logs/parser.go diff --git a/src/go/collectors/go.d.plugin/pkg/logs/parser_test.go b/src/go/plugin/go.d/pkg/logs/parser_test.go index 88ef46c27..88ef46c27 100644 --- a/src/go/collectors/go.d.plugin/pkg/logs/parser_test.go +++ b/src/go/plugin/go.d/pkg/logs/parser_test.go diff --git a/src/go/collectors/go.d.plugin/pkg/logs/reader.go b/src/go/plugin/go.d/pkg/logs/reader.go index 34544eac6..55f0ee18f 100644 --- a/src/go/collectors/go.d.plugin/pkg/logs/reader.go +++ b/src/go/plugin/go.d/pkg/logs/reader.go @@ -10,7 +10,7 @@ import ( "path/filepath" "sort" - "github.com/netdata/netdata/go/go.d.plugin/logger" + "github.com/netdata/netdata/go/plugins/logger" ) const ( diff --git a/src/go/collectors/go.d.plugin/pkg/logs/reader_test.go b/src/go/plugin/go.d/pkg/logs/reader_test.go index e6ef47fe7..e6ef47fe7 100644 --- a/src/go/collectors/go.d.plugin/pkg/logs/reader_test.go +++ b/src/go/plugin/go.d/pkg/logs/reader_test.go diff --git a/src/go/collectors/go.d.plugin/pkg/logs/regexp.go b/src/go/plugin/go.d/pkg/logs/regexp.go index e0dee1d02..e0dee1d02 100644 --- a/src/go/collectors/go.d.plugin/pkg/logs/regexp.go +++ b/src/go/plugin/go.d/pkg/logs/regexp.go diff --git a/src/go/collectors/go.d.plugin/pkg/logs/regexp_test.go b/src/go/plugin/go.d/pkg/logs/regexp_test.go index fc7bacaa5..fc7bacaa5 100644 --- a/src/go/collectors/go.d.plugin/pkg/logs/regexp_test.go +++ b/src/go/plugin/go.d/pkg/logs/regexp_test.go diff --git a/src/go/collectors/go.d.plugin/pkg/matcher/README.md b/src/go/plugin/go.d/pkg/matcher/README.md index 8c9094260..971774ec2 100644 --- a/src/go/collectors/go.d.plugin/pkg/matcher/README.md +++ b/src/go/plugin/go.d/pkg/matcher/README.md @@ -1,6 +1,6 @@ <!-- title: "matcher" -custom_edit_url: "/src/go/collectors/go.d.plugin/pkg/matcher/README.md" +custom_edit_url: "/src/go/plugin/go.d/pkg/matcher/README.md" sidebar_label: "matcher" learn_status: "Published" learn_rel_path: "Developers/External plugins/go.d.plugin/Helper Packages" diff --git a/src/go/collectors/go.d.plugin/pkg/matcher/cache.go b/src/go/plugin/go.d/pkg/matcher/cache.go index 4594fa06f..4594fa06f 100644 --- a/src/go/collectors/go.d.plugin/pkg/matcher/cache.go +++ b/src/go/plugin/go.d/pkg/matcher/cache.go diff --git a/src/go/collectors/go.d.plugin/pkg/matcher/cache_test.go b/src/go/plugin/go.d/pkg/matcher/cache_test.go index a545777b3..a545777b3 100644 --- a/src/go/collectors/go.d.plugin/pkg/matcher/cache_test.go +++ b/src/go/plugin/go.d/pkg/matcher/cache_test.go diff --git a/src/go/collectors/go.d.plugin/pkg/matcher/doc.go b/src/go/plugin/go.d/pkg/matcher/doc.go index 33b06988d..33b06988d 100644 --- a/src/go/collectors/go.d.plugin/pkg/matcher/doc.go +++ b/src/go/plugin/go.d/pkg/matcher/doc.go diff --git a/src/go/collectors/go.d.plugin/pkg/matcher/doc_test.go b/src/go/plugin/go.d/pkg/matcher/doc_test.go index d04b39a54..4cc3944df 100644 --- a/src/go/collectors/go.d.plugin/pkg/matcher/doc_test.go +++ b/src/go/plugin/go.d/pkg/matcher/doc_test.go @@ -2,7 +2,7 @@ package matcher_test -import "github.com/netdata/netdata/go/go.d.plugin/pkg/matcher" +import "github.com/netdata/netdata/go/plugins/plugin/go.d/pkg/matcher" func ExampleNew_string_format() { // create a string matcher, which perform full text match diff --git a/src/go/collectors/go.d.plugin/pkg/matcher/expr.go b/src/go/plugin/go.d/pkg/matcher/expr.go index e5ea0cb2e..e5ea0cb2e 100644 --- a/src/go/collectors/go.d.plugin/pkg/matcher/expr.go +++ b/src/go/plugin/go.d/pkg/matcher/expr.go diff --git a/src/go/collectors/go.d.plugin/pkg/matcher/expr_test.go b/src/go/plugin/go.d/pkg/matcher/expr_test.go index 93a183226..93a183226 100644 --- a/src/go/collectors/go.d.plugin/pkg/matcher/expr_test.go +++ b/src/go/plugin/go.d/pkg/matcher/expr_test.go diff --git a/src/go/collectors/go.d.plugin/pkg/matcher/glob.go b/src/go/plugin/go.d/pkg/matcher/glob.go index 726c94c45..726c94c45 100644 --- a/src/go/collectors/go.d.plugin/pkg/matcher/glob.go +++ b/src/go/plugin/go.d/pkg/matcher/glob.go diff --git a/src/go/collectors/go.d.plugin/pkg/matcher/glob_test.go b/src/go/plugin/go.d/pkg/matcher/glob_test.go index 09d456105..09d456105 100644 --- a/src/go/collectors/go.d.plugin/pkg/matcher/glob_test.go +++ b/src/go/plugin/go.d/pkg/matcher/glob_test.go diff --git a/src/go/collectors/go.d.plugin/pkg/matcher/logical.go b/src/go/plugin/go.d/pkg/matcher/logical.go index af07be8f4..af07be8f4 100644 --- a/src/go/collectors/go.d.plugin/pkg/matcher/logical.go +++ b/src/go/plugin/go.d/pkg/matcher/logical.go diff --git a/src/go/collectors/go.d.plugin/pkg/matcher/logical_test.go b/src/go/plugin/go.d/pkg/matcher/logical_test.go index 64491f1ad..64491f1ad 100644 --- a/src/go/collectors/go.d.plugin/pkg/matcher/logical_test.go +++ b/src/go/plugin/go.d/pkg/matcher/logical_test.go diff --git a/src/go/collectors/go.d.plugin/pkg/matcher/matcher.go b/src/go/plugin/go.d/pkg/matcher/matcher.go index 76d903325..76d903325 100644 --- a/src/go/collectors/go.d.plugin/pkg/matcher/matcher.go +++ b/src/go/plugin/go.d/pkg/matcher/matcher.go diff --git a/src/go/collectors/go.d.plugin/pkg/matcher/matcher_test.go b/src/go/plugin/go.d/pkg/matcher/matcher_test.go index f304d983d..f304d983d 100644 --- a/src/go/collectors/go.d.plugin/pkg/matcher/matcher_test.go +++ b/src/go/plugin/go.d/pkg/matcher/matcher_test.go diff --git a/src/go/collectors/go.d.plugin/pkg/matcher/regexp.go b/src/go/plugin/go.d/pkg/matcher/regexp.go index 3a297f3b3..3a297f3b3 100644 --- a/src/go/collectors/go.d.plugin/pkg/matcher/regexp.go +++ b/src/go/plugin/go.d/pkg/matcher/regexp.go diff --git a/src/go/collectors/go.d.plugin/pkg/matcher/regexp_test.go b/src/go/plugin/go.d/pkg/matcher/regexp_test.go index fe644747b..fe644747b 100644 --- a/src/go/collectors/go.d.plugin/pkg/matcher/regexp_test.go +++ b/src/go/plugin/go.d/pkg/matcher/regexp_test.go diff --git a/src/go/collectors/go.d.plugin/pkg/matcher/simple_patterns.go b/src/go/plugin/go.d/pkg/matcher/simple_patterns.go index 91a0a3bbd..91a0a3bbd 100644 --- a/src/go/collectors/go.d.plugin/pkg/matcher/simple_patterns.go +++ b/src/go/plugin/go.d/pkg/matcher/simple_patterns.go diff --git a/src/go/collectors/go.d.plugin/pkg/matcher/simple_patterns_test.go b/src/go/plugin/go.d/pkg/matcher/simple_patterns_test.go index 016096d57..016096d57 100644 --- a/src/go/collectors/go.d.plugin/pkg/matcher/simple_patterns_test.go +++ b/src/go/plugin/go.d/pkg/matcher/simple_patterns_test.go diff --git a/src/go/collectors/go.d.plugin/pkg/matcher/string.go b/src/go/plugin/go.d/pkg/matcher/string.go index 43ba43eb3..43ba43eb3 100644 --- a/src/go/collectors/go.d.plugin/pkg/matcher/string.go +++ b/src/go/plugin/go.d/pkg/matcher/string.go diff --git a/src/go/collectors/go.d.plugin/pkg/matcher/string_test.go b/src/go/plugin/go.d/pkg/matcher/string_test.go index 1694efbd0..1694efbd0 100644 --- a/src/go/collectors/go.d.plugin/pkg/matcher/string_test.go +++ b/src/go/plugin/go.d/pkg/matcher/string_test.go diff --git a/src/go/collectors/go.d.plugin/pkg/metrics/counter.go b/src/go/plugin/go.d/pkg/metrics/counter.go index 7231fc7a4..406bc8792 100644 --- a/src/go/collectors/go.d.plugin/pkg/metrics/counter.go +++ b/src/go/plugin/go.d/pkg/metrics/counter.go @@ -5,7 +5,7 @@ package metrics import ( "errors" - "github.com/netdata/netdata/go/go.d.plugin/pkg/stm" + "github.com/netdata/netdata/go/plugins/plugin/go.d/pkg/stm" ) type ( diff --git a/src/go/collectors/go.d.plugin/pkg/metrics/counter_test.go b/src/go/plugin/go.d/pkg/metrics/counter_test.go index 61f50501a..61f50501a 100644 --- a/src/go/collectors/go.d.plugin/pkg/metrics/counter_test.go +++ b/src/go/plugin/go.d/pkg/metrics/counter_test.go diff --git a/src/go/collectors/go.d.plugin/pkg/metrics/gauge.go b/src/go/plugin/go.d/pkg/metrics/gauge.go index 6f0930f66..20f0823a8 100644 --- a/src/go/collectors/go.d.plugin/pkg/metrics/gauge.go +++ b/src/go/plugin/go.d/pkg/metrics/gauge.go @@ -5,7 +5,7 @@ package metrics import ( "time" - "github.com/netdata/netdata/go/go.d.plugin/pkg/stm" + "github.com/netdata/netdata/go/plugins/plugin/go.d/pkg/stm" ) type ( diff --git a/src/go/collectors/go.d.plugin/pkg/metrics/gauge_test.go b/src/go/plugin/go.d/pkg/metrics/gauge_test.go index 8940e330e..8940e330e 100644 --- a/src/go/collectors/go.d.plugin/pkg/metrics/gauge_test.go +++ b/src/go/plugin/go.d/pkg/metrics/gauge_test.go diff --git a/src/go/collectors/go.d.plugin/pkg/metrics/histogram.go b/src/go/plugin/go.d/pkg/metrics/histogram.go index caabf09af..98c2302ca 100644 --- a/src/go/collectors/go.d.plugin/pkg/metrics/histogram.go +++ b/src/go/plugin/go.d/pkg/metrics/histogram.go @@ -6,7 +6,7 @@ import ( "fmt" "sort" - "github.com/netdata/netdata/go/go.d.plugin/pkg/stm" + "github.com/netdata/netdata/go/plugins/plugin/go.d/pkg/stm" ) type ( diff --git a/src/go/collectors/go.d.plugin/pkg/metrics/histogram_test.go b/src/go/plugin/go.d/pkg/metrics/histogram_test.go index 91266915c..91266915c 100644 --- a/src/go/collectors/go.d.plugin/pkg/metrics/histogram_test.go +++ b/src/go/plugin/go.d/pkg/metrics/histogram_test.go diff --git a/src/go/collectors/go.d.plugin/pkg/metrics/metrics.go b/src/go/plugin/go.d/pkg/metrics/metrics.go index 44a24056f..9f6b7529b 100644 --- a/src/go/collectors/go.d.plugin/pkg/metrics/metrics.go +++ b/src/go/plugin/go.d/pkg/metrics/metrics.go @@ -2,7 +2,7 @@ package metrics -import "github.com/netdata/netdata/go/go.d.plugin/pkg/stm" +import "github.com/netdata/netdata/go/plugins/plugin/go.d/pkg/stm" // Observer is an interface that wraps the Observe method, which is used by // Histogram and Summary to add observations. diff --git a/src/go/collectors/go.d.plugin/pkg/metrics/summary.go b/src/go/plugin/go.d/pkg/metrics/summary.go index 01b85f65e..d72d968e6 100644 --- a/src/go/collectors/go.d.plugin/pkg/metrics/summary.go +++ b/src/go/plugin/go.d/pkg/metrics/summary.go @@ -5,7 +5,7 @@ package metrics import ( "math" - "github.com/netdata/netdata/go/go.d.plugin/pkg/stm" + "github.com/netdata/netdata/go/plugins/plugin/go.d/pkg/stm" ) type ( diff --git a/src/go/collectors/go.d.plugin/pkg/metrics/summary_test.go b/src/go/plugin/go.d/pkg/metrics/summary_test.go index b98218369..b98218369 100644 --- a/src/go/collectors/go.d.plugin/pkg/metrics/summary_test.go +++ b/src/go/plugin/go.d/pkg/metrics/summary_test.go diff --git a/src/go/collectors/go.d.plugin/pkg/metrics/unique_counter.go b/src/go/plugin/go.d/pkg/metrics/unique_counter.go index dfc96126a..da80fd3d0 100644 --- a/src/go/collectors/go.d.plugin/pkg/metrics/unique_counter.go +++ b/src/go/plugin/go.d/pkg/metrics/unique_counter.go @@ -4,7 +4,7 @@ package metrics import ( "github.com/axiomhq/hyperloglog" - "github.com/netdata/netdata/go/go.d.plugin/pkg/stm" + "github.com/netdata/netdata/go/plugins/plugin/go.d/pkg/stm" ) type ( diff --git a/src/go/collectors/go.d.plugin/pkg/metrics/unique_counter_test.go b/src/go/plugin/go.d/pkg/metrics/unique_counter_test.go index b9439c9a3..b9439c9a3 100644 --- a/src/go/collectors/go.d.plugin/pkg/metrics/unique_counter_test.go +++ b/src/go/plugin/go.d/pkg/metrics/unique_counter_test.go diff --git a/src/go/collectors/go.d.plugin/pkg/multipath/multipath.go b/src/go/plugin/go.d/pkg/multipath/multipath.go index 6172def06..6172def06 100644 --- a/src/go/collectors/go.d.plugin/pkg/multipath/multipath.go +++ b/src/go/plugin/go.d/pkg/multipath/multipath.go diff --git a/src/go/collectors/go.d.plugin/pkg/multipath/multipath_test.go b/src/go/plugin/go.d/pkg/multipath/multipath_test.go index cd6c90d95..cd6c90d95 100644 --- a/src/go/collectors/go.d.plugin/pkg/multipath/multipath_test.go +++ b/src/go/plugin/go.d/pkg/multipath/multipath_test.go diff --git a/src/go/collectors/go.d.plugin/pkg/multipath/testdata/data1/test-empty.conf b/src/go/plugin/go.d/pkg/multipath/testdata/data1/test-empty.conf index e69de29bb..e69de29bb 100644 --- a/src/go/collectors/go.d.plugin/pkg/multipath/testdata/data1/test-empty.conf +++ b/src/go/plugin/go.d/pkg/multipath/testdata/data1/test-empty.conf diff --git a/src/go/collectors/go.d.plugin/pkg/multipath/testdata/data1/test.conf b/src/go/plugin/go.d/pkg/multipath/testdata/data1/test.conf index aebe64730..aebe64730 100644 --- a/src/go/collectors/go.d.plugin/pkg/multipath/testdata/data1/test.conf +++ b/src/go/plugin/go.d/pkg/multipath/testdata/data1/test.conf diff --git a/src/go/collectors/go.d.plugin/pkg/multipath/testdata/data2/test-empty.conf b/src/go/plugin/go.d/pkg/multipath/testdata/data2/test-empty.conf index e69de29bb..e69de29bb 100644 --- a/src/go/collectors/go.d.plugin/pkg/multipath/testdata/data2/test-empty.conf +++ b/src/go/plugin/go.d/pkg/multipath/testdata/data2/test-empty.conf diff --git a/src/go/collectors/go.d.plugin/pkg/multipath/testdata/data2/test.conf b/src/go/plugin/go.d/pkg/multipath/testdata/data2/test.conf index aebe64730..aebe64730 100644 --- a/src/go/collectors/go.d.plugin/pkg/multipath/testdata/data2/test.conf +++ b/src/go/plugin/go.d/pkg/multipath/testdata/data2/test.conf diff --git a/src/go/collectors/go.d.plugin/pkg/prometheus/client.go b/src/go/plugin/go.d/pkg/prometheus/client.go index 3365b270c..19d6bcfbc 100644 --- a/src/go/collectors/go.d.plugin/pkg/prometheus/client.go +++ b/src/go/plugin/go.d/pkg/prometheus/client.go @@ -13,8 +13,8 @@ import ( "os" "path/filepath" - "github.com/netdata/netdata/go/go.d.plugin/pkg/prometheus/selector" - "github.com/netdata/netdata/go/go.d.plugin/pkg/web" + "github.com/netdata/netdata/go/plugins/plugin/go.d/pkg/prometheus/selector" + "github.com/netdata/netdata/go/plugins/plugin/go.d/pkg/web" ) type ( diff --git a/src/go/collectors/go.d.plugin/pkg/prometheus/client_test.go b/src/go/plugin/go.d/pkg/prometheus/client_test.go index 76199800a..e6f61b9af 100644 --- a/src/go/collectors/go.d.plugin/pkg/prometheus/client_test.go +++ b/src/go/plugin/go.d/pkg/prometheus/client_test.go @@ -11,8 +11,8 @@ import ( "strings" "testing" - "github.com/netdata/netdata/go/go.d.plugin/pkg/prometheus/selector" - "github.com/netdata/netdata/go/go.d.plugin/pkg/web" + "github.com/netdata/netdata/go/plugins/plugin/go.d/pkg/prometheus/selector" + "github.com/netdata/netdata/go/plugins/plugin/go.d/pkg/web" "github.com/stretchr/testify/assert" "github.com/stretchr/testify/require" diff --git a/src/go/collectors/go.d.plugin/pkg/prometheus/metric_family.go b/src/go/plugin/go.d/pkg/prometheus/metric_family.go index dde08801e..dde08801e 100644 --- a/src/go/collectors/go.d.plugin/pkg/prometheus/metric_family.go +++ b/src/go/plugin/go.d/pkg/prometheus/metric_family.go diff --git a/src/go/collectors/go.d.plugin/pkg/prometheus/metric_family_test.go b/src/go/plugin/go.d/pkg/prometheus/metric_family_test.go index f373996da..f373996da 100644 --- a/src/go/collectors/go.d.plugin/pkg/prometheus/metric_family_test.go +++ b/src/go/plugin/go.d/pkg/prometheus/metric_family_test.go diff --git a/src/go/collectors/go.d.plugin/pkg/prometheus/metric_series.go b/src/go/plugin/go.d/pkg/prometheus/metric_series.go index 31914f4b2..31914f4b2 100644 --- a/src/go/collectors/go.d.plugin/pkg/prometheus/metric_series.go +++ b/src/go/plugin/go.d/pkg/prometheus/metric_series.go diff --git a/src/go/collectors/go.d.plugin/pkg/prometheus/metric_series_test.go b/src/go/plugin/go.d/pkg/prometheus/metric_series_test.go index 80c805474..80c805474 100644 --- a/src/go/collectors/go.d.plugin/pkg/prometheus/metric_series_test.go +++ b/src/go/plugin/go.d/pkg/prometheus/metric_series_test.go diff --git a/src/go/collectors/go.d.plugin/pkg/prometheus/parse.go b/src/go/plugin/go.d/pkg/prometheus/parse.go index 958d66289..2c7d2eb40 100644 --- a/src/go/collectors/go.d.plugin/pkg/prometheus/parse.go +++ b/src/go/plugin/go.d/pkg/prometheus/parse.go @@ -8,7 +8,7 @@ import ( "strconv" "strings" - "github.com/netdata/netdata/go/go.d.plugin/pkg/prometheus/selector" + "github.com/netdata/netdata/go/plugins/plugin/go.d/pkg/prometheus/selector" "github.com/prometheus/common/model" "github.com/prometheus/prometheus/model/labels" diff --git a/src/go/collectors/go.d.plugin/pkg/prometheus/parse_test.go b/src/go/plugin/go.d/pkg/prometheus/parse_test.go index 453011c07..cb128ffe5 100644 --- a/src/go/collectors/go.d.plugin/pkg/prometheus/parse_test.go +++ b/src/go/plugin/go.d/pkg/prometheus/parse_test.go @@ -7,7 +7,7 @@ import ( "os" "testing" - "github.com/netdata/netdata/go/go.d.plugin/pkg/prometheus/selector" + "github.com/netdata/netdata/go/plugins/plugin/go.d/pkg/prometheus/selector" "github.com/prometheus/common/model" "github.com/prometheus/prometheus/model/labels" diff --git a/src/go/collectors/go.d.plugin/pkg/prometheus/selector/README.md b/src/go/plugin/go.d/pkg/prometheus/selector/README.md index 75682c38d..601eb0891 100644 --- a/src/go/collectors/go.d.plugin/pkg/prometheus/selector/README.md +++ b/src/go/plugin/go.d/pkg/prometheus/selector/README.md @@ -1,6 +1,6 @@ <!-- title: "Time series selector" -custom_edit_url: "/src/go/collectors/go.d.plugin/pkg/prometheus/selector/README.md" +custom_edit_url: "/src/go/plugin/go.d/pkg/prometheus/selector/README.md" sidebar_label: "Time series selector" learn_status: "Published" learn_rel_path: "Developers/External plugins/go.d.plugin/Helper Packages" diff --git a/src/go/collectors/go.d.plugin/pkg/prometheus/selector/expr.go b/src/go/plugin/go.d/pkg/prometheus/selector/expr.go index 6f61cf3a5..6f61cf3a5 100644 --- a/src/go/collectors/go.d.plugin/pkg/prometheus/selector/expr.go +++ b/src/go/plugin/go.d/pkg/prometheus/selector/expr.go diff --git a/src/go/collectors/go.d.plugin/pkg/prometheus/selector/expr_test.go b/src/go/plugin/go.d/pkg/prometheus/selector/expr_test.go index 598cef9b8..598cef9b8 100644 --- a/src/go/collectors/go.d.plugin/pkg/prometheus/selector/expr_test.go +++ b/src/go/plugin/go.d/pkg/prometheus/selector/expr_test.go diff --git a/src/go/collectors/go.d.plugin/pkg/prometheus/selector/logical.go b/src/go/plugin/go.d/pkg/prometheus/selector/logical.go index 1556d1715..1556d1715 100644 --- a/src/go/collectors/go.d.plugin/pkg/prometheus/selector/logical.go +++ b/src/go/plugin/go.d/pkg/prometheus/selector/logical.go diff --git a/src/go/collectors/go.d.plugin/pkg/prometheus/selector/logical_test.go b/src/go/plugin/go.d/pkg/prometheus/selector/logical_test.go index 239c7f715..239c7f715 100644 --- a/src/go/collectors/go.d.plugin/pkg/prometheus/selector/logical_test.go +++ b/src/go/plugin/go.d/pkg/prometheus/selector/logical_test.go diff --git a/src/go/collectors/go.d.plugin/pkg/prometheus/selector/parse.go b/src/go/plugin/go.d/pkg/prometheus/selector/parse.go index 29c1d4fbf..81e970c48 100644 --- a/src/go/collectors/go.d.plugin/pkg/prometheus/selector/parse.go +++ b/src/go/plugin/go.d/pkg/prometheus/selector/parse.go @@ -7,7 +7,7 @@ import ( "regexp" "strings" - "github.com/netdata/netdata/go/go.d.plugin/pkg/matcher" + "github.com/netdata/netdata/go/plugins/plugin/go.d/pkg/matcher" ) var ( diff --git a/src/go/collectors/go.d.plugin/pkg/prometheus/selector/parse_test.go b/src/go/plugin/go.d/pkg/prometheus/selector/parse_test.go index ba764e039..1a1f8ab79 100644 --- a/src/go/collectors/go.d.plugin/pkg/prometheus/selector/parse_test.go +++ b/src/go/plugin/go.d/pkg/prometheus/selector/parse_test.go @@ -6,7 +6,7 @@ import ( "fmt" "testing" - "github.com/netdata/netdata/go/go.d.plugin/pkg/matcher" + "github.com/netdata/netdata/go/plugins/plugin/go.d/pkg/matcher" "github.com/prometheus/prometheus/model/labels" "github.com/stretchr/testify/assert" diff --git a/src/go/collectors/go.d.plugin/pkg/prometheus/selector/selector.go b/src/go/plugin/go.d/pkg/prometheus/selector/selector.go index 28203fca1..a42b846f2 100644 --- a/src/go/collectors/go.d.plugin/pkg/prometheus/selector/selector.go +++ b/src/go/plugin/go.d/pkg/prometheus/selector/selector.go @@ -3,7 +3,7 @@ package selector import ( - "github.com/netdata/netdata/go/go.d.plugin/pkg/matcher" + "github.com/netdata/netdata/go/plugins/plugin/go.d/pkg/matcher" "github.com/prometheus/prometheus/model/labels" ) diff --git a/src/go/collectors/go.d.plugin/pkg/prometheus/selector/selector_test.go b/src/go/plugin/go.d/pkg/prometheus/selector/selector_test.go index aa3110b03..aa3110b03 100644 --- a/src/go/collectors/go.d.plugin/pkg/prometheus/selector/selector_test.go +++ b/src/go/plugin/go.d/pkg/prometheus/selector/selector_test.go diff --git a/src/go/collectors/go.d.plugin/pkg/prometheus/testdata/counter-meta.txt b/src/go/plugin/go.d/pkg/prometheus/testdata/counter-meta.txt index 53eccda63..53eccda63 100644 --- a/src/go/collectors/go.d.plugin/pkg/prometheus/testdata/counter-meta.txt +++ b/src/go/plugin/go.d/pkg/prometheus/testdata/counter-meta.txt diff --git a/src/go/collectors/go.d.plugin/pkg/prometheus/testdata/counter-no-meta.txt b/src/go/plugin/go.d/pkg/prometheus/testdata/counter-no-meta.txt index afb11b9b8..afb11b9b8 100644 --- a/src/go/collectors/go.d.plugin/pkg/prometheus/testdata/counter-no-meta.txt +++ b/src/go/plugin/go.d/pkg/prometheus/testdata/counter-no-meta.txt diff --git a/src/go/collectors/go.d.plugin/pkg/prometheus/testdata/gauge-meta.txt b/src/go/plugin/go.d/pkg/prometheus/testdata/gauge-meta.txt index c0773a426..c0773a426 100644 --- a/src/go/collectors/go.d.plugin/pkg/prometheus/testdata/gauge-meta.txt +++ b/src/go/plugin/go.d/pkg/prometheus/testdata/gauge-meta.txt diff --git a/src/go/collectors/go.d.plugin/pkg/prometheus/testdata/gauge-no-meta.txt b/src/go/plugin/go.d/pkg/prometheus/testdata/gauge-no-meta.txt index e89e0e4d9..e89e0e4d9 100644 --- a/src/go/collectors/go.d.plugin/pkg/prometheus/testdata/gauge-no-meta.txt +++ b/src/go/plugin/go.d/pkg/prometheus/testdata/gauge-no-meta.txt diff --git a/src/go/collectors/go.d.plugin/pkg/prometheus/testdata/histogram-meta.txt b/src/go/plugin/go.d/pkg/prometheus/testdata/histogram-meta.txt index 9b4b8a965..9b4b8a965 100644 --- a/src/go/collectors/go.d.plugin/pkg/prometheus/testdata/histogram-meta.txt +++ b/src/go/plugin/go.d/pkg/prometheus/testdata/histogram-meta.txt diff --git a/src/go/collectors/go.d.plugin/pkg/prometheus/testdata/histogram-no-meta.txt b/src/go/plugin/go.d/pkg/prometheus/testdata/histogram-no-meta.txt index 49def677c..49def677c 100644 --- a/src/go/collectors/go.d.plugin/pkg/prometheus/testdata/histogram-no-meta.txt +++ b/src/go/plugin/go.d/pkg/prometheus/testdata/histogram-no-meta.txt diff --git a/src/go/collectors/go.d.plugin/pkg/prometheus/testdata/multiline-help.txt b/src/go/plugin/go.d/pkg/prometheus/testdata/multiline-help.txt index f1598fcce..f1598fcce 100644 --- a/src/go/collectors/go.d.plugin/pkg/prometheus/testdata/multiline-help.txt +++ b/src/go/plugin/go.d/pkg/prometheus/testdata/multiline-help.txt diff --git a/src/go/collectors/go.d.plugin/pkg/prometheus/testdata/summary-meta.txt b/src/go/plugin/go.d/pkg/prometheus/testdata/summary-meta.txt index 3056e8076..3056e8076 100644 --- a/src/go/collectors/go.d.plugin/pkg/prometheus/testdata/summary-meta.txt +++ b/src/go/plugin/go.d/pkg/prometheus/testdata/summary-meta.txt diff --git a/src/go/collectors/go.d.plugin/pkg/prometheus/testdata/summary-no-meta.txt b/src/go/plugin/go.d/pkg/prometheus/testdata/summary-no-meta.txt index e66564bb7..e66564bb7 100644 --- a/src/go/collectors/go.d.plugin/pkg/prometheus/testdata/summary-no-meta.txt +++ b/src/go/plugin/go.d/pkg/prometheus/testdata/summary-no-meta.txt diff --git a/src/go/collectors/go.d.plugin/pkg/prometheus/testdata/testdata.nometa.txt b/src/go/plugin/go.d/pkg/prometheus/testdata/testdata.nometa.txt index e760ad268..e760ad268 100644 --- a/src/go/collectors/go.d.plugin/pkg/prometheus/testdata/testdata.nometa.txt +++ b/src/go/plugin/go.d/pkg/prometheus/testdata/testdata.nometa.txt diff --git a/src/go/collectors/go.d.plugin/pkg/prometheus/testdata/testdata.txt b/src/go/plugin/go.d/pkg/prometheus/testdata/testdata.txt index c7f2a7af0..c7f2a7af0 100644 --- a/src/go/collectors/go.d.plugin/pkg/prometheus/testdata/testdata.txt +++ b/src/go/plugin/go.d/pkg/prometheus/testdata/testdata.txt diff --git a/src/go/collectors/go.d.plugin/pkg/socket/client.go b/src/go/plugin/go.d/pkg/socket/client.go index 26ae1dfa6..26ae1dfa6 100644 --- a/src/go/collectors/go.d.plugin/pkg/socket/client.go +++ b/src/go/plugin/go.d/pkg/socket/client.go diff --git a/src/go/collectors/go.d.plugin/pkg/socket/client_test.go b/src/go/plugin/go.d/pkg/socket/client_test.go index fa64f4558..fa64f4558 100644 --- a/src/go/collectors/go.d.plugin/pkg/socket/client_test.go +++ b/src/go/plugin/go.d/pkg/socket/client_test.go diff --git a/src/go/collectors/go.d.plugin/pkg/socket/servers_test.go b/src/go/plugin/go.d/pkg/socket/servers_test.go index d66178162..d66178162 100644 --- a/src/go/collectors/go.d.plugin/pkg/socket/servers_test.go +++ b/src/go/plugin/go.d/pkg/socket/servers_test.go diff --git a/src/go/collectors/go.d.plugin/pkg/socket/types.go b/src/go/plugin/go.d/pkg/socket/types.go index 693faf5be..693faf5be 100644 --- a/src/go/collectors/go.d.plugin/pkg/socket/types.go +++ b/src/go/plugin/go.d/pkg/socket/types.go diff --git a/src/go/collectors/go.d.plugin/pkg/socket/utils.go b/src/go/plugin/go.d/pkg/socket/utils.go index dcc48b383..dcc48b383 100644 --- a/src/go/collectors/go.d.plugin/pkg/socket/utils.go +++ b/src/go/plugin/go.d/pkg/socket/utils.go diff --git a/src/go/collectors/go.d.plugin/pkg/stm/stm.go b/src/go/plugin/go.d/pkg/stm/stm.go index 7d07ba9a4..7d07ba9a4 100644 --- a/src/go/collectors/go.d.plugin/pkg/stm/stm.go +++ b/src/go/plugin/go.d/pkg/stm/stm.go diff --git a/src/go/collectors/go.d.plugin/pkg/stm/stm_test.go b/src/go/plugin/go.d/pkg/stm/stm_test.go index 04d63b32d..74ac6f3f1 100644 --- a/src/go/collectors/go.d.plugin/pkg/stm/stm_test.go +++ b/src/go/plugin/go.d/pkg/stm/stm_test.go @@ -5,9 +5,9 @@ package stm_test import ( "testing" - "github.com/netdata/netdata/go/go.d.plugin/pkg/stm" + "github.com/netdata/netdata/go/plugins/plugin/go.d/pkg/stm" - "github.com/netdata/netdata/go/go.d.plugin/pkg/metrics" + "github.com/netdata/netdata/go/plugins/plugin/go.d/pkg/metrics" "github.com/stretchr/testify/assert" ) diff --git a/src/go/collectors/go.d.plugin/pkg/tlscfg/config.go b/src/go/plugin/go.d/pkg/tlscfg/config.go index 7a227c4c8..7a227c4c8 100644 --- a/src/go/collectors/go.d.plugin/pkg/tlscfg/config.go +++ b/src/go/plugin/go.d/pkg/tlscfg/config.go diff --git a/src/go/collectors/go.d.plugin/pkg/tlscfg/config_test.go b/src/go/plugin/go.d/pkg/tlscfg/config_test.go index d95fe24bc..d95fe24bc 100644 --- a/src/go/collectors/go.d.plugin/pkg/tlscfg/config_test.go +++ b/src/go/plugin/go.d/pkg/tlscfg/config_test.go diff --git a/src/go/collectors/go.d.plugin/pkg/web/client.go b/src/go/plugin/go.d/pkg/web/client.go index 1de75230d..02dc17de1 100644 --- a/src/go/collectors/go.d.plugin/pkg/web/client.go +++ b/src/go/plugin/go.d/pkg/web/client.go @@ -9,7 +9,7 @@ import ( "net/http" "net/url" - "github.com/netdata/netdata/go/go.d.plugin/pkg/tlscfg" + "github.com/netdata/netdata/go/plugins/plugin/go.d/pkg/tlscfg" ) // ErrRedirectAttempted indicates that a redirect occurred. diff --git a/src/go/collectors/go.d.plugin/pkg/web/client_test.go b/src/go/plugin/go.d/pkg/web/client_test.go index ead1486c3..ead1486c3 100644 --- a/src/go/collectors/go.d.plugin/pkg/web/client_test.go +++ b/src/go/plugin/go.d/pkg/web/client_test.go diff --git a/src/go/collectors/go.d.plugin/pkg/web/doc.go b/src/go/plugin/go.d/pkg/web/doc.go index 4c6d31461..4c6d31461 100644 --- a/src/go/collectors/go.d.plugin/pkg/web/doc.go +++ b/src/go/plugin/go.d/pkg/web/doc.go diff --git a/src/go/collectors/go.d.plugin/pkg/web/doc_test.go b/src/go/plugin/go.d/pkg/web/doc_test.go index 137eed207..137eed207 100644 --- a/src/go/collectors/go.d.plugin/pkg/web/doc_test.go +++ b/src/go/plugin/go.d/pkg/web/doc_test.go diff --git a/src/go/collectors/go.d.plugin/pkg/web/duration.go b/src/go/plugin/go.d/pkg/web/duration.go index 85d5ef650..85d5ef650 100644 --- a/src/go/collectors/go.d.plugin/pkg/web/duration.go +++ b/src/go/plugin/go.d/pkg/web/duration.go diff --git a/src/go/collectors/go.d.plugin/pkg/web/duration_test.go b/src/go/plugin/go.d/pkg/web/duration_test.go index b45063f13..b45063f13 100644 --- a/src/go/collectors/go.d.plugin/pkg/web/duration_test.go +++ b/src/go/plugin/go.d/pkg/web/duration_test.go diff --git a/src/go/collectors/go.d.plugin/pkg/web/request.go b/src/go/plugin/go.d/pkg/web/request.go index e8e4b742a..20a6ec093 100644 --- a/src/go/collectors/go.d.plugin/pkg/web/request.go +++ b/src/go/plugin/go.d/pkg/web/request.go @@ -7,10 +7,11 @@ import ( "fmt" "io" "net/http" + "net/url" "strings" - "github.com/netdata/netdata/go/go.d.plugin/agent/executable" - "github.com/netdata/netdata/go/go.d.plugin/pkg/buildinfo" + "github.com/netdata/netdata/go/plugins/pkg/buildinfo" + "github.com/netdata/netdata/go/plugins/pkg/executable" ) // Request is the configuration of the HTTP request. @@ -90,3 +91,15 @@ func NewHTTPRequest(cfg Request) (*http.Request, error) { return req, nil } + +func NewHTTPRequestWithPath(cfg Request, urlPath string) (*http.Request, error) { + cfg = cfg.Copy() + + v, err := url.JoinPath(cfg.URL, urlPath) + if err != nil { + return nil, fmt.Errorf("failed to join URL path: %v", err) + } + cfg.URL = v + + return NewHTTPRequest(cfg) +} diff --git a/src/go/collectors/go.d.plugin/pkg/web/request_test.go b/src/go/plugin/go.d/pkg/web/request_test.go index 284cccb93..d39f9a36a 100644 --- a/src/go/collectors/go.d.plugin/pkg/web/request_test.go +++ b/src/go/plugin/go.d/pkg/web/request_test.go @@ -159,6 +159,34 @@ func TestNewHTTPRequest(t *testing.T) { } } +func TestNewRequest(t *testing.T) { + tests := map[string]struct { + url string + path string + wantURL string + }{ + "base url": { + url: "http://127.0.0.1:65535", + path: "/bar", + wantURL: "http://127.0.0.1:65535/bar", + }, + "with path": { + url: "http://127.0.0.1:65535/foo/", + path: "/bar", + wantURL: "http://127.0.0.1:65535/foo/bar", + }, + } + + for name, test := range tests { + t.Run(name, func(t *testing.T) { + req, err := NewHTTPRequestWithPath(Request{URL: test.url}.Copy(), test.path) + require.NoError(t, err) + + assert.Equal(t, test.wantURL, req.URL.String()) + }) + } +} + func parseBasicAuth(auth string) (username, password string, ok bool) { const prefix = "Basic " if len(auth) < len(prefix) || !strings.EqualFold(auth[:len(prefix)], prefix) { diff --git a/src/go/collectors/go.d.plugin/pkg/web/web.go b/src/go/plugin/go.d/pkg/web/web.go index cbda396d4..cbda396d4 100644 --- a/src/go/collectors/go.d.plugin/pkg/web/web.go +++ b/src/go/plugin/go.d/pkg/web/web.go diff --git a/src/health/guides/httpcheck/httpcheck_web_service_bad_content.md b/src/health/guides/httpcheck/httpcheck_web_service_bad_content.md index 433425e09..cbf42694d 100644 --- a/src/health/guides/httpcheck/httpcheck_web_service_bad_content.md +++ b/src/health/guides/httpcheck/httpcheck_web_service_bad_content.md @@ -27,4 +27,4 @@ sudo ./edit-config go.d/httpcheck.conf ### Useful resources -1. [HTTP endpoint monitoring with Netdata](/src/go/collectors/go.d.plugin/modules/httpcheck/integrations/http_endpoints.md)
\ No newline at end of file +1. [HTTP endpoint monitoring with Netdata](/src/go/plugin/go.d/modules/httpcheck/integrations/http_endpoints.md)
\ No newline at end of file diff --git a/src/health/guides/httpcheck/httpcheck_web_service_bad_status.md b/src/health/guides/httpcheck/httpcheck_web_service_bad_status.md index 60fabd751..8ac06a57e 100644 --- a/src/health/guides/httpcheck/httpcheck_web_service_bad_status.md +++ b/src/health/guides/httpcheck/httpcheck_web_service_bad_status.md @@ -18,4 +18,4 @@ root@netdata # curl -v <your_http_endpoint>:<port>/<path> ### Useful resources -1. [HTTP endpoint monitoring with Netdata](/src/go/collectors/go.d.plugin/modules/httpcheck/integrations/http_endpoints.md) +1. [HTTP endpoint monitoring with Netdata](/src/go/plugin/go.d/modules/httpcheck/integrations/http_endpoints.md) diff --git a/src/health/guides/httpcheck/httpcheck_web_service_slow.md b/src/health/guides/httpcheck/httpcheck_web_service_slow.md index 4f962e155..8f46a0f14 100644 --- a/src/health/guides/httpcheck/httpcheck_web_service_slow.md +++ b/src/health/guides/httpcheck/httpcheck_web_service_slow.md @@ -14,5 +14,5 @@ To troubleshoot this issue, check for: ### Useful resources -1. [HTTP endpoint monitoring with Netdata](/src/go/collectors/go.d.plugin/modules/httpcheck/integrations/http_endpoints.md) +1. [HTTP endpoint monitoring with Netdata](/src/go/plugin/go.d/modules/httpcheck/integrations/http_endpoints.md) diff --git a/src/health/guides/httpcheck/httpcheck_web_service_unreachable.md b/src/health/guides/httpcheck/httpcheck_web_service_unreachable.md index c77d33c0b..306ce1fee 100644 --- a/src/health/guides/httpcheck/httpcheck_web_service_unreachable.md +++ b/src/health/guides/httpcheck/httpcheck_web_service_unreachable.md @@ -30,4 +30,4 @@ To troubleshoot this error, check the following: ### Useful resources -1. [HTTP endpoint monitoring with Netdata](/src/go/collectors/go.d.plugin/modules/httpcheck/integrations/http_endpoints.md)
\ No newline at end of file +1. [HTTP endpoint monitoring with Netdata](/src/go/plugin/go.d/modules/httpcheck/integrations/http_endpoints.md)
\ No newline at end of file diff --git a/src/health/health.d/beanstalkd.conf b/src/health/health.d/beanstalkd.conf index 0d37f28e0..51b280491 100644 --- a/src/health/health.d/beanstalkd.conf +++ b/src/health/health.d/beanstalkd.conf @@ -11,31 +11,5 @@ component: Beanstalk warn: $this > 3 delay: up 0 down 5m multiplier 1.2 max 1h summary: Beanstalk buried jobs - info: Number of buried jobs across all tubes. \ - You need to manually kick them so they can be processed. \ - Presence of buried jobs in a tube does not affect new jobs. - to: sysadmin - -# get the number of buried jobs per queue - -#template: beanstalk_tube_buried_jobs -# on: beanstalk.jobs -# calc: $buried -# units: jobs -# every: 10s -# warn: $this > 0 -# crit: $this > 10 -# delay: up 0 down 5m multiplier 1.2 max 1h -# info: the number of jobs buried per tube -# to: sysadmin - -# get the current number of tubes - -#template: beanstalk_number_of_tubes -# on: beanstalk.current_tubes -# calc: $tubes -# every: 10s -# warn: $this < 5 -# delay: up 0 down 5m multiplier 1.2 max 1h -# info: the current number of tubes on the server -# to: sysadmin + info: Number of buried jobs across all tubes. + to: silent diff --git a/src/health/health.d/docker.conf b/src/health/health.d/docker.conf index 668614d4d..edb63a08c 100644 --- a/src/health/health.d/docker.conf +++ b/src/health/health.d/docker.conf @@ -1,4 +1,6 @@ - template: docker_container_unhealthy +# you can disable an alarm notification by setting the 'to' line to: silent + +template: docker_container_unhealthy on: docker.container_health_status class: Errors type: Containers @@ -10,3 +12,22 @@ component: Docker summary: Docker container ${label:container_name} health info: ${label:container_name} docker container health status is unhealthy to: sysadmin + +# This alert monitors the status of Docker containers and triggers if any container is exited (down). +# To enable this alert for specific containers, you need to modify the "chart labels" filter. +# This filter uses Netdata's simple pattern matching syntax. + + template: docker_container_down + on: docker.container_state + class: Errors + type: Containers + component: Docker +chart labels: container_name=!* + units: status + every: 10s + lookup: average -10s of exited + warn: $this > 0 + delay: down 1m multiplier 1.5 max 2h + summary: Docker container ${label:container_name} down + info: Docker container ${label:container_name} is currently not running + to: sysadmin diff --git a/src/health/health.d/gearman.conf b/src/health/health.d/gearman.conf index 78e1165d1..2b19105b5 100644 --- a/src/health/health.d/gearman.conf +++ b/src/health/health.d/gearman.conf @@ -1,14 +1,15 @@ +# you can disable an alarm notification by setting the 'to' line to: silent - template: gearman_workers_queued - on: gearman.single_job - class: Latency - type: Computing -component: Gearman - lookup: average -10m unaligned match-names of Pending - units: workers - every: 10s - warn: $this > 30000 - delay: down 5m multiplier 1.5 max 1h - summary: Gearman queued jobs - info: Average number of queued jobs over the last 10 minutes - to: sysadmin +# template: gearman_function_waiting_jobs +# on: gearman.function_queued_jobs_activity +# class: Latency +# type: Computing +#component: Gearman +# lookup: average -10m unaligned of waiting +# units: jobs +# every: 10s +# warn: $this > 30000 +# delay: down 5m multiplier 1.5 max 1h +# summary: Waiting jobs for ${label:task_name} function +# info: Average number of waiting jobs for ${label:function_name} function over the last 10 minutes +# to: sysadmin diff --git a/src/health/health.d/ipfs.conf b/src/health/health.d/ipfs.conf index 4dfee3c7f..bc3b0b1ea 100644 --- a/src/health/health.d/ipfs.conf +++ b/src/health/health.d/ipfs.conf @@ -1,10 +1,10 @@ template: ipfs_datastore_usage - on: ipfs.repo_size + on: ipfs.datastore_space_utilization class: Utilization type: Data Sharing component: IPFS - calc: $size * 100 / $avail + calc: $used units: % every: 10s warn: $this > (($status >= $WARNING) ? (80) : (90)) diff --git a/src/health/health.d/x509check.conf b/src/health/health.d/x509check.conf index 1d40c8602..38187326f 100644 --- a/src/health/health.d/x509check.conf +++ b/src/health/health.d/x509check.conf @@ -12,15 +12,16 @@ component: x509 certificates summary: x509 certificate expiration for ${label:source} info: Time until x509 certificate expires for ${label:source} to: webmaster - + template: x509check_revocation_status on: x509check.revocation_status class: Errors type: Certificates component: x509 certificates calc: $revoked + units: status every: 60s - crit: $this != nan AND $this != 0 + crit: $this == 1 summary: x509 certificate revocation status for ${label:source} - info: x509 certificate revocation status (0: revoked, 1: valid) for ${label:source} + info: x509 certificate revocation status for ${label:source} to: webmaster diff --git a/src/health/health.d/zfs.conf b/src/health/health.d/zfs.conf index 9c1f0018b..5c8065aa3 100644 --- a/src/health/health.d/zfs.conf +++ b/src/health/health.d/zfs.conf @@ -67,7 +67,7 @@ component: File system type: System component: File system calc: $degraded - units: boolean + units: status every: 10s warn: $this > 0 delay: down 1m multiplier 1.5 max 1h @@ -81,10 +81,25 @@ component: File system type: System component: File system calc: $faulted + $unavail - units: boolean + units: status every: 10s crit: $this > 0 delay: down 1m multiplier 1.5 max 1h summary: Critical ZFS pool ${label:pool} state info: ZFS pool ${label:pool} state is faulted or unavail to: sysadmin + + + template: zfs_vdev_health_state + on: zfspool.vdev_health_state + class: Errors + type: System +component: File system + calc: $degraded + $faulted + units: status + every: 10s + warn: $this > 0 + delay: down 1m multiplier 1.5 max 1h + summary: ZFS vdev ${label:vdev} pool ${label:pool} state + info: ZFS vdev ${label:vdev} state is faulted or degraded + to: sysadmin diff --git a/src/health/health_event_loop.c b/src/health/health_event_loop.c index 756ffa165..b50812f2a 100644 --- a/src/health/health_event_loop.c +++ b/src/health/health_event_loop.c @@ -101,26 +101,10 @@ static void health_sleep(time_t next_run, unsigned int loop __maybe_unused) { } } -static void sql_health_postpone_queue_removed(RRDHOST *host __maybe_unused) { -#ifdef ENABLE_ACLK - if (netdata_cloud_enabled) { - struct aclk_sync_cfg_t *wc = host->aclk_config; - if (unlikely(!wc)) { - return; - } - - if (wc->alert_queue_removed >= 1) { - wc->alert_queue_removed+=6; - } - } -#endif -} - static void health_execute_delayed_initializations(RRDHOST *host) { health_plugin_init(); RRDSET *st; - bool must_postpone = false; if (!rrdhost_flag_check(host, RRDHOST_FLAG_PENDING_HEALTH_INITIALIZATION)) return; rrdhost_flag_clear(host, RRDHOST_FLAG_PENDING_HEALTH_INITIALIZATION); @@ -131,11 +115,8 @@ static void health_execute_delayed_initializations(RRDHOST *host) { worker_is_busy(WORKER_HEALTH_JOB_DELAYED_INIT_RRDSET); health_prototype_alerts_for_rrdset_incrementally(st); - must_postpone = true; } rrdset_foreach_done(st); - if (must_postpone) - sql_health_postpone_queue_removed(host); } static void health_initialize_rrdhost(RRDHOST *host) { @@ -179,6 +160,50 @@ static inline int check_if_resumed_from_suspension(void) { return ret; } +static void do_eval_expression( + RRDCALC *rc, + EVAL_EXPRESSION *expression, + const char *expression_type __maybe_unused, + size_t job_type, + RRDCALC_FLAGS error_type, + RRDCALC_STATUS *calc_status, + NETDATA_DOUBLE *result) +{ + if (!expression || (!calc_status && !result)) + return; + + worker_is_busy(job_type); + + if (unlikely(!expression_evaluate(expression))) { + // calculation failed + rc->run_flags |= error_type; + if (result) + *result = NAN; + + netdata_log_debug(D_HEALTH, + "Health on host '%s', alarm '%s.%s': %s expression failed with error: %s", + rrdhost_hostname(rc->rrdset->rrdhost), rrdcalc_chart_name(rc), rrdcalc_name(rc), expression_type, + expression_error_msg(expression) + ); + return; + } + rc->run_flags &= ~error_type; + netdata_log_debug(D_HEALTH, + "Health on host '%s', alarm '%s.%s': %s expression gave value " + NETDATA_DOUBLE_FORMAT ": %s (source: %s)", + rrdhost_hostname(rc->rrdset->rrdhost), + rrdcalc_chart_name(rc), + rrdcalc_name(rc), + expression_type, + expression_result(expression), + expression_error_msg(expression), + rrdcalc_source(rc)); + if (calc_status) + *calc_status = rrdcalc_value2status(expression_result(expression)); + else + *result = expression_result(expression); +} + static void health_event_loop(void) { bool health_running_logged = false; @@ -270,6 +295,13 @@ static void health_event_loop(void) { } worker_is_busy(WORKER_HEALTH_JOB_HOST_LOCK); +#ifdef ENABLE_ACLK + if (netdata_cloud_enabled) { + struct aclk_sync_cfg_t *wc = host->aclk_config; + if (wc && wc->send_snapshot == 2) + continue; + } +#endif // the first loop is to lookup values from the db foreach_rrdcalc_in_rrdhost_read(host, rc) { @@ -314,11 +346,6 @@ static void health_event_loop(void) { rc->last_status_change_value = rc->value; rc->last_updated = now_tmp; rc->value = NAN; - -#ifdef ENABLE_ACLK - if (netdata_cloud_enabled) - sql_queue_alarm_to_aclk(host, ae, true); -#endif } } } @@ -404,36 +431,7 @@ static void health_event_loop(void) { // ------------------------------------------------------------ // if there is calculation expression, run it - if (unlikely(rc->config.calculation)) { - worker_is_busy(WORKER_HEALTH_JOB_CALC_EVAL); - - if (unlikely(!expression_evaluate(rc->config.calculation))) { - // calculation failed - rc->value = NAN; - rc->run_flags |= RRDCALC_FLAG_CALC_ERROR; - - netdata_log_debug( - D_HEALTH, "Health on host '%s', alarm '%s.%s': expression '%s' failed: %s", - rrdhost_hostname(host), rrdcalc_chart_name(rc), rrdcalc_name(rc), - expression_parsed_as(rc->config.calculation), expression_error_msg(rc->config.calculation) - ); - } - else { - rc->run_flags &= ~RRDCALC_FLAG_CALC_ERROR; - - netdata_log_debug( - D_HEALTH, "Health on host '%s', alarm '%s.%s': expression '%s' gave value " - NETDATA_DOUBLE_FORMAT": %s (source: %s)", - rrdhost_hostname(host), rrdcalc_chart_name(rc), rrdcalc_name(rc), - expression_parsed_as(rc->config.calculation), - expression_result(rc->config.calculation), - expression_error_msg(rc->config.calculation), - rrdcalc_source(rc) - ); - - rc->value = expression_result(rc->config.calculation); - } - } + do_eval_expression(rc, rc->config.calculation, "calculation", WORKER_HEALTH_JOB_CALC_EVAL, RRDCALC_FLAG_CALC_ERROR, NULL, &rc->value); } foreach_rrdcalc_in_rrdhost_done(rc); @@ -453,65 +451,8 @@ static void health_event_loop(void) { RRDCALC_STATUS warning_status = RRDCALC_STATUS_UNDEFINED; RRDCALC_STATUS critical_status = RRDCALC_STATUS_UNDEFINED; - // -------------------------------------------------------- - // check the warning expression - - if (likely(rc->config.warning)) { - worker_is_busy(WORKER_HEALTH_JOB_WARNING_EVAL); - - if (unlikely(!expression_evaluate(rc->config.warning))) { - // calculation failed - rc->run_flags |= RRDCALC_FLAG_WARN_ERROR; - - netdata_log_debug(D_HEALTH, - "Health on host '%s', alarm '%s.%s': warning expression failed with error: %s", - rrdhost_hostname(host), rrdcalc_chart_name(rc), rrdcalc_name(rc), - expression_error_msg(rc->config.warning) - ); - } else { - rc->run_flags &= ~RRDCALC_FLAG_WARN_ERROR; - netdata_log_debug(D_HEALTH, - "Health on host '%s', alarm '%s.%s': warning expression gave value " - NETDATA_DOUBLE_FORMAT ": %s (source: %s)", - rrdhost_hostname(host), - rrdcalc_chart_name(rc), - rrdcalc_name(rc), - expression_result(rc->config.warning), - expression_error_msg(rc->config.warning), - rrdcalc_source(rc) - ); - warning_status = rrdcalc_value2status(expression_result(rc->config.warning)); - } - } - - // -------------------------------------------------------- - // check the critical expression - - if (likely(rc->config.critical)) { - worker_is_busy(WORKER_HEALTH_JOB_CRITICAL_EVAL); - - if (unlikely(!expression_evaluate(rc->config.critical))) { - // calculation failed - rc->run_flags |= RRDCALC_FLAG_CRIT_ERROR; - - netdata_log_debug(D_HEALTH, - "Health on host '%s', alarm '%s.%s': critical expression failed with error: %s", - rrdhost_hostname(host), rrdcalc_chart_name(rc), rrdcalc_name(rc), - expression_error_msg(rc->config.critical) - ); - } else { - rc->run_flags &= ~RRDCALC_FLAG_CRIT_ERROR; - netdata_log_debug(D_HEALTH, - "Health on host '%s', alarm '%s.%s': critical expression gave value " - NETDATA_DOUBLE_FORMAT ": %s (source: %s)", - rrdhost_hostname(host), rrdcalc_chart_name(rc), rrdcalc_name(rc), - expression_result(rc->config.critical), - expression_error_msg(rc->config.critical), - rrdcalc_source(rc) - ); - critical_status = rrdcalc_value2status(expression_result(rc->config.critical)); - } - } + do_eval_expression(rc, rc->config.warning, "warning", WORKER_HEALTH_JOB_WARNING_EVAL, RRDCALC_FLAG_WARN_ERROR, &warning_status, NULL); + do_eval_expression(rc, rc->config.critical, "critical", WORKER_HEALTH_JOB_CRITICAL_EVAL, RRDCALC_FLAG_CRIT_ERROR, &critical_status, NULL); // -------------------------------------------------------- // decide the final alarm status @@ -706,26 +647,18 @@ static void health_event_loop(void) { wait_for_all_notifications_to_finish_before_allowing_health_to_be_cleaned_up(); break; } + } #ifdef ENABLE_ACLK - if (netdata_cloud_enabled) { - struct aclk_sync_cfg_t *wc = host->aclk_config; - if (unlikely(!wc)) - continue; - - if (wc->alert_queue_removed == 1) { - sql_queue_removed_alerts_to_aclk(host); - } else if (wc->alert_queue_removed > 1) { - wc->alert_queue_removed--; - } - - if (wc->alert_checkpoint_req == 1) { - aclk_push_alarm_checkpoint(host); - } else if (wc->alert_checkpoint_req > 1) { - wc->alert_checkpoint_req--; - } - } -#endif + struct aclk_sync_cfg_t *wc = host->aclk_config; + if (wc && wc->send_snapshot == 1) { + wc->send_snapshot = 2; + rrdhost_flag_set(host, RRDHOST_FLAG_ACLK_STREAM_ALERTS); } + else + if (process_alert_pending_queue(host)) + rrdhost_flag_set(host, RRDHOST_FLAG_ACLK_STREAM_ALERTS); +#endif + dfe_done(host); // wait for all notifications to finish before allowing health to be cleaned up diff --git a/src/health/health_log.c b/src/health/health_log.c index b04f8f248..143b741bf 100644 --- a/src/health/health_log.c +++ b/src/health/health_log.c @@ -4,7 +4,8 @@ // ---------------------------------------------------------------------------- -inline void health_alarm_log_save(RRDHOST *host, ALARM_ENTRY *ae) { +inline void health_alarm_log_save(RRDHOST *host, ALARM_ENTRY *ae) +{ sql_health_alarm_log_save(host, ae); } @@ -43,7 +44,7 @@ void health_log_alert_transition_with_trace(RRDHOST *host, ALARM_ENTRY *ae, int }; ND_LOG_STACK_PUSH(lgs); - errno = 0; + errno_clear(); ND_LOG_FIELD_PRIORITY priority = NDLP_INFO; diff --git a/src/health/health_notifications.c b/src/health/health_notifications.c index 79426f48c..85dd2d0d8 100644 --- a/src/health/health_notifications.c +++ b/src/health/health_notifications.c @@ -23,7 +23,13 @@ void health_alarm_wait_for_execution(ALARM_ENTRY *ae) { if (!(ae->flags & HEALTH_ENTRY_FLAG_EXEC_IN_PROGRESS)) return; - spawn_wait_cmd(ae->exec_spawn_serial, &ae->exec_code, &ae->exec_run_timestamp); + if(!ae->popen_instance) { + // nd_log(NDLS_DAEMON, NDLP_ERR, "attempted to wait for the execution of alert that has not spawn a notification"); + return; + } + + ae->exec_code = spawn_popen_wait(ae->popen_instance); + netdata_log_debug(D_HEALTH, "done executing command - returned with code %d", ae->exec_code); ae->flags &= ~HEALTH_ENTRY_FLAG_EXEC_IN_PROGRESS; @@ -75,7 +81,6 @@ static inline void enqueue_alarm_notify_in_progress(ALARM_ENTRY *ae) alarm_notifications_in_progress.head = ae; } alarm_notifications_in_progress.tail = ae; - } static bool prepare_command(BUFFER *wb, @@ -462,7 +467,7 @@ void health_send_notification(RRDHOST *host, ALARM_ENTRY *ae, struct health_rais netdata_log_debug(D_HEALTH, "executing command '%s'", command_to_run); ae->flags |= HEALTH_ENTRY_FLAG_EXEC_IN_PROGRESS; - ae->exec_spawn_serial = spawn_enq_cmd(command_to_run); + ae->popen_instance = spawn_popen_run(command_to_run); enqueue_alarm_notify_in_progress(ae); health_alarm_log_save(host, ae); } else { diff --git a/src/health/health_prototypes.c b/src/health/health_prototypes.c index c43096115..a8681a453 100644 --- a/src/health/health_prototypes.c +++ b/src/health/health_prototypes.c @@ -687,15 +687,6 @@ void health_apply_prototypes_to_host(RRDHOST *host) { health_prototype_reset_alerts_for_rrdset(st); } rrdset_foreach_done(st); - -#ifdef ENABLE_ACLK - if (netdata_cloud_enabled) { - struct aclk_sync_cfg_t *wc = host->aclk_config; - if (likely(wc)) { - wc->alert_queue_removed = SEND_REMOVED_AFTER_HEALTH_LOOPS; - } - } -#endif } void health_apply_prototypes_to_all_hosts(void) { diff --git a/src/health/notifications/alarm-notify.sh.in b/src/health/notifications/alarm-notify.sh.in index 9a5780de1..c7c44cb11 100755 --- a/src/health/notifications/alarm-notify.sh.in +++ b/src/health/notifications/alarm-notify.sh.in @@ -641,8 +641,12 @@ filter_recipient_by_criticality() { ;; CLEAR) - # remove tracking file - [ -f "${tracking_file}" ] && rm "${tracking_file}" + if [ -f "${tracking_file}" ]; then + tracking_file_existed="yes" + rm "${tracking_file}" + else + tracking_file_existed="" + fi # "noclear" modifier set, block notification if [ "${mod_noclear}" == "1" ]; then @@ -657,7 +661,7 @@ filter_recipient_by_criticality() { fi # "critical" modifier set, send notification if tracking file exists - if [ "${mod_critical}" == "1" ] && [ -f "${tracking_file}" ]; then + if [ "${mod_critical}" == "1" ] && [ -n "${tracking_file_existed}" ]; then debug "SEVERITY FILTERING for ${recipient_arg} VIA ${method}: ALLOW: recipient has been notified for this alarm in the past (no status change will be sent from now)" return 0 fi @@ -1515,13 +1519,20 @@ send_telegram() { notify_telegram=1 notify_retries=${TELEGRAM_RETRIES_ON_LIMIT:-0} + IFS=":" read -r chatID threadID <<< "${chatid}" + + # https://core.telegram.org/bots/api#sendmessage + api_url="https://api.telegram.org/bot${bottoken}/sendMessage?chat_id=${chatID}" + if [ -n "${threadID}" ]; then + api_url+="&message_thread_id=${threadID}" + fi + while [ ${notify_telegram} -eq 1 ]; do - # https://core.telegram.org/bots/api#sendmessage httpcode=$(docurl ${disableNotification} \ --data-urlencode "parse_mode=HTML" \ --data-urlencode "disable_web_page_preview=true" \ --data-urlencode "text=${emoji} ${message}" \ - "https://api.telegram.org/bot${bottoken}/sendMessage?chat_id=${chatid}") + "${api_url}") notify_telegram=0 diff --git a/src/health/notifications/health_alarm_notify.conf b/src/health/notifications/health_alarm_notify.conf index f3b67c9de..9dcec27ae 100755 --- a/src/health/notifications/health_alarm_notify.conf +++ b/src/health/notifications/health_alarm_notify.conf @@ -413,6 +413,7 @@ DEFAULT_RECIPIENT_KAVENEGAR="" # multiple recipients can be given like this: # "CHAT_ID_1 CHAT_ID_2 ..." +# To send alerts to a specific topic within a chat, use `CHAT_ID:TOPIC_ID`. # enable/disable sending telegram messages SEND_TELEGRAM="YES" diff --git a/src/health/notifications/telegram/README.md b/src/health/notifications/telegram/README.md index e263d0bb5..90cca4214 100644 --- a/src/health/notifications/telegram/README.md +++ b/src/health/notifications/telegram/README.md @@ -55,7 +55,7 @@ The following options can be defined for this notification |:----|:-----------|:-------|:--------:| | SEND_TELEGRAM | Set `SEND_TELEGRAM` to YES | YES | yes | | TELEGRAM_BOT_TOKEN | set `TELEGRAM_BOT_TOKEN` to your bot token. | | yes | -| DEFAULT_RECIPIENT_TELEGRAM | Set `DEFAULT_RECIPIENT_TELEGRAM` to the chat ID you want the alert notifications to be sent to. You can define multiple chat IDs like this: -49999333322 -1009999222255. | | yes | +| DEFAULT_RECIPIENT_TELEGRAM | Set the `DEFAULT_RECIPIENT_TELEGRAM` variable in your config file to your Telegram chat ID (find it with @myidbot). Separate multiple chat IDs with spaces. To send alerts to a specific topic within a chat, use `chatID:topicID`. | | yes | ##### DEFAULT_RECIPIENT_TELEGRAM diff --git a/src/health/notifications/telegram/metadata.yaml b/src/health/notifications/telegram/metadata.yaml index cc6d8c91e..daa45da72 100644 --- a/src/health/notifications/telegram/metadata.yaml +++ b/src/health/notifications/telegram/metadata.yaml @@ -40,7 +40,7 @@ required: true - name: 'DEFAULT_RECIPIENT_TELEGRAM' default_value: '' - description: "Set `DEFAULT_RECIPIENT_TELEGRAM` to the chat ID you want the alert notifications to be sent to. You can define multiple chat IDs like this: -49999333322 -1009999222255." + description: "Set the `DEFAULT_RECIPIENT_TELEGRAM` variable in your config file to your Telegram chat ID (find it with @myidbot). Separate multiple chat IDs with spaces. To send alerts to a specific topic within a chat, use `chatID:topicID`." required: true detailed_description: | All roles will default to this variable if left unconfigured. diff --git a/src/libnetdata/clocks/clocks.c b/src/libnetdata/clocks/clocks.c index e1a3e64cb..5da450a2d 100644 --- a/src/libnetdata/clocks/clocks.c +++ b/src/libnetdata/clocks/clocks.c @@ -343,7 +343,7 @@ usec_t heartbeat_next(heartbeat_t *hb, usec_t tick) { } if(unlikely(now < next)) { - errno = 0; + errno_clear(); nd_log_limit_static_global_var(erl, 10, 0); nd_log_limit(&erl, NDLS_DAEMON, NDLP_NOTICE, "heartbeat clock: woke up %"PRIu64" microseconds earlier than expected " @@ -351,7 +351,7 @@ usec_t heartbeat_next(heartbeat_t *hb, usec_t tick) { next - now); } else if(unlikely(now - next > tick / 2)) { - errno = 0; + errno_clear(); nd_log_limit_static_global_var(erl, 10, 0); nd_log_limit(&erl, NDLS_DAEMON, NDLP_NOTICE, "heartbeat clock: woke up %"PRIu64" microseconds later than expected " @@ -368,6 +368,35 @@ usec_t heartbeat_next(heartbeat_t *hb, usec_t tick) { return dt; } +#ifdef OS_WINDOWS + +#include "windows.h" + +void sleep_usec_with_now(usec_t usec, usec_t started_ut) +{ + if (!started_ut) + started_ut = now_realtime_usec(); + + usec_t end_ut = started_ut + usec; + usec_t remaining_ut = usec; + + timeBeginPeriod(1); + + while (remaining_ut >= 1000) + { + DWORD sleep_ms = (DWORD) (remaining_ut / USEC_PER_MS); + Sleep(sleep_ms); + + usec_t now_ut = now_realtime_usec(); + if (now_ut >= end_ut) + break; + + remaining_ut = end_ut - now_ut; + } + + timeEndPeriod(1); +} +#else void sleep_usec_with_now(usec_t usec, usec_t started_ut) { // we expect microseconds (1.000.000 per second) // but timespec is nanoseconds (1.000.000.000 per second) @@ -411,6 +440,7 @@ void sleep_usec_with_now(usec_t usec, usec_t started_ut) { } } } +#endif static inline collected_number uptime_from_boottime(void) { #ifdef CLOCK_BOOTTIME_IS_AVAILABLE diff --git a/src/libnetdata/json/json-c-parser-inline.h b/src/libnetdata/json/json-c-parser-inline.h index 543612a29..c1d60ca45 100644 --- a/src/libnetdata/json/json-c-parser-inline.h +++ b/src/libnetdata/json/json-c-parser-inline.h @@ -136,7 +136,7 @@ return false; \ } \ } else if(required) { \ - buffer_sprintf(error, "missing or invalid type (expected double value or null) for '%s.%s'", path, member); \ + buffer_sprintf(error, "missing or invalid type (expected int value or null) for '%s.%s'", path, member); \ return false; \ } \ } while(0) diff --git a/src/libnetdata/libnetdata.c b/src/libnetdata/libnetdata.c index 909bb71d0..b36a139d2 100644 --- a/src/libnetdata/libnetdata.c +++ b/src/libnetdata/libnetdata.c @@ -493,7 +493,7 @@ char *strndupz(const char *s, size_t len) { // If ptr is NULL, no operation is performed. void freez(void *ptr) { - free(ptr); + if(likely(ptr)) free(ptr); } void *mallocz(size_t size) { @@ -1248,7 +1248,7 @@ cleanup: close(fd); } if(mem == MAP_FAILED) return NULL; - errno = 0; + errno_clear(); return mem; } @@ -1364,7 +1364,7 @@ int verify_netdata_host_prefix(bool log_msg) { char buffer[FILENAME_MAX + 1]; char *path = netdata_configured_host_prefix; char *reason = "unknown reason"; - errno = 0; + errno_clear(); struct stat sb; if (stat(path, &sb) == -1) { @@ -1679,19 +1679,17 @@ char *find_and_replace(const char *src, const char *find, const char *replace, c return value; } - BUFFER *run_command_and_get_output_to_buffer(const char *command, int max_line_length) { BUFFER *wb = buffer_create(0, NULL); - pid_t pid; - FILE *fp = netdata_popen(command, &pid, NULL); - - if(fp) { + POPEN_INSTANCE *pi = spawn_popen_run(command); + if(pi) { char buffer[max_line_length + 1]; - while (fgets(buffer, max_line_length, fp)) { + while (fgets(buffer, max_line_length, pi->child_stdout_fp)) { buffer[max_line_length] = '\0'; buffer_strcat(wb, buffer); } + spawn_popen_kill(pi); } else { buffer_free(wb); @@ -1699,103 +1697,27 @@ BUFFER *run_command_and_get_output_to_buffer(const char *command, int max_line_l return NULL; } - netdata_pclose(NULL, fp, pid); return wb; } bool run_command_and_copy_output_to_stdout(const char *command, int max_line_length) { - pid_t pid; - FILE *fp = netdata_popen(command, &pid, NULL); - - if(fp) { + POPEN_INSTANCE *pi = spawn_popen_run(command); + if(pi) { char buffer[max_line_length + 1]; - while (fgets(buffer, max_line_length, fp)) + + while (fgets(buffer, max_line_length, pi->child_stdout_fp)) fprintf(stdout, "%s", buffer); + + spawn_popen_kill(pi); } else { netdata_log_error("Failed to execute command '%s'.", command); return false; } - netdata_pclose(NULL, fp, pid); return true; } - -static int fd_is_valid(int fd) { - return fcntl(fd, F_GETFD) != -1 || errno != EBADF; -} - -void for_each_open_fd(OPEN_FD_ACTION action, OPEN_FD_EXCLUDE excluded_fds){ - int fd; - - switch(action){ - case OPEN_FD_ACTION_CLOSE: - if(!(excluded_fds & OPEN_FD_EXCLUDE_STDIN)) (void)close(STDIN_FILENO); - if(!(excluded_fds & OPEN_FD_EXCLUDE_STDOUT)) (void)close(STDOUT_FILENO); - if(!(excluded_fds & OPEN_FD_EXCLUDE_STDERR)) (void)close(STDERR_FILENO); -#if defined(HAVE_CLOSE_RANGE) - if(close_range(STDERR_FILENO + 1, ~0U, 0) == 0) return; - nd_log(NDLS_DAEMON, NDLP_DEBUG, "close_range() failed, will try to close fds one by one"); -#endif - break; - case OPEN_FD_ACTION_FD_CLOEXEC: - if(!(excluded_fds & OPEN_FD_EXCLUDE_STDIN)) (void)fcntl(STDIN_FILENO, F_SETFD, FD_CLOEXEC); - if(!(excluded_fds & OPEN_FD_EXCLUDE_STDOUT)) (void)fcntl(STDOUT_FILENO, F_SETFD, FD_CLOEXEC); - if(!(excluded_fds & OPEN_FD_EXCLUDE_STDERR)) (void)fcntl(STDERR_FILENO, F_SETFD, FD_CLOEXEC); -#if defined(HAVE_CLOSE_RANGE) && defined(CLOSE_RANGE_CLOEXEC) // Linux >= 5.11, FreeBSD >= 13.1 - if(close_range(STDERR_FILENO + 1, ~0U, CLOSE_RANGE_CLOEXEC) == 0) return; - nd_log(NDLS_DAEMON, NDLP_DEBUG, "close_range() failed, will try to mark fds for closing one by one"); -#endif - break; - default: - break; // do nothing - } - - DIR *dir = opendir("/proc/self/fd"); - if (dir == NULL) { - struct rlimit rl; - int open_max = -1; - - if(getrlimit(RLIMIT_NOFILE, &rl) == 0 && rl.rlim_max != RLIM_INFINITY) open_max = rl.rlim_max; -#ifdef _SC_OPEN_MAX - else open_max = sysconf(_SC_OPEN_MAX); -#endif - - if (open_max == -1) open_max = 65535; // 65535 arbitrary default if everything else fails - - for (fd = STDERR_FILENO + 1; fd < open_max; fd++) { - switch(action){ - case OPEN_FD_ACTION_CLOSE: - if(fd_is_valid(fd)) (void)close(fd); - break; - case OPEN_FD_ACTION_FD_CLOEXEC: - (void)fcntl(fd, F_SETFD, FD_CLOEXEC); - break; - default: - break; // do nothing - } - } - } else { - struct dirent *entry; - while ((entry = readdir(dir)) != NULL) { - fd = str2i(entry->d_name); - if(unlikely((fd == STDIN_FILENO ) || (fd == STDOUT_FILENO) || (fd == STDERR_FILENO) )) continue; - switch(action){ - case OPEN_FD_ACTION_CLOSE: - if(fd_is_valid(fd)) (void)close(fd); - break; - case OPEN_FD_ACTION_FD_CLOEXEC: - (void)fcntl(fd, F_SETFD, FD_CLOEXEC); - break; - default: - break; // do nothing - } - } - closedir(dir); - } -} - struct timing_steps { const char *name; usec_t time; diff --git a/src/libnetdata/libnetdata.h b/src/libnetdata/libnetdata.h index 859f54cc3..b4bddb70a 100644 --- a/src/libnetdata/libnetdata.h +++ b/src/libnetdata/libnetdata.h @@ -326,6 +326,9 @@ size_t judy_aral_structures(void); #define GUID_LEN 36 +#define PIPE_READ 0 +#define PIPE_WRITE 1 + #include "linked-lists.h" #include "storage-point.h" @@ -425,7 +428,7 @@ char *find_and_replace(const char *src, const char *find, const char *replace, c #define UNUSED_FUNCTION(x) UNUSED_##x #endif -#define error_report(x, args...) do { errno = 0; netdata_log_error(x, ##args); } while(0) +#define error_report(x, args...) do { errno_clear(); netdata_log_error(x, ##args); } while(0) // Taken from linux kernel #define BUILD_BUG_ON(condition) ((void)sizeof(char[1 - 2*!!(condition)])) @@ -440,18 +443,12 @@ char *find_and_replace(const char *src, const char *find, const char *replace, c bool run_command_and_copy_output_to_stdout(const char *command, int max_line_length); struct web_buffer *run_command_and_get_output_to_buffer(const char *command, int max_line_length); -typedef enum { - OPEN_FD_ACTION_CLOSE, - OPEN_FD_ACTION_FD_CLOEXEC -} OPEN_FD_ACTION; -typedef enum { - OPEN_FD_EXCLUDE_STDIN = 0x01, - OPEN_FD_EXCLUDE_STDOUT = 0x02, - OPEN_FD_EXCLUDE_STDERR = 0x04 -} OPEN_FD_EXCLUDE; -void for_each_open_fd(OPEN_FD_ACTION action, OPEN_FD_EXCLUDE excluded_fds); - +#ifdef OS_WINDOWS +void netdata_cleanup_and_exit(int ret, const char *action, const char *action_result, const char *action_data); +#else void netdata_cleanup_and_exit(int ret, const char *action, const char *action_result, const char *action_data) NORETURN; +#endif + extern char *netdata_configured_host_prefix; #include "os/os.h" @@ -478,7 +475,9 @@ extern char *netdata_configured_host_prefix; #include "datetime/rfc3339.h" #include "datetime/rfc7231.h" #include "completion/completion.h" -#include "popen/popen.h" +#include "log/log.h" +#include "spawn_server/spawn_server.h" +#include "spawn_server/spawn_popen.h" #include "simple_pattern/simple_pattern.h" #ifdef ENABLE_HTTPS # include "socket/security.h" @@ -486,7 +485,6 @@ extern char *netdata_configured_host_prefix; #include "socket/socket.h" #include "config/appconfig.h" #include "log/journal.h" -#include "log/log.h" #include "buffered_reader/buffered_reader.h" #include "procfile/procfile.h" #include "string/string.h" diff --git a/src/libnetdata/locks/locks.c b/src/libnetdata/locks/locks.c index d01ee29f1..424b86ce9 100644 --- a/src/libnetdata/locks/locks.c +++ b/src/libnetdata/locks/locks.c @@ -224,14 +224,24 @@ int __netdata_rwlock_trywrlock(netdata_rwlock_t *rwlock) { // spinlock implementation // https://www.youtube.com/watch?v=rmGJc9PXpuE&t=41s -void spinlock_init(SPINLOCK *spinlock) { +#ifdef SPINLOCK_IMPL_WITH_MUTEX +void spinlock_init(SPINLOCK *spinlock) +{ + netdata_mutex_init(&spinlock->inner); +} +#else +void spinlock_init(SPINLOCK *spinlock) +{ memset(spinlock, 0, sizeof(SPINLOCK)); } +#endif -static inline void spinlock_lock_internal(SPINLOCK *spinlock) { -#ifdef NETDATA_INTERNAL_CHECKS +#ifndef SPINLOCK_IMPL_WITH_MUTEX +static inline void spinlock_lock_internal(SPINLOCK *spinlock) +{ + #ifdef NETDATA_INTERNAL_CHECKS size_t spins = 0; -#endif + #endif for(int i = 1; __atomic_load_n(&spinlock->locked, __ATOMIC_RELAXED) || @@ -239,9 +249,10 @@ static inline void spinlock_lock_internal(SPINLOCK *spinlock) { ; i++ ) { -#ifdef NETDATA_INTERNAL_CHECKS + #ifdef NETDATA_INTERNAL_CHECKS spins++; -#endif + #endif + if(unlikely(i == 8)) { i = 0; tinysleep(); @@ -250,23 +261,29 @@ static inline void spinlock_lock_internal(SPINLOCK *spinlock) { // we have the lock -#ifdef NETDATA_INTERNAL_CHECKS + #ifdef NETDATA_INTERNAL_CHECKS spinlock->spins += spins; spinlock->locker_pid = gettid_cached(); -#endif + #endif nd_thread_spinlock_locked(); } +#endif // SPINLOCK_IMPL_WITH_MUTEX -static inline void spinlock_unlock_internal(SPINLOCK *spinlock) { -#ifdef NETDATA_INTERNAL_CHECKS +#ifndef SPINLOCK_IMPL_WITH_MUTEX +static inline void spinlock_unlock_internal(SPINLOCK *spinlock) +{ + #ifdef NETDATA_INTERNAL_CHECKS spinlock->locker_pid = 0; -#endif + #endif + __atomic_clear(&spinlock->locked, __ATOMIC_RELEASE); nd_thread_spinlock_unlocked(); } +#endif // SPINLOCK_IMPL_WITH_MUTEX +#ifndef SPINLOCK_IMPL_WITH_MUTEX static inline bool spinlock_trylock_internal(SPINLOCK *spinlock) { if(!__atomic_load_n(&spinlock->locked, __ATOMIC_RELAXED) && !__atomic_test_and_set(&spinlock->locked, __ATOMIC_ACQUIRE)) { @@ -277,36 +294,79 @@ static inline bool spinlock_trylock_internal(SPINLOCK *spinlock) { return false; } +#endif // SPINLOCK_IMPL_WITH_MUTEX +#ifdef SPINLOCK_IMPL_WITH_MUTEX +void spinlock_lock(SPINLOCK *spinlock) +{ + netdata_mutex_lock(&spinlock->inner); +} +#else void spinlock_lock(SPINLOCK *spinlock) { spinlock_lock_internal(spinlock); } +#endif +#ifdef SPINLOCK_IMPL_WITH_MUTEX +void spinlock_unlock(SPINLOCK *spinlock) +{ + netdata_mutex_unlock(&spinlock->inner); +} +#else void spinlock_unlock(SPINLOCK *spinlock) { spinlock_unlock_internal(spinlock); } +#endif +#ifdef SPINLOCK_IMPL_WITH_MUTEX +bool spinlock_trylock(SPINLOCK *spinlock) +{ + return netdata_mutex_trylock(&spinlock->inner) == 0; +} +#else bool spinlock_trylock(SPINLOCK *spinlock) { return spinlock_trylock_internal(spinlock); } +#endif +#ifdef SPINLOCK_IMPL_WITH_MUTEX +void spinlock_lock_cancelable(SPINLOCK *spinlock) +{ + netdata_mutex_lock(&spinlock->inner); +} +#else void spinlock_lock_cancelable(SPINLOCK *spinlock) { spinlock_lock_internal(spinlock); } +#endif +#ifdef SPINLOCK_IMPL_WITH_MUTEX +void spinlock_unlock_cancelable(SPINLOCK *spinlock) +{ + netdata_mutex_unlock(&spinlock->inner); +} +#else void spinlock_unlock_cancelable(SPINLOCK *spinlock) { spinlock_unlock_internal(spinlock); } +#endif +#ifdef SPINLOCK_IMPL_WITH_MUTEX +bool spinlock_trylock_cancelable(SPINLOCK *spinlock) +{ + return netdata_mutex_trylock(&spinlock->inner) == 0; +} +#else bool spinlock_trylock_cancelable(SPINLOCK *spinlock) { return spinlock_trylock_internal(spinlock); } +#endif // ---------------------------------------------------------------------------- // rw_spinlock implementation diff --git a/src/libnetdata/locks/locks.h b/src/libnetdata/locks/locks.h index d3873c295..c05c65fe2 100644 --- a/src/libnetdata/locks/locks.h +++ b/src/libnetdata/locks/locks.h @@ -6,19 +6,34 @@ #include "../libnetdata.h" #include "../clocks/clocks.h" +// #ifdef OS_WINDOWS +// #define SPINLOCK_IMPL_WITH_MUTEX +// #endif + typedef pthread_mutex_t netdata_mutex_t; #define NETDATA_MUTEX_INITIALIZER PTHREAD_MUTEX_INITIALIZER -typedef struct netdata_spinlock { - bool locked; -#ifdef NETDATA_INTERNAL_CHECKS - pid_t locker_pid; - size_t spins; +#ifdef SPINLOCK_IMPL_WITH_MUTEX + typedef struct netdata_spinlock + { + netdata_mutex_t inner; + } SPINLOCK; +#else + typedef struct netdata_spinlock + { + bool locked; + #ifdef NETDATA_INTERNAL_CHECKS + pid_t locker_pid; + size_t spins; + #endif + } SPINLOCK; #endif -} SPINLOCK; -#define NETDATA_SPINLOCK_INITIALIZER \ - { .locked = false } +#ifdef SPINLOCK_IMPL_WITH_MUTEX +#define NETDATA_SPINLOCK_INITIALIZER { .inner = PTHREAD_MUTEX_INITIALIZER } +#else +#define NETDATA_SPINLOCK_INITIALIZER { .locked = false } +#endif void spinlock_init(SPINLOCK *spinlock); void spinlock_lock(SPINLOCK *spinlock); diff --git a/src/libnetdata/log/log.c b/src/libnetdata/log/log.c index 501b66324..a31127c42 100644 --- a/src/libnetdata/log/log.c +++ b/src/libnetdata/log/log.c @@ -6,6 +6,10 @@ #include "../libnetdata.h" +#if defined(OS_WINDOWS) +#include <windows.h> +#endif + #ifdef __FreeBSD__ #include <sys/endian.h> #endif @@ -36,6 +40,16 @@ struct nd_log_source; static bool nd_log_limit_reached(struct nd_log_source *source); // ---------------------------------------------------------------------------- + +void errno_clear(void) { + errno = 0; + +#if defined(OS_WINDOWS) + SetLastError(ERROR_SUCCESS); +#endif +} + +// ---------------------------------------------------------------------------- // logging method typedef enum __attribute__((__packed__)) { @@ -514,6 +528,13 @@ int nd_log_health_fd(void) { return STDERR_FILENO; } +int nd_log_collectors_fd(void) { + if(nd_log.sources[NDLS_COLLECTORS].method == NDLM_FILE && nd_log.sources[NDLS_COLLECTORS].fd != -1) + return nd_log.sources[NDLS_COLLECTORS].fd; + + return STDERR_FILENO; +} + void nd_log_set_user_settings(ND_LOG_SOURCES source, const char *setting) { char buf[FILENAME_MAX + 100]; if(setting && *setting) @@ -971,14 +992,38 @@ void nd_log_initialize(void) { nd_log_open(&nd_log.sources[i], i); } -void nd_log_reopen_log_files(void) { - netdata_log_info("Reopening all log files."); +void nd_log_reopen_log_files(bool log) { + if(log) + netdata_log_info("Reopening all log files."); nd_log.std_output.initialized = false; nd_log.std_error.initialized = false; nd_log_initialize(); - netdata_log_info("Log files re-opened."); + if(log) + netdata_log_info("Log files re-opened."); +} + +void nd_log_reopen_log_files_for_spawn_server(void) { + if(nd_log.syslog.initialized) { + closelog(); + nd_log.syslog.initialized = false; + nd_log_syslog_init(); + } + + if(nd_log.journal_direct.initialized) { + close(nd_log.journal_direct.fd); + nd_log.journal_direct.fd = -1; + nd_log.journal_direct.initialized = false; + nd_log_journal_direct_init(NULL); + } + + nd_log.sources[NDLS_UNSET].method = NDLM_DISABLED; + nd_log.sources[NDLS_ACCESS].method = NDLM_DISABLED; + nd_log.sources[NDLS_ACLK].method = NDLM_DISABLED; + nd_log.sources[NDLS_DEBUG].method = NDLM_DISABLED; + nd_log.sources[NDLS_HEALTH].method = NDLM_DISABLED; + nd_log_reopen_log_files(false); } void chown_open_file(int fd, uid_t uid, gid_t gid) { @@ -1011,6 +1056,10 @@ static void errno_annotator(BUFFER *wb, const char *key, struct log_field *lf); static void priority_annotator(BUFFER *wb, const char *key, struct log_field *lf); static void timestamp_usec_annotator(BUFFER *wb, const char *key, struct log_field *lf); +#if defined(OS_WINDOWS) +static void winerror_annotator(BUFFER *wb, const char *key, struct log_field *lf); +#endif + // ---------------------------------------------------------------------------- typedef void (*annotator_t)(BUFFER *wb, const char *key, struct log_field *lf); @@ -1058,6 +1107,13 @@ static __thread struct log_field thread_log_fields[_NDF_MAX] = { .logfmt = "errno", .logfmt_annotator = errno_annotator, }, +#if defined(OS_WINDOWS) + [NDF_WINERROR] = { + .journal = "WINERROR", + .logfmt = "winerror", + .logfmt_annotator = winerror_annotator, + }, +#endif [NDF_INVOCATION_ID] = { .journal = "INVOCATION_ID", // standard journald field .logfmt = NULL, @@ -1563,6 +1619,45 @@ static void errno_annotator(BUFFER *wb, const char *key, struct log_field *lf) { buffer_fast_strcat(wb, "\"", 1); } +#if defined(OS_WINDOWS) +static void winerror_annotator(BUFFER *wb, const char *key, struct log_field *lf) { + DWORD errnum = log_field_to_uint64(lf); + + if(errnum == 0) + return; + + char buf[1024]; + DWORD size = FormatMessageA( + FORMAT_MESSAGE_FROM_SYSTEM | FORMAT_MESSAGE_IGNORE_INSERTS, + NULL, + errnum, + MAKELANGID(LANG_NEUTRAL, SUBLANG_DEFAULT), + buf, + (DWORD)(sizeof(buf) - 1), + NULL + ); + if(size > 0) { + // remove \r\n at the end + while(size > 0 && (buf[size - 1] == '\r' || buf[size - 1] == '\n')) + buf[--size] = '\0'; + } + else + size = snprintf(buf, sizeof(buf) - 1, "unknown error code"); + + buf[size] = '\0'; + + if(buffer_strlen(wb)) + buffer_fast_strcat(wb, " ", 1); + + buffer_strcat(wb, key); + buffer_fast_strcat(wb, "=\"", 2); + buffer_print_int64(wb, errnum); + buffer_fast_strcat(wb, ", ", 2); + buffer_json_strcat(wb, buf); + buffer_fast_strcat(wb, "\"", 1); +} +#endif + static void priority_annotator(BUFFER *wb, const char *key, struct log_field *lf) { uint64_t pri = log_field_to_uint64(lf); @@ -2099,8 +2194,8 @@ static void nd_logger_merge_log_stack_to_thread_fields(void) { } static void nd_logger(const char *file, const char *function, const unsigned long line, - ND_LOG_SOURCES source, ND_LOG_FIELD_PRIORITY priority, bool limit, int saved_errno, - const char *fmt, va_list ap) { + ND_LOG_SOURCES source, ND_LOG_FIELD_PRIORITY priority, bool limit, + int saved_errno, size_t saved_winerror __maybe_unused, const char *fmt, va_list ap) { SPINLOCK *spinlock; FILE *fp; @@ -2168,6 +2263,11 @@ static void nd_logger(const char *file, const char *function, const unsigned lon if(saved_errno != 0 && !thread_log_fields[NDF_ERRNO].entry.set) thread_log_fields[NDF_ERRNO].entry = ND_LOG_FIELD_I64(NDF_ERRNO, saved_errno); +#if defined(OS_WINDOWS) + if(saved_winerror != 0 && !thread_log_fields[NDF_WINERROR].entry.set) + thread_log_fields[NDF_WINERROR].entry = ND_LOG_FIELD_U64(NDF_WINERROR, saved_winerror); +#endif + CLEAN_BUFFER *wb = NULL; if(fmt && !thread_log_fields[NDF_MESSAGE].entry.set) { wb = buffer_create(1024, NULL); @@ -2215,7 +2315,7 @@ static void nd_logger(const char *file, const char *function, const unsigned lon nd_log.sources[source].pending_msg = NULL; } - errno = 0; + errno_clear(); } static ND_LOG_SOURCES nd_log_validate_source(ND_LOG_SOURCES source) { @@ -2234,6 +2334,12 @@ static ND_LOG_SOURCES nd_log_validate_source(ND_LOG_SOURCES source) { void netdata_logger(ND_LOG_SOURCES source, ND_LOG_FIELD_PRIORITY priority, const char *file, const char *function, unsigned long line, const char *fmt, ... ) { int saved_errno = errno; + + size_t saved_winerror = 0; +#if defined(OS_WINDOWS) + saved_winerror = GetLastError(); +#endif + source = nd_log_validate_source(source); if (source != NDLS_DEBUG && priority > nd_log.sources[source].min_priority) @@ -2243,12 +2349,18 @@ void netdata_logger(ND_LOG_SOURCES source, ND_LOG_FIELD_PRIORITY priority, const va_start(args, fmt); nd_logger(file, function, line, source, priority, source == NDLS_DAEMON || source == NDLS_COLLECTORS, - saved_errno, fmt, args); + saved_errno, saved_winerror, fmt, args); va_end(args); } void netdata_logger_with_limit(ERROR_LIMIT *erl, ND_LOG_SOURCES source, ND_LOG_FIELD_PRIORITY priority, const char *file __maybe_unused, const char *function __maybe_unused, const unsigned long line __maybe_unused, const char *fmt, ... ) { int saved_errno = errno; + + size_t saved_winerror = 0; +#if defined(OS_WINDOWS) + saved_winerror = GetLastError(); +#endif + source = nd_log_validate_source(source); if (source != NDLS_DEBUG && priority > nd_log.sources[source].min_priority) @@ -2272,7 +2384,7 @@ void netdata_logger_with_limit(ERROR_LIMIT *erl, ND_LOG_SOURCES source, ND_LOG_F va_start(args, fmt); nd_logger(file, function, line, source, priority, source == NDLS_DAEMON || source == NDLS_COLLECTORS, - saved_errno, fmt, args); + saved_errno, saved_winerror, fmt, args); va_end(args); erl->last_logged = now; erl->count = 0; @@ -2280,12 +2392,18 @@ void netdata_logger_with_limit(ERROR_LIMIT *erl, ND_LOG_SOURCES source, ND_LOG_F void netdata_logger_fatal( const char *file, const char *function, const unsigned long line, const char *fmt, ... ) { int saved_errno = errno; + + size_t saved_winerror = 0; +#if defined(OS_WINDOWS) + saved_winerror = GetLastError(); +#endif + ND_LOG_SOURCES source = NDLS_DAEMON; source = nd_log_validate_source(source); va_list args; va_start(args, fmt); - nd_logger(file, function, line, source, NDLP_ALERT, true, saved_errno, fmt, args); + nd_logger(file, function, line, source, NDLP_ALERT, true, saved_errno, saved_winerror, fmt, args); va_end(args); char date[LOG_DATE_LENGTH]; diff --git a/src/libnetdata/log/log.h b/src/libnetdata/log/log.h index 338a5d53b..015c02eb6 100644 --- a/src/libnetdata/log/log.h +++ b/src/libnetdata/log/log.h @@ -46,6 +46,9 @@ typedef enum __attribute__((__packed__)) { NDF_LOG_SOURCE, // DAEMON, COLLECTORS, HEALTH, ACCESS, ACLK - set at the log call NDF_PRIORITY, // the syslog priority (severity) - set at the log call NDF_ERRNO, // the ERRNO at the time of the log call - added automatically +#if defined(OS_WINDOWS) + NDF_WINERROR, // Windows GetLastError() +#endif NDF_INVOCATION_ID, // the INVOCATION_ID of Netdata - added automatically NDF_LINE, // the source code file line number - added automatically NDF_FILE, // the source code filename - added automatically @@ -141,15 +144,17 @@ typedef enum __attribute__((__packed__)) { NDFT_CALLBACK, } ND_LOG_STACK_FIELD_TYPE; +void errno_clear(void); void nd_log_set_user_settings(ND_LOG_SOURCES source, const char *setting); void nd_log_set_facility(const char *facility); void nd_log_set_priority_level(const char *setting); void nd_log_initialize(void); -void nd_log_reopen_log_files(void); +void nd_log_reopen_log_files(bool log); void chown_open_file(int fd, uid_t uid, gid_t gid); void nd_log_chown_log_files(uid_t uid, gid_t gid); void nd_log_set_flood_protection(size_t logs, time_t period); void nd_log_initialize_for_external_plugins(const char *name); +void nd_log_reopen_log_files_for_spawn_server(void); bool nd_log_journal_socket_available(void); ND_LOG_FIELD_ID nd_log_field_id_by_name(const char *field, size_t len); int nd_log_priority2id(const char *priority); @@ -157,6 +162,7 @@ const char *nd_log_id2priority(ND_LOG_FIELD_PRIORITY priority); const char *nd_log_method_for_external_plugins(const char *s); int nd_log_health_fd(void); +int nd_log_collectors_fd(void); typedef bool (*log_formatter_callback_t)(BUFFER *wb, void *data); struct log_stack_entry { diff --git a/src/libnetdata/maps/local-sockets.h b/src/libnetdata/maps/local-sockets.h index d407e6be6..6f2ffd81a 100644 --- a/src/libnetdata/maps/local-sockets.h +++ b/src/libnetdata/maps/local-sockets.h @@ -5,10 +5,8 @@ #include "libnetdata/libnetdata.h" -// disable libmnl for the moment -#undef HAVE_LIBMNL - #ifdef HAVE_LIBMNL +#include <linux/rtnetlink.h> #include <linux/inet_diag.h> #include <linux/sock_diag.h> #include <linux/unix_diag.h> @@ -67,30 +65,41 @@ struct local_port; struct local_socket_state; typedef void (*local_sockets_cb_t)(struct local_socket_state *state, struct local_socket *n, void *data); +struct local_sockets_config { + bool listening; + bool inbound; + bool outbound; + bool local; + bool tcp4; + bool tcp6; + bool udp4; + bool udp6; + bool pid; + bool cmdline; + bool comm; + bool uid; + bool namespaces; + bool tcp_info; + + size_t max_errors; + size_t max_concurrent_namespaces; + + local_sockets_cb_t cb; + void *data; + + const char *host_prefix; + + // internal use + uint64_t net_ns_inode; +}; + typedef struct local_socket_state { - struct { - bool listening; - bool inbound; - bool outbound; - bool local; - bool tcp4; - bool tcp6; - bool udp4; - bool udp6; - bool pid; - bool cmdline; - bool comm; - bool uid; - bool namespaces; - size_t max_errors; - - local_sockets_cb_t cb; - void *data; - - const char *host_prefix; - } config; + struct local_sockets_config config; struct { + size_t mnl_sends; + size_t namespaces_found; + size_t tcp_info_received; size_t pid_fds_processed; size_t pid_fds_opendir_failed; size_t pid_fds_readlink_failed; @@ -98,6 +107,9 @@ typedef struct local_socket_state { size_t errors_encountered; } stats; + bool spawn_server_is_mine; + SPAWN_SERVER *spawn_server; + #ifdef HAVE_LIBMNL bool use_nl; struct mnl_socket *nl; @@ -106,6 +118,7 @@ typedef struct local_socket_state { ARAL *local_socket_aral; ARAL *pid_socket_aral; + SPINLOCK spinlock; // for namespaces uint64_t proc_self_net_ns_inode; @@ -181,12 +194,21 @@ typedef struct local_socket { SOCKET_DIRECTION direction; uint8_t timer; - uint8_t retransmits; + uint8_t retransmits; // the # of packets currently queued for retransmission (not yet acknowledged) uint32_t expires; uint32_t rqueue; uint32_t wqueue; uid_t uid; + struct { + bool checked; + bool ipv46; + } ipv6ony; + + union { + struct tcp_info tcp; + } info; + char comm[TASK_COMM_LEN]; STRING *cmdline; @@ -201,16 +223,18 @@ typedef struct local_socket { #endif } LOCAL_SOCKET; +static inline void local_sockets_spawn_server_callback(SPAWN_REQUEST *request); + // -------------------------------------------------------------------------------------------------------------------- static inline void local_sockets_log(LS_STATE *ls, const char *format, ...) PRINTFLIKE(2, 3); static inline void local_sockets_log(LS_STATE *ls, const char *format, ...) { - if(++ls->stats.errors_encountered == ls->config.max_errors) { + if(ls && ++ls->stats.errors_encountered == ls->config.max_errors) { nd_log(NDLS_COLLECTORS, NDLP_ERR, "LOCAL-SOCKETS: max number of logs reached. Not logging anymore"); return; } - if(ls->stats.errors_encountered > ls->config.max_errors) + if(ls && ls->stats.errors_encountered > ls->config.max_errors) return; char buf[16384]; @@ -224,6 +248,133 @@ static inline void local_sockets_log(LS_STATE *ls, const char *format, ...) { // -------------------------------------------------------------------------------------------------------------------- +static bool local_sockets_is_ipv4_mapped_ipv6_address(const struct in6_addr *addr) { + // An IPv4-mapped IPv6 address starts with 80 bits of zeros followed by 16 bits of ones + static const unsigned char ipv4_mapped_prefix[12] = { 0, 0, 0, 0, 0, 0, 0, 0, 0, 0, 0xFF, 0xFF }; + return memcmp(addr->s6_addr, ipv4_mapped_prefix, 12) == 0; +} + +static bool local_sockets_is_loopback_address(struct socket_endpoint *se) { + if (se->family == AF_INET) { + // For IPv4, loopback addresses are in the 127.0.0.0/8 range + return (ntohl(se->ip.ipv4) >> 24) == 127; // Check if the first byte is 127 + } else if (se->family == AF_INET6) { + // Check if the address is an IPv4-mapped IPv6 address + if (local_sockets_is_ipv4_mapped_ipv6_address(&se->ip.ipv6)) { + // Extract the last 32 bits (IPv4 address) and check if it's in the 127.0.0.0/8 range + uint8_t *ip6 = (uint8_t *)&se->ip.ipv6; + const uint32_t ipv4_addr = *((const uint32_t *)(ip6 + 12)); + return (ntohl(ipv4_addr) >> 24) == 127; + } + + // For IPv6, loopback address is ::1 + return memcmp(&se->ip.ipv6, &in6addr_loopback, sizeof(se->ip.ipv6)) == 0; + } + + return false; +} + +static inline bool local_sockets_is_ipv4_reserved_address(uint32_t ip) { + // Check for the reserved address ranges + ip = ntohl(ip); + return ( + (ip >> 24 == 10) || // Private IP range (A class) + (ip >> 20 == (172 << 4) + 1) || // Private IP range (B class) + (ip >> 16 == (192 << 8) + 168) || // Private IP range (C class) + (ip >> 24 == 127) || // Loopback address (127.0.0.0) + (ip >> 24 == 0) || // Reserved (0.0.0.0) + (ip >> 24 == 169 && (ip >> 16) == 254) || // Link-local address (169.254.0.0) + (ip >> 16 == (192 << 8) + 0) // Test-Net (192.0.0.0) + ); +} + +static inline bool local_sockets_is_private_address(struct socket_endpoint *se) { + if (se->family == AF_INET) { + return local_sockets_is_ipv4_reserved_address(se->ip.ipv4); + } + else if (se->family == AF_INET6) { + uint8_t *ip6 = (uint8_t *)&se->ip.ipv6; + + // Check if the address is an IPv4-mapped IPv6 address + if (local_sockets_is_ipv4_mapped_ipv6_address(&se->ip.ipv6)) { + // Extract the last 32 bits (IPv4 address) and check if it's in the 127.0.0.0/8 range + const uint32_t ipv4_addr = *((const uint32_t *)(ip6 + 12)); + return local_sockets_is_ipv4_reserved_address(ipv4_addr); + } + + // Check for link-local addresses (fe80::/10) + if ((ip6[0] == 0xFE) && ((ip6[1] & 0xC0) == 0x80)) + return true; + + // Check for Unique Local Addresses (ULA) (fc00::/7) + if ((ip6[0] & 0xFE) == 0xFC) + return true; + + // Check for multicast addresses (ff00::/8) + if (ip6[0] == 0xFF) + return true; + + // For IPv6, loopback address is :: or ::1 + return memcmp(&se->ip.ipv6, &in6addr_any, sizeof(se->ip.ipv6)) == 0 || + memcmp(&se->ip.ipv6, &in6addr_loopback, sizeof(se->ip.ipv6)) == 0; + } + + return false; +} + +static bool local_sockets_is_multicast_address(struct socket_endpoint *se) { + if (se->family == AF_INET) { + // For IPv4, check if the address is 0.0.0.0 + uint32_t ip = htonl(se->ip.ipv4); + return (ip >= 0xE0000000 && ip <= 0xEFFFFFFF); // Multicast address range (224.0.0.0/4) + } + else if (se->family == AF_INET6) { + // For IPv6, check if the address is ff00::/8 + uint8_t *ip6 = (uint8_t *)&se->ip.ipv6; + return ip6[0] == 0xff; + } + + return false; +} + +static bool local_sockets_is_zero_address(struct socket_endpoint *se) { + if (se->family == AF_INET) { + // For IPv4, check if the address is 0.0.0.0 + return se->ip.ipv4 == 0; + } + else if (se->family == AF_INET6) { + // For IPv6, check if the address is :: + return memcmp(&se->ip.ipv6, &in6addr_any, sizeof(se->ip.ipv6)) == 0; + } + + return false; +} + +static inline const char *local_sockets_address_space(struct socket_endpoint *se) { + if(local_sockets_is_zero_address(se)) + return "zero"; + else if(local_sockets_is_loopback_address(se)) + return "loopback"; + else if(local_sockets_is_multicast_address(se)) + return "multicast"; + else if(local_sockets_is_private_address(se)) + return "private"; + else + return "public"; +} + +// -------------------------------------------------------------------------------------------------------------------- + +static inline bool is_local_socket_ipv46(LOCAL_SOCKET *n) { + return n->local.family == AF_INET6 && + n->direction == SOCKET_DIRECTION_LISTEN && + local_sockets_is_zero_address(&n->local) && + n->ipv6ony.checked && + n->ipv6ony.ipv46; +} + +// -------------------------------------------------------------------------------------------------------------------- + static void local_sockets_foreach_local_socket_call_cb(LS_STATE *ls) { for(SIMPLE_HASHTABLE_SLOT_LOCAL_SOCKET *sl = simple_hashtable_first_read_only_LOCAL_SOCKET(&ls->sockets_hashtable); sl; @@ -425,123 +576,6 @@ static inline bool local_sockets_find_all_sockets_in_proc(LS_STATE *ls, const ch // -------------------------------------------------------------------------------------------------------------------- -static bool local_sockets_is_ipv4_mapped_ipv6_address(const struct in6_addr *addr) { - // An IPv4-mapped IPv6 address starts with 80 bits of zeros followed by 16 bits of ones - static const unsigned char ipv4_mapped_prefix[12] = { 0, 0, 0, 0, 0, 0, 0, 0, 0, 0, 0xFF, 0xFF }; - return memcmp(addr->s6_addr, ipv4_mapped_prefix, 12) == 0; -} - -static bool local_sockets_is_loopback_address(struct socket_endpoint *se) { - if (se->family == AF_INET) { - // For IPv4, loopback addresses are in the 127.0.0.0/8 range - return (ntohl(se->ip.ipv4) >> 24) == 127; // Check if the first byte is 127 - } else if (se->family == AF_INET6) { - // Check if the address is an IPv4-mapped IPv6 address - if (local_sockets_is_ipv4_mapped_ipv6_address(&se->ip.ipv6)) { - // Extract the last 32 bits (IPv4 address) and check if it's in the 127.0.0.0/8 range - uint8_t *ip6 = (uint8_t *)&se->ip.ipv6; - const uint32_t ipv4_addr = *((const uint32_t *)(ip6 + 12)); - return (ntohl(ipv4_addr) >> 24) == 127; - } - - // For IPv6, loopback address is ::1 - return memcmp(&se->ip.ipv6, &in6addr_loopback, sizeof(se->ip.ipv6)) == 0; - } - - return false; -} - -static inline bool local_sockets_is_ipv4_reserved_address(uint32_t ip) { - // Check for the reserved address ranges - ip = ntohl(ip); - return ( - (ip >> 24 == 10) || // Private IP range (A class) - (ip >> 20 == (172 << 4) + 1) || // Private IP range (B class) - (ip >> 16 == (192 << 8) + 168) || // Private IP range (C class) - (ip >> 24 == 127) || // Loopback address (127.0.0.0) - (ip >> 24 == 0) || // Reserved (0.0.0.0) - (ip >> 24 == 169 && (ip >> 16) == 254) || // Link-local address (169.254.0.0) - (ip >> 16 == (192 << 8) + 0) // Test-Net (192.0.0.0) - ); -} - -static inline bool local_sockets_is_private_address(struct socket_endpoint *se) { - if (se->family == AF_INET) { - return local_sockets_is_ipv4_reserved_address(se->ip.ipv4); - } - else if (se->family == AF_INET6) { - uint8_t *ip6 = (uint8_t *)&se->ip.ipv6; - - // Check if the address is an IPv4-mapped IPv6 address - if (local_sockets_is_ipv4_mapped_ipv6_address(&se->ip.ipv6)) { - // Extract the last 32 bits (IPv4 address) and check if it's in the 127.0.0.0/8 range - const uint32_t ipv4_addr = *((const uint32_t *)(ip6 + 12)); - return local_sockets_is_ipv4_reserved_address(ipv4_addr); - } - - // Check for link-local addresses (fe80::/10) - if ((ip6[0] == 0xFE) && ((ip6[1] & 0xC0) == 0x80)) - return true; - - // Check for Unique Local Addresses (ULA) (fc00::/7) - if ((ip6[0] & 0xFE) == 0xFC) - return true; - - // Check for multicast addresses (ff00::/8) - if (ip6[0] == 0xFF) - return true; - - // For IPv6, loopback address is :: or ::1 - return memcmp(&se->ip.ipv6, &in6addr_any, sizeof(se->ip.ipv6)) == 0 || - memcmp(&se->ip.ipv6, &in6addr_loopback, sizeof(se->ip.ipv6)) == 0; - } - - return false; -} - -static bool local_sockets_is_multicast_address(struct socket_endpoint *se) { - if (se->family == AF_INET) { - // For IPv4, check if the address is 0.0.0.0 - uint32_t ip = htonl(se->ip.ipv4); - return (ip >= 0xE0000000 && ip <= 0xEFFFFFFF); // Multicast address range (224.0.0.0/4) - } - else if (se->family == AF_INET6) { - // For IPv6, check if the address is ff00::/8 - uint8_t *ip6 = (uint8_t *)&se->ip.ipv6; - return ip6[0] == 0xff; - } - - return false; -} - -static bool local_sockets_is_zero_address(struct socket_endpoint *se) { - if (se->family == AF_INET) { - // For IPv4, check if the address is 0.0.0.0 - return se->ip.ipv4 == 0; - } - else if (se->family == AF_INET6) { - // For IPv6, check if the address is :: - return memcmp(&se->ip.ipv6, &in6addr_any, sizeof(se->ip.ipv6)) == 0; - } - - return false; -} - -static inline const char *local_sockets_address_space(struct socket_endpoint *se) { - if(local_sockets_is_zero_address(se)) - return "zero"; - else if(local_sockets_is_loopback_address(se)) - return "loopback"; - else if(local_sockets_is_multicast_address(se)) - return "multicast"; - else if(local_sockets_is_private_address(se)) - return "private"; - else - return "public"; -} - -// -------------------------------------------------------------------------------------------------------------------- - static inline void local_sockets_index_listening_port(LS_STATE *ls, LOCAL_SOCKET *n) { if(n->direction & SOCKET_DIRECTION_LISTEN) { // for the listening sockets, keep a hashtable with all the local ports @@ -636,28 +670,31 @@ static inline bool local_sockets_add_socket(LS_STATE *ls, LOCAL_SOCKET *tmp) { #ifdef HAVE_LIBMNL -static inline void local_sockets_netlink_init(LS_STATE *ls) { - ls->use_nl = true; +static inline void local_sockets_libmnl_init(LS_STATE *ls) { ls->nl = mnl_socket_open(NETLINK_INET_DIAG); - if (!ls->nl) { - local_sockets_log(ls, "cannot open netlink socket"); + if (ls->nl == NULL) { + local_sockets_log(ls, "cannot open libmnl netlink socket"); ls->use_nl = false; } - - if (mnl_socket_bind(ls->nl, 0, MNL_SOCKET_AUTOPID) < 0) { - local_sockets_log(ls, "cannot bind netlink socket"); + else if (mnl_socket_bind(ls->nl, 0, MNL_SOCKET_AUTOPID) < 0) { + local_sockets_log(ls, "cannot bind libmnl netlink socket"); + mnl_socket_close(ls->nl); + ls->nl = NULL; ls->use_nl = false; } + else + ls->use_nl = true; } -static inline void local_sockets_netlink_cleanup(LS_STATE *ls) { +static inline void local_sockets_libmnl_cleanup(LS_STATE *ls) { if(ls->nl) { mnl_socket_close(ls->nl); ls->nl = NULL; + ls->use_nl = false; } } -static inline int local_sockets_netlink_cb_data(const struct nlmsghdr *nlh, void *data) { +static inline int local_sockets_libmnl_cb_data(const struct nlmsghdr *nlh, void *data) { LS_STATE *ls = data; struct inet_diag_msg *diag_msg = mnl_nlmsg_get_payload(nlh); @@ -666,15 +703,19 @@ static inline int local_sockets_netlink_cb_data(const struct nlmsghdr *nlh, void .inode = diag_msg->idiag_inode, .direction = SOCKET_DIRECTION_NONE, .state = diag_msg->idiag_state, + .ipv6ony = { + .checked = false, + .ipv46 = false, + }, .local = { .protocol = ls->tmp_protocol, .family = diag_msg->idiag_family, - .port = diag_msg->id.idiag_sport, + .port = ntohs(diag_msg->id.idiag_sport), }, .remote = { .protocol = ls->tmp_protocol, .family = diag_msg->idiag_family, - .port = diag_msg->id.idiag_dport, + .port = ntohs(diag_msg->id.idiag_dport), }, .timer = diag_msg->idiag_timer, .retransmits = diag_msg->idiag_retrans, @@ -693,12 +734,37 @@ static inline int local_sockets_netlink_cb_data(const struct nlmsghdr *nlh, void memcpy(&n.remote.ip.ipv6, diag_msg->id.idiag_dst, sizeof(n.remote.ip.ipv6)); } + struct rtattr *attr = (struct rtattr *)(diag_msg + 1); + int rtattrlen = nlh->nlmsg_len - NLMSG_LENGTH(sizeof(*diag_msg)); + for (; !n.ipv6ony.checked && RTA_OK(attr, rtattrlen); attr = RTA_NEXT(attr, rtattrlen)) { + switch (attr->rta_type) { + case INET_DIAG_INFO: { + if(ls->tmp_protocol == IPPROTO_TCP) { + struct tcp_info *info = (struct tcp_info *)RTA_DATA(attr); + n.info.tcp = *info; + ls->stats.tcp_info_received++; + } + } + break; + + case INET_DIAG_SKV6ONLY: { + n.ipv6ony.checked = true; + int ipv6only = *(int *)RTA_DATA(attr); + n.ipv6ony.ipv46 = !ipv6only; + } + break; + + default: + break; + } + } + local_sockets_add_socket(ls, &n); return MNL_CB_OK; } -static inline bool local_sockets_netlink_get_sockets(LS_STATE *ls, uint16_t family, uint16_t protocol) { +static inline bool local_sockets_libmnl_get_sockets(LS_STATE *ls, uint16_t family, uint16_t protocol) { ls->tmp_protocol = protocol; char buf[MNL_SOCKET_BUFFER_SIZE]; @@ -710,14 +776,22 @@ static inline bool local_sockets_netlink_get_sockets(LS_STATE *ls, uint16_t fami req.sdiag_family = family; req.sdiag_protocol = protocol; req.idiag_states = -1; + req.idiag_ext = 0; + + if(family == AF_INET6) + req.idiag_ext |= 1 << (INET_DIAG_SKV6ONLY - 1); + + if(protocol == IPPROTO_TCP && ls->config.tcp_info) + req.idiag_ext |= 1 << (INET_DIAG_INFO - 1); nlh = mnl_nlmsg_put_header(buf); nlh->nlmsg_type = SOCK_DIAG_BY_FAMILY; - nlh->nlmsg_flags = NLM_F_DUMP | NLM_F_REQUEST; + nlh->nlmsg_flags = NLM_F_ROOT | NLM_F_MATCH | NLM_F_REQUEST; nlh->nlmsg_seq = seq = time(NULL); mnl_nlmsg_put_extra_header(nlh, sizeof(req)); memcpy(mnl_nlmsg_get_payload(nlh), &req, sizeof(req)); + ls->stats.mnl_sends++; if (mnl_socket_sendto(ls->nl, nlh, nlh->nlmsg_len) < 0) { local_sockets_log(ls, "mnl_socket_send failed"); return false; @@ -725,7 +799,7 @@ static inline bool local_sockets_netlink_get_sockets(LS_STATE *ls, uint16_t fami ssize_t ret; while ((ret = mnl_socket_recvfrom(ls->nl, buf, sizeof(buf))) > 0) { - ret = mnl_cb_run(buf, ret, seq, portid, local_sockets_netlink_cb_data, ls); + ret = mnl_cb_run(buf, ret, seq, portid, local_sockets_libmnl_cb_data, ls); if (ret <= MNL_CB_STOP) break; } @@ -774,6 +848,10 @@ static inline bool local_sockets_read_proc_net_x(LS_STATE *ls, const char *filen LOCAL_SOCKET n = { .direction = SOCKET_DIRECTION_NONE, + .ipv6ony = { + .checked = false, + .ipv46 = false, + }, .local = { .family = family, .protocol = protocol, @@ -904,6 +982,10 @@ static inline void local_sockets_detect_directions(LS_STATE *ls) { // -------------------------------------------------------------------------------------------------------------------- static inline void local_sockets_init(LS_STATE *ls) { + ls->config.host_prefix = netdata_configured_host_prefix; + + spinlock_init(&ls->spinlock); + simple_hashtable_init_NET_NS(&ls->ns_hashtable, 1024); simple_hashtable_init_PID_SOCKET(&ls->pid_sockets_hashtable, 65535); simple_hashtable_init_LOCAL_SOCKET(&ls->sockets_hashtable, 65535); @@ -923,9 +1005,36 @@ static inline void local_sockets_init(LS_STATE *ls) { 65536, 65536, NULL, NULL, NULL, false, true); + + memset(&ls->stats, 0, sizeof(ls->stats)); + +#ifdef HAVE_LIBMNL + ls->use_nl = false; + ls->nl = NULL; + ls->tmp_protocol = 0; + local_sockets_libmnl_init(ls); +#endif + + if(ls->config.namespaces && ls->spawn_server == NULL) { + ls->spawn_server = spawn_server_create(SPAWN_SERVER_OPTION_CALLBACK, NULL, local_sockets_spawn_server_callback, 0, NULL); + ls->spawn_server_is_mine = true; + } + else + ls->spawn_server_is_mine = false; } static inline void local_sockets_cleanup(LS_STATE *ls) { + + if(ls->spawn_server_is_mine) { + spawn_server_destroy(ls->spawn_server); + ls->spawn_server = NULL; + ls->spawn_server_is_mine = false; + } + +#ifdef HAVE_LIBMNL + local_sockets_libmnl_cleanup(ls); +#endif + // free the sockets hashtable data for(SIMPLE_HASHTABLE_SLOT_LOCAL_SOCKET *sl = simple_hashtable_first_read_only_LOCAL_SOCKET(&ls->sockets_hashtable); sl; @@ -963,8 +1072,8 @@ static inline void local_sockets_cleanup(LS_STATE *ls) { static inline void local_sockets_do_family_protocol(LS_STATE *ls, const char *filename, uint16_t family, uint16_t protocol) { #ifdef HAVE_LIBMNL - if(ls->use_nl) { - ls->use_nl = local_sockets_netlink_get_sockets(ls, family, protocol); + if(ls->nl && ls->use_nl) { + ls->use_nl = local_sockets_libmnl_get_sockets(ls, family, protocol); if(ls->use_nl) return; @@ -974,7 +1083,7 @@ static inline void local_sockets_do_family_protocol(LS_STATE *ls, const char *fi local_sockets_read_proc_net_x(ls, filename, family, protocol); } -static inline void local_sockets_read_sockets_from_proc(LS_STATE *ls) { +static inline void local_sockets_read_all_system_sockets(LS_STATE *ls) { char path[FILENAME_MAX + 1]; if(ls->config.namespaces) { @@ -1036,7 +1145,52 @@ static inline void local_sockets_send_to_parent(struct local_socket_state *ls __ local_sockets_log(ls, "failed to write cmdline to pipe"); } -static inline bool local_sockets_get_namespace_sockets(LS_STATE *ls, struct pid_socket *ps, pid_t *pid) { +static inline void local_sockets_spawn_server_callback(SPAWN_REQUEST *request) { + LS_STATE ls = { 0 }; + ls.config = *((struct local_sockets_config *)request->data); + + // we don't need these inside namespaces + ls.config.cmdline = false; + ls.config.comm = false; + ls.config.pid = false; + ls.config.namespaces = false; + + // initialize local sockets + local_sockets_init(&ls); + + ls.config.host_prefix = ""; // we need the /proc of the container + + struct local_sockets_child_work cw = { + .net_ns_inode = ls.proc_self_net_ns_inode, + .fd = request->fds[1], // stdout + }; + + ls.config.cb = local_sockets_send_to_parent; + ls.config.data = &cw; + ls.proc_self_net_ns_inode = ls.config.net_ns_inode; + + // switch namespace using the custom fd passed via the spawn server + if (setns(request->fds[3], CLONE_NEWNET) == -1) { + local_sockets_log(&ls, "failed to switch network namespace at child process using fd %d", request->fds[3]); + exit(EXIT_FAILURE); + } + + // read all sockets from /proc + local_sockets_read_all_system_sockets(&ls); + + // send all sockets to parent + local_sockets_foreach_local_socket_call_cb(&ls); + + // send the terminating socket + struct local_socket zero = { + .net_ns_inode = ls.config.net_ns_inode, + }; + local_sockets_send_to_parent(&ls, &zero, &cw); + + exit(EXIT_SUCCESS); +} + +static inline bool local_sockets_get_namespace_sockets_with_pid(LS_STATE *ls, struct pid_socket *ps) { char filename[1024]; snprintfz(filename, sizeof(filename), "%s/proc/%d/ns/net", ls->config.host_prefix, ps->pid); @@ -1060,80 +1214,32 @@ static inline bool local_sockets_get_namespace_sockets(LS_STATE *ls, struct pid_ return false; } - int pipefd[2]; - if (pipe(pipefd) != 0) { - local_sockets_log(ls, "cannot create pipe"); + if(ls->spawn_server == NULL) { close(fd); + local_sockets_log(ls, "spawn server is not available"); return false; } - *pid = fork(); - if (*pid == 0) { - // Child process - close(pipefd[0]); - - // local_sockets_log(ls, "child is here for inode %"PRIu64" and namespace %"PRIu64, ps->inode, ps->net_ns_inode); - - struct local_sockets_child_work cw = { - .net_ns_inode = ps->net_ns_inode, - .fd = pipefd[1], - }; - - ls->config.host_prefix = ""; // we need the /proc of the container - ls->config.cb = local_sockets_send_to_parent; - ls->config.data = &cw; - ls->config.cmdline = false; // we have these already - ls->config.comm = false; // we have these already - ls->config.pid = false; // we have these already - ls->config.namespaces = false; - ls->proc_self_net_ns_inode = ps->net_ns_inode; - - - // switch namespace - if (setns(fd, CLONE_NEWNET) == -1) { - local_sockets_log(ls, "failed to switch network namespace at child process"); - exit(EXIT_FAILURE); - } - -#ifdef HAVE_LIBMNL - local_sockets_netlink_cleanup(ls); - local_sockets_netlink_init(ls); -#endif - - // read all sockets from /proc - local_sockets_read_sockets_from_proc(ls); - - // send all sockets to parent - local_sockets_foreach_local_socket_call_cb(ls); + struct local_sockets_config config = ls->config; + config.net_ns_inode = ps->net_ns_inode; + SPAWN_INSTANCE *si = spawn_server_exec(ls->spawn_server, STDERR_FILENO, fd, NULL, &config, sizeof(config), SPAWN_INSTANCE_TYPE_CALLBACK); + close(fd); fd = -1; - // send the terminating socket - struct local_socket zero = { - .net_ns_inode = ps->net_ns_inode, - }; - local_sockets_send_to_parent(ls, &zero, &cw); - -#ifdef HAVE_LIBMNL - local_sockets_netlink_cleanup(ls); -#endif - - close(pipefd[1]); // Close write end of pipe - exit(EXIT_SUCCESS); + if(si == NULL) { + local_sockets_log(ls, "cannot create spawn instance"); + return false; } - // parent - - close(fd); - close(pipefd[1]); size_t received = 0; struct local_socket buf; - while(read(pipefd[0], &buf, sizeof(buf)) == sizeof(buf)) { + while(read(spawn_server_instance_read_fd(si), &buf, sizeof(buf)) == sizeof(buf)) { size_t len = 0; - if(read(pipefd[0], &len, sizeof(len)) != sizeof(len)) + if(read(spawn_server_instance_read_fd(si), &len, sizeof(len)) != sizeof(len)) local_sockets_log(ls, "failed to read cmdline length from pipe"); if(len) { char cmdline[len + 1]; - if(read(pipefd[0], cmdline, len) != (ssize_t)len) + if(read(spawn_server_instance_read_fd(si), cmdline, len) != (ssize_t)len) local_sockets_log(ls, "failed to read cmdline from pipe"); else { cmdline[len] = '\0'; @@ -1153,15 +1259,15 @@ static inline bool local_sockets_get_namespace_sockets(LS_STATE *ls, struct pid_ break; } + spinlock_lock(&ls->spinlock); + SIMPLE_HASHTABLE_SLOT_LOCAL_SOCKET *sl = simple_hashtable_get_slot_LOCAL_SOCKET(&ls->sockets_hashtable, buf.inode, &buf, true); LOCAL_SOCKET *n = SIMPLE_HASHTABLE_SLOT_DATA(sl); if(n) { string_freez(buf.cmdline); - // local_sockets_log(ls, // "ns inode %" PRIu64" (comm: '%s', pid: %u, ns: %"PRIu64") already exists in hashtable (comm: '%s', pid: %u, ns: %"PRIu64") - ignoring duplicate", // buf.inode, buf.comm, buf.pid, buf.net_ns_inode, n->comm, n->pid, n->net_ns_inode); - continue; } else { n = aral_mallocz(ls->local_socket_aral); @@ -1170,75 +1276,109 @@ static inline bool local_sockets_get_namespace_sockets(LS_STATE *ls, struct pid_ local_sockets_index_listening_port(ls, n); } - } - close(pipefd[0]); + spinlock_unlock(&ls->spinlock); + } + spawn_server_exec_kill(ls->spawn_server, si); return received > 0; } -static inline void local_socket_waitpid(LS_STATE *ls, pid_t pid) { - if(!pid) return; +struct local_sockets_namespace_worker { + LS_STATE *ls; + uint64_t inode; +}; + +static inline void *local_sockets_get_namespace_sockets(void *arg) { + struct local_sockets_namespace_worker *data = arg; + LS_STATE *ls = data->ls; + const uint64_t inode = data->inode; + + spinlock_lock(&ls->spinlock); + + // find a pid_socket that has this namespace + for(SIMPLE_HASHTABLE_SLOT_PID_SOCKET *sl_pid = simple_hashtable_first_read_only_PID_SOCKET(&ls->pid_sockets_hashtable) ; + sl_pid ; + sl_pid = simple_hashtable_next_read_only_PID_SOCKET(&ls->pid_sockets_hashtable, sl_pid)) { + struct pid_socket *ps = SIMPLE_HASHTABLE_SLOT_DATA(sl_pid); + if(!ps || ps->net_ns_inode != inode) continue; - int status; - waitpid(pid, &status, 0); + // now we have a pid that has the same namespace inode - if (WIFEXITED(status) && WEXITSTATUS(status) != 0) - local_sockets_log(ls, "Child exited with status %d", WEXITSTATUS(status)); - else if (WIFSIGNALED(status)) - local_sockets_log(ls, "Child terminated by signal %d", WTERMSIG(status)); + spinlock_unlock(&ls->spinlock); + const bool worked = local_sockets_get_namespace_sockets_with_pid(ls, ps); + spinlock_lock(&ls->spinlock); + + if(worked) + break; + } + + spinlock_unlock(&ls->spinlock); + + return NULL; } static inline void local_sockets_namespaces(LS_STATE *ls) { - pid_t children[5] = { 0 }; - size_t last_child = 0; + size_t threads = ls->config.max_concurrent_namespaces; + if(threads == 0) threads = 5; + if(threads > 100) threads = 100; + + size_t last_thread = 0; + ND_THREAD *workers[threads]; + struct local_sockets_namespace_worker workers_data[threads]; + memset(workers, 0, sizeof(workers)); + memset(workers_data, 0, sizeof(workers_data)); + + spinlock_lock(&ls->spinlock); for(SIMPLE_HASHTABLE_SLOT_NET_NS *sl = simple_hashtable_first_read_only_NET_NS(&ls->ns_hashtable); sl; sl = simple_hashtable_next_read_only_NET_NS(&ls->ns_hashtable, sl)) { - uint64_t inode = (uint64_t)SIMPLE_HASHTABLE_SLOT_DATA(sl); + const uint64_t inode = (uint64_t)SIMPLE_HASHTABLE_SLOT_DATA(sl); if(inode == ls->proc_self_net_ns_inode) continue; - // find a pid_socket that has this namespace - for(SIMPLE_HASHTABLE_SLOT_PID_SOCKET *sl_pid = simple_hashtable_first_read_only_PID_SOCKET(&ls->pid_sockets_hashtable) ; - sl_pid ; - sl_pid = simple_hashtable_next_read_only_PID_SOCKET(&ls->pid_sockets_hashtable, sl_pid)) { - struct pid_socket *ps = SIMPLE_HASHTABLE_SLOT_DATA(sl_pid); - if(!ps || ps->net_ns_inode != inode) continue; + spinlock_unlock(&ls->spinlock); - if(++last_child >= 5) - last_child = 0; + ls->stats.namespaces_found++; - local_socket_waitpid(ls, children[last_child]); - children[last_child] = 0; + if(workers[last_thread] != NULL) { + if(++last_thread >= threads) + last_thread = 0; - // now we have a pid that has the same namespace inode - if(local_sockets_get_namespace_sockets(ls, ps, &children[last_child])) - break; + if(workers[last_thread]) { + nd_thread_join(workers[last_thread]); + workers[last_thread] = NULL; + } } + + workers_data[last_thread].ls = ls; + workers_data[last_thread].inode = inode; + workers[last_thread] = nd_thread_create( + "local-sockets-worker", NETDATA_THREAD_OPTION_JOINABLE, + local_sockets_get_namespace_sockets, &workers_data[last_thread]); + + spinlock_lock(&ls->spinlock); } - for(size_t i = 0; i < 5 ;i++) - local_socket_waitpid(ls, children[i]); + spinlock_unlock(&ls->spinlock); + + // wait all the threads running + for(size_t i = 0; i < threads ;i++) { + if(workers[i]) + nd_thread_join(workers[i]); + } } // -------------------------------------------------------------------------------------------------------------------- static inline void local_sockets_process(LS_STATE *ls) { - -#ifdef HAVE_LIBMNL - local_sockets_netlink_init(ls); -#endif - - ls->config.host_prefix = netdata_configured_host_prefix; - // initialize our hashtables local_sockets_init(ls); // read all sockets from /proc - local_sockets_read_sockets_from_proc(ls); + local_sockets_read_all_system_sockets(ls); // check all socket namespaces if(ls->config.namespaces) @@ -1253,10 +1393,6 @@ static inline void local_sockets_process(LS_STATE *ls) { // free all memory local_sockets_cleanup(ls); - -#ifdef HAVE_LIBMNL - local_sockets_netlink_cleanup(ls); -#endif } static inline void ipv6_address_to_txt(struct in6_addr *in6_addr, char *dst) { diff --git a/src/libnetdata/maps/system-services.h b/src/libnetdata/maps/system-services.h new file mode 100644 index 000000000..123f4f10b --- /dev/null +++ b/src/libnetdata/maps/system-services.h @@ -0,0 +1,92 @@ +// SPDX-License-Identifier: GPL-3.0-or-later + +#ifndef NETDATA_SYSTEM_SERVICES_H +#define NETDATA_SYSTEM_SERVICES_H + +#include "libnetdata/libnetdata.h" +#include <netdb.h> + +// -------------------------------------------------------------------------------------------------------------------- +// hashtable for caching port and protocol to service name mappings +// key is the combination of protocol and port packed into a uint64_t, value is service name (STRING) + +#define SIMPLE_HASHTABLE_VALUE_TYPE STRING +#define SIMPLE_HASHTABLE_NAME _SERVICENAMES_CACHE +#include "libnetdata/simple_hashtable.h" + +typedef struct servicenames_cache { + SPINLOCK spinlock; + SIMPLE_HASHTABLE_SERVICENAMES_CACHE ht; +} SERVICENAMES_CACHE; + +static inline uint64_t system_servicenames_key(uint16_t port, uint16_t ipproto) { + return ((uint64_t)ipproto << 16) | (uint64_t)port; +} + +static inline const char *system_servicenames_ipproto2str(uint16_t ipproto) { + return (ipproto == IPPROTO_TCP) ? "tcp" : "udp"; +} + +static inline const char *static_portnames(uint16_t port, uint16_t ipproto) { + if(port == 19999 && ipproto == IPPROTO_TCP) + return "netdata"; + + if(port == 8125) + return "statsd"; + + return NULL; +} + +static inline STRING *system_servicenames_cache_lookup(SERVICENAMES_CACHE *sc, uint16_t port, uint16_t ipproto) { + uint64_t key = system_servicenames_key(port, ipproto); + spinlock_lock(&sc->spinlock); + + SIMPLE_HASHTABLE_SLOT_SERVICENAMES_CACHE *sl = simple_hashtable_get_slot_SERVICENAMES_CACHE(&sc->ht, key, &key, true); + STRING *s = SIMPLE_HASHTABLE_SLOT_DATA(sl); + if (!s) { + const char *st = static_portnames(port, ipproto); + if(st) { + s = string_strdupz(st); + } + else { + struct servent *se = getservbyport(htons(port), system_servicenames_ipproto2str(ipproto)); + + if (!se || !se->s_name) { + char name[50]; + snprintfz(name, sizeof(name), "%u/%s", port, system_servicenames_ipproto2str(ipproto)); + s = string_strdupz(name); + } + else + s = string_strdupz(se->s_name); + } + + simple_hashtable_set_slot_SERVICENAMES_CACHE(&sc->ht, sl, key, s); + } + + s = string_dup(s); + spinlock_unlock(&sc->spinlock); + return s; +} + +static inline SERVICENAMES_CACHE *system_servicenames_cache_init(void) { + SERVICENAMES_CACHE *sc = callocz(1, sizeof(*sc)); + spinlock_init(&sc->spinlock); + simple_hashtable_init_SERVICENAMES_CACHE(&sc->ht, 100); + return sc; +} + +static inline void system_servicenames_cache_destroy(SERVICENAMES_CACHE *sc) { + spinlock_lock(&sc->spinlock); + + for (SIMPLE_HASHTABLE_SLOT_SERVICENAMES_CACHE *sl = simple_hashtable_first_read_only_SERVICENAMES_CACHE(&sc->ht); + sl; + sl = simple_hashtable_next_read_only_SERVICENAMES_CACHE(&sc->ht, sl)) { + STRING *s = SIMPLE_HASHTABLE_SLOT_DATA(sl); + string_freez(s); + } + + simple_hashtable_destroy_SERVICENAMES_CACHE(&sc->ht); + freez(sc); +} + +#endif //NETDATA_SYSTEM_SERVICES_H diff --git a/src/libnetdata/os/close_range.c b/src/libnetdata/os/close_range.c new file mode 100644 index 000000000..56d5c2527 --- /dev/null +++ b/src/libnetdata/os/close_range.c @@ -0,0 +1,98 @@ +// SPDX-License-Identifier: GPL-3.0-or-later + +#include "../libnetdata.h" + +static int fd_is_valid(int fd) { + errno_clear(); + return fcntl(fd, F_GETFD) != -1 || errno != EBADF; +} + +int os_get_fd_open_max(void) { + static int fd_open_max = CLOSE_RANGE_FD_MAX; + + if(fd_open_max != CLOSE_RANGE_FD_MAX) + return fd_open_max; + + if(fd_open_max == CLOSE_RANGE_FD_MAX || fd_open_max == -1) { + struct rlimit rl; + if (getrlimit(RLIMIT_NOFILE, &rl) == 0 && rl.rlim_max != RLIM_INFINITY) + fd_open_max = rl.rlim_max; + } + +#ifdef _SC_OPEN_MAX + if(fd_open_max == CLOSE_RANGE_FD_MAX || fd_open_max == -1) { + fd_open_max = sysconf(_SC_OPEN_MAX); + } +#endif + + if(fd_open_max == CLOSE_RANGE_FD_MAX || fd_open_max == -1) { + // Arbitrary default if everything else fails + fd_open_max = 65535; + } + + return fd_open_max; +} + +void os_close_range(int first, int last) { +#if defined(HAVE_CLOSE_RANGE) + if(close_range(first, last, 0) == 0) return; +#endif + +#if defined(OS_LINUX) + DIR *dir = opendir("/proc/self/fd"); + if (dir != NULL) { + struct dirent *entry; + while ((entry = readdir(dir)) != NULL) { + int fd = str2i(entry->d_name); + if (fd >= first && (last == CLOSE_RANGE_FD_MAX || fd <= last) && fd_is_valid(fd)) + (void)close(fd); + } + closedir(dir); + return; + } +#endif + + // Fallback to looping through all file descriptors if necessary + if (last == CLOSE_RANGE_FD_MAX) + last = os_get_fd_open_max(); + + for (int fd = first; fd <= last; fd++) { + if (fd_is_valid(fd)) (void)close(fd); + } +} + +static int compare_ints(const void *a, const void *b) { + int int_a = *((int*)a); + int int_b = *((int*)b); + return (int_a > int_b) - (int_a < int_b); +} + +void os_close_all_non_std_open_fds_except(const int fds[], size_t fds_num) { + if (fds_num == 0 || fds == NULL) { + os_close_range(STDERR_FILENO + 1, CLOSE_RANGE_FD_MAX); + return; + } + + // copy the fds array to ensure we will not alter them + int fds_copy[fds_num]; + memcpy(fds_copy, fds, sizeof(fds_copy)); + + qsort(fds_copy, fds_num, sizeof(int), compare_ints); + + int start = STDERR_FILENO + 1; + size_t i = 0; + + // filter out all fds with a number smaller than our start + for (; i < fds_num; i++) + if(fds_copy[i] >= start) break; + + // call os_close_range() as many times as needed + for (; i < fds_num; i++) { + if (fds_copy[i] > start) + os_close_range(start, fds_copy[i] - 1); + + start = fds_copy[i] + 1; + } + + os_close_range(start, CLOSE_RANGE_FD_MAX); +} diff --git a/src/libnetdata/os/close_range.h b/src/libnetdata/os/close_range.h new file mode 100644 index 000000000..e3cb93798 --- /dev/null +++ b/src/libnetdata/os/close_range.h @@ -0,0 +1,12 @@ +// SPDX-License-Identifier: GPL-3.0-or-later + +#ifndef CLOSE_RANGE_H +#define CLOSE_RANGE_H + +#define CLOSE_RANGE_FD_MAX (int)(~0U) + +int os_get_fd_open_max(void); +void os_close_range(int first, int last); +void os_close_all_non_std_open_fds_except(const int fds[], size_t fds_num); + +#endif //CLOSE_RANGE_H diff --git a/src/libnetdata/os/get_pid_max.c b/src/libnetdata/os/get_pid_max.c index 45027961a..70372a743 100644 --- a/src/libnetdata/os/get_pid_max.c +++ b/src/libnetdata/os/get_pid_max.c @@ -2,13 +2,27 @@ #include "../libnetdata.h" -pid_t pid_max = 32768; +pid_t pid_max = 4194304; + pid_t os_get_system_pid_max(void) { + static bool read = false; + if(read) return pid_max; + read = true; + #if defined(OS_MACOS) + int mib[2]; + int maxproc; + size_t len = sizeof(maxproc); + + mib[0] = CTL_KERN; + mib[1] = KERN_MAXPROC; + + if (sysctl(mib, 2, &maxproc, &len, NULL, 0) == -1) { + pid_max = 99999; // Fallback value + nd_log(NDLS_DAEMON, NDLP_ERR, "Cannot find system max pid. Assuming %d.", pid_max); + } + else pid_max = (pid_t)maxproc; - // As we currently do not know a solution to query pid_max from the os - // we use the number defined in bsd/sys/proc_internal.h in XNU sources - pid_max = 99999; return pid_max; #elif defined(OS_FREEBSD) @@ -17,41 +31,40 @@ pid_t os_get_system_pid_max(void) { if (unlikely(GETSYSCTL_BY_NAME("kern.pid_max", tmp_pid_max))) { pid_max = 99999; - netdata_log_error("Assuming system's maximum pid is %d.", pid_max); - } else { - pid_max = tmp_pid_max; + nd_log(NDLS_DAEMON, NDLP_ERR, "Cannot get system max pid. Assuming %d.", pid_max); } + else + pid_max = tmp_pid_max; return pid_max; #elif defined(OS_LINUX) - static char read = 0; - if(unlikely(read)) return pid_max; - read = 1; - char filename[FILENAME_MAX + 1]; snprintfz(filename, FILENAME_MAX, "%s/proc/sys/kernel/pid_max", netdata_configured_host_prefix?netdata_configured_host_prefix:""); unsigned long long max = 0; if(read_single_number_file(filename, &max) != 0) { - netdata_log_error("Cannot open file '%s'. Assuming system supports %d pids.", filename, pid_max); + nd_log(NDLS_DAEMON, NDLP_ERR, "Cannot open file '%s'. Assuming system supports %d pids.", filename, pid_max); return pid_max; } if(!max) { - netdata_log_error("Cannot parse file '%s'. Assuming system supports %d pids.", filename, pid_max); + nd_log(NDLS_DAEMON, NDLP_ERR, "Cannot parse file '%s'. Assuming system supports %d pids.", filename, pid_max); return pid_max; } pid_max = (pid_t) max; return pid_max; -#else +#elif defined(OS_WINDOWS) - // just a big default + pid_max = (pid_t)0x7FFFFFFF; + return pid_max; + +#else - pid_max = 4194304; + // return the default return pid_max; #endif diff --git a/src/libnetdata/os/os-windows-wrappers.c b/src/libnetdata/os/os-windows-wrappers.c new file mode 100644 index 000000000..64076eae2 --- /dev/null +++ b/src/libnetdata/os/os-windows-wrappers.c @@ -0,0 +1,61 @@ +// SPDX-License-Identifier: GPL-3.0-or-later + +#include "../libnetdata.h" + +#if defined(OS_WINDOWS) +#include <windows.h> + +long netdata_registry_get_dword_from_open_key(unsigned int *out, void *lKey, char *name) +{ + DWORD length = 260; + return RegQueryValueEx(lKey, name, NULL, NULL, (LPBYTE) out, &length); +} + +bool netdata_registry_get_dword(unsigned int *out, void *hKey, char *subKey, char *name) +{ + HKEY lKey; + bool status = true; + long ret = RegOpenKeyEx(hKey, + subKey, + 0, + KEY_READ, + &lKey); + if (ret != ERROR_SUCCESS) + return false; + + ret = netdata_registry_get_dword_from_open_key(out, lKey, name); + if (ret != ERROR_SUCCESS) + status = false; + + RegCloseKey(lKey); + + return status; +} + +long netdata_registry_get_string_from_open_key(char *out, unsigned int length, void *lKey, char *name) +{ + return RegQueryValueEx(lKey, name, NULL, NULL, (LPBYTE) out, &length); +} + +bool netdata_registry_get_string(char *out, unsigned int length, void *hKey, char *subKey, char *name) +{ + HKEY lKey; + bool status = true; + long ret = RegOpenKeyEx(hKey, + subKey, + 0, + KEY_READ, + &lKey); + if (ret != ERROR_SUCCESS) + return false; + + ret = netdata_registry_get_string_from_open_key(out, length, lKey, name); + if (ret != ERROR_SUCCESS) + status = false; + + RegCloseKey(lKey); + + return status; +} + +#endif diff --git a/src/libnetdata/os/os-windows-wrappers.h b/src/libnetdata/os/os-windows-wrappers.h new file mode 100644 index 000000000..5ae73043a --- /dev/null +++ b/src/libnetdata/os/os-windows-wrappers.h @@ -0,0 +1,18 @@ +// SPDX-License-Identifier: GPL-3.0-or-later + +#ifndef NETDATA_OS_WINDOWS_WRAPPERS_H +#define NETDATA_OS_WINDOWS_WRAPPERS_H + +#include "../libnetdata.h" + +#if defined(OS_WINDOWS) +#define NETDATA_WIN_DETECTION_METHOD "Windows API/Registry" + +long netdata_registry_get_dword_from_open_key(unsigned int *out, void *lKey, char *name); +bool netdata_registry_get_dword(unsigned int *out, void *hKey, char *subKey, char *name); + +long netdata_registry_get_string_from_open_key(char *out, unsigned int length, void *lKey, char *name); +bool netdata_registry_get_string(char *out, unsigned int length, void *hKey, char *subKey, char *name); + +#endif // OS_WINDOWS +#endif //NETDATA_OS_WINDOWS_WRAPPERS_H diff --git a/src/libnetdata/os/os.h b/src/libnetdata/os/os.h index 350096159..15e74faa7 100644 --- a/src/libnetdata/os/os.h +++ b/src/libnetdata/os/os.h @@ -7,12 +7,13 @@ #include <sys/syscall.h> #endif +#include "setproctitle.h" +#include "close_range.h" #include "setresuid.h" #include "setresgid.h" #include "getgrouplist.h" #include "adjtimex.h" #include "gettid.h" -#include "waitid.h" #include "get_pid_max.h" #include "get_system_cpus.h" #include "tinysleep.h" @@ -20,6 +21,7 @@ #include "setenv.h" #include "os-freebsd-wrappers.h" #include "os-macos-wrappers.h" +#include "os-windows-wrappers.h" // ===================================================================================================================== // common defs for Apple/FreeBSD/Linux diff --git a/src/libnetdata/os/setproctitle.c b/src/libnetdata/os/setproctitle.c new file mode 100644 index 000000000..d93158202 --- /dev/null +++ b/src/libnetdata/os/setproctitle.c @@ -0,0 +1,31 @@ +// SPDX-License-Identifier: GPL-3.0-or-later + +#include "../libnetdata.h" +#include "setproctitle.h" + +void os_setproctitle(const char *new_name, const int argc, const char **argv) { +#ifdef HAVE_SYS_PRCTL_H + // Set the process name (comm) + prctl(PR_SET_NAME, new_name, 0, 0, 0); +#endif + +#ifdef __FreeBSD__ + // Set the process name on FreeBSD + setproctitle("%s", new_name); +#endif + + if(argc && argv) { + // replace with spaces all parameters found (except argv[0]) + for(int i = 1; i < argc ;i++) { + char *s = (char *)&argv[i][0]; + while(*s != '\0') *s++ = ' '; + } + + // overwrite argv[0] + size_t len = strlen(new_name); + const size_t argv0_len = strlen(argv[0]); + strncpyz((char *)argv[0], new_name, MIN(len, argv0_len)); + while(len < argv0_len) + ((char *)argv[0])[len++] = ' '; + } +} diff --git a/src/libnetdata/os/setproctitle.h b/src/libnetdata/os/setproctitle.h new file mode 100644 index 000000000..0e7211b26 --- /dev/null +++ b/src/libnetdata/os/setproctitle.h @@ -0,0 +1,8 @@ +// SPDX-License-Identifier: GPL-3.0-or-later + +#ifndef SETPROCTITLE_H +#define SETPROCTITLE_H + +void os_setproctitle(const char *new_name, int argc, const char **argv); + +#endif //SETPROCTITLE_H diff --git a/src/libnetdata/os/waitid.c b/src/libnetdata/os/waitid.c deleted file mode 100644 index b78d704ed..000000000 --- a/src/libnetdata/os/waitid.c +++ /dev/null @@ -1,72 +0,0 @@ -// SPDX-License-Identifier: GPL-3.0-or-later - -#include "../libnetdata.h" - -int os_waitid(idtype_t idtype, id_t id, siginfo_t *infop, int options) { -#if defined(HAVE_WAITID) - return waitid(idtype, id, infop, options); -#else - // emulate waitid() using waitpid() - - // a cache for WNOWAIT - static const struct pid_status empty = { 0, 0 }; - static __thread struct pid_status last = { 0, 0 }; // the cache - struct pid_status current = { 0, 0 }; - - // zero the infop structure - memset(infop, 0, sizeof(*infop)); - - // from the infop structure we use only 3 fields: - // - si_pid - // - si_code - // - si_status - // so, we update only these 3 - - switch(idtype) { - case P_ALL: - current.pid = waitpid((pid_t)-1, ¤t.status, options); - if(options & WNOWAIT) - last = current; - else - last = empty; - break; - - case P_PID: - if(last.pid == (pid_t)id) { - current = last; - last = empty; - } - else - current.pid = waitpid((pid_t)id, ¤t.status, options); - - break; - - default: - errno = ENOSYS; - return -1; - } - - if (current.pid > 0) { - if (WIFEXITED(current.status)) { - infop->si_code = CLD_EXITED; - infop->si_status = WEXITSTATUS(current.status); - } else if (WIFSIGNALED(current.status)) { - infop->si_code = WTERMSIG(current.status) == SIGABRT ? CLD_DUMPED : CLD_KILLED; - infop->si_status = WTERMSIG(current.status); - } else if (WIFSTOPPED(current.status)) { - infop->si_code = CLD_STOPPED; - infop->si_status = WSTOPSIG(current.status); - } else if (WIFCONTINUED(current.status)) { - infop->si_code = CLD_CONTINUED; - infop->si_status = SIGCONT; - } - infop->si_pid = current.pid; - return 0; - } else if (current.pid == 0) { - // No change in state, depends on WNOHANG - return 0; - } - - return -1; -#endif -} diff --git a/src/libnetdata/os/waitid.h b/src/libnetdata/os/waitid.h deleted file mode 100644 index 9e1fd6be7..000000000 --- a/src/libnetdata/os/waitid.h +++ /dev/null @@ -1,48 +0,0 @@ -// SPDX-License-Identifier: GPL-3.0-or-later - -#ifndef NETDATA_WAITID_H -#define NETDATA_WAITID_H - -#include "config.h" -#include <sys/types.h> -#include <signal.h> - -#ifdef HAVE_SYS_WAIT_H -#include <sys/wait.h> -#endif - -#ifndef WNOWAIT -#define WNOWAIT 0x01000000 -#endif - -#ifndef WEXITED -#define WEXITED 4 -#endif - -#if !defined(HAVE_WAITID) -typedef enum -{ - P_ALL, /* Wait for any child. */ - P_PID, /* Wait for specified process. */ - P_PGID, /* Wait for members of process group. */ - P_PIDFD, /* Wait for the child referred by the PID file descriptor. */ -} idtype_t; - -struct pid_status { - pid_t pid; - int status; -}; - -#if defined(OS_WINDOWS) && !defined(__CYGWIN__) -typedef uint32_t id_t; -typedef struct { - int si_code; /* Signal code. */ - int si_status; /* Exit value or signal. */ - pid_t si_pid; /* Sending process ID. */ -} siginfo_t; -#endif -#endif - -int os_waitid(idtype_t idtype, id_t id, siginfo_t *infop, int options); - -#endif //NETDATA_WAITID_H diff --git a/src/libnetdata/popen/README.md b/src/libnetdata/popen/README.md deleted file mode 100644 index ca4877c1a..000000000 --- a/src/libnetdata/popen/README.md +++ /dev/null @@ -1,15 +0,0 @@ -<!-- -title: "popen" -custom_edit_url: https://github.com/netdata/netdata/edit/master/src/libnetdata/popen/README.md -sidebar_label: "popen" -learn_status: "Published" -learn_topic_type: "Tasks" -learn_rel_path: "Developers/libnetdata" ---> - -# popen - -Process management library - - - diff --git a/src/libnetdata/popen/popen.c b/src/libnetdata/popen/popen.c deleted file mode 100644 index c1721e9b4..000000000 --- a/src/libnetdata/popen/popen.c +++ /dev/null @@ -1,446 +0,0 @@ -// SPDX-License-Identifier: GPL-3.0-or-later - -#include "../libnetdata.h" - -// ---------------------------------------------------------------------------- -// popen with tracking - -static pthread_mutex_t netdata_popen_tracking_mutex = NETDATA_MUTEX_INITIALIZER; - -struct netdata_popen { - pid_t pid; - bool reaped; - siginfo_t infop; - int waitid_ret; - struct netdata_popen *next; - struct netdata_popen *prev; -}; - -static struct netdata_popen *netdata_popen_root = NULL; - -// myp_add_lock takes the lock if we're tracking. -static void netdata_popen_tracking_lock(void) { - netdata_mutex_lock(&netdata_popen_tracking_mutex); -} - -// myp_add_unlock release the lock if we're tracking. -static void netdata_popen_tracking_unlock(void) { - netdata_mutex_unlock(&netdata_popen_tracking_mutex); -} - -// myp_add_locked adds pid if we're tracking. -// myp_add_lock must have been called previously. -static void netdata_popen_tracking_add_pid_unsafe(pid_t pid) { - struct netdata_popen *mp; - - mp = callocz(1, sizeof(struct netdata_popen)); - mp->pid = pid; - - DOUBLE_LINKED_LIST_PREPEND_ITEM_UNSAFE(netdata_popen_root, mp, prev, next); -} - -// myp_del deletes pid if we're tracking. -static void netdata_popen_tracking_del_pid(pid_t pid) { - struct netdata_popen *mp; - - netdata_popen_tracking_lock(); - - DOUBLE_LINKED_LIST_FOREACH_FORWARD(netdata_popen_root, mp, prev, next) { - if(unlikely(mp->pid == pid)) - break; - } - - if(mp) { - DOUBLE_LINKED_LIST_REMOVE_ITEM_UNSAFE(netdata_popen_root, mp, prev, next); - freez(mp); - } - else - netdata_log_error("POPEN: Cannot find pid %d.", pid); - - netdata_popen_tracking_unlock(); -} - -// myp_free cleans up any resources allocated for process -// tracking. -void netdata_popen_tracking_cleanup(void) { - netdata_popen_tracking_lock(); - - while(netdata_popen_root) { - struct netdata_popen *mp = netdata_popen_root; - DOUBLE_LINKED_LIST_REMOVE_ITEM_UNSAFE(netdata_popen_root, mp, prev, next); - freez(mp); - } - - netdata_popen_tracking_unlock(); -} - -int netdata_waitid(idtype_t idtype, id_t id, siginfo_t *infop, int options) { - struct netdata_popen *mp = NULL; - - if(idtype == P_PID && id != 0) { - // the caller is asking to waitid() for a specific child pid - - netdata_popen_tracking_lock(); - DOUBLE_LINKED_LIST_FOREACH_FORWARD(netdata_popen_root, mp, prev, next) { - if(unlikely(mp->pid == (pid_t)id)) - break; - } - - if(!mp) - netdata_popen_tracking_unlock(); - } - - int ret; - if(mp && mp->reaped) { - // we have already reaped this child - ret = mp->waitid_ret; - *infop = mp->infop; - } - else { - // we haven't reaped this child yet - ret = os_waitid(idtype, id, infop, options); - - if(mp && !mp->reaped) { - mp->reaped = true; - mp->infop = *infop; - mp->waitid_ret = ret; - } - } - - if(mp) - netdata_popen_tracking_unlock(); - - return ret; -} - -// ---------------------------------------------------------------------------- -// helpers - -static inline void convert_argv_to_string(char *dst, size_t size, const char *spawn_argv[]) { - int i; - for(i = 0; spawn_argv[i] ;i++) { - if(i == 0) snprintfz(dst, size, "%s", spawn_argv[i]); - else { - size_t len = strlen(dst); - snprintfz(&dst[len], size - len, " '%s'", spawn_argv[i]); - } - } -} - -// ---------------------------------------------------------------------------- -// the core of netdata popen - -/* - * Returns -1 on failure, 0 on success. When POPEN_FLAG_CREATE_PIPE is set, on success set the FILE *fp pointer. - */ -#define PIPE_READ 0 -#define PIPE_WRITE 1 - -static int popene_internal(volatile pid_t *pidptr, char **env, uint8_t flags, FILE **fpp_child_stdin, FILE **fpp_child_stdout, const char *command, const char *spawn_argv[]) { - // create a string to be logged about the command we are running - char command_to_be_logged[2048]; - convert_argv_to_string(command_to_be_logged, sizeof(command_to_be_logged), spawn_argv); - // netdata_log_info("custom_popene() running command: %s", command_to_be_logged); - - int ret = 0; // success by default - int attr_rc = 1; // failure by default - - FILE *fp_child_stdin = NULL, *fp_child_stdout = NULL; - int pipefd_stdin[2] = { -1, -1 }; - int pipefd_stdout[2] = { -1, -1 }; - - pid_t pid; - posix_spawnattr_t attr; - posix_spawn_file_actions_t fa; - - unsigned int fds_to_exclude_from_closing = OPEN_FD_EXCLUDE_STDERR; - - if(posix_spawn_file_actions_init(&fa)) { - netdata_log_error("POPEN: posix_spawn_file_actions_init() failed."); - ret = -1; - goto set_return_values_and_return; - } - - if(fpp_child_stdin) { - if (pipe(pipefd_stdin) == -1) { - netdata_log_error("POPEN: stdin pipe() failed"); - ret = -1; - goto cleanup_and_return; - } - - if ((fp_child_stdin = fdopen(pipefd_stdin[PIPE_WRITE], "w")) == NULL) { - netdata_log_error("POPEN: fdopen() stdin failed"); - ret = -1; - goto cleanup_and_return; - } - - if(posix_spawn_file_actions_adddup2(&fa, pipefd_stdin[PIPE_READ], STDIN_FILENO)) { - netdata_log_error("POPEN: posix_spawn_file_actions_adddup2() on stdin failed."); - ret = -1; - goto cleanup_and_return; - } - } - else { - if (posix_spawn_file_actions_addopen(&fa, STDIN_FILENO, "/dev/null", O_RDONLY, 0)) { - netdata_log_error("POPEN: posix_spawn_file_actions_addopen() on stdin to /dev/null failed."); - // this is not a fatal error - fds_to_exclude_from_closing |= OPEN_FD_EXCLUDE_STDIN; - } - } - - if (fpp_child_stdout) { - if (pipe(pipefd_stdout) == -1) { - netdata_log_error("POPEN: stdout pipe() failed"); - ret = -1; - goto cleanup_and_return; - } - - if ((fp_child_stdout = fdopen(pipefd_stdout[PIPE_READ], "r")) == NULL) { - netdata_log_error("POPEN: fdopen() stdout failed"); - ret = -1; - goto cleanup_and_return; - } - - if(posix_spawn_file_actions_adddup2(&fa, pipefd_stdout[PIPE_WRITE], STDOUT_FILENO)) { - netdata_log_error("POPEN: posix_spawn_file_actions_adddup2() on stdout failed."); - ret = -1; - goto cleanup_and_return; - } - } - else { - if (posix_spawn_file_actions_addopen(&fa, STDOUT_FILENO, "/dev/null", O_WRONLY, 0)) { - netdata_log_error("POPEN: posix_spawn_file_actions_addopen() on stdout to /dev/null failed."); - // this is not a fatal error - fds_to_exclude_from_closing |= OPEN_FD_EXCLUDE_STDOUT; - } - } - - if(flags & POPEN_FLAG_CLOSE_FD) { - // Mark all files to be closed by the exec() stage of posix_spawn() - for_each_open_fd(OPEN_FD_ACTION_FD_CLOEXEC, fds_to_exclude_from_closing); - } - - attr_rc = posix_spawnattr_init(&attr); - if(attr_rc) { - // failed - netdata_log_error("POPEN: posix_spawnattr_init() failed."); - } - else { - // success - // reset all signals in the child - - if (posix_spawnattr_setflags(&attr, POSIX_SPAWN_SETSIGMASK | POSIX_SPAWN_SETSIGDEF)) - netdata_log_error("POPEN: posix_spawnattr_setflags() failed."); - - sigset_t mask; - sigemptyset(&mask); - - if (posix_spawnattr_setsigmask(&attr, &mask)) - netdata_log_error("POPEN: posix_spawnattr_setsigmask() failed."); - } - - // Take the lock while we fork to ensure we don't race with SIGCHLD - // delivery on a process which exits quickly. - netdata_popen_tracking_lock(); - if (!posix_spawn(&pid, command, &fa, &attr, (char * const*)spawn_argv, env)) { - // success - *pidptr = pid; - netdata_popen_tracking_add_pid_unsafe(pid); - netdata_popen_tracking_unlock(); - } - else { - // failure - netdata_popen_tracking_unlock(); - netdata_log_error("POPEN: failed to spawn command: \"%s\" from parent pid %d.", command_to_be_logged, getpid()); - ret = -1; - goto cleanup_and_return; - } - - // the normal cleanup will run - // but ret == 0 at this point - -cleanup_and_return: - if(!attr_rc) { - // posix_spawnattr_init() succeeded - if (posix_spawnattr_destroy(&attr)) - netdata_log_error("POPEN: posix_spawnattr_destroy() failed"); - } - - if (posix_spawn_file_actions_destroy(&fa)) - netdata_log_error("POPEN: posix_spawn_file_actions_destroy() failed"); - - // the child end - close it - if(pipefd_stdin[PIPE_READ] != -1) - close(pipefd_stdin[PIPE_READ]); - - // our end - if(ret == -1 || !fpp_child_stdin) { - if (fp_child_stdin) - fclose(fp_child_stdin); - else if (pipefd_stdin[PIPE_WRITE] != -1) - close(pipefd_stdin[PIPE_WRITE]); - - fp_child_stdin = NULL; - } - - // the child end - close it - if (pipefd_stdout[PIPE_WRITE] != -1) - close(pipefd_stdout[PIPE_WRITE]); - - // our end - if (ret == -1 || !fpp_child_stdout) { - if (fp_child_stdout) - fclose(fp_child_stdout); - else if (pipefd_stdout[PIPE_READ] != -1) - close(pipefd_stdout[PIPE_READ]); - - fp_child_stdout = NULL; - } - -set_return_values_and_return: - if(fpp_child_stdin) - *fpp_child_stdin = fp_child_stdin; - - if(fpp_child_stdout) - *fpp_child_stdout = fp_child_stdout; - - return ret; -} - -int netdata_popene_variadic_internal_dont_use_directly(volatile pid_t *pidptr, char **env, uint8_t flags, FILE **fpp_child_input, FILE **fpp_child_output, const char *command, ...) { - // convert the variable list arguments into what posix_spawn() needs - // all arguments are expected strings - va_list args; - int args_count; - - // count the number variable parameters - // the variable parameters are expected NULL terminated - { - const char *s; - - va_start(args, command); - args_count = 0; - while ((s = va_arg(args, const char *))) args_count++; - va_end(args); - } - - // create a string pointer array as needed by posix_spawn() - // variable array in the stack - const char *spawn_argv[args_count + 1]; - { - const char *s; - va_start(args, command); - int i; - for (i = 0; i < args_count; i++) { - s = va_arg(args, const char *); - spawn_argv[i] = s; - } - spawn_argv[args_count] = NULL; - va_end(args); - } - - return popene_internal(pidptr, env, flags, fpp_child_input, fpp_child_output, command, spawn_argv); -} - -// See man environ -extern char **environ; - -FILE *netdata_popen(const char *command, volatile pid_t *pidptr, FILE **fpp_child_input) { - FILE *fp_child_output = NULL; - const char *spawn_argv[] = { - "sh", - "-c", - command, - NULL - }; - (void)popene_internal(pidptr, environ, POPEN_FLAG_CLOSE_FD, fpp_child_input, &fp_child_output, "/bin/sh", spawn_argv); - return fp_child_output; -} - -FILE *netdata_popene(const char *command, volatile pid_t *pidptr, char **env, FILE **fpp_child_input) { - FILE *fp_child_output = NULL; - const char *spawn_argv[] = { - "sh", - "-c", - command, - NULL - }; - (void)popene_internal(pidptr, env, POPEN_FLAG_CLOSE_FD, fpp_child_input, &fp_child_output, "/bin/sh", spawn_argv); - return fp_child_output; -} - -// returns 0 on success, -1 on failure -int netdata_spawn(const char *command, volatile pid_t *pidptr) { - const char *spawn_argv[] = { - "sh", - "-c", - command, - NULL - }; - return popene_internal(pidptr, environ, POPEN_FLAG_NONE, NULL, NULL, "/bin/sh", spawn_argv); -} - -int netdata_pclose(FILE *fp_child_input, FILE *fp_child_output, pid_t pid) { - int ret; - siginfo_t info; - - netdata_log_debug(D_EXIT, "Request to netdata_pclose() on pid %d", pid); - - if (fp_child_input) - fclose(fp_child_input); - - if (fp_child_output) - fclose(fp_child_output); - - errno = 0; - - ret = netdata_waitid(P_PID, (id_t) pid, &info, WEXITED); - netdata_popen_tracking_del_pid(pid); - - if (ret != -1) { - switch (info.si_code) { - case CLD_EXITED: - if(info.si_status) - netdata_log_error("child pid %d exited with code %d.", info.si_pid, info.si_status); - return(info.si_status); - - case CLD_KILLED: - if(info.si_status == SIGTERM) { - netdata_log_info("child pid %d killed by SIGTERM", info.si_pid); - return(0); - } - else if(info.si_status == SIGPIPE) { - netdata_log_info("child pid %d killed by SIGPIPE.", info.si_pid); - return(0); - } - else { - netdata_log_error("child pid %d killed by signal %d.", info.si_pid, info.si_status); - return(-1); - } - - case CLD_DUMPED: - netdata_log_error("child pid %d core dumped by signal %d.", info.si_pid, info.si_status); - return(-2); - - case CLD_STOPPED: - netdata_log_error("child pid %d stopped by signal %d.", info.si_pid, info.si_status); - return(0); - - case CLD_TRAPPED: - netdata_log_error("child pid %d trapped by signal %d.", info.si_pid, info.si_status); - return(-4); - - case CLD_CONTINUED: - netdata_log_error("child pid %d continued by signal %d.", info.si_pid, info.si_status); - return(0); - - default: - netdata_log_error("child pid %d gave us a SIGCHLD with code %d and status %d.", info.si_pid, info.si_code, info.si_status); - return(-5); - } - } - else - netdata_log_error("Cannot waitid() for pid %d", pid); - - return 0; -} diff --git a/src/libnetdata/popen/popen.h b/src/libnetdata/popen/popen.h deleted file mode 100644 index 8f46abbc8..000000000 --- a/src/libnetdata/popen/popen.h +++ /dev/null @@ -1,35 +0,0 @@ -// SPDX-License-Identifier: GPL-3.0-or-later - -#ifndef NETDATA_POPEN_H -#define NETDATA_POPEN_H 1 - -#include "../os/waitid.h" -int netdata_waitid(idtype_t idtype, id_t id, siginfo_t *infop, int options); - -#include "../libnetdata.h" - -#define PIPE_READ 0 -#define PIPE_WRITE 1 - -/* custom_popene_variadic_internal_dont_use_directly flag definitions */ -#define POPEN_FLAG_NONE 0 -#define POPEN_FLAG_CLOSE_FD (1 << 0) // Close all file descriptors other than STDIN_FILENO, STDOUT_FILENO, STDERR_FILENO - -// the flags to be used by default -#define POPEN_FLAGS_DEFAULT (POPEN_FLAG_CLOSE_FD) - -// mypopen_raw is the interface to use instead of custom_popene_variadic_internal_dont_use_directly() -// mypopen_raw will add the terminating NULL at the arguments list -// we append the parameter 'command' twice - this is because the underlying call needs the command to execute and the argv[0] to pass to it -#define netdata_popen_raw_default_flags_and_environment(pidptr, fpp_child_input, fpp_child_output, command, args...) netdata_popene_variadic_internal_dont_use_directly(pidptr, environ, POPEN_FLAGS_DEFAULT, fpp_child_input, fpp_child_output, command, command, ##args, NULL) -#define netdata_popen_raw_default_flags(pidptr, env, fpp_child_input, fpp_child_output, command, args...) netdata_popene_variadic_internal_dont_use_directly(pidptr, env, POPEN_FLAGS_DEFAULT, fpp_child_input, fpp_child_output, command, command, ##args, NULL) -#define netdata_popen_raw(pidptr, env, flags, fpp_child_input, fpp_child_output, command, args...) netdata_popene_variadic_internal_dont_use_directly(pidptr, env, flags, fpp_child_input, fpp_child_output, command, command, ##args, NULL) - -FILE *netdata_popen(const char *command, volatile pid_t *pidptr, FILE **fp_child_input); -FILE *netdata_popene(const char *command, volatile pid_t *pidptr, char **env, FILE **fp_child_input); -int netdata_popene_variadic_internal_dont_use_directly(volatile pid_t *pidptr, char **env, uint8_t flags, FILE **fpp_child_input, FILE **fpp_child_output, const char *command, ...); -int netdata_pclose(FILE *fp_child_input, FILE *fp_child_output, pid_t pid); - -int netdata_spawn(const char *command, volatile pid_t *pidptr); - -#endif /* NETDATA_POPEN_H */ diff --git a/src/libnetdata/procfile/procfile.c b/src/libnetdata/procfile/procfile.c index d9ebf4c93..2b7eeeb56 100644 --- a/src/libnetdata/procfile/procfile.c +++ b/src/libnetdata/procfile/procfile.c @@ -336,7 +336,7 @@ __attribute__((constructor)) void procfile_initialize_default_separators(void) { if(unlikely(i == '\n' || i == '\r')) procfile_default_separators[i] = PF_CHAR_IS_NEWLINE; - else if(unlikely(isspace(i) || !isprint(i))) + else if(unlikely(isspace(i) || (!isprint(i) && !IS_UTF8_BYTE(i)))) procfile_default_separators[i] = PF_CHAR_IS_SEPARATOR; else diff --git a/src/libnetdata/socket/socket.c b/src/libnetdata/socket/socket.c index 0ba24b747..7170a3963 100644 --- a/src/libnetdata/socket/socket.c +++ b/src/libnetdata/socket/socket.c @@ -194,11 +194,9 @@ int sock_setreuse(int fd, int reuse) { void sock_setcloexec(int fd) { UNUSED(fd); -#ifndef SOCK_CLOEXEC int flags = fcntl(fd, F_GETFD); if (flags != -1) (void) fcntl(fd, F_SETFD, flags | FD_CLOEXEC); -#endif } int sock_setreuse_port(int fd __maybe_unused, int reuse __maybe_unused) { @@ -290,7 +288,7 @@ int create_listen_socket_unix(const char *path, int listen_backlog) { name.sun_family = AF_UNIX; strncpy(name.sun_path, path, sizeof(name.sun_path)-1); - errno = 0; + errno_clear(); if (unlink(path) == -1 && errno != ENOENT) nd_log(NDLS_DAEMON, NDLP_ERR, "LISTENER: failed to remove existing (probably obsolete or left-over) file on UNIX socket path '%s'.", @@ -918,7 +916,7 @@ int connect_to_this_ip46(int protocol, int socktype, const char *host, uint32_t } sock_setcloexec(fd); - errno = 0; + errno_clear(); if(connect(fd, ai->ai_addr, ai->ai_addrlen) < 0) { if(errno == EALREADY || errno == EINPROGRESS) { nd_log(NDLS_DAEMON, NDLP_DEBUG, @@ -1200,7 +1198,7 @@ inline int wait_on_socket_or_cancel_with_timeout( const int wait_ms = (timeout_ms >= ND_CHECK_CANCELLABILITY_WHILE_WAITING_EVERY_MS || forever) ? ND_CHECK_CANCELLABILITY_WHILE_WAITING_EVERY_MS : timeout_ms; - errno = 0; + errno_clear(); // check every wait_ms const int ret = poll(&pfd, 1, wait_ms); @@ -1482,7 +1480,7 @@ int accept_socket(int fd, int flags, char *client_ip, size_t ipsize, char *clien break; } if (!connection_allowed(nfd, client_ip, client_host, hostsize, access_list, "connection", allow_dns)) { - errno = 0; + errno_clear(); nd_log(NDLS_DAEMON, NDLP_WARNING, "Permission denied for client '%s', port '%s'", client_ip, client_port); diff --git a/src/libnetdata/spawn_server/spawn_popen.c b/src/libnetdata/spawn_server/spawn_popen.c new file mode 100644 index 000000000..f354b1f2a --- /dev/null +++ b/src/libnetdata/spawn_server/spawn_popen.c @@ -0,0 +1,142 @@ +// SPDX-License-Identifier: GPL-3.0-or-later + +#include "spawn_popen.h" + +SPAWN_SERVER *netdata_main_spawn_server = NULL; +static SPINLOCK netdata_main_spawn_server_spinlock = NETDATA_SPINLOCK_INITIALIZER; + +bool netdata_main_spawn_server_init(const char *name, int argc, const char **argv) { + if(netdata_main_spawn_server == NULL) { + spinlock_lock(&netdata_main_spawn_server_spinlock); + if(netdata_main_spawn_server == NULL) + netdata_main_spawn_server = spawn_server_create(SPAWN_SERVER_OPTION_EXEC, name, NULL, argc, argv); + spinlock_unlock(&netdata_main_spawn_server_spinlock); + } + + return netdata_main_spawn_server != NULL; +} + +void netdata_main_spawn_server_cleanup(void) { + if(netdata_main_spawn_server) { + spinlock_lock(&netdata_main_spawn_server_spinlock); + if(netdata_main_spawn_server) { + spawn_server_destroy(netdata_main_spawn_server); + netdata_main_spawn_server = NULL; + } + spinlock_unlock(&netdata_main_spawn_server_spinlock); + } +} + +POPEN_INSTANCE *spawn_popen_run_argv(const char **argv) { + netdata_main_spawn_server_init(NULL, 0, NULL); + + SPAWN_INSTANCE *si = spawn_server_exec(netdata_main_spawn_server, nd_log_collectors_fd(), + 0, argv, NULL, 0, SPAWN_INSTANCE_TYPE_EXEC); + + if(si == NULL) return NULL; + + POPEN_INSTANCE *pi = mallocz(sizeof(*pi)); + pi->si = si; + pi->child_stdin_fp = fdopen(spawn_server_instance_write_fd(si), "w"); + pi->child_stdout_fp = fdopen(spawn_server_instance_read_fd(si), "r"); + + if(!pi->child_stdin_fp) { + nd_log(NDLS_COLLECTORS, NDLP_ERR, "Cannot open FILE on child's stdin on fd %d.", spawn_server_instance_write_fd(si)); + goto cleanup; + } + + if(!pi->child_stdout_fp) { + nd_log(NDLS_COLLECTORS, NDLP_ERR, "Cannot open FILE on child's stdout on fd %d.", spawn_server_instance_read_fd(si)); + goto cleanup; + } + + return pi; + +cleanup: + if(pi->child_stdin_fp) { fclose(pi->child_stdin_fp); spawn_server_instance_write_fd(si); } + if(pi->child_stdout_fp) { fclose(pi->child_stdout_fp); spawn_server_instance_read_fd_unset(si); } + spawn_server_exec_kill(netdata_main_spawn_server, si); + freez(pi); + return NULL; +} + +POPEN_INSTANCE *spawn_popen_run_variadic(const char *cmd, ...) { + va_list args; + va_list args_copy; + int argc = 0; + + // Start processing variadic arguments + va_start(args, cmd); + + // Make a copy of args to count the number of arguments + va_copy(args_copy, args); + while (va_arg(args_copy, char *) != NULL) argc++; + va_end(args_copy); + + // Allocate memory for argv array (+2 for cmd and NULL terminator) + const char *argv[argc + 2]; + + // Populate the argv array + argv[0] = cmd; + + for (int i = 1; i <= argc; i++) + argv[i] = va_arg(args, const char *); + + argv[argc + 1] = NULL; // NULL-terminate the array + + // End processing variadic arguments + va_end(args); + + return spawn_popen_run_argv(argv); +} + +POPEN_INSTANCE *spawn_popen_run(const char *cmd) { + if(!cmd || !*cmd) return NULL; + + const char *argv[] = { + "/bin/sh", + "-c", + cmd, + NULL + }; + return spawn_popen_run_argv(argv); +} + +static int spawn_popen_status_rc(int status) { + if(WIFEXITED(status)) + return WEXITSTATUS(status); + + if(WIFSIGNALED(status)) { + int sig = WTERMSIG(status); + switch(sig) { + case SIGTERM: + case SIGPIPE: + return 0; + + default: + return -1; + } + } + + return -1; +} + +int spawn_popen_wait(POPEN_INSTANCE *pi) { + if(!pi) return -1; + + fclose(pi->child_stdin_fp); pi->child_stdin_fp = NULL; spawn_server_instance_write_fd_unset(pi->si); + fclose(pi->child_stdout_fp); pi->child_stdout_fp = NULL; spawn_server_instance_read_fd_unset(pi->si); + int status = spawn_server_exec_wait(netdata_main_spawn_server, pi->si); + freez(pi); + return spawn_popen_status_rc(status); +} + +int spawn_popen_kill(POPEN_INSTANCE *pi) { + if(!pi) return -1; + + fclose(pi->child_stdin_fp); pi->child_stdin_fp = NULL; spawn_server_instance_write_fd_unset(pi->si); + fclose(pi->child_stdout_fp); pi->child_stdout_fp = NULL; spawn_server_instance_read_fd_unset(pi->si); + int status = spawn_server_exec_kill(netdata_main_spawn_server, pi->si); + freez(pi); + return spawn_popen_status_rc(status); +} diff --git a/src/libnetdata/spawn_server/spawn_popen.h b/src/libnetdata/spawn_server/spawn_popen.h new file mode 100644 index 000000000..253d1f34b --- /dev/null +++ b/src/libnetdata/spawn_server/spawn_popen.h @@ -0,0 +1,24 @@ +// SPDX-License-Identifier: GPL-3.0-or-later + +#ifndef SPAWN_POPEN_H +#define SPAWN_POPEN_H + +#include "../libnetdata.h" + +extern SPAWN_SERVER *netdata_main_spawn_server; +bool netdata_main_spawn_server_init(const char *name, int argc, const char **argv); +void netdata_main_spawn_server_cleanup(void); + +typedef struct { + SPAWN_INSTANCE *si; + FILE *child_stdin_fp; + FILE *child_stdout_fp; +} POPEN_INSTANCE; + +POPEN_INSTANCE *spawn_popen_run(const char *cmd); +POPEN_INSTANCE *spawn_popen_run_argv(const char **argv); +POPEN_INSTANCE *spawn_popen_run_variadic(const char *cmd, ...); +int spawn_popen_wait(POPEN_INSTANCE *pi); +int spawn_popen_kill(POPEN_INSTANCE *pi); + +#endif //SPAWN_POPEN_H diff --git a/src/libnetdata/spawn_server/spawn_server.c b/src/libnetdata/spawn_server/spawn_server.c new file mode 100644 index 000000000..ef6755c32 --- /dev/null +++ b/src/libnetdata/spawn_server/spawn_server.c @@ -0,0 +1,1533 @@ +// SPDX-License-Identifier: GPL-3.0-or-later + +#include "../libnetdata.h" + +#include "spawn_server.h" + +#if defined(OS_WINDOWS) +#include <windows.h> +#include <io.h> +#include <fcntl.h> +#include <process.h> +#include <sys/cygwin.h> +#endif + +struct spawn_server { + size_t id; + size_t request_id; + const char *name; +#if !defined(OS_WINDOWS) + SPAWN_SERVER_OPTIONS options; + + ND_UUID magic; // for authorizing requests, the client needs to know our random UUID + // it is ignored for PING requests + + int pipe[2]; + int sock; // the listening socket of the server + pid_t server_pid; + char *path; + spawn_request_callback_t cb; + + int argc; + const char **argv; +#endif +}; + +struct spawm_instance { + size_t request_id; + int sock; + int write_fd; + int read_fd; + pid_t child_pid; + +#if defined(OS_WINDOWS) + HANDLE process_handle; + HANDLE read_handle; + HANDLE write_handle; +#endif +}; + +int spawn_server_instance_read_fd(SPAWN_INSTANCE *si) { return si->read_fd; } +int spawn_server_instance_write_fd(SPAWN_INSTANCE *si) { return si->write_fd; } +pid_t spawn_server_instance_pid(SPAWN_INSTANCE *si) { return si->child_pid; } +void spawn_server_instance_read_fd_unset(SPAWN_INSTANCE *si) { si->read_fd = -1; } +void spawn_server_instance_write_fd_unset(SPAWN_INSTANCE *si) { si->write_fd = -1; } + +#if defined(OS_WINDOWS) + +SPAWN_SERVER* spawn_server_create(SPAWN_SERVER_OPTIONS options __maybe_unused, const char *name, spawn_request_callback_t cb __maybe_unused, int argc __maybe_unused, const char **argv __maybe_unused) { + SPAWN_SERVER* server = callocz(1, sizeof(SPAWN_SERVER)); + if(name) + server->name = strdupz(name); + else + server->name = strdupz("unnamed"); + return server; +} + +void spawn_server_destroy(SPAWN_SERVER *server) { + if (server) { + freez((void *)server->name); + freez(server); + } +} + +static BUFFER *argv_to_windows(const char **argv) { + BUFFER *wb = buffer_create(0, NULL); + + // argv[0] is the path + char b[strlen(argv[0]) * 2 + 1024]; + cygwin_conv_path(CCP_POSIX_TO_WIN_A | CCP_ABSOLUTE, argv[0], b, sizeof(b)); + + buffer_strcat(wb, "cmd.exe /C "); + + for(size_t i = 0; argv[i] ;i++) { + const char *s = (i == 0) ? b : argv[i]; + size_t len = strlen(s); + buffer_need_bytes(wb, len * 2 + 1); + + bool needs_quotes = false; + for(const char *c = s; !needs_quotes && *c ; c++) { + switch(*c) { + case ' ': + case '\v': + case '\t': + case '\n': + case '"': + needs_quotes = true; + break; + + default: + break; + } + } + + if(needs_quotes && buffer_strlen(wb)) + buffer_strcat(wb, " \""); + else + buffer_putc(wb, ' '); + + for(const char *c = s; *c ; c++) { + switch(*c) { + case '"': + buffer_putc(wb, '\\'); + // fall through + + default: + buffer_putc(wb, *c); + break; + } + } + + if(needs_quotes) + buffer_strcat(wb, "\""); + } + + return wb; +} + +SPAWN_INSTANCE* spawn_server_exec(SPAWN_SERVER *server, int stderr_fd, int custom_fd __maybe_unused, const char **argv, const void *data __maybe_unused, size_t data_size __maybe_unused, SPAWN_INSTANCE_TYPE type) { + static SPINLOCK spinlock = NETDATA_SPINLOCK_INITIALIZER; + + if (type != SPAWN_INSTANCE_TYPE_EXEC) + return NULL; + + int pipe_stdin[2] = { -1, -1 }, pipe_stdout[2] = { -1, -1 }; + + errno_clear(); + + SPAWN_INSTANCE *instance = callocz(1, sizeof(*instance)); + instance->request_id = __atomic_add_fetch(&server->request_id, 1, __ATOMIC_RELAXED); + + CLEAN_BUFFER *wb = argv_to_windows(argv); + char *command = (char *)buffer_tostring(wb); + + if (pipe(pipe_stdin) == -1) { + nd_log(NDLS_COLLECTORS, NDLP_ERR, + "SPAWN PARENT: Cannot create stdin pipe() for request No %zu, command: %s", + instance->request_id, command); + goto cleanup; + } + + if (pipe(pipe_stdout) == -1) { + nd_log(NDLS_COLLECTORS, NDLP_ERR, + "SPAWN PARENT: Cannot create stdout pipe() for request No %zu, command: %s", + instance->request_id, command); + goto cleanup; + } + + // do not run multiple times this section + // to prevent handles leaking + spinlock_lock(&spinlock); + + // Convert POSIX file descriptors to Windows handles + HANDLE stdin_read_handle = (HANDLE)_get_osfhandle(pipe_stdin[0]); + HANDLE stdout_write_handle = (HANDLE)_get_osfhandle(pipe_stdout[1]); + HANDLE stderr_handle = (HANDLE)_get_osfhandle(stderr_fd); + + if (stdin_read_handle == INVALID_HANDLE_VALUE || stdout_write_handle == INVALID_HANDLE_VALUE || stderr_handle == INVALID_HANDLE_VALUE) { + spinlock_unlock(&spinlock); + nd_log(NDLS_COLLECTORS, NDLP_ERR, + "SPAWN PARENT: Invalid handle value(s) for request No %zu, command: %s", + instance->request_id, command); + goto cleanup; + } + + // Set handle inheritance + if (!SetHandleInformation(stdin_read_handle, HANDLE_FLAG_INHERIT, HANDLE_FLAG_INHERIT) || + !SetHandleInformation(stdout_write_handle, HANDLE_FLAG_INHERIT, HANDLE_FLAG_INHERIT) || + !SetHandleInformation(stderr_handle, HANDLE_FLAG_INHERIT, HANDLE_FLAG_INHERIT)) { + spinlock_unlock(&spinlock); + nd_log(NDLS_COLLECTORS, NDLP_ERR, + "SPAWN PARENT: Cannot set handle(s) inheritance for request No %zu, command: %s", + instance->request_id, command); + goto cleanup; + } + + // Set up the STARTUPINFO structure + STARTUPINFO si; + PROCESS_INFORMATION pi; + ZeroMemory(&si, sizeof(si)); + si.cb = sizeof(si); + si.dwFlags = STARTF_USESTDHANDLES; + si.hStdInput = stdin_read_handle; + si.hStdOutput = stdout_write_handle; + si.hStdError = stderr_handle; + + nd_log(NDLS_COLLECTORS, NDLP_ERR, + "SPAWN PARENT: Running request No %zu, command: %s", + instance->request_id, command); + + // Spawn the process + if (!CreateProcess(NULL, command, NULL, NULL, TRUE, 0, NULL, NULL, &si, &pi)) { + spinlock_unlock(&spinlock); + nd_log(NDLS_COLLECTORS, NDLP_ERR, + "SPAWN PARENT: cannot CreateProcess() for request No %zu, command: %s", + instance->request_id, command); + goto cleanup; + } + + CloseHandle(pi.hThread); + + // end of the critical section + spinlock_unlock(&spinlock); + + // Close unused pipe ends + close(pipe_stdin[0]); pipe_stdin[0] = -1; + close(pipe_stdout[1]); pipe_stdout[1] = -1; + + // Store process information in instance + instance->child_pid = cygwin_winpid_to_pid(pi.dwProcessId); + if(instance->child_pid == -1) instance->child_pid = pi.dwProcessId; + + instance->process_handle = pi.hProcess; + + // Convert handles to POSIX file descriptors + instance->write_fd = pipe_stdin[1]; + instance->read_fd = pipe_stdout[0]; + + errno_clear(); + nd_log(NDLS_COLLECTORS, NDLP_ERR, + "SPAWN PARENT: created process for request No %zu, pid %d, command: %s", + instance->request_id, (int)instance->child_pid, command); + + return instance; + +cleanup: + if (pipe_stdin[0] >= 0) close(pipe_stdin[0]); + if (pipe_stdin[1] >= 0) close(pipe_stdin[1]); + if (pipe_stdout[0] >= 0) close(pipe_stdout[0]); + if (pipe_stdout[1] >= 0) close(pipe_stdout[1]); + freez(instance); + return NULL; +} + +int spawn_server_exec_kill(SPAWN_SERVER *server __maybe_unused, SPAWN_INSTANCE *instance) { + if(instance->read_fd != -1) { close(instance->read_fd); instance->read_fd = -1; } + if(instance->write_fd != -1) { close(instance->write_fd); instance->write_fd = -1; } + CloseHandle(instance->read_handle); instance->read_handle = NULL; + CloseHandle(instance->write_handle); instance->write_handle = NULL; + + TerminateProcess(instance->process_handle, 0); + + DWORD exit_code; + GetExitCodeProcess(instance->process_handle, &exit_code); + CloseHandle(instance->process_handle); + + nd_log(NDLS_COLLECTORS, NDLP_ERR, + "SPAWN PARENT: child of request No %zu, pid %d, killed and exited with code %d", + instance->request_id, (int)instance->child_pid, (int)exit_code); + + freez(instance); + return (int)exit_code; +} + +int spawn_server_exec_wait(SPAWN_SERVER *server __maybe_unused, SPAWN_INSTANCE *instance) { + if(instance->read_fd != -1) { close(instance->read_fd); instance->read_fd = -1; } + if(instance->write_fd != -1) { close(instance->write_fd); instance->write_fd = -1; } + CloseHandle(instance->read_handle); instance->read_handle = NULL; + CloseHandle(instance->write_handle); instance->write_handle = NULL; + + WaitForSingleObject(instance->process_handle, INFINITE); + + DWORD exit_code = -1; + GetExitCodeProcess(instance->process_handle, &exit_code); + CloseHandle(instance->process_handle); + + nd_log(NDLS_COLLECTORS, NDLP_ERR, + "SPAWN PARENT: child of request No %zu, pid %d, waited and exited with code %d", + instance->request_id, (int)instance->child_pid, (int)exit_code); + + freez(instance); + return (int)exit_code; +} + +#else // !OS_WINDOWS + +#ifdef __APPLE__ +#include <crt_externs.h> +#define environ (*_NSGetEnviron()) +#else +extern char **environ; +#endif + +static size_t spawn_server_id = 0; +static volatile bool spawn_server_exit = false; +static volatile bool spawn_server_sigchld = false; +static SPAWN_REQUEST *spawn_server_requests = NULL; + +// -------------------------------------------------------------------------------------------------------------------- + +static int connect_to_spawn_server(const char *path, bool log) { + int sock = -1; + + if ((sock = socket(AF_UNIX, SOCK_STREAM, 0)) == -1) { + if(log) + nd_log(NDLS_COLLECTORS, NDLP_ERR, "SPAWN PARENT: cannot create socket() to connect to spawn server."); + return -1; + } + + struct sockaddr_un server_addr = { + .sun_family = AF_UNIX, + }; + strcpy(server_addr.sun_path, path); + + if (connect(sock, (struct sockaddr *)&server_addr, sizeof(server_addr)) == -1) { + if(log) + nd_log(NDLS_COLLECTORS, NDLP_ERR, "SPAWN PARENT: Cannot connect() to spawn server."); + close(sock); + return -1; + } + + return sock; +} + +// -------------------------------------------------------------------------------------------------------------------- +// the child created by the spawn server + +static void spawn_server_run_child(SPAWN_SERVER *server, SPAWN_REQUEST *rq) { + // close the server sockets; + close(server->sock); server->sock = -1; + if(server->pipe[0] != -1) { close(server->pipe[0]); server->pipe[0] = -1; } + if(server->pipe[1] != -1) { close(server->pipe[1]); server->pipe[1] = -1; } + + // set the process name + os_setproctitle("spawn-child", server->argc, server->argv); + + // get the fds from the request + int stdin_fd = rq->fds[0]; + int stdout_fd = rq->fds[1]; + int stderr_fd = rq->fds[2]; + int custom_fd = rq->fds[3]; (void)custom_fd; + + // change stdio fds to the ones in the request + if (dup2(stdin_fd, STDIN_FILENO) == -1) { + nd_log(NDLS_COLLECTORS, NDLP_ERR, + "SPAWN SERVER: cannot dup2(%d) stdin of request No %zu: %s", + stdin_fd, rq->request_id, rq->cmdline); + exit(1); + } + if (dup2(stdout_fd, STDOUT_FILENO) == -1) { + nd_log(NDLS_COLLECTORS, NDLP_ERR, + "SPAWN SERVER: cannot dup2(%d) stdin of request No %zu: %s", + stdout_fd, rq->request_id, rq->cmdline); + exit(1); + } + if (dup2(stderr_fd, STDERR_FILENO) == -1) { + nd_log(NDLS_COLLECTORS, NDLP_ERR, + "SPAWN SERVER: cannot dup2(%d) stderr of request No %zu: %s", + stderr_fd, rq->request_id, rq->cmdline); + exit(1); + } + + // close the excess fds + close(stdin_fd); stdin_fd = rq->fds[0] = STDIN_FILENO; + close(stdout_fd); stdout_fd = rq->fds[1] = STDOUT_FILENO; + close(stderr_fd); stderr_fd = rq->fds[2] = STDERR_FILENO; + + // overwrite the process environment + environ = (char **)rq->environment; + + // Perform different actions based on the type + switch (rq->type) { + + case SPAWN_INSTANCE_TYPE_EXEC: + // close all fds except the ones we need + os_close_all_non_std_open_fds_except(NULL, 0); + + // run the command + execvp(rq->argv[0], (char **)rq->argv); + + nd_log(NDLS_COLLECTORS, NDLP_ERR, + "SPAWN SERVER: Failed to execute command of request No %zu: %s", + rq->request_id, rq->cmdline); + + exit(1); + break; + + case SPAWN_INSTANCE_TYPE_CALLBACK: + server->cb(rq); + exit(0); + break; + + default: + nd_log(NDLS_COLLECTORS, NDLP_ERR, "SPAWN SERVER: unknown request type %u", rq->type); + exit(1); + } +} + +// -------------------------------------------------------------------------------------------------------------------- +// Encoding and decoding of spawn server request argv type of data + +// Function to encode argv or envp +static void* argv_encode(const char **argv, size_t *out_size) { + size_t buffer_size = 1024; // Initial buffer size + size_t buffer_used = 0; + char *buffer = mallocz(buffer_size); + + if(argv) { + for (const char **p = argv; *p != NULL; p++) { + if (strlen(*p) == 0) + continue; // Skip empty strings + + size_t len = strlen(*p) + 1; + size_t wanted_size = buffer_used + len + 1; + + if (wanted_size >= buffer_size) { + buffer_size *= 2; + + if(buffer_size < wanted_size) + buffer_size = wanted_size; + + buffer = reallocz(buffer, buffer_size); + } + + memcpy(&buffer[buffer_used], *p, len); + buffer_used += len; + } + } + + buffer[buffer_used++] = '\0'; // Final empty string + *out_size = buffer_used; + + return buffer; +} + +// Function to decode argv or envp +static const char** argv_decode(const char *buffer, size_t size) { + size_t count = 0; + const char *ptr = buffer; + while (ptr < buffer + size) { + if(ptr && *ptr) { + count++; + ptr += strlen(ptr) + 1; + } + else + break; + } + + const char **argv = mallocz((count + 1) * sizeof(char *)); + + ptr = buffer; + for (size_t i = 0; i < count; i++) { + argv[i] = ptr; + ptr += strlen(ptr) + 1; + } + argv[count] = NULL; // Null-terminate the array + + return argv; +} + +static BUFFER *argv_to_cmdline_buffer(const char **argv) { + BUFFER *wb = buffer_create(0, NULL); + + for(size_t i = 0; argv[i] ;i++) { + const char *s = argv[i]; + size_t len = strlen(s); + buffer_need_bytes(wb, len * 2 + 1); + + bool needs_quotes = false; + for(const char *c = s; !needs_quotes && *c ; c++) { + switch(*c) { + case ' ': + case '\v': + case '\t': + case '\n': + case '"': + needs_quotes = true; + break; + + default: + break; + } + } + + if(needs_quotes && buffer_strlen(wb)) + buffer_strcat(wb, " \""); + else + buffer_putc(wb, ' '); + + for(const char *c = s; *c ; c++) { + switch(*c) { + case '"': + buffer_putc(wb, '\\'); + // fall through + + default: + buffer_putc(wb, *c); + break; + } + } + + if(needs_quotes) + buffer_strcat(wb, "\""); + } + + return wb; +} + +// -------------------------------------------------------------------------------------------------------------------- +// status reports + +typedef enum __attribute__((packed)) { + STATUS_REPORT_NONE = 0, + STATUS_REPORT_STARTED, + STATUS_REPORT_FAILED, + STATUS_REPORT_EXITED, + STATUS_REPORT_PING, +} STATUS_REPORT; + +#define STATUS_REPORT_MAGIC 0xBADA55EE + +struct status_report { + uint32_t magic; + STATUS_REPORT status; + union { + struct { + pid_t pid; + } started; + + struct { + int err_no; + } failed; + + struct { + int waitpid_status; + } exited; + }; +}; + +static void spawn_server_send_status_ping(int sock) { + struct status_report sr = { + .magic = STATUS_REPORT_MAGIC, + .status = STATUS_REPORT_PING, + }; + + if(write(sock, &sr, sizeof(sr)) != sizeof(sr)) + nd_log(NDLS_COLLECTORS, NDLP_ERR, + "SPAWN SERVER: Cannot send ping reply."); +} + +static void spawn_server_send_status_success(SPAWN_REQUEST *rq) { + const struct status_report sr = { + .magic = STATUS_REPORT_MAGIC, + .status = STATUS_REPORT_STARTED, + .started = { + .pid = rq->pid, + }, + }; + + if(write(rq->sock, &sr, sizeof(sr)) != sizeof(sr)) + nd_log(NDLS_COLLECTORS, NDLP_ERR, + "SPAWN SERVER: Cannot send success status report for pid %d, request %zu: %s", + rq->pid, rq->request_id, rq->cmdline); +} + +static void spawn_server_send_status_failure(SPAWN_REQUEST *rq) { + struct status_report sr = { + .magic = STATUS_REPORT_MAGIC, + .status = STATUS_REPORT_FAILED, + .failed = { + .err_no = errno, + }, + }; + + if(write(rq->sock, &sr, sizeof(sr)) != sizeof(sr)) + nd_log(NDLS_COLLECTORS, NDLP_ERR, + "SPAWN SERVER: Cannot send failure status report for request %zu: %s", + rq->request_id, rq->cmdline); +} + +static void spawn_server_send_status_exit(SPAWN_REQUEST *rq, int waitpid_status) { + struct status_report sr = { + .magic = STATUS_REPORT_MAGIC, + .status = STATUS_REPORT_EXITED, + .exited = { + .waitpid_status = waitpid_status, + }, + }; + + if(write(rq->sock, &sr, sizeof(sr)) != sizeof(sr)) + nd_log(NDLS_COLLECTORS, NDLP_ERR, + "SPAWN SERVER: Cannot send exit status (%d) report for pid %d, request %zu: %s", + waitpid_status, rq->pid, rq->request_id, rq->cmdline); +} + +// -------------------------------------------------------------------------------------------------------------------- +// execute a received request + +static void request_free(SPAWN_REQUEST *rq) { + if(rq->fds[0] != -1) close(rq->fds[0]); + if(rq->fds[1] != -1) close(rq->fds[1]); + if(rq->fds[2] != -1) close(rq->fds[2]); + if(rq->fds[3] != -1) close(rq->fds[3]); + if(rq->sock != -1) close(rq->sock); + freez((void *)rq->argv); + freez((void *)rq->environment); + freez((void *)rq->data); + freez((void *)rq->cmdline); + freez((void *)rq); +} + +static void spawn_server_execute_request(SPAWN_SERVER *server, SPAWN_REQUEST *rq) { + switch(rq->type) { + case SPAWN_INSTANCE_TYPE_EXEC: + // close custom_fd - it is not needed for exec mode + if(rq->fds[3] != -1) { close(rq->fds[3]); rq->fds[3] = -1; } + + // create the cmdline for logs + if(rq->argv) { + CLEAN_BUFFER *wb = argv_to_cmdline_buffer(rq->argv); + rq->cmdline = strdupz(buffer_tostring(wb)); + } + break; + + case SPAWN_INSTANCE_TYPE_CALLBACK: + if(server->cb == NULL) { + errno = ENOSYS; + spawn_server_send_status_failure(rq); + request_free(rq); + return; + } + rq->cmdline = strdupz("callback() function"); + break; + + default: + errno = EINVAL; + spawn_server_send_status_failure(rq); + request_free(rq); + return; + } + + pid_t pid = fork(); + if (pid < 0) { + // fork failed + + nd_log(NDLS_COLLECTORS, NDLP_ERR, "SPAWN SERVER: Failed to fork() child."); + spawn_server_send_status_failure(rq); + request_free(rq); + return; + } + else if (pid == 0) { + // the child + + spawn_server_run_child(server, rq); + exit(63); + } + + // the parent + rq->pid = pid; + + // let the parent know + spawn_server_send_status_success(rq); + + // do not keep data we don't need at the parent + freez((void *)rq->environment); rq->environment = NULL; + freez((void *)rq->argv); rq->argv = NULL; + freez((void *)rq->data); rq->data = NULL; + rq->data_size = 0; + + // do not keep fds we don't need at the parent + if(rq->fds[0] != -1) { close(rq->fds[0]); rq->fds[0] = -1; } + if(rq->fds[1] != -1) { close(rq->fds[1]); rq->fds[1] = -1; } + if(rq->fds[2] != -1) { close(rq->fds[2]); rq->fds[2] = -1; } + if(rq->fds[3] != -1) { close(rq->fds[3]); rq->fds[3] = -1; } + + // keep it in the list + DOUBLE_LINKED_LIST_APPEND_ITEM_UNSAFE(spawn_server_requests, rq, prev, next); +} + +// -------------------------------------------------------------------------------------------------------------------- +// Sending and receiving requests + +typedef enum __attribute__((packed)) { + SPAWN_SERVER_MSG_INVALID = 0, + SPAWN_SERVER_MSG_REQUEST, + SPAWN_SERVER_MSG_PING, +} SPAWN_SERVER_MSG; + +static bool spawn_server_is_running(const char *path) { + struct msghdr msg = {0}; + struct iovec iov[7]; + SPAWN_SERVER_MSG msg_type = SPAWN_SERVER_MSG_PING; + size_t dummy_size = 0; + SPAWN_INSTANCE_TYPE dummy_type = 0; + ND_UUID magic = UUID_ZERO; + char cmsgbuf[CMSG_SPACE(sizeof(int))]; + + iov[0].iov_base = &msg_type; + iov[0].iov_len = sizeof(msg_type); + + iov[1].iov_base = magic.uuid; + iov[1].iov_len = sizeof(magic.uuid); + + iov[2].iov_base = &dummy_size; + iov[2].iov_len = sizeof(dummy_size); + + iov[3].iov_base = &dummy_size; + iov[3].iov_len = sizeof(dummy_size); + + iov[4].iov_base = &dummy_size; + iov[4].iov_len = sizeof(dummy_size); + + iov[5].iov_base = &dummy_size; + iov[5].iov_len = sizeof(dummy_size); + + iov[6].iov_base = &dummy_type; + iov[6].iov_len = sizeof(dummy_type); + + msg.msg_iov = iov; + msg.msg_iovlen = 7; + msg.msg_control = cmsgbuf; + msg.msg_controllen = sizeof(cmsgbuf); + + int sock = connect_to_spawn_server(path, false); + if(sock == -1) + return false; + + int rc = sendmsg(sock, &msg, 0); + if (rc < 0) { + // cannot send the message + close(sock); + return false; + } + + // Receive response + struct status_report sr = { 0 }; + if (read(sock, &sr, sizeof(sr)) != sizeof(sr)) { + // cannot receive a ping reply + close(sock); + return false; + } + + close(sock); + return sr.status == STATUS_REPORT_PING; +} + +static bool spawn_server_send_request(ND_UUID *magic, SPAWN_REQUEST *request) { + bool ret = false; + + size_t env_size = 0; + void *encoded_env = argv_encode(request->environment, &env_size); + if (!encoded_env) + goto cleanup; + + size_t argv_size = 0; + void *encoded_argv = argv_encode(request->argv, &argv_size); + if (!encoded_argv) + goto cleanup; + + struct msghdr msg = {0}; + struct cmsghdr *cmsg; + SPAWN_SERVER_MSG msg_type = SPAWN_SERVER_MSG_REQUEST; + char cmsgbuf[CMSG_SPACE(sizeof(int) * SPAWN_SERVER_TRANSFER_FDS)]; + struct iovec iov[11]; + + + // We send 1 request with 10 iovec in it + // The request will be received in 2 parts + // 1. the first 6 iovec which include the sizes of the memory allocations required + // 2. the last 4 iovec which require the memory allocations to be received + + iov[0].iov_base = &msg_type; + iov[0].iov_len = sizeof(msg_type); + + iov[1].iov_base = magic->uuid; + iov[1].iov_len = sizeof(magic->uuid); + + iov[2].iov_base = &request->request_id; + iov[2].iov_len = sizeof(request->request_id); + + iov[3].iov_base = &env_size; + iov[3].iov_len = sizeof(env_size); + + iov[4].iov_base = &argv_size; + iov[4].iov_len = sizeof(argv_size); + + iov[5].iov_base = &request->data_size; + iov[5].iov_len = sizeof(request->data_size); + + iov[6].iov_base = &request->type; // Added this line + iov[6].iov_len = sizeof(request->type); + + iov[7].iov_base = encoded_env; + iov[7].iov_len = env_size; + + iov[8].iov_base = encoded_argv; + iov[8].iov_len = argv_size; + + iov[9].iov_base = (char *)request->data; + iov[9].iov_len = request->data_size; + + iov[10].iov_base = NULL; + iov[10].iov_len = 0; + + msg.msg_iov = iov; + msg.msg_iovlen = 11; + msg.msg_control = cmsgbuf; + msg.msg_controllen = CMSG_SPACE(sizeof(int) * SPAWN_SERVER_TRANSFER_FDS); + + cmsg = CMSG_FIRSTHDR(&msg); + cmsg->cmsg_level = SOL_SOCKET; + cmsg->cmsg_type = SCM_RIGHTS; + cmsg->cmsg_len = CMSG_LEN(sizeof(int) * SPAWN_SERVER_TRANSFER_FDS); + + memcpy(CMSG_DATA(cmsg), request->fds, sizeof(int) * SPAWN_SERVER_TRANSFER_FDS); + + int rc = sendmsg(request->sock, &msg, 0); + + if (rc < 0) { + nd_log(NDLS_COLLECTORS, NDLP_ERR, "SPAWN PARENT: Failed to sendmsg() request to spawn server using socket %d.", request->sock); + goto cleanup; + } + else { + ret = true; + // fprintf(stderr, "PARENT: sent request %zu on socket %d (fds: %d, %d, %d, %d) from tid %d\n", + // request->request_id, request->socket, request->fds[0], request->fds[1], request->fds[2], request->fds[3], os_gettid()); + } + +cleanup: + freez(encoded_env); + freez(encoded_argv); + return ret; +} + +static void spawn_server_receive_request(int sock, SPAWN_SERVER *server) { + struct msghdr msg = {0}; + struct iovec iov[7]; + SPAWN_SERVER_MSG msg_type = SPAWN_SERVER_MSG_INVALID; + size_t request_id; + size_t env_size; + size_t argv_size; + size_t data_size; + ND_UUID magic = UUID_ZERO; + SPAWN_INSTANCE_TYPE type; + char cmsgbuf[CMSG_SPACE(sizeof(int) * SPAWN_SERVER_TRANSFER_FDS)]; + char *envp_encoded = NULL, *argv_encoded = NULL, *data = NULL; + int stdin_fd = -1, stdout_fd = -1, stderr_fd = -1, custom_fd = -1; + + // First recvmsg() to read sizes and control message + iov[0].iov_base = &msg_type; + iov[0].iov_len = sizeof(msg_type); + + iov[1].iov_base = magic.uuid; + iov[1].iov_len = sizeof(magic.uuid); + + iov[2].iov_base = &request_id; + iov[2].iov_len = sizeof(request_id); + + iov[3].iov_base = &env_size; + iov[3].iov_len = sizeof(env_size); + + iov[4].iov_base = &argv_size; + iov[4].iov_len = sizeof(argv_size); + + iov[5].iov_base = &data_size; + iov[5].iov_len = sizeof(data_size); + + iov[6].iov_base = &type; + iov[6].iov_len = sizeof(type); + + msg.msg_iov = iov; + msg.msg_iovlen = 7; + msg.msg_control = cmsgbuf; + msg.msg_controllen = sizeof(cmsgbuf); + + if (recvmsg(sock, &msg, 0) < 0) { + nd_log(NDLS_COLLECTORS, NDLP_ERR, + "SPAWN SERVER: failed to recvmsg() the first part of the request."); + close(sock); + return; + } + + if(msg_type == SPAWN_SERVER_MSG_PING) { + spawn_server_send_status_ping(sock); + close(sock); + return; + } + + if(!UUIDeq(magic, server->magic)) { + nd_log(NDLS_COLLECTORS, NDLP_ERR, + "SPAWN SERVER: Invalid authorization key for request %zu. " + "Rejecting request.", + request_id); + close(sock); + return; + } + + if(type == SPAWN_INSTANCE_TYPE_EXEC && !(server->options & SPAWN_SERVER_OPTION_EXEC)) { + nd_log(NDLS_COLLECTORS, NDLP_ERR, + "SPAWN SERVER: Request %zu wants to exec, but exec is not allowed for this spawn server. " + "Rejecting request.", + request_id); + close(sock); + return; + } + + if(type == SPAWN_INSTANCE_TYPE_CALLBACK && !(server->options & SPAWN_SERVER_OPTION_CALLBACK)) { + nd_log(NDLS_COLLECTORS, NDLP_ERR, + "SPAWN SERVER: Request %zu wants to run a callback, but callbacks are not allowed for this spawn server. " + "Rejecting request.", + request_id); + close(sock); + return; + } + + // Extract file descriptors from control message + struct cmsghdr *cmsg = CMSG_FIRSTHDR(&msg); + if (cmsg == NULL || cmsg->cmsg_len != CMSG_LEN(sizeof(int) * SPAWN_SERVER_TRANSFER_FDS)) { + nd_log(NDLS_COLLECTORS, NDLP_ERR, + "SPAWN SERVER: Received invalid control message (expected %zu bytes, received %zu bytes)", + CMSG_LEN(sizeof(int) * SPAWN_SERVER_TRANSFER_FDS), cmsg?cmsg->cmsg_len:0); + close(sock); + return; + } + + if (cmsg->cmsg_level != SOL_SOCKET || cmsg->cmsg_type != SCM_RIGHTS) { + nd_log(NDLS_COLLECTORS, NDLP_ERR, "SPAWN SERVER: Received unexpected control message type."); + close(sock); + return; + } + + int *fds = (int *)CMSG_DATA(cmsg); + stdin_fd = fds[0]; + stdout_fd = fds[1]; + stderr_fd = fds[2]; + custom_fd = fds[3]; + + if (stdin_fd < 0 || stdout_fd < 0 || stderr_fd < 0) { + nd_log(NDLS_COLLECTORS, NDLP_ERR, + "SPAWN SERVER: invalid file descriptors received, stdin = %d, stdout = %d, stderr = %d", + stdin_fd, stdout_fd, stderr_fd); + goto cleanup; + } + + // Second recvmsg() to read buffer contents + iov[0].iov_base = envp_encoded = mallocz(env_size); + iov[0].iov_len = env_size; + iov[1].iov_base = argv_encoded = mallocz(argv_size); + iov[1].iov_len = argv_size; + iov[2].iov_base = data = mallocz(data_size); + iov[2].iov_len = data_size; + + msg.msg_iov = iov; + msg.msg_iovlen = 3; + msg.msg_control = NULL; + msg.msg_controllen = 0; + + ssize_t total_bytes_received = recvmsg(sock, &msg, 0); + if (total_bytes_received < 0) { + nd_log(NDLS_COLLECTORS, NDLP_ERR, "SPAWN SERVER: failed to recvmsg() the second part of the request."); + goto cleanup; + } + + // fprintf(stderr, "SPAWN SERVER: received request %zu (fds: %d, %d, %d, %d)\n", request_id, + // stdin_fd, stdout_fd, stderr_fd, custom_fd); + + SPAWN_REQUEST *rq = mallocz(sizeof(*rq)); + *rq = (SPAWN_REQUEST){ + .pid = 0, + .request_id = request_id, + .sock = sock, + .fds = { + [0] = stdin_fd, + [1] = stdout_fd, + [2] = stderr_fd, + [3] = custom_fd, + }, + .environment = argv_decode(envp_encoded, env_size), + .argv = argv_decode(argv_encoded, argv_size), + .data = data, + .data_size = data_size, + .type = type + }; + + // all allocations given to the request are now handled by this + spawn_server_execute_request(server, rq); + + // since we make rq->argv and rq->environment NULL when we keep it, + // we don't need these anymore. + freez(envp_encoded); + freez(argv_encoded); + return; + +cleanup: + close(sock); + if(stdin_fd != -1) close(stdin_fd); + if(stdout_fd != -1) close(stdout_fd); + if(stderr_fd != -1) close(stderr_fd); + if(custom_fd != -1) close(custom_fd); + freez(envp_encoded); + freez(argv_encoded); + freez(data); +} + +// -------------------------------------------------------------------------------------------------------------------- +// the spawn server main event loop + +static void spawn_server_sigchld_handler(int signo __maybe_unused) { + spawn_server_sigchld = true; +} + +static void spawn_server_sigterm_handler(int signo __maybe_unused) { + spawn_server_exit = true; +} + +static SPAWN_REQUEST *find_request_by_pid(pid_t pid) { + for(SPAWN_REQUEST *rq = spawn_server_requests; rq ;rq = rq->next) + if(rq->pid == pid) + return rq; + + return NULL; +} + +static void spawn_server_process_sigchld(void) { + // nd_log(NDLS_COLLECTORS, NDLP_INFO, "SPAWN SERVER: checking for exited children"); + + int status; + pid_t pid; + + // Loop to check for exited child processes + while ((pid = waitpid((pid_t)(-1), &status, WNOHANG)) != 0) { + if(pid == -1) + break; + + errno_clear(); + + SPAWN_REQUEST *rq = find_request_by_pid(pid); + size_t request_id = rq ? rq->request_id : 0; + bool send_report_remove_request = false; + + if(WIFEXITED(status)) { + if(WEXITSTATUS(status)) + nd_log(NDLS_COLLECTORS, NDLP_INFO, + "SPAWN SERVER: child with pid %d (request %zu) exited with exit code %d: %s", + pid, request_id, WEXITSTATUS(status), rq ? rq->cmdline : "[request not found]"); + send_report_remove_request = true; + } + else if(WIFSIGNALED(status)) { + if(WCOREDUMP(status)) + nd_log(NDLS_COLLECTORS, NDLP_INFO, + "SPAWN SERVER: child with pid %d (request %zu) coredump'd due to signal %d: %s", + pid, request_id, WTERMSIG(status), rq ? rq->cmdline : "[request not found]"); + else + nd_log(NDLS_COLLECTORS, NDLP_INFO, + "SPAWN SERVER: child with pid %d (request %zu) killed by signal %d: %s", + pid, request_id, WTERMSIG(status), rq ? rq->cmdline : "[request not found]"); + send_report_remove_request = true; + } + else if(WIFSTOPPED(status)) { + nd_log(NDLS_COLLECTORS, NDLP_INFO, + "SPAWN SERVER: child with pid %d (request %zu) stopped due to signal %d: %s", + pid, request_id, WSTOPSIG(status), rq ? rq->cmdline : "[request not found]"); + send_report_remove_request = false; + } + else if(WIFCONTINUED(status)) { + nd_log(NDLS_COLLECTORS, NDLP_INFO, + "SPAWN SERVER: child with pid %d (request %zu) continued due to signal %d: %s", + pid, request_id, SIGCONT, rq ? rq->cmdline : "[request not found]"); + send_report_remove_request = false; + } + else { + nd_log(NDLS_COLLECTORS, NDLP_INFO, + "SPAWN SERVER: child with pid %d (request %zu) reports unhandled status: %s", + pid, request_id, rq ? rq->cmdline : "[request not found]"); + send_report_remove_request = false; + } + + if(send_report_remove_request && rq) { + spawn_server_send_status_exit(rq, status); + DOUBLE_LINKED_LIST_REMOVE_ITEM_UNSAFE(spawn_server_requests, rq, prev, next); + request_free(rq); + } + } +} + +static void signals_unblock(void) { + sigset_t sigset; + sigfillset(&sigset); + + if(pthread_sigmask(SIG_UNBLOCK, &sigset, NULL) == -1) { + netdata_log_error("SPAWN SERVER: Could not unblock signals for threads"); + } +} + +static void spawn_server_event_loop(SPAWN_SERVER *server) { + int pipe_fd = server->pipe[1]; + close(server->pipe[0]); server->pipe[0] = -1; + + signals_unblock(); + + // Set up the signal handler for SIGCHLD and SIGTERM + struct sigaction sa; + sa.sa_handler = spawn_server_sigchld_handler; + sigemptyset(&sa.sa_mask); + sa.sa_flags = SA_RESTART | SA_NOCLDSTOP; + if (sigaction(SIGCHLD, &sa, NULL) == -1) { + nd_log(NDLS_COLLECTORS, NDLP_ERR, "SPAWN SERVER: sigaction() failed for SIGCHLD"); + exit(1); + } + + sa.sa_handler = spawn_server_sigterm_handler; + if (sigaction(SIGTERM, &sa, NULL) == -1) { + nd_log(NDLS_COLLECTORS, NDLP_ERR, "SPAWN SERVER: sigaction() failed for SIGTERM"); + exit(1); + } + + struct status_report sr = { + .status = STATUS_REPORT_STARTED, + .started = { + .pid = getpid(), + }, + }; + if (write(pipe_fd, &sr, sizeof(sr)) != sizeof(sr)) { + nd_log(NDLS_COLLECTORS, NDLP_ERR, "SPAWN SERVER: failed to write initial status report."); + exit(1); + } + + struct pollfd fds[2]; + fds[0].fd = server->sock; + fds[0].events = POLLIN; + fds[1].fd = pipe_fd; + fds[1].events = POLLHUP | POLLERR; + + while(!spawn_server_exit) { + int ret = poll(fds, 2, -1); + if (spawn_server_sigchld) { + spawn_server_sigchld = false; + spawn_server_process_sigchld(); + errno_clear(); + + if(ret == -1) + continue; + } + + if (ret == -1) { + nd_log(NDLS_COLLECTORS, NDLP_ERR, "SPAWN SERVER: poll() failed"); + break; + } + + if (fds[1].revents & (POLLHUP|POLLERR)) { + // Pipe has been closed (parent has exited) + nd_log(NDLS_COLLECTORS, NDLP_DEBUG, "SPAWN SERVER: Parent process has exited"); + break; + } + + if (fds[0].revents & POLLIN) { + int sock = accept(server->sock, NULL, NULL); + if (sock == -1) { + nd_log(NDLS_COLLECTORS, NDLP_ERR, "SPAWN SERVER: accept() failed"); + continue; + } + + // do not fork this socket + sock_setcloexec(sock); + + // receive the request and process it + spawn_server_receive_request(sock, server); + } + } + + // Cleanup before exiting + unlink(server->path); + + // stop all children + if(spawn_server_requests) { + // nd_log(NDLS_COLLECTORS, NDLP_INFO, "SPAWN SERVER: killing all children..."); + size_t killed = 0; + for(SPAWN_REQUEST *rq = spawn_server_requests; rq ; rq = rq->next) { + kill(rq->pid, SIGTERM); + killed++; + } + while(spawn_server_requests) { + spawn_server_process_sigchld(); + tinysleep(); + } + // nd_log(NDLS_COLLECTORS, NDLP_INFO, "SPAWN SERVER: all %zu children finished", killed); + } + + exit(1); +} + +// -------------------------------------------------------------------------------------------------------------------- +// management of the spawn server + +void spawn_server_destroy(SPAWN_SERVER *server) { + if(server->pipe[0] != -1) close(server->pipe[0]); + if(server->pipe[1] != -1) close(server->pipe[1]); + if(server->sock != -1) close(server->sock); + + if(server->server_pid) { + kill(server->server_pid, SIGTERM); + waitpid(server->server_pid, NULL, 0); + } + + if(server->path) { + unlink(server->path); + freez(server->path); + } + + freez((void *)server->name); + freez(server); +} + +static bool spawn_server_create_listening_socket(SPAWN_SERVER *server) { + if(spawn_server_is_running(server->path)) { + nd_log(NDLS_COLLECTORS, NDLP_ERR, "SPAWN SERVER: Server is already listening on path '%s'", server->path); + return false; + } + + if ((server->sock = socket(AF_UNIX, SOCK_STREAM, 0)) == -1) { + nd_log(NDLS_COLLECTORS, NDLP_ERR, "SPAWN SERVER: Failed to create socket()"); + return false; + } + + struct sockaddr_un server_addr = { + .sun_family = AF_UNIX, + }; + strcpy(server_addr.sun_path, server->path); + unlink(server->path); + errno = 0; + + if (bind(server->sock, (struct sockaddr *)&server_addr, sizeof(server_addr)) == -1) { + nd_log(NDLS_COLLECTORS, NDLP_ERR, "SPAWN SERVER: Failed to bind()"); + return false; + } + + if (listen(server->sock, 5) == -1) { + nd_log(NDLS_COLLECTORS, NDLP_ERR, "SPAWN SERVER: Failed to listen()"); + return false; + } + + return true; +} + +static void replace_stdio_with_dev_null() { + int dev_null_fd = open("/dev/null", O_RDWR); + if (dev_null_fd == -1) { + nd_log(NDLS_COLLECTORS, NDLP_ERR, "SPAWN SERVER: Failed to open /dev/null: %s", strerror(errno)); + return; + } + + // Redirect stdin (fd 0) + if (dup2(dev_null_fd, STDIN_FILENO) == -1) { + nd_log(NDLS_COLLECTORS, NDLP_ERR, "SPAWN SERVER: Failed to redirect stdin to /dev/null: %s", strerror(errno)); + close(dev_null_fd); + return; + } + + // Redirect stdout (fd 1) + if (dup2(dev_null_fd, STDOUT_FILENO) == -1) { + nd_log(NDLS_COLLECTORS, NDLP_ERR, "SPAWN SERVER: Failed to redirect stdout to /dev/null: %s", strerror(errno)); + close(dev_null_fd); + return; + } + + // Close the original /dev/null file descriptor + close(dev_null_fd); +} + +SPAWN_SERVER* spawn_server_create(SPAWN_SERVER_OPTIONS options, const char *name, spawn_request_callback_t child_callback, int argc, const char **argv) { + SPAWN_SERVER *server = callocz(1, sizeof(SPAWN_SERVER)); + server->pipe[0] = -1; + server->pipe[1] = -1; + server->sock = -1; + server->cb = child_callback; + server->argc = argc; + server->argv = argv; + server->options = options; + server->id = __atomic_add_fetch(&spawn_server_id, 1, __ATOMIC_RELAXED); + os_uuid_generate_random(server->magic.uuid); + + char *runtime_directory = getenv("NETDATA_CACHE_DIR"); + if(runtime_directory && !*runtime_directory) runtime_directory = NULL; + if (runtime_directory) { + struct stat statbuf; + + if(!*runtime_directory) + // it is empty + runtime_directory = NULL; + + else if (stat(runtime_directory, &statbuf) == 0 && S_ISDIR(statbuf.st_mode)) { + // it exists and it is a directory + + if (access(runtime_directory, W_OK) != 0) { + // it is not writable by us + nd_log(NDLS_COLLECTORS, NDLP_ERR, "Runtime directory '%s' is not writable, falling back to '/tmp'", runtime_directory); + runtime_directory = NULL; + } + } + else { + // it does not exist + nd_log(NDLS_COLLECTORS, NDLP_ERR, "Runtime directory '%s' does not exist, falling back to '/tmp'", runtime_directory); + runtime_directory = NULL; + } + } + if(!runtime_directory) + runtime_directory = "/tmp"; + + char path[1024]; + if(name && *name) { + server->name = strdupz(name); + snprintf(path, sizeof(path), "%s/.netdata-spawn-%s.sock", runtime_directory, name); + } + else { + server->name = strdupz("unnamed"); + snprintf(path, sizeof(path), "%s/.netdata-spawn-%d-%zu.sock", runtime_directory, getpid(), server->id); + } + + server->path = strdupz(path); + + if (!spawn_server_create_listening_socket(server)) + goto cleanup; + + if (pipe(server->pipe) == -1) { + nd_log(NDLS_COLLECTORS, NDLP_ERR, "SPAWN SERVER: Cannot create status pipe()"); + goto cleanup; + } + + pid_t pid = fork(); + if (pid == 0) { + // the child - the spawn server + + { + char buf[15]; + snprintfz(buf, sizeof(buf), "spawn-%s", server->name); + os_setproctitle(buf, server->argc, server->argv); + } + + replace_stdio_with_dev_null(); + os_close_all_non_std_open_fds_except((int[]){ server->sock, server->pipe[1] }, 2); + nd_log_reopen_log_files_for_spawn_server(); + spawn_server_event_loop(server); + } + else if (pid > 0) { + // the parent + server->server_pid = pid; + close(server->sock); server->sock = -1; + close(server->pipe[1]); server->pipe[1] = -1; + + struct status_report sr = { 0 }; + if (read(server->pipe[0], &sr, sizeof(sr)) != sizeof(sr)) { + nd_log(NDLS_COLLECTORS, NDLP_ERR, "SPAWN SERVER: cannot read() initial status report from spawn server"); + goto cleanup; + } + + if(sr.status != STATUS_REPORT_STARTED) { + nd_log(NDLS_COLLECTORS, NDLP_ERR, "SPAWN SERVER: server did not respond with success."); + goto cleanup; + } + + if(sr.started.pid != server->server_pid) { + nd_log(NDLS_COLLECTORS, NDLP_ERR, "SPAWN SERVER: server sent pid %d but we have created %d.", sr.started.pid, server->server_pid); + goto cleanup; + } + + return server; + } + + nd_log(NDLS_COLLECTORS, NDLP_ERR, "SPAWN SERVER: Cannot fork()"); + +cleanup: + spawn_server_destroy(server); + return NULL; +} + +// -------------------------------------------------------------------------------------------------------------------- +// creating spawn server instances + +void spawn_server_exec_destroy(SPAWN_INSTANCE *instance) { + if(instance->child_pid) kill(instance->child_pid, SIGTERM); + if(instance->write_fd != -1) close(instance->write_fd); + if(instance->read_fd != -1) close(instance->read_fd); + if(instance->sock != -1) close(instance->sock); + freez(instance); +} + +int spawn_server_exec_wait(SPAWN_SERVER *server __maybe_unused, SPAWN_INSTANCE *instance) { + int rc = -1; + + // close the child pipes, to make it exit + if(instance->write_fd != -1) { close(instance->write_fd); instance->write_fd = -1; } + if(instance->read_fd != -1) { close(instance->read_fd); instance->read_fd = -1; } + + // get the result + struct status_report sr = { 0 }; + if(read(instance->sock, &sr, sizeof(sr)) != sizeof(sr)) + nd_log(NDLS_COLLECTORS, NDLP_ERR, + "SPAWN PARENT: failed to read final status report for child %d, request %zu", + instance->child_pid, instance->request_id); + + else if(sr.magic != STATUS_REPORT_MAGIC) { + nd_log(NDLS_COLLECTORS, NDLP_ERR, + "SPAWN PARENT: invalid final status report for child %d, request %zu (invalid magic %#x in response)", + instance->child_pid, instance->request_id, sr.magic); + } + else switch(sr.status) { + case STATUS_REPORT_EXITED: + rc = sr.exited.waitpid_status; + break; + + case STATUS_REPORT_STARTED: + case STATUS_REPORT_FAILED: + default: + errno = 0; + nd_log(NDLS_COLLECTORS, NDLP_ERR, + "SPAWN PARENT: invalid status report to exec spawn request %zu for pid %d (status = %u)", + instance->request_id, instance->child_pid, sr.status); + break; + } + + instance->child_pid = 0; + spawn_server_exec_destroy(instance); + return rc; +} + +int spawn_server_exec_kill(SPAWN_SERVER *server, SPAWN_INSTANCE *instance) { + // kill the child, if it is still running + if(instance->child_pid) kill(instance->child_pid, SIGTERM); + return spawn_server_exec_wait(server, instance); +} + +SPAWN_INSTANCE* spawn_server_exec(SPAWN_SERVER *server, int stderr_fd, int custom_fd, const char **argv, const void *data, size_t data_size, SPAWN_INSTANCE_TYPE type) { + int pipe_stdin[2] = { -1, -1 }, pipe_stdout[2] = { -1, -1 }; + + SPAWN_INSTANCE *instance = callocz(1, sizeof(SPAWN_INSTANCE)); + instance->read_fd = -1; + instance->write_fd = -1; + + instance->sock = connect_to_spawn_server(server->path, true); + if(instance->sock == -1) + goto cleanup; + + if (pipe(pipe_stdin) == -1) { + nd_log(NDLS_COLLECTORS, NDLP_ERR, "SPAWN PARENT: Cannot create stdin pipe()"); + goto cleanup; + } + + if (pipe(pipe_stdout) == -1) { + nd_log(NDLS_COLLECTORS, NDLP_ERR, "SPAWN PARENT: Cannot create stdout pipe()"); + goto cleanup; + } + + SPAWN_REQUEST request = { + .request_id = __atomic_add_fetch(&server->request_id, 1, __ATOMIC_RELAXED), + .sock = instance->sock, + .fds = { + [0] = pipe_stdin[0], + [1] = pipe_stdout[1], + [2] = stderr_fd, + [3] = custom_fd, + }, + .environment = (const char **)environ, + .argv = argv, + .data = data, + .data_size = data_size, + .type = type + }; + + if(!spawn_server_send_request(&server->magic, &request)) + goto cleanup; + + close(pipe_stdin[0]); pipe_stdin[0] = -1; + instance->write_fd = pipe_stdin[1]; pipe_stdin[1] = -1; + + close(pipe_stdout[1]); pipe_stdout[1] = -1; + instance->read_fd = pipe_stdout[0]; pipe_stdout[0] = -1; + + // copy the request id to the instance + instance->request_id = request.request_id; + + struct status_report sr = { 0 }; + if(read(instance->sock, &sr, sizeof(sr)) != sizeof(sr)) { + nd_log(NDLS_COLLECTORS, NDLP_ERR, + "SPAWN PARENT: Failed to exec spawn request %zu (cannot get initial status report)", + request.request_id); + goto cleanup; + } + + if(sr.magic != STATUS_REPORT_MAGIC) { + nd_log(NDLS_COLLECTORS, NDLP_ERR, + "SPAWN PARENT: Failed to exec spawn request %zu (invalid magic %#x in response)", + request.request_id, sr.magic); + goto cleanup; + } + + switch(sr.status) { + case STATUS_REPORT_STARTED: + instance->child_pid = sr.started.pid; + return instance; + + case STATUS_REPORT_FAILED: + errno = sr.failed.err_no; + nd_log(NDLS_COLLECTORS, NDLP_ERR, + "SPAWN PARENT: Failed to exec spawn request %zu (server reports failure, errno is updated)", + request.request_id); + errno = 0; + break; + + case STATUS_REPORT_EXITED: + errno = ENOEXEC; + nd_log(NDLS_COLLECTORS, NDLP_ERR, + "SPAWN PARENT: Failed to exec spawn request %zu (server reports exit, errno is updated)", + request.request_id); + errno = 0; + break; + + default: + errno = 0; + nd_log(NDLS_COLLECTORS, NDLP_ERR, + "SPAWN PARENT: Invalid status report to exec spawn request %zu (received invalid data)", + request.request_id); + break; + } + +cleanup: + if (pipe_stdin[0] >= 0) close(pipe_stdin[0]); + if (pipe_stdin[1] >= 0) close(pipe_stdin[1]); + if (pipe_stdout[0] >= 0) close(pipe_stdout[0]); + if (pipe_stdout[1] >= 0) close(pipe_stdout[1]); + spawn_server_exec_destroy(instance); + return NULL; +} + +#endif // !OS_WINDOWS diff --git a/src/libnetdata/spawn_server/spawn_server.h b/src/libnetdata/spawn_server/spawn_server.h new file mode 100644 index 000000000..5ba66ae38 --- /dev/null +++ b/src/libnetdata/spawn_server/spawn_server.h @@ -0,0 +1,57 @@ +// SPDX-License-Identifier: GPL-3.0-or-later + +#ifndef SPAWN_SERVER_H +#define SPAWN_SERVER_H + +#define SPAWN_SERVER_TRANSFER_FDS 4 + +typedef enum __attribute__((packed)) { + SPAWN_INSTANCE_TYPE_EXEC = 0, +#if !defined(OS_WINDOWS) + SPAWN_INSTANCE_TYPE_CALLBACK = 1 +#endif +} SPAWN_INSTANCE_TYPE; + +typedef enum __attribute__((packed)) { + SPAWN_SERVER_OPTION_EXEC = (1 << 0), +#if !defined(OS_WINDOWS) + SPAWN_SERVER_OPTION_CALLBACK = (1 << 1), +#endif +} SPAWN_SERVER_OPTIONS; + +// this is only used publicly for SPAWN_INSTANCE_TYPE_CALLBACK +// which is not available in Windows +typedef struct spawn_request { + const char *cmdline; // the cmd line of the command we should run + size_t request_id; // the incremental request id + pid_t pid; // the pid of the child + int sock; // the socket for this request + int fds[SPAWN_SERVER_TRANSFER_FDS]; // 0 = stdin, 1 = stdout, 2 = stderr, 3 = custom + const char **environment; // the environment of the parent process + const char **argv; // the command line and its parameters + const void *data; // the data structure for the callback + size_t data_size; // the data structure size + SPAWN_INSTANCE_TYPE type; // the type of the request + + struct spawn_request *prev, *next; // linking of active requests at the spawn server +} SPAWN_REQUEST; + +typedef void (*spawn_request_callback_t)(SPAWN_REQUEST *request); + +typedef struct spawm_instance SPAWN_INSTANCE; +typedef struct spawn_server SPAWN_SERVER; + +SPAWN_SERVER* spawn_server_create(SPAWN_SERVER_OPTIONS options, const char *name, spawn_request_callback_t child_callback, int argc, const char **argv); +void spawn_server_destroy(SPAWN_SERVER *server); + +SPAWN_INSTANCE* spawn_server_exec(SPAWN_SERVER *server, int stderr_fd, int custom_fd, const char **argv, const void *data, size_t data_size, SPAWN_INSTANCE_TYPE type); +int spawn_server_exec_kill(SPAWN_SERVER *server, SPAWN_INSTANCE *instance); +int spawn_server_exec_wait(SPAWN_SERVER *server, SPAWN_INSTANCE *instance); + +int spawn_server_instance_read_fd(SPAWN_INSTANCE *si); +int spawn_server_instance_write_fd(SPAWN_INSTANCE *si); +pid_t spawn_server_instance_pid(SPAWN_INSTANCE *si); +void spawn_server_instance_read_fd_unset(SPAWN_INSTANCE *si); +void spawn_server_instance_write_fd_unset(SPAWN_INSTANCE *si); + +#endif //SPAWN_SERVER_H diff --git a/src/libnetdata/string/string.c b/src/libnetdata/string/string.c index 94c11f4b9..257a3cc4b 100644 --- a/src/libnetdata/string/string.c +++ b/src/libnetdata/string/string.c @@ -702,3 +702,8 @@ int string_unittest(size_t entries) { fprintf(stderr, "\n%zu errors found\n", errors); return errors ? 1 : 0; } + +void string_init(void) { + for (size_t i = 0; i != STRING_PARTITIONS; i++) + rw_spinlock_init(&string_base[i].spinlock); +} diff --git a/src/libnetdata/string/string.h b/src/libnetdata/string/string.h index f2ff9666c..c44696be2 100644 --- a/src/libnetdata/string/string.h +++ b/src/libnetdata/string/string.h @@ -34,4 +34,6 @@ void string_statistics(size_t *inserts, size_t *deletes, size_t *searches, size_ int string_unittest(size_t entries); +void string_init(void); + #endif diff --git a/src/libnetdata/threads/threads.c b/src/libnetdata/threads/threads.c index 0e12d173e..36c63f4e0 100644 --- a/src/libnetdata/threads/threads.c +++ b/src/libnetdata/threads/threads.c @@ -418,12 +418,14 @@ bool nd_thread_signaled_to_cancel(void) { // ---------------------------------------------------------------------------- // nd_thread_join -void nd_thread_join(ND_THREAD *nti) { - if(!nti) return; +int nd_thread_join(ND_THREAD *nti) { + if(!nti) + return ESRCH; int ret = pthread_join(nti->thread, NULL); - if(ret != 0) - nd_log(NDLS_DAEMON, NDLP_WARNING, "cannot join thread. pthread_join() failed with code %d.", ret); + if(ret != 0) { + nd_log(NDLS_DAEMON, NDLP_WARNING, "cannot join thread. pthread_join() failed with code %d. (tag=%s)", ret, nti->tag); + } else { nd_thread_status_set(nti, NETDATA_THREAD_STATUS_JOINED); @@ -434,4 +436,6 @@ void nd_thread_join(ND_THREAD *nti) { freez(nti); } + + return ret; } diff --git a/src/libnetdata/threads/threads.h b/src/libnetdata/threads/threads.h index a7204e2a2..0b54a5fc0 100644 --- a/src/libnetdata/threads/threads.h +++ b/src/libnetdata/threads/threads.h @@ -70,7 +70,7 @@ void netdata_threads_init_after_fork(size_t stacksize); void netdata_threads_init_for_external_plugins(size_t stacksize); ND_THREAD *nd_thread_create(const char *tag, NETDATA_THREAD_OPTIONS options, void *(*start_routine) (void *), void *arg); -void nd_thread_join(ND_THREAD * nti); +int nd_thread_join(ND_THREAD * nti); ND_THREAD *nd_thread_self(void); bool nd_thread_is_me(ND_THREAD *nti); diff --git a/src/logsmanagement/README.md b/src/logsmanagement/README.md deleted file mode 100644 index cfcd3ce8f..000000000 --- a/src/logsmanagement/README.md +++ /dev/null @@ -1,673 +0,0 @@ -# Logs Management - -## Table of Contents - -- [Summary](#summary) - - [Types of available log collectors](#collector-types) -- [Getting Started](#getting-started) -- [Package Requirements](#package-requirements) -- [General Configuration](#general-configuration) -- [Collector-specific Configuration](#collector-configuration) - - [Kernel logs (kmsg)](#collector-configuration-kmsg) - - [Systemd](#collector-configuration-systemd) - - [Docker events](#collector-configuration-docker-events) - - [Tail](#collector-configuration-tail) - - [Web log](#collector-configuration-web-log) - - [Syslog socket](#collector-configuration-syslog) - - [Serial](#collector-configuration-serial) - - [MQTT](#collector-configuration-mqtt) -- [Custom Charts](#custom-charts) -- [Streaming logs to Netdata](#streaming-in) - - [Example: Systemd log streaming](#streaming-systemd) - - [Example: Kernel log streaming](#streaming-kmsg) - - [Example: Generic log streaming](#streaming-generic) - - [Example: Docker Events log streaming](#streaming-docker-events) -- [Streaming logs from Netdata (exporting)](#streaming-out) -- [Troubleshooting](#troubleshooting) - -<a name="summary"/> - -## Summary - -</a> - -The Netdata logs management engine enables collection, processing, storage, streaming and querying of logs through the Netdata agent. The following pipeline depicts a high-level overview of the different stages that collected logs propagate through for this to be achieved: - - - -The [Fluent Bit](https://github.com/fluent/fluent-bit) project has been used as the logs collection and exporting / streaming engine, due to its stability and the variety of [collection (input) plugins](https://docs.fluentbit.io/manual/pipeline/inputs) that it offers. Each collected log record passes through the Fluent Bit engine first, before it gets buffered, parsed, compressed and (optionally) stored locally by the logs management engine. It can also be streamed to another Netdata or Fluent Bit instance (using Fluent Bit's [Forward](https://docs.fluentbit.io/manual/pipeline/outputs/forward) protocol), or exported using any other [Fluent Bit output](https://docs.fluentbit.io/manual/pipeline/outputs). - -A bespoke circular buffering implementation has been used to maximize performance and optimize memory utilization. More technical details about how it works can be found [here](https://github.com/netdata/netdata/pull/13291#buffering). - -To configure Netdata's logs management engine properly, please make sure you are aware of the following points first: - -* One collection cycle (at max) occurs per `update every` interval (in seconds - minimum 1 sec) and any log records collected in a collection cycle are grouped together (for compression and performance purposes). As a result of this, a longer `update every` interval will reduce memory and disk space requirements. -* When collected logs contain parsable timestamps, these will be used to display metrics from parsed logs at the correct time in each chart, even if collection of said logs takes place *much* later than the time they were produced. How much later? Up to a configurable value of `update timeout` seconds. This mechanism ensures correct parsing and querying of delayed logs that contain parsable timestamps (such as streamed inputs or buffered logs sources that write logs in batches), but the respective charts may lag behind some seconds up to that timeout. If no parsable timestamp is found, the collection timestamp will be used instead (or the collector can be forced to always use the collection timestamp by setting `use log timestamp = no`). - -<a name="collector-types"/> - -### Types of available log collectors - -</a> - -The following log collectors are supported at the moment. The table will be updated as more collectors are added: -| Collector | Log type | Description | -| ------------ | ------------ | ------------ | -| kernel logs (kmsg) | `flb_kmsg` | Collection of new kernel ring buffer logs.| -| systemd | `flb_systemd` | Collection of journald logs.| -| docker events | `flb_docker_events` | Collection of docker events logs, similar to executing the `docker events` command.| -| tail | `flb_tail` | Collection of new logs from files by "tailing" them, similar to `tail -f`.| -| web log | `flb_web_log` | Collection of Apache or Nginx access logs.| -| syslog socket | `flb_syslog` | Collection of RFC-3164 syslog logs by creating listening sockets.| -| serial | `flb_serial` | Collection of logs from a serial interface.| -| mqtt | `flb_mqtt` | Collection of MQTT messages over a TCP connection.| - -<a name="getting-started"/> - -## Getting Started - -</a> - -Since version `XXXXX`, Netdata is distributed with logs management functionality as an external plugin, but it is disabled by default and must be explicitly enabled using `./edit-config netdata.conf` and changing the respective configuration option: - -``` -[plugins] - logs-management = yes -``` - -There are some pre-configured log sources that Netdata will attempt to automatically discover and monitor that can be edited using `./edit-config logsmanagement.d/default.conf` in Netdata's configuration directory. More sources can be configured for monitoring by adding them in `logsmanagement.d/default.conf` or in other `.conf` files in the `logsmanagement.d` directory. - -There are also some example configurations that can be listed using `./edit-config --list`. - -To get familiar with the Logs Management functionality, the user is advised to read at least the [Summary](#summary) and the [General Configuration](#general-configuration) sections and also any [Collector-specific Configuration](#collector-configuration) subsections, according to each use case. - -For any issues, please refer to [Troubleshooting](#troubleshooting) or open a new support ticket on [Github](https://github.com/netdata/netdata/issues) or one of Netdata's support channels. - -<a name="package-requirements"/> - -## Package Requirements - -</a> - -Netdata logs management introduces minimal additional package dependencies and those are actually [Fluent Bit dependencies](https://docs.fluentbit.io/manual/installation/requirements). The only extra build-time dependencies are: -- `flex` -- `bison` -- `musl-fts-dev` ([Alpine Linux](https://www.alpinelinux.org/about) only) - -However, there may be some exceptions to this rule as more collectors are added to the logs management engine, so if a specific collector is disabled due to missing dependencies, please refer to this section or check [Troubleshooting](#troubleshooting). - -<a name="general-configuration"/> - -## General Configuration - -</a> - -There are some fundamental configuration options that are common to all log collector types. These options can be set globally in `logsmanagement.d.conf` or they can be customized per log source: - -| Configuration Option | Default | Description | -| :------------: | :------------: | ------------ | -| `update every` | Equivalent value in `logsmanagement.d.conf` (or in `netdata.conf` under `[plugin:logs-management]`, if higher). | How often metrics in charts will be updated every (in seconds). -| `update timeout` | Equivalent value in `[logs management]` section of `netdata.conf` (or Netdata global value, if higher). | Maximum timeout charts may be delayed by while waiting for new logs. -| `use log timestamp` | Equivalent value in `logsmanagement.d.conf` (`auto` by default). | If set to `auto`, log timestamps (when available) will be used for precise metrics aggregation. Otherwise (if set to `no`), collection timestamps will be used instead (which may result in lagged metrics under heavy system load, but it will reduce CPU usage). -| `log type` | `flb_tail` | Type of this log collector, see [relevant table](#collector-types) for a complete list of supported collectors. -| `circular buffer max size` | Equivalent value in `logsmanagement.d.conf`. | Maximum RAM that can be used to buffer collected logs until they are saved to the disk database. -| `circular buffer drop logs if full` | Equivalent value in `logsmanagement.d.conf` (`no` by default). | If there are new logs pending to be collected and the circular buffer is full, enabling this setting will allow old buffered logs to be dropped in favor of new ones. If disabled, collection of new logs will be blocked until there is free space again in the buffer (no logs will be lost in this case, but logs will not be ingested in real-time). -| `compression acceleration` | Equivalent value in `logsmanagement.d.conf` (`1` by default). | Fine-tunes tradeoff between log compression speed and compression ratio, see [here](https://github.com/lz4/lz4/blob/90d68e37093d815e7ea06b0ee3c168cccffc84b8/lib/lz4.h#L195) for more details. -| `db mode` | Equivalent value in `logsmanagement.d.conf` (`none` by default). | Mode of logs management database per collector. If set to `none`, logs will be collected, buffered, parsed and then discarded. If set to `full`, buffered logs will be saved to the logs management database instead of being discarded. When mode is `none`, logs management queries cannot be executed. -| `buffer flush to DB` | Equivalent value in `logsmanagement.d.conf` (`6` by default). | Interval in seconds at which logs will be transferred from RAM buffers to the database. -| `disk space limit` | Equivalent value in `logsmanagement.d.conf` (`500 MiB` by default). | Maximum disk space that all compressed logs in database can occupy (per log source). Once exceeded, oldest BLOB of logs will be truncated for new logs to be written over. Each log source database can contain a maximum of 10 BLOBs at any point, so each truncation equates to a deletion of about 10% of the oldest logs. The number of BLOBS will be configurable in a future release. -| `collected logs total chart enable` | Equivalent value in `logsmanagement.d.conf` (`no` by default). | Chart that shows the number of log records collected for this log source, since the last Netdata agent restart. Useful for debugging purposes. -| `collected logs rate chart enable` | Equivalent value in `logsmanagement.d.conf` (`yes` by default). | Chart that shows the rate that log records are collected at for this log source. -| `submit logs to system journal = no` | Equivalent value in `logsmanagement.d.conf` (`no` by default). Available only for `flb_tail`, `flb_web_log`, `flb_serial`, `flb_docker_events` and `flb_mqtt`. | If enabled, it will submit the collected logs to the system journal. - -There is also one setting that cannot be set per log source, but can only be defined in `logsmanagement.d.conf`: - -| Configuration Option | Default | Description | -| :------------: | :------------: | ------------ | -| `db dir` | `/var/cache/netdata/logs_management_db` | Logs management database path, will be created if it does not exist.| - - - -> **Note** -> `log path` must be defined per log source for any collector type, except for `kmsg` and the collectors that listen to network sockets. Some default examples use `log path = auto`. In those cases, an autodetection of the path will be attempted by searching through common paths where each log source is typically expected to be found. - -<a name="collector-configuration"/> - -## Collector-specific Configuration - -</a> - -<a name="collector-configuration-kmsg"/> - -### Kernel logs (kmsg) - -</a> - -This collector will collect logs from the kernel message log buffer. See also documentation of [Fluent Bit kmsg input plugin](https://docs.fluentbit.io/manual/pipeline/inputs/kernel-logs). - -> **Warning** -> If `use log timestamp` is set to `auto` and the system has been in suspend and resumed since the last boot, timestamps of new `kmsg` logs will be incorrect and log collection will not work. This is a know limitation when reading the kernel log buffer records and it is recommended to use `use log timestamp = no` in this case. - -> **Note** -> `/dev/kmsg` normally returns all the logs in the kernel log buffer every time it is read. To avoid duplicate logs, the collector will discard any previous logs the first time `/dev/kmsg` is read after an agent restart and it will collect only new kernel logs. - -| Configuration Option | Description | -| :------------: | ------------ | -| `prio level` | Drop kernel logs with priority higher than `prio level`. Default value is 8, so no logs will be dropped. -| `severity chart` | Enable chart showing Syslog Severity values of collected logs. Severity values are in the range of 0 to 7 inclusive.| -| `subsystem chart` | Enable chart showing which subsystems generated the logs.| -| `device chart` | Enable chart showing which devices generated the logs.| - -<a name="collector-configuration-systemd"/> - -### Systemd - -</a> - -This collector will collect logs from the journald daemon. See also documentation of [Fluent Bit systemd input plugin](https://docs.fluentbit.io/manual/pipeline/inputs/systemd). - -| Configuration Option | Description | -| :------------: | ------------ | -| `log path` | Path to the systemd journal directory. If set to `auto`, the default path will be used to read local-only logs. | -| `priority value chart` | Enable chart showing Syslog Priority values (PRIVAL) of collected logs. The Priority value ranges from 0 to 191 and represents both the Facility and Severity. It is calculated by first multiplying the Facility number by 8 and then adding the numerical value of the Severity. Please see the [rfc5424: Syslog Protocol](https://www.rfc-editor.org/rfc/rfc5424#section-6.2.1) document for more information.| -| `severity chart` | Enable chart showing Syslog Severity values of collected logs. Severity values are in the range of 0 to 7 inclusive.| -| `facility chart` | Enable chart showing Syslog Facility values of collected logs. Facility values show which subsystem generated the log and are in the range of 0 to 23 inclusive.| - -<a name="collector-configuration-docker-events"/> - -### Docker events - -</a> - -This collector will use the Docker API to collect Docker events logs. See also documentation of [Fluent Bit docker events input plugin](https://docs.fluentbit.io/manual/pipeline/inputs/docker-events). - -| Configuration Option | Description | -| :------------: | ------------ | -| `log path` | Docker socket UNIX path. If set to `auto`, the default path (`/var/run/docker.sock`) will be used. | -| `event type chart` | Enable chart showing the Docker object type of the collected logs. | -| `event action chart` | Enable chart showing the Docker object action of the collected logs. | - -<a name="collector-configuration-tail"/> - -### Tail - -</a> - -This collector will collect any type of logs from a log file, similar to executing the `tail -f` command. See also documentation of [Fluent Bit tail plugin](https://docs.fluentbit.io/manual/pipeline/inputs/tail). - -| Configuration Option | Description | -| :------------: | ------------ | -| `log path` | The path to the log file to be monitored. | -| `use inotify` | Select between inotify and file stat watchers (providing `libfluent-bit.so` has been built with inotify support). It defaults to `yes`. Set to `no` if abnormally high CPU usage is observed or if the log source is expected to consistently produce tens of thousands of (unbuffered) logs per second. | - -<a name="collector-configuration-web-log"/> - -### Web log - -</a> - -This collector will collect [Apache](https://httpd.apache.org/) and [Nginx](https://nginx.org/) access logs. - -| Configuration Option | Description | -| :------------: | ------------ | -| `log path` | The path to the web server's `access.log`. If set to `auto`, the collector will attempt to auto-discover it, provided the name of the configuration section is either `Apache access.log` or `Nginx access.log`. | -| `use inotify` | Select between inotify and file stat watchers (providing `libfluent-bit.so` has been built with inotify support). It defaults to `yes`. Set to `no` if abnormally high CPU usage is observed or if the log source is expected to consistently produce tens of thousands of (unbuffered) logs per second. | -| `log format` | The log format to be used for parsing. Unlike the [`GO weblog`]() module, only the `CSV` parser is supported and it can be configured [in the same way](/src/go/collectors/go.d.plugin/modules/weblog/README.md#known-fields) as in the `GO` module. If set to `auto`, the collector will attempt to auto-detect the log format using the same logic explained [here](/src/go/collectors/go.d.plugin/modules/weblog/README.md#log-parser-auto-detection). | -| `verify parsed logs` | If set to `yes`, the parser will attempt to verify that the parsed fields are valid, before extracting metrics from them. If they are invalid (for example, the response code is less than `100`), the `invalid` dimension will be incremented instead. Setting this to `no` will result in a slight performance gain. | -| `vhosts chart` | Enable chart showing names of the virtual hosts extracted from the collected logs. | -| `ports chart` | Enable chart showing port numbers extracted from the collected logs. | -| `IP versions chart` | Enable chart showing IP versions (`v4` or `v6`) extracted from the collected logs. | -| `unique client IPs - current poll chart` | Enable chart showing unique client IPs in each collection interval. | -| `unique client IPs - all-time chart` | Enable chart showing unique client IPs since agent startup. It is recommended to set this to `no` as it can have a negative impact on long-term performance. | -| `http request methods chart` | Enable chart showing HTTP request methods extracted from the collected logs. | -| `http protocol versions chart` | Enable chart showing HTTP protocol versions exctracted from the collected logs. | -| `bandwidth chart` | Enable chart showing request and response bandwidth extracted from the collected logs. | -| `timings chart` | Enable chart showing request processing time stats extracted from the collected logs. | -| `response code families chart` | Enable chart showing response code families (`1xx`, `2xx` etc.) extracted from the collected logs. | -| `response codes chart` | Enable chart showing response codes extracted from the collected logs. | -| `response code types chart` | Enable chart showing response code types (`success`, `redirect` etc.) extracted from the collected logs. | -| `SSL protocols chart` | Enable chart showing SSL protocols (`TLSV1`, `TLSV1.1` etc.) exctracted from the collected logs. | -| `SSL chipher suites chart` | Enable chart showing SSL chipher suites exctracted from the collected logs. | - -<a name="collector-configuration-syslog"/> - -### Syslog socket - -</a> - -This collector will collect logs through a Unix socket server (UDP or TCP) or over the network using TCP or UDP. See also documentation of [Fluent Bit syslog input plugin](https://docs.fluentbit.io/manual/pipeline/inputs/syslog). - -| Configuration Option | Description | -| :------------: | ------------ | -| `mode` | Type of socket to be created to listen for incoming syslog messages. Supported modes are: `unix_tcp`, `unix_udp`, `tcp` and `udp`.| -| `log path` | If `mode == unix_tcp` or `mode == unix_udp`, Netdata will create a UNIX socket on this path to listen for syslog messages. Otherwise, this option is not used.| -| `unix_perm` | If `mode == unix_tcp` or `mode == unix_udp`, this sets the permissions of the generated UNIX socket. Otherwise, this option is not used.| -| `listen` | If `mode == tcp` or `mode == udp`, this sets the network interface to bind.| -| `port` | If `mode == tcp` or `mode == udp`, this specifies the port to listen for incoming connections.| -| `log format` | This is a Ruby Regular Expression to define the expected syslog format. Fluent Bit provides some [pre-configured syslog parsers](https://github.com/fluent/fluent-bit/blob/master/conf/parsers.conf#L65). | -|`priority value chart` | Please see the respective [systemd](#collector-configuration-systemd) configuration.| -| `severity chart` | Please see the respective [systemd](#collector-configuration-systemd) configuration.| -| `facility chart` | Please see the respective [systemd](#collector-configuration-systemd) configuration.| - - For parsing and metrics extraction to work properly, please ensure fields `<PRIVAL>`, `<SYSLOG_TIMESTAMP>`, `<HOSTNAME>`, `<SYSLOG_IDENTIFIER>`, `<PID>` and `<MESSAGE>` are defined in `log format`. For example, to parse incoming `syslog-rfc3164` logs, the following regular expression can be used: - -``` -/^\<(?<PRIVAL>[0-9]+)\>(?<SYSLOG_TIMESTAMP>[^ ]* {1,2}[^ ]* [^ ]* )(?<HOSTNAME>[^ ]*) (?<SYSLOG_IDENTIFIER>[a-zA-Z0-9_\/\.\-]*)(?:\[(?<PID>[0-9]+)\])?(?:[^\:]*\:)? *(?<MESSAGE>.*)$/ -``` - -<a name="collector-configuration-serial"/> - -### Serial - -</a> - -This collector will collect logs through a serial interface. See also documentation of [Fluent Bit serial interface input plugin](https://docs.fluentbit.io/manual/pipeline/inputs/serial-interface). - -| Configuration Option | Description | -| :------------: | ------------ | -| `log path` | Absolute path to the device entry, e.g: `/dev/ttyS0`.| -| `bitrate` | The bitrate for the communication, e.g: 9600, 38400, 115200, etc..| -| `min bytes` | The minimum bytes the serial interface will wait to receive before it begines to process the log message.| -| `separator` | An optional separator string to determine the end of a log message.| -| `format` | Specify the format of the incoming data stream. The only option available is 'json'. Note that Format and Separator cannot be used at the same time.| - -<a name="collector-configuration-mqtt"/> - -### MQTT - -</a> - -This collector will collect MQTT data over a TCP connection, by spawning an MQTT server through Fluent Bit. See also documentation of [Fluent Bit MQTT input plugin](https://docs.fluentbit.io/manual/pipeline/inputs/mqtt). - -| Configuration Option | Description | -| :------------: | ------------ | -| `listen` | Specifies the network interface to bind.| -| `port` | Specifies the port to listen for incoming connections.| -| `topic chart` | Enable chart showing MQTT topic of incoming messages.| - -<a name="custom-charts"/> - -## Custom Charts - -</a> - -In addition to the predefined charts, each log source supports the option to extract -user-defined metrics, by matching log records to [POSIX Extended Regular Expressions](https://en.wikibooks.org/wiki/Regular_Expressions/POSIX-Extended_Regular_Expressions). -This can be very useful particularly for `FLB_TAIL` type log sources, where -there is no parsing at all by default. - -To create a custom chart, the following key-value configuration options must be -added to the respective log source configuration section: - -``` - custom 1 chart = identifier - custom 1 regex name = kernel - custom 1 regex = .*\bkernel\b.* - custom 1 ignore case = no -``` - -where the value denoted by: -- `custom x chart` is the title of the chart. -- `custom x regex name` is an optional name for the dimension of this particular metric (if absent, the regex will be used as the dimension name instead). -- `custom x regex` is the POSIX Extended Regular Expression to be used to match log records. -- `custom x ignore case` is equivalent to setting `REG_ICASE` when using POSIX Extended Regular Expressions for case insensitive searches. It is optional and defaults to `yes`. - -`x` must start from number 1 and monotonically increase by 1 every time a new regular expression is configured. -If the titles of two or more charts of a certain log source are the same, the dimensions will be grouped together -in the same chart, rather than a new chart being created. - -Example of configuration for a generic log source collection with custom regex-based parsers: - -``` -[Auth.log] - ## Example: Log collector that will tail auth.log file and count - ## occurences of certain `sudo` commands, using POSIX regular expressions. - - ## Required settings - enabled = no - log type = flb_tail - - ## Optional settings, common to all log source. - ## Uncomment to override global equivalents in netdata.conf. - # update every = 1 - # update timeout = 10 - # use log timestamp = auto - # circular buffer max size MiB = 64 - # circular buffer drop logs if full = no - # compression acceleration = 1 - # db mode = none - # circular buffer flush to db = 6 - # disk space limit MiB = 500 - - ## This section supports auto-detection of log file path if section name - ## is left unchanged, otherwise it can be set manually, e.g.: - ## log path = /var/log/auth.log - ## See README for more information on 'log path = auto' option - log path = auto - - ## Use inotify instead of file stat watcher. Set to 'no' to reduce CPU usage. - use inotify = yes - - custom 1 chart = sudo and su - custom 1 regex name = sudo - custom 1 regex = \bsudo\b - custom 1 ignore case = yes - - custom 2 chart = sudo and su - # custom 2 regex name = su - custom 2 regex = \bsu\b - custom 2 ignore case = yes - - custom 3 chart = sudo or su - custom 3 regex name = sudo or su - custom 3 regex = \bsudo\b|\bsu\b - custom 3 ignore case = yes -``` - -And the generated charts based on this configuration: - -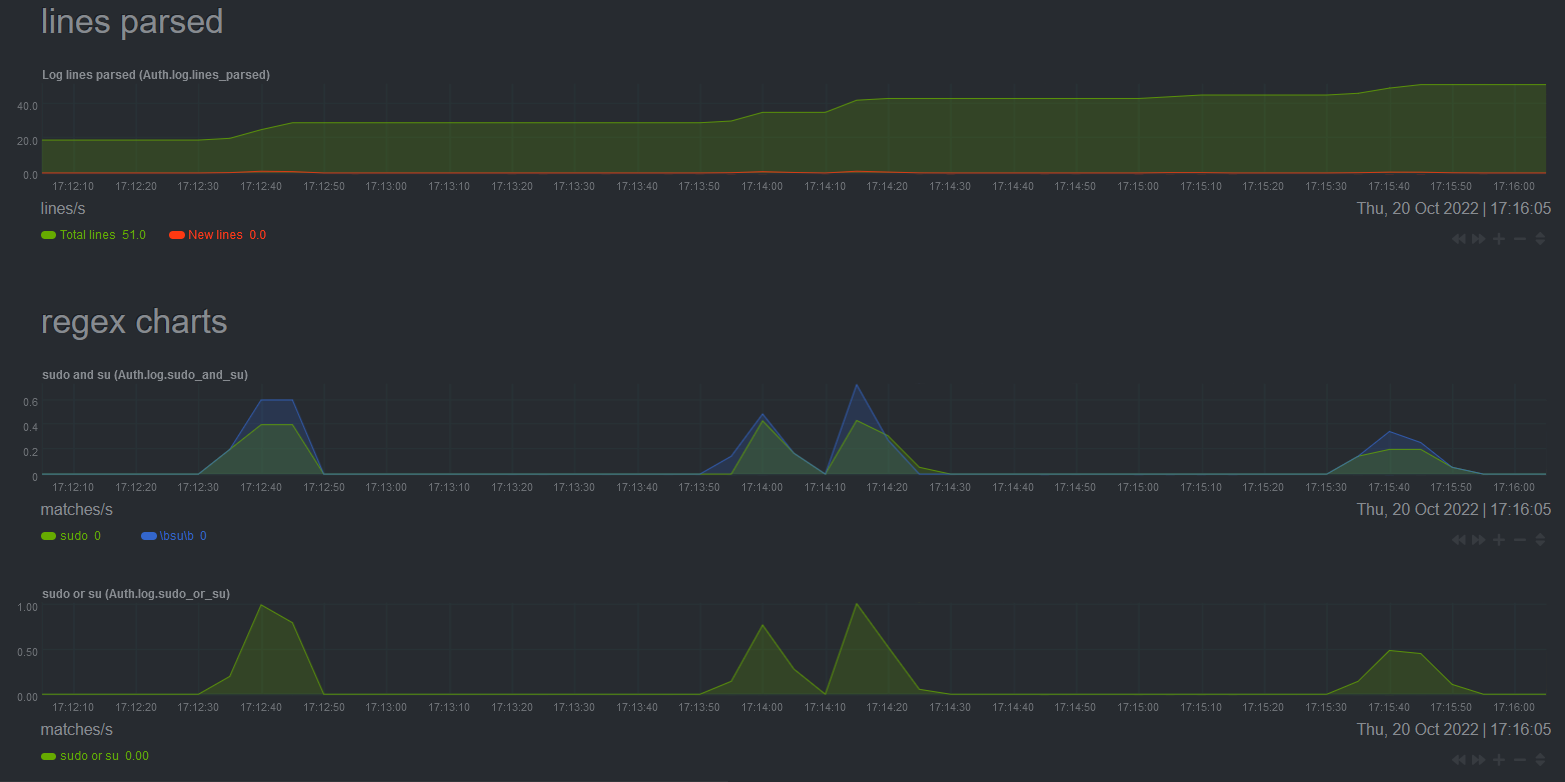 - -<a name="streaming-in"/> - -## Streaming logs to Netdata - -</a> - -Netdata supports 2 incoming streaming configurations: -1. `syslog` messages over Unix or network sockets. -2. Fluent Bit's [Forward protocol](https://docs.fluentbit.io/manual/pipeline/outputs/forward). - -For option 1, please refer to the [syslog collector](#collector-configuration-syslog) section. This section will be focused on using option 2. - -A Netdata agent can be used as a logs aggregation parent to listen to `Forward` messages, using either Unix or network sockets. This option is separate to [Netdata's metrics streaming](/docs/observability-centralization-points/README.md) and can be used independently of whether that's enabled or not (and it uses a different listening socket too). - -This setting can be enabled under the `[forward input]` section in `logsmanagement.d.conf`: - -``` -[forward input] - enable = no - unix path = - unix perm = 0644 - listen = 0.0.0.0 - port = 24224 -``` - -The default settings will listen for incoming `Forward` messages on TCP port 24224. If `unix path` is set to a valid path, `listen` and `port` will be ignored and a unix socket will be created under that path. Make sure that `unix perm` has the correct permissions set for that unix socket. Please also see Fluent Bit's [Forward input plugin documentation](https://docs.fluentbit.io/manual/pipeline/inputs/forward). - -The Netdata agent will now listen for incoming `Forward` messages, but by default it won't process or store them. To do that, there must exist at least one log collection, to define how the incoming logs will be processed and stored. This is similar to configuring a local log source, with the difference that `log source = forward` must be set and also a `stream guid` must be defined, matching that of the children log sources. - -The rest of this section contains some examples on how to configure log collections of different types, using a Netdata parent and Fluent Bit children instances (see also `./edit-config logsmanagement.d/example_forward.conf`). Please use the recommended settings on children instances for parsing on parents to work correctly. Also, note that `Forward` output on children supports optional `gzip` compression, by using the `-p Compress=gzip` configuration parameter, as demonstrated in some of the examples. - -<a name="streaming-systemd"/> - -### Example: Systemd log streaming - -</a> - -Example configuration of an `flb_docker_events` type parent log collection: -``` -[Forward systemd] - - ## Required settings - enabled = yes - log type = flb_systemd - - ## Optional settings, common to all log source. - ## Uncomment to override global equivalents in netdata.conf. - # update every = 1 - # update timeout = 10 - # use log timestamp = auto - # circular buffer max size MiB = 64 - # circular buffer drop logs if full = no - # compression acceleration = 1 - # db mode = none - # circular buffer flush to db = 6 - # disk space limit MiB = 500 - - ## Streaming input settings. - log source = forward - stream guid = 6ce266f5-2704-444d-a301-2423b9d30735 - - ## Other settings specific to this log source type - priority value chart = yes - severity chart = yes - facility chart = yes -``` - -Any children can be configured as follows: -``` -fluent-bit -i systemd -p Read_From_Tail=on -p Strip_Underscores=on -o forward -p Compress=gzip -F record_modifier -p 'Record="stream guid" 6ce266f5-2704-444d-a301-2423b9d30735' -m '*' -``` - -<a name="streaming-kmsg"/> - -### Example: Kernel log streaming - -</a> - -Example configuration of an `flb_kmsg` type parent log collection: -``` -[Forward kmsg] - - ## Required settings - enabled = yes - log type = flb_kmsg - - ## Optional settings, common to all log source. - ## Uncomment to override global equivalents in netdata.conf. - # update every = 1 - # update timeout = 10 - use log timestamp = no - # circular buffer max size MiB = 64 - # circular buffer drop logs if full = no - # compression acceleration = 1 - # db mode = none - # circular buffer flush to db = 6 - # disk space limit MiB = 500 - - ## Streaming input settings. - log source = forward - stream guid = 6ce266f5-2704-444d-a301-2423b9d30736 - - ## Other settings specific to this log source type - severity chart = yes - subsystem chart = yes - device chart = yes -``` -Any children can be configured as follows: -``` -fluent-bit -i kmsg -o forward -p Compress=gzip -F record_modifier -p 'Record="stream guid" 6ce266f5-2704-444d-a301-2423b9d30736' -m '*' -``` - -> **Note** -> Fluent Bit's `kmsg` input plugin will collect all kernel logs since boot every time it's started up. Normally, when configured as a local source in a Netdata agent, all these initially collected logs will be discarded at startup so they are not duplicated. This is not possible when streaming from a Fluent Bit child, so every time a child is restarted, all kernel logs since boot will be re-collected and streamed again. - -<a name="streaming-generic"/> - -### Example: Generic log streaming - -</a> - -This is the most flexible option for a parent log collection, as it allows aggregation of logs from multiple children Fluent Bit instances of different log types. Example configuration of a generic parent log collection with `db mode = full`: - -``` -[Forward collection] - - ## Required settings - enabled = yes - log type = flb_tail - - ## Optional settings, common to all log source. - ## Uncomment to override global equivalents in netdata.conf. - # update every = 1 - # update timeout = 10 - # use log timestamp = auto - # circular buffer max size MiB = 64 - # circular buffer drop logs if full = no - # compression acceleration = 1 - db mode = full - # circular buffer flush to db = 6 - # disk space limit MiB = 500 - - ## Streaming input settings. - log source = forward - stream guid = 6ce266f5-2704-444d-a301-2423b9d30738 -``` - -Children can be configured to `tail` local logs using Fluent Bit and stream them to the parent: -``` -fluent-bit -i tail -p Path=/tmp/test.log -p Inotify_Watcher=true -p Refresh_Interval=1 -p Key=msg -o forward -p Compress=gzip -F record_modifier -p 'Record="stream guid" 6ce266f5-2704-444d-a301-2423b9d30738' -m '*' -``` - -Children instances do not have to use the `tail` input plugin specifically. Any of the supported log types can be used for the streaming child. The following configuration for example can stream `systemd` logs to the same parent as the configuration above: -``` -fluent-bit -i systemd -p Read_From_Tail=on -p Strip_Underscores=on -o forward -p Compress=gzip -F record_modifier -p 'Record="stream guid" 6ce266f5-2704-444d-a301-2423b9d30738' -m '*' -``` - -The caveat is that an `flb_tail` log collection on a parent won't generate any type-specific charts by default, but [custom charts](#custom-charts) can be of course manually added by the user. - -<a name="streaming-docker-events"/> - -### Example: Docker Events log streaming - -</a> - -Example configuration of a `flb_docker_events` type parent log collection: -``` -[Forward Docker Events] - - ## Required settings - enabled = yes - log type = flb_docker_events - - ## Optional settings, common to all log source. - ## Uncomment to override global equivalents in netdata.conf. - # update every = 1 - # update timeout = 10 - # use log timestamp = auto - # circular buffer max size MiB = 64 - # circular buffer drop logs if full = no - # compression acceleration = 1 - # db mode = none - # circular buffer flush to db = 6 - # disk space limit MiB = 500 - - ## Streaming input settings. - log source = forward - stream guid = 6ce266f5-2704-444d-a301-2423b9d30737 - - ## Other settings specific to this log source type - event type chart = yes -``` - -Any children streaming to this collection must be set up to use one of the [default `json` or `docker` parsers](https://github.com/fluent/fluent-bit/blob/master/conf/parsers.conf), to send the collected log as structured messages, so they can be parsed by the parent: - -``` -fluent-bit -R ~/fluent-bit/conf/parsers.conf -i docker_events -p Parser=json -o forward -F record_modifier -p 'Record="stream guid" 6ce266f5-2704-444d-a301-2423b9d30737' -m '*' -``` -or -``` -fluent-bit -R ~/fluent-bit/conf/parsers.conf -i docker_events -p Parser=docker -o forward -F record_modifier -p 'Record="stream guid" 6ce266f5-2704-444d-a301-2423b9d30737' -m '*' -``` - -If instead the user desires to stream to a parent that collects logs into an `flb_tail` log collection, then a parser is not necessary and the unstructured logs can also be streamed in their original JSON format: -``` -fluent-bit -i docker_events -o forward -F record_modifier -p 'Record="stream guid 6ce266f5-2704-444d-a301-2423b9d30737' -m '*' -``` - -Logs will appear in the parent in their unstructured format: - -``` -{"status":"create","id":"de2432a4f00bd26a4899dde5633bb16090a4f367c36f440ebdfdc09020cb462d","from":"hello-world","Type":"container","Action":"create","Actor":{"ID":"de2432a4f00bd26a4899dde5633bb16090a4f367c36f440ebdfdc09020cb462d","Attributes":{"image":"hello-world","name":"lucid_yalow"}},"scope":"local","time":1680263414,"timeNano":1680263414473911042} -``` - -<a name="streaming-out"/> - -## Streaming logs from Netdata (exporting) - -</a> - -Netdata supports real-time log streaming and exporting through any of [Fluent Bit's outgoing streaming configurations](https://docs.fluentbit.io/manual/pipeline/outputs). - -To use any of the outputs, follow Fluent Bit's documentation with the addition of a `output x` prefix to all of the configuration parameters of the output. `x` must start from number 1 and monotonically increase by 1 every time a new output is configured for the log source. - -For example, the following configuration will add 2 outputs to a `docker events` log collector. The first output will stream logs to https://cloud.openobserve.ai/ using Fluent Bit's [http output plugin](https://docs.fluentbit.io/manual/pipeline/outputs/http) and the second one will save the same logs in a file in CSV format, using Fluent Bit's [file output plugin](https://docs.fluentbit.io/manual/pipeline/outputs/file): - -``` -[Docker Events Logs] - ## Example: Log collector that will monitor the Docker daemon socket and - ## collect Docker event logs in a default format similar to executing - ## the `sudo docker events` command. - - ## Required settings - enabled = yes - log type = flb_docker_events - - ## Optional settings, common to all log source. - ## Uncomment to override global equivalents in netdata.conf. - # update every = 1 - # update timeout = 10 - # use log timestamp = auto - # circular buffer max size MiB = 64 - # circular buffer drop logs if full = no - # compression acceleration = 1 - # db mode = none - # circular buffer flush to db = 6 - # disk space limit MiB = 500 - - ## Use default Docker socket UNIX path: /var/run/docker.sock - log path = auto - - ## Charts to enable - # collected logs total chart enable = no - # collected logs rate chart enable = yes - event type chart = yes - event action chart = yes - - ## Stream to https://cloud.openobserve.ai/ - output 1 name = http - output 1 URI = YOUR_API_URI - output 1 Host = api.openobserve.ai - output 1 Port = 443 - output 1 tls = On - output 1 Format = json - output 1 Json_date_key = _timestamp - output 1 Json_date_format = iso8601 - output 1 HTTP_User = test@netdata.cloud - output 1 HTTP_Passwd = YOUR_OPENOBSERVE_PASSWORD - output 1 compress = gzip - - ## Real-time export to /tmp/docker_event_logs.csv - output 2 name = file - output 2 Path = /tmp - output 2 File = docker_event_logs.csv -``` - -</a> - -<a name="troubleshooting"/> - -## Troubleshooting - -</a> - -1. I am building Netdata from source or a Git checkout but the `FLB_SYSTEMD` plugin is not available / does not work: - -If during the Fluent Bit build step you are seeing the following message: -``` --- Could NOT find Journald (missing: JOURNALD_LIBRARY JOURNALD_INCLUDE_DIR) -``` -it means that the systemd development libraries are missing from your system. Please see [how to install them alongside other required packages](/packaging/installer/methods/manual.md). - -2. I am observing very high CPU usage when monitoring a log source using `flb_tail` or `flb_web_log`. - -The log source is probably producing a very high number of unbuffered logs, which results in too many filesystem events. Try setting `use inotify = no` to use file stat watchers instead. - -3. I am using Podman instead of Docker, but I cannot see any Podman events logs being collected. - -Please ensure there is a listening service running that answers API calls for Podman. Instructions on how to start such a service can be found [here](https://docs.podman.io/en/latest/markdown/podman-system-service.1.html). - -Once the service is started, you must updated the Docker events logs collector `log path` to monitor the generated socket (otherwise, it will search for a `dock.sock` by default). - -You must ensure `podman.sock` has the right permissions for Netdata to be able to access it. diff --git a/src/logsmanagement/circular_buffer.c b/src/logsmanagement/circular_buffer.c deleted file mode 100644 index 9e748a30b..000000000 --- a/src/logsmanagement/circular_buffer.c +++ /dev/null @@ -1,404 +0,0 @@ -// SPDX-License-Identifier: GPL-3.0-or-later - -/** @file circular_buffer.c - * @brief This is the implementation of a circular buffer to be used - * for saving collected logs in memory, until they are stored - * into the database. - */ - -#include "circular_buffer.h" -#include "helper.h" -#include "parser.h" - -struct qsort_item { - Circ_buff_item_t *cbi; - struct File_info *pfi; -}; - -static int qsort_timestamp (const void *item_a, const void *item_b) { - return ( (int64_t)((struct qsort_item*)item_a)->cbi->timestamp - - (int64_t)((struct qsort_item*)item_b)->cbi->timestamp); -} - -static int reverse_qsort_timestamp (const void * item_a, const void * item_b) { - return -qsort_timestamp(item_a, item_b); -} - -/** - * @brief Search circular buffers according to the query_params. - * @details If multiple buffers are to be searched, the results will be sorted - * according to timestamps. - * - * Note that buff->tail can only be changed through circ_buff_read_done(), and - * circ_buff_search() and circ_buff_read_done() are mutually exclusive due - * to uv_mutex_lock() and uv_mutex_unlock() in queries and when writing to DB. - * - * @param p_query_params Query parameters to search according to. - * @param p_file_infos File_info structs to be searched. - */ -void circ_buff_search(logs_query_params_t *const p_query_params, struct File_info *const p_file_infos[]) { - - for(int pfi_off = 0; p_file_infos[pfi_off]; pfi_off++) - uv_rwlock_rdlock(&p_file_infos[pfi_off]->circ_buff->buff_realloc_rwlock); - - int buffs_size = 0, - buff_max_num_of_items = 0; - - while(p_file_infos[buffs_size]){ - if(p_file_infos[buffs_size]->circ_buff->num_of_items > buff_max_num_of_items) - buff_max_num_of_items = p_file_infos[buffs_size]->circ_buff->num_of_items; - buffs_size++; - } - - struct qsort_item items[buffs_size * buff_max_num_of_items + 1]; // worst case allocation - - int items_off = 0; - - for(int buff_off = 0; p_file_infos[buff_off]; buff_off++){ - Circ_buff_t *buff = p_file_infos[buff_off]->circ_buff; - /* TODO: The following 3 operations need to be replaced with a struct - * to gurantee atomicity. */ - int head = __atomic_load_n(&buff->head, __ATOMIC_SEQ_CST) % buff->num_of_items; - int tail = __atomic_load_n(&buff->tail, __ATOMIC_SEQ_CST) % buff->num_of_items; - int full = __atomic_load_n(&buff->full, __ATOMIC_SEQ_CST); - - if ((head == tail) && !full) continue; // Nothing to do if buff is empty - - for (int i = tail; i != head; i = (i + 1) % buff->num_of_items){ - items[items_off].cbi = &buff->items[i]; - items[items_off++].pfi = p_file_infos[buff_off]; - } - } - - items[items_off].cbi = NULL; - items[items_off].pfi = NULL; - - if(items[0].cbi) - qsort(items, items_off, sizeof(items[0]), p_query_params->order_by_asc ? qsort_timestamp : reverse_qsort_timestamp); - - - BUFFER *const res_buff = p_query_params->results_buff; - - logs_query_res_hdr_t res_hdr = { // result header - .timestamp = p_query_params->act_to_ts, - .text_size = 0, - .matches = 0, - .log_source = "", - .log_type = "" - }; - - for (int i = 0; items[i].cbi; i++) { - - /* If exceeding quota or timeout is reached and new timestamp is different than previous, - * terminate query but inform caller about act_to_ts to continue from (its next value) in next call. */ - if( (res_buff->len >= p_query_params->quota || terminate_logs_manag_query(p_query_params)) && - items[i].cbi->timestamp != res_hdr.timestamp){ - p_query_params->act_to_ts = res_hdr.timestamp; - break; - } - - res_hdr.timestamp = items[i].cbi->timestamp; - res_hdr.text_size = items[i].cbi->text_size; - strncpyz(res_hdr.log_source, log_src_t_str[items[i].pfi->log_source], sizeof(res_hdr.log_source) - 1); - strncpyz(res_hdr.log_type, log_src_type_t_str[items[i].pfi->log_type], sizeof(res_hdr.log_type) - 1); - strncpyz(res_hdr.basename, items[i].pfi->file_basename, sizeof(res_hdr.basename) - 1); - strncpyz(res_hdr.filename, items[i].pfi->filename, sizeof(res_hdr.filename) - 1); - strncpyz(res_hdr.chartname, items[i].pfi->chartname, sizeof(res_hdr.chartname) - 1); - - if (p_query_params->order_by_asc ? - ( res_hdr.timestamp >= p_query_params->req_from_ts && res_hdr.timestamp <= p_query_params->req_to_ts ) : - ( res_hdr.timestamp >= p_query_params->req_to_ts && res_hdr.timestamp <= p_query_params->req_from_ts) ){ - - /* In case of search_keyword, less than sizeof(res_hdr) + temp_msg.text_size - * space is required, but go for worst case scenario for now */ - buffer_increase(res_buff, sizeof(res_hdr) + res_hdr.text_size); - - if(!p_query_params->keyword || !*p_query_params->keyword || !strcmp(p_query_params->keyword, " ")){ - /* NOTE: relying on items[i]->cbi->num_lines to get number of log lines - * might not be 100% correct, since parsing must have taken place - * already to return correct count. Maybe an issue under heavy load. */ - res_hdr.matches = items[i].cbi->num_lines; - memcpy(&res_buff->buffer[res_buff->len + sizeof(res_hdr)], items[i].cbi->data, res_hdr.text_size); - } - else { - res_hdr.matches = search_keyword( items[i].cbi->data, res_hdr.text_size, - &res_buff->buffer[res_buff->len + sizeof(res_hdr)], - &res_hdr.text_size, p_query_params->keyword, NULL, - p_query_params->ignore_case); - - m_assert( (res_hdr.matches > 0 && res_hdr.text_size > 0) || - (res_hdr.matches == 0 && res_hdr.text_size == 0), - "res_hdr.matches and res_hdr.text_size must both be > 0 or == 0."); - - if(unlikely(res_hdr.matches < 0)) - break; /* res_hdr.matches < 0 - error during keyword search */ - } - - if(res_hdr.text_size){ - res_buff->buffer[res_buff->len + sizeof(res_hdr) + res_hdr.text_size - 1] = '\n'; // replace '\0' with '\n' - memcpy(&res_buff->buffer[res_buff->len], &res_hdr, sizeof(res_hdr)); - res_buff->len += sizeof(res_hdr) + res_hdr.text_size; - p_query_params->num_lines += res_hdr.matches; - } - - m_assert(TEST_MS_TIMESTAMP_VALID(res_hdr.timestamp), "res_hdr.timestamp is invalid"); - } - } - - for(int pfi_off = 0; p_file_infos[pfi_off]; pfi_off++) - uv_rwlock_rdunlock(&p_file_infos[pfi_off]->circ_buff->buff_realloc_rwlock); -} - -/** - * @brief Query circular buffer if there is space for item insertion. - * @param buff Circular buffer to query for available space. - * @param requested_text_space Size of raw (uncompressed) space needed. - * @note If buff->allow_dropped_logs is 0, then this function will block and - * it will only return once there is available space as requested. In this - * case, it will never return 0. - * @return \p requested_text_space if there is enough space, else 0. - */ -size_t circ_buff_prepare_write(Circ_buff_t *const buff, size_t const requested_text_space){ - - /* Calculate how much is the maximum compressed space that will - * be required on top of the requested space for the raw data. */ - buff->in->text_compressed_size = (size_t) LZ4_compressBound(requested_text_space); - m_assert(buff->in->text_compressed_size != 0, "requested text compressed space is zero"); - size_t const required_space = requested_text_space + buff->in->text_compressed_size; - - size_t available_text_space = 0; - size_t total_cached_mem_ex_in; - -try_to_acquire_space: - total_cached_mem_ex_in = 0; - for (int i = 0; i < buff->num_of_items; i++){ - total_cached_mem_ex_in += buff->items[i].data_max_size; - } - - /* If the required space is more than the allocated space of the input - * buffer, then we need to check if the input buffer can be reallocated: - * - * a) If the total memory consumption of the circular buffer plus the - * required space is less than the limit set by "circular buffer max size" - * for this log source, then the input buffer can be reallocated. - * - * b) If the total memory consumption of the circular buffer plus the - * required space is more than the limit set by "circular buffer max size" - * for this log source, we will attempt to reclaim some of the circular - * buffer allocated memory from any empty items. - * - * c) If after reclaiming the total memory consumption is still beyond the - * configuration limit, either 0 will be returned as the available space - * for raw logs in the input buffer, or the function will block and repeat - * the same process, until there is available space to be returned, depending - * of the configuration value of buff->allow_dropped_logs. - * */ - if(required_space > buff->in->data_max_size) { - if(likely(total_cached_mem_ex_in + required_space <= buff->total_cached_mem_max)){ - buff->in->data_max_size = required_space; - buff->in->data = reallocz(buff->in->data, buff->in->data_max_size); - - available_text_space = requested_text_space; - } - else if(likely(__atomic_load_n(&buff->full, __ATOMIC_SEQ_CST) == 0)){ - int head = __atomic_load_n(&buff->head, __ATOMIC_SEQ_CST) % buff->num_of_items; - int tail = __atomic_load_n(&buff->tail, __ATOMIC_SEQ_CST) % buff->num_of_items; - - for (int i = (head == tail ? (head + 1) % buff->num_of_items : head); - i != tail; i = (i + 1) % buff->num_of_items) { - - m_assert(i <= buff->num_of_items, "i > buff->num_of_items"); - buff->items[i].data_max_size = 1; - buff->items[i].data = reallocz(buff->items[i].data, buff->items[i].data_max_size); - } - - total_cached_mem_ex_in = 0; - for (int i = 0; i < buff->num_of_items; i++){ - total_cached_mem_ex_in += buff->items[i].data_max_size; - } - - if(total_cached_mem_ex_in + required_space <= buff->total_cached_mem_max){ - buff->in->data_max_size = required_space; - buff->in->data = reallocz(buff->in->data, buff->in->data_max_size); - - available_text_space = requested_text_space; - } - else available_text_space = 0; - } - } else available_text_space = requested_text_space; - - __atomic_store_n(&buff->total_cached_mem, total_cached_mem_ex_in + buff->in->data_max_size, __ATOMIC_RELAXED); - - if(unlikely(!buff->allow_dropped_logs && !available_text_space)){ - sleep_usec(CIRC_BUFF_PREP_WR_RETRY_AFTER_MS * USEC_PER_MS); - goto try_to_acquire_space; - } - - m_assert(available_text_space || buff->allow_dropped_logs, "!available_text_space == 0 && !buff->allow_dropped_logs"); - return available_text_space; -} - -/** - * @brief Insert item from temporary input buffer to circular buffer. - * @param buff Circular buffer to insert the item into - * @return 0 in case of success or -1 in case there was an error (e.g. buff - * is out of space). - */ -int circ_buff_insert(Circ_buff_t *const buff){ - - // TODO: Probably can be changed to __ATOMIC_RELAXED, but ideally a mutex should be used here. - int head = __atomic_load_n(&buff->head, __ATOMIC_SEQ_CST) % buff->num_of_items; - int tail = __atomic_load_n(&buff->tail, __ATOMIC_SEQ_CST) % buff->num_of_items; - int full = __atomic_load_n(&buff->full, __ATOMIC_SEQ_CST); - - /* If circular buffer does not have any free items, it will be expanded - * by reallocating the `items` array and adding one more item. */ - if (unlikely(( head == tail ) && full )) { - debug_log( "buff out of space! will be expanded."); - uv_rwlock_wrlock(&buff->buff_realloc_rwlock); - - - Circ_buff_item_t *items_new = callocz(buff->num_of_items + 1, sizeof(Circ_buff_item_t)); - - for(int i = 0; i < buff->num_of_items; i++){ - Circ_buff_item_t *item_old = &buff->items[head++ % buff->num_of_items]; - items_new[i] = *item_old; - } - freez(buff->items); - buff->items = items_new; - - buff->parse = buff->parse - buff->tail; - head = buff->head = buff->num_of_items++; - buff->tail = buff->read = 0; - buff->full = 0; - - __atomic_add_fetch(&buff->buff_realloc_cnt, 1, __ATOMIC_RELAXED); - - uv_rwlock_wrunlock(&buff->buff_realloc_rwlock); - } - - Circ_buff_item_t *cur_item = &buff->items[head]; - - char *tmp_data = cur_item->data; - size_t tmp_data_max_size = cur_item->data_max_size; - - cur_item->status = buff->in->status; - cur_item->timestamp = buff->in->timestamp; - cur_item->data = buff->in->data; - cur_item->text_size = buff->in->text_size; - cur_item->text_compressed = buff->in->text_compressed; - cur_item->text_compressed_size = buff->in->text_compressed_size; - cur_item->data_max_size = buff->in->data_max_size; - cur_item->num_lines = buff->in->num_lines; - - buff->in->status = CIRC_BUFF_ITEM_STATUS_UNPROCESSED; - buff->in->timestamp = 0; - buff->in->data = tmp_data; - buff->in->text_size = 0; - // buff->in->text_compressed = tmp_data; - buff->in->text_compressed_size = 0; - buff->in->data_max_size = tmp_data_max_size; - buff->in->num_lines = 0; - - __atomic_add_fetch(&buff->text_size_total, cur_item->text_size, __ATOMIC_SEQ_CST); - - if( __atomic_add_fetch(&buff->text_compressed_size_total, cur_item->text_compressed_size, __ATOMIC_SEQ_CST)){ - __atomic_store_n(&buff->compression_ratio, - __atomic_load_n(&buff->text_size_total, __ATOMIC_SEQ_CST) / - __atomic_load_n(&buff->text_compressed_size_total, __ATOMIC_SEQ_CST), - __ATOMIC_SEQ_CST); - } else __atomic_store_n( &buff->compression_ratio, 0, __ATOMIC_SEQ_CST); - - - if(unlikely(__atomic_add_fetch(&buff->head, 1, __ATOMIC_SEQ_CST) % buff->num_of_items == - __atomic_load_n(&buff->tail, __ATOMIC_SEQ_CST) % buff->num_of_items)){ - __atomic_store_n(&buff->full, 1, __ATOMIC_SEQ_CST); - } - - __atomic_or_fetch(&cur_item->status, CIRC_BUFF_ITEM_STATUS_PARSED | CIRC_BUFF_ITEM_STATUS_STREAMED, __ATOMIC_SEQ_CST); - - return 0; -} - -/** - * @brief Return pointer to next item to be read from the circular buffer. - * @param buff Circular buffer to get next item from. - * @return Pointer to the next circular buffer item to be read, or NULL - * if there are no more items to be read. - */ -Circ_buff_item_t *circ_buff_read_item(Circ_buff_t *const buff) { - - Circ_buff_item_t *item = &buff->items[buff->read % buff->num_of_items]; - - m_assert(__atomic_load_n(&item->status, __ATOMIC_RELAXED) <= CIRC_BUFF_ITEM_STATUS_DONE, "Invalid status"); - - if( /* No more records to be retrieved from the buffer - pay attention that - * there is no `% buff->num_of_items` operation, as we need to check - * the case where buff->read is exactly equal to buff->head. */ - (buff->read == (__atomic_load_n(&buff->head, __ATOMIC_SEQ_CST))) || - /* Current item either not parsed or streamed */ - (__atomic_load_n(&item->status, __ATOMIC_RELAXED) != CIRC_BUFF_ITEM_STATUS_DONE) ){ - - return NULL; - } - - __atomic_sub_fetch(&buff->text_size_total, item->text_size, __ATOMIC_SEQ_CST); - - if( __atomic_sub_fetch(&buff->text_compressed_size_total, item->text_compressed_size, __ATOMIC_SEQ_CST)){ - __atomic_store_n(&buff->compression_ratio, - __atomic_load_n(&buff->text_size_total, __ATOMIC_SEQ_CST) / - __atomic_load_n(&buff->text_compressed_size_total, __ATOMIC_SEQ_CST), - __ATOMIC_SEQ_CST); - } else __atomic_store_n( &buff->compression_ratio, 0, __ATOMIC_SEQ_CST); - - buff->read++; - - return item; -} - -/** - * @brief Complete buffer read process. - * @param buff Circular buffer to complete read process on. - */ -void circ_buff_read_done(Circ_buff_t *const buff){ - /* Even if one item was read, it means buffer cannot be full anymore */ - if(__atomic_load_n(&buff->tail, __ATOMIC_RELAXED) != buff->read) - __atomic_store_n(&buff->full, 0, __ATOMIC_SEQ_CST); - - __atomic_store_n(&buff->tail, buff->read, __ATOMIC_SEQ_CST); -} - -/** - * @brief Create a new circular buffer. - * @param num_of_items Number of Circ_buff_item_t items in the buffer. - * @param max_size Maximum memory the circular buffer can occupy. - * @param allow_dropped_logs Maximum memory the circular buffer can occupy. - * @return Pointer to the new circular buffer structure. - */ -Circ_buff_t *circ_buff_init(const int num_of_items, - const size_t max_size, - const int allow_dropped_logs ) { - Circ_buff_t *buff = callocz(1, sizeof(Circ_buff_t)); - buff->num_of_items = num_of_items; - buff->items = callocz(buff->num_of_items, sizeof(Circ_buff_item_t)); - buff->in = callocz(1, sizeof(Circ_buff_item_t)); - - uv_rwlock_init(&buff->buff_realloc_rwlock); - - buff->total_cached_mem_max = max_size; - buff->allow_dropped_logs = allow_dropped_logs; - - return buff; -} - -/** - * @brief Destroy a circular buffer. - * @param buff Circular buffer to be destroyed. - */ -void circ_buff_destroy(Circ_buff_t *buff){ - for (int i = 0; i < buff->num_of_items; i++) freez(buff->items[i].data); - freez(buff->items); - freez(buff->in->data); - freez(buff->in); - freez(buff); -} diff --git a/src/logsmanagement/circular_buffer.h b/src/logsmanagement/circular_buffer.h deleted file mode 100644 index 92697824b..000000000 --- a/src/logsmanagement/circular_buffer.h +++ /dev/null @@ -1,66 +0,0 @@ -// SPDX-License-Identifier: GPL-3.0-or-later - -/** @file circular_buffer.h - * @brief Header of circular_buffer.c - */ - -#ifndef CIRCULAR_BUFFER_H_ -#define CIRCULAR_BUFFER_H_ - -#include <stdio.h> -#include <stdlib.h> -#include <string.h> -#include <uv.h> -#include "defaults.h" -#include "query.h" -#include "file_info.h" - -// Forward declaration to break circular dependency -struct File_info; - -typedef enum { - CIRC_BUFF_ITEM_STATUS_UNPROCESSED = 0, - CIRC_BUFF_ITEM_STATUS_PARSED = 1, - CIRC_BUFF_ITEM_STATUS_STREAMED = 2, - CIRC_BUFF_ITEM_STATUS_DONE = 3 // == CIRC_BUFF_ITEM_STATUS_PARSED | CIRC_BUFF_ITEM_STATUS_STREAMED -} circ_buff_item_status_t; - -typedef struct Circ_buff_item { - circ_buff_item_status_t status; /**< Denotes if item is unprocessed, in processing or processed **/ - msec_t timestamp; /**< Epoch datetime of when data was collected **/ - char *data; /**< Base of buffer to store both uncompressed and compressed logs **/ - size_t text_size; /**< Size of uncompressed logs **/ - char *text_compressed; /**< Pointer offset within *data that points to start of compressed logs **/ - size_t text_compressed_size; /**< Size of compressed logs **/ - size_t data_max_size; /**< Allocated size of *data **/ - unsigned long num_lines; /**< Number of log records in item */ -} Circ_buff_item_t; - -typedef struct Circ_buff { - int num_of_items; /**< Number of preallocated items in the buffer **/ - Circ_buff_item_t *items; /**< Array of all circular buffer items **/ - Circ_buff_item_t *in; /**< Circular buffer item to write new data into **/ - int head; /**< Position of next item insertion **/ - int read; /**< Index between tail and head, used to read items out of Circ_buff **/ - int tail; /**< Last valid item in Circ_buff **/ - int parse; /**< Points to next item in buffer to be parsed **/ - int full; /**< When head == tail, this indicates if buffer is full or empty **/ - uv_rwlock_t buff_realloc_rwlock; /**< RW lock to lock buffer operations when reallocating or expanding buffer **/ - unsigned int buff_realloc_cnt; /**< Counter of how any buffer reallocations have occurred **/ - size_t total_cached_mem; /**< Total memory allocated for Circ_buff (excluding *in) **/ - size_t total_cached_mem_max; /**< Maximum allowable size for total_cached_mem **/ - int allow_dropped_logs; /**< Boolean to indicate whether logs are allowed to be dropped if buffer is full */ - size_t text_size_total; /**< Total size of items[]->text_size **/ - size_t text_compressed_size_total; /**< Total size of items[]->text_compressed_size **/ - int compression_ratio; /**< text_size_total / text_compressed_size_total **/ -} Circ_buff_t; - -void circ_buff_search(logs_query_params_t *const p_query_params, struct File_info *const p_file_infos[]); -size_t circ_buff_prepare_write(Circ_buff_t *const buff, size_t const requested_text_space); -int circ_buff_insert(Circ_buff_t *const buff); -Circ_buff_item_t *circ_buff_read_item(Circ_buff_t *const buff); -void circ_buff_read_done(Circ_buff_t *const buff); -Circ_buff_t *circ_buff_init(const int num_of_items, const size_t max_size, const int allow_dropped_logs); -void circ_buff_destroy(Circ_buff_t *buff); - -#endif // CIRCULAR_BUFFER_H_ diff --git a/src/logsmanagement/db_api.c b/src/logsmanagement/db_api.c deleted file mode 100644 index a3489b2df..000000000 --- a/src/logsmanagement/db_api.c +++ /dev/null @@ -1,1396 +0,0 @@ -// SPDX-License-Identifier: GPL-3.0-or-later - - -/** @file db_api.c - * @brief This is the file implementing the API to the - * logs management database. - */ - -#include "daemon/common.h" -#include "db_api.h" -#include <inttypes.h> -#include <stdio.h> -#include "circular_buffer.h" -#include "helper.h" -#include "lz4.h" -#include "parser.h" - -#define MAIN_DB "main.db" /**< Primary DB with metadata for all the logs managemt collections **/ -#define MAIN_COLLECTIONS_TABLE "LogCollections" /*< Table name where logs collections metadata is stored in MAIN_DB **/ -#define BLOB_STORE_FILENAME "logs.bin." /*< Filename of BLOBs where logs are stored in **/ -#define METADATA_DB_FILENAME "metadata.db" /**< Metadata DB for each log collection **/ -#define LOGS_TABLE "Logs" /*< Table name where logs metadata is stored in METADATA_DB_FILENAME **/ -#define BLOBS_TABLE "Blobs" /*< Table name where BLOBs metadata is stored in METADATA_DB_FILENAME **/ - -#define LOGS_MANAG_DB_VERSION 1 - -static sqlite3 *main_db = NULL; /**< SQLite DB handler for MAIN_DB **/ -static char *main_db_dir = NULL; /**< Directory where all the log management databases and log blobs are stored in **/ -static char *main_db_path = NULL; /**< Path of MAIN_DB **/ - -/* -------------------------------------------------------------------------- */ -/* Database migrations */ -/* -------------------------------------------------------------------------- */ - -/** - * @brief No-op database migration, just to bump up starting version. - * @param database Unused - * @param name Unused - * @return Always 0. - */ -static int do_migration_noop(sqlite3 *database, const char *name){ - UNUSED(database); - UNUSED(name); - collector_info("Running database migration %s", name); - return 0; -} - -typedef struct database_func_migration_list{ - char *name; - int (*func)(sqlite3 *database, const char *name); -} DATABASE_FUNC_MIGRATION_LIST; - -DATABASE_FUNC_MIGRATION_LIST migration_list_main_db[] = { - {.name = MAIN_DB" v0 to v1", .func = do_migration_noop}, - // the terminator of this array - {.name = NULL, .func = NULL} -}; - -DATABASE_FUNC_MIGRATION_LIST migration_list_metadata_db[] = { - {.name = METADATA_DB_FILENAME " v0 to v1", .func = do_migration_noop}, - // the terminator of this array - {.name = NULL, .func = NULL} -}; - -typedef enum { - ERR_TYPE_OTHER, - ERR_TYPE_SQLITE, - ERR_TYPE_LIBUV, -} logs_manag_db_error_t; - -/** - * @brief Logs a database error - * @param[in] log_source Log source that caused the error - * @param[in] error_type Type of error - * @param[in] rc Error code - * @param[in] line Line number where the error occurred (__LINE__) - * @param[in] file Source file where the error occurred (__FILE__) - * @param[in] func Function where the error occurred (__FUNCTION__) - */ -static void throw_error(const char *const log_source, - const logs_manag_db_error_t error_type, - const int rc, const int line, - const char *const file, const char *const func){ - collector_error("[%s]: %s database error: (%d) %s (%s:%s:%d))", - log_source ? log_source : "-", - error_type == ERR_TYPE_OTHER ? "" : ERR_TYPE_SQLITE ? "SQLite" : "libuv", - rc, error_type == ERR_TYPE_OTHER ? "" : ERR_TYPE_SQLITE ? sqlite3_errstr(rc) : uv_strerror(rc), - file, func, line); -} - -/** - * @brief Get or set user_version of database. - * @param db SQLite database to act upon. - * @param set_user_version If <= 0, just get user_version. Otherwise, set - * user_version first, before returning it. - * @return Database user_version or -1 in case of error. - */ -int db_user_version(sqlite3 *const db, const int set_user_version){ - if(unlikely(!db)) return -1; - int rc = 0; - if(set_user_version <= 0){ - sqlite3_stmt *stmt_get_user_version; - rc = sqlite3_prepare_v2(db, "PRAGMA user_version;", -1, &stmt_get_user_version, NULL); - if (unlikely(SQLITE_OK != rc)) { - throw_error(NULL, ERR_TYPE_SQLITE, rc, __LINE__, __FILE__, __FUNCTION__); - return -1; - } - rc = sqlite3_step(stmt_get_user_version); - if (unlikely(SQLITE_ROW != rc)) { - throw_error(NULL, ERR_TYPE_SQLITE, rc, __LINE__, __FILE__, __FUNCTION__); - return -1; - } - int current_user_version = sqlite3_column_int(stmt_get_user_version, 0); - rc = sqlite3_finalize(stmt_get_user_version); - if (unlikely(SQLITE_OK != rc)) { - throw_error(NULL, ERR_TYPE_SQLITE, rc, __LINE__, __FILE__, __FUNCTION__); - return -1; - } - return current_user_version; - } else { - char buf[25]; - snprintfz(buf, 25, "PRAGMA user_version=%d;", set_user_version); - rc = sqlite3_exec(db, buf, NULL, NULL, NULL); - if (unlikely(SQLITE_OK!= rc)) { - throw_error(NULL, ERR_TYPE_SQLITE, rc, __LINE__, __FILE__, __FUNCTION__); - return -1; - } - return set_user_version; - } -} - -static void db_writer_db_mode_none(void *arg){ - struct File_info *const p_file_info = (struct File_info *) arg; - Circ_buff_item_t *item; - - while(__atomic_load_n(&p_file_info->state, __ATOMIC_RELAXED) == LOG_SRC_READY){ - uv_rwlock_rdlock(&p_file_info->circ_buff->buff_realloc_rwlock); - do{ item = circ_buff_read_item(p_file_info->circ_buff);} while(item); - circ_buff_read_done(p_file_info->circ_buff); - uv_rwlock_rdunlock(&p_file_info->circ_buff->buff_realloc_rwlock); - for(int i = 0; i < p_file_info->buff_flush_to_db_interval * 4; i++){ - if(__atomic_load_n(&p_file_info->state, __ATOMIC_RELAXED) != LOG_SRC_READY) - break; - sleep_usec(250 * USEC_PER_MS); - } - } -} - -#define return_db_writer_db_mode_none(p_file_info, do_mut_unlock) do { \ - p_file_info->db_mode = LOGS_MANAG_DB_MODE_NONE; \ - freez((void *) p_file_info->db_dir); \ - p_file_info->db_dir = strdupz(""); \ - freez((void *) p_file_info->db_metadata); \ - p_file_info->db_metadata = NULL; \ - sqlite3_finalize(stmt_logs_insert); \ - sqlite3_finalize(stmt_blobs_get_total_filesize); \ - sqlite3_finalize(stmt_blobs_update); \ - sqlite3_finalize(stmt_blobs_set_zero_filesize); \ - sqlite3_finalize(stmt_logs_delete); \ - if(do_mut_unlock){ \ - uv_mutex_unlock(p_file_info->db_mut); \ - uv_rwlock_rdunlock(&p_file_info->circ_buff->buff_realloc_rwlock); \ - } \ - if(__atomic_load_n(&p_file_info->state, __ATOMIC_RELAXED) == LOG_SRC_READY) \ - return fatal_assert(!uv_thread_create( p_file_info->db_writer_thread, \ - db_writer_db_mode_none, \ - p_file_info)); \ -} while(0) - -static void db_writer_db_mode_full(void *arg){ - int rc = 0; - struct File_info *const p_file_info = (struct File_info *) arg; - - sqlite3_stmt *stmt_logs_insert = NULL; - sqlite3_stmt *stmt_blobs_get_total_filesize = NULL; - sqlite3_stmt *stmt_blobs_update = NULL; - sqlite3_stmt *stmt_blobs_set_zero_filesize = NULL; - sqlite3_stmt *stmt_logs_delete = NULL; - - /* Prepare LOGS_TABLE INSERT statement */ - rc = sqlite3_prepare_v2(p_file_info->db, - "INSERT INTO " LOGS_TABLE "(" - "FK_BLOB_Id," - "BLOB_Offset," - "Timestamp," - "Msg_compr_size," - "Msg_decompr_size," - "Num_lines" - ") VALUES (?,?,?,?,?,?) ;", - -1, &stmt_logs_insert, NULL); - if (unlikely(SQLITE_OK != rc)) { - throw_error(p_file_info->chartname, ERR_TYPE_SQLITE, rc, __LINE__, __FILE__, __FUNCTION__); - return_db_writer_db_mode_none(p_file_info, 0); - } - - /* Prepare BLOBS_TABLE get total filesize statement */ - rc = sqlite3_prepare_v2(p_file_info->db, - "SELECT SUM(Filesize) FROM " BLOBS_TABLE " ;", - -1, &stmt_blobs_get_total_filesize, NULL); - if (unlikely(SQLITE_OK != rc)) { - throw_error(p_file_info->chartname, ERR_TYPE_SQLITE, rc, __LINE__, __FILE__, __FUNCTION__); - return_db_writer_db_mode_none(p_file_info, 0); - } - - /* Prepare BLOBS_TABLE UPDATE statement */ - rc = sqlite3_prepare_v2(p_file_info->db, - "UPDATE " BLOBS_TABLE - " SET Filesize = Filesize + ?" - " WHERE Id = ? ;", - -1, &stmt_blobs_update, NULL); - if (unlikely(SQLITE_OK != rc)) { - throw_error(p_file_info->chartname, ERR_TYPE_SQLITE, rc, __LINE__, __FILE__, __FUNCTION__); - return_db_writer_db_mode_none(p_file_info, 0); - } - - /* Prepare BLOBS_TABLE UPDATE SET zero filesize statement */ - rc = sqlite3_prepare_v2(p_file_info->db, - "UPDATE " BLOBS_TABLE - " SET Filesize = 0" - " WHERE Id = ? ;", - -1, &stmt_blobs_set_zero_filesize, NULL); - if (unlikely(SQLITE_OK != rc)) { - throw_error(p_file_info->chartname, ERR_TYPE_SQLITE, rc, __LINE__, __FILE__, __FUNCTION__); - return_db_writer_db_mode_none(p_file_info, 0); - } - - /* Prepare LOGS_TABLE DELETE statement */ - rc = sqlite3_prepare_v2(p_file_info->db, - "DELETE FROM " LOGS_TABLE - " WHERE FK_BLOB_Id = ? ;", - -1, &stmt_logs_delete, NULL); - if (unlikely(SQLITE_OK != rc)) { - throw_error(p_file_info->chartname, ERR_TYPE_SQLITE, rc, __LINE__, __FILE__, __FUNCTION__); - return_db_writer_db_mode_none(p_file_info, 0); - } - - /* Get initial filesize of logs.bin.0 BLOB */ - sqlite3_stmt *stmt_retrieve_filesize_from_id = NULL; - if(unlikely( - SQLITE_OK != (rc = sqlite3_prepare_v2(p_file_info->db, - "SELECT Filesize FROM " BLOBS_TABLE - " WHERE Id = ? ;", - -1, &stmt_retrieve_filesize_from_id, NULL)) || - SQLITE_OK != (rc = sqlite3_bind_int(stmt_retrieve_filesize_from_id, 1, - p_file_info->blob_write_handle_offset)) || - SQLITE_ROW != (rc = sqlite3_step(stmt_retrieve_filesize_from_id)) - )){ - throw_error(p_file_info->chartname, ERR_TYPE_SQLITE, rc, __LINE__, __FILE__, __FUNCTION__); - return_db_writer_db_mode_none(p_file_info, 0); - } - int64_t blob_filesize = (int64_t) sqlite3_column_int64(stmt_retrieve_filesize_from_id, 0); - rc = sqlite3_finalize(stmt_retrieve_filesize_from_id); - if (unlikely(SQLITE_OK != rc)) { - throw_error(p_file_info->chartname, ERR_TYPE_SQLITE, rc, __LINE__, __FILE__, __FUNCTION__); - return_db_writer_db_mode_none(p_file_info, 0); - } - - struct timespec ts_db_write_start, ts_db_write_end, ts_db_rotate_end; - while(__atomic_load_n(&p_file_info->state, __ATOMIC_RELAXED) == LOG_SRC_READY){ - clock_gettime(CLOCK_THREAD_CPUTIME_ID, &ts_db_write_start); - - uv_rwlock_rdlock(&p_file_info->circ_buff->buff_realloc_rwlock); - uv_mutex_lock(p_file_info->db_mut); - - /* --------------------------------------------------------------------- - * Read items from circular buffer and store them in disk BLOBs. - * After that, SQLite metadata is updated. - * ------------------------------------------------------------------ */ - Circ_buff_item_t *item = circ_buff_read_item(p_file_info->circ_buff); - while (item) { - m_assert(TEST_MS_TIMESTAMP_VALID(item->timestamp), "item->timestamp == 0"); - m_assert(item->text_compressed_size != 0, "item->text_compressed_size == 0"); - m_assert(item->text_size != 0, "item->text_size == 0"); - - /* Write logs in BLOB */ - uv_fs_t write_req; - uv_buf_t uv_buf = uv_buf_init((char *) item->text_compressed, (unsigned int) item->text_compressed_size); - rc = uv_fs_write( NULL, &write_req, - p_file_info->blob_handles[p_file_info->blob_write_handle_offset], - &uv_buf, 1, blob_filesize, NULL); // Write synchronously at the end of the BLOB file - uv_fs_req_cleanup(&write_req); - if(unlikely(rc < 0)){ - throw_error(p_file_info->chartname, ERR_TYPE_LIBUV, rc, __LINE__, __FILE__, __FUNCTION__); - circ_buff_read_done(p_file_info->circ_buff); - return_db_writer_db_mode_none(p_file_info, 1); - } - - /* Ensure data is flushed to BLOB via fdatasync() */ - uv_fs_t dsync_req; - rc = uv_fs_fdatasync( NULL, &dsync_req, - p_file_info->blob_handles[p_file_info->blob_write_handle_offset], NULL); - uv_fs_req_cleanup(&dsync_req); - if (unlikely(rc)){ - throw_error(p_file_info->chartname, ERR_TYPE_LIBUV, rc, __LINE__, __FILE__, __FUNCTION__); - circ_buff_read_done(p_file_info->circ_buff); - return_db_writer_db_mode_none(p_file_info, 1); - } - - if(unlikely( - /* Write metadata of logs in LOGS_TABLE */ - SQLITE_OK != (rc = sqlite3_exec(p_file_info->db, "BEGIN TRANSACTION;", NULL, NULL, NULL)) || - SQLITE_OK != (rc = sqlite3_bind_int(stmt_logs_insert, 1, p_file_info->blob_write_handle_offset)) || - SQLITE_OK != (rc = sqlite3_bind_int64(stmt_logs_insert, 2, (sqlite3_int64) blob_filesize)) || - SQLITE_OK != (rc = sqlite3_bind_int64(stmt_logs_insert, 3, (sqlite3_int64) item->timestamp)) || - SQLITE_OK != (rc = sqlite3_bind_int64(stmt_logs_insert, 4, (sqlite3_int64) item->text_compressed_size)) || - SQLITE_OK != (rc = sqlite3_bind_int64(stmt_logs_insert, 5, (sqlite3_int64)item->text_size)) || - SQLITE_OK != (rc = sqlite3_bind_int64(stmt_logs_insert, 6, (sqlite3_int64)item->num_lines)) || - SQLITE_DONE != (rc = sqlite3_step(stmt_logs_insert)) || - SQLITE_OK != (rc = sqlite3_reset(stmt_logs_insert)) || - - /* Update metadata of BLOBs filesize in BLOBS_TABLE */ - SQLITE_OK != (rc = sqlite3_bind_int64(stmt_blobs_update, 1, (sqlite3_int64)item->text_compressed_size)) || - SQLITE_OK != (rc = sqlite3_bind_int(stmt_blobs_update, 2, p_file_info->blob_write_handle_offset)) || - SQLITE_DONE != (rc = sqlite3_step(stmt_blobs_update)) || - SQLITE_OK != (rc = sqlite3_reset(stmt_blobs_update)) || - SQLITE_OK != (rc = sqlite3_exec(p_file_info->db, "END TRANSACTION;", NULL, NULL, NULL)) - )) { - throw_error(p_file_info->chartname, ERR_TYPE_SQLITE, rc, __LINE__, __FILE__, __FUNCTION__); - rc = sqlite3_exec(p_file_info->db, "ROLLBACK;", NULL, NULL, NULL); - if (unlikely(SQLITE_OK != rc)) - throw_error(p_file_info->chartname, ERR_TYPE_SQLITE, rc, __LINE__, __FILE__, __FUNCTION__); - circ_buff_read_done(p_file_info->circ_buff); - return_db_writer_db_mode_none(p_file_info, 1); - } - - /* TODO: Should we log it if there is a fatal error in the transaction, - * as there will be a mismatch between BLOBs and SQLite metadata? */ - - /* Increase BLOB offset and read next log message until no more messages in buff */ - blob_filesize += (int64_t) item->text_compressed_size; - item = circ_buff_read_item(p_file_info->circ_buff); - } - circ_buff_read_done(p_file_info->circ_buff); - - clock_gettime(CLOCK_THREAD_CPUTIME_ID, &ts_db_write_end); - - /* --------------------------------------------------------------------- - * If the filesize of the current write-to BLOB is > - * p_file_info->blob_max_size, then perform a BLOBs rotation. - * ------------------------------------------------------------------ */ - if(blob_filesize > p_file_info->blob_max_size){ - uv_fs_t rename_req; - char old_path[FILENAME_MAX + 1], new_path[FILENAME_MAX + 1]; - - /* Rotate path of BLOBs */ - for(int i = BLOB_MAX_FILES - 1; i >= 0; i--){ - snprintfz(old_path, FILENAME_MAX, "%s" BLOB_STORE_FILENAME "%d", p_file_info->db_dir, i); - snprintfz(new_path, FILENAME_MAX, "%s" BLOB_STORE_FILENAME "%d", p_file_info->db_dir, i + 1); - rc = uv_fs_rename(NULL, &rename_req, old_path, new_path, NULL); - uv_fs_req_cleanup(&rename_req); - if (unlikely(rc)){ - //TODO: This error case needs better handling, as it will result in mismatch with sqlite metadata. - // We probably require a WAL or something similar. - throw_error(p_file_info->chartname, ERR_TYPE_LIBUV, rc, __LINE__, __FILE__, __FUNCTION__); - return_db_writer_db_mode_none(p_file_info, 1); - } - } - - /* Replace the maximum number with 0 in BLOB files. */ - snprintfz(old_path, FILENAME_MAX, "%s" BLOB_STORE_FILENAME "%d", p_file_info->db_dir, BLOB_MAX_FILES); - snprintfz(new_path, FILENAME_MAX, "%s" BLOB_STORE_FILENAME "%d", p_file_info->db_dir, 0); - rc = uv_fs_rename(NULL, &rename_req, old_path, new_path, NULL); - uv_fs_req_cleanup(&rename_req); - if (unlikely(rc)){ - //TODO: This error case needs better handling, as it will result in mismatch with sqlite metadata. - // We probably require a WAL or something similar. - throw_error(p_file_info->chartname, ERR_TYPE_LIBUV, rc, __LINE__, __FILE__, __FUNCTION__); - return_db_writer_db_mode_none(p_file_info, 1); - } - - /* Rotate BLOBS_TABLE Filenames */ - rc = sqlite3_exec(p_file_info->db, - "UPDATE " BLOBS_TABLE - " SET Filename = REPLACE( " - " Filename, " - " substr(Filename, -1), " - " case when " - " (cast(substr(Filename, -1) AS INTEGER) < (" LOGS_MANAG_STR(BLOB_MAX_FILES) " - 1)) then " - " substr(Filename, -1) + 1 else 0 end);", - NULL, NULL, NULL); - if (unlikely(rc != SQLITE_OK)) { - throw_error(p_file_info->chartname, ERR_TYPE_SQLITE, rc, __LINE__, __FILE__, __FUNCTION__); - //TODO: Undo rotation if possible? - return_db_writer_db_mode_none(p_file_info, 1); - } - - /* ----------------------------------------------------------------- - * (a) Update blob_write_handle_offset, - * (b) truncate new write-to BLOB, - * (c) update filesize of truncated BLOB in SQLite DB, - * (d) delete respective logs in LOGS_TABLE for the truncated BLOB and - * (e) reset blob_filesize - * -------------------------------------------------------------- */ - /* (a) */ - p_file_info->blob_write_handle_offset = - p_file_info->blob_write_handle_offset == 1 ? BLOB_MAX_FILES : p_file_info->blob_write_handle_offset - 1; - - /* (b) */ - uv_fs_t trunc_req; - rc = uv_fs_ftruncate(NULL, &trunc_req, p_file_info->blob_handles[p_file_info->blob_write_handle_offset], 0, NULL); - uv_fs_req_cleanup(&trunc_req); - if (unlikely(rc)){ - //TODO: This error case needs better handling, as it will result in mismatch with sqlite metadata. - // We probably require a WAL or something similar. - throw_error(p_file_info->chartname, ERR_TYPE_LIBUV, rc, __LINE__, __FILE__, __FUNCTION__); - return_db_writer_db_mode_none(p_file_info, 1); - } - - /* (c) */ - if(unlikely( - SQLITE_OK != (rc = sqlite3_exec(p_file_info->db, "BEGIN TRANSACTION;", NULL, NULL, NULL)) || - SQLITE_OK != (rc = sqlite3_bind_int(stmt_blobs_set_zero_filesize, 1, p_file_info->blob_write_handle_offset)) || - SQLITE_DONE != (rc = sqlite3_step(stmt_blobs_set_zero_filesize)) || - SQLITE_OK != (rc = sqlite3_reset(stmt_blobs_set_zero_filesize)) || - - /* (d) */ - SQLITE_OK != (rc = sqlite3_bind_int(stmt_logs_delete, 1, p_file_info->blob_write_handle_offset)) || - SQLITE_DONE != (rc = sqlite3_step(stmt_logs_delete)) || - SQLITE_OK != (rc = sqlite3_reset(stmt_logs_delete)) || - SQLITE_OK != (rc = sqlite3_exec(p_file_info->db, "END TRANSACTION;", NULL, NULL, NULL)) - )) { - throw_error(p_file_info->chartname, ERR_TYPE_SQLITE, rc, __LINE__, __FILE__, __FUNCTION__); - rc = sqlite3_exec(p_file_info->db, "ROLLBACK;", NULL, NULL, NULL); - if (unlikely(SQLITE_OK != rc)) - throw_error(p_file_info->chartname, ERR_TYPE_SQLITE, rc, __LINE__, __FILE__, __FUNCTION__); - return_db_writer_db_mode_none(p_file_info, 1); - } - - /* (e) */ - blob_filesize = 0; - - } - - clock_gettime(CLOCK_THREAD_CPUTIME_ID, &ts_db_rotate_end); - - /* Update database write & rotate timings for this log source */ - __atomic_store_n(&p_file_info->db_write_duration, - (ts_db_write_end.tv_sec - ts_db_write_start.tv_sec) * NSEC_PER_SEC + - (ts_db_write_end.tv_nsec - ts_db_write_start.tv_nsec), __ATOMIC_RELAXED); - __atomic_store_n(&p_file_info->db_rotate_duration, - (ts_db_rotate_end.tv_sec - ts_db_write_end.tv_sec) * NSEC_PER_SEC + - (ts_db_rotate_end.tv_nsec - ts_db_write_end.tv_nsec), __ATOMIC_RELAXED); - - /* Update total disk usage of all BLOBs for this log source */ - rc = sqlite3_step(stmt_blobs_get_total_filesize); - if (unlikely(SQLITE_ROW != rc)) { - throw_error(p_file_info->chartname, ERR_TYPE_SQLITE, rc, __LINE__, __FILE__, __FUNCTION__); - return_db_writer_db_mode_none(p_file_info, 1); - } - __atomic_store_n(&p_file_info->blob_total_size, sqlite3_column_int64(stmt_blobs_get_total_filesize, 0), __ATOMIC_RELAXED); - rc = sqlite3_reset(stmt_blobs_get_total_filesize); - if (unlikely(SQLITE_OK != rc)) { - throw_error(p_file_info->chartname, ERR_TYPE_SQLITE, rc, __LINE__, __FILE__, __FUNCTION__); - return_db_writer_db_mode_none(p_file_info, 1); - } - - // TODO: Can uv_mutex_unlock(p_file_info->db_mut) be moved before if(blob_filesize > p_file_info-> blob_max_size) ? - uv_mutex_unlock(p_file_info->db_mut); - uv_rwlock_rdunlock(&p_file_info->circ_buff->buff_realloc_rwlock); - for(int i = 0; i < p_file_info->buff_flush_to_db_interval * 4; i++){ - if(__atomic_load_n(&p_file_info->state, __ATOMIC_RELAXED) != LOG_SRC_READY) - break; - sleep_usec(250 * USEC_PER_MS); - } - } - - return_db_writer_db_mode_none(p_file_info, 0); -} - -inline void db_set_main_dir(char *const dir){ - main_db_dir = dir; -} - -int db_init() { - int rc = 0; - char *err_msg = 0; - uv_fs_t mkdir_req; - - if(unlikely(!main_db_dir || !*main_db_dir)){ - rc = -1; - collector_error("main_db_dir is unset"); - throw_error(NULL, ERR_TYPE_OTHER, rc, __LINE__, __FILE__, __FUNCTION__); - goto return_error; - } - size_t main_db_path_len = strlen(main_db_dir) + sizeof(MAIN_DB) + 1; - main_db_path = mallocz(main_db_path_len); - snprintfz(main_db_path, main_db_path_len, "%s/" MAIN_DB, main_db_dir); - - /* Create databases directory if it doesn't exist. */ - rc = uv_fs_mkdir(NULL, &mkdir_req, main_db_dir, 0775, NULL); - uv_fs_req_cleanup(&mkdir_req); - if(rc == 0) collector_info("DB directory created: %s", main_db_dir); - else if (rc == UV_EEXIST) collector_info("DB directory %s found", main_db_dir); - else { - throw_error(NULL, ERR_TYPE_LIBUV, rc, __LINE__, __FILE__, __FUNCTION__); - goto return_error; - } - - /* Create or open main db */ - rc = sqlite3_open(main_db_path, &main_db); - if (unlikely(rc != SQLITE_OK)){ - throw_error(MAIN_DB, ERR_TYPE_SQLITE, rc, __LINE__, __FILE__, __FUNCTION__); - goto return_error; - } - - /* Configure main database */ - rc = sqlite3_exec(main_db, - "PRAGMA auto_vacuum = INCREMENTAL;" - "PRAGMA synchronous = 1;" - "PRAGMA journal_mode = WAL;" - "PRAGMA temp_store = MEMORY;" - "PRAGMA foreign_keys = ON;", - 0, 0, &err_msg); - if (unlikely(rc != SQLITE_OK)) { - collector_error("Failed to configure database, SQL error: %s\n", err_msg); - throw_error(MAIN_DB, ERR_TYPE_SQLITE, rc, __LINE__, __FILE__, __FUNCTION__); - goto return_error; - } else collector_info("%s configured successfully", MAIN_DB); - - /* Execute pending main database migrations */ - int main_db_ver = db_user_version(main_db, -1); - if (likely(LOGS_MANAG_DB_VERSION == main_db_ver)) - collector_info("Logs management %s database version is %d (no migration needed)", MAIN_DB, main_db_ver); - else { - for(int ver = main_db_ver; ver < LOGS_MANAG_DB_VERSION && migration_list_main_db[ver].func; ver++){ - rc = (migration_list_main_db[ver].func)(main_db, migration_list_main_db[ver].name); - if (unlikely(rc)){ - collector_error("Logs management %s database migration from version %d to version %d failed", MAIN_DB, ver, ver + 1); - throw_error(MAIN_DB, ERR_TYPE_SQLITE, rc, __LINE__, __FILE__, __FUNCTION__); - goto return_error; - } - db_user_version(main_db, ver + 1); - } - } - - /* Create new main DB LogCollections table if it doesn't exist */ - rc = sqlite3_exec(main_db, - "CREATE TABLE IF NOT EXISTS " MAIN_COLLECTIONS_TABLE "(" - "Id INTEGER PRIMARY KEY," - "Stream_Tag TEXT NOT NULL," - "Log_Source_Path TEXT NOT NULL," - "Type INTEGER NOT NULL," - "DB_Dir TEXT NOT NULL," - "UNIQUE(Stream_Tag, DB_Dir) " - ");", - 0, 0, &err_msg); - if (unlikely(SQLITE_OK != rc)) { - collector_error("Failed to create table" MAIN_COLLECTIONS_TABLE "SQL error: %s", err_msg); - throw_error(MAIN_DB, ERR_TYPE_SQLITE, rc, __LINE__, __FILE__, __FUNCTION__); - goto return_error; - } - - sqlite3_stmt *stmt_search_if_log_source_exists = NULL; - rc = sqlite3_prepare_v2(main_db, - "SELECT COUNT(*), Id, DB_Dir FROM " MAIN_COLLECTIONS_TABLE - " WHERE Stream_Tag = ? AND Log_Source_Path = ? AND Type = ? ;", - -1, &stmt_search_if_log_source_exists, NULL); - if (unlikely(SQLITE_OK != rc)){ - throw_error(MAIN_DB, ERR_TYPE_SQLITE, rc, __LINE__, __FILE__, __FUNCTION__); - goto return_error; - } - - - sqlite3_stmt *stmt_insert_log_collection_metadata = NULL; - rc = sqlite3_prepare_v2(main_db, - "INSERT INTO " MAIN_COLLECTIONS_TABLE - " (Stream_Tag, Log_Source_Path, Type, DB_Dir) VALUES (?,?,?,?) ;", - -1, &stmt_insert_log_collection_metadata, NULL); - if (unlikely(SQLITE_OK != rc)){ - throw_error(MAIN_DB, ERR_TYPE_SQLITE, rc, __LINE__, __FILE__, __FUNCTION__); - goto return_error; - } - - for (int i = 0; i < p_file_infos_arr->count; i++) { - - struct File_info *const p_file_info = p_file_infos_arr->data[i]; - - if(p_file_info->db_mode == LOGS_MANAG_DB_MODE_NONE){ - p_file_info->db_dir = strdupz(""); - p_file_info->db_writer_thread = mallocz(sizeof(uv_thread_t)); - rc = uv_thread_create(p_file_info->db_writer_thread, db_writer_db_mode_none, p_file_info); - if (unlikely(rc)){ - throw_error(p_file_info->chartname, ERR_TYPE_LIBUV, rc, __LINE__, __FILE__, __FUNCTION__); - goto return_error; - } - } - else if(p_file_info->db_mode == LOGS_MANAG_DB_MODE_FULL){ - - p_file_info->db_mut = mallocz(sizeof(uv_mutex_t)); - rc = uv_mutex_init(p_file_info->db_mut); - if (unlikely(rc)) fatal("Failed to initialize uv_mutex_t"); - uv_mutex_lock(p_file_info->db_mut); - - // This error check will be used a lot, so define it here. - #define do_sqlite_error_check(p_file_info, rc, rc_expctd) do { \ - if(unlikely(rc_expctd != rc)) { \ - throw_error(p_file_info->chartname, ERR_TYPE_SQLITE, rc, __LINE__, __FILE__, __FUNCTION__);\ - uv_mutex_unlock(p_file_info->db_mut); \ - goto return_error; \ - } \ - } while(0) - - if(unlikely( - SQLITE_OK != (rc = sqlite3_bind_text(stmt_search_if_log_source_exists, 1, p_file_info->stream_guid, -1, NULL)) || - SQLITE_OK != (rc = sqlite3_bind_text(stmt_search_if_log_source_exists, 2, p_file_info->filename, -1, NULL)) || - SQLITE_OK != (rc = sqlite3_bind_int(stmt_search_if_log_source_exists, 3, p_file_info->log_type)) || - /* COUNT(*) query should always return SQLITE_ROW */ - SQLITE_ROW != (rc = sqlite3_step(stmt_search_if_log_source_exists)))){ - throw_error(p_file_info->chartname, ERR_TYPE_SQLITE, rc, __LINE__, __FILE__, __FUNCTION__); - uv_mutex_unlock(p_file_info->db_mut); - goto return_error; - } - - const int log_source_occurences = sqlite3_column_int(stmt_search_if_log_source_exists, 0); - switch (log_source_occurences) { - case 0: { /* Log collection metadata not found in main DB - create a new record */ - - /* Create directory of collection of logs for the particular - * log source (in the form of a UUID) and bind it. */ - nd_uuid_t uuid; - uuid_generate(uuid); - char uuid_str[UUID_STR_LEN]; // ex. "1b4e28ba-2fa1-11d2-883f-0016d3cca427" + "\0" - uuid_unparse_lower(uuid, uuid_str); - - p_file_info->db_dir = mallocz(snprintf(NULL, 0, "%s/%s/", main_db_dir, uuid_str) + 1); - sprintf((char *) p_file_info->db_dir, "%s/%s/", main_db_dir, uuid_str); - - rc = uv_fs_mkdir(NULL, &mkdir_req, p_file_info->db_dir, 0775, NULL); - uv_fs_req_cleanup(&mkdir_req); - if (unlikely(rc)) { - if(errno == EEXIST) - collector_error("DB directory %s exists but not found in %s.\n", p_file_info->db_dir, MAIN_DB); - throw_error(p_file_info->chartname, ERR_TYPE_LIBUV, rc, __LINE__, __FILE__, __FUNCTION__); - uv_mutex_unlock(p_file_info->db_mut); - goto return_error; - } - - if(unlikely( - SQLITE_OK != (rc = sqlite3_bind_text(stmt_insert_log_collection_metadata, 1, p_file_info->stream_guid, -1, NULL)) || - SQLITE_OK != (rc = sqlite3_bind_text(stmt_insert_log_collection_metadata, 2, p_file_info->filename, -1, NULL)) || - SQLITE_OK != (rc = sqlite3_bind_int(stmt_insert_log_collection_metadata, 3, p_file_info->log_type)) || - SQLITE_OK != (rc = sqlite3_bind_text(stmt_insert_log_collection_metadata, 4, p_file_info->db_dir, -1, NULL)) || - SQLITE_DONE != (rc = sqlite3_step(stmt_insert_log_collection_metadata)) || - SQLITE_OK != (rc = sqlite3_reset(stmt_insert_log_collection_metadata)))) { - throw_error(p_file_info->chartname, ERR_TYPE_SQLITE, rc, __LINE__, __FILE__, __FUNCTION__); - uv_mutex_unlock(p_file_info->db_mut); - goto return_error; - } - - break; - } - - case 1: { /* File metadata found in DB */ - p_file_info->db_dir = mallocz((size_t)sqlite3_column_bytes(stmt_search_if_log_source_exists, 2) + 1); - sprintf((char*) p_file_info->db_dir, "%s", sqlite3_column_text(stmt_search_if_log_source_exists, 2)); - break; - } - - default: { /* Error, file metadata can exist either 0 or 1 times in DB */ - m_assert(0, "Same file stored in DB more than once!"); - collector_error("[%s]: Record encountered multiple times in DB " MAIN_COLLECTIONS_TABLE " table \n", - p_file_info->filename); - throw_error(p_file_info->chartname, ERR_TYPE_OTHER, rc, __LINE__, __FILE__, __FUNCTION__); - uv_mutex_unlock(p_file_info->db_mut); - goto return_error; - } - } - rc = sqlite3_reset(stmt_search_if_log_source_exists); - do_sqlite_error_check(p_file_info, rc, SQLITE_OK); - - /* Create or open metadata DBs for each log collection */ - p_file_info->db_metadata = mallocz(snprintf(NULL, 0, "%s" METADATA_DB_FILENAME, p_file_info->db_dir) + 1); - sprintf((char *) p_file_info->db_metadata, "%s" METADATA_DB_FILENAME, p_file_info->db_dir); - rc = sqlite3_open(p_file_info->db_metadata, &p_file_info->db); - do_sqlite_error_check(p_file_info, rc, SQLITE_OK); - - /* Configure metadata DB */ - rc = sqlite3_exec(p_file_info->db, - "PRAGMA auto_vacuum = INCREMENTAL;" - "PRAGMA synchronous = 1;" - "PRAGMA journal_mode = WAL;" - "PRAGMA temp_store = MEMORY;" - "PRAGMA foreign_keys = ON;", - 0, 0, &err_msg); - if (unlikely(rc != SQLITE_OK)) { - collector_error("[%s]: Failed to configure database, SQL error: %s", p_file_info->filename, err_msg); - throw_error(p_file_info->chartname, ERR_TYPE_SQLITE, rc, __LINE__, __FILE__, __FUNCTION__); - uv_mutex_unlock(p_file_info->db_mut); - goto return_error; - } - - /* Execute pending metadata database migrations */ - collector_info("[%s]: About to execute " METADATA_DB_FILENAME " migrations", p_file_info->chartname); - int metadata_db_ver = db_user_version(p_file_info->db, -1); - if (likely(LOGS_MANAG_DB_VERSION == metadata_db_ver)) { - collector_info( "[%s]: Logs management " METADATA_DB_FILENAME " database version is %d (no migration needed)", - p_file_info->chartname, metadata_db_ver); - } else { - for(int ver = metadata_db_ver; ver < LOGS_MANAG_DB_VERSION && migration_list_metadata_db[ver].func; ver++){ - rc = (migration_list_metadata_db[ver].func)(p_file_info->db, migration_list_metadata_db[ver].name); - if (unlikely(rc)){ - collector_error("[%s]: Logs management " METADATA_DB_FILENAME " database migration from version %d to version %d failed", - p_file_info->chartname, ver, ver + 1); - throw_error(MAIN_DB, ERR_TYPE_SQLITE, rc, __LINE__, __FILE__, __FUNCTION__); - uv_mutex_unlock(p_file_info->db_mut); - goto return_error; - } - db_user_version(p_file_info->db, ver + 1); - } - } - - /* ----------------------------------------------------------------- - * Create BLOBS_TABLE and LOGS_TABLE if they don't exist. Do it - * as a transaction, so that it can all be rolled back if something - * goes wrong. - * -------------------------------------------------------------- */ - { - rc = sqlite3_exec(p_file_info->db, "BEGIN TRANSACTION;", NULL, NULL, NULL); - do_sqlite_error_check(p_file_info, rc, SQLITE_OK); - - /* Check if BLOBS_TABLE exists or not */ - sqlite3_stmt *stmt_check_if_BLOBS_TABLE_exists = NULL; - rc = sqlite3_prepare_v2(p_file_info->db, - "SELECT COUNT(*) FROM sqlite_master" - " WHERE type='table' AND name='"BLOBS_TABLE"';", - -1, &stmt_check_if_BLOBS_TABLE_exists, NULL); - do_sqlite_error_check(p_file_info, rc, SQLITE_OK); - rc = sqlite3_step(stmt_check_if_BLOBS_TABLE_exists); - do_sqlite_error_check(p_file_info, rc, SQLITE_ROW); - - /* If BLOBS_TABLE doesn't exist, create and populate it */ - if(sqlite3_column_int(stmt_check_if_BLOBS_TABLE_exists, 0) == 0){ - - /* 1. Create it */ - rc = sqlite3_exec(p_file_info->db, - "CREATE TABLE IF NOT EXISTS " BLOBS_TABLE "(" - "Id INTEGER PRIMARY KEY," - "Filename TEXT NOT NULL," - "Filesize INTEGER NOT NULL" - ");", - 0, 0, &err_msg); - if (unlikely(SQLITE_OK != rc)) { - collector_error("[%s]: Failed to create " BLOBS_TABLE ", SQL error: %s", p_file_info->chartname, err_msg); - throw_error(p_file_info->chartname, ERR_TYPE_SQLITE, rc, __LINE__, __FILE__, __FUNCTION__); - uv_mutex_unlock(p_file_info->db_mut); - goto return_error; - } else collector_info("[%s]: Table " BLOBS_TABLE " created successfully", p_file_info->chartname); - - /* 2. Populate it */ - sqlite3_stmt *stmt_init_BLOBS_table = NULL; - rc = sqlite3_prepare_v2(p_file_info->db, - "INSERT INTO " BLOBS_TABLE - " (Filename, Filesize) VALUES (?,?) ;", - -1, &stmt_init_BLOBS_table, NULL); - do_sqlite_error_check(p_file_info, rc, SQLITE_OK); - - for(int t = 0; t < BLOB_MAX_FILES; t++){ - char filename[FILENAME_MAX + 1]; - snprintfz(filename, FILENAME_MAX, BLOB_STORE_FILENAME "%d", t); - if(unlikely( - SQLITE_OK != (rc = sqlite3_bind_text(stmt_init_BLOBS_table, 1, filename, -1, NULL)) || - SQLITE_OK != (rc = sqlite3_bind_int64(stmt_init_BLOBS_table, 2, (sqlite3_int64) 0)) || - SQLITE_DONE != (rc = sqlite3_step(stmt_init_BLOBS_table)) || - SQLITE_OK != (rc = sqlite3_reset(stmt_init_BLOBS_table)))){ - throw_error(p_file_info->chartname, ERR_TYPE_SQLITE, rc, __LINE__, __FILE__, __FUNCTION__); - uv_mutex_unlock(p_file_info->db_mut); - goto return_error; - } - } - rc = sqlite3_finalize(stmt_init_BLOBS_table); - do_sqlite_error_check(p_file_info, rc, SQLITE_OK); - } - rc = sqlite3_finalize(stmt_check_if_BLOBS_TABLE_exists); - do_sqlite_error_check(p_file_info, rc, SQLITE_OK); - - /* If LOGS_TABLE doesn't exist, create it */ - rc = sqlite3_exec(p_file_info->db, - "CREATE TABLE IF NOT EXISTS " LOGS_TABLE "(" - "Id INTEGER PRIMARY KEY," - "FK_BLOB_Id INTEGER NOT NULL," - "BLOB_Offset INTEGER NOT NULL," - "Timestamp INTEGER NOT NULL," - "Msg_compr_size INTEGER NOT NULL," - "Msg_decompr_size INTEGER NOT NULL," - "Num_lines INTEGER NOT NULL," - "FOREIGN KEY (FK_BLOB_Id) REFERENCES " BLOBS_TABLE " (Id) ON DELETE CASCADE ON UPDATE CASCADE" - ");", - 0, 0, &err_msg); - if (unlikely(SQLITE_OK != rc)) { - collector_error("[%s]: Failed to create " LOGS_TABLE ", SQL error: %s", p_file_info->chartname, err_msg); - throw_error(p_file_info->chartname, ERR_TYPE_SQLITE, rc, __LINE__, __FILE__, __FUNCTION__); - uv_mutex_unlock(p_file_info->db_mut); - goto return_error; - } else collector_info("[%s]: Table " LOGS_TABLE " created successfully", p_file_info->chartname); - - /* Create index on LOGS_TABLE Timestamp - * TODO: If this doesn't speed up queries, check SQLITE R*tree - * module. Requires benchmarking with/without index. */ - rc = sqlite3_exec(p_file_info->db, - "CREATE INDEX IF NOT EXISTS logs_timestamps_idx " - "ON " LOGS_TABLE "(Timestamp);", - 0, 0, &err_msg); - if (unlikely(SQLITE_OK != rc)) { - collector_error("[%s]: Failed to create logs_timestamps_idx, SQL error: %s", p_file_info->chartname, err_msg); - throw_error(p_file_info->chartname, ERR_TYPE_SQLITE, rc, __LINE__, __FILE__, __FUNCTION__); - uv_mutex_unlock(p_file_info->db_mut); - goto return_error; - } else collector_info("[%s]: logs_timestamps_idx created successfully", p_file_info->chartname); - - rc = sqlite3_exec(p_file_info->db, "END TRANSACTION;", NULL, NULL, NULL); - do_sqlite_error_check(p_file_info, rc, SQLITE_OK); - } - - - /* ----------------------------------------------------------------- - * Remove excess BLOBs beyond BLOB_MAX_FILES (from both DB and disk - * storage). - * - * This is useful if BLOB_MAX_FILES is reduced after an agent - * restart (for example, if in the future it is not hardcoded, - * but instead it is read from the configuration file). LOGS_TABLE - * entries should be deleted automatically (due to ON DELETE CASCADE). - * -------------------------------------------------------------- */ - { - sqlite3_stmt *stmt_get_BLOBS_TABLE_size = NULL; - rc = sqlite3_prepare_v2(p_file_info->db, - "SELECT MAX(Id) FROM " BLOBS_TABLE ";", - -1, &stmt_get_BLOBS_TABLE_size, NULL); - do_sqlite_error_check(p_file_info, rc, SQLITE_OK); - rc = sqlite3_step(stmt_get_BLOBS_TABLE_size); - do_sqlite_error_check(p_file_info, rc, SQLITE_ROW); - - const int blobs_table_max_id = sqlite3_column_int(stmt_get_BLOBS_TABLE_size, 0); - - sqlite3_stmt *stmt_retrieve_filename_last_digits = NULL; // This statement retrieves the last digit(s) from the Filename column of BLOBS_TABLE - rc = sqlite3_prepare_v2(p_file_info->db, - "WITH split(word, str) AS ( SELECT '', (SELECT Filename FROM " BLOBS_TABLE " WHERE Id = ? ) || '.' " - "UNION ALL SELECT substr(str, 0, instr(str, '.')), substr(str, instr(str, '.')+1) FROM split WHERE str!='' ) " - "SELECT word FROM split WHERE word!='' ORDER BY LENGTH(str) LIMIT 1;", - -1, &stmt_retrieve_filename_last_digits, NULL); - do_sqlite_error_check(p_file_info, rc, SQLITE_OK); - - sqlite3_stmt *stmt_delete_row_by_id = NULL; - rc = sqlite3_prepare_v2(p_file_info->db, - "DELETE FROM " BLOBS_TABLE " WHERE Id = ?;", - -1, &stmt_delete_row_by_id, NULL); - do_sqlite_error_check(p_file_info, rc, SQLITE_OK); - - for (int id = 1; id <= blobs_table_max_id; id++){ - - rc = sqlite3_bind_int(stmt_retrieve_filename_last_digits, 1, id); - do_sqlite_error_check(p_file_info, rc, SQLITE_OK); - rc = sqlite3_step(stmt_retrieve_filename_last_digits); - do_sqlite_error_check(p_file_info, rc, SQLITE_ROW); - int last_digits = sqlite3_column_int(stmt_retrieve_filename_last_digits, 0); - rc = sqlite3_reset(stmt_retrieve_filename_last_digits); - do_sqlite_error_check(p_file_info, rc, SQLITE_OK); - - /* If last_digits > BLOB_MAX_FILES - 1, then some BLOB files - * will need to be removed (both from DB BLOBS_TABLE and - * also from the disk). */ - if(last_digits > BLOB_MAX_FILES - 1){ - - /* Delete BLOB file from filesystem */ - char blob_delete_path[FILENAME_MAX + 1]; - snprintfz(blob_delete_path, FILENAME_MAX, "%s" BLOB_STORE_FILENAME "%d", p_file_info->db_dir, last_digits); - uv_fs_t unlink_req; - rc = uv_fs_unlink(NULL, &unlink_req, blob_delete_path, NULL); - uv_fs_req_cleanup(&unlink_req); - if (unlikely(rc)) { - // TODO: If there is an erro here, the entry won't be deleted from BLOBS_TABLE. What to do? - throw_error(p_file_info->chartname, ERR_TYPE_LIBUV, rc, __LINE__, __FILE__, __FUNCTION__); - uv_mutex_unlock(p_file_info->db_mut); - goto return_error; - } - do_sqlite_error_check(p_file_info, rc, SQLITE_OK); - - /* Delete entry from DB BLOBS_TABLE */ - rc = sqlite3_bind_int(stmt_delete_row_by_id, 1, id); - do_sqlite_error_check(p_file_info, rc, SQLITE_OK); - rc = sqlite3_step(stmt_delete_row_by_id); - do_sqlite_error_check(p_file_info, rc, SQLITE_DONE); - rc = sqlite3_reset(stmt_delete_row_by_id); - do_sqlite_error_check(p_file_info, rc, SQLITE_OK); - } - } - rc = sqlite3_finalize(stmt_retrieve_filename_last_digits); - do_sqlite_error_check(p_file_info, rc, SQLITE_OK); - rc = sqlite3_finalize(stmt_delete_row_by_id); - do_sqlite_error_check(p_file_info, rc, SQLITE_OK); - - /* ------------------------------------------------------------- - * BLOBS_TABLE ids after the deletion might not be contiguous. - * This needs to be fixed, by having the ids updated. - * LOGS_TABLE FKs will be updated automatically - * (due to ON UPDATE CASCADE). - * ---------------------------------------------------------- */ - - int old_blobs_table_ids[BLOB_MAX_FILES]; - int off = 0; - sqlite3_stmt *stmt_retrieve_all_ids = NULL; - rc = sqlite3_prepare_v2(p_file_info->db, - "SELECT Id FROM " BLOBS_TABLE " ORDER BY Id ASC;", - -1, &stmt_retrieve_all_ids, NULL); - do_sqlite_error_check(p_file_info, rc, SQLITE_OK); - - rc = sqlite3_step(stmt_retrieve_all_ids); - while(rc == SQLITE_ROW){ - old_blobs_table_ids[off++] = sqlite3_column_int(stmt_retrieve_all_ids, 0); - rc = sqlite3_step(stmt_retrieve_all_ids); - } - do_sqlite_error_check(p_file_info, rc, SQLITE_DONE); - rc = sqlite3_finalize(stmt_retrieve_all_ids); - do_sqlite_error_check(p_file_info, rc, SQLITE_OK); - - sqlite3_stmt *stmt_update_id = NULL; - rc = sqlite3_prepare_v2(p_file_info->db, - "UPDATE " BLOBS_TABLE " SET Id = ? WHERE Id = ?;", - -1, &stmt_update_id, NULL); - do_sqlite_error_check(p_file_info, rc, SQLITE_OK); - - for (int t = 0; t < BLOB_MAX_FILES; t++){ - if(unlikely( - SQLITE_OK != (rc = sqlite3_bind_int(stmt_update_id, 1, t + 1)) || - SQLITE_OK != (rc = sqlite3_bind_int(stmt_update_id, 2, old_blobs_table_ids[t])) || - SQLITE_DONE != (rc = sqlite3_step(stmt_update_id)) || - SQLITE_OK != (rc = sqlite3_reset(stmt_update_id)))) { - throw_error(p_file_info->chartname, ERR_TYPE_SQLITE, rc, __LINE__, __FILE__, __FUNCTION__); - uv_mutex_unlock(p_file_info->db_mut); - goto return_error; - } - } - rc = sqlite3_finalize(stmt_update_id); - do_sqlite_error_check(p_file_info, rc, SQLITE_OK); - } - - /* ----------------------------------------------------------------- - * Traverse BLOBS_TABLE, open logs.bin.X files and store their - * file handles in p_file_info array. - * -------------------------------------------------------------- */ - sqlite3_stmt *stmt_retrieve_metadata_from_id = NULL; - rc = sqlite3_prepare_v2(p_file_info->db, - "SELECT Filename, Filesize FROM " BLOBS_TABLE - " WHERE Id = ? ;", - -1, &stmt_retrieve_metadata_from_id, NULL); - do_sqlite_error_check(p_file_info, rc, SQLITE_OK); - - sqlite3_stmt *stmt_retrieve_total_logs_size = NULL; - rc = sqlite3_prepare_v2(p_file_info->db, - "SELECT SUM(Msg_compr_size) FROM " LOGS_TABLE - " WHERE FK_BLOB_Id = ? GROUP BY FK_BLOB_Id ;", - -1, &stmt_retrieve_total_logs_size, NULL); - do_sqlite_error_check(p_file_info, rc, SQLITE_OK); - - uv_fs_t open_req; - for(int id = 1; id <= BLOB_MAX_FILES; id++){ - - /* Open BLOB file based on filename stored in BLOBS_TABLE. */ - rc = sqlite3_bind_int(stmt_retrieve_metadata_from_id, 1, id); - do_sqlite_error_check(p_file_info, rc, SQLITE_OK); - rc = sqlite3_step(stmt_retrieve_metadata_from_id); - do_sqlite_error_check(p_file_info, rc, SQLITE_ROW); - - char filename[FILENAME_MAX + 1] = {0}; - snprintfz(filename, FILENAME_MAX, "%s%s", p_file_info->db_dir, - sqlite3_column_text(stmt_retrieve_metadata_from_id, 0)); - rc = uv_fs_open(NULL, &open_req, filename, - UV_FS_O_RDWR | UV_FS_O_CREAT | UV_FS_O_APPEND | UV_FS_O_RANDOM, - 0644, NULL); - if (unlikely(rc < 0)){ - uv_fs_req_cleanup(&open_req); - throw_error(p_file_info->chartname, ERR_TYPE_LIBUV, rc, __LINE__, __FILE__, __FUNCTION__); - uv_mutex_unlock(p_file_info->db_mut); - goto return_error; - } - - // open_req.result of a uv_fs_t is the file descriptor in case of the uv_fs_open - p_file_info->blob_handles[id] = open_req.result; - uv_fs_req_cleanup(&open_req); - - const int64_t metadata_filesize = (int64_t) sqlite3_column_int64(stmt_retrieve_metadata_from_id, 1); - - /* ------------------------------------------------------------- - * Retrieve total log messages compressed size from LOGS_TABLE - * for current FK_BLOB_Id. - * Only to assert whether correct - not used elsewhere. - * - * If no rows are returned, it means it is probably the initial - * execution of the program so still valid (except if rc is other - * than SQLITE_DONE, which is an error then). - * ---------------------------------------------------------- */ - rc = sqlite3_bind_int(stmt_retrieve_total_logs_size, 1, id); - do_sqlite_error_check(p_file_info, rc, SQLITE_OK); - rc = sqlite3_step(stmt_retrieve_total_logs_size); - if (SQLITE_ROW == rc){ - const int64_t total_logs_filesize = (int64_t) sqlite3_column_int64(stmt_retrieve_total_logs_size, 0); - if(unlikely(total_logs_filesize != metadata_filesize)){ - throw_error(p_file_info->chartname, ERR_TYPE_OTHER, rc, __LINE__, __FILE__, __FUNCTION__); - uv_mutex_unlock(p_file_info->db_mut); - goto return_error; - } - } else do_sqlite_error_check(p_file_info, rc, SQLITE_DONE); - - - /* Get filesize of BLOB file. */ - uv_fs_t stat_req; - rc = uv_fs_stat(NULL, &stat_req, filename, NULL); - if (unlikely(rc)){ - uv_fs_req_cleanup(&stat_req); - throw_error(p_file_info->chartname, ERR_TYPE_LIBUV, rc, __LINE__, __FILE__, __FUNCTION__); - uv_mutex_unlock(p_file_info->db_mut); - goto return_error; - } - const int64_t blob_filesize = (int64_t) stat_req.statbuf.st_size; - uv_fs_req_cleanup(&stat_req); - - do{ - /* Case 1: blob_filesize == metadata_filesize (equal, either both zero or not): All good */ - if(likely(blob_filesize == metadata_filesize)) - break; - - /* Case 2: blob_filesize == 0 && metadata_filesize > 0: fatal(), however could it mean that - * EXT_BLOB_STORE_FILENAME was rotated but the SQLite metadata wasn't updated? So can it - * maybe be recovered by un-rotating? Either way, treat as fatal error for now. */ - // TODO: Can we avoid fatal()? - if(unlikely(blob_filesize == 0 && metadata_filesize > 0)){ - collector_error("[%s]: blob_filesize == 0 but metadata_filesize > 0 for '%s'\n", - p_file_info->chartname, filename); - throw_error(p_file_info->chartname, ERR_TYPE_OTHER, rc, __LINE__, __FILE__, __FUNCTION__); - uv_mutex_unlock(p_file_info->db_mut); - goto return_error; - } - - /* Case 3: blob_filesize > metadata_filesize: Truncate binary to sqlite filesize, program - * crashed or terminated after writing BLOBs to external file but before metadata was updated */ - if(unlikely(blob_filesize > metadata_filesize)){ - collector_info("[%s]: blob_filesize > metadata_filesize for '%s'. Will attempt to fix it.", - p_file_info->chartname, filename); - uv_fs_t trunc_req; - rc = uv_fs_ftruncate(NULL, &trunc_req, p_file_info->blob_handles[id], metadata_filesize, NULL); - uv_fs_req_cleanup(&trunc_req); - if(unlikely(rc)) { - throw_error(p_file_info->chartname, ERR_TYPE_LIBUV, rc, __LINE__, __FILE__, __FUNCTION__); - uv_mutex_unlock(p_file_info->db_mut); - goto return_error; - } - break; - } - - /* Case 4: blob_filesize < metadata_filesize: unrecoverable, - * maybe rotation went horrible wrong? - * TODO: Delete external BLOB and clear metadata from DB, - * start from clean state but the most recent logs. */ - if(unlikely(blob_filesize < metadata_filesize)){ - collector_info("[%s]: blob_filesize < metadata_filesize for '%s'.", - p_file_info->chartname, filename); - throw_error(p_file_info->chartname, ERR_TYPE_OTHER, rc, __LINE__, __FILE__, __FUNCTION__); - uv_mutex_unlock(p_file_info->db_mut); - goto return_error; - } - - /* Case 5: default if none of the above, should never reach here, fatal() */ - m_assert(0, "Code should not reach here"); - throw_error(p_file_info->chartname, ERR_TYPE_OTHER, rc, __LINE__, __FILE__, __FUNCTION__); - uv_mutex_unlock(p_file_info->db_mut); - goto return_error; - } while(0); - - - /* Initialise blob_write_handle with logs.bin.0 */ - if(filename[strlen(filename) - 1] == '0') - p_file_info->blob_write_handle_offset = id; - - rc = sqlite3_reset(stmt_retrieve_total_logs_size); - do_sqlite_error_check(p_file_info, rc, SQLITE_OK); - rc = sqlite3_reset(stmt_retrieve_metadata_from_id); - do_sqlite_error_check(p_file_info, rc, SQLITE_OK); - } - - rc = sqlite3_finalize(stmt_retrieve_metadata_from_id); - do_sqlite_error_check(p_file_info, rc, SQLITE_OK); - - /* Prepare statements to be used in single database queries */ - rc = sqlite3_prepare_v2(p_file_info->db, - "SELECT Timestamp, Msg_compr_size , Msg_decompr_size, " - "BLOB_Offset, " BLOBS_TABLE".Id, Num_lines " - "FROM " LOGS_TABLE " INNER JOIN " BLOBS_TABLE " " - "ON " LOGS_TABLE ".FK_BLOB_Id = " BLOBS_TABLE ".Id " - "WHERE Timestamp >= ? AND Timestamp <= ? " - "ORDER BY Timestamp;", - -1, &p_file_info->stmt_get_log_msg_metadata_asc, NULL); - do_sqlite_error_check(p_file_info, rc, SQLITE_OK); - - rc = sqlite3_prepare_v2(p_file_info->db, - "SELECT Timestamp, Msg_compr_size , Msg_decompr_size, " - "BLOB_Offset, " BLOBS_TABLE".Id, Num_lines " - "FROM " LOGS_TABLE " INNER JOIN " BLOBS_TABLE " " - "ON " LOGS_TABLE ".FK_BLOB_Id = " BLOBS_TABLE ".Id " - "WHERE Timestamp <= ? AND Timestamp >= ? " - "ORDER BY Timestamp DESC;", - -1, &p_file_info->stmt_get_log_msg_metadata_desc, NULL); - do_sqlite_error_check(p_file_info, rc, SQLITE_OK); - - /* DB initialisation finished; release lock */ - uv_mutex_unlock(p_file_info->db_mut); - - /* Create synchronous writer thread, one for each log source */ - p_file_info->db_writer_thread = mallocz(sizeof(uv_thread_t)); - rc = uv_thread_create(p_file_info->db_writer_thread, db_writer_db_mode_full, p_file_info); - if (unlikely(rc)){ - throw_error(p_file_info->chartname, ERR_TYPE_LIBUV, rc, __LINE__, __FILE__, __FUNCTION__); - goto return_error; - } - } - } - rc = sqlite3_finalize(stmt_search_if_log_source_exists); - if (unlikely(rc != SQLITE_OK)){ - throw_error(MAIN_DB, ERR_TYPE_SQLITE, rc, __LINE__, __FILE__, __FUNCTION__); - // TODO: Some additional cleanup required here, e.g. terminate db_writer_thread. - goto return_error; - } - rc = sqlite3_finalize(stmt_insert_log_collection_metadata); - if (unlikely(rc != SQLITE_OK)){ - throw_error(MAIN_DB, ERR_TYPE_SQLITE, rc, __LINE__, __FILE__, __FUNCTION__); - // TODO: Some additional cleanup required here, e.g. terminate db_writer_thread. - goto return_error; - } - - return 0; - -return_error: - freez(main_db_path); - main_db_path = NULL; - - sqlite3_close(main_db); // No-op if main_db == NULL - sqlite3_free(err_msg); // No-op if err_msg == NULL - - m_assert(rc != 0, "rc should not be == 0 in case of error"); - return rc == 0 ? -1 : rc; -} - -/** - * @brief Search database(s) for logs - * @details This function searches one or more databases for any results - * matching the query parameters. If any results are found, it will decompress - * the text of each returned row and add it to the results buffer, up to a - * maximum amount of p_query_params->quota bytes (unless timed out). - * @todo Make decompress buffer static to reduce mallocs/frees. - * @todo Limit number of results returned through SQLite Query to speed up search? - */ -void db_search(logs_query_params_t *const p_query_params, struct File_info *const p_file_infos[]) { - int rc = 0; - - sqlite3_stmt *stmt_get_log_msg_metadata; - sqlite3 *dbt = NULL; // Used only when multiple DBs are searched - - if(!p_file_infos[1]){ /* Single DB to be searched */ - stmt_get_log_msg_metadata = p_query_params->order_by_asc ? - p_file_infos[0]->stmt_get_log_msg_metadata_asc : p_file_infos[0]->stmt_get_log_msg_metadata_desc; - if(unlikely( - SQLITE_OK != (rc = sqlite3_bind_int64(stmt_get_log_msg_metadata, 1, p_query_params->req_from_ts)) || - SQLITE_OK != (rc = sqlite3_bind_int64(stmt_get_log_msg_metadata, 2, p_query_params->req_to_ts)) || - (SQLITE_ROW != (rc = sqlite3_step(stmt_get_log_msg_metadata)) && (SQLITE_DONE != rc)) - )){ - throw_error(p_file_infos[0]->chartname, ERR_TYPE_SQLITE, rc, __LINE__, __FILE__, __FUNCTION__); - // TODO: If there are errors here, should db_writer_db_mode_full() be terminated? - sqlite3_reset(stmt_get_log_msg_metadata); - return; - } - } else { /* Multiple DBs to be searched */ - sqlite3_stmt *stmt_attach_db; - sqlite3_stmt *stmt_create_tmp_view; - int pfi_off = 0; - - /* Open a new DB connection on the first log source DB and attach other DBs */ - if(unlikely( - SQLITE_OK != (rc = sqlite3_open_v2(p_file_infos[0]->db_metadata, &dbt, SQLITE_OPEN_READONLY, NULL)) || - SQLITE_OK != (rc = sqlite3_prepare_v2(dbt,"ATTACH DATABASE ? AS ? ;", -1, &stmt_attach_db, NULL)) - )){ - throw_error(p_file_infos[0]->chartname, ERR_TYPE_SQLITE, rc, __LINE__, __FILE__, __FUNCTION__); - sqlite3_close_v2(dbt); - return; - } - for(pfi_off = 0; p_file_infos[pfi_off]; pfi_off++){ - if(unlikely( - SQLITE_OK != (rc = sqlite3_bind_text(stmt_attach_db, 1, p_file_infos[pfi_off]->db_metadata, -1, NULL)) || - SQLITE_OK != (rc = sqlite3_bind_int(stmt_attach_db, 2, pfi_off)) || - SQLITE_DONE != (rc = sqlite3_step(stmt_attach_db)) || - SQLITE_OK != (rc = sqlite3_reset(stmt_attach_db)) - )){ - throw_error(p_file_infos[pfi_off]->chartname, ERR_TYPE_SQLITE, rc, __LINE__, __FILE__, __FUNCTION__); - sqlite3_close_v2(dbt); - return; - } - } - - /* Create temporary view, then prepare retrieval of metadata from - * TMP_VIEW_TABLE statement and execute search. - * TODO: Limit number of results returned through SQLite Query to speed up search? */ - #define TMP_VIEW_TABLE "compound_view" - #define TMP_VIEW_QUERY_PREFIX "CREATE TEMP VIEW " TMP_VIEW_TABLE " AS SELECT * FROM (SELECT * FROM '0'."\ - LOGS_TABLE " INNER JOIN (VALUES(0)) ORDER BY Timestamp) " - #define TMP_VIEW_QUERY_BODY_1 "UNION ALL SELECT * FROM (SELECT * FROM '" - #define TMP_VIEW_QUERY_BODY_2 "'." LOGS_TABLE " INNER JOIN (VALUES(" - #define TMP_VIEW_QUERY_BODY_3 ")) ORDER BY Timestamp) " - #define TMP_VIEW_QUERY_POSTFIX "ORDER BY Timestamp;" - - char tmp_view_query[sizeof(TMP_VIEW_QUERY_PREFIX) + ( - sizeof(TMP_VIEW_QUERY_BODY_1) + - sizeof(TMP_VIEW_QUERY_BODY_2) + - sizeof(TMP_VIEW_QUERY_BODY_3) + 4 - ) * (LOGS_MANAG_MAX_COMPOUND_QUERY_SOURCES - 1) + - sizeof(TMP_VIEW_QUERY_POSTFIX) + - 50 /* +50 bytes to play it safe */] = TMP_VIEW_QUERY_PREFIX; - int pos = sizeof(TMP_VIEW_QUERY_PREFIX) - 1; - for(pfi_off = 1; p_file_infos[pfi_off]; pfi_off++){ // Skip p_file_infos[0] - int n = snprintf(&tmp_view_query[pos], sizeof(tmp_view_query) - pos, "%s%d%s%d%s", - TMP_VIEW_QUERY_BODY_1, pfi_off, - TMP_VIEW_QUERY_BODY_2, pfi_off, - TMP_VIEW_QUERY_BODY_3); - - if (n < 0 || n >= (int) sizeof(tmp_view_query) - pos){ - throw_error(p_file_infos[pfi_off]->chartname, ERR_TYPE_OTHER, n, __LINE__, __FILE__, __FUNCTION__); - sqlite3_close_v2(dbt); - return; - } - pos += n; - } - snprintf(&tmp_view_query[pos], sizeof(tmp_view_query) - pos, "%s", TMP_VIEW_QUERY_POSTFIX); - - if(unlikely( - SQLITE_OK != (rc = sqlite3_prepare_v2(dbt, tmp_view_query, -1, &stmt_create_tmp_view, NULL)) || - SQLITE_DONE != (rc = sqlite3_step(stmt_create_tmp_view)) || - SQLITE_OK != (rc = sqlite3_prepare_v2(dbt, p_query_params->order_by_asc ? - - "SELECT Timestamp, Msg_compr_size , Msg_decompr_size, " - "BLOB_Offset, FK_BLOB_Id, Num_lines, column1 " - "FROM " TMP_VIEW_TABLE " " - "WHERE Timestamp >= ? AND Timestamp <= ?;" : - - /* TODO: The following can also be done by defining - * a descending order tmp_view_query, which will - * probably be faster. Needs to be measured. */ - - "SELECT Timestamp, Msg_compr_size , Msg_decompr_size, " - "BLOB_Offset, FK_BLOB_Id, Num_lines, column1 " - "FROM " TMP_VIEW_TABLE " " - "WHERE Timestamp <= ? AND Timestamp >= ? ORDER BY Timestamp DESC;", - - -1, &stmt_get_log_msg_metadata, NULL)) || - SQLITE_OK != (rc = sqlite3_bind_int64(stmt_get_log_msg_metadata, 1, - (sqlite3_int64)p_query_params->req_from_ts)) || - SQLITE_OK != (rc = sqlite3_bind_int64(stmt_get_log_msg_metadata, 2, - (sqlite3_int64)p_query_params->req_to_ts)) || - (SQLITE_ROW != (rc = sqlite3_step(stmt_get_log_msg_metadata)) && (SQLITE_DONE != rc)) - )){ - throw_error(p_file_infos[0]->chartname, ERR_TYPE_SQLITE, rc, __LINE__, __FILE__, __FUNCTION__); - sqlite3_close_v2(dbt); - return; - } - } - - Circ_buff_item_t tmp_itm = {0}; - - BUFFER *const res_buff = p_query_params->results_buff; - logs_query_res_hdr_t res_hdr = { // results header - .timestamp = p_query_params->act_to_ts, - .text_size = 0, - .matches = 0, - .log_source = "", - .log_type = "", - .basename = "", - .filename = "", - .chartname ="" - }; - size_t text_compressed_size_max = 0; - - while (rc == SQLITE_ROW) { - - /* Retrieve metadata from DB */ - tmp_itm.timestamp = (msec_t)sqlite3_column_int64(stmt_get_log_msg_metadata, 0); - tmp_itm.text_compressed_size = (size_t)sqlite3_column_int64(stmt_get_log_msg_metadata, 1); - tmp_itm.text_size = (size_t)sqlite3_column_int64(stmt_get_log_msg_metadata, 2); - int64_t blob_offset = (int64_t) sqlite3_column_int64(stmt_get_log_msg_metadata, 3); - int blob_handles_offset = sqlite3_column_int(stmt_get_log_msg_metadata, 4); - unsigned long num_lines = (unsigned long) sqlite3_column_int64(stmt_get_log_msg_metadata, 5); - int db_off = p_file_infos[1] ? sqlite3_column_int(stmt_get_log_msg_metadata, 6) : 0; - - /* If exceeding quota or timeout is reached and new timestamp - * is different than previous, terminate query. */ - if((res_buff->len >= p_query_params->quota || terminate_logs_manag_query(p_query_params)) && - tmp_itm.timestamp != res_hdr.timestamp){ - p_query_params->act_to_ts = res_hdr.timestamp; - break; - } - - res_hdr.timestamp = tmp_itm.timestamp; - snprintfz(res_hdr.log_source, sizeof(res_hdr.log_source), "%s", log_src_t_str[p_file_infos[db_off]->log_source]); - snprintfz(res_hdr.log_type, sizeof(res_hdr.log_type), "%s", log_src_type_t_str[p_file_infos[db_off]->log_type]); - snprintfz(res_hdr.basename, sizeof(res_hdr.basename), "%s", p_file_infos[db_off]->file_basename); - snprintfz(res_hdr.filename, sizeof(res_hdr.filename), "%s", p_file_infos[db_off]->filename); - snprintfz(res_hdr.chartname, sizeof(res_hdr.chartname), "%s", p_file_infos[db_off]->chartname); - - /* Retrieve compressed log messages from BLOB file */ - if(tmp_itm.text_compressed_size > text_compressed_size_max){ - text_compressed_size_max = tmp_itm.text_compressed_size; - tmp_itm.text_compressed = reallocz(tmp_itm.text_compressed, text_compressed_size_max); - } - uv_fs_t read_req; - uv_buf_t uv_buf = uv_buf_init(tmp_itm.text_compressed, tmp_itm.text_compressed_size); - rc = uv_fs_read(NULL, - &read_req, - p_file_infos[db_off]->blob_handles[blob_handles_offset], - &uv_buf, 1, blob_offset, NULL); - uv_fs_req_cleanup(&read_req); - if (unlikely(rc < 0)){ - throw_error(NULL, ERR_TYPE_LIBUV, rc, __LINE__, __FILE__, __FUNCTION__); - break; - } - - /* Append retrieved results to BUFFER. - * In the case of search_keyword(), less than sizeof(res_hdr) + tmp_itm.text_size - *space may be required, but go for worst case scenario for now */ - buffer_increase(res_buff, sizeof(res_hdr) + tmp_itm.text_size); - - if(!p_query_params->keyword || !*p_query_params->keyword || !strcmp(p_query_params->keyword, " ")){ - rc = LZ4_decompress_safe(tmp_itm.text_compressed, - &res_buff->buffer[res_buff->len + sizeof(res_hdr)], - tmp_itm.text_compressed_size, - tmp_itm.text_size); - - if(unlikely(rc < 0)){ - throw_error(p_file_infos[db_off]->chartname, ERR_TYPE_OTHER, rc, __LINE__, __FILE__, __FUNCTION__); - break; - } - - res_hdr.matches = num_lines; - res_hdr.text_size = tmp_itm.text_size; - } - else { - tmp_itm.data = mallocz(tmp_itm.text_size); - rc = LZ4_decompress_safe(tmp_itm.text_compressed, - tmp_itm.data, - tmp_itm.text_compressed_size, - tmp_itm.text_size); - - if(unlikely(rc < 0)){ - freez(tmp_itm.data); - throw_error(p_file_infos[db_off]->chartname, ERR_TYPE_OTHER, rc, __LINE__, __FILE__, __FUNCTION__); - break; - } - - res_hdr.matches = search_keyword( tmp_itm.data, tmp_itm.text_size, - &res_buff->buffer[res_buff->len + sizeof(res_hdr)], - &res_hdr.text_size, p_query_params->keyword, NULL, - p_query_params->ignore_case); - freez(tmp_itm.data); - - m_assert( (res_hdr.matches > 0 && res_hdr.text_size > 0) || - (res_hdr.matches == 0 && res_hdr.text_size == 0), - "res_hdr.matches and res_hdr.text_size must both be > 0 or == 0."); - - if(unlikely(res_hdr.matches < 0)){ /* res_hdr.matches < 0 - error during keyword search */ - throw_error(p_file_infos[db_off]->chartname, ERR_TYPE_LIBUV, rc, __LINE__, __FILE__, __FUNCTION__); - break; - } - } - - if(res_hdr.text_size){ - res_buff->buffer[res_buff->len + sizeof(res_hdr) + res_hdr.text_size - 1] = '\n'; // replace '\0' with '\n' - memcpy(&res_buff->buffer[res_buff->len], &res_hdr, sizeof(res_hdr)); - res_buff->len += sizeof(res_hdr) + res_hdr.text_size; - p_query_params->num_lines += res_hdr.matches; - } - - m_assert(TEST_MS_TIMESTAMP_VALID(res_hdr.timestamp), "res_hdr.timestamp is invalid"); - - rc = sqlite3_step(stmt_get_log_msg_metadata); - if (unlikely(rc != SQLITE_ROW && rc != SQLITE_DONE)){ - throw_error(p_file_infos[db_off]->chartname, ERR_TYPE_SQLITE, rc, __LINE__, __FILE__, __FUNCTION__); - // TODO: If there are errors here, should db_writer_db_mode_full() be terminated? - break; - } - } - - if(tmp_itm.text_compressed) - freez(tmp_itm.text_compressed); - - if(p_file_infos[1]) - rc = sqlite3_close_v2(dbt); - else - rc = sqlite3_reset(stmt_get_log_msg_metadata); - - if (unlikely(SQLITE_OK != rc)) - throw_error(p_file_infos[0]->chartname, ERR_TYPE_SQLITE, rc, __LINE__, __FILE__, __FUNCTION__); -} diff --git a/src/logsmanagement/db_api.h b/src/logsmanagement/db_api.h deleted file mode 100644 index 81ff2de06..000000000 --- a/src/logsmanagement/db_api.h +++ /dev/null @@ -1,22 +0,0 @@ -// SPDX-License-Identifier: GPL-3.0-or-later - -/** @file db_api.h - * @brief Header of db_api.c - */ - -#ifndef DB_API_H_ -#define DB_API_H_ - -#include "database/sqlite/sqlite3.h" -#include <uv.h> -#include "query.h" -#include "file_info.h" - -#define LOGS_MANAG_DB_SUBPATH "/logs_management_db" - -int db_user_version(sqlite3 *const db, const int set_user_version); -void db_set_main_dir(char *const dir); -int db_init(void); -void db_search(logs_query_params_t *const p_query_params, struct File_info *const p_file_infos[]); - -#endif // DB_API_H_ diff --git a/src/logsmanagement/defaults.h b/src/logsmanagement/defaults.h deleted file mode 100644 index 2309f7810..000000000 --- a/src/logsmanagement/defaults.h +++ /dev/null @@ -1,140 +0,0 @@ -// SPDX-License-Identifier: GPL-3.0-or-later - -/** @file defaults.h - * @brief Hard-coded configuration settings for the Logs Management engine - */ - -#ifndef LOGSMANAG_DEFAULTS_H_ -#define LOGSMANAG_DEFAULTS_H_ - -/* -------------------------------------------------------------------------- */ -/* General */ -/* -------------------------------------------------------------------------- */ - -#define KiB * 1024ULL -#define MiB * 1048576ULL -#define GiB * 1073741824ULL - -#define MAX_LOG_MSG_SIZE 50 MiB /**< Maximum allowable log message size (in Bytes) to be stored in message queue and DB. **/ - -#define MAX_CUS_CHARTS_PER_SOURCE 100 /**< Hard limit of maximum custom charts per log source **/ - -#define MAX_OUTPUTS_PER_SOURCE 100 /**< Hard limit of maximum Fluent Bit outputs per log source **/ - -#define UPDATE_TIMEOUT_DEFAULT 10 /**< Default timeout to use to update charts if they haven't been updated in the meantime. **/ - -#if !defined(LOGS_MANAGEMENT_DEV_MODE) -#define ENABLE_COLLECTED_LOGS_TOTAL_DEFAULT CONFIG_BOOLEAN_NO /**< Default value to enable (or not) metrics of total collected log records **/ -#else -#define ENABLE_COLLECTED_LOGS_TOTAL_DEFAULT CONFIG_BOOLEAN_YES /**< Default value to enable (or not) metrics of total collected log records, if stress tests are enabled **/ -#endif -#define ENABLE_COLLECTED_LOGS_RATE_DEFAULT CONFIG_BOOLEAN_YES /**< Default value to enable (or not) metrics of rate of collected log records **/ - -#define SD_JOURNAL_FIELD_PREFIX "LOGS_MANAG_" /**< Default systemd journal field prefix for sources that log to the system journal */ - -#define SD_JOURNAL_SEND_DEFAULT CONFIG_BOOLEAN_NO /**< Default value to enable (or not) submission of logs to the system journal (where applicable) **/ - -#define LOGS_MANAG_CHARTNAME_SIZE 50 /**< Maximum size of log source chart names, including terminating '\0'. **/ -#define LOGS_MANAG_CHARTNAME_PREFIX "logs_manag_" /**< Prefix of top-level chart names, used also in function sources. **/ - -/* -------------------------------------------------------------------------- */ - - -/* -------------------------------------------------------------------------- */ -/* Database */ -/* -------------------------------------------------------------------------- */ - -typedef enum { - LOGS_MANAG_DB_MODE_FULL = 0, - LOGS_MANAG_DB_MODE_NONE -} logs_manag_db_mode_t; - -#define SAVE_BLOB_TO_DB_DEFAULT 6 /**< Global default configuration interval to save buffers from RAM to disk **/ -#define SAVE_BLOB_TO_DB_MIN 2 /**< Minimum allowed interval to save buffers from RAM to disk **/ -#define SAVE_BLOB_TO_DB_MAX 1800 /**< Maximum allowed interval to save buffers from RAM to disk **/ - -#define BLOB_MAX_FILES 10 /**< Maximum allowed number of BLOB files (per collection) that are used to store compressed logs. When exceeded, the olderst one will be overwritten. **/ - -#define DISK_SPACE_LIMIT_DEFAULT 500 /**< Global default configuration maximum database disk space limit per log source **/ - -#if !defined(LOGS_MANAGEMENT_DEV_MODE) -#define GLOBAL_DB_MODE_DEFAULT_STR "none" /**< db mode string to be used as global default in configuration **/ -#define GLOBAL_DB_MODE_DEFAULT LOGS_MANAG_DB_MODE_NONE /**< db mode to be used as global default, matching GLOBAL_DB_MODE_DEFAULT_STR **/ -#else -#define GLOBAL_DB_MODE_DEFAULT_STR "full" /**< db mode string to be used as global default in configuration, if stress tests are enabled **/ -#define GLOBAL_DB_MODE_DEFAULT LOGS_MANAG_DB_MODE_FULL /**< db mode to be used as global default, matching GLOBAL_DB_MODE_DEFAULT_STR, if stress tests are enabled **/ -#endif - -/* -------------------------------------------------------------------------- */ - - -/* -------------------------------------------------------------------------- */ -/* Circular Buffer */ -/* -------------------------------------------------------------------------- */ - -#define CIRCULAR_BUFF_SPARE_ITEMS_DEFAULT 2 /**< Additional circular buffers items to give time to the db engine to save buffers to disk **/ - -#define CIRCULAR_BUFF_DEFAULT_MAX_SIZE (64 MiB) /**< Default circular_buffer_max_size **/ -#define CIRCULAR_BUFF_MAX_SIZE_RANGE_MIN (1 MiB) /**< circular_buffer_max_size read from configuration cannot be smaller than this **/ -#define CIRCULAR_BUFF_MAX_SIZE_RANGE_MAX (4 GiB) /**< circular_buffer_max_size read from configuration cannot be larger than this **/ - -#define CIRCULAR_BUFF_DEFAULT_DROP_LOGS 0 /**< Global default configuration value whether to drop logs if circular buffer is full **/ - -#define CIRC_BUFF_PREP_WR_RETRY_AFTER_MS 1000 /**< If circ_buff_prepare_write() fails due to not enough space, how many millisecs to wait before retrying **/ - -/* -------------------------------------------------------------------------- */ - - -/* -------------------------------------------------------------------------- */ -/* Compression */ -/* -------------------------------------------------------------------------- */ - -#define COMPRESSION_ACCELERATION_DEFAULT 1 /**< Global default value for compression acceleration **/ - -/* -------------------------------------------------------------------------- */ - - -/* -------------------------------------------------------------------------- */ -/* Kernel logs (kmsg) plugin */ -/* -------------------------------------------------------------------------- */ - -#define KERNEL_LOGS_COLLECT_INIT_WAIT 5 /**< Wait time (in sec) before kernel log collection starts. Required in order to skip collection and processing of pre-existing logs at Netdata boot. **/ - -/* -------------------------------------------------------------------------- */ - - -/* -------------------------------------------------------------------------- */ -/* Fluent Bit */ -/* -------------------------------------------------------------------------- */ - -#define FLB_FLUSH_DEFAULT "0.1" /**< Default Fluent Bit flush interval **/ -#define FLB_HTTP_LISTEN_DEFAULT "0.0.0.0" /**< Default Fluent Bit server listening socket **/ -#define FLB_HTTP_PORT_DEFAULT "2020" /**< Default Fluent Bit server listening port **/ -#define FLB_HTTP_SERVER_DEFAULT "false" /**< Default Fluent Bit server enable status **/ -#define FLB_LOG_FILENAME_DEFAULT "fluentbit.log" /**< Default Fluent Bit log filename **/ -#define FLB_LOG_LEVEL_DEFAULT "info" /**< Default Fluent Bit log level **/ -#define FLB_CORO_STACK_SIZE_DEFAULT "24576" /**< Default Fluent Bit coro stack size - do not change this value unless there is a good reason **/ - -#define FLB_FORWARD_UNIX_PATH_DEFAULT "" /**< Default path for Forward unix socket configuration, see also https://docs.fluentbit.io/manual/pipeline/inputs/forward#configuration-parameters **/ -#define FLB_FORWARD_UNIX_PERM_DEFAULT "0644" /**< Default permissions for Forward unix socket configuration, see also https://docs.fluentbit.io/manual/pipeline/inputs/forward#configuration-parameters **/ -#define FLB_FORWARD_ADDR_DEFAULT "0.0.0.0" /**< Default listen address for Forward socket configuration, see also https://docs.fluentbit.io/manual/pipeline/inputs/forward#configuration-parameters **/ -#define FLB_FORWARD_PORT_DEFAULT "24224" /**< Default listen port for Forward socket configuration, see also https://docs.fluentbit.io/manual/pipeline/inputs/forward#configuration-parameters **/ - -/* -------------------------------------------------------------------------- */ - - -/* -------------------------------------------------------------------------- */ -/* Queries */ -/* -------------------------------------------------------------------------- */ - -#define LOGS_MANAG_MAX_COMPOUND_QUERY_SOURCES 10U /**< Maximum allowed number of log sources that can be searched in a single query **/ -#define LOGS_MANAG_QUERY_QUOTA_DEFAULT (10 MiB) /**< Default logs management query quota **/ -#define LOGS_MANAG_QUERY_QUOTA_MAX MAX_LOG_MSG_SIZE /**< Max logs management query quota **/ -#define LOGS_MANAG_QUERY_IGNORE_CASE_DEFAULT 0 /**< Boolean to indicate whether to ignore case for keyword or not **/ -#define LOGS_MANAG_QUERY_SANITIZE_KEYWORD_DEFAULT 0 /**< Boolean to indicate whether to sanitize keyword or not **/ -#define LOGS_MANAG_QUERY_TIMEOUT_DEFAULT 30 /**< Default timeout of logs management queries (in secs) **/ - -/* -------------------------------------------------------------------------- */ - - -#endif // LOGSMANAG_DEFAULTS_H_ diff --git a/src/logsmanagement/file_info.h b/src/logsmanagement/file_info.h deleted file mode 100644 index 224f4ecc4..000000000 --- a/src/logsmanagement/file_info.h +++ /dev/null @@ -1,165 +0,0 @@ -// SPDX-License-Identifier: GPL-3.0-or-later - -/** @file file_info.h - * @brief Includes the File_info structure that is the primary - * structure for configuring each log source. - */ - -#ifndef FILE_INFO_H_ -#define FILE_INFO_H_ - -#include <uv.h> -#include "database/sqlite/sqlite3.h" -#include "defaults.h" -#include "parser.h" - -// Cool trick --> http://userpage.fu-berlin.de/~ram/pub/pub_jf47ht81Ht/c_preprocessor_applications_en -/* WARNING: DO NOT CHANGED THE ORDER OF LOG_SRC_TYPES, ONLY APPEND NEW TYPES */ -#define LOG_SRC_TYPES LST(FLB_TAIL)LST(FLB_WEB_LOG)LST(FLB_KMSG) \ - LST(FLB_SYSTEMD)LST(FLB_DOCKER_EV)LST(FLB_SYSLOG) \ - LST(FLB_SERIAL)LST(FLB_MQTT) -#define LST(x) x, -enum log_src_type_t {LOG_SRC_TYPES}; -#undef LST -#define LST(x) #x, -static const char * const log_src_type_t_str[] = {LOG_SRC_TYPES}; -#undef LST - -#define LOG_SRCS LST(LOG_SOURCE_LOCAL)LST(LOG_SOURCE_FORWARD) -#define LST(x) x, -enum log_src_t {LOG_SRCS}; -#undef LST -#define LST(x) #x, -static const char * const log_src_t_str[] = {LOG_SRCS}; -#undef LST - -#include "rrd_api/rrd_api.h" - -typedef enum log_src_state { - LOG_SRC_UNINITIALIZED = 0, /*!< config not initialized */ - LOG_SRC_READY, /*!< config initialized (monitoring may have started or not) */ - LOG_SRC_EXITING /*!< cleanup and destroy stage */ -} LOG_SRC_STATE; - -typedef struct flb_tail_config { - int use_inotify; -} Flb_tail_config_t; - -typedef struct flb_kmsg_config { - char *prio_level; -} Flb_kmsg_config_t; - -typedef struct flb_serial_config { - char *bitrate; - char *min_bytes; - char *separator; - char *format; -} Flb_serial_config_t; - -typedef struct flb_socket_config { - char *mode; - char *unix_path; - char *unix_perm; - char *listen; - char *port; -} Flb_socket_config_t; - -typedef struct syslog_parser_config { - char *log_format; - Flb_socket_config_t *socket_config; -} Syslog_parser_config_t; - -typedef struct flb_output_config { - char *plugin; /**< Fluent Bit output plugin name, see: https://docs.fluentbit.io/manual/pipeline/outputs **/ - int id; /**< Incremental id of plugin configuration in linked list, starting from 1 **/ - struct flb_output_config_param { - char *key; /**< Key of the parameter configuration **/ - char *val; /**< Value of the parameter configuration **/ - struct flb_output_config_param *next; /**< Next output parameter configuration in the linked list of parameters **/ - } *param; - struct flb_output_config *next; /**< Next output plugin configuration in the linked list of output plugins **/ -} Flb_output_config_t; - -struct File_info { - - /* Struct members core to any log source type */ - const char *chartname; /**< Top level chart name for this log source on web dashboard **/ - char *filename; /**< Full path of log source **/ - const char *file_basename; /**< Basename of log source **/ - const char *stream_guid; /**< Streaming input GUID **/ - enum log_src_t log_source; /**< Defines log source origin - see enum log_src_t for options **/ - enum log_src_type_t log_type; /**< Defines type of log source - see enum log_src_type_t for options **/ - struct Circ_buff *circ_buff; /**< Associated circular buffer - only one should exist per log source. **/ - int compression_accel; /**< LZ4 compression acceleration factor for collected logs, see also: https://github.com/lz4/lz4/blob/90d68e37093d815e7ea06b0ee3c168cccffc84b8/lib/lz4.h#L195 **/ - int update_every; /**< Interval (in sec) of how often to collect and update charts **/ - int update_timeout; /**< Timeout to update charts after, since last update */ - int use_log_timestamp; /**< Use log timestamps instead of collection timestamps, if available **/ - int do_sd_journal_send; /**< Write to system journal - not applicable to all log source types **/ - struct Chart_meta *chart_meta; - LOG_SRC_STATE state; /**< State of log source, used to sync status among threads **/ - - /* Struct members related to disk database */ - sqlite3 *db; /**< SQLite3 DB connection to DB that contains metadata for this log source **/ - const char *db_dir; /**< Path to metadata DB and compressed log BLOBs directory **/ - const char *db_metadata; /**< Path to metadata DB file **/ - uv_mutex_t *db_mut; /**< DB access mutex **/ - uv_thread_t *db_writer_thread; /**< Thread responsible for handling the DB writes **/ - uv_file blob_handles[BLOB_MAX_FILES + 1]; /**< File handles for BLOB files. Item 0 not used - just for matching 1-1 with DB ids **/ - logs_manag_db_mode_t db_mode; /**< DB mode as enum. **/ - int blob_write_handle_offset; /**< File offset denoting HEAD of currently open database BLOB file **/ - int buff_flush_to_db_interval; /**< Frequency at which RAM buffers of this log source will be flushed to the database **/ - int64_t blob_max_size; /**< When the size of a BLOB exceeds this value, the BLOB gets rotated. **/ - int64_t blob_total_size; /**< This is the total disk space that all BLOBs occupy (for this log source) **/ - int64_t db_write_duration; /**< Holds timing details related to duration of DB write operations **/ - int64_t db_rotate_duration; /**< Holds timing details related to duration of DB rorate operations **/ - sqlite3_stmt *stmt_get_log_msg_metadata_asc; /**< SQLITE3 statement used to retrieve metadata from database during queries in ascending order **/ - sqlite3_stmt *stmt_get_log_msg_metadata_desc; /**< SQLITE3 statement used to retrieve metadata from database during queries in descending order **/ - - /* Struct members related to queries */ - struct { - usec_t user; - usec_t sys; - } cpu_time_per_mib; - - /* Struct members related to log parsing */ - Log_parser_config_t *parser_config; /**< Configuration to be user by log parser - read from logsmanagement.conf **/ - Log_parser_cus_config_t **parser_cus_config; /**< Array of custom log parsing configurations **/ - Log_parser_metrics_t *parser_metrics; /**< Extracted metrics **/ - - /* Struct members related to Fluent-Bit inputs, filters, buffers, outputs */ - int flb_input; /**< Fluent-bit input interface property for this log source **/ - int flb_parser; /**< Fluent-bit parser interface property for this log source **/ - int flb_lib_output; /**< Fluent-bit "lib" output interface property for this log source **/ - void *flb_config; /**< Any other Fluent-Bit configuration specific to this log source only **/ - uv_mutex_t flb_tmp_buff_mut; - uv_timer_t flb_tmp_buff_cpy_timer; - Flb_output_config_t *flb_outputs; /**< Linked list of Fluent Bit outputs for this log source **/ - -}; - -struct File_infos_arr { - struct File_info **data; - uint8_t count; /**< Number of items in array **/ -}; - -extern struct File_infos_arr *p_file_infos_arr; /**< Array that contains all p_file_info structs for all log sources **/ - -typedef struct { - int update_every; - int update_timeout; - int use_log_timestamp; - int circ_buff_max_size_in_mib; - int circ_buff_drop_logs; - int compression_acceleration; - logs_manag_db_mode_t db_mode; - int disk_space_limit_in_mib; - int buff_flush_to_db_interval; - int enable_collected_logs_total; - int enable_collected_logs_rate; - char *sd_journal_field_prefix; - int do_sd_journal_send; -} g_logs_manag_config_t; - -extern g_logs_manag_config_t g_logs_manag_config; - -#endif // FILE_INFO_H_ diff --git a/src/logsmanagement/flb_plugin.c b/src/logsmanagement/flb_plugin.c deleted file mode 100644 index a583d8f95..000000000 --- a/src/logsmanagement/flb_plugin.c +++ /dev/null @@ -1,1536 +0,0 @@ -// SPDX-License-Identifier: GPL-3.0-or-later - -/** @file flb_plugin.c - * @brief This file includes all functions that act as an API to - * the Fluent Bit library. - */ - -#include "flb_plugin.h" -#include <lz4.h> -#include "helper.h" -#include "defaults.h" -#include "circular_buffer.h" -#include "daemon/common.h" -#include "libnetdata/libnetdata.h" -#include "../fluent-bit/lib/msgpack-c/include/msgpack/unpack.h" -#include "../fluent-bit/lib/msgpack-c/include/msgpack/object.h" -#include "../fluent-bit/lib/monkey/include/monkey/mk_core/mk_list.h" -#include <dlfcn.h> - -#ifdef HAVE_SYSTEMD -#include <systemd/sd-journal.h> -#define SD_JOURNAL_SEND_DEFAULT_FIELDS \ - "%s_LOG_SOURCE=%s" , sd_journal_field_prefix, log_src_t_str[p_file_info->log_source], \ - "%s_LOG_TYPE=%s" , sd_journal_field_prefix, log_src_type_t_str[p_file_info->log_type] -#endif - -#define LOG_REC_KEY "msg" /**< key to represent log message field in most log sources **/ -#define LOG_REC_KEY_SYSTEMD "MESSAGE" /**< key to represent log message field in systemd log source **/ -#define SYSLOG_TIMESTAMP_SIZE 16 -#define UNKNOWN "unknown" - - -/* Including "../fluent-bit/include/fluent-bit/flb_macros.h" causes issues - * with CI, as it requires mk_core/mk_core_info.h which is generated only - * after Fluent Bit has been built. We can instead just redefined a couple - * of macros here: */ -#define FLB_FALSE 0 -#define FLB_TRUE !FLB_FALSE - -/* For similar reasons, (re)define the following macros from "flb_lib.h": */ -/* Lib engine status */ -#define FLB_LIB_ERROR -1 -#define FLB_LIB_NONE 0 -#define FLB_LIB_OK 1 -#define FLB_LIB_NO_CONFIG_MAP 2 - -/* Following structs are the same as defined in fluent-bit/flb_lib.h and - * fluent-bit/flb_time.h, but need to be redefined due to use of dlsym(). */ - -struct flb_time { - struct timespec tm; -}; - -/* Library mode context data */ -struct flb_lib_ctx { - int status; - struct mk_event_loop *event_loop; - struct mk_event *event_channel; - struct flb_config *config; -}; - -struct flb_parser_types { - char *key; - int key_len; - int type; -}; - -struct flb_parser { - /* configuration */ - int type; /* parser type */ - char *name; /* format name */ - char *p_regex; /* pattern for main regular expression */ - int skip_empty; /* skip empty regex matches */ - char *time_fmt; /* time format */ - char *time_fmt_full; /* original given time format */ - char *time_key; /* field name that contains the time */ - int time_offset; /* fixed UTC offset */ - int time_keep; /* keep time field */ - int time_strict; /* parse time field strictly */ - int logfmt_no_bare_keys; /* in logfmt parsers, require all keys to have values */ - char *time_frac_secs; /* time format have fractional seconds ? */ - struct flb_parser_types *types; /* type casting */ - int types_len; - - /* Field decoders */ - struct mk_list *decoders; - - /* internal */ - int time_with_year; /* do time_fmt consider a year (%Y) ? */ - char *time_fmt_year; - int time_with_tz; /* do time_fmt consider a timezone ? */ - struct flb_regex *regex; - struct mk_list _head; -}; - -struct flb_lib_out_cb { - int (*cb) (void *record, size_t size, void *data); - void *data; -}; - -typedef struct flb_lib_ctx flb_ctx_t; - -static flb_ctx_t *(*flb_create)(void); -static int (*flb_service_set)(flb_ctx_t *ctx, ...); -static int (*flb_start)(flb_ctx_t *ctx); -static int (*flb_stop)(flb_ctx_t *ctx); -static void (*flb_destroy)(flb_ctx_t *ctx); -static int (*flb_time_pop_from_msgpack)(struct flb_time *time, msgpack_unpacked *upk, msgpack_object **map); -static int (*flb_lib_free)(void *data); -static struct flb_parser *(*flb_parser_create)( const char *name, const char *format, const char *p_regex, int skip_empty, - const char *time_fmt, const char *time_key, const char *time_offset, - int time_keep, int time_strict, int logfmt_no_bare_keys, - struct flb_parser_types *types, int types_len,struct mk_list *decoders, - struct flb_config *config); -static int (*flb_input)(flb_ctx_t *ctx, const char *input, void *data); -static int (*flb_input_set)(flb_ctx_t *ctx, int ffd, ...); -// static int (*flb_filter)(flb_ctx_t *ctx, const char *filter, void *data); -// static int (*flb_filter_set)(flb_ctx_t *ctx, int ffd, ...); -static int (*flb_output)(flb_ctx_t *ctx, const char *output, struct flb_lib_out_cb *cb); -static int (*flb_output_set)(flb_ctx_t *ctx, int ffd, ...); -static msgpack_unpack_return (*dl_msgpack_unpack_next)(msgpack_unpacked* result, const char* data, size_t len, size_t* off); -static void (*dl_msgpack_zone_free)(msgpack_zone* zone); -static int (*dl_msgpack_object_print_buffer)(char *buffer, size_t buffer_size, msgpack_object o); - -static flb_ctx_t *ctx = NULL; -static void *flb_lib_handle = NULL; - -static struct flb_lib_out_cb *fwd_input_out_cb = NULL; - -static const char *sd_journal_field_prefix = SD_JOURNAL_FIELD_PREFIX; - -extern netdata_mutex_t stdout_mut; - -int flb_init(flb_srvc_config_t flb_srvc_config, - const char *const stock_config_dir, - const char *const new_sd_journal_field_prefix){ - int rc = 0; - char *dl_error; - - char *flb_lib_path = strdupz_path_subpath(stock_config_dir, "/../libfluent-bit.so"); - if (unlikely(NULL == (flb_lib_handle = dlopen(flb_lib_path, RTLD_LAZY)))){ - if (NULL != (dl_error = dlerror())) - collector_error("dlopen() libfluent-bit.so error: %s", dl_error); - rc = -1; - goto do_return; - } - - dlerror(); /* Clear any existing error */ - - /* Load Fluent-Bit functions from the shared library */ - #define load_function(FUNC_NAME){ \ - *(void **) (&FUNC_NAME) = dlsym(flb_lib_handle, LOGS_MANAG_STR(FUNC_NAME)); \ - if ((dl_error = dlerror()) != NULL) { \ - collector_error("dlerror loading %s: %s", LOGS_MANAG_STR(FUNC_NAME), dl_error); \ - rc = -1; \ - goto do_return; \ - } \ - } - - load_function(flb_create); - load_function(flb_service_set); - load_function(flb_start); - load_function(flb_stop); - load_function(flb_destroy); - load_function(flb_time_pop_from_msgpack); - load_function(flb_lib_free); - load_function(flb_parser_create); - load_function(flb_input); - load_function(flb_input_set); - // load_function(flb_filter); - // load_function(flb_filter_set); - load_function(flb_output); - load_function(flb_output_set); - *(void **) (&dl_msgpack_unpack_next) = dlsym(flb_lib_handle, "msgpack_unpack_next"); - if ((dl_error = dlerror()) != NULL) { - collector_error("dlerror loading msgpack_unpack_next: %s", dl_error); - rc = -1; - goto do_return; - } - *(void **) (&dl_msgpack_zone_free) = dlsym(flb_lib_handle, "msgpack_zone_free"); - if ((dl_error = dlerror()) != NULL) { - collector_error("dlerror loading msgpack_zone_free: %s", dl_error); - rc = -1; - goto do_return; - } - *(void **) (&dl_msgpack_object_print_buffer) = dlsym(flb_lib_handle, "msgpack_object_print_buffer"); - if ((dl_error = dlerror()) != NULL) { - collector_error("dlerror loading msgpack_object_print_buffer: %s", dl_error); - rc = -1; - goto do_return; - } - - ctx = flb_create(); - if (unlikely(!ctx)){ - rc = -1; - goto do_return; - } - - /* Global service settings */ - if(unlikely(flb_service_set(ctx, - "Flush" , flb_srvc_config.flush, - "HTTP_Listen" , flb_srvc_config.http_listen, - "HTTP_Port" , flb_srvc_config.http_port, - "HTTP_Server" , flb_srvc_config.http_server, - "Log_File" , flb_srvc_config.log_path, - "Log_Level" , flb_srvc_config.log_level, - "Coro_stack_size" , flb_srvc_config.coro_stack_size, - NULL) != 0 )){ - rc = -1; - goto do_return; - } - - if(new_sd_journal_field_prefix && *new_sd_journal_field_prefix) - sd_journal_field_prefix = new_sd_journal_field_prefix; - -do_return: - freez(flb_lib_path); - if(unlikely(rc && flb_lib_handle)) - dlclose(flb_lib_handle); - - return rc; -} - -int flb_run(void){ - if (likely(flb_start(ctx)) == 0) return 0; - else return -1; -} - -void flb_terminate(void){ - if(ctx){ - flb_stop(ctx); - flb_destroy(ctx); - ctx = NULL; - } - if(flb_lib_handle) - dlclose(flb_lib_handle); -} - -static void flb_complete_buff_item(struct File_info *p_file_info){ - - Circ_buff_t *buff = p_file_info->circ_buff; - - m_assert(buff->in->timestamp, "buff->in->timestamp cannot be 0"); - m_assert(buff->in->data, "buff->in->text cannot be NULL"); - m_assert(*buff->in->data, "*buff->in->text cannot be 0"); - m_assert(buff->in->text_size, "buff->in->text_size cannot be 0"); - - /* Replace last '\n' with '\0' to null-terminate text */ - buff->in->data[buff->in->text_size - 1] = '\0'; - - /* Store status (timestamp and text_size must have already been - * stored during flb_collect_logs_cb() ). */ - buff->in->status = CIRC_BUFF_ITEM_STATUS_UNPROCESSED; - - /* Load max size of compressed buffer, as calculated previously */ - size_t text_compressed_buff_max_size = buff->in->text_compressed_size; - - /* Do compression. - * TODO: Validate compression option? */ - buff->in->text_compressed = buff->in->data + buff->in->text_size; - buff->in->text_compressed_size = LZ4_compress_fast( buff->in->data, - buff->in->text_compressed, - buff->in->text_size, - text_compressed_buff_max_size, - p_file_info->compression_accel); - m_assert(buff->in->text_compressed_size != 0, "Text_compressed_size should be != 0"); - - p_file_info->parser_metrics->last_update = buff->in->timestamp / MSEC_PER_SEC; - - p_file_info->parser_metrics->num_lines += buff->in->num_lines; - - /* Perform custom log chart parsing */ - for(int i = 0; p_file_info->parser_cus_config[i]; i++){ - p_file_info->parser_metrics->parser_cus[i]->count += - search_keyword( buff->in->data, buff->in->text_size, NULL, NULL, - NULL, &p_file_info->parser_cus_config[i]->regex, 0); - } - - /* Update charts */ - netdata_mutex_lock(&stdout_mut); - p_file_info->chart_meta->update(p_file_info); - fflush(stdout); - netdata_mutex_unlock(&stdout_mut); - - circ_buff_insert(buff); - - uv_timer_again(&p_file_info->flb_tmp_buff_cpy_timer); -} - -void flb_complete_item_timer_timeout_cb(uv_timer_t *handle) { - - struct File_info *p_file_info = handle->data; - Circ_buff_t *buff = p_file_info->circ_buff; - - uv_mutex_lock(&p_file_info->flb_tmp_buff_mut); - if(!buff->in->data || !*buff->in->data || !buff->in->text_size){ - p_file_info->parser_metrics->last_update = now_realtime_sec(); - netdata_mutex_lock(&stdout_mut); - p_file_info->chart_meta->update(p_file_info); - fflush(stdout); - netdata_mutex_unlock(&stdout_mut); - uv_mutex_unlock(&p_file_info->flb_tmp_buff_mut); - return; - } - - flb_complete_buff_item(p_file_info); - - uv_mutex_unlock(&p_file_info->flb_tmp_buff_mut); -} - -static int flb_collect_logs_cb(void *record, size_t size, void *data){ - - /* "data" is NULL for Forward-type sources and non-NULL for local sources */ - struct File_info *p_file_info = (struct File_info *) data; - Circ_buff_t *buff = NULL; - - msgpack_unpacked result; - size_t off = 0; - struct flb_time tmp_time; - msgpack_object *x; - - char timestamp_str[TIMESTAMP_MS_STR_SIZE] = ""; - msec_t timestamp = 0; - - struct resizable_key_val_arr { - char **key; - char **val; - size_t *key_size; - size_t *val_size; - int size, max_size; - }; - - /* FLB_WEB_LOG case */ - Log_line_parsed_t line_parsed = (Log_line_parsed_t) {0}; - /* FLB_WEB_LOG case end */ - - /* FLB_KMSG case */ - static int skip_kmsg_log_buffering = 1; - int kmsg_sever = -1; // -1 equals invalid - /* FLB_KMSG case end */ - - /* FLB_SYSTEMD or FLB_SYSLOG case */ - char syslog_prival[4] = ""; - size_t syslog_prival_size = 0; - char syslog_severity[2] = ""; - char syslog_facility[3] = ""; - char *syslog_timestamp = NULL; - size_t syslog_timestamp_size = 0; - char *hostname = NULL; - size_t hostname_size = 0; - char *syslog_identifier = NULL; - size_t syslog_identifier_size = 0; - char *pid = NULL; - size_t pid_size = 0; - char *message = NULL; - size_t message_size = 0; - /* FLB_SYSTEMD or FLB_SYSLOG case end */ - - /* FLB_DOCKER_EV case */ - long docker_ev_time = 0; - long docker_ev_timeNano = 0; - char *docker_ev_type = NULL; - size_t docker_ev_type_size = 0; - char *docker_ev_action = NULL; - size_t docker_ev_action_size = 0; - char *docker_ev_id = NULL; - size_t docker_ev_id_size = 0; - static struct resizable_key_val_arr docker_ev_attr = {0}; - docker_ev_attr.size = 0; - /* FLB_DOCKER_EV case end */ - - /* FLB_MQTT case */ - char *mqtt_topic = NULL; - size_t mqtt_topic_size = 0; - static char *mqtt_message = NULL; - static size_t mqtt_message_size_max = 0; - /* FLB_MQTT case end */ - - size_t new_tmp_text_size = 0; - - msgpack_unpacked_init(&result); - - int iter = 0; - while (dl_msgpack_unpack_next(&result, record, size, &off) == MSGPACK_UNPACK_SUCCESS) { - iter++; - m_assert(iter == 1, "We do not expect more than one loop iteration here"); - - flb_time_pop_from_msgpack(&tmp_time, &result, &x); - - if(likely(x->type == MSGPACK_OBJECT_MAP && x->via.map.size != 0)){ - msgpack_object_kv* p = x->via.map.ptr; - msgpack_object_kv* pend = x->via.map.ptr + x->via.map.size; - - /* ================================================================ - * If p_file_info == NULL, it means it is a "Forward" source, so - * we need to search for the associated p_file_info. This code can - * be optimized further. - * ============================================================== */ - if(p_file_info == NULL){ - do{ - if(!strncmp(p->key.via.str.ptr, "stream guid", (size_t) p->key.via.str.size)){ - char *stream_guid = (char *) p->val.via.str.ptr; - size_t stream_guid_size = p->val.via.str.size; - debug_log( "stream guid:%.*s", (int) stream_guid_size, stream_guid); - - for (int i = 0; i < p_file_infos_arr->count; i++) { - if(!strncmp(p_file_infos_arr->data[i]->stream_guid, stream_guid, stream_guid_size)){ - p_file_info = p_file_infos_arr->data[i]; - // debug_log( "p_file_info match found: %s type[%s]", - // p_file_info->stream_guid, - // log_src_type_t_str[p_file_info->log_type]); - break; - } - } - } - ++p; - // continue; - } while(p < pend); - } - if(unlikely(p_file_info == NULL)) - goto skip_collect_and_drop_logs; - - - uv_mutex_lock(&p_file_info->flb_tmp_buff_mut); - buff = p_file_info->circ_buff; - - - p = x->via.map.ptr; - pend = x->via.map.ptr + x->via.map.size; - do{ - switch(p_file_info->log_type){ - - case FLB_TAIL: - case FLB_WEB_LOG: - case FLB_SERIAL: - { - if( !strncmp(p->key.via.str.ptr, LOG_REC_KEY, (size_t) p->key.via.str.size) || - /* The following line is in case we collect systemd logs - * (tagged as "MESSAGE") or docker_events (tagged as - * "message") via a "Forward" source to an FLB_TAIL parent. */ - !strncasecmp(p->key.via.str.ptr, LOG_REC_KEY_SYSTEMD, (size_t) p->key.via.str.size)){ - - message = (char *) p->val.via.str.ptr; - message_size = p->val.via.str.size; - - if(p_file_info->log_type == FLB_WEB_LOG){ - parse_web_log_line( (Web_log_parser_config_t *) p_file_info->parser_config->gen_config, - message, message_size, &line_parsed); - - if(likely(p_file_info->use_log_timestamp)){ - timestamp = line_parsed.timestamp * MSEC_PER_SEC; // convert to msec from sec - - { /* ------------------ FIXME ------------------------ - * Temporary kludge so that metrics don't break when - * a new record has timestamp before the current one. - */ - static msec_t previous_timestamp = 0; - if((((long long) timestamp - (long long) previous_timestamp) < 0)) - timestamp = previous_timestamp; - - previous_timestamp = timestamp; - } - } - } - - new_tmp_text_size = message_size + 1; // +1 for '\n' - - m_assert(message_size, "message_size is 0"); - m_assert(message, "message is NULL"); - } - - break; - } - - case FLB_KMSG: - { - if(unlikely(skip_kmsg_log_buffering)){ - static time_t start_time = 0; - if (!start_time) start_time = now_boottime_sec(); - if(now_boottime_sec() - start_time < KERNEL_LOGS_COLLECT_INIT_WAIT) - goto skip_collect_and_drop_logs; - else skip_kmsg_log_buffering = 0; - } - - /* NOTE/WARNING: - * kmsg timestamps are tricky. The timestamp will be - * *wrong** if the system has gone into hibernation since - * last boot and "p_file_info->use_log_timestamp" is set. - * Even if "p_file_info->use_log_timestamp" is NOT set, we - * need to use now_realtime_msec() as Fluent Bit timestamp - * will also be wrong. */ - if( !strncmp(p->key.via.str.ptr, "sec", (size_t) p->key.via.str.size)){ - if(p_file_info->use_log_timestamp){ - timestamp += (now_realtime_sec() - now_boottime_sec() + p->val.via.i64) * MSEC_PER_SEC; - } - else if(!timestamp) - timestamp = now_realtime_msec(); - } - else if(!strncmp(p->key.via.str.ptr, "usec", (size_t) p->key.via.str.size) && - p_file_info->use_log_timestamp){ - timestamp += p->val.via.i64 / USEC_PER_MS; - } - else if(!strncmp(p->key.via.str.ptr, LOG_REC_KEY, (size_t) p->key.via.str.size)){ - message = (char *) p->val.via.str.ptr; - message_size = p->val.via.str.size; - - m_assert(message, "message is NULL"); - m_assert(message_size, "message_size is 0"); - - new_tmp_text_size += message_size + 1; // +1 for '\n' - } - else if(!strncmp(p->key.via.str.ptr, "priority", (size_t) p->key.via.str.size)){ - kmsg_sever = (int) p->val.via.u64; - } - - break; - } - - case FLB_SYSTEMD: - case FLB_SYSLOG: - { - if( p_file_info->use_log_timestamp && !strncmp( p->key.via.str.ptr, - "SOURCE_REALTIME_TIMESTAMP", - (size_t) p->key.via.str.size)){ - - m_assert(p->val.via.str.size - 3 == TIMESTAMP_MS_STR_SIZE - 1, - "p->val.via.str.size - 3 != TIMESTAMP_MS_STR_SIZE"); - - strncpyz(timestamp_str, p->val.via.str.ptr, (size_t) p->val.via.str.size); - - char *endptr = NULL; - timestamp = str2ll(timestamp_str, &endptr); - timestamp = *endptr ? 0 : timestamp / USEC_PER_MS; - } - else if(!strncmp(p->key.via.str.ptr, "PRIVAL", (size_t) p->key.via.str.size)){ - m_assert(p->val.via.str.size <= 3, "p->val.via.str.size > 3"); - strncpyz(syslog_prival, p->val.via.str.ptr, (size_t) p->val.via.str.size); - syslog_prival_size = (size_t) p->val.via.str.size; - - m_assert(syslog_prival, "syslog_prival is NULL"); - } - else if(!strncmp(p->key.via.str.ptr, "PRIORITY", (size_t) p->key.via.str.size)){ - m_assert(p->val.via.str.size <= 1, "p->val.via.str.size > 1"); - strncpyz(syslog_severity, p->val.via.str.ptr, (size_t) p->val.via.str.size); - - m_assert(syslog_severity, "syslog_severity is NULL"); - } - else if(!strncmp(p->key.via.str.ptr, "SYSLOG_FACILITY", (size_t) p->key.via.str.size)){ - m_assert(p->val.via.str.size <= 2, "p->val.via.str.size > 2"); - strncpyz(syslog_facility, p->val.via.str.ptr, (size_t) p->val.via.str.size); - - m_assert(syslog_facility, "syslog_facility is NULL"); - } - else if(!strncmp(p->key.via.str.ptr, "SYSLOG_TIMESTAMP", (size_t) p->key.via.str.size)){ - syslog_timestamp = (char *) p->val.via.str.ptr; - syslog_timestamp_size = p->val.via.str.size; - - m_assert(syslog_timestamp, "syslog_timestamp is NULL"); - m_assert(syslog_timestamp_size, "syslog_timestamp_size is 0"); - - new_tmp_text_size += syslog_timestamp_size; - } - else if(!strncmp(p->key.via.str.ptr, "HOSTNAME", (size_t) p->key.via.str.size)){ - hostname = (char *) p->val.via.str.ptr; - hostname_size = p->val.via.str.size; - - m_assert(hostname, "hostname is NULL"); - m_assert(hostname_size, "hostname_size is 0"); - - new_tmp_text_size += hostname_size + 1; // +1 for ' ' char - } - else if(!strncmp(p->key.via.str.ptr, "SYSLOG_IDENTIFIER", (size_t) p->key.via.str.size)){ - syslog_identifier = (char *) p->val.via.str.ptr; - syslog_identifier_size = p->val.via.str.size; - - new_tmp_text_size += syslog_identifier_size; - } - else if(!strncmp(p->key.via.str.ptr, "PID", (size_t) p->key.via.str.size)){ - pid = (char *) p->val.via.str.ptr; - pid_size = p->val.via.str.size; - - new_tmp_text_size += pid_size; - } - else if(!strncmp(p->key.via.str.ptr, LOG_REC_KEY_SYSTEMD, (size_t) p->key.via.str.size)){ - - message = (char *) p->val.via.str.ptr; - message_size = p->val.via.str.size; - - m_assert(message, "message is NULL"); - m_assert(message_size, "message_size is 0"); - - new_tmp_text_size += message_size; - } - - break; - } - - case FLB_DOCKER_EV: - { - if(!strncmp(p->key.via.str.ptr, "time", (size_t) p->key.via.str.size)){ - docker_ev_time = p->val.via.i64; - - m_assert(docker_ev_time, "docker_ev_time is 0"); - } - else if(!strncmp(p->key.via.str.ptr, "timeNano", (size_t) p->key.via.str.size)){ - docker_ev_timeNano = p->val.via.i64; - - m_assert(docker_ev_timeNano, "docker_ev_timeNano is 0"); - - if(likely(p_file_info->use_log_timestamp)) - timestamp = docker_ev_timeNano / NSEC_PER_MSEC; - } - else if(!strncmp(p->key.via.str.ptr, "Type", (size_t) p->key.via.str.size)){ - docker_ev_type = (char *) p->val.via.str.ptr; - docker_ev_type_size = p->val.via.str.size; - - m_assert(docker_ev_type, "docker_ev_type is NULL"); - m_assert(docker_ev_type_size, "docker_ev_type_size is 0"); - - // debug_log("docker_ev_type: %.*s", docker_ev_type_size, docker_ev_type); - } - else if(!strncmp(p->key.via.str.ptr, "Action", (size_t) p->key.via.str.size)){ - docker_ev_action = (char *) p->val.via.str.ptr; - docker_ev_action_size = p->val.via.str.size; - - m_assert(docker_ev_action, "docker_ev_action is NULL"); - m_assert(docker_ev_action_size, "docker_ev_action_size is 0"); - - // debug_log("docker_ev_action: %.*s", docker_ev_action_size, docker_ev_action); - } - else if(!strncmp(p->key.via.str.ptr, "id", (size_t) p->key.via.str.size)){ - docker_ev_id = (char *) p->val.via.str.ptr; - docker_ev_id_size = p->val.via.str.size; - - m_assert(docker_ev_id, "docker_ev_id is NULL"); - m_assert(docker_ev_id_size, "docker_ev_id_size is 0"); - - // debug_log("docker_ev_id: %.*s", docker_ev_id_size, docker_ev_id); - } - else if(!strncmp(p->key.via.str.ptr, "Actor", (size_t) p->key.via.str.size)){ - // debug_log( "msg key:[%.*s]val:[%.*s]", (int) p->key.via.str.size, - // p->key.via.str.ptr, - // (int) p->val.via.str.size, - // p->val.via.str.ptr); - if(likely(p->val.type == MSGPACK_OBJECT_MAP && p->val.via.map.size != 0)){ - msgpack_object_kv* ac = p->val.via.map.ptr; - msgpack_object_kv* const ac_pend= p->val.via.map.ptr + p->val.via.map.size; - do{ - if(!strncmp(ac->key.via.str.ptr, "ID", (size_t) ac->key.via.str.size)){ - docker_ev_id = (char *) ac->val.via.str.ptr; - docker_ev_id_size = ac->val.via.str.size; - - m_assert(docker_ev_id, "docker_ev_id is NULL"); - m_assert(docker_ev_id_size, "docker_ev_id_size is 0"); - - // debug_log("docker_ev_id: %.*s", docker_ev_id_size, docker_ev_id); - } - else if(!strncmp(ac->key.via.str.ptr, "Attributes", (size_t) ac->key.via.str.size)){ - if(likely(ac->val.type == MSGPACK_OBJECT_MAP && ac->val.via.map.size != 0)){ - msgpack_object_kv* att = ac->val.via.map.ptr; - msgpack_object_kv* const att_pend = ac->val.via.map.ptr + ac->val.via.map.size; - do{ - if(unlikely(++docker_ev_attr.size > docker_ev_attr.max_size)){ - docker_ev_attr.max_size = docker_ev_attr.size; - docker_ev_attr.key = reallocz(docker_ev_attr.key, - docker_ev_attr.max_size * sizeof(char *)); - docker_ev_attr.val = reallocz(docker_ev_attr.val, - docker_ev_attr.max_size * sizeof(char *)); - docker_ev_attr.key_size = reallocz(docker_ev_attr.key_size, - docker_ev_attr.max_size * sizeof(size_t)); - docker_ev_attr.val_size = reallocz(docker_ev_attr.val_size, - docker_ev_attr.max_size * sizeof(size_t)); - } - - docker_ev_attr.key[docker_ev_attr.size - 1] = (char *) att->key.via.str.ptr; - docker_ev_attr.val[docker_ev_attr.size - 1] = (char *) att->val.via.str.ptr; - docker_ev_attr.key_size[docker_ev_attr.size - 1] = (size_t) att->key.via.str.size; - docker_ev_attr.val_size[docker_ev_attr.size - 1] = (size_t) att->val.via.str.size; - - att++; - continue; - } while(att < att_pend); - } - } - ac++; - continue; - } while(ac < ac_pend); - } - } - - break; - } - - case FLB_MQTT: - { - if(!strncmp(p->key.via.str.ptr, "topic", (size_t) p->key.via.str.size)){ - mqtt_topic = (char *) p->val.via.str.ptr; - mqtt_topic_size = (size_t) p->val.via.str.size; - - while(0 == (message_size = dl_msgpack_object_print_buffer(mqtt_message, mqtt_message_size_max, *x))) - mqtt_message = reallocz(mqtt_message, (mqtt_message_size_max += 10)); - - new_tmp_text_size = message_size + 1; // +1 for '\n' - - m_assert(message_size, "message_size is 0"); - m_assert(mqtt_message, "mqtt_message is NULL"); - - break; // watch out, MQTT requires a 'break' here, as we parse the entire 'x' msgpack_object - } - else m_assert(0, "missing mqtt topic"); - - break; - } - - default: - break; - } - - } while(++p < pend); - } - } - - /* If no log timestamp was found, use Fluent Bit collection timestamp. */ - if(timestamp == 0) - timestamp = (msec_t) tmp_time.tm.tv_sec * MSEC_PER_SEC + (msec_t) tmp_time.tm.tv_nsec / (NSEC_PER_MSEC); - - m_assert(TEST_MS_TIMESTAMP_VALID(timestamp), "timestamp is invalid"); - - /* If input buffer timestamp is not set, now is the time to set it, - * else just be done with the previous buffer */ - if(unlikely(buff->in->timestamp == 0)) buff->in->timestamp = timestamp / 1000 * 1000; // rounding down - else if((timestamp - buff->in->timestamp) >= MSEC_PER_SEC) { - flb_complete_buff_item(p_file_info); - buff->in->timestamp = timestamp / 1000 * 1000; // rounding down - } - - m_assert(TEST_MS_TIMESTAMP_VALID(buff->in->timestamp), "buff->in->timestamp is invalid"); - - new_tmp_text_size += buff->in->text_size; - - /* ======================================================================== - * Step 2: Extract metrics and reconstruct log record - * ====================================================================== */ - - /* Parse number of log lines - common for all log source types */ - buff->in->num_lines++; - - /* FLB_TAIL, FLB_WEB_LOG and FLB_SERIAL case */ - if( p_file_info->log_type == FLB_TAIL || - p_file_info->log_type == FLB_WEB_LOG || - p_file_info->log_type == FLB_SERIAL){ - - if(p_file_info->log_type == FLB_WEB_LOG) - extract_web_log_metrics(p_file_info->parser_config, &line_parsed, - p_file_info->parser_metrics->web_log); - - // TODO: Fix: Metrics will still be collected if circ_buff_prepare_write() returns 0. - if(unlikely(!circ_buff_prepare_write(buff, new_tmp_text_size))) - goto skip_collect_and_drop_logs; - - size_t tmp_item_off = buff->in->text_size; - - memcpy_iscntrl_fix(&buff->in->data[tmp_item_off], message, message_size); - tmp_item_off += message_size; - - buff->in->data[tmp_item_off++] = '\n'; - m_assert(tmp_item_off == new_tmp_text_size, "tmp_item_off should be == new_tmp_text_size"); - buff->in->text_size = new_tmp_text_size; - -#ifdef HAVE_SYSTEMD - if(p_file_info->do_sd_journal_send){ - if(p_file_info->log_type == FLB_WEB_LOG){ - sd_journal_send( - SD_JOURNAL_SEND_DEFAULT_FIELDS, - *line_parsed.vhost ? "%sWEB_LOG_VHOST=%s" : "_%s=%s", sd_journal_field_prefix, line_parsed.vhost, - line_parsed.port ? "%sWEB_LOG_PORT=%d" : "_%s=%d", sd_journal_field_prefix, line_parsed.port, - *line_parsed.req_scheme ? "%sWEB_LOG_REQ_SCHEME=%s" : "_%s=%s", sd_journal_field_prefix, line_parsed.req_scheme, - *line_parsed.req_client ? "%sWEB_LOG_REQ_CLIENT=%s" : "_%s=%s", sd_journal_field_prefix, line_parsed.req_client, - "%sWEB_LOG_REQ_METHOD=%s" , sd_journal_field_prefix, line_parsed.req_method, - *line_parsed.req_URL ? "%sWEB_LOG_REQ_URL=%s" : "_%s=%s", sd_journal_field_prefix, line_parsed.req_URL, - *line_parsed.req_proto ? "%sWEB_LOG_REQ_PROTO=%s" : "_%s=%s", sd_journal_field_prefix, line_parsed.req_proto, - line_parsed.req_size ? "%sWEB_LOG_REQ_SIZE=%d" : "_%s=%d", sd_journal_field_prefix, line_parsed.req_size, - line_parsed.req_proc_time ? "%sWEB_LOG_REC_PROC_TIME=%d" : "_%s=%d", sd_journal_field_prefix, line_parsed.req_proc_time, - line_parsed.resp_code ? "%sWEB_LOG_RESP_CODE=%d" : "_%s=%d", sd_journal_field_prefix ,line_parsed.resp_code, - line_parsed.ups_resp_time ? "%sWEB_LOG_UPS_RESP_TIME=%d" : "_%s=%d", sd_journal_field_prefix ,line_parsed.ups_resp_time, - *line_parsed.ssl_proto ? "%sWEB_LOG_SSL_PROTO=%s" : "_%s=%s", sd_journal_field_prefix ,line_parsed.ssl_proto, - *line_parsed.ssl_cipher ? "%sWEB_LOB_SSL_CIPHER=%s" : "_%s=%s", sd_journal_field_prefix ,line_parsed.ssl_cipher, - LOG_REC_KEY_SYSTEMD "=%.*s", (int) message_size, message, - NULL - ); - } - else if(p_file_info->log_type == FLB_SERIAL){ - Flb_serial_config_t *serial_config = (Flb_serial_config_t *) p_file_info->flb_config; - sd_journal_send( - SD_JOURNAL_SEND_DEFAULT_FIELDS, - serial_config->bitrate && *serial_config->bitrate ? - "%sSERIAL_BITRATE=%s" : "_%s=%s", sd_journal_field_prefix, serial_config->bitrate, - LOG_REC_KEY_SYSTEMD "=%.*s", (int) message_size, message, - NULL - ); - } - else{ - sd_journal_send( - SD_JOURNAL_SEND_DEFAULT_FIELDS, - LOG_REC_KEY_SYSTEMD "=%.*s", (int) message_size, message, - NULL - ); - } - } -#endif - - } /* FLB_TAIL, FLB_WEB_LOG and FLB_SERIAL case end */ - - /* FLB_KMSG case */ - else if(p_file_info->log_type == FLB_KMSG){ - - char *c; - - // see https://www.kernel.org/doc/Documentation/ABI/testing/dev-kmsg - if((c = memchr(message, '\n', message_size))){ - - const char subsys_str[] = "SUBSYSTEM=", - device_str[] = "DEVICE="; - const size_t subsys_str_len = sizeof(subsys_str) - 1, - device_str_len = sizeof(device_str) - 1; - - size_t bytes_remain = message_size - (c - message); - - /* Extract machine-readable info for charts, such as subsystem and device. */ - while(bytes_remain){ - size_t sz = 0; - while(--bytes_remain && c[++sz] != '\n'); - if(bytes_remain) --sz; - *(c++) = '\\'; - *(c++) = 'n'; - sz--; - - DICTIONARY *dict = NULL; - char *str = NULL; - size_t str_len = 0; - if(!strncmp(c, subsys_str, subsys_str_len)){ - dict = p_file_info->parser_metrics->kernel->subsystem; - str = &c[subsys_str_len]; - str_len = (sz - subsys_str_len); - } - else if (!strncmp(c, device_str, device_str_len)){ - dict = p_file_info->parser_metrics->kernel->device; - str = &c[device_str_len]; - str_len = (sz - device_str_len); - } - - if(likely(str)){ - char *const key = mallocz(str_len + 1); - memcpy(key, str, str_len); - key[str_len] = '\0'; - metrics_dict_item_t item = {.dim_initialized = false, .num_new = 1}; - dictionary_set_advanced(dict, key, str_len, &item, sizeof(item), NULL); - } - c = &c[sz]; - } - } - - if(likely(kmsg_sever >= 0)) - p_file_info->parser_metrics->kernel->sever[kmsg_sever]++; - - // TODO: Fix: Metrics will still be collected if circ_buff_prepare_write() returns 0. - if(unlikely(!circ_buff_prepare_write(buff, new_tmp_text_size))) - goto skip_collect_and_drop_logs; - - size_t tmp_item_off = buff->in->text_size; - - memcpy_iscntrl_fix(&buff->in->data[tmp_item_off], message, message_size); - tmp_item_off += message_size; - - buff->in->data[tmp_item_off++] = '\n'; - m_assert(tmp_item_off == new_tmp_text_size, "tmp_item_off should be == new_tmp_text_size"); - buff->in->text_size = new_tmp_text_size; - } /* FLB_KMSG case end */ - - /* FLB_SYSTEMD or FLB_SYSLOG case */ - else if(p_file_info->log_type == FLB_SYSTEMD || - p_file_info->log_type == FLB_SYSLOG){ - - int syslog_prival_d = SYSLOG_PRIOR_ARR_SIZE - 1; // Initialise to 'unknown' - int syslog_severity_d = SYSLOG_SEVER_ARR_SIZE - 1; // Initialise to 'unknown' - int syslog_facility_d = SYSLOG_FACIL_ARR_SIZE - 1; // Initialise to 'unknown' - - - /* FLB_SYSTEMD case has syslog_severity and syslog_facility values that - * are used to calculate syslog_prival from. FLB_SYSLOG is the opposite - * case, as it has a syslog_prival value that is used to calculate - * syslog_severity and syslog_facility from. */ - if(p_file_info->log_type == FLB_SYSTEMD){ - - /* Parse syslog_severity char* field into int and extract metrics. - * syslog_severity_s will consist of 1 char (plus '\0'), - * see https://datatracker.ietf.org/doc/html/rfc5424#section-6.2.1 */ - if(likely(syslog_severity[0])){ - if(likely(str2int(&syslog_severity_d, syslog_severity, 10) == STR2XX_SUCCESS)){ - p_file_info->parser_metrics->systemd->sever[syslog_severity_d]++; - } // else parsing errors ++ ?? - } else p_file_info->parser_metrics->systemd->sever[SYSLOG_SEVER_ARR_SIZE - 1]++; // 'unknown' - - /* Parse syslog_facility char* field into int and extract metrics. - * syslog_facility_s will consist of up to 2 chars (plus '\0'), - * see https://datatracker.ietf.org/doc/html/rfc5424#section-6.2.1 */ - if(likely(syslog_facility[0])){ - if(likely(str2int(&syslog_facility_d, syslog_facility, 10) == STR2XX_SUCCESS)){ - p_file_info->parser_metrics->systemd->facil[syslog_facility_d]++; - } // else parsing errors ++ ?? - } else p_file_info->parser_metrics->systemd->facil[SYSLOG_FACIL_ARR_SIZE - 1]++; // 'unknown' - - if(likely(syslog_severity[0] && syslog_facility[0])){ - /* Definition of syslog priority value == facility * 8 + severity */ - syslog_prival_d = syslog_facility_d * 8 + syslog_severity_d; - syslog_prival_size = snprintfz(syslog_prival, 4, "%d", syslog_prival_d); - m_assert(syslog_prival_size < 4 && syslog_prival_size > 0, "error with snprintf()"); - - new_tmp_text_size += syslog_prival_size + 2; // +2 for '<' and '>' - - p_file_info->parser_metrics->systemd->prior[syslog_prival_d]++; - } else { - new_tmp_text_size += 3; // +3 for "<->" string - p_file_info->parser_metrics->systemd->prior[SYSLOG_PRIOR_ARR_SIZE - 1]++; // 'unknown' - } - - } else if(p_file_info->log_type == FLB_SYSLOG){ - - if(likely(syslog_prival[0])){ - if(likely(str2int(&syslog_prival_d, syslog_prival, 10) == STR2XX_SUCCESS)){ - syslog_severity_d = syslog_prival_d % 8; - syslog_facility_d = syslog_prival_d / 8; - - p_file_info->parser_metrics->systemd->prior[syslog_prival_d]++; - p_file_info->parser_metrics->systemd->sever[syslog_severity_d]++; - p_file_info->parser_metrics->systemd->facil[syslog_facility_d]++; - - new_tmp_text_size += syslog_prival_size + 2; // +2 for '<' and '>' - - } // else parsing errors ++ ?? - } else { - new_tmp_text_size += 3; // +3 for "<->" string - p_file_info->parser_metrics->systemd->prior[SYSLOG_PRIOR_ARR_SIZE - 1]++; // 'unknown' - p_file_info->parser_metrics->systemd->sever[SYSLOG_SEVER_ARR_SIZE - 1]++; // 'unknown' - p_file_info->parser_metrics->systemd->facil[SYSLOG_FACIL_ARR_SIZE - 1]++; // 'unknown' - } - - } else m_assert(0, "shoudn't get here"); - - char syslog_time_from_flb_time[25]; // 25 just to be on the safe side, but 16 + 1 chars bytes needed only. - if(unlikely(!syslog_timestamp)){ - const time_t ts = tmp_time.tm.tv_sec; - struct tm *const tm = localtime(&ts); - - strftime(syslog_time_from_flb_time, sizeof(syslog_time_from_flb_time), "%b %d %H:%M:%S ", tm); - new_tmp_text_size += SYSLOG_TIMESTAMP_SIZE; - } - - if(unlikely(!syslog_identifier)) new_tmp_text_size += sizeof(UNKNOWN) - 1; - if(unlikely(!pid)) new_tmp_text_size += sizeof(UNKNOWN) - 1; - - new_tmp_text_size += 5; // +5 for '[', ']', ':' and ' ' characters around and after pid and '\n' at the end - - /* Metrics extracted, now prepare circular buffer for write */ - // TODO: Fix: Metrics will still be collected if circ_buff_prepare_write() returns 0. - if(unlikely(!circ_buff_prepare_write(buff, new_tmp_text_size))) - goto skip_collect_and_drop_logs; - - size_t tmp_item_off = buff->in->text_size; - - buff->in->data[tmp_item_off++] = '<'; - if(likely(syslog_prival[0])){ - memcpy(&buff->in->data[tmp_item_off], syslog_prival, syslog_prival_size); - m_assert(syslog_prival_size, "syslog_prival_size cannot be 0"); - tmp_item_off += syslog_prival_size; - } else buff->in->data[tmp_item_off++] = '-'; - buff->in->data[tmp_item_off++] = '>'; - - if(likely(syslog_timestamp)){ - memcpy(&buff->in->data[tmp_item_off], syslog_timestamp, syslog_timestamp_size); - // FLB_SYSLOG doesn't add space, but FLB_SYSTEMD does: - // if(buff->in->data[tmp_item_off] != ' ') buff->in->data[tmp_item_off++] = ' '; - tmp_item_off += syslog_timestamp_size; - } else { - memcpy(&buff->in->data[tmp_item_off], syslog_time_from_flb_time, SYSLOG_TIMESTAMP_SIZE); - tmp_item_off += SYSLOG_TIMESTAMP_SIZE; - } - - if(likely(hostname)){ - memcpy(&buff->in->data[tmp_item_off], hostname, hostname_size); - tmp_item_off += hostname_size; - buff->in->data[tmp_item_off++] = ' '; - } - - if(likely(syslog_identifier)){ - memcpy(&buff->in->data[tmp_item_off], syslog_identifier, syslog_identifier_size); - tmp_item_off += syslog_identifier_size; - } else { - memcpy(&buff->in->data[tmp_item_off], UNKNOWN, sizeof(UNKNOWN) - 1); - tmp_item_off += sizeof(UNKNOWN) - 1; - } - - buff->in->data[tmp_item_off++] = '['; - if(likely(pid)){ - memcpy(&buff->in->data[tmp_item_off], pid, pid_size); - tmp_item_off += pid_size; - } else { - memcpy(&buff->in->data[tmp_item_off], UNKNOWN, sizeof(UNKNOWN) - 1); - tmp_item_off += sizeof(UNKNOWN) - 1; - } - buff->in->data[tmp_item_off++] = ']'; - - buff->in->data[tmp_item_off++] = ':'; - buff->in->data[tmp_item_off++] = ' '; - - if(likely(message)){ - memcpy_iscntrl_fix(&buff->in->data[tmp_item_off], message, message_size); - tmp_item_off += message_size; - } - - buff->in->data[tmp_item_off++] = '\n'; - m_assert(tmp_item_off == new_tmp_text_size, "tmp_item_off should be == new_tmp_text_size"); - buff->in->text_size = new_tmp_text_size; - } /* FLB_SYSTEMD or FLB_SYSLOG case end */ - - /* FLB_DOCKER_EV case */ - else if(p_file_info->log_type == FLB_DOCKER_EV){ - - const size_t docker_ev_datetime_size = sizeof "2022-08-26T15:33:20.802840200+0000" /* example datetime */; - char docker_ev_datetime[docker_ev_datetime_size]; - docker_ev_datetime[0] = 0; - if(likely(docker_ev_time && docker_ev_timeNano)){ - struct timespec ts; - ts.tv_sec = docker_ev_time; - if(unlikely(0 == strftime( docker_ev_datetime, docker_ev_datetime_size, - "%Y-%m-%dT%H:%M:%S.000000000%z", localtime(&ts.tv_sec)))) { /* TODO: do what if error? */}; - const size_t docker_ev_timeNano_s_size = sizeof "802840200"; - char docker_ev_timeNano_s[docker_ev_timeNano_s_size]; - snprintfz( docker_ev_timeNano_s, docker_ev_timeNano_s_size, "%0*ld", - (int) docker_ev_timeNano_s_size, docker_ev_timeNano % 1000000000); - memcpy(&docker_ev_datetime[20], &docker_ev_timeNano_s, docker_ev_timeNano_s_size - 1); - - new_tmp_text_size += docker_ev_datetime_size; // -1 for null terminator, +1 for ' ' character - } - - if(likely(docker_ev_type && docker_ev_action)){ - int ev_off = -1; - while(++ev_off < NUM_OF_DOCKER_EV_TYPES){ - if(!strncmp(docker_ev_type, docker_ev_type_string[ev_off], docker_ev_type_size)){ - p_file_info->parser_metrics->docker_ev->ev_type[ev_off]++; - - int act_off = -1; - while(docker_ev_action_string[ev_off][++act_off] != NULL){ - if(!strncmp(docker_ev_action, docker_ev_action_string[ev_off][act_off], docker_ev_action_size)){ - p_file_info->parser_metrics->docker_ev->ev_action[ev_off][act_off]++; - break; - } - } - if(unlikely(docker_ev_action_string[ev_off][act_off] == NULL)) - p_file_info->parser_metrics->docker_ev->ev_action[NUM_OF_DOCKER_EV_TYPES - 1][0]++; // 'unknown' - - break; - } - } - if(unlikely(ev_off >= NUM_OF_DOCKER_EV_TYPES - 1)){ - p_file_info->parser_metrics->docker_ev->ev_type[ev_off]++; // 'unknown' - p_file_info->parser_metrics->docker_ev->ev_action[NUM_OF_DOCKER_EV_TYPES - 1][0]++; // 'unknown' - } - - new_tmp_text_size += docker_ev_type_size + docker_ev_action_size + 2; // +2 for ' ' chars - } - - if(likely(docker_ev_id)){ - // debug_log("docker_ev_id: %.*s", (int) docker_ev_id_size, docker_ev_id); - - new_tmp_text_size += docker_ev_id_size + 1; // +1 for ' ' char - } - - if(likely(docker_ev_attr.size)){ - for(int i = 0; i < docker_ev_attr.size; i++){ - new_tmp_text_size += docker_ev_attr.key_size[i] + - docker_ev_attr.val_size[i] + 3; // +3 for '=' ',' ' ' characters - } - /* new_tmp_text_size = -2 + 2; - * -2 due to missing ',' ' ' from last attribute and +2 for the two - * '(' and ')' characters, so no need to add or subtract */ - } - - new_tmp_text_size += 1; // +1 for '\n' character at the end - - /* Metrics extracted, now prepare circular buffer for write */ - // TODO: Fix: Metrics will still be collected if circ_buff_prepare_write() returns 0. - if(unlikely(!circ_buff_prepare_write(buff, new_tmp_text_size))) - goto skip_collect_and_drop_logs; - - size_t tmp_item_off = buff->in->text_size; - message_size = new_tmp_text_size - 1 - tmp_item_off; - - if(likely(*docker_ev_datetime)){ - memcpy(&buff->in->data[tmp_item_off], docker_ev_datetime, docker_ev_datetime_size - 1); - tmp_item_off += docker_ev_datetime_size - 1; // -1 due to null terminator - buff->in->data[tmp_item_off++] = ' '; - } - - if(likely(docker_ev_type)){ - memcpy(&buff->in->data[tmp_item_off], docker_ev_type, docker_ev_type_size); - tmp_item_off += docker_ev_type_size; - buff->in->data[tmp_item_off++] = ' '; - } - - if(likely(docker_ev_action)){ - memcpy(&buff->in->data[tmp_item_off], docker_ev_action, docker_ev_action_size); - tmp_item_off += docker_ev_action_size; - buff->in->data[tmp_item_off++] = ' '; - } - - if(likely(docker_ev_id)){ - memcpy(&buff->in->data[tmp_item_off], docker_ev_id, docker_ev_id_size); - tmp_item_off += docker_ev_id_size; - buff->in->data[tmp_item_off++] = ' '; - } - - if(likely(docker_ev_attr.size)){ - buff->in->data[tmp_item_off++] = '('; - for(int i = 0; i < docker_ev_attr.size; i++){ - memcpy(&buff->in->data[tmp_item_off], docker_ev_attr.key[i], docker_ev_attr.key_size[i]); - tmp_item_off += docker_ev_attr.key_size[i]; - buff->in->data[tmp_item_off++] = '='; - memcpy(&buff->in->data[tmp_item_off], docker_ev_attr.val[i], docker_ev_attr.val_size[i]); - tmp_item_off += docker_ev_attr.val_size[i]; - buff->in->data[tmp_item_off++] = ','; - buff->in->data[tmp_item_off++] = ' '; - } - tmp_item_off -= 2; // overwrite last ',' and ' ' characters with a ')' character - buff->in->data[tmp_item_off++] = ')'; - } - - buff->in->data[tmp_item_off++] = '\n'; - m_assert(tmp_item_off == new_tmp_text_size, "tmp_item_off should be == new_tmp_text_size"); - buff->in->text_size = new_tmp_text_size; - -#ifdef HAVE_SYSTEMD - if(p_file_info->do_sd_journal_send){ - sd_journal_send( - SD_JOURNAL_SEND_DEFAULT_FIELDS, - "%sDOCKER_EVENTS_TYPE=%.*s", sd_journal_field_prefix, (int) docker_ev_type_size, docker_ev_type, - "%sDOCKER_EVENTS_ACTION=%.*s", sd_journal_field_prefix, (int) docker_ev_action_size, docker_ev_action, - "%sDOCKER_EVENTS_ID=%.*s", sd_journal_field_prefix, (int) docker_ev_id_size, docker_ev_id, - LOG_REC_KEY_SYSTEMD "=%.*s", (int) message_size, &buff->in->data[tmp_item_off - 1 - message_size], - NULL - ); - } -#endif - - } /* FLB_DOCKER_EV case end */ - - /* FLB_MQTT case */ - else if(p_file_info->log_type == FLB_MQTT){ - if(likely(mqtt_topic)){ - char *const key = mallocz(mqtt_topic_size + 1); - memcpy(key, mqtt_topic, mqtt_topic_size); - key[mqtt_topic_size] = '\0'; - metrics_dict_item_t item = {.dim_initialized = false, .num_new = 1}; - dictionary_set_advanced(p_file_info->parser_metrics->mqtt->topic, key, mqtt_topic_size, &item, sizeof(item), NULL); - - // TODO: Fix: Metrics will still be collected if circ_buff_prepare_write() returns 0. - if(unlikely(!circ_buff_prepare_write(buff, new_tmp_text_size))) - goto skip_collect_and_drop_logs; - - size_t tmp_item_off = buff->in->text_size; - - memcpy(&buff->in->data[tmp_item_off], mqtt_message, message_size); - tmp_item_off += message_size; - - buff->in->data[tmp_item_off++] = '\n'; - m_assert(tmp_item_off == new_tmp_text_size, "tmp_item_off should be == new_tmp_text_size"); - buff->in->text_size = new_tmp_text_size; - -#ifdef HAVE_SYSTEMD - if(p_file_info->do_sd_journal_send){ - sd_journal_send( - SD_JOURNAL_SEND_DEFAULT_FIELDS, - "%sMQTT_TOPIC=%s", key, - LOG_REC_KEY_SYSTEMD "=%.*s", (int) message_size, mqtt_message, - NULL - ); - } -#endif - - } - else m_assert(0, "missing mqtt topic"); - } - -skip_collect_and_drop_logs: - /* Following code is equivalent to msgpack_unpacked_destroy(&result) due - * to that function call being unavailable when using dl_open() */ - if(result.zone != NULL) { - dl_msgpack_zone_free(result.zone); - result.zone = NULL; - memset(&result.data, 0, sizeof(msgpack_object)); - } - - if(p_file_info) - uv_mutex_unlock(&p_file_info->flb_tmp_buff_mut); - - flb_lib_free(record); - return 0; - -} - -/** - * @brief Add a Fluent-Bit input that outputs to the "lib" Fluent-Bit plugin. - * @param[in] p_file_info Pointer to the log source struct where the input will - * be registered to. - * @return 0 on success, a negative number for any errors (see enum). - */ -int flb_add_input(struct File_info *const p_file_info){ - - enum return_values { - SUCCESS = 0, - INVALID_LOG_TYPE = -1, - CONFIG_READ_ERROR = -2, - FLB_PARSER_CREATE_ERROR = -3, - FLB_INPUT_ERROR = -4, - FLB_INPUT_SET_ERROR = -5, - FLB_OUTPUT_ERROR = -6, - FLB_OUTPUT_SET_ERROR = -7, - DEFAULT_ERROR = -8 - }; - - const int tag_max_size = 5; - static unsigned tag = 0; // incremental tag id to link flb inputs to outputs - char tag_s[tag_max_size]; - snprintfz(tag_s, tag_max_size, "%u", tag++); - - - switch(p_file_info->log_type){ - case FLB_TAIL: - case FLB_WEB_LOG: { - - char update_every_str[10]; - snprintfz(update_every_str, 10, "%d", p_file_info->update_every); - - debug_log("Setting up %s tail for %s (basename:%s)", - p_file_info->log_type == FLB_TAIL ? "FLB_TAIL" : "FLB_WEB_LOG", - p_file_info->filename, p_file_info->file_basename); - - Flb_tail_config_t *tail_config = (Flb_tail_config_t *) p_file_info->flb_config; - if(unlikely(!tail_config)) return CONFIG_READ_ERROR; - - /* Set up input from log source */ - p_file_info->flb_input = flb_input(ctx, "tail", NULL); - if(p_file_info->flb_input < 0 ) return FLB_INPUT_ERROR; - if(flb_input_set(ctx, p_file_info->flb_input, - "Tag", tag_s, - "Path", p_file_info->filename, - "Key", LOG_REC_KEY, - "Refresh_Interval", update_every_str, - "Skip_Long_Lines", "On", - "Skip_Empty_Lines", "On", -#if defined(FLB_HAVE_INOTIFY) - "Inotify_Watcher", tail_config->use_inotify ? "true" : "false", -#endif - NULL) != 0) return FLB_INPUT_SET_ERROR; - - break; - } - case FLB_KMSG: { - debug_log( "Setting up FLB_KMSG collector"); - - Flb_kmsg_config_t *kmsg_config = (Flb_kmsg_config_t *) p_file_info->flb_config; - if(unlikely(!kmsg_config || - !kmsg_config->prio_level || - !*kmsg_config->prio_level)) return CONFIG_READ_ERROR; - - /* Set up kmsg input */ - p_file_info->flb_input = flb_input(ctx, "kmsg", NULL); - if(p_file_info->flb_input < 0 ) return FLB_INPUT_ERROR; - if(flb_input_set(ctx, p_file_info->flb_input, - "Tag", tag_s, - "Prio_Level", kmsg_config->prio_level, - NULL) != 0) return FLB_INPUT_SET_ERROR; - - break; - } - case FLB_SYSTEMD: { - debug_log( "Setting up FLB_SYSTEMD collector"); - - /* Set up systemd input */ - p_file_info->flb_input = flb_input(ctx, "systemd", NULL); - if(p_file_info->flb_input < 0 ) return FLB_INPUT_ERROR; - if(!strcmp(p_file_info->filename, SYSTEMD_DEFAULT_PATH)){ - if(flb_input_set(ctx, p_file_info->flb_input, - "Tag", tag_s, - "Read_From_Tail", "On", - "Strip_Underscores", "On", - NULL) != 0) return FLB_INPUT_SET_ERROR; - } else { - if(flb_input_set(ctx, p_file_info->flb_input, - "Tag", tag_s, - "Read_From_Tail", "On", - "Strip_Underscores", "On", - "Path", p_file_info->filename, - NULL) != 0) return FLB_INPUT_SET_ERROR; - } - - break; - } - case FLB_DOCKER_EV: { - debug_log( "Setting up FLB_DOCKER_EV collector"); - - /* Set up Docker Events parser */ - if(flb_parser_create( "docker_events_parser", /* parser name */ - "json", /* backend type */ - NULL, /* regex */ - FLB_TRUE, /* skip_empty */ - NULL, /* time format */ - NULL, /* time key */ - NULL, /* time offset */ - FLB_TRUE, /* time keep */ - FLB_FALSE, /* time strict */ - FLB_FALSE, /* no bare keys */ - NULL, /* parser types */ - 0, /* types len */ - NULL, /* decoders */ - ctx->config) == NULL) return FLB_PARSER_CREATE_ERROR; - - /* Set up Docker Events input */ - p_file_info->flb_input = flb_input(ctx, "docker_events", NULL); - if(p_file_info->flb_input < 0 ) return FLB_INPUT_ERROR; - if(flb_input_set(ctx, p_file_info->flb_input, - "Tag", tag_s, - "Parser", "docker_events_parser", - "Unix_Path", p_file_info->filename, - NULL) != 0) return FLB_INPUT_SET_ERROR; - - break; - } - case FLB_SYSLOG: { - debug_log( "Setting up FLB_SYSLOG collector"); - - /* Set up syslog parser */ - const char syslog_parser_prfx[] = "syslog_parser_"; - size_t parser_name_size = sizeof(syslog_parser_prfx) + tag_max_size - 1; - char parser_name[parser_name_size]; - snprintfz(parser_name, parser_name_size, "%s%u", syslog_parser_prfx, tag); - - Syslog_parser_config_t *syslog_config = (Syslog_parser_config_t *) p_file_info->parser_config->gen_config; - if(unlikely(!syslog_config || - !syslog_config->socket_config || - !syslog_config->socket_config->mode || - !p_file_info->filename)) return CONFIG_READ_ERROR; - - if(flb_parser_create( parser_name, /* parser name */ - "regex", /* backend type */ - syslog_config->log_format, /* regex */ - FLB_TRUE, /* skip_empty */ - NULL, /* time format */ - NULL, /* time key */ - NULL, /* time offset */ - FLB_TRUE, /* time keep */ - FLB_TRUE, /* time strict */ - FLB_FALSE, /* no bare keys */ - NULL, /* parser types */ - 0, /* types len */ - NULL, /* decoders */ - ctx->config) == NULL) return FLB_PARSER_CREATE_ERROR; - - /* Set up syslog input */ - p_file_info->flb_input = flb_input(ctx, "syslog", NULL); - if(p_file_info->flb_input < 0 ) return FLB_INPUT_ERROR; - if( !strcmp(syslog_config->socket_config->mode, "unix_udp") || - !strcmp(syslog_config->socket_config->mode, "unix_tcp")){ - m_assert(syslog_config->socket_config->unix_perm, "unix_perm is not set"); - if(flb_input_set(ctx, p_file_info->flb_input, - "Tag", tag_s, - "Path", p_file_info->filename, - "Parser", parser_name, - "Mode", syslog_config->socket_config->mode, - "Unix_Perm", syslog_config->socket_config->unix_perm, - NULL) != 0) return FLB_INPUT_SET_ERROR; - } else if( !strcmp(syslog_config->socket_config->mode, "udp") || - !strcmp(syslog_config->socket_config->mode, "tcp")){ - m_assert(syslog_config->socket_config->listen, "listen is not set"); - m_assert(syslog_config->socket_config->port, "port is not set"); - if(flb_input_set(ctx, p_file_info->flb_input, - "Tag", tag_s, - "Parser", parser_name, - "Mode", syslog_config->socket_config->mode, - "Listen", syslog_config->socket_config->listen, - "Port", syslog_config->socket_config->port, - NULL) != 0) return FLB_INPUT_SET_ERROR; - } else return FLB_INPUT_SET_ERROR; // should never reach this line - - break; - } - case FLB_SERIAL: { - debug_log( "Setting up FLB_SERIAL collector"); - - Flb_serial_config_t *serial_config = (Flb_serial_config_t *) p_file_info->flb_config; - if(unlikely(!serial_config || - !serial_config->bitrate || - !*serial_config->bitrate || - !serial_config->min_bytes || - !*serial_config->min_bytes || - !p_file_info->filename)) return CONFIG_READ_ERROR; - - /* Set up serial input */ - p_file_info->flb_input = flb_input(ctx, "serial", NULL); - if(p_file_info->flb_input < 0 ) return FLB_INPUT_ERROR; - if(flb_input_set(ctx, p_file_info->flb_input, - "Tag", tag_s, - "File", p_file_info->filename, - "Bitrate", serial_config->bitrate, - "Min_Bytes", serial_config->min_bytes, - "Separator", serial_config->separator, - "Format", serial_config->format, - NULL) != 0) return FLB_INPUT_SET_ERROR; - - break; - } - case FLB_MQTT: { - debug_log( "Setting up FLB_MQTT collector"); - - Flb_socket_config_t *socket_config = (Flb_socket_config_t *) p_file_info->flb_config; - if(unlikely(!socket_config || !socket_config->listen || !*socket_config->listen || - !socket_config->port || !*socket_config->port)) return CONFIG_READ_ERROR; - - /* Set up MQTT input */ - p_file_info->flb_input = flb_input(ctx, "mqtt", NULL); - if(p_file_info->flb_input < 0 ) return FLB_INPUT_ERROR; - if(flb_input_set(ctx, p_file_info->flb_input, - "Tag", tag_s, - "Listen", socket_config->listen, - "Port", socket_config->port, - NULL) != 0) return FLB_INPUT_SET_ERROR; - - break; - } - default: { - m_assert(0, "default: case in flb_add_input() error"); - return DEFAULT_ERROR; // Shouldn't reach here - } - } - - /* Set up user-configured outputs */ - for(Flb_output_config_t *output = p_file_info->flb_outputs; output; output = output->next){ - debug_log( "setting up user output [%s]", output->plugin); - - int out = flb_output(ctx, output->plugin, NULL); - if(out < 0) return FLB_OUTPUT_ERROR; - if(flb_output_set(ctx, out, - "Match", tag_s, - NULL) != 0) return FLB_OUTPUT_SET_ERROR; - for(struct flb_output_config_param *param = output->param; param; param = param->next){ - debug_log( "setting up param [%s][%s] of output [%s]", param->key, param->val, output->plugin); - if(flb_output_set(ctx, out, - param->key, param->val, - NULL) != 0) return FLB_OUTPUT_SET_ERROR; - } - } - - /* Set up "lib" output */ - struct flb_lib_out_cb *callback = mallocz(sizeof(struct flb_lib_out_cb)); - callback->cb = flb_collect_logs_cb; - callback->data = p_file_info; - if(((p_file_info->flb_lib_output = flb_output(ctx, "lib", callback)) < 0) || - (flb_output_set(ctx, p_file_info->flb_lib_output, "Match", tag_s, NULL) != 0)){ - freez(callback); - return FLB_OUTPUT_ERROR; - } - - return SUCCESS; -} - -/** - * @brief Add a Fluent-Bit Forward input. - * @details This creates a unix or network socket to accept logs using - * Fluent Bit's Forward protocol. For more information see: - * https://docs.fluentbit.io/manual/pipeline/inputs/forward - * @param[in] forward_in_config Configuration of the Forward input socket. - * @return 0 on success, -1 on error. - */ -int flb_add_fwd_input(Flb_socket_config_t *forward_in_config){ - - if(forward_in_config == NULL){ - debug_log( "forward: forward_in_config is NULL"); - collector_info("forward_in_config is NULL"); - return 0; - } - - do{ - debug_log( "forward: Setting up flb_add_fwd_input()"); - - int input, output; - - if((input = flb_input(ctx, "forward", NULL)) < 0) break; - - if( forward_in_config->unix_path && *forward_in_config->unix_path && - forward_in_config->unix_perm && *forward_in_config->unix_perm){ - if(flb_input_set(ctx, input, - "Tag_Prefix", "fwd", - "Unix_Path", forward_in_config->unix_path, - "Unix_Perm", forward_in_config->unix_perm, - NULL) != 0) break; - } else if( forward_in_config->listen && *forward_in_config->listen && - forward_in_config->port && *forward_in_config->port){ - if(flb_input_set(ctx, input, - "Tag_Prefix", "fwd", - "Listen", forward_in_config->listen, - "Port", forward_in_config->port, - NULL) != 0) break; - } else break; // should never reach this line - - fwd_input_out_cb = mallocz(sizeof(struct flb_lib_out_cb)); - - /* Set up output */ - fwd_input_out_cb->cb = flb_collect_logs_cb; - fwd_input_out_cb->data = NULL; - if((output = flb_output(ctx, "lib", fwd_input_out_cb)) < 0) break; - if(flb_output_set(ctx, output, - "Match", "fwd*", - NULL) != 0) break; - - debug_log( "forward: Set up flb_add_fwd_input() with success"); - return 0; - } while(0); - - /* Error */ - if(fwd_input_out_cb) freez(fwd_input_out_cb); - return -1; -} - -void flb_free_fwd_input_out_cb(void){ - freez(fwd_input_out_cb); -}
\ No newline at end of file diff --git a/src/logsmanagement/flb_plugin.h b/src/logsmanagement/flb_plugin.h deleted file mode 100644 index 5c35315b1..000000000 --- a/src/logsmanagement/flb_plugin.h +++ /dev/null @@ -1,35 +0,0 @@ -// SPDX-License-Identifier: GPL-3.0-or-later - -/** @file flb_plugin.h - * @brief Header of flb_plugin.c - */ - -#ifndef FLB_PLUGIN_H_ -#define FLB_PLUGIN_H_ - -#include "file_info.h" -#include <uv.h> - -#define LOG_PATH_AUTO "auto" -#define KMSG_DEFAULT_PATH "/dev/kmsg" -#define SYSTEMD_DEFAULT_PATH "SD_JOURNAL_LOCAL_ONLY" -#define DOCKER_EV_DEFAULT_PATH "/var/run/docker.sock" - -typedef struct { - char *flush, - *http_listen, *http_port, *http_server, - *log_path, *log_level, - *coro_stack_size; -} flb_srvc_config_t ; - -int flb_init(flb_srvc_config_t flb_srvc_config, - const char *const stock_config_dir, - const char *const new_sd_journal_field_prefix); -int flb_run(void); -void flb_terminate(void); -void flb_complete_item_timer_timeout_cb(uv_timer_t *handle); -int flb_add_input(struct File_info *const p_file_info); -int flb_add_fwd_input(Flb_socket_config_t *const forward_in_config); -void flb_free_fwd_input_out_cb(void); - -#endif // FLB_PLUGIN_H_ diff --git a/src/logsmanagement/fluent_bit_build/CMakeLists.patch b/src/logsmanagement/fluent_bit_build/CMakeLists.patch deleted file mode 100644 index e2b8cab14..000000000 --- a/src/logsmanagement/fluent_bit_build/CMakeLists.patch +++ /dev/null @@ -1,19 +0,0 @@ -diff --git a/CMakeLists.txt b/CMakeLists.txt -index ae853815b..8b81a052f 100644 ---- a/CMakeLists.txt -+++ b/CMakeLists.txt -@@ -70,12 +70,14 @@ set(CMAKE_C_FLAGS "${CMAKE_C_FLAGS} -D__FLB_FILENAME__=__FILE__") - if(${CMAKE_SYSTEM_PROCESSOR} MATCHES "armv7l") - set(CMAKE_C_LINK_FLAGS "${CMAKE_C_LINK_FLAGS} -latomic") - set(CMAKE_CXX_LINK_FLAGS "${CMAKE_CXX_LINK_FLAGS} -latomic") -+ set(CMAKE_SHARED_LINKER_FLAGS "${CMAKE_SHARED_LINKER_FLAGS} -latomic") - endif() - if(${CMAKE_SYSTEM_NAME} MATCHES "FreeBSD") - set(FLB_SYSTEM_FREEBSD On) - add_definitions(-DFLB_SYSTEM_FREEBSD) - set(CMAKE_C_LINK_FLAGS "${CMAKE_C_LINK_FLAGS} -lutil") - set(CMAKE_CXX_LINK_FLAGS "${CMAKE_CXX_LINK_FLAGS} -lutil") -+ set(CMAKE_SHARED_LINKER_FLAGS "${CMAKE_SHARED_LINKER_FLAGS} -lutil") - endif() - - # *BSD is not supported platform for wasm-micro-runtime except for FreeBSD. diff --git a/src/logsmanagement/fluent_bit_build/chunkio-static-lib-fts.patch b/src/logsmanagement/fluent_bit_build/chunkio-static-lib-fts.patch deleted file mode 100644 index f3c4dd835..000000000 --- a/src/logsmanagement/fluent_bit_build/chunkio-static-lib-fts.patch +++ /dev/null @@ -1,10 +0,0 @@ ---- a/lib/chunkio/src/CMakeLists.txt -+++ b/lib/chunkio/src/CMakeLists.txt -@@ -14,6 +14,7 @@ - ) - - set(libs cio-crc32) -+set(libs ${libs} fts) - - if(${CMAKE_SYSTEM_NAME} MATCHES "Windows") - set(src diff --git a/src/logsmanagement/fluent_bit_build/config.cmake b/src/logsmanagement/fluent_bit_build/config.cmake deleted file mode 100644 index 7bb2e86a9..000000000 --- a/src/logsmanagement/fluent_bit_build/config.cmake +++ /dev/null @@ -1,178 +0,0 @@ -set(FLB_ALL OFF CACHE BOOL "Enable all features") -set(FLB_DEBUG OFF CACHE BOOL "Build with debug mode (-g)") -set(FLB_RELEASE OFF CACHE BOOL "Build with release mode (-O2 -g -DNDEBUG)") -# set(FLB_IPO "ReleaseOnly" CACHE STRING "Build with interprocedural optimization") -# set_property(CACHE FLB_IPO PROPERTY STRINGS "On;Off;ReleaseOnly") -set(FLB_SMALL OFF CACHE BOOL "Optimise for small size") -set(FLB_COVERAGE OFF CACHE BOOL "Build with code-coverage") -set(FLB_JEMALLOC OFF CACHE BOOL "Build with Jemalloc support") -set(FLB_REGEX ON CACHE BOOL "Build with Regex support") -set(FLB_UTF8_ENCODER ON CACHE BOOL "Build with UTF8 encoding support") -set(FLB_PARSER ON CACHE BOOL "Build with Parser support") -set(FLB_TLS ON CACHE BOOL "Build with SSL/TLS support") -set(FLB_BINARY OFF CACHE BOOL "Build executable binary") -set(FLB_EXAMPLES OFF CACHE BOOL "Build examples") -set(FLB_SHARED_LIB ON CACHE BOOL "Build shared library") -set(FLB_VALGRIND OFF CACHE BOOL "Enable Valgrind support") -set(FLB_TRACE OFF CACHE BOOL "Enable trace mode") -set(FLB_CHUNK_TRACE OFF CACHE BOOL "Enable chunk traces") -set(FLB_TESTS_RUNTIME OFF CACHE BOOL "Enable runtime tests") -set(FLB_TESTS_INTERNAL OFF CACHE BOOL "Enable internal tests") -set(FLB_TESTS_INTERNAL_FUZZ OFF CACHE BOOL "Enable internal fuzz tests") -set(FLB_TESTS_OSSFUZZ OFF CACHE BOOL "Enable OSS-Fuzz build") -set(FLB_MTRACE OFF CACHE BOOL "Enable mtrace support") -set(FLB_POSIX_TLS OFF CACHE BOOL "Force POSIX thread storage") -set(FLB_INOTIFY ON CACHE BOOL "Enable inotify support") -set(FLB_SQLDB ON CACHE BOOL "Enable SQL embedded DB") -set(FLB_HTTP_SERVER ON CACHE BOOL "Enable HTTP Server") -set(FLB_BACKTRACE OFF CACHE BOOL "Enable stacktrace support") -set(FLB_LUAJIT OFF CACHE BOOL "Enable Lua Scripting support") -set(FLB_RECORD_ACCESSOR ON CACHE BOOL "Enable record accessor") -set(FLB_SIGNV4 ON CACHE BOOL "Enable AWS Signv4 support") -set(FLB_AWS ON CACHE BOOL "Enable AWS support") -# set(FLB_STATIC_CONF "Build binary using static configuration") -set(FLB_STREAM_PROCESSOR OFF CACHE BOOL "Enable Stream Processor") -set(FLB_CORO_STACK_SIZE 24576 CACHE STRING "Set coroutine stack size") -set(FLB_AVRO_ENCODER OFF CACHE BOOL "Build with Avro encoding support") -set(FLB_AWS_ERROR_REPORTER ON CACHE BOOL "Build with aws error reporting support") -set(FLB_ARROW OFF CACHE BOOL "Build with Apache Arrow support") -set(FLB_WINDOWS_DEFAULTS OFF CACHE BOOL "Build with predefined Windows settings") -set(FLB_WASM OFF CACHE BOOL "Build with WASM runtime support") -set(FLB_WAMRC OFF CACHE BOOL "Build with WASM AOT compiler executable") -set(FLB_WASM_STACK_PROTECT OFF CACHE BOOL "Build with WASM runtime with strong stack protector flags") - -# Native Metrics Support (cmetrics) -set(FLB_METRICS OFF CACHE BOOL "Enable metrics support") - -# Proxy Plugins -set(FLB_PROXY_GO OFF CACHE BOOL "Enable Go plugins support") - -# Built-in Custom Plugins -set(FLB_CUSTOM_CALYPTIA OFF CACHE BOOL "Enable Calyptia Support") - -# Config formats -set(FLB_CONFIG_YAML OFF CACHE BOOL "Enable YAML config format") - -# Built-in Plugins -set(FLB_IN_CPU OFF CACHE BOOL "Enable CPU input plugin") -set(FLB_IN_THERMAL OFF CACHE BOOL "Enable Thermal plugin") -set(FLB_IN_DISK OFF CACHE BOOL "Enable Disk input plugin") -set(FLB_IN_DOCKER OFF CACHE BOOL "Enable Docker input plugin") -set(FLB_IN_DOCKER_EVENTS ON CACHE BOOL "Enable Docker events input plugin") -set(FLB_IN_EXEC OFF CACHE BOOL "Enable Exec input plugin") -set(FLB_IN_EXEC_WASI OFF CACHE BOOL "Enable Exec WASI input plugin") -set(FLB_IN_EVENT_TEST OFF CACHE BOOL "Enable Events test plugin") -set(FLB_IN_EVENT_TYPE OFF CACHE BOOL "Enable event type plugin") -set(FLB_IN_FLUENTBIT_METRICS OFF CACHE BOOL "Enable Fluent Bit metrics plugin") -set(FLB_IN_FORWARD ON CACHE BOOL "Enable Forward input plugin") -set(FLB_IN_HEALTH OFF CACHE BOOL "Enable Health input plugin") -set(FLB_IN_HTTP OFF CACHE BOOL "Enable HTTP input plugin") -set(FLB_IN_MEM OFF CACHE BOOL "Enable Memory input plugin") -set(FLB_IN_KUBERNETES_EVENTS OFF CACHE BOOL "Enable Kubernetes Events plugin") -set(FLB_IN_KAFKA OFF CACHE BOOL "Enable Kafka input plugin") -set(FLB_IN_KMSG ON CACHE BOOL "Enable Kernel log input plugin") -set(FLB_IN_LIB ON CACHE BOOL "Enable library mode input plugin") -set(FLB_IN_RANDOM OFF CACHE BOOL "Enable random input plugin") -set(FLB_IN_SERIAL ON CACHE BOOL "Enable Serial input plugin") -set(FLB_IN_STDIN OFF CACHE BOOL "Enable Standard input plugin") -set(FLB_IN_SYSLOG ON CACHE BOOL "Enable Syslog input plugin") -set(FLB_IN_TAIL ON CACHE BOOL "Enable Tail input plugin") -set(FLB_IN_UDP OFF CACHE BOOL "Enable UDP input plugin") -set(FLB_IN_TCP OFF CACHE BOOL "Enable TCP input plugin") -set(FLB_IN_UNIX_SOCKET OFF CACHE BOOL "Enable Unix socket input plugin") -set(FLB_IN_MQTT ON CACHE BOOL "Enable MQTT Broker input plugin") -set(FLB_IN_HEAD OFF CACHE BOOL "Enable Head input plugin") -set(FLB_IN_PROC OFF CACHE BOOL "Enable Process input plugin") -set(FLB_IN_SYSTEMD ON CACHE BOOL "Enable Systemd input plugin") -set(FLB_IN_DUMMY OFF CACHE BOOL "Enable Dummy input plugin") -set(FLB_IN_NGINX_EXPORTER_METRICS OFF CACHE BOOL "Enable Nginx Metrics input plugin") -set(FLB_IN_NETIF OFF CACHE BOOL "Enable NetworkIF input plugin") -set(FLB_IN_WINLOG OFF CACHE BOOL "Enable Windows Log input plugin") -set(FLB_IN_WINSTAT OFF CACHE BOOL "Enable Windows Stat input plugin") -set(FLB_IN_WINEVTLOG OFF CACHE BOOL "Enable Windows EvtLog input plugin") -set(FLB_IN_COLLECTD OFF CACHE BOOL "Enable Collectd input plugin") -set(FLB_IN_PROMETHEUS_SCRAPE OFF CACHE BOOL "Enable Promeheus Scrape input plugin") -set(FLB_IN_STATSD OFF CACHE BOOL "Enable StatsD input plugin") -set(FLB_IN_EVENT_TEST OFF CACHE BOOL "Enable event test plugin") -set(FLB_IN_STORAGE_BACKLOG OFF CACHE BOOL "Enable storage backlog input plugin") -set(FLB_IN_EMITTER OFF CACHE BOOL "Enable emitter input plugin") -set(FLB_IN_NODE_EXPORTER_METRICS OFF CACHE BOOL "Enable node exporter metrics input plugin") -set(FLB_IN_WINDOWS_EXPORTER_METRICS OFF CACHE BOOL "Enable windows exporter metrics input plugin") -set(FLB_IN_PODMAN_METRICS OFF CACHE BOOL "Enable Podman Metrics input plugin") -set(FLB_IN_OPENTELEMETRY OFF CACHE BOOL "Enable OpenTelemetry input plugin") -set(FLB_IN_ELASTICSEARCH OFF CACHE BOOL "Enable Elasticsearch (Bulk API) input plugin") -set(FLB_IN_CALYPTIA_FLEET OFF CACHE BOOL "Enable Calyptia Fleet input plugin") -set(FLB_IN_SPLUNK OFF CACHE BOOL "Enable Splunk HTTP HEC input plugin") -set(FLB_OUT_AZURE ON CACHE BOOL "Enable Azure output plugin") -set(FLB_OUT_AZURE_BLOB ON CACHE BOOL "Enable Azure output plugin") -set(FLB_OUT_AZURE_LOGS_INGESTION ON CACHE BOOL "Enable Azure Logs Ingestion output plugin") -set(FLB_OUT_AZURE_KUSTO ON CACHE BOOL "Enable Azure Kusto output plugin") -set(FLB_OUT_BIGQUERY ON CACHE BOOL "Enable BigQuery output plugin") -set(FLB_OUT_CALYPTIA OFF CACHE BOOL "Enable Calyptia monitoring plugin") -set(FLB_OUT_COUNTER OFF CACHE BOOL "Enable Counter output plugin") -set(FLB_OUT_DATADOG ON CACHE BOOL "Enable DataDog output plugin") -set(FLB_OUT_ES ON CACHE BOOL "Enable Elasticsearch output plugin") -set(FLB_OUT_EXIT OFF CACHE BOOL "Enable Exit output plugin") -set(FLB_OUT_FORWARD ON CACHE BOOL "Enable Forward output plugin") -set(FLB_OUT_GELF ON CACHE BOOL "Enable GELF output plugin") -set(FLB_OUT_HTTP ON CACHE BOOL "Enable HTTP output plugin") -set(FLB_OUT_INFLUXDB ON CACHE BOOL "Enable InfluxDB output plugin") -set(FLB_OUT_NATS ON CACHE BOOL "Enable NATS output plugin") -set(FLB_OUT_NRLOGS ON CACHE BOOL "Enable New Relic output plugin") -set(FLB_OUT_OPENSEARCH ON CACHE BOOL "Enable OpenSearch output plugin") -set(FLB_OUT_TCP ON CACHE BOOL "Enable TCP output plugin") -set(FLB_OUT_UDP ON CACHE BOOL "Enable UDP output plugin") -set(FLB_OUT_PLOT ON CACHE BOOL "Enable Plot output plugin") -set(FLB_OUT_FILE ON CACHE BOOL "Enable file output plugin") -set(FLB_OUT_TD ON CACHE BOOL "Enable Treasure Data output plugin") -set(FLB_OUT_RETRY OFF CACHE BOOL "Enable Retry test output plugin") -set(FLB_OUT_PGSQL ON CACHE BOOL "Enable PostgreSQL output plugin") -set(FLB_OUT_SKYWALKING ON CACHE BOOL "Enable Apache SkyWalking output plugin") -set(FLB_OUT_SLACK ON CACHE BOOL "Enable Slack output plugin") -set(FLB_OUT_SPLUNK ON CACHE BOOL "Enable Splunk output plugin") -set(FLB_OUT_STACKDRIVER ON CACHE BOOL "Enable Stackdriver output plugin") -set(FLB_OUT_STDOUT OFF CACHE BOOL "Enable STDOUT output plugin") -set(FLB_OUT_SYSLOG ON CACHE BOOL "Enable Syslog output plugin") -set(FLB_OUT_LIB ON CACHE BOOL "Enable library mode output plugin") -set(FLB_OUT_NULL OFF CACHE BOOL "Enable dev null output plugin") -set(FLB_OUT_FLOWCOUNTER ON CACHE BOOL "Enable flowcount output plugin") -set(FLB_OUT_LOGDNA ON CACHE BOOL "Enable LogDNA output plugin") -set(FLB_OUT_LOKI ON CACHE BOOL "Enable Loki output plugin") -set(FLB_OUT_KAFKA ON CACHE BOOL "Enable Kafka output plugin") -set(FLB_OUT_KAFKA_REST ON CACHE BOOL "Enable Kafka Rest output plugin") -set(FLB_OUT_CLOUDWATCH_LOGS ON CACHE BOOL "Enable AWS CloudWatch output plugin") -set(FLB_OUT_KINESIS_FIREHOSE ON CACHE BOOL "Enable AWS Firehose output plugin") -set(FLB_OUT_KINESIS_STREAMS ON CACHE BOOL "Enable AWS Kinesis output plugin") -set(FLB_OUT_OPENTELEMETRY ON CACHE BOOL "Enable OpenTelemetry plugin") -set(FLB_OUT_PROMETHEUS_EXPORTER ON CACHE BOOL "Enable Prometheus exporter plugin") -set(FLB_OUT_PROMETHEUS_REMOTE_WRITE ON CACHE BOOL "Enable Prometheus remote write plugin") -set(FLB_OUT_S3 ON CACHE BOOL "Enable AWS S3 output plugin") -set(FLB_OUT_VIVO_EXPORTER ON CACHE BOOL "Enabel Vivo exporter output plugin") -set(FLB_OUT_WEBSOCKET ON CACHE BOOL "Enable Websocket output plugin") -set(FLB_OUT_CHRONICLE ON CACHE BOOL "Enable Google Chronicle output plugin") -set(FLB_FILTER_ALTER_SIZE OFF CACHE BOOL "Enable alter_size filter") -set(FLB_FILTER_AWS OFF CACHE BOOL "Enable aws filter") -set(FLB_FILTER_ECS OFF CACHE BOOL "Enable AWS ECS filter") -set(FLB_FILTER_CHECKLIST OFF CACHE BOOL "Enable checklist filter") -set(FLB_FILTER_EXPECT OFF CACHE BOOL "Enable expect filter") -set(FLB_FILTER_GREP OFF CACHE BOOL "Enable grep filter") -set(FLB_FILTER_MODIFY OFF CACHE BOOL "Enable modify filter") -set(FLB_FILTER_STDOUT OFF CACHE BOOL "Enable stdout filter") -set(FLB_FILTER_PARSER ON CACHE BOOL "Enable parser filter") -set(FLB_FILTER_KUBERNETES OFF CACHE BOOL "Enable kubernetes filter") -set(FLB_FILTER_REWRITE_TAG OFF CACHE BOOL "Enable tag rewrite filter") -set(FLB_FILTER_THROTTLE OFF CACHE BOOL "Enable throttle filter") -set(FLB_FILTER_THROTTLE_SIZE OFF CACHE BOOL "Enable throttle size filter") -set(FLB_FILTER_TYPE_CONVERTER OFF CACHE BOOL "Enable type converter filter") -set(FLB_FILTER_MULTILINE OFF CACHE BOOL "Enable multiline filter") -set(FLB_FILTER_NEST OFF CACHE BOOL "Enable nest filter") -set(FLB_FILTER_LOG_TO_METRICS OFF CACHE BOOL "Enable log-derived metrics filter") -set(FLB_FILTER_LUA OFF CACHE BOOL "Enable Lua scripting filter") -set(FLB_FILTER_LUA_USE_MPACK OFF CACHE BOOL "Enable mpack on the lua filter") -set(FLB_FILTER_RECORD_MODIFIER ON CACHE BOOL "Enable record_modifier filter") -set(FLB_FILTER_TENSORFLOW OFF CACHE BOOL "Enable tensorflow filter") -set(FLB_FILTER_GEOIP2 OFF CACHE BOOL "Enable geoip2 filter") -set(FLB_FILTER_NIGHTFALL OFF CACHE BOOL "Enable Nightfall filter") -set(FLB_FILTER_WASM OFF CACHE BOOL "Enable WASM filter") -set(FLB_PROCESSOR_LABELS OFF CACHE BOOL "Enable metrics label manipulation processor") -set(FLB_PROCESSOR_ATTRIBUTES OFF CACHE BOOL "Enable atributes manipulation processor") diff --git a/src/logsmanagement/fluent_bit_build/exclude-luajit.patch b/src/logsmanagement/fluent_bit_build/exclude-luajit.patch deleted file mode 100644 index 4055f59c1..000000000 --- a/src/logsmanagement/fluent_bit_build/exclude-luajit.patch +++ /dev/null @@ -1,10 +0,0 @@ -diff --git a/cmake/luajit.cmake b/cmake/luajit.cmake -index b6774eb..f8042ae 100644 ---- a/cmake/luajit.cmake -+++ b/cmake/luajit.cmake -@@ -1,4 +1,4 @@ - # luajit cmake - option(LUAJIT_DIR "Path of LuaJIT 2.1 source dir" ON) - set(LUAJIT_DIR ${FLB_PATH_ROOT_SOURCE}/${FLB_PATH_LIB_LUAJIT}) --add_subdirectory("lib/luajit-cmake") -+add_subdirectory("lib/luajit-cmake" EXCLUDE_FROM_ALL) diff --git a/src/logsmanagement/fluent_bit_build/flb-log-fmt.patch b/src/logsmanagement/fluent_bit_build/flb-log-fmt.patch deleted file mode 100644 index b3429c41d..000000000 --- a/src/logsmanagement/fluent_bit_build/flb-log-fmt.patch +++ /dev/null @@ -1,52 +0,0 @@ -diff --git a/src/flb_log.c b/src/flb_log.c -index d004af8af..6ed27b8c6 100644 ---- a/src/flb_log.c -+++ b/src/flb_log.c -@@ -509,31 +509,31 @@ int flb_log_construct(struct log_message *msg, int *ret_len, - - switch (type) { - case FLB_LOG_HELP: -- header_title = "help"; -+ header_title = "HELP"; - header_color = ANSI_CYAN; - break; - case FLB_LOG_INFO: -- header_title = "info"; -+ header_title = "INFO"; - header_color = ANSI_GREEN; - break; - case FLB_LOG_WARN: -- header_title = "warn"; -+ header_title = "WARN"; - header_color = ANSI_YELLOW; - break; - case FLB_LOG_ERROR: -- header_title = "error"; -+ header_title = "ERROR"; - header_color = ANSI_RED; - break; - case FLB_LOG_DEBUG: -- header_title = "debug"; -+ header_title = "DEBUG"; - header_color = ANSI_YELLOW; - break; - case FLB_LOG_IDEBUG: -- header_title = "debug"; -+ header_title = "DEBUG"; - header_color = ANSI_CYAN; - break; - case FLB_LOG_TRACE: -- header_title = "trace"; -+ header_title = "TRACE"; - header_color = ANSI_BLUE; - break; - } -@@ -559,7 +559,7 @@ int flb_log_construct(struct log_message *msg, int *ret_len, - } - - len = snprintf(msg->msg, sizeof(msg->msg) - 1, -- "%s[%s%i/%02i/%02i %02i:%02i:%02i%s]%s [%s%5s%s] ", -+ "%s%s%i-%02i-%02i %02i:%02i:%02i%s:%s fluent-bit %s%s%s: ", - /* time */ /* type */ - - /* time variables */ diff --git a/src/logsmanagement/fluent_bit_build/xsi-strerror.patch b/src/logsmanagement/fluent_bit_build/xsi-strerror.patch deleted file mode 100644 index 527de2099..000000000 --- a/src/logsmanagement/fluent_bit_build/xsi-strerror.patch +++ /dev/null @@ -1,15 +0,0 @@ ---- a/src/flb_network.c -+++ b/src/flb_network.c -@@ -523,9 +523,10 @@ - } - - /* Connection is broken, not much to do here */ -- str = strerror_r(error, so_error_buf, sizeof(so_error_buf)); -+ /* XXX: XSI */ -+ int _err = strerror_r(error, so_error_buf, sizeof(so_error_buf)); - flb_error("[net] TCP connection failed: %s:%i (%s)", -- u->tcp_host, u->tcp_port, str); -+ u->tcp_host, u->tcp_port, so_error_buf); - return -1; - } - } diff --git a/src/logsmanagement/functions.c b/src/logsmanagement/functions.c deleted file mode 100644 index 59a732bea..000000000 --- a/src/logsmanagement/functions.c +++ /dev/null @@ -1,722 +0,0 @@ -// SPDX-License-Identifier: GPL-3.0-or-later - -/** @file functions.c - * - * @brief This is the file containing the implementation of the - * logs management functions API. - */ - -#include "functions.h" -#include "helper.h" -#include "query.h" - -#define LOGS_MANAG_MAX_PARAMS 100 -#define LOGS_MANAGEMENT_DEFAULT_QUERY_DURATION_IN_SEC 3600 -#define LOGS_MANAGEMENT_DEFAULT_ITEMS_PER_QUERY 200 - -#define LOGS_MANAG_FUNC_PARAM_HELP "help" -#define LOGS_MANAG_FUNC_PARAM_ANCHOR "anchor" -#define LOGS_MANAG_FUNC_PARAM_LAST "last" -#define LOGS_MANAG_FUNC_PARAM_QUERY "query" -#define LOGS_MANAG_FUNC_PARAM_FACETS "facets" -#define LOGS_MANAG_FUNC_PARAM_HISTOGRAM "histogram" -#define LOGS_MANAG_FUNC_PARAM_DIRECTION "direction" -#define LOGS_MANAG_FUNC_PARAM_IF_MODIFIED_SINCE "if_modified_since" -#define LOGS_MANAG_FUNC_PARAM_DATA_ONLY "data_only" -#define LOGS_MANAG_FUNC_PARAM_SOURCE "source" -#define LOGS_MANAG_FUNC_PARAM_INFO "info" -#define LOGS_MANAG_FUNC_PARAM_SLICE "slice" -#define LOGS_MANAG_FUNC_PARAM_DELTA "delta" -#define LOGS_MANAG_FUNC_PARAM_TAIL "tail" - -#define LOGS_MANAG_DEFAULT_DIRECTION FACETS_ANCHOR_DIRECTION_BACKWARD - -#define FACET_MAX_VALUE_LENGTH 8192 - -#define FUNCTION_LOGSMANAGEMENT_HELP_LONG \ - LOGS_MANAGEMENT_PLUGIN_STR " / " LOGS_MANAG_FUNC_NAME"\n" \ - "\n" \ - FUNCTION_LOGSMANAGEMENT_HELP_SHORT"\n" \ - "\n" \ - "The following parameters are supported::\n" \ - "\n" \ - " "LOGS_MANAG_FUNC_PARAM_HELP"\n" \ - " Shows this help message\n" \ - "\n" \ - " "LOGS_MANAG_FUNC_PARAM_INFO"\n" \ - " Request initial configuration information about the plugin.\n" \ - " The key entity returned is the required_params array, which includes\n" \ - " all the available "LOGS_MANAG_FUNC_NAME" sources.\n" \ - " When `"LOGS_MANAG_FUNC_PARAM_INFO"` is requested, all other parameters are ignored.\n" \ - "\n" \ - " "LOGS_MANAG_FUNC_PARAM_DATA_ONLY":true or "LOGS_MANAG_FUNC_PARAM_DATA_ONLY":false\n" \ - " Quickly respond with data requested, without generating a\n" \ - " `histogram`, `facets` counters and `items`.\n" \ - "\n" \ - " "LOGS_MANAG_FUNC_PARAM_SOURCE":SOURCE\n" \ - " Query only the specified "LOGS_MANAG_FUNC_NAME" sources.\n" \ - " Do an `"LOGS_MANAG_FUNC_PARAM_INFO"` query to find the sources.\n" \ - "\n" \ - " "LOGS_MANAG_FUNC_PARAM_BEFORE":TIMESTAMP_IN_SECONDS\n" \ - " Absolute or relative (to now) timestamp in seconds, to start the query.\n" \ - " The query is always executed from the most recent to the oldest log entry.\n" \ - " If not given the default is: now.\n" \ - "\n" \ - " "LOGS_MANAG_FUNC_PARAM_AFTER":TIMESTAMP_IN_SECONDS\n" \ - " Absolute or relative (to `before`) timestamp in seconds, to end the query.\n" \ - " If not given, the default is "LOGS_MANAG_STR(-LOGS_MANAGEMENT_DEFAULT_QUERY_DURATION_IN_SEC)".\n" \ - "\n" \ - " "LOGS_MANAG_FUNC_PARAM_LAST":ITEMS\n" \ - " The number of items to return.\n" \ - " The default is "LOGS_MANAG_STR(LOGS_MANAGEMENT_DEFAULT_ITEMS_PER_QUERY)".\n" \ - "\n" \ - " "LOGS_MANAG_FUNC_PARAM_ANCHOR":TIMESTAMP_IN_MICROSECONDS\n" \ - " Return items relative to this timestamp.\n" \ - " The exact items to be returned depend on the query `"LOGS_MANAG_FUNC_PARAM_DIRECTION"`.\n" \ - "\n" \ - " "LOGS_MANAG_FUNC_PARAM_DIRECTION":forward or "LOGS_MANAG_FUNC_PARAM_DIRECTION":backward\n" \ - " When set to `backward` (default) the items returned are the newest before the\n" \ - " `"LOGS_MANAG_FUNC_PARAM_ANCHOR"`, (or `"LOGS_MANAG_FUNC_PARAM_BEFORE"` if `"LOGS_MANAG_FUNC_PARAM_ANCHOR"` is not set)\n" \ - " When set to `forward` the items returned are the oldest after the\n" \ - " `"LOGS_MANAG_FUNC_PARAM_ANCHOR"`, (or `"LOGS_MANAG_FUNC_PARAM_AFTER"` if `"LOGS_MANAG_FUNC_PARAM_ANCHOR"` is not set)\n" \ - " The default is: backward\n" \ - "\n" \ - " "LOGS_MANAG_FUNC_PARAM_QUERY":SIMPLE_PATTERN\n" \ - " Do a full text search to find the log entries matching the pattern given.\n" \ - " The plugin is searching for matches on all fields of the database.\n" \ - "\n" \ - " "LOGS_MANAG_FUNC_PARAM_IF_MODIFIED_SINCE":TIMESTAMP_IN_MICROSECONDS\n" \ - " Each successful response, includes a `last_modified` field.\n" \ - " By providing the timestamp to the `"LOGS_MANAG_FUNC_PARAM_IF_MODIFIED_SINCE"` parameter,\n" \ - " the plugin will return 200 with a successful response, or 304 if the source has not\n" \ - " been modified since that timestamp.\n" \ - "\n" \ - " "LOGS_MANAG_FUNC_PARAM_HISTOGRAM":facet_id\n" \ - " Use the given `facet_id` for the histogram.\n" \ - " This parameter is ignored in `"LOGS_MANAG_FUNC_PARAM_DATA_ONLY"` mode.\n" \ - "\n" \ - " "LOGS_MANAG_FUNC_PARAM_FACETS":facet_id1,facet_id2,facet_id3,...\n" \ - " Add the given facets to the list of fields for which analysis is required.\n" \ - " The plugin will offer both a histogram and facet value counters for its values.\n" \ - " This parameter is ignored in `"LOGS_MANAG_FUNC_PARAM_DATA_ONLY"` mode.\n" \ - "\n" \ - " facet_id:value_id1,value_id2,value_id3,...\n" \ - " Apply filters to the query, based on the facet IDs returned.\n" \ - " Each `facet_id` can be given once, but multiple `facet_ids` can be given.\n" \ - "\n" - - -extern netdata_mutex_t stdout_mut; - -static DICTIONARY *function_query_status_dict = NULL; - -static DICTIONARY *used_hashes_registry = NULL; - -typedef struct function_query_status { - bool *cancelled; // a pointer to the cancelling boolean - usec_t *stop_monotonic_ut; - - // request - STRING *source; - usec_t after_ut; - usec_t before_ut; - - struct { - usec_t start_ut; - usec_t stop_ut; - } anchor; - - FACETS_ANCHOR_DIRECTION direction; - size_t entries; - usec_t if_modified_since; - bool delta; - bool tail; - bool data_only; - bool slice; - size_t filters; - usec_t last_modified; - const char *query; - const char *histogram; - - // per file progress info - size_t cached_count; - - // progress statistics - usec_t matches_setup_ut; - size_t rows_useful; - size_t rows_read; - size_t bytes_read; - size_t files_matched; - size_t file_working; -} FUNCTION_QUERY_STATUS; - - -#define LOGS_MANAG_KEYS_INCLUDED_IN_FACETS \ - "log_source" \ - "|log_type" \ - "|filename" \ - "|basename" \ - "|chartname" \ - "|message" \ - "" - -static void logsmanagement_function_facets(const char *transaction, char *function, - usec_t *stop_monotonic_ut, bool *cancelled, - BUFFER *payload __maybe_unused, HTTP_ACCESS access __maybe_unused, - const char *src __maybe_unused, void *data __maybe_unused){ - - struct rusage start, end; - getrusage(RUSAGE_THREAD, &start); - - const logs_qry_res_err_t *ret = &logs_qry_res_err[LOGS_QRY_RES_ERR_CODE_SERVER_ERR]; - - BUFFER *wb = buffer_create(0, NULL); - buffer_flush(wb); - buffer_json_initialize(wb, "\"", "\"", 0, true, BUFFER_JSON_OPTIONS_MINIFY); - - FUNCTION_QUERY_STATUS tmp_fqs = { - .cancelled = cancelled, - .stop_monotonic_ut = stop_monotonic_ut, - }; - FUNCTION_QUERY_STATUS *fqs = NULL; - const DICTIONARY_ITEM *fqs_item = NULL; - - FACETS *facets = facets_create(50, FACETS_OPTION_ALL_KEYS_FTS, - NULL, - LOGS_MANAG_KEYS_INCLUDED_IN_FACETS, - NULL); - - facets_accepted_param(facets, LOGS_MANAG_FUNC_PARAM_INFO); - facets_accepted_param(facets, LOGS_MANAG_FUNC_PARAM_SOURCE); - facets_accepted_param(facets, LOGS_MANAG_FUNC_PARAM_AFTER); - facets_accepted_param(facets, LOGS_MANAG_FUNC_PARAM_BEFORE); - facets_accepted_param(facets, LOGS_MANAG_FUNC_PARAM_ANCHOR); - facets_accepted_param(facets, LOGS_MANAG_FUNC_PARAM_DIRECTION); - facets_accepted_param(facets, LOGS_MANAG_FUNC_PARAM_LAST); - facets_accepted_param(facets, LOGS_MANAG_FUNC_PARAM_QUERY); - facets_accepted_param(facets, LOGS_MANAG_FUNC_PARAM_FACETS); - facets_accepted_param(facets, LOGS_MANAG_FUNC_PARAM_HISTOGRAM); - facets_accepted_param(facets, LOGS_MANAG_FUNC_PARAM_IF_MODIFIED_SINCE); - facets_accepted_param(facets, LOGS_MANAG_FUNC_PARAM_DATA_ONLY); - facets_accepted_param(facets, LOGS_MANAG_FUNC_PARAM_DELTA); - // facets_accepted_param(facets, JOURNAL_PARAMETER_TAIL); - -// #ifdef HAVE_SD_JOURNAL_RESTART_FIELDS -// facets_accepted_param(facets, JOURNAL_PARAMETER_SLICE); -// #endif // HAVE_SD_JOURNAL_RESTART_FIELDS - - // register the fields in the order you want them on the dashboard - - facets_register_key_name(facets, "log_source", FACET_KEY_OPTION_FACET | - FACET_KEY_OPTION_FTS); - - facets_register_key_name(facets, "log_type", FACET_KEY_OPTION_FACET | - FACET_KEY_OPTION_FTS); - - facets_register_key_name(facets, "filename", FACET_KEY_OPTION_FACET | - FACET_KEY_OPTION_FTS); - - facets_register_key_name(facets, "basename", FACET_KEY_OPTION_FACET | - FACET_KEY_OPTION_FTS); - - facets_register_key_name(facets, "chartname", FACET_KEY_OPTION_VISIBLE | - FACET_KEY_OPTION_FACET | - FACET_KEY_OPTION_FTS); - - facets_register_key_name(facets, "message", FACET_KEY_OPTION_NEVER_FACET | - FACET_KEY_OPTION_MAIN_TEXT | - FACET_KEY_OPTION_VISIBLE | - FACET_KEY_OPTION_FTS); - - bool info = false, - data_only = false, - /* slice = true, */ - delta = false, - tail = false; - time_t after_s = 0, before_s = 0; - usec_t anchor = 0; - usec_t if_modified_since = 0; - size_t last = 0; - FACETS_ANCHOR_DIRECTION direction = LOGS_MANAG_DEFAULT_DIRECTION; - const char *query = NULL; - const char *chart = NULL; - const char *source = NULL; - // size_t filters = 0; - - buffer_json_member_add_object(wb, "_request"); - - logs_query_params_t query_params = {0}; - unsigned long req_quota = 0; - - // unsigned int fn_off = 0, cn_off = 0; - - char *words[LOGS_MANAG_MAX_PARAMS] = { NULL }; - size_t num_words = quoted_strings_splitter_pluginsd(function, words, LOGS_MANAG_MAX_PARAMS); - for(int i = 1; i < LOGS_MANAG_MAX_PARAMS ; i++) { - char *keyword = get_word(words, num_words, i); - if(!keyword) break; - - - if(!strcmp(keyword, LOGS_MANAG_FUNC_PARAM_HELP)){ - BUFFER *tmp = buffer_create(0, NULL); - buffer_sprintf(tmp, FUNCTION_LOGSMANAGEMENT_HELP_LONG); - netdata_mutex_lock(&stdout_mut); - pluginsd_function_result_to_stdout(transaction, HTTP_RESP_OK, "text/plain", now_realtime_sec() + 3600, tmp); - netdata_mutex_unlock(&stdout_mut); - buffer_free(tmp); - goto cleanup; - } - else if(!strcmp(keyword, LOGS_MANAG_FUNC_PARAM_INFO)){ - info = true; - } - else if(strncmp(keyword, LOGS_MANAG_FUNC_PARAM_DELTA ":", sizeof(LOGS_MANAG_FUNC_PARAM_DELTA ":") - 1) == 0) { - char *v = &keyword[sizeof(LOGS_MANAG_FUNC_PARAM_DELTA ":") - 1]; - - if(strcmp(v, "false") == 0 || strcmp(v, "no") == 0 || strcmp(v, "0") == 0) - delta = false; - else - delta = true; - } - // else if(strncmp(keyword, JOURNAL_PARAMETER_TAIL ":", sizeof(JOURNAL_PARAMETER_TAIL ":") - 1) == 0) { - // char *v = &keyword[sizeof(JOURNAL_PARAMETER_TAIL ":") - 1]; - - // if(strcmp(v, "false") == 0 || strcmp(v, "no") == 0 || strcmp(v, "0") == 0) - // tail = false; - // else - // tail = true; - // } - else if(!strncmp( keyword, - LOGS_MANAG_FUNC_PARAM_DATA_ONLY ":", - sizeof(LOGS_MANAG_FUNC_PARAM_DATA_ONLY ":") - 1)) { - - char *v = &keyword[sizeof(LOGS_MANAG_FUNC_PARAM_DATA_ONLY ":") - 1]; - - if(!strcmp(v, "false") || !strcmp(v, "no") || !strcmp(v, "0")) - data_only = false; - else - data_only = true; - } - // else if(strncmp(keyword, JOURNAL_PARAMETER_SLICE ":", sizeof(JOURNAL_PARAMETER_SLICE ":") - 1) == 0) { - // char *v = &keyword[sizeof(JOURNAL_PARAMETER_SLICE ":") - 1]; - - // if(strcmp(v, "false") == 0 || strcmp(v, "no") == 0 || strcmp(v, "0") == 0) - // slice = false; - // else - // slice = true; - // } - else if(strncmp(keyword, LOGS_MANAG_FUNC_PARAM_SOURCE ":", sizeof(LOGS_MANAG_FUNC_PARAM_SOURCE ":") - 1) == 0) { - source = !strcmp("all", &keyword[sizeof(LOGS_MANAG_FUNC_PARAM_SOURCE ":") - 1]) ? - NULL : &keyword[sizeof(LOGS_MANAG_FUNC_PARAM_SOURCE ":") - 1]; - } - else if(strncmp(keyword, LOGS_MANAG_FUNC_PARAM_AFTER ":", sizeof(LOGS_MANAG_FUNC_PARAM_AFTER ":") - 1) == 0) { - after_s = str2l(&keyword[sizeof(LOGS_MANAG_FUNC_PARAM_AFTER ":") - 1]); - } - else if(strncmp(keyword, LOGS_MANAG_FUNC_PARAM_BEFORE ":", sizeof(LOGS_MANAG_FUNC_PARAM_BEFORE ":") - 1) == 0) { - before_s = str2l(&keyword[sizeof(LOGS_MANAG_FUNC_PARAM_BEFORE ":") - 1]); - } - else if(strncmp(keyword, LOGS_MANAG_FUNC_PARAM_IF_MODIFIED_SINCE ":", sizeof(LOGS_MANAG_FUNC_PARAM_IF_MODIFIED_SINCE ":") - 1) == 0) { - if_modified_since = str2ull(&keyword[sizeof(LOGS_MANAG_FUNC_PARAM_IF_MODIFIED_SINCE ":") - 1], NULL); - } - else if(strncmp(keyword, LOGS_MANAG_FUNC_PARAM_ANCHOR ":", sizeof(LOGS_MANAG_FUNC_PARAM_ANCHOR ":") - 1) == 0) { - anchor = str2ull(&keyword[sizeof(LOGS_MANAG_FUNC_PARAM_ANCHOR ":") - 1], NULL); - } - else if(strncmp(keyword, LOGS_MANAG_FUNC_PARAM_DIRECTION ":", sizeof(LOGS_MANAG_FUNC_PARAM_DIRECTION ":") - 1) == 0) { - direction = !strcasecmp(&keyword[sizeof(LOGS_MANAG_FUNC_PARAM_DIRECTION ":") - 1], "forward") ? - FACETS_ANCHOR_DIRECTION_FORWARD : FACETS_ANCHOR_DIRECTION_BACKWARD; - } - else if(strncmp(keyword, LOGS_MANAG_FUNC_PARAM_LAST ":", sizeof(LOGS_MANAG_FUNC_PARAM_LAST ":") - 1) == 0) { - last = str2ul(&keyword[sizeof(LOGS_MANAG_FUNC_PARAM_LAST ":") - 1]); - } - else if(strncmp(keyword, LOGS_MANAG_FUNC_PARAM_QUERY ":", sizeof(LOGS_MANAG_FUNC_PARAM_QUERY ":") - 1) == 0) { - query= &keyword[sizeof(LOGS_MANAG_FUNC_PARAM_QUERY ":") - 1]; - } - else if(strncmp(keyword, LOGS_MANAG_FUNC_PARAM_HISTOGRAM ":", sizeof(LOGS_MANAG_FUNC_PARAM_HISTOGRAM ":") - 1) == 0) { - chart = &keyword[sizeof(LOGS_MANAG_FUNC_PARAM_HISTOGRAM ":") - 1]; - } - else if(strncmp(keyword, LOGS_MANAG_FUNC_PARAM_FACETS ":", sizeof(LOGS_MANAG_FUNC_PARAM_FACETS ":") - 1) == 0) { - char *value = &keyword[sizeof(LOGS_MANAG_FUNC_PARAM_FACETS ":") - 1]; - if(*value) { - buffer_json_member_add_array(wb, LOGS_MANAG_FUNC_PARAM_FACETS); - - while(value) { - char *sep = strchr(value, ','); - if(sep) - *sep++ = '\0'; - - facets_register_facet_id(facets, value, FACET_KEY_OPTION_FACET|FACET_KEY_OPTION_FTS|FACET_KEY_OPTION_REORDER); - buffer_json_add_array_item_string(wb, value); - - value = sep; - } - - buffer_json_array_close(wb); // LOGS_MANAG_FUNC_PARAM_FACETS - } - } - else { - char *value = strchr(keyword, ':'); - if(value) { - *value++ = '\0'; - - buffer_json_member_add_array(wb, keyword); - - while(value) { - char *sep = strchr(value, ','); - if(sep) - *sep++ = '\0'; - - facets_register_facet_id_filter(facets, keyword, value, FACET_KEY_OPTION_FACET|FACET_KEY_OPTION_FTS|FACET_KEY_OPTION_REORDER); - buffer_json_add_array_item_string(wb, value); - // filters++; - - value = sep; - } - - buffer_json_array_close(wb); // keyword - } - } - } - - fqs = &tmp_fqs; - fqs_item = NULL; - - // ------------------------------------------------------------------------ - // validate parameters - - time_t now_s = now_realtime_sec(); - time_t expires = now_s + 1; - - if(!after_s && !before_s) { - before_s = now_s; - after_s = before_s - LOGS_MANAGEMENT_DEFAULT_QUERY_DURATION_IN_SEC; - } - else - rrdr_relative_window_to_absolute(&after_s, &before_s, now_s); - - if(after_s > before_s) { - time_t tmp = after_s; - after_s = before_s; - before_s = tmp; - } - - if(after_s == before_s) - after_s = before_s - LOGS_MANAGEMENT_DEFAULT_QUERY_DURATION_IN_SEC; - - if(!last) - last = LOGS_MANAGEMENT_DEFAULT_ITEMS_PER_QUERY; - - - // ------------------------------------------------------------------------ - // set query time-frame, anchors and direction - - fqs->after_ut = after_s * USEC_PER_SEC; - fqs->before_ut = (before_s * USEC_PER_SEC) + USEC_PER_SEC - 1; - fqs->if_modified_since = if_modified_since; - fqs->data_only = data_only; - fqs->delta = (fqs->data_only) ? delta : false; - fqs->tail = (fqs->data_only && fqs->if_modified_since) ? tail : false; - fqs->source = string_strdupz(source); - fqs->entries = last; - fqs->last_modified = 0; - // fqs->filters = filters; - fqs->query = (query && *query) ? query : NULL; - fqs->histogram = (chart && *chart) ? chart : NULL; - fqs->direction = direction; - fqs->anchor.start_ut = anchor; - fqs->anchor.stop_ut = 0; - - if(fqs->anchor.start_ut && fqs->tail) { - // a tail request - // we need the top X entries from BEFORE - // but, we need to calculate the facets and the - // histogram up to the anchor - fqs->direction = direction = FACETS_ANCHOR_DIRECTION_BACKWARD; - fqs->anchor.start_ut = 0; - fqs->anchor.stop_ut = anchor; - } - - if(anchor && anchor < fqs->after_ut) { - // log_fqs(fqs, "received anchor is too small for query timeframe, ignoring anchor"); - anchor = 0; - fqs->anchor.start_ut = 0; - fqs->anchor.stop_ut = 0; - fqs->direction = direction = FACETS_ANCHOR_DIRECTION_BACKWARD; - } - else if(anchor > fqs->before_ut) { - // log_fqs(fqs, "received anchor is too big for query timeframe, ignoring anchor"); - anchor = 0; - fqs->anchor.start_ut = 0; - fqs->anchor.stop_ut = 0; - fqs->direction = direction = FACETS_ANCHOR_DIRECTION_BACKWARD; - } - - facets_set_anchor(facets, fqs->anchor.start_ut, fqs->anchor.stop_ut, fqs->direction); - - facets_set_additional_options(facets, - ((fqs->data_only) ? FACETS_OPTION_DATA_ONLY : 0) | - ((fqs->delta) ? FACETS_OPTION_SHOW_DELTAS : 0)); - - // ------------------------------------------------------------------------ - // set the rest of the query parameters - - facets_set_items(facets, fqs->entries); - facets_set_query(facets, fqs->query); - -// #ifdef HAVE_SD_JOURNAL_RESTART_FIELDS -// fqs->slice = slice; -// if(slice) -// facets_enable_slice_mode(facets); -// #else -// fqs->slice = false; -// #endif - - if(fqs->histogram) - facets_set_timeframe_and_histogram_by_id(facets, fqs->histogram, fqs->after_ut, fqs->before_ut); - else - facets_set_timeframe_and_histogram_by_name(facets, chart ? chart : "chartname", fqs->after_ut, fqs->before_ut); - - - // ------------------------------------------------------------------------ - // complete the request object - - buffer_json_member_add_boolean(wb, LOGS_MANAG_FUNC_PARAM_INFO, false); - buffer_json_member_add_boolean(wb, LOGS_MANAG_FUNC_PARAM_SLICE, fqs->slice); - buffer_json_member_add_boolean(wb, LOGS_MANAG_FUNC_PARAM_DATA_ONLY, fqs->data_only); - buffer_json_member_add_boolean(wb, LOGS_MANAG_FUNC_PARAM_DELTA, fqs->delta); - buffer_json_member_add_boolean(wb, LOGS_MANAG_FUNC_PARAM_TAIL, fqs->tail); - buffer_json_member_add_string(wb, LOGS_MANAG_FUNC_PARAM_SOURCE, string2str(fqs->source)); - buffer_json_member_add_uint64(wb, LOGS_MANAG_FUNC_PARAM_AFTER, fqs->after_ut / USEC_PER_SEC); - buffer_json_member_add_uint64(wb, LOGS_MANAG_FUNC_PARAM_BEFORE, fqs->before_ut / USEC_PER_SEC); - buffer_json_member_add_uint64(wb, LOGS_MANAG_FUNC_PARAM_IF_MODIFIED_SINCE, fqs->if_modified_since); - buffer_json_member_add_uint64(wb, LOGS_MANAG_FUNC_PARAM_ANCHOR, anchor); - buffer_json_member_add_string(wb, LOGS_MANAG_FUNC_PARAM_DIRECTION, - fqs->direction == FACETS_ANCHOR_DIRECTION_FORWARD ? "forward" : "backward"); - buffer_json_member_add_uint64(wb, LOGS_MANAG_FUNC_PARAM_LAST, fqs->entries); - buffer_json_member_add_string(wb, LOGS_MANAG_FUNC_PARAM_QUERY, fqs->query); - buffer_json_member_add_string(wb, LOGS_MANAG_FUNC_PARAM_HISTOGRAM, fqs->histogram); - buffer_json_object_close(wb); // request - - // buffer_json_journal_versions(wb); - - // ------------------------------------------------------------------------ - // run the request - - if(info) { - facets_accepted_parameters_to_json_array(facets, wb, false); - buffer_json_member_add_array(wb, "required_params"); - { - buffer_json_add_array_item_object(wb); - { - buffer_json_member_add_string(wb, "id", "source"); - buffer_json_member_add_string(wb, "name", "source"); - buffer_json_member_add_string(wb, "help", "Select the Logs Management source to query"); - buffer_json_member_add_string(wb, "type", "select"); - buffer_json_member_add_array(wb, "options"); - ret = fetch_log_sources(wb); - buffer_json_array_close(wb); // options array - } - buffer_json_object_close(wb); // required params object - } - buffer_json_array_close(wb); // required_params array - - facets_table_config(wb); - - buffer_json_member_add_uint64(wb, "status", HTTP_RESP_OK); - buffer_json_member_add_string(wb, "type", "table"); - buffer_json_member_add_string(wb, "help", FUNCTION_LOGSMANAGEMENT_HELP_SHORT); - buffer_json_finalize(wb); - goto output; - } - - if(!req_quota) - query_params.quota = LOGS_MANAG_QUERY_QUOTA_DEFAULT; - else if(req_quota > LOGS_MANAG_QUERY_QUOTA_MAX) - query_params.quota = LOGS_MANAG_QUERY_QUOTA_MAX; - else query_params.quota = req_quota; - - - if(fqs->source) - query_params.chartname[0] = (char *) string2str(fqs->source); - - query_params.order_by_asc = 0; - - - // NOTE: Always perform descending timestamp query, req_from_ts >= req_to_ts. - if(fqs->direction == FACETS_ANCHOR_DIRECTION_BACKWARD){ - query_params.req_from_ts = - (fqs->data_only && fqs->anchor.start_ut) ? fqs->anchor.start_ut / USEC_PER_MS : before_s * MSEC_PER_SEC; - query_params.req_to_ts = - (fqs->data_only && fqs->anchor.stop_ut) ? fqs->anchor.stop_ut / USEC_PER_MS : after_s * MSEC_PER_SEC; - } - else{ - query_params.req_from_ts = - (fqs->data_only && fqs->anchor.stop_ut) ? fqs->anchor.stop_ut / USEC_PER_MS : before_s * MSEC_PER_SEC; - query_params.req_to_ts = - (fqs->data_only && fqs->anchor.start_ut) ? fqs->anchor.start_ut / USEC_PER_MS : after_s * MSEC_PER_SEC; - } - - query_params.cancelled = cancelled; - query_params.stop_monotonic_ut = stop_monotonic_ut; - query_params.results_buff = buffer_create(query_params.quota, NULL); - - facets_rows_begin(facets); - - do{ - if(query_params.act_to_ts) - query_params.req_from_ts = query_params.act_to_ts - 1000; - - ret = execute_logs_manag_query(&query_params); - - - size_t res_off = 0; - logs_query_res_hdr_t *p_res_hdr; - while(query_params.results_buff->len - res_off > 0){ - p_res_hdr = (logs_query_res_hdr_t *) &query_params.results_buff->buffer[res_off]; - - ssize_t remaining = p_res_hdr->text_size; - char *ls = &query_params.results_buff->buffer[res_off] + sizeof(*p_res_hdr) + p_res_hdr->text_size - 1; - *ls = '\0'; - int timestamp_off = p_res_hdr->matches; - do{ - do{ - --remaining; - --ls; - } while(remaining > 0 && *ls != '\n'); - *ls = '\0'; - --remaining; - --ls; - - usec_t timestamp = p_res_hdr->timestamp * USEC_PER_MS + --timestamp_off; - - if(unlikely(!fqs->last_modified)) { - if(timestamp == if_modified_since){ - ret = &logs_qry_res_err[LOGS_QRY_RES_ERR_CODE_UNMODIFIED]; - goto output; - } - else - fqs->last_modified = timestamp; - } - - facets_add_key_value(facets, "log_source", p_res_hdr->log_source[0] ? p_res_hdr->log_source : "-"); - - facets_add_key_value(facets, "log_type", p_res_hdr->log_type[0] ? p_res_hdr->log_type : "-"); - - facets_add_key_value(facets, "filename", p_res_hdr->filename[0] ? p_res_hdr->filename : "-"); - - facets_add_key_value(facets, "basename", p_res_hdr->basename[0] ? p_res_hdr->basename : "-"); - - facets_add_key_value(facets, "chartname", p_res_hdr->chartname[0] ? p_res_hdr->chartname : "-"); - - size_t ls_len = strlen(ls + 2); - facets_add_key_value_length(facets, "message", sizeof("message") - 1, - ls + 2, ls_len <= FACET_MAX_VALUE_LENGTH ? ls_len : FACET_MAX_VALUE_LENGTH); - - facets_row_finished(facets, timestamp); - - } while(remaining > 0); - - res_off += sizeof(*p_res_hdr) + p_res_hdr->text_size; - - } - - buffer_flush(query_params.results_buff); - - } while(query_params.act_to_ts > query_params.req_to_ts); - - m_assert(query_params.req_from_ts == query_params.act_from_ts, "query_params.req_from_ts != query_params.act_from_ts"); - m_assert(query_params.req_to_ts == query_params.act_to_ts , "query_params.req_to_ts != query_params.act_to_ts"); - - - getrusage(RUSAGE_THREAD, &end); - time_t user_time = end.ru_utime.tv_sec * USEC_PER_SEC + end.ru_utime.tv_usec - - start.ru_utime.tv_sec * USEC_PER_SEC - start.ru_utime.tv_usec; - time_t sys_time = end.ru_stime.tv_sec * USEC_PER_SEC + end.ru_stime.tv_usec - - start.ru_stime.tv_sec * USEC_PER_SEC - start.ru_stime.tv_usec; - - buffer_json_member_add_object(wb, "logs_management_meta"); - buffer_json_member_add_string(wb, "api_version", LOGS_QRY_VERSION); - buffer_json_member_add_uint64(wb, "num_lines", query_params.num_lines); - buffer_json_member_add_uint64(wb, "user_time", user_time); - buffer_json_member_add_uint64(wb, "system_time", sys_time); - buffer_json_member_add_uint64(wb, "total_time", user_time + sys_time); - buffer_json_member_add_uint64(wb, "error_code", (uint64_t) ret->err_code); - buffer_json_member_add_string(wb, "error_string", ret->err_str); - buffer_json_object_close(wb); // logs_management_meta - - buffer_json_member_add_uint64(wb, "status", ret->http_code); - buffer_json_member_add_boolean(wb, "partial", ret->http_code != HTTP_RESP_OK || - ret->err_code == LOGS_QRY_RES_ERR_CODE_TIMEOUT); - buffer_json_member_add_string(wb, "type", "table"); - - - if(!fqs->data_only) { - buffer_json_member_add_time_t(wb, "update_every", 1); - buffer_json_member_add_string(wb, "help", FUNCTION_LOGSMANAGEMENT_HELP_SHORT); - } - - if(!fqs->data_only || fqs->tail) - buffer_json_member_add_uint64(wb, "last_modified", fqs->last_modified); - - facets_sort_and_reorder_keys(facets); - facets_report(facets, wb, used_hashes_registry); - - buffer_json_member_add_time_t(wb, "expires", now_realtime_sec() + (fqs->data_only ? 3600 : 0)); - buffer_json_finalize(wb); // logs_management_meta - - - // ------------------------------------------------------------------------ - // cleanup query params - - string_freez(fqs->source); - fqs->source = NULL; - - // ------------------------------------------------------------------------ - // handle error response - -output: - netdata_mutex_lock(&stdout_mut); - if(ret->http_code != HTTP_RESP_OK) - pluginsd_function_json_error_to_stdout(transaction, ret->http_code, ret->err_str); - else - pluginsd_function_result_to_stdout(transaction, ret->http_code, "application/json", expires, wb); - netdata_mutex_unlock(&stdout_mut); - -cleanup: - facets_destroy(facets); - buffer_free(query_params.results_buff); - buffer_free(wb); - - if(fqs_item) { - dictionary_del(function_query_status_dict, dictionary_acquired_item_name(fqs_item)); - dictionary_acquired_item_release(function_query_status_dict, fqs_item); - dictionary_garbage_collect(function_query_status_dict); - } -} - -struct functions_evloop_globals *logsmanagement_func_facets_init(bool *p_logsmanagement_should_exit){ - - function_query_status_dict = dictionary_create_advanced( - DICT_OPTION_DONT_OVERWRITE_VALUE | DICT_OPTION_FIXED_SIZE, - NULL, sizeof(FUNCTION_QUERY_STATUS)); - - used_hashes_registry = dictionary_create(DICT_OPTION_DONT_OVERWRITE_VALUE); - - netdata_mutex_lock(&stdout_mut); - fprintf(stdout, PLUGINSD_KEYWORD_FUNCTION " GLOBAL \"%s\" %d \"%s\" \"logs\" "HTTP_ACCESS_FORMAT" %d\n", - LOGS_MANAG_FUNC_NAME, - LOGS_MANAG_QUERY_TIMEOUT_DEFAULT, - FUNCTION_LOGSMANAGEMENT_HELP_SHORT, - (HTTP_ACCESS_FORMAT_CAST)(HTTP_ACCESS_SIGNED_ID | HTTP_ACCESS_SAME_SPACE | HTTP_ACCESS_SENSITIVE_DATA), - RRDFUNCTIONS_PRIORITY_DEFAULT + 1); - netdata_mutex_unlock(&stdout_mut); - - struct functions_evloop_globals *wg = functions_evloop_init(1, "LGSMNGM", - &stdout_mut, - p_logsmanagement_should_exit); - - functions_evloop_add_function( wg, LOGS_MANAG_FUNC_NAME, - logsmanagement_function_facets, - LOGS_MANAG_QUERY_TIMEOUT_DEFAULT, - NULL); - - return wg; -} diff --git a/src/logsmanagement/functions.h b/src/logsmanagement/functions.h deleted file mode 100644 index ea8f35c0e..000000000 --- a/src/logsmanagement/functions.h +++ /dev/null @@ -1,22 +0,0 @@ -// SPDX-License-Identifier: GPL-3.0-or-later - -/** @file functions.h - * @brief Header of functions.c - */ - -#ifndef FUNCTIONS_H_ -#define FUNCTIONS_H_ - -#include "database/rrdfunctions.h" - -#define LOGS_MANAG_FUNC_NAME "logs-management" -#define FUNCTION_LOGSMANAGEMENT_HELP_SHORT "View, search and analyze logs monitored through the logs management engine." - -int logsmanagement_function_execute_cb( BUFFER *dest_wb, int timeout, - const char *function, void *collector_data, - void (*callback)(BUFFER *wb, int code, void *callback_data), - void *callback_data); - -struct functions_evloop_globals *logsmanagement_func_facets_init(bool *p_logsmanagement_should_exit); - -#endif // FUNCTIONS_H_ diff --git a/src/logsmanagement/helper.h b/src/logsmanagement/helper.h deleted file mode 100644 index 6d1d51f76..000000000 --- a/src/logsmanagement/helper.h +++ /dev/null @@ -1,238 +0,0 @@ -// SPDX-License-Identifier: GPL-3.0-or-later - -/** @file helper.h - * @brief Includes helper functions for the Logs Management project. - */ - -#ifndef HELPER_H_ -#define HELPER_H_ - -#include "libnetdata/libnetdata.h" -#include <assert.h> - -#define LOGS_MANAGEMENT_PLUGIN_STR "logs-management.plugin" - -#define LOGS_MANAG_STR_HELPER(x) #x -#define LOGS_MANAG_STR(x) LOGS_MANAG_STR_HELPER(x) - -#ifndef m_assert -#if defined(LOGS_MANAGEMENT_DEV_MODE) -#define m_assert(expr, msg) assert(((void)(msg), (expr))) -#else -#define m_assert(expr, msg) do{} while(0) -#endif // LOGS_MANAGEMENT_DEV_MODE -#endif // m_assert - -/* Test if a timestamp is within a valid range - * 1649175852000 equals Tuesday, 5 April 2022 16:24:12, - * 2532788652000 equals Tuesday, 5 April 2050 16:24:12 - */ -#define TEST_MS_TIMESTAMP_VALID(x) (((x) > 1649175852000 && (x) < 2532788652000)? 1:0) - -#define TIMESTAMP_MS_STR_SIZE sizeof("1649175852000") - -#ifdef ENABLE_LOGSMANAGEMENT_TESTS -#define UNIT_STATIC -#else -#define UNIT_STATIC static -#endif // ENABLE_LOGSMANAGEMENT_TESTS - -#ifndef COMPILE_TIME_ASSERT // https://stackoverflow.com/questions/3385515/static-assert-in-c -#define STATIC_ASSERT(COND,MSG) typedef char static_assertion_##MSG[(!!(COND))*2-1] -// token pasting madness: -#define COMPILE_TIME_ASSERT3(X,L) STATIC_ASSERT(X,static_assertion_at_line_##L) -#define COMPILE_TIME_ASSERT2(X,L) COMPILE_TIME_ASSERT3(X,L) -#define COMPILE_TIME_ASSERT(X) COMPILE_TIME_ASSERT2(X,__LINE__) -#endif // COMPILE_TIME_ASSERT - -#if defined(NETDATA_INTERNAL_CHECKS) && defined(LOGS_MANAGEMENT_DEV_MODE) -#define debug_log(args...) netdata_logger(NDLS_COLLECTORS, NDLP_DEBUG, __FILE__, __FUNCTION__, __LINE__, ##args) -#else -#define debug_log(fmt, args...) do {} while(0) -#endif - -/** - * @brief Extract file_basename from full file path - * @param path String containing the full path. - * @return Pointer to the file_basename string - */ -static inline char *get_basename(const char *const path) { - if(!path) return NULL; - char *s = strrchr(path, '/'); - if (!s) - return strdupz(path); - else - return strdupz(s + 1); -} - -typedef enum { - STR2XX_SUCCESS = 0, - STR2XX_OVERFLOW, - STR2XX_UNDERFLOW, - STR2XX_INCONVERTIBLE -} str2xx_errno; - -/* Convert string s to int out. - * https://stackoverflow.com/questions/7021725/how-to-convert-a-string-to-integer-in-c - * - * @param[out] out The converted int. Cannot be NULL. - * @param[in] s Input string to be converted. - * - * The format is the same as strtol, - * except that the following are inconvertible: - * - empty string - * - leading whitespace - * - any trailing characters that are not part of the number - * Cannot be NULL. - * - * @param[in] base Base to interpret string in. Same range as strtol (2 to 36). - * @return Indicates if the operation succeeded, or why it failed. - */ -static inline str2xx_errno str2int(int *out, char *s, int base) { - char *end; - if (unlikely(s[0] == '\0' || isspace(s[0]))){ - // debug_log( "str2int error: STR2XX_INCONVERTIBLE 1"); - // m_assert(0, "str2int error: STR2XX_INCONVERTIBLE"); - return STR2XX_INCONVERTIBLE; - } - errno = 0; - long l = strtol(s, &end, base); - /* Both checks are needed because INT_MAX == LONG_MAX is possible. */ - if (unlikely(l > INT_MAX || (errno == ERANGE && l == LONG_MAX))){ - debug_log( "str2int error: STR2XX_OVERFLOW"); - // m_assert(0, "str2int error: STR2XX_OVERFLOW"); - return STR2XX_OVERFLOW; - } - if (unlikely(l < INT_MIN || (errno == ERANGE && l == LONG_MIN))){ - debug_log( "str2int error: STR2XX_UNDERFLOW"); - // m_assert(0, "str2int error: STR2XX_UNDERFLOW"); - return STR2XX_UNDERFLOW; - } - if (unlikely(*end != '\0')){ - debug_log( "str2int error: STR2XX_INCONVERTIBLE 2"); - // m_assert(0, "str2int error: STR2XX_INCONVERTIBLE 2"); - return STR2XX_INCONVERTIBLE; - } - *out = l; - return STR2XX_SUCCESS; -} - -static inline str2xx_errno str2float(float *out, char *s) { - char *end; - if (unlikely(s[0] == '\0' || isspace(s[0]))){ - // debug_log( "str2float error: STR2XX_INCONVERTIBLE 1\n"); - // m_assert(0, "str2float error: STR2XX_INCONVERTIBLE"); - return STR2XX_INCONVERTIBLE; - } - errno = 0; - float f = strtof(s, &end); - /* Both checks are needed because INT_MAX == LONG_MAX is possible. */ - if (unlikely((errno == ERANGE && f == HUGE_VALF))){ - debug_log( "str2float error: STR2XX_OVERFLOW\n"); - // m_assert(0, "str2float error: STR2XX_OVERFLOW"); - return STR2XX_OVERFLOW; - } - if (unlikely((errno == ERANGE && f == -HUGE_VALF))){ - debug_log( "str2float error: STR2XX_UNDERFLOW\n"); - // m_assert(0, "str2float error: STR2XX_UNDERFLOW"); - return STR2XX_UNDERFLOW; - } - if (unlikely((*end != '\0'))){ - debug_log( "str2float error: STR2XX_INCONVERTIBLE 2\n"); - // m_assert(0, "str2float error: STR2XX_INCONVERTIBLE"); - return STR2XX_INCONVERTIBLE; - } - *out = f; - return STR2XX_SUCCESS; -} - -/** - * @brief Read last line of *filename, up to max_line_width characters. - * @note This function should be used carefully as it is not the most - * efficient one. But it is a quick-n-dirty way of reading the last line - * of a file. - * @param[in] filename File to be read. - * @param[in] max_line_width Integer indicating the max line width to be read. - * If a line is longer than that, it will be truncated. If zero or negative, a - * default value will be used instead. - * @return Pointer to a string holding the line that was read, or NULL if error. - */ -static inline char *read_last_line(const char *filename, int max_line_width){ - uv_fs_t req; - int64_t start_pos, end_pos; - uv_file file_handle = -1; - uv_buf_t uvBuf; - char *buff = NULL; - int rc, line_pos = -1, bytes_read; - - max_line_width = max_line_width > 0 ? max_line_width : 1024; // 1024 == default value - - rc = uv_fs_stat(NULL, &req, filename, NULL); - end_pos = req.statbuf.st_size; - uv_fs_req_cleanup(&req); - if (unlikely(rc)) { - collector_error("[%s]: uv_fs_stat() error: (%d) %s", filename, rc, uv_strerror(rc)); - m_assert(0, "uv_fs_stat() failed during read_last_line()"); - goto error; - } - - if(end_pos == 0) goto error; - start_pos = end_pos - max_line_width; - if(start_pos < 0) start_pos = 0; - - rc = uv_fs_open(NULL, &req, filename, O_RDONLY, 0, NULL); - uv_fs_req_cleanup(&req); - if (unlikely(rc < 0)) { - collector_error("[%s]: uv_fs_open() error: (%d) %s",filename, rc, uv_strerror(rc)); - m_assert(0, "uv_fs_open() failed during read_last_line()"); - goto error; - } - file_handle = rc; - - buff = callocz(1, (size_t) (end_pos - start_pos + 1) * sizeof(char)); - uvBuf = uv_buf_init(buff, (unsigned int) (end_pos - start_pos)); - rc = uv_fs_read(NULL, &req, file_handle, &uvBuf, 1, start_pos, NULL); - uv_fs_req_cleanup(&req); - if (unlikely(rc < 0)){ - collector_error("[%s]: uv_fs_read() error: (%d) %s", filename, rc, uv_strerror(rc)); - m_assert(0, "uv_fs_read() failed during read_last_line()"); - goto error; - } - bytes_read = rc; - - buff[bytes_read] = '\0'; - - for(int i = bytes_read - 2; i >= 0; i--){ // -2 because -1 could be '\n' - if (buff[i] == '\n'){ - line_pos = i; - break; - } - } - - if(line_pos >= 0){ - char *line = callocz(1, (size_t) (bytes_read - line_pos) * sizeof(char)); - memcpy(line, &buff[line_pos + 1], (size_t) (bytes_read - line_pos)); - freez(buff); - uv_fs_close(NULL, &req, file_handle, NULL); - return line; - } - - if(start_pos == 0){ - uv_fs_close(NULL, &req, file_handle, NULL); - return buff; - } - -error: - if(buff) freez(buff); - if(file_handle >= 0) uv_fs_close(NULL, &req, file_handle, NULL); - return NULL; -} - -static inline void memcpy_iscntrl_fix(char *dest, char *src, size_t num){ - while(num--){ - *dest++ = unlikely(!iscntrl(*src)) ? *src : ' '; - src++; - } -} - -#endif // HELPER_H_ diff --git a/src/logsmanagement/logsmanag_config.c b/src/logsmanagement/logsmanag_config.c deleted file mode 100644 index e356183f8..000000000 --- a/src/logsmanagement/logsmanag_config.c +++ /dev/null @@ -1,1410 +0,0 @@ -// SPDX-License-Identifier: GPL-3.0-or-later - -/** @file logsmanag_config.c - * @brief This file includes functions to manage - * the logs management configuration. - */ - -#include "logsmanag_config.h" -#include "db_api.h" -#include "rrd_api/rrd_api.h" -#include "helper.h" - -g_logs_manag_config_t g_logs_manag_config = { - .update_every = UPDATE_EVERY, - .update_timeout = UPDATE_TIMEOUT_DEFAULT, - .use_log_timestamp = CONFIG_BOOLEAN_AUTO, - .circ_buff_max_size_in_mib = CIRCULAR_BUFF_DEFAULT_MAX_SIZE / (1 MiB), - .circ_buff_drop_logs = CIRCULAR_BUFF_DEFAULT_DROP_LOGS, - .compression_acceleration = COMPRESSION_ACCELERATION_DEFAULT, - .db_mode = GLOBAL_DB_MODE_DEFAULT, - .disk_space_limit_in_mib = DISK_SPACE_LIMIT_DEFAULT, - .buff_flush_to_db_interval = SAVE_BLOB_TO_DB_DEFAULT, - .enable_collected_logs_total = ENABLE_COLLECTED_LOGS_TOTAL_DEFAULT, - .enable_collected_logs_rate = ENABLE_COLLECTED_LOGS_RATE_DEFAULT, - .sd_journal_field_prefix = SD_JOURNAL_FIELD_PREFIX, - .do_sd_journal_send = SD_JOURNAL_SEND_DEFAULT -}; - -static logs_manag_db_mode_t db_mode_str_to_db_mode(const char *const db_mode_str){ - if(!db_mode_str || !*db_mode_str) return g_logs_manag_config.db_mode; - else if(!strcasecmp(db_mode_str, "full")) return LOGS_MANAG_DB_MODE_FULL; - else if(!strcasecmp(db_mode_str, "none")) return LOGS_MANAG_DB_MODE_NONE; - else return g_logs_manag_config.db_mode; -} - -static struct config log_management_config = { - .first_section = NULL, - .last_section = NULL, - .mutex = NETDATA_MUTEX_INITIALIZER, - .index = { - .avl_tree = { - .root = NULL, - .compar = appconfig_section_compare - }, - .rwlock = AVL_LOCK_INITIALIZER - } -}; - -static struct Chart_meta chart_types[] = { - {.type = FLB_TAIL, .init = generic_chart_init, .update = generic_chart_update}, - {.type = FLB_WEB_LOG, .init = web_log_chart_init, .update = web_log_chart_update}, - {.type = FLB_KMSG, .init = kernel_chart_init, .update = kernel_chart_update}, - {.type = FLB_SYSTEMD, .init = systemd_chart_init, .update = systemd_chart_update}, - {.type = FLB_DOCKER_EV, .init = docker_ev_chart_init, .update = docker_ev_chart_update}, - {.type = FLB_SYSLOG, .init = generic_chart_init, .update = generic_chart_update}, - {.type = FLB_SERIAL, .init = generic_chart_init, .update = generic_chart_update}, - {.type = FLB_MQTT, .init = mqtt_chart_init, .update = mqtt_chart_update} -}; - -char *get_user_config_dir(void){ - char *dir = getenv("NETDATA_USER_CONFIG_DIR"); - - return dir ? dir : CONFIG_DIR; -} - -char *get_stock_config_dir(void){ - char *dir = getenv("NETDATA_STOCK_CONFIG_DIR"); - - return dir ? dir : LIBCONFIG_DIR; -} - -char *get_log_dir(void){ - char *dir = getenv("NETDATA_LOG_DIR"); - - return dir ? dir : LOG_DIR; -} - -char *get_cache_dir(void){ - char *dir = getenv("NETDATA_CACHE_DIR"); - - return dir ? dir : CACHE_DIR; -} - -/** - * @brief Cleanup p_file_info struct - * @param p_file_info The struct of File_info type to be cleaned up. - * @todo Pass p_file_info by reference, so that it can be set to NULL. */ -static void p_file_info_destroy(void *arg){ - struct File_info *p_file_info = (struct File_info *) arg; - - // TODO: Clean up rrd / chart stuff. - // p_file_info->chart_meta - - if(unlikely(!p_file_info)){ - collector_info("p_file_info_destroy() called but p_file_info == NULL - already destroyed?"); - return; - } - - char chartname[100]; - snprintfz(chartname, 100, "%s", p_file_info->chartname ? p_file_info->chartname : "Unknown"); - collector_info("[%s]: p_file_info_destroy() cleanup...", chartname); - - __atomic_store_n(&p_file_info->state, LOG_SRC_EXITING, __ATOMIC_RELAXED); - - if(uv_is_active((uv_handle_t *) &p_file_info->flb_tmp_buff_cpy_timer)){ - uv_timer_stop(&p_file_info->flb_tmp_buff_cpy_timer); - if (!uv_is_closing((uv_handle_t *) &p_file_info->flb_tmp_buff_cpy_timer)) - uv_close((uv_handle_t *) &p_file_info->flb_tmp_buff_cpy_timer, NULL); - } - - // TODO: Need to do proper termination of DB threads and allocated memory. - if(p_file_info->db_writer_thread){ - uv_thread_join(p_file_info->db_writer_thread); - sqlite3_finalize(p_file_info->stmt_get_log_msg_metadata_asc); - sqlite3_finalize(p_file_info->stmt_get_log_msg_metadata_desc); - if(sqlite3_close(p_file_info->db) != SQLITE_OK) - collector_error("[%s]: Failed to close database", chartname); - freez(p_file_info->db_mut); - freez((void *) p_file_info->db_metadata); - freez((void *) p_file_info->db_dir); - freez(p_file_info->db_writer_thread); - } - - freez((void *) p_file_info->chartname); - freez(p_file_info->filename); - freez((void *) p_file_info->file_basename); - freez((void *) p_file_info->stream_guid); - - for(int i = 1; i <= BLOB_MAX_FILES; i++){ - if(p_file_info->blob_handles[i]){ - uv_fs_close(NULL, NULL, p_file_info->blob_handles[i], NULL); - p_file_info->blob_handles[i] = 0; - } - } - - if(p_file_info->circ_buff) - circ_buff_destroy(p_file_info->circ_buff); - - if(p_file_info->parser_metrics){ - switch(p_file_info->log_type){ - case FLB_WEB_LOG: { - if(p_file_info->parser_metrics->web_log) - freez(p_file_info->parser_metrics->web_log); - break; - } - case FLB_KMSG: { - if(p_file_info->parser_metrics->kernel){ - dictionary_destroy(p_file_info->parser_metrics->kernel->subsystem); - dictionary_destroy(p_file_info->parser_metrics->kernel->device); - freez(p_file_info->parser_metrics->kernel); - } - break; - } - case FLB_SYSTEMD: - case FLB_SYSLOG: { - if(p_file_info->parser_metrics->systemd) - freez(p_file_info->parser_metrics->systemd); - break; - } - case FLB_DOCKER_EV: { - if(p_file_info->parser_metrics->docker_ev) - freez(p_file_info->parser_metrics->docker_ev); - break; - } - case FLB_MQTT: { - if(p_file_info->parser_metrics->mqtt){ - dictionary_destroy(p_file_info->parser_metrics->mqtt->topic); - freez(p_file_info->parser_metrics->mqtt); - } - break; - } - default: - break; - } - - for(int i = 0; p_file_info->parser_cus_config && - p_file_info->parser_metrics->parser_cus && - p_file_info->parser_cus_config[i]; i++){ - freez(p_file_info->parser_cus_config[i]->chartname); - freez(p_file_info->parser_cus_config[i]->regex_str); - freez(p_file_info->parser_cus_config[i]->regex_name); - regfree(&p_file_info->parser_cus_config[i]->regex); - freez(p_file_info->parser_cus_config[i]); - freez(p_file_info->parser_metrics->parser_cus[i]); - } - - freez(p_file_info->parser_cus_config); - freez(p_file_info->parser_metrics->parser_cus); - - freez(p_file_info->parser_metrics); - } - - if(p_file_info->parser_config){ - freez(p_file_info->parser_config->gen_config); - freez(p_file_info->parser_config); - } - - Flb_output_config_t *output_next = p_file_info->flb_outputs; - while(output_next){ - Flb_output_config_t *output = output_next; - output_next = output_next->next; - - struct flb_output_config_param *param_next = output->param; - while(param_next){ - struct flb_output_config_param *param = param_next; - param_next = param->next; - freez(param->key); - freez(param->val); - freez(param); - } - freez(output->plugin); - freez(output); - } - - freez(p_file_info->flb_config); - - freez(p_file_info); - - collector_info("[%s]: p_file_info_destroy() cleanup done", chartname); -} - -void p_file_info_destroy_all(void){ - if(p_file_infos_arr){ - uv_thread_t thread_id[p_file_infos_arr->count]; - for(int i = 0; i < p_file_infos_arr->count; i++){ - fatal_assert(0 == uv_thread_create(&thread_id[i], p_file_info_destroy, p_file_infos_arr->data[i])); - } - for(int i = 0; i < p_file_infos_arr->count; i++){ - uv_thread_join(&thread_id[i]); - } - freez(p_file_infos_arr); - p_file_infos_arr = NULL; - } -} - -/** - * @brief Load logs management configuration. - * @returns 0 if success, - * -1 if config file not found - * -2 if p_flb_srvc_config if is NULL (no flb_srvc_config_t provided) - */ -int logs_manag_config_load( flb_srvc_config_t *p_flb_srvc_config, - Flb_socket_config_t **forward_in_config_p, - int g_update_every){ - int rc = LOGS_MANAG_CONFIG_LOAD_ERROR_OK; - char section[100]; - char temp_path[FILENAME_MAX + 1]; - - struct config logsmanagement_d_conf = { - .first_section = NULL, - .last_section = NULL, - .mutex = NETDATA_MUTEX_INITIALIZER, - .index = { - .avl_tree = { - .root = NULL, - .compar = appconfig_section_compare - }, - .rwlock = AVL_LOCK_INITIALIZER - } - }; - - char *filename = strdupz_path_subpath(get_user_config_dir(), "logsmanagement.d.conf"); - if(!appconfig_load(&logsmanagement_d_conf, filename, 0, NULL)) { - collector_info("CONFIG: cannot load user config '%s'. Will try stock config.", filename); - freez(filename); - - filename = strdupz_path_subpath(get_stock_config_dir(), "logsmanagement.d.conf"); - if(!appconfig_load(&logsmanagement_d_conf, filename, 0, NULL)){ - collector_error("CONFIG: cannot load stock config '%s'. Logs management will be disabled.", filename); - rc = LOGS_MANAG_CONFIG_LOAD_ERROR_NO_STOCK_CONFIG; - } - } - freez(filename); - - - /* [global] section */ - - snprintfz(section, 100, "global"); - - g_logs_manag_config.update_every = appconfig_get_number( - &logsmanagement_d_conf, - section, - "update every", - g_logs_manag_config.update_every); - - g_logs_manag_config.update_every = - g_update_every && g_update_every > g_logs_manag_config.update_every ? - g_update_every : g_logs_manag_config.update_every; - - g_logs_manag_config.update_timeout = appconfig_get_number( - &logsmanagement_d_conf, - section, - "update timeout", - UPDATE_TIMEOUT_DEFAULT); - - if(g_logs_manag_config.update_timeout < g_logs_manag_config.update_every) - g_logs_manag_config.update_timeout = g_logs_manag_config.update_every; - - g_logs_manag_config.use_log_timestamp = appconfig_get_boolean_ondemand( - &logsmanagement_d_conf, - section, - "use log timestamp", - g_logs_manag_config.use_log_timestamp); - - g_logs_manag_config.circ_buff_max_size_in_mib = appconfig_get_number( - &logsmanagement_d_conf, - section, - "circular buffer max size MiB", - g_logs_manag_config.circ_buff_max_size_in_mib); - - g_logs_manag_config.circ_buff_drop_logs = appconfig_get_boolean( - &logsmanagement_d_conf, - section, - "circular buffer drop logs if full", - g_logs_manag_config.circ_buff_drop_logs); - - g_logs_manag_config.compression_acceleration = appconfig_get_number( - &logsmanagement_d_conf, - section, - "compression acceleration", - g_logs_manag_config.compression_acceleration); - - g_logs_manag_config.enable_collected_logs_total = appconfig_get_boolean( - &logsmanagement_d_conf, - section, - "collected logs total chart enable", - g_logs_manag_config.enable_collected_logs_total); - - g_logs_manag_config.enable_collected_logs_rate = appconfig_get_boolean( - &logsmanagement_d_conf, - section, - "collected logs rate chart enable", - g_logs_manag_config.enable_collected_logs_rate); - - g_logs_manag_config.do_sd_journal_send = appconfig_get_boolean( - &logsmanagement_d_conf, - section, - "submit logs to system journal", - g_logs_manag_config.do_sd_journal_send); - - g_logs_manag_config.sd_journal_field_prefix = appconfig_get( - &logsmanagement_d_conf, - section, - "systemd journal fields prefix", - g_logs_manag_config.sd_journal_field_prefix); - - if(!rc){ - collector_info("CONFIG: [%s] update every: %d", section, g_logs_manag_config.update_every); - collector_info("CONFIG: [%s] update timeout: %d", section, g_logs_manag_config.update_timeout); - collector_info("CONFIG: [%s] use log timestamp: %d", section, g_logs_manag_config.use_log_timestamp); - collector_info("CONFIG: [%s] circular buffer max size MiB: %d", section, g_logs_manag_config.circ_buff_max_size_in_mib); - collector_info("CONFIG: [%s] circular buffer drop logs if full: %d", section, g_logs_manag_config.circ_buff_drop_logs); - collector_info("CONFIG: [%s] compression acceleration: %d", section, g_logs_manag_config.compression_acceleration); - collector_info("CONFIG: [%s] collected logs total chart enable: %d", section, g_logs_manag_config.enable_collected_logs_total); - collector_info("CONFIG: [%s] collected logs rate chart enable: %d", section, g_logs_manag_config.enable_collected_logs_rate); - collector_info("CONFIG: [%s] submit logs to system journal: %d", section, g_logs_manag_config.do_sd_journal_send); - collector_info("CONFIG: [%s] systemd journal fields prefix: %s", section, g_logs_manag_config.sd_journal_field_prefix); - } - - - /* [db] section */ - - snprintfz(section, 100, "db"); - - const char *const db_mode_str = appconfig_get( - &logsmanagement_d_conf, - section, - "db mode", - GLOBAL_DB_MODE_DEFAULT_STR); - g_logs_manag_config.db_mode = db_mode_str_to_db_mode(db_mode_str); - - snprintfz(temp_path, FILENAME_MAX, "%s" LOGS_MANAG_DB_SUBPATH, get_cache_dir()); - db_set_main_dir(appconfig_get(&logsmanagement_d_conf, section, "db dir", temp_path)); - - g_logs_manag_config.buff_flush_to_db_interval = appconfig_get_number( - &logsmanagement_d_conf, - section, - "circular buffer flush to db", - g_logs_manag_config.buff_flush_to_db_interval); - - g_logs_manag_config.disk_space_limit_in_mib = appconfig_get_number( - &logsmanagement_d_conf, - section, - "disk space limit MiB", - g_logs_manag_config.disk_space_limit_in_mib); - - if(!rc){ - collector_info("CONFIG: [%s] db mode: %s [%d]", section, db_mode_str, (int) g_logs_manag_config.db_mode); - collector_info("CONFIG: [%s] db dir: %s", section, temp_path); - collector_info("CONFIG: [%s] circular buffer flush to db: %d", section, g_logs_manag_config.buff_flush_to_db_interval); - collector_info("CONFIG: [%s] disk space limit MiB: %d", section, g_logs_manag_config.disk_space_limit_in_mib); - } - - - /* [forward input] section */ - - snprintfz(section, 100, "forward input"); - - const int fwd_enable = appconfig_get_boolean( - &logsmanagement_d_conf, - section, - "enabled", - CONFIG_BOOLEAN_NO); - - *forward_in_config_p = (Flb_socket_config_t *) callocz(1, sizeof(Flb_socket_config_t)); - - (*forward_in_config_p)->unix_path = appconfig_get( - &logsmanagement_d_conf, - section, - "unix path", - FLB_FORWARD_UNIX_PATH_DEFAULT); - - (*forward_in_config_p)->unix_perm = appconfig_get( - &logsmanagement_d_conf, - section, - "unix perm", - FLB_FORWARD_UNIX_PERM_DEFAULT); - - // TODO: Check if listen is in valid format - (*forward_in_config_p)->listen = appconfig_get( - &logsmanagement_d_conf, - section, - "listen", - FLB_FORWARD_ADDR_DEFAULT); - - (*forward_in_config_p)->port = appconfig_get( - &logsmanagement_d_conf, - section, - "port", - FLB_FORWARD_PORT_DEFAULT); - - if(!rc){ - collector_info("CONFIG: [%s] enabled: %s", section, fwd_enable ? "yes" : "no"); - collector_info("CONFIG: [%s] unix path: %s", section, (*forward_in_config_p)->unix_path); - collector_info("CONFIG: [%s] unix perm: %s", section, (*forward_in_config_p)->unix_perm); - collector_info("CONFIG: [%s] listen: %s", section, (*forward_in_config_p)->listen); - collector_info("CONFIG: [%s] port: %s", section, (*forward_in_config_p)->port); - } - - if(!fwd_enable) { - freez(*forward_in_config_p); - *forward_in_config_p = NULL; - } - - - /* [fluent bit] section */ - - snprintfz(section, 100, "fluent bit"); - - snprintfz(temp_path, FILENAME_MAX, "%s/%s", get_log_dir(), FLB_LOG_FILENAME_DEFAULT); - - if(p_flb_srvc_config){ - p_flb_srvc_config->flush = appconfig_get( - &logsmanagement_d_conf, - section, - "flush", - p_flb_srvc_config->flush); - - p_flb_srvc_config->http_listen = appconfig_get( - &logsmanagement_d_conf, - section, - "http listen", - p_flb_srvc_config->http_listen); - - p_flb_srvc_config->http_port = appconfig_get( - &logsmanagement_d_conf, - section, - "http port", - p_flb_srvc_config->http_port); - - p_flb_srvc_config->http_server = appconfig_get( - &logsmanagement_d_conf, - section, - "http server", - p_flb_srvc_config->http_server); - - p_flb_srvc_config->log_path = appconfig_get( - &logsmanagement_d_conf, - section, - "log file", - temp_path); - - p_flb_srvc_config->log_level = appconfig_get( - &logsmanagement_d_conf, - section, - "log level", - p_flb_srvc_config->log_level); - - p_flb_srvc_config->coro_stack_size = appconfig_get( - &logsmanagement_d_conf, - section, - "coro stack size", - p_flb_srvc_config->coro_stack_size); - } - else - rc = LOGS_MANAG_CONFIG_LOAD_ERROR_P_FLB_SRVC_NULL; - - if(!rc){ - collector_info("CONFIG: [%s] flush: %s", section, p_flb_srvc_config->flush); - collector_info("CONFIG: [%s] http listen: %s", section, p_flb_srvc_config->http_listen); - collector_info("CONFIG: [%s] http port: %s", section, p_flb_srvc_config->http_port); - collector_info("CONFIG: [%s] http server: %s", section, p_flb_srvc_config->http_server); - collector_info("CONFIG: [%s] log file: %s", section, p_flb_srvc_config->log_path); - collector_info("CONFIG: [%s] log level: %s", section, p_flb_srvc_config->log_level); - collector_info("CONFIG: [%s] coro stack size: %s", section, p_flb_srvc_config->coro_stack_size); - } - - return rc; -} - -static bool metrics_dict_conflict_cb(const DICTIONARY_ITEM *item __maybe_unused, void *old_value, void *new_value, void *data __maybe_unused){ - ((metrics_dict_item_t *)old_value)->num_new += ((metrics_dict_item_t *)new_value)->num_new; - return true; -} - -#define FLB_OUTPUT_PLUGIN_NAME_KEY "name" - -static int flb_output_param_get_cb(void *entry, void *data){ - struct config_option *option = (struct config_option *) entry; - Flb_output_config_t *flb_output = (Flb_output_config_t *) data; - - char *param_prefix = callocz(1, snprintf(NULL, 0, "output %d", MAX_OUTPUTS_PER_SOURCE) + 1); - sprintf(param_prefix, "output %d", flb_output->id); - size_t param_prefix_len = strlen(param_prefix); - - if(!strncasecmp(option->name, param_prefix, param_prefix_len)){ // param->name looks like "output 1 host" - char *param_key = &option->name[param_prefix_len]; // param_key should look like " host" - while(*param_key == ' ') param_key++; // remove whitespace so it looks like "host" - - if(*param_key && strcasecmp(param_key, FLB_OUTPUT_PLUGIN_NAME_KEY)){ // ignore param_key "name" - // debug_log( "config_option: name[%s], value[%s]", option->name, option->value); - // debug_log( "config option kv:[%s][%s]", param_key, option->value); - - struct flb_output_config_param **p = &flb_output->param; - while((*p) != NULL) p = &((*p)->next); // Go to last param of linked list - - (*p) = callocz(1, sizeof(struct flb_output_config_param)); - (*p)->key = strdupz(param_key); - (*p)->val = strdupz(option->value); - } - } - - freez(param_prefix); - - return 0; -} - -/** - * @brief Initialize logs management based on a section configuration. - * @note On error, calls p_file_info_destroy() to clean up before returning. - * @param config_section Section to read configuration from. - * @todo How to handle duplicate entries? - */ -static void config_section_init(uv_loop_t *main_loop, - struct section *config_section, - Flb_socket_config_t *forward_in_config, - flb_srvc_config_t *p_flb_srvc_config, - netdata_mutex_t *stdout_mut){ - - struct File_info *p_file_info = callocz(1, sizeof(struct File_info)); - - /* ------------------------------------------------------------------------- - * Check if config_section->name is valid and if so, use it as chartname. - * ------------------------------------------------------------------------- */ - if(config_section->name && *config_section->name){ - char tmp[LOGS_MANAG_CHARTNAME_SIZE] = {0}; - - snprintfz(tmp, sizeof(tmp), "%s%s", LOGS_MANAG_CHARTNAME_PREFIX, config_section->name); - - netdata_fix_chart_id(tmp); - - for(char *ch = (char *) tmp; *ch; ch++) - *ch = *ch == '.' ? '_' : *ch; // Convert dots to underscores - - p_file_info->chartname = strdupz(tmp); - - collector_info("[%s]: Initializing config loading", p_file_info->chartname); - } else { - collector_error("Invalid logs management config section."); - return p_file_info_destroy(p_file_info); - } - - - /* ------------------------------------------------------------------------- - * Check if this log source is enabled. - * ------------------------------------------------------------------------- */ - if(appconfig_get_boolean(&log_management_config, config_section->name, "enabled", CONFIG_BOOLEAN_NO)){ - collector_info("[%s]: enabled = yes", p_file_info->chartname); - } else { - collector_info("[%s]: enabled = no", p_file_info->chartname); - return p_file_info_destroy(p_file_info); - } - - - /* ------------------------------------------------------------------------- - * Check log type. - * ------------------------------------------------------------------------- */ - char *type = appconfig_get(&log_management_config, config_section->name, "log type", "flb_tail"); - if(!type || !*type) p_file_info->log_type = FLB_TAIL; // Default - else{ - if(!strcasecmp(type, "flb_tail")) p_file_info->log_type = FLB_TAIL; - else if (!strcasecmp(type, "flb_web_log")) p_file_info->log_type = FLB_WEB_LOG; - else if (!strcasecmp(type, "flb_kmsg")) p_file_info->log_type = FLB_KMSG; - else if (!strcasecmp(type, "flb_systemd")) p_file_info->log_type = FLB_SYSTEMD; - else if (!strcasecmp(type, "flb_docker_events")) p_file_info->log_type = FLB_DOCKER_EV; - else if (!strcasecmp(type, "flb_syslog")) p_file_info->log_type = FLB_SYSLOG; - else if (!strcasecmp(type, "flb_serial")) p_file_info->log_type = FLB_SERIAL; - else if (!strcasecmp(type, "flb_mqtt")) p_file_info->log_type = FLB_MQTT; - else p_file_info->log_type = FLB_TAIL; - } - freez(type); - collector_info("[%s]: log type = %s", p_file_info->chartname, log_src_type_t_str[p_file_info->log_type]); - - - /* ------------------------------------------------------------------------- - * Read log source. - * ------------------------------------------------------------------------- */ - char *source = appconfig_get(&log_management_config, config_section->name, "log source", "local"); - if(!source || !*source) p_file_info->log_source = LOG_SOURCE_LOCAL; // Default - else if(!strcasecmp(source, "forward")) p_file_info->log_source = LOG_SOURCE_FORWARD; - else p_file_info->log_source = LOG_SOURCE_LOCAL; - freez(source); - collector_info("[%s]: log source = %s", p_file_info->chartname, log_src_t_str[p_file_info->log_source]); - - if(p_file_info->log_source == LOG_SOURCE_FORWARD && !forward_in_config){ - collector_info("[%s]: forward_in_config == NULL - this log source will be disabled", p_file_info->chartname); - return p_file_info_destroy(p_file_info); - } - - - /* ------------------------------------------------------------------------- - * Read stream uuid. - * ------------------------------------------------------------------------- */ - p_file_info->stream_guid = appconfig_get(&log_management_config, config_section->name, "stream guid", ""); - collector_info("[%s]: stream guid = %s", p_file_info->chartname, p_file_info->stream_guid); - - - /* ------------------------------------------------------------------------- - * Read log path configuration and check if it is valid. - * ------------------------------------------------------------------------- */ - p_file_info->filename = appconfig_get(&log_management_config, config_section->name, "log path", LOG_PATH_AUTO); - if( /* path doesn't matter when log source is not local */ - (p_file_info->log_source == LOG_SOURCE_LOCAL) && - - /* FLB_SYSLOG is special case, may or may not require a path */ - (p_file_info->log_type != FLB_SYSLOG) && - - /* FLB_MQTT is special case, does not require a path */ - (p_file_info->log_type != FLB_MQTT) && - - (!p_file_info->filename /* Sanity check */ || - !*p_file_info->filename || - !strcmp(p_file_info->filename, LOG_PATH_AUTO) || - access(p_file_info->filename, R_OK) - )){ - - freez(p_file_info->filename); - p_file_info->filename = NULL; - - switch(p_file_info->log_type){ - case FLB_TAIL: - if(!strcasecmp(p_file_info->chartname, LOGS_MANAG_CHARTNAME_PREFIX "netdata_daemon_log")){ - char path[FILENAME_MAX + 1]; - snprintfz(path, FILENAME_MAX, "%s/daemon.log", get_log_dir()); - if(access(path, R_OK)) { - collector_error("[%s]: 'Netdata daemon.log' path (%s) invalid, unknown or needs permissions", - p_file_info->chartname, path); - return p_file_info_destroy(p_file_info); - } else p_file_info->filename = strdupz(path); - } else if(!strcasecmp(p_file_info->chartname, LOGS_MANAG_CHARTNAME_PREFIX "fluentbit_log")){ - if(access(p_flb_srvc_config->log_path, R_OK)){ - collector_error("[%s]: Netdata fluentbit.log path (%s) invalid, unknown or needs permissions", - p_file_info->chartname, p_flb_srvc_config->log_path); - return p_file_info_destroy(p_file_info); - } else p_file_info->filename = strdupz(p_flb_srvc_config->log_path); - } else if(!strcasecmp(p_file_info->chartname, LOGS_MANAG_CHARTNAME_PREFIX "auth_log_tail")){ - const char * const auth_path_default[] = { - "/var/log/auth.log", - NULL - }; - int i = 0; - while(auth_path_default[i] && access(auth_path_default[i], R_OK)) i++; - if(!auth_path_default[i]){ - collector_error("[%s]: auth.log path invalid, unknown or needs permissions", p_file_info->chartname); - return p_file_info_destroy(p_file_info); - } else p_file_info->filename = strdupz(auth_path_default[i]); - } else if(!strcasecmp(p_file_info->chartname, "syslog_tail")){ - const char * const syslog_path_default[] = { - "/var/log/syslog", /* Debian, Ubuntu */ - "/var/log/messages", /* RHEL, Red Hat, CentOS, Fedora */ - NULL - }; - int i = 0; - while(syslog_path_default[i] && access(syslog_path_default[i], R_OK)) i++; - if(!syslog_path_default[i]){ - collector_error("[%s]: syslog path invalid, unknown or needs permissions", p_file_info->chartname); - return p_file_info_destroy(p_file_info); - } else p_file_info->filename = strdupz(syslog_path_default[i]); - } - break; - case FLB_WEB_LOG: - if(!strcasecmp(p_file_info->chartname, LOGS_MANAG_CHARTNAME_PREFIX "apache_access_log")){ - const char * const apache_access_path_default[] = { - "/var/log/apache/access.log", - "/var/log/apache2/access.log", - "/var/log/apache2/access_log", - "/var/log/httpd/access_log", - "/var/log/httpd-access.log", - NULL - }; - int i = 0; - while(apache_access_path_default[i] && access(apache_access_path_default[i], R_OK)) i++; - if(!apache_access_path_default[i]){ - collector_error("[%s]: Apache access.log path invalid, unknown or needs permissions", p_file_info->chartname); - return p_file_info_destroy(p_file_info); - } else p_file_info->filename = strdupz(apache_access_path_default[i]); - } else if(!strcasecmp(p_file_info->chartname, LOGS_MANAG_CHARTNAME_PREFIX "nginx_access_log")){ - const char * const nginx_access_path_default[] = { - "/var/log/nginx/access.log", - NULL - }; - int i = 0; - while(nginx_access_path_default[i] && access(nginx_access_path_default[i], R_OK)) i++; - if(!nginx_access_path_default[i]){ - collector_error("[%s]: Nginx access.log path invalid, unknown or needs permissions", p_file_info->chartname); - return p_file_info_destroy(p_file_info); - } else p_file_info->filename = strdupz(nginx_access_path_default[i]); - } - break; - case FLB_KMSG: - if(access(KMSG_DEFAULT_PATH, R_OK)){ - collector_error("[%s]: kmsg default path invalid, unknown or needs permissions", p_file_info->chartname); - return p_file_info_destroy(p_file_info); - } else p_file_info->filename = strdupz(KMSG_DEFAULT_PATH); - break; - case FLB_SYSTEMD: - p_file_info->filename = strdupz(SYSTEMD_DEFAULT_PATH); - break; - case FLB_DOCKER_EV: - if(access(DOCKER_EV_DEFAULT_PATH, R_OK)){ - collector_error("[%s]: Docker socket default Unix path invalid, unknown or needs permissions", p_file_info->chartname); - return p_file_info_destroy(p_file_info); - } else p_file_info->filename = strdupz(DOCKER_EV_DEFAULT_PATH); - break; - default: - collector_error("[%s]: log path invalid or unknown", p_file_info->chartname); - return p_file_info_destroy(p_file_info); - } - } - p_file_info->file_basename = get_basename(p_file_info->filename); - collector_info("[%s]: p_file_info->filename: %s", p_file_info->chartname, - p_file_info->filename ? p_file_info->filename : "NULL"); - collector_info("[%s]: p_file_info->file_basename: %s", p_file_info->chartname, - p_file_info->file_basename ? p_file_info->file_basename : "NULL"); - if(unlikely(!p_file_info->filename)) return p_file_info_destroy(p_file_info); - - - /* ------------------------------------------------------------------------- - * Read "update every" and "update timeout" configuration. - * ------------------------------------------------------------------------- */ - p_file_info->update_every = appconfig_get_number( &log_management_config, config_section->name, - "update every", g_logs_manag_config.update_every); - collector_info("[%s]: update every = %d", p_file_info->chartname, p_file_info->update_every); - - p_file_info->update_timeout = appconfig_get_number( &log_management_config, config_section->name, - "update timeout", g_logs_manag_config.update_timeout); - if(p_file_info->update_timeout < p_file_info->update_every) p_file_info->update_timeout = p_file_info->update_every; - collector_info("[%s]: update timeout = %d", p_file_info->chartname, p_file_info->update_timeout); - - - /* ------------------------------------------------------------------------- - * Read "use log timestamp" configuration. - * ------------------------------------------------------------------------- */ - p_file_info->use_log_timestamp = appconfig_get_boolean_ondemand(&log_management_config, config_section->name, - "use log timestamp", - g_logs_manag_config.use_log_timestamp); - collector_info("[%s]: use log timestamp = %s", p_file_info->chartname, - p_file_info->use_log_timestamp ? "auto or yes" : "no"); - - - /* ------------------------------------------------------------------------- - * Read compression acceleration configuration. - * ------------------------------------------------------------------------- */ - p_file_info->compression_accel = appconfig_get_number( &log_management_config, config_section->name, - "compression acceleration", - g_logs_manag_config.compression_acceleration); - collector_info("[%s]: compression acceleration = %d", p_file_info->chartname, p_file_info->compression_accel); - - - /* ------------------------------------------------------------------------- - * Read DB mode. - * ------------------------------------------------------------------------- */ - const char *const db_mode_str = appconfig_get(&log_management_config, config_section->name, "db mode", NULL); - collector_info("[%s]: db mode = %s", p_file_info->chartname, db_mode_str ? db_mode_str : "NULL"); - p_file_info->db_mode = db_mode_str_to_db_mode(db_mode_str); - freez((void *)db_mode_str); - - - /* ------------------------------------------------------------------------- - * Read save logs from buffers to DB interval configuration. - * ------------------------------------------------------------------------- */ - p_file_info->buff_flush_to_db_interval = appconfig_get_number( &log_management_config, config_section->name, - "circular buffer flush to db", - g_logs_manag_config.buff_flush_to_db_interval); - if(p_file_info->buff_flush_to_db_interval > SAVE_BLOB_TO_DB_MAX) { - p_file_info->buff_flush_to_db_interval = SAVE_BLOB_TO_DB_MAX; - collector_info("[%s]: circular buffer flush to db out of range. Using maximum permitted value: %d", - p_file_info->chartname, p_file_info->buff_flush_to_db_interval); - - } else if(p_file_info->buff_flush_to_db_interval < SAVE_BLOB_TO_DB_MIN) { - p_file_info->buff_flush_to_db_interval = SAVE_BLOB_TO_DB_MIN; - collector_info("[%s]: circular buffer flush to db out of range. Using minimum permitted value: %d", - p_file_info->chartname, p_file_info->buff_flush_to_db_interval); - } - collector_info("[%s]: circular buffer flush to db = %d", p_file_info->chartname, p_file_info->buff_flush_to_db_interval); - - - /* ------------------------------------------------------------------------- - * Read BLOB max size configuration. - * ------------------------------------------------------------------------- */ - p_file_info->blob_max_size = appconfig_get_number( &log_management_config, config_section->name, - "disk space limit MiB", - g_logs_manag_config.disk_space_limit_in_mib) MiB / BLOB_MAX_FILES; - collector_info("[%s]: BLOB max size = %lld", p_file_info->chartname, (long long)p_file_info->blob_max_size); - - - /* ------------------------------------------------------------------------- - * Read configuration about sending logs to system journal. - * ------------------------------------------------------------------------- */ - p_file_info->do_sd_journal_send = appconfig_get_boolean(&log_management_config, config_section->name, - "submit logs to system journal", - g_logs_manag_config.do_sd_journal_send); - - /* ------------------------------------------------------------------------- - * Read collected logs chart configuration. - * ------------------------------------------------------------------------- */ - p_file_info->parser_config = callocz(1, sizeof(Log_parser_config_t)); - - if(appconfig_get_boolean(&log_management_config, config_section->name, - "collected logs total chart enable", - g_logs_manag_config.enable_collected_logs_total)){ - p_file_info->parser_config->chart_config |= CHART_COLLECTED_LOGS_TOTAL; - } - collector_info( "[%s]: collected logs total chart enable = %s", p_file_info->chartname, - (p_file_info->parser_config->chart_config & CHART_COLLECTED_LOGS_TOTAL) ? "yes" : "no"); - - if(appconfig_get_boolean(&log_management_config, config_section->name, - "collected logs rate chart enable", - g_logs_manag_config.enable_collected_logs_rate)){ - p_file_info->parser_config->chart_config |= CHART_COLLECTED_LOGS_RATE; - } - collector_info( "[%s]: collected logs rate chart enable = %s", p_file_info->chartname, - (p_file_info->parser_config->chart_config & CHART_COLLECTED_LOGS_RATE) ? "yes" : "no"); - - - /* ------------------------------------------------------------------------- - * Deal with log-type-specific configuration options. - * ------------------------------------------------------------------------- */ - - if(p_file_info->log_type == FLB_TAIL || p_file_info->log_type == FLB_WEB_LOG){ - Flb_tail_config_t *tail_config = callocz(1, sizeof(Flb_tail_config_t)); - if(appconfig_get_boolean(&log_management_config, config_section->name, "use inotify", CONFIG_BOOLEAN_YES)) - tail_config->use_inotify = 1; - collector_info( "[%s]: use inotify = %s", p_file_info->chartname, tail_config->use_inotify? "yes" : "no"); - - p_file_info->flb_config = tail_config; - } - - if(p_file_info->log_type == FLB_WEB_LOG){ - /* Check if a valid web log format configuration is detected */ - char *log_format = appconfig_get(&log_management_config, config_section->name, "log format", LOG_PATH_AUTO); - const char delimiter = ' '; // TODO!!: TO READ FROM CONFIG - collector_info("[%s]: log format = %s", p_file_info->chartname, log_format ? log_format : "NULL!"); - - /* If "log format = auto" or no "log format" config is detected, - * try log format autodetection based on last log file line. - * TODO 1: Add another case in OR where log_format is compared with a valid reg exp. - * TODO 2: Set default log format and delimiter if not found in config? Or auto-detect? */ - if(!log_format || !*log_format || !strcmp(log_format, LOG_PATH_AUTO)){ - collector_info("[%s]: Attempting auto-detection of log format", p_file_info->chartname); - char *line = read_last_line(p_file_info->filename, 0); - if(!line){ - collector_error("[%s]: read_last_line() returned NULL", p_file_info->chartname); - return p_file_info_destroy(p_file_info); - } - p_file_info->parser_config->gen_config = auto_detect_web_log_parser_config(line, delimiter); - freez(line); - } - else{ - p_file_info->parser_config->gen_config = read_web_log_parser_config(log_format, delimiter); - collector_info( "[%s]: Read web log parser config: %s", p_file_info->chartname, - p_file_info->parser_config->gen_config ? "success!" : "failed!"); - } - freez(log_format); - - if(!p_file_info->parser_config->gen_config){ - collector_error("[%s]: No valid web log parser config found", p_file_info->chartname); - return p_file_info_destroy(p_file_info); - } - - /* Check whether metrics verification during parsing is required */ - Web_log_parser_config_t *wblp_config = (Web_log_parser_config_t *) p_file_info->parser_config->gen_config; - wblp_config->verify_parsed_logs = appconfig_get_boolean( &log_management_config, config_section->name, - "verify parsed logs", CONFIG_BOOLEAN_NO); - collector_info("[%s]: verify parsed logs = %d", p_file_info->chartname, wblp_config->verify_parsed_logs); - - wblp_config->skip_timestamp_parsing = p_file_info->use_log_timestamp ? 0 : 1; - collector_info("[%s]: skip_timestamp_parsing = %d", p_file_info->chartname, wblp_config->skip_timestamp_parsing); - - for(int j = 0; j < wblp_config->num_fields; j++){ - if((wblp_config->fields[j] == VHOST_WITH_PORT || wblp_config->fields[j] == VHOST) - && appconfig_get_boolean(&log_management_config, config_section->name, "vhosts chart", CONFIG_BOOLEAN_NO)){ - p_file_info->parser_config->chart_config |= CHART_VHOST; - } - if((wblp_config->fields[j] == VHOST_WITH_PORT || wblp_config->fields[j] == PORT) - && appconfig_get_boolean(&log_management_config, config_section->name, "ports chart", CONFIG_BOOLEAN_NO)){ - p_file_info->parser_config->chart_config |= CHART_PORT; - } - if((wblp_config->fields[j] == REQ_CLIENT) - && appconfig_get_boolean(&log_management_config, config_section->name, "IP versions chart", CONFIG_BOOLEAN_NO)){ - p_file_info->parser_config->chart_config |= CHART_IP_VERSION; - } - if((wblp_config->fields[j] == REQ_CLIENT) - && appconfig_get_boolean(&log_management_config, config_section->name, "unique client IPs - current poll chart", CONFIG_BOOLEAN_NO)){ - p_file_info->parser_config->chart_config |= CHART_REQ_CLIENT_CURRENT; - } - if((wblp_config->fields[j] == REQ_CLIENT) - && appconfig_get_boolean(&log_management_config, config_section->name, "unique client IPs - all-time chart", CONFIG_BOOLEAN_NO)){ - p_file_info->parser_config->chart_config |= CHART_REQ_CLIENT_ALL_TIME; - } - if((wblp_config->fields[j] == REQ || wblp_config->fields[j] == REQ_METHOD) - && appconfig_get_boolean(&log_management_config, config_section->name, "http request methods chart", CONFIG_BOOLEAN_NO)){ - p_file_info->parser_config->chart_config |= CHART_REQ_METHODS; - } - if((wblp_config->fields[j] == REQ || wblp_config->fields[j] == REQ_PROTO) - && appconfig_get_boolean(&log_management_config, config_section->name, "http protocol versions chart", CONFIG_BOOLEAN_NO)){ - p_file_info->parser_config->chart_config |= CHART_REQ_PROTO; - } - if((wblp_config->fields[j] == REQ_SIZE || wblp_config->fields[j] == RESP_SIZE) - && appconfig_get_boolean(&log_management_config, config_section->name, "bandwidth chart", CONFIG_BOOLEAN_NO)){ - p_file_info->parser_config->chart_config |= CHART_BANDWIDTH; - } - if((wblp_config->fields[j] == REQ_PROC_TIME) - && appconfig_get_boolean(&log_management_config, config_section->name, "timings chart", CONFIG_BOOLEAN_NO)){ - p_file_info->parser_config->chart_config |= CHART_REQ_PROC_TIME; - } - if((wblp_config->fields[j] == RESP_CODE) - && appconfig_get_boolean(&log_management_config, config_section->name, "response code families chart", CONFIG_BOOLEAN_NO)){ - p_file_info->parser_config->chart_config |= CHART_RESP_CODE_FAMILY; - } - if((wblp_config->fields[j] == RESP_CODE) - && appconfig_get_boolean(&log_management_config, config_section->name, "response codes chart", CONFIG_BOOLEAN_NO)){ - p_file_info->parser_config->chart_config |= CHART_RESP_CODE; - } - if((wblp_config->fields[j] == RESP_CODE) - && appconfig_get_boolean(&log_management_config, config_section->name, "response code types chart", CONFIG_BOOLEAN_NO)){ - p_file_info->parser_config->chart_config |= CHART_RESP_CODE_TYPE; - } - if((wblp_config->fields[j] == SSL_PROTO) - && appconfig_get_boolean(&log_management_config, config_section->name, "SSL protocols chart", CONFIG_BOOLEAN_NO)){ - p_file_info->parser_config->chart_config |= CHART_SSL_PROTO; - } - if((wblp_config->fields[j] == SSL_CIPHER_SUITE) - && appconfig_get_boolean(&log_management_config, config_section->name, "SSL chipher suites chart", CONFIG_BOOLEAN_NO)){ - p_file_info->parser_config->chart_config |= CHART_SSL_CIPHER; - } - } - } - else if(p_file_info->log_type == FLB_KMSG){ - Flb_kmsg_config_t *kmsg_config = callocz(1, sizeof(Flb_kmsg_config_t)); - - kmsg_config->prio_level = appconfig_get(&log_management_config, config_section->name, "prio level", "8"); - - p_file_info->flb_config = kmsg_config; - - if(appconfig_get_boolean(&log_management_config, config_section->name, "severity chart", CONFIG_BOOLEAN_NO)) { - p_file_info->parser_config->chart_config |= CHART_SYSLOG_SEVER; - } - if(appconfig_get_boolean(&log_management_config, config_section->name, "subsystem chart", CONFIG_BOOLEAN_NO)) { - p_file_info->parser_config->chart_config |= CHART_KMSG_SUBSYSTEM; - } - if(appconfig_get_boolean(&log_management_config, config_section->name, "device chart", CONFIG_BOOLEAN_NO)) { - p_file_info->parser_config->chart_config |= CHART_KMSG_DEVICE; - } - } - else if(p_file_info->log_type == FLB_SYSTEMD || p_file_info->log_type == FLB_SYSLOG){ - if(p_file_info->log_type == FLB_SYSLOG){ - Syslog_parser_config_t *syslog_config = callocz(1, sizeof(Syslog_parser_config_t)); - - /* Read syslog format */ - syslog_config->log_format = appconfig_get( &log_management_config, - config_section->name, - "log format", NULL); - collector_info("[%s]: log format = %s", p_file_info->chartname, - syslog_config->log_format ? syslog_config->log_format : "NULL!"); - if(!syslog_config->log_format || !*syslog_config->log_format || !strcasecmp(syslog_config->log_format, "auto")){ - freez(syslog_config->log_format); - freez(syslog_config); - return p_file_info_destroy(p_file_info); - } - - syslog_config->socket_config = callocz(1, sizeof(Flb_socket_config_t)); - - /* Read syslog socket mode - * see also https://docs.fluentbit.io/manual/pipeline/inputs/syslog#configuration-parameters */ - syslog_config->socket_config->mode = appconfig_get( &log_management_config, - config_section->name, - "mode", "unix_udp"); - collector_info("[%s]: mode = %s", p_file_info->chartname, syslog_config->socket_config->mode); - - /* Check for valid socket path if (mode == unix_udp) or - * (mode == unix_tcp), else read syslog network interface to bind, - * if (mode == udp) or (mode == tcp). */ - if( !strcasecmp(syslog_config->socket_config->mode, "unix_udp") || - !strcasecmp(syslog_config->socket_config->mode, "unix_tcp")){ - if(!p_file_info->filename || !*p_file_info->filename || !strcasecmp(p_file_info->filename, LOG_PATH_AUTO)){ - // freez(syslog_config->socket_config->mode); - freez(syslog_config->socket_config); - freez(syslog_config->log_format); - freez(syslog_config); - return p_file_info_destroy(p_file_info); - } - syslog_config->socket_config->unix_perm = appconfig_get(&log_management_config, - config_section->name, - "unix_perm", "0644"); - collector_info("[%s]: unix_perm = %s", p_file_info->chartname, syslog_config->socket_config->unix_perm); - } else if( !strcasecmp(syslog_config->socket_config->mode, "udp") || - !strcasecmp(syslog_config->socket_config->mode, "tcp")){ - // TODO: Check if listen is in valid format - syslog_config->socket_config->listen = appconfig_get( &log_management_config, - config_section->name, - "listen", "0.0.0.0"); - collector_info("[%s]: listen = %s", p_file_info->chartname, syslog_config->socket_config->listen); - syslog_config->socket_config->port = appconfig_get( &log_management_config, - config_section->name, - "port", "5140"); - collector_info("[%s]: port = %s", p_file_info->chartname, syslog_config->socket_config->port); - } else { - /* Any other modes are invalid */ - // freez(syslog_config->socket_config->mode); - freez(syslog_config->socket_config); - freez(syslog_config->log_format); - freez(syslog_config); - return p_file_info_destroy(p_file_info); - } - - p_file_info->parser_config->gen_config = syslog_config; - } - if(appconfig_get_boolean(&log_management_config, config_section->name, "priority value chart", CONFIG_BOOLEAN_NO)) { - p_file_info->parser_config->chart_config |= CHART_SYSLOG_PRIOR; - } - if(appconfig_get_boolean(&log_management_config, config_section->name, "severity chart", CONFIG_BOOLEAN_NO)) { - p_file_info->parser_config->chart_config |= CHART_SYSLOG_SEVER; - } - if(appconfig_get_boolean(&log_management_config, config_section->name, "facility chart", CONFIG_BOOLEAN_NO)) { - p_file_info->parser_config->chart_config |= CHART_SYSLOG_FACIL; - } - } - else if(p_file_info->log_type == FLB_DOCKER_EV){ - if(appconfig_get_boolean(&log_management_config, config_section->name, "event type chart", CONFIG_BOOLEAN_NO)) { - p_file_info->parser_config->chart_config |= CHART_DOCKER_EV_TYPE; - } - if(appconfig_get_boolean(&log_management_config, config_section->name, "event action chart", CONFIG_BOOLEAN_NO)) { - p_file_info->parser_config->chart_config |= CHART_DOCKER_EV_ACTION; - } - } - else if(p_file_info->log_type == FLB_SERIAL){ - Flb_serial_config_t *serial_config = callocz(1, sizeof(Flb_serial_config_t)); - - serial_config->bitrate = appconfig_get(&log_management_config, config_section->name, "bitrate", "115200"); - serial_config->min_bytes = appconfig_get(&log_management_config, config_section->name, "min bytes", "1"); - serial_config->separator = appconfig_get(&log_management_config, config_section->name, "separator", ""); - serial_config->format = appconfig_get(&log_management_config, config_section->name, "format", ""); - - p_file_info->flb_config = serial_config; - } - else if(p_file_info->log_type == FLB_MQTT){ - Flb_socket_config_t *socket_config = callocz(1, sizeof(Flb_socket_config_t)); - - socket_config->listen = appconfig_get(&log_management_config, config_section->name, "listen", "0.0.0.0"); - socket_config->port = appconfig_get(&log_management_config, config_section->name, "port", "1883"); - - p_file_info->flb_config = socket_config; - - if(appconfig_get_boolean(&log_management_config, config_section->name, "topic chart", CONFIG_BOOLEAN_NO)) { - p_file_info->parser_config->chart_config |= CHART_MQTT_TOPIC; - } - } - - - /* ------------------------------------------------------------------------- - * Allocate p_file_info->parser_metrics memory. - * ------------------------------------------------------------------------- */ - p_file_info->parser_metrics = callocz(1, sizeof(Log_parser_metrics_t)); - switch(p_file_info->log_type){ - case FLB_WEB_LOG:{ - p_file_info->parser_metrics->web_log = callocz(1, sizeof(Web_log_metrics_t)); - break; - } - case FLB_KMSG: { - p_file_info->parser_metrics->kernel = callocz(1, sizeof(Kernel_metrics_t)); - p_file_info->parser_metrics->kernel->subsystem = dictionary_create( DICT_OPTION_SINGLE_THREADED | - DICT_OPTION_NAME_LINK_DONT_CLONE | - DICT_OPTION_DONT_OVERWRITE_VALUE); - dictionary_register_conflict_callback(p_file_info->parser_metrics->kernel->subsystem, metrics_dict_conflict_cb, NULL); - p_file_info->parser_metrics->kernel->device = dictionary_create(DICT_OPTION_SINGLE_THREADED | - DICT_OPTION_NAME_LINK_DONT_CLONE | - DICT_OPTION_DONT_OVERWRITE_VALUE); - dictionary_register_conflict_callback(p_file_info->parser_metrics->kernel->device, metrics_dict_conflict_cb, NULL); - break; - } - case FLB_SYSTEMD: - case FLB_SYSLOG: { - p_file_info->parser_metrics->systemd = callocz(1, sizeof(Systemd_metrics_t)); - break; - } - case FLB_DOCKER_EV: { - p_file_info->parser_metrics->docker_ev = callocz(1, sizeof(Docker_ev_metrics_t)); - break; - } - case FLB_MQTT: { - p_file_info->parser_metrics->mqtt = callocz(1, sizeof(Mqtt_metrics_t)); - p_file_info->parser_metrics->mqtt->topic = dictionary_create( DICT_OPTION_SINGLE_THREADED | - DICT_OPTION_NAME_LINK_DONT_CLONE | - DICT_OPTION_DONT_OVERWRITE_VALUE); - dictionary_register_conflict_callback(p_file_info->parser_metrics->mqtt->topic, metrics_dict_conflict_cb, NULL); - break; - } - default: - break; - } - - - /* ------------------------------------------------------------------------- - * Configure (optional) custom charts. - * ------------------------------------------------------------------------- */ - p_file_info->parser_cus_config = callocz(1, sizeof(Log_parser_cus_config_t *)); - p_file_info->parser_metrics->parser_cus = callocz(1, sizeof(Log_parser_cus_metrics_t *)); - for(int cus_off = 1; cus_off <= MAX_CUS_CHARTS_PER_SOURCE; cus_off++){ - - /* Read chart name config */ - char *cus_chart_k = mallocz(snprintf(NULL, 0, "custom %d chart", MAX_CUS_CHARTS_PER_SOURCE) + 1); - sprintf(cus_chart_k, "custom %d chart", cus_off); - char *cus_chart_v = appconfig_get(&log_management_config, config_section->name, cus_chart_k, NULL); - debug_log( "cus chart: (%s:%s)", cus_chart_k, cus_chart_v ? cus_chart_v : "NULL"); - freez(cus_chart_k); - if(unlikely(!cus_chart_v)){ - collector_error("[%s]: custom %d chart = NULL, custom charts for this log source will be disabled.", - p_file_info->chartname, cus_off); - break; - } - netdata_fix_chart_id(cus_chart_v); - - /* Read regex config */ - char *cus_regex_k = mallocz(snprintf(NULL, 0, "custom %d regex", MAX_CUS_CHARTS_PER_SOURCE) + 1); - sprintf(cus_regex_k, "custom %d regex", cus_off); - char *cus_regex_v = appconfig_get(&log_management_config, config_section->name, cus_regex_k, NULL); - debug_log( "cus regex: (%s:%s)", cus_regex_k, cus_regex_v ? cus_regex_v : "NULL"); - freez(cus_regex_k); - if(unlikely(!cus_regex_v)) { - collector_error("[%s]: custom %d regex = NULL, custom charts for this log source will be disabled.", - p_file_info->chartname, cus_off); - freez(cus_chart_v); - break; - } - - /* Read regex name config */ - char *cus_regex_name_k = mallocz(snprintf(NULL, 0, "custom %d regex name", MAX_CUS_CHARTS_PER_SOURCE) + 1); - sprintf(cus_regex_name_k, "custom %d regex name", cus_off); - char *cus_regex_name_v = appconfig_get( &log_management_config, config_section->name, - cus_regex_name_k, cus_regex_v); - debug_log( "cus regex name: (%s:%s)", cus_regex_name_k, cus_regex_name_v ? cus_regex_name_v : "NULL"); - freez(cus_regex_name_k); - m_assert(cus_regex_name_v, "cus_regex_name_v cannot be NULL, should be cus_regex_v"); - - - /* Escape any backslashes in the regex name, to ensure dimension is displayed correctly in charts */ - int regex_name_bslashes = 0; - char **p_regex_name = &cus_regex_name_v; - for(char *p = *p_regex_name; *p; p++) if(unlikely(*p == '\\')) regex_name_bslashes++; - if(regex_name_bslashes) { - *p_regex_name = reallocz(*p_regex_name, strlen(*p_regex_name) + 1 + regex_name_bslashes); - for(char *p = *p_regex_name; *p; p++){ - if(unlikely(*p == '\\')){ - memmove(p + 1, p, strlen(p) + 1); - *p++ = '\\'; - } - } - } - - /* Read ignore case config */ - char *cus_ignore_case_k = mallocz(snprintf(NULL, 0, "custom %d ignore case", MAX_CUS_CHARTS_PER_SOURCE) + 1); - sprintf(cus_ignore_case_k, "custom %d ignore case", cus_off); - int cus_ignore_case_v = appconfig_get_boolean( &log_management_config, - config_section->name, cus_ignore_case_k, CONFIG_BOOLEAN_YES); - debug_log( "cus case: (%s:%s)", cus_ignore_case_k, cus_ignore_case_v ? "yes" : "no"); - freez(cus_ignore_case_k); - - int regex_flags = cus_ignore_case_v ? REG_EXTENDED | REG_NEWLINE | REG_ICASE : REG_EXTENDED | REG_NEWLINE; - - int rc; - regex_t regex; - if (unlikely((rc = regcomp(®ex, cus_regex_v, regex_flags)))){ - size_t regcomp_err_str_size = regerror(rc, ®ex, 0, 0); - char *regcomp_err_str = mallocz(regcomp_err_str_size); - regerror(rc, ®ex, regcomp_err_str, regcomp_err_str_size); - collector_error("[%s]: could not compile regex for custom %d chart: %s due to error: %s. " - "Custom charts for this log source will be disabled.", - p_file_info->chartname, cus_off, cus_chart_v, regcomp_err_str); - freez(regcomp_err_str); - freez(cus_chart_v); - freez(cus_regex_v); - freez(cus_regex_name_v); - break; - }; - - /* Allocate memory and copy config to p_file_info->parser_cus_config struct */ - p_file_info->parser_cus_config = reallocz( p_file_info->parser_cus_config, - (cus_off + 1) * sizeof(Log_parser_cus_config_t *)); - p_file_info->parser_cus_config[cus_off - 1] = callocz(1, sizeof(Log_parser_cus_config_t)); - - p_file_info->parser_cus_config[cus_off - 1]->chartname = cus_chart_v; - p_file_info->parser_cus_config[cus_off - 1]->regex_str = cus_regex_v; - p_file_info->parser_cus_config[cus_off - 1]->regex_name = cus_regex_name_v; - p_file_info->parser_cus_config[cus_off - 1]->regex = regex; - - /* Initialise custom log parser metrics struct array */ - p_file_info->parser_metrics->parser_cus = reallocz( p_file_info->parser_metrics->parser_cus, - (cus_off + 1) * sizeof(Log_parser_cus_metrics_t *)); - p_file_info->parser_metrics->parser_cus[cus_off - 1] = callocz(1, sizeof(Log_parser_cus_metrics_t)); - - - p_file_info->parser_cus_config[cus_off] = NULL; - p_file_info->parser_metrics->parser_cus[cus_off] = NULL; - } - - - /* ------------------------------------------------------------------------- - * Configure (optional) Fluent Bit outputs. - * ------------------------------------------------------------------------- */ - - Flb_output_config_t **output_next_p = &p_file_info->flb_outputs; - for(int out_off = 1; out_off <= MAX_OUTPUTS_PER_SOURCE; out_off++){ - - /* Read output plugin */ - char *out_plugin_k = callocz(1, snprintf(NULL, 0, "output %d " FLB_OUTPUT_PLUGIN_NAME_KEY, MAX_OUTPUTS_PER_SOURCE) + 1); - sprintf(out_plugin_k, "output %d " FLB_OUTPUT_PLUGIN_NAME_KEY, out_off); - char *out_plugin_v = appconfig_get(&log_management_config, config_section->name, out_plugin_k, NULL); - debug_log( "output %d "FLB_OUTPUT_PLUGIN_NAME_KEY": %s", out_off, out_plugin_v ? out_plugin_v : "NULL"); - freez(out_plugin_k); - if(unlikely(!out_plugin_v)){ - collector_error("[%s]: output %d "FLB_OUTPUT_PLUGIN_NAME_KEY" = NULL, outputs for this log source will be disabled.", - p_file_info->chartname, out_off); - break; - } - - Flb_output_config_t *output = callocz(1, sizeof(Flb_output_config_t)); - output->id = out_off; - output->plugin = out_plugin_v; - - /* Read parameters for this output */ - avl_traverse_lock(&config_section->values_index, flb_output_param_get_cb, output); - - *output_next_p = output; - output_next_p = &output->next; - } - - - /* ------------------------------------------------------------------------- - * Read circular buffer configuration and initialize the buffer. - * ------------------------------------------------------------------------- */ - size_t circular_buffer_max_size = ((size_t)appconfig_get_number(&log_management_config, - config_section->name, - "circular buffer max size MiB", - g_logs_manag_config.circ_buff_max_size_in_mib)) MiB; - if(circular_buffer_max_size > CIRCULAR_BUFF_MAX_SIZE_RANGE_MAX) { - circular_buffer_max_size = CIRCULAR_BUFF_MAX_SIZE_RANGE_MAX; - collector_info( "[%s]: circular buffer max size out of range. Using maximum permitted value (MiB): %zu", - p_file_info->chartname, (size_t) (circular_buffer_max_size / (1 MiB))); - } else if(circular_buffer_max_size < CIRCULAR_BUFF_MAX_SIZE_RANGE_MIN) { - circular_buffer_max_size = CIRCULAR_BUFF_MAX_SIZE_RANGE_MIN; - collector_info( "[%s]: circular buffer max size out of range. Using minimum permitted value (MiB): %zu", - p_file_info->chartname, (size_t) (circular_buffer_max_size / (1 MiB))); - } - collector_info("[%s]: circular buffer max size MiB = %zu", p_file_info->chartname, (size_t) (circular_buffer_max_size / (1 MiB))); - - int circular_buffer_allow_dropped_logs = appconfig_get_boolean( &log_management_config, - config_section->name, - "circular buffer drop logs if full", - g_logs_manag_config.circ_buff_drop_logs); - collector_info("[%s]: circular buffer drop logs if full = %s", p_file_info->chartname, - circular_buffer_allow_dropped_logs ? "yes" : "no"); - - p_file_info->circ_buff = circ_buff_init(p_file_info->buff_flush_to_db_interval, - circular_buffer_max_size, - circular_buffer_allow_dropped_logs); - - - /* ------------------------------------------------------------------------- - * Initialize rrd related structures. - * ------------------------------------------------------------------------- */ - p_file_info->chart_meta = callocz(1, sizeof(struct Chart_meta)); - memcpy(p_file_info->chart_meta, &chart_types[p_file_info->log_type], sizeof(struct Chart_meta)); - p_file_info->chart_meta->base_prio = NETDATA_CHART_PRIO_LOGS_BASE + p_file_infos_arr->count * NETDATA_CHART_PRIO_LOGS_INCR; - netdata_mutex_lock(stdout_mut); - p_file_info->chart_meta->init(p_file_info); - fflush(stdout); - netdata_mutex_unlock(stdout_mut); - - /* ------------------------------------------------------------------------- - * Initialize input plugin for local log sources. - * ------------------------------------------------------------------------- */ - if(p_file_info->log_source == LOG_SOURCE_LOCAL){ - int rc = flb_add_input(p_file_info); - if(unlikely(rc)){ - collector_error("[%s]: flb_add_input() error: %d", p_file_info->chartname, rc); - return p_file_info_destroy(p_file_info); - } - } - - /* flb_complete_item_timer_timeout_cb() is needed for both local and - * non-local sources. */ - p_file_info->flb_tmp_buff_cpy_timer.data = p_file_info; - if(unlikely(0 != uv_mutex_init(&p_file_info->flb_tmp_buff_mut))) - fatal("uv_mutex_init(&p_file_info->flb_tmp_buff_mut) failed"); - - fatal_assert(0 == uv_timer_init( main_loop, - &p_file_info->flb_tmp_buff_cpy_timer)); - - fatal_assert(0 == uv_timer_start( &p_file_info->flb_tmp_buff_cpy_timer, - flb_complete_item_timer_timeout_cb, 0, - p_file_info->update_timeout * MSEC_PER_SEC)); - - - /* ------------------------------------------------------------------------- - * All set up successfully - add p_file_info to list of all p_file_info structs. - * ------------------------------------------------------------------------- */ - p_file_infos_arr->data = reallocz(p_file_infos_arr->data, (++p_file_infos_arr->count) * (sizeof p_file_info)); - p_file_infos_arr->data[p_file_infos_arr->count - 1] = p_file_info; - - __atomic_store_n(&p_file_info->state, LOG_SRC_READY, __ATOMIC_RELAXED); - - collector_info("[%s]: initialization completed", p_file_info->chartname); -} - -void config_file_load( uv_loop_t *main_loop, - Flb_socket_config_t *p_forward_in_config, - flb_srvc_config_t *p_flb_srvc_config, - netdata_mutex_t *stdout_mut){ - - int user_default_conf_found = 0; - - struct section *config_section; - - char tmp_name[FILENAME_MAX + 1]; - snprintfz(tmp_name, FILENAME_MAX, "%s/logsmanagement.d", get_user_config_dir()); - DIR *dir = opendir(tmp_name); - - if(dir){ - struct dirent *de = NULL; - while ((de = readdir(dir))) { - size_t d_name_len = strlen(de->d_name); - if (de->d_type == DT_DIR || d_name_len < 6 || strncmp(&de->d_name[d_name_len - 5], ".conf", sizeof(".conf"))) - continue; - - if(!user_default_conf_found && !strncmp(de->d_name, "default.conf", sizeof("default.conf"))) - user_default_conf_found = 1; - - snprintfz(tmp_name, FILENAME_MAX, "%s/logsmanagement.d/%s", get_user_config_dir(), de->d_name); - collector_info("loading config:%s", tmp_name); - log_management_config = (struct config){ - .first_section = NULL, - .last_section = NULL, - .mutex = NETDATA_MUTEX_INITIALIZER, - .index = { - .avl_tree = { - .root = NULL, - .compar = appconfig_section_compare - }, - .rwlock = AVL_LOCK_INITIALIZER - } - }; - if(!appconfig_load(&log_management_config, tmp_name, 0, NULL)) - continue; - - config_section = log_management_config.first_section; - do { - config_section_init(main_loop, config_section, p_forward_in_config, p_flb_srvc_config, stdout_mut); - config_section = config_section->next; - } while(config_section); - - } - closedir(dir); - } - - if(!user_default_conf_found){ - collector_info("CONFIG: cannot load user config '%s/logsmanagement.d/default.conf'. Will try stock config.", get_user_config_dir()); - snprintfz(tmp_name, FILENAME_MAX, "%s/logsmanagement.d/default.conf", get_stock_config_dir()); - if(!appconfig_load(&log_management_config, tmp_name, 0, NULL)){ - collector_error("CONFIG: cannot load stock config '%s/logsmanagement.d/default.conf'. Logs management will be disabled.", get_stock_config_dir()); - exit(1); - } - - config_section = log_management_config.first_section; - do { - config_section_init(main_loop, config_section, p_forward_in_config, p_flb_srvc_config, stdout_mut); - config_section = config_section->next; - } while(config_section); - } -} diff --git a/src/logsmanagement/logsmanag_config.h b/src/logsmanagement/logsmanag_config.h deleted file mode 100644 index 346939221..000000000 --- a/src/logsmanagement/logsmanag_config.h +++ /dev/null @@ -1,31 +0,0 @@ -// SPDX-License-Identifier: GPL-3.0-or-later - -/** @file logsmanag_config.h - * @brief Header of logsmanag_config.c - */ - -#include "file_info.h" -#include "flb_plugin.h" - -char *get_user_config_dir(void); - -char *get_stock_config_dir(void); - -char *get_log_dir(void); - -char *get_cache_dir(void); - -void p_file_info_destroy_all(void); - -#define LOGS_MANAG_CONFIG_LOAD_ERROR_OK 0 -#define LOGS_MANAG_CONFIG_LOAD_ERROR_NO_STOCK_CONFIG -1 -#define LOGS_MANAG_CONFIG_LOAD_ERROR_P_FLB_SRVC_NULL -2 - -int logs_manag_config_load( flb_srvc_config_t *p_flb_srvc_config, - Flb_socket_config_t **forward_in_config_p, - int g_update_every); - -void config_file_load( uv_loop_t *main_loop, - Flb_socket_config_t *p_forward_in_config, - flb_srvc_config_t *p_flb_srvc_config, - netdata_mutex_t *stdout_mut);
\ No newline at end of file diff --git a/src/logsmanagement/logsmanagement.c b/src/logsmanagement/logsmanagement.c deleted file mode 100644 index a7817097a..000000000 --- a/src/logsmanagement/logsmanagement.c +++ /dev/null @@ -1,252 +0,0 @@ -// SPDX-License-Identifier: GPL-3.0-or-later - -/** @file logsmanagement.c - * @brief This is the main file of the Netdata logs management project - * - * The aim of the project is to add the capability to collect, parse and - * query logs in the Netdata agent. For more information please refer - * to the project's [README](README.md) file. - */ - -#include <uv.h> -#include "daemon/common.h" -#include "db_api.h" -#include "file_info.h" -#include "flb_plugin.h" -#include "functions.h" -#include "helper.h" -#include "libnetdata/required_dummies.h" -#include "logsmanag_config.h" -#include "rrd_api/rrd_api_stats.h" - -#if defined(ENABLE_LOGSMANAGEMENT_TESTS) -#include "logsmanagement/unit_test/unit_test.h" -#endif - -netdata_mutex_t stdout_mut = NETDATA_MUTEX_INITIALIZER; - -bool logsmanagement_should_exit = false; - -struct File_infos_arr *p_file_infos_arr = NULL; - -static uv_loop_t *main_loop; - -static struct { - uv_signal_t sig; - const int signum; -} signals[] = { - // Add here signals that will terminate the plugin - {.signum = SIGINT}, - {.signum = SIGQUIT}, - {.signum = SIGPIPE}, - {.signum = SIGTERM} -}; - -static void signal_handler(uv_signal_t *handle, int signum __maybe_unused) { - UNUSED(handle); - - debug_log("Signal received: %d\n", signum); - - __atomic_store_n(&logsmanagement_should_exit, true, __ATOMIC_RELAXED); - -} - -static void on_walk_cleanup(uv_handle_t* handle, void* data){ - UNUSED(data); - if (!uv_is_closing(handle)) - uv_close(handle, NULL); -} - -/** - * @brief The main function of the logs management plugin. - * @details Any static asserts are most likely going to be inluded here. After - * any initialisation routines, the default uv_loop_t is executed indefinitely. - */ -int main(int argc, char **argv) { - - /* Static asserts */ - #pragma GCC diagnostic push - #pragma GCC diagnostic ignored "-Wunused-local-typedefs" - COMPILE_TIME_ASSERT(SAVE_BLOB_TO_DB_MIN <= SAVE_BLOB_TO_DB_MAX); - COMPILE_TIME_ASSERT(CIRCULAR_BUFF_DEFAULT_MAX_SIZE >= CIRCULAR_BUFF_MAX_SIZE_RANGE_MIN); - COMPILE_TIME_ASSERT(CIRCULAR_BUFF_DEFAULT_MAX_SIZE <= CIRCULAR_BUFF_MAX_SIZE_RANGE_MAX); - #pragma GCC diagnostic pop - - clocks_init(); - - program_name = LOGS_MANAGEMENT_PLUGIN_STR; - - nd_log_initialize_for_external_plugins(program_name); - - // netdata_configured_host_prefix = getenv("NETDATA_HOST_PREFIX"); - // if(verify_netdata_host_prefix(true) == -1) exit(1); - - int g_update_every = 0; - for(int i = 1; i < argc ; i++) { - if(isdigit(*argv[i]) && !g_update_every && str2i(argv[i]) > 0 && str2i(argv[i]) < 86400) { - g_update_every = str2i(argv[i]); - debug_log("new update_every received: %d", g_update_every); - } - else if(!strcmp("--unittest", argv[i])) { -#if defined(ENABLE_LOGSMANAGEMENT_TESTS) - exit(logs_management_unittest()); -#else - collector_error("%s was not built with unit test support.", program_name); -#endif - } - else if(!strcmp("version", argv[i]) || - !strcmp("-version", argv[i]) || - !strcmp("--version", argv[i]) || - !strcmp("-v", argv[i]) || - !strcmp("-V", argv[i])) { - printf(NETDATA_VERSION"\n"); - exit(0); - } - else if(!strcmp("-h", argv[i]) || - !strcmp("--help", argv[i])) { - fprintf(stderr, - "\n" - " netdata %s %s\n" - " Copyright (C) 2023 Netdata Inc.\n" - " Released under GNU General Public License v3 or later.\n" - " All rights reserved.\n" - "\n" - " This program is the logs management plugin for netdata.\n" - "\n" - " Available command line options:\n" - "\n" - " --unittest run unit tests and exit\n" - "\n" - " -v\n" - " -V\n" - " --version print version and exit\n" - "\n" - " -h\n" - " --help print this message and exit\n" - "\n" - " For more information:\n" - " https://github.com/netdata/netdata/tree/master/src/collectors/logs-management.plugin\n" - "\n", - program_name, - NETDATA_VERSION - ); - exit(1); - } - else - collector_error("%s(): ignoring parameter '%s'", __FUNCTION__, argv[i]); - } - - Flb_socket_config_t *p_forward_in_config = NULL; - - main_loop = mallocz(sizeof(uv_loop_t)); - fatal_assert(uv_loop_init(main_loop) == 0); - - flb_srvc_config_t flb_srvc_config = { - .flush = FLB_FLUSH_DEFAULT, - .http_listen = FLB_HTTP_LISTEN_DEFAULT, - .http_port = FLB_HTTP_PORT_DEFAULT, - .http_server = FLB_HTTP_SERVER_DEFAULT, - .log_path = "NULL", - .log_level = FLB_LOG_LEVEL_DEFAULT, - .coro_stack_size = FLB_CORO_STACK_SIZE_DEFAULT - }; - - p_file_infos_arr = callocz(1, sizeof(struct File_infos_arr)); - - if(logs_manag_config_load(&flb_srvc_config, &p_forward_in_config, g_update_every)) - exit(1); - - if(flb_init(flb_srvc_config, get_stock_config_dir(), g_logs_manag_config.sd_journal_field_prefix)){ - collector_error("flb_init() failed - logs management will be disabled"); - exit(1); - } - - if(flb_add_fwd_input(p_forward_in_config)) - collector_error("flb_add_fwd_input() failed - logs management forward input will be disabled"); - - /* Initialize logs management for each configuration section */ - config_file_load(main_loop, p_forward_in_config, &flb_srvc_config, &stdout_mut); - - if(p_file_infos_arr->count == 0){ - collector_info("No valid configuration could be found for any log source - logs management will be disabled"); - exit(1); - } - - /* Run Fluent Bit engine - * NOTE: flb_run() ideally would be executed after db_init(), but in case of - * a db_init() failure, it is easier to call flb_stop_and_cleanup() rather - * than the other way round (i.e. cleaning up after db_init(), if flb_run() - * fails). */ - if(flb_run()){ - collector_error("flb_run() failed - logs management will be disabled"); - exit(1); - } - - if(db_init()){ - collector_error("db_init() failed - logs management will be disabled"); - exit(1); - } - - uv_thread_t *p_stats_charts_thread_id = NULL; - const char *const netdata_internals_monitoring = getenv("NETDATA_INTERNALS_MONITORING"); - if( netdata_internals_monitoring && - *netdata_internals_monitoring && - strcmp(netdata_internals_monitoring, "YES") == 0){ - - p_stats_charts_thread_id = mallocz(sizeof(uv_thread_t)); - fatal_assert(0 == uv_thread_create(p_stats_charts_thread_id, stats_charts_init, &stdout_mut)); - } - -#if defined(__STDC_VERSION__) - debug_log( "__STDC_VERSION__: %ld", __STDC_VERSION__); -#else - debug_log( "__STDC_VERSION__ undefined"); -#endif // defined(__STDC_VERSION__) - debug_log( "libuv version: %s", uv_version_string()); - debug_log( "LZ4 version: %s", LZ4_versionString()); - debug_log( "SQLITE version: " SQLITE_VERSION); - - for(int i = 0; i < (int) (sizeof(signals) / sizeof(signals[0])); i++){ - uv_signal_init(main_loop, &signals[i].sig); - uv_signal_start(&signals[i].sig, signal_handler, signals[i].signum); - } - - struct functions_evloop_globals *wg = logsmanagement_func_facets_init(&logsmanagement_should_exit); - - collector_info("%s setup completed successfully", program_name); - - /* Run uvlib loop. */ - while(!__atomic_load_n(&logsmanagement_should_exit, __ATOMIC_RELAXED)) - uv_run(main_loop, UV_RUN_ONCE); - - /* If there are valid log sources, there should always be valid handles */ - collector_info("uv_run(main_loop, ...); no handles or requests - cleaning up..."); - - nd_log_limits_unlimited(); - - // TODO: Clean up stats charts memory - if(p_stats_charts_thread_id){ - uv_thread_join(p_stats_charts_thread_id); - freez(p_stats_charts_thread_id); - } - - uv_stop(main_loop); - - flb_terminate(); - - flb_free_fwd_input_out_cb(); - - p_file_info_destroy_all(); - - uv_walk(main_loop, on_walk_cleanup, NULL); - while(0 != uv_run(main_loop, UV_RUN_ONCE)); - if(uv_loop_close(main_loop)) - m_assert(0, "uv_loop_close() result not 0"); - freez(main_loop); - - functions_evloop_cancel_threads(wg); - - collector_info("logs management clean up done - exiting"); - - exit(0); -} diff --git a/src/logsmanagement/parser.c b/src/logsmanagement/parser.c deleted file mode 100644 index f637bef27..000000000 --- a/src/logsmanagement/parser.c +++ /dev/null @@ -1,1499 +0,0 @@ -// SPDX-License-Identifier: GPL-3.0-or-later - -/** @file parser.c - * @brief API to parse and search logs - */ - -#if !defined(_XOPEN_SOURCE) && !defined(__DARWIN__) && !defined(__APPLE__) && !defined(__FreeBSD__) -/* _XOPEN_SOURCE 700 required by strptime (POSIX 2004) and strndup (POSIX 2008) - * Will need to find a cleaner way of doing this, as currently defining - * _XOPEN_SOURCE 700 can cause issues on Centos 7, MacOS and FreeBSD too. */ -#define _XOPEN_SOURCE 700 -/* _BSD_SOURCE (glibc <= 2.19) and _DEFAULT_SOURCE (glibc >= 2.20) are required - * to silence "warning: implicit declaration of function ‘strsep’;" that is - * included through libnetdata/inlined.h. */ -#define _BSD_SOURCE -#define _DEFAULT_SOURCE -#include <time.h> -#endif - -#include "parser.h" -#include "helper.h" -#include <stdio.h> -#include <sys/resource.h> -#include <math.h> -#include <string.h> - -static regex_t vhost_regex, req_client_regex, cipher_suite_regex; - -const char* const csv_auto_format_guess_matrix[] = { - "$host:$server_port $remote_addr - - [$time_local] \"$request\" $status $body_bytes_sent - - $request_length $request_time $upstream_response_time", // csvVhostCustom4 - "$host:$server_port $remote_addr - - [$time_local] \"$request\" $status $body_bytes_sent - - $request_length $request_time", // csvVhostCustom3 - "$host:$server_port $remote_addr - - [$time_local] \"$request\" $status $body_bytes_sent - -", // csvVhostCombined - "$host:$server_port $remote_addr - - [$time_local] \"$request\" $status $body_bytes_sent $request_length $request_time $upstream_response_time", // csvVhostCustom2 - "$host:$server_port $remote_addr - - [$time_local] \"$request\" $status $body_bytes_sent $request_length $request_time", // csvVhostCustom1 - "$host:$server_port $remote_addr - - [$time_local] \"$request\" $status $body_bytes_sent", // csvVhostCommon - "$remote_addr - - [$time_local] \"$request\" $status $body_bytes_sent - - $request_length $request_time $upstream_response_time", // csvCustom4 - "$remote_addr - - [$time_local] \"$request\" $status $body_bytes_sent - - $request_length $request_time", // csvCustom3 - "$remote_addr - - [$time_local] \"$request\" $status $body_bytes_sent - -", // csvCombined - "$remote_addr - - [$time_local] \"$request\" $status $body_bytes_sent $request_length $request_time $upstream_response_time", // csvCustom2 - "$remote_addr - - [$time_local] \"$request\" $status $body_bytes_sent $request_length $request_time", // csvCustom1 - "$remote_addr - - [$time_local] \"$request\" $status $body_bytes_sent", // csvCommon - NULL} -; - -UNIT_STATIC int count_fields(const char *line, const char delimiter){ - const char *ptr; - int cnt, fQuote; - - for (cnt = 1, fQuote = 0, ptr = line; *ptr != '\n' && *ptr != '\r' && *ptr != '\0'; ptr++ ){ - if (fQuote) { - if (*ptr == '\"') { - if ( ptr[1] == '\"' ) { - ptr++; - continue; - } - fQuote = 0; - } - continue; - } - - if(*ptr == '\"'){ - fQuote = 1; - continue; - } - if(*ptr == delimiter){ - cnt++; - while(*(ptr+1) == delimiter) ptr++; - continue; - } - } - - if (fQuote) { - return -1; - } - - return cnt; -} - -/** - * @brief Parse a delimited string into an array of strings. - * @details Given a string containing no linebreaks, or containing line breaks - * which are escaped by "double quotes", extract a NULL-terminated - * array of strings, one for every delimiter-separated value in the row. - * @param[in] line The input string to be parsed. - * @param[in] delimiter The delimiter to be used to split the string. - * @param[in] num_fields The expected number of fields in \p line. If a negative - * number is provided, they will be counted. - * @return A NULL-terminated array of strings with the delimited values in \p line, - * or NULL in any other case. - * @todo This function has not been benchmarked or optimised. - */ -static inline char **parse_csv( const char *line, const char delimiter, int num_fields) { - char **buf, **bptr, *tmp, *tptr; - const char *ptr; - int fQuote, fEnd; - - if(num_fields < 0){ - num_fields = count_fields(line, delimiter); - - if ( num_fields == -1 ) { - return NULL; - } - } - - buf = mallocz( sizeof(char*) * (num_fields+1) ); - - tmp = mallocz( strlen(line) + 1 ); - - bptr = buf; - - for ( ptr = line, fQuote = 0, *tmp = '\0', tptr = tmp, fEnd = 0; ; ptr++ ) { - if ( fQuote ) { - if ( !*ptr ) { - break; - } - - if ( *ptr == '\"' ) { - if ( ptr[1] == '\"' ) { - *tptr++ = '\"'; - ptr++; - continue; - } - fQuote = 0; - } - else { - *tptr++ = *ptr; - } - - continue; - } - - - if(*ptr == '\"'){ - fQuote = 1; - continue; - } - else if(*ptr == '\0'){ - fEnd = 1; - *tptr = '\0'; - *bptr = strdupz( tmp ); - - if ( !*bptr ) { - for ( bptr--; bptr >= buf; bptr-- ) { - freez( *bptr ); - } - freez( buf ); - freez( tmp ); - - return NULL; - } - - bptr++; - tptr = tmp; - break; - } - else if(*ptr == delimiter){ - *tptr = '\0'; - *bptr = strdupz( tmp ); - - if ( !*bptr ) { - for ( bptr--; bptr >= buf; bptr-- ) { - freez( *bptr ); - } - freez( buf ); - freez( tmp ); - - return NULL; - } - - bptr++; - tptr = tmp; - - continue; - } - else{ - *tptr++ = *ptr; - continue; - } - - if ( fEnd ) { - break; - } - } - - *bptr = NULL; - freez( tmp ); - return buf; -} - -/** - * @brief Search a buffer for a keyword (or regular expression) - * @details Search the source buffer for a keyword (or regular expression) and - * copy matches to the destination buffer. - * @param[in] src The source buffer to be searched - * @param[in] src_sz Size of \p src - * @param[in, out] dest The destination buffer where the results will be - * written out to. If NULL, the results will just be discarded. - * @param[out] dest_sz Size of \p dest - * @param[in] keyword The keyword or pattern to be searched in the src buffer - * @param[in] regex The precompiled regular expression to be search in the - * src buffer. If NULL, \p keyword will be used instead. - * @param[in] ignore_case Perform case insensitive search if 1. - * @return Number of matches, or -1 in case of error - */ -int search_keyword( char *src, size_t src_sz __maybe_unused, - char *dest, size_t *dest_sz, - const char *keyword, regex_t *regex, - const int ignore_case){ - - m_assert(src[src_sz - 1] == '\0', "src[src_sz - 1] should be '\0' but it's not"); - m_assert((dest && dest_sz) || (!dest && !dest_sz), "either both dest and dest_sz exist, or none does"); - - if(unlikely(dest && !dest_sz)) - return -1; - - regex_t regex_compiled; - - if(regex) - regex_compiled = *regex; - else{ - char regexString[MAX_REGEX_SIZE]; - const int regex_flags = ignore_case ? REG_EXTENDED | REG_NEWLINE | REG_ICASE : REG_EXTENDED | REG_NEWLINE; - snprintf(regexString, MAX_REGEX_SIZE, ".*(%s).*", keyword); - int rc; - if (unlikely((rc = regcomp(®ex_compiled, regexString, regex_flags)))){ - size_t regcomp_err_str_size = regerror(rc, ®ex_compiled, 0, 0); - char *regcomp_err_str = mallocz(regcomp_err_str_size); - regerror(rc, ®ex_compiled, regcomp_err_str, regcomp_err_str_size); - fatal("Could not compile regular expression:%.*s, error: %s", (int) MAX_REGEX_SIZE, regexString, regcomp_err_str); - } - } - - regmatch_t groupArray[1]; - int matches = 0; - char *cursor = src; - - if(dest_sz) - *dest_sz = 0; - - for ( ; ; matches++){ - if (regexec(®ex_compiled, cursor, 1, groupArray, REG_NOTBOL | REG_NOTEOL)) - break; // No more matches - if (groupArray[0].rm_so == -1) - break; // No more groups - - size_t match_len = (size_t) (groupArray[0].rm_eo - groupArray[0].rm_so); - - // debug_log( "Match %d [%2d-%2d]:%.*s\n", matches, groupArray[0].rm_so, - // groupArray[0].rm_eo, (int) match_len, cursor + groupArray[0].rm_so); - - if(dest && dest_sz){ - memcpy( &dest[*dest_sz], cursor + groupArray[0].rm_so, match_len); - *dest_sz += match_len + 1; - dest[*dest_sz - 1] = '\n'; - } - - cursor += groupArray[0].rm_eo; - } - - if(!regex) - regfree(®ex_compiled); - - return matches; -} - -/** - * @brief Extract web log parser configuration from string - * @param[in] log_format String that describes the log format - * @param[in] delimiter Delimiter to be used when parsing a CSV log format - * @return Pointer to struct that contains the extracted log format - * configuration or NULL if no fields found in log_format. - */ -Web_log_parser_config_t *read_web_log_parser_config(const char *log_format, const char delimiter){ - int num_fields = count_fields(log_format, delimiter); - if(num_fields <= 0) return NULL; - - /* If first execution of this function, initialise regexs */ - static int regexs_initialised = 0; - - // TODO: Tests needed for following regexs. - if(!regexs_initialised){ - assert(regcomp(&vhost_regex, "^[a-zA-Z0-9:.-]+$", REG_NOSUB | REG_EXTENDED) == 0); - assert(regcomp(&req_client_regex, "^([0-9a-f:.]+|localhost)$", REG_NOSUB | REG_EXTENDED) == 0); - assert(regcomp(&cipher_suite_regex, "^[A-Z0-9_-]+$", REG_NOSUB | REG_EXTENDED) == 0); - regexs_initialised = 1; - } - - Web_log_parser_config_t *wblp_config = callocz(1, sizeof(Web_log_parser_config_t)); - wblp_config->num_fields = num_fields; - wblp_config->delimiter = delimiter; - - char **parsed_format = parse_csv(log_format, delimiter, num_fields); // parsed_format is NULL-terminated - wblp_config->fields = callocz(num_fields, sizeof(web_log_line_field_t)); - unsigned int fields_off = 0; - - for(int i = 0; i < num_fields; i++ ){ - - if(strcmp(parsed_format[i], "$host:$server_port") == 0 || - strcmp(parsed_format[i], "%v:%p") == 0) { - wblp_config->fields[fields_off++] = VHOST_WITH_PORT; - continue; - } - - if(strcmp(parsed_format[i], "$host") == 0 || - strcmp(parsed_format[i], "$http_host") == 0 || - strcmp(parsed_format[i], "%v") == 0) { - wblp_config->fields[fields_off++] = VHOST; - continue; - } - - if(strcmp(parsed_format[i], "$server_port") == 0 || - strcmp(parsed_format[i], "%p") == 0) { - wblp_config->fields[fields_off++] = PORT; - continue; - } - - if(strcmp(parsed_format[i], "$scheme") == 0) { - wblp_config->fields[fields_off++] = REQ_SCHEME; - continue; - } - - if(strcmp(parsed_format[i], "$remote_addr") == 0 || - strcmp(parsed_format[i], "%a") == 0 || - strcmp(parsed_format[i], "%h") == 0) { - wblp_config->fields[fields_off++] = REQ_CLIENT; - continue; - } - - if(strcmp(parsed_format[i], "$request") == 0 || - strcmp(parsed_format[i], "%r") == 0) { - wblp_config->fields[fields_off++] = REQ; - continue; - } - - if(strcmp(parsed_format[i], "$request_method") == 0 || - strcmp(parsed_format[i], "%m") == 0) { - wblp_config->fields[fields_off++] = REQ_METHOD; - continue; - } - - if(strcmp(parsed_format[i], "$request_uri") == 0 || - strcmp(parsed_format[i], "%U") == 0) { - wblp_config->fields[fields_off++] = REQ_URL; - continue; - } - - if(strcmp(parsed_format[i], "$server_protocol") == 0 || - strcmp(parsed_format[i], "%H") == 0) { - wblp_config->fields[fields_off++] = REQ_PROTO; - continue; - } - - if(strcmp(parsed_format[i], "$request_length") == 0 || - strcmp(parsed_format[i], "%I") == 0) { - wblp_config->fields[fields_off++] = REQ_SIZE; - continue; - } - - if(strcmp(parsed_format[i], "$request_time") == 0 || - strcmp(parsed_format[i], "%D") == 0) { - wblp_config->fields[fields_off++] = REQ_PROC_TIME; - continue; - } - - if(strcmp(parsed_format[i], "$status") == 0 || - strcmp(parsed_format[i], "%>s") == 0 || - strcmp(parsed_format[i], "%s") == 0) { - wblp_config->fields[fields_off++] = RESP_CODE; - continue; - } - - if(strcmp(parsed_format[i], "$bytes_sent") == 0 || - strcmp(parsed_format[i], "$body_bytes_sent") == 0 || - strcmp(parsed_format[i], "%b") == 0 || - strcmp(parsed_format[i], "%O") == 0 || - strcmp(parsed_format[i], "%B") == 0) { - wblp_config->fields[fields_off++] = RESP_SIZE; - continue; - } - - if(strcmp(parsed_format[i], "$upstream_response_time") == 0) { - wblp_config->fields[fields_off++] = UPS_RESP_TIME; - continue; - } - - if(strcmp(parsed_format[i], "$ssl_protocol") == 0) { - wblp_config->fields[fields_off++] = SSL_PROTO; - continue; - } - - if(strcmp(parsed_format[i], "$ssl_cipher") == 0) { - wblp_config->fields[fields_off++] = SSL_CIPHER_SUITE; - continue; - } - - if(strcmp(parsed_format[i], "$time_local") == 0 || strcmp(parsed_format[i], "[$time_local]") == 0 || - strcmp(parsed_format[i], "%t") == 0 || strcmp(parsed_format[i], "[%t]") == 0) { - wblp_config->fields = reallocz(wblp_config->fields, (num_fields + 1) * sizeof(web_log_line_field_t)); - wblp_config->fields[fields_off++] = TIME; - wblp_config->fields[fields_off++] = TIME; // TIME takes 2 fields - wblp_config->num_fields++; // TIME takes 2 fields - continue; - } - - wblp_config->fields[fields_off++] = CUSTOM; - - } - - for(int i = 0; parsed_format[i] != NULL; i++) - freez(parsed_format[i]); - - freez(parsed_format); - return wblp_config; -} - -/** - * @brief Parse a web log line to extract individual fields. - * @param[in] wblp_config Configuration that specifies how to parse the line. - * @param[in] line Web log record to be parsed. '\n', '\r' or '\0' terminated. - * @param[out] log_line_parsed Struct that stores the results of parsing. - */ -void parse_web_log_line(const Web_log_parser_config_t *wblp_config, - char *line, size_t line_len, - Log_line_parsed_t *log_line_parsed){ - - /* Read parsing configuration */ - web_log_line_field_t *fields_format = wblp_config->fields; - const int num_fields_config = wblp_config->num_fields; - const char delimiter = wblp_config->delimiter; - const int verify = wblp_config->verify_parsed_logs; - - /* Consume new lines and spaces at end of line */ - for(; line[line_len-1] == '\n' || line[line_len-1] == '\r' || line[line_len-1] == ' '; line_len--); - - char *field = line; - char *offset = line; - size_t field_size = 0; - - for(int i = 0; i < num_fields_config; i++ ){ - - /* Consume double quotes and extra delimiters at beginning of field */ - while(*field == '"' || *field == delimiter) field++, offset++; - - /* Find offset boundaries of next field in line */ - while(((size_t)(offset - line) < line_len) && *offset != delimiter) offset++; - - if(unlikely(*(offset - 1) == '"')) offset--; - - field_size = (size_t) (offset - field); - - #if ENABLE_PARSE_WEB_LOG_LINE_DEBUG - debug_log( "Field[%d]:%.*s", i, (int)field_size, field); - #endif - - if(fields_format[i] == CUSTOM){ - #if ENABLE_PARSE_WEB_LOG_LINE_DEBUG - debug_log( "Item %d (type: CUSTOM or UNKNOWN):%.*s", i, (int)field_size, field); - #endif - goto next_item; - } - - - char *port = field; - size_t port_size = 0; - size_t vhost_size = 0; - - if(fields_format[i] == VHOST_WITH_PORT){ - #if ENABLE_PARSE_WEB_LOG_LINE_DEBUG - debug_log( "Item %d (type: VHOST_WITH_PORT):%.*s", i, (int)field_size, field); - #endif - - if(unlikely(field[0] == '-' && field_size == 1)){ - log_line_parsed->vhost[0] = '\0'; - log_line_parsed->port = WEB_LOG_INVALID_PORT; - log_line_parsed->parsing_errors++; - goto next_item; - } - - while(*port != ':' && vhost_size < field_size) { port++; vhost_size++; } - if(likely(vhost_size < field_size)) { - /* ':' detected in string */ - port++; - port_size = field_size - vhost_size - 1; - field_size = vhost_size; // now field represents vhost and port is separate - } - else { - /* no ':' detected in string - invalid */ - log_line_parsed->vhost[0] = '\0'; - log_line_parsed->port = WEB_LOG_INVALID_PORT; - log_line_parsed->parsing_errors++; - goto next_item; - } - } - - if(fields_format[i] == VHOST_WITH_PORT || fields_format[i] == VHOST){ - #if ENABLE_PARSE_WEB_LOG_LINE_DEBUG - debug_log( "Item %d (type: VHOST):%.*s", i, (int)field_size, field); - #endif - - if(unlikely(field[0] == '-' && field_size == 1)){ - log_line_parsed->vhost[0] = '\0'; - log_line_parsed->parsing_errors++; - goto next_item; - } - - // TODO: Add below case in code!!! - // nginx $host and $http_host return ipv6 in [], apache doesn't - // TODO: TEST! This case hasn't been tested! - // char *pch = strchr(parsed[i], ']'); - // if(pch){ - // *pch = '\0'; - // memmove(parsed[i], parsed[i]+1, strlen(parsed[i])); - // } - - snprintfz(log_line_parsed->vhost, VHOST_MAX_LEN, "%.*s", (int) field_size, field); - - if(verify){ - // if(field_size >= VHOST_MAX_LEN){ - // #if ENABLE_PARSE_WEB_LOG_LINE_DEBUG - // collector_error("VHOST is invalid"); - // #endif - // log_line_parsed->vhost[0] = '\0'; - // log_line_parsed->parsing_errors++; - // goto next_item; // TODO: Not entirely right, as it will also skip PORT parsing in case of VHOST_WITH_PORT - // } - - if(unlikely(regexec(&vhost_regex, log_line_parsed->vhost, 0, NULL, 0) == REG_NOMATCH)){ - #if ENABLE_PARSE_WEB_LOG_LINE_DEBUG - collector_error("VHOST is invalid"); - #endif - // log_line_parsed->vhost[0] = 'invalid'; - snprintf(log_line_parsed->vhost, sizeof(WEB_LOG_INVALID_HOST_STR), WEB_LOG_INVALID_HOST_STR); - log_line_parsed->parsing_errors++; - } - } - - #if ENABLE_PARSE_WEB_LOG_LINE_DEBUG - debug_log( "Extracted VHOST:%s", log_line_parsed->vhost); - #endif - - if(fields_format[i] == VHOST) goto next_item; - } - - if(fields_format[i] == VHOST_WITH_PORT || fields_format[i] == PORT){ - - if(fields_format[i] != VHOST_WITH_PORT){ - port = field; - port_size = field_size; - } - - #if ENABLE_PARSE_WEB_LOG_LINE_DEBUG - debug_log( "Item %d (type: PORT):%.*s", i, (int) port_size, port); - #endif - - if(unlikely(port[0] == '-' && port_size == 1)){ - log_line_parsed->port = WEB_LOG_INVALID_PORT; - log_line_parsed->parsing_errors++; - goto next_item; - } - - char port_d[PORT_MAX_LEN]; - snprintfz( port_d, PORT_MAX_LEN, "%.*s", (int) port_size, port); - - if(likely(str2int(&log_line_parsed->port, port_d, 10) == STR2XX_SUCCESS)){ - if(verify){ - if(unlikely(log_line_parsed->port < 80 || log_line_parsed->port > 49151)){ - #if ENABLE_PARSE_WEB_LOG_LINE_DEBUG - collector_error("PORT is invalid (<80 or >49151)"); - #endif - log_line_parsed->port = WEB_LOG_INVALID_PORT; - log_line_parsed->parsing_errors++; - } - } - } - else{ - #if ENABLE_PARSE_WEB_LOG_LINE_DEBUG - collector_error("Error while extracting PORT from string"); - #endif - log_line_parsed->port = WEB_LOG_INVALID_PORT; - log_line_parsed->parsing_errors++; - } - #if ENABLE_PARSE_WEB_LOG_LINE_DEBUG - debug_log( "Extracted PORT:%d", log_line_parsed->port); - #endif - - goto next_item; - } - - if(fields_format[i] == REQ_SCHEME){ - #if ENABLE_PARSE_WEB_LOG_LINE_DEBUG - debug_log( "Item %d (type: REQ_SCHEME):%.*s", i, (int)field_size, field); - #endif - - if(unlikely(field[0] == '-' && field_size == 1)){ - log_line_parsed->req_scheme[0] = '\0'; - log_line_parsed->parsing_errors++; - goto next_item; - } - - snprintfz(log_line_parsed->req_scheme, REQ_SCHEME_MAX_LEN, "%.*s", (int) field_size, field); - - if(verify){ - if(unlikely( strcmp(log_line_parsed->req_scheme, "http") && - strcmp(log_line_parsed->req_scheme, "https"))){ - #if ENABLE_PARSE_WEB_LOG_LINE_DEBUG - collector_error("REQ_SCHEME is invalid (must be either 'http' or 'https')"); - #endif - log_line_parsed->req_scheme[0] = '\0'; - log_line_parsed->parsing_errors++; - } - } - #if ENABLE_PARSE_WEB_LOG_LINE_DEBUG - debug_log( "Extracted REQ_SCHEME:%s", log_line_parsed->req_scheme); - #endif - goto next_item; - } - - if(fields_format[i] == REQ_CLIENT){ - #if ENABLE_PARSE_WEB_LOG_LINE_DEBUG - debug_log( "Item %d (type: REQ_CLIENT):%.*s", i, (int)field_size, field); - #endif - - if(unlikely(field[0] == '-' && field_size == 1)){ - log_line_parsed->req_client[0] = '\0'; - log_line_parsed->parsing_errors++; - goto next_item; - } - - snprintfz(log_line_parsed->req_client, REQ_CLIENT_MAX_LEN, "%.*s", (int)field_size, field); - - if(verify){ - int regex_rc = regexec(&req_client_regex, log_line_parsed->req_client, 0, NULL, 0); - if (likely(regex_rc == 0)) {/* do nothing */} - else if (unlikely(regex_rc == REG_NOMATCH)) { - #if ENABLE_PARSE_WEB_LOG_LINE_DEBUG - collector_error("REQ_CLIENT is invalid"); - #endif - snprintf(log_line_parsed->req_client, REQ_CLIENT_MAX_LEN, "%s", WEB_LOG_INVALID_CLIENT_IP_STR); - log_line_parsed->parsing_errors++; - } - else { - size_t err_msg_size = regerror(regex_rc, &req_client_regex, NULL, 0); - char *err_msg = mallocz(err_msg_size); - regerror(regex_rc, &req_client_regex, err_msg, err_msg_size); - collector_error("req_client_regex error:%s", err_msg); - freez(err_msg); - m_assert(0, "req_client_regex has failed"); - } - } - - #if ENABLE_PARSE_WEB_LOG_LINE_DEBUG - debug_log( "Extracted REQ_CLIENT:%s", log_line_parsed->req_client); - #endif - - goto next_item; - } - - if(fields_format[i] == REQ || fields_format[i] == REQ_METHOD){ - - /* If fields_format[i] == REQ, then field is filled in with request in the previous code */ - - #if ENABLE_PARSE_WEB_LOG_LINE_DEBUG - debug_log( "Item %d (type: REQ or REQ_METHOD):%.*s", i, (int)field_size, field); - #endif - - snprintfz( log_line_parsed->req_method, REQ_METHOD_MAX_LEN, "%.*s", (int)field_size, field); - - if(verify){ - if( unlikely( - /* GET and POST are the most common requests, so check them first */ - strcmp(log_line_parsed->req_method, "GET") && - strcmp(log_line_parsed->req_method, "POST") && - - strcmp(log_line_parsed->req_method, "ACL") && - strcmp(log_line_parsed->req_method, "BASELINE-CONTROL") && - strcmp(log_line_parsed->req_method, "BIND") && - strcmp(log_line_parsed->req_method, "CHECKIN") && - strcmp(log_line_parsed->req_method, "CHECKOUT") && - strcmp(log_line_parsed->req_method, "CONNECT") && - strcmp(log_line_parsed->req_method, "COPY") && - strcmp(log_line_parsed->req_method, "DELETE") && - strcmp(log_line_parsed->req_method, "HEAD") && - strcmp(log_line_parsed->req_method, "LABEL") && - strcmp(log_line_parsed->req_method, "LINK") && - strcmp(log_line_parsed->req_method, "LOCK") && - strcmp(log_line_parsed->req_method, "MERGE") && - strcmp(log_line_parsed->req_method, "MKACTIVITY") && - strcmp(log_line_parsed->req_method, "MKCALENDAR") && - strcmp(log_line_parsed->req_method, "MKCOL") && - strcmp(log_line_parsed->req_method, "MKREDIRECTREF") && - strcmp(log_line_parsed->req_method, "MKWORKSPACE") && - strcmp(log_line_parsed->req_method, "MOVE") && - strcmp(log_line_parsed->req_method, "OPTIONS") && - strcmp(log_line_parsed->req_method, "ORDERPATCH") && - strcmp(log_line_parsed->req_method, "PATCH") && - strcmp(log_line_parsed->req_method, "PRI") && - strcmp(log_line_parsed->req_method, "PROPFIND") && - strcmp(log_line_parsed->req_method, "PROPPATCH") && - strcmp(log_line_parsed->req_method, "PUT") && - strcmp(log_line_parsed->req_method, "REBIND") && - strcmp(log_line_parsed->req_method, "REPORT") && - strcmp(log_line_parsed->req_method, "SEARCH") && - strcmp(log_line_parsed->req_method, "TRACE") && - strcmp(log_line_parsed->req_method, "UNBIND") && - strcmp(log_line_parsed->req_method, "UNCHECKOUT") && - strcmp(log_line_parsed->req_method, "UNLINK") && - strcmp(log_line_parsed->req_method, "UNLOCK") && - strcmp(log_line_parsed->req_method, "UPDATE") && - strcmp(log_line_parsed->req_method, "UPDATEREDIRECTREF") && - strcmp(log_line_parsed->req_method, "-"))) { - - #if ENABLE_PARSE_WEB_LOG_LINE_DEBUG - collector_error("REQ_METHOD is invalid"); - #endif - log_line_parsed->req_method[0] = '\0'; - log_line_parsed->parsing_errors++; - } - } - #if ENABLE_PARSE_WEB_LOG_LINE_DEBUG - debug_log( "Extracted REQ_METHOD:%s", log_line_parsed->req_method); - #endif - - if(fields_format[i] == REQ && field[0] != '-') { - while(*(offset + 1) == delimiter) offset++; // Consume extra whitespace characters - field = ++offset; - while(*offset != delimiter && ((size_t)(offset - line) < line_len)) offset++; - field_size = (size_t) (offset - field); - } - else goto next_item; - } - - if(fields_format[i] == REQ || fields_format[i] == REQ_URL){ - #if ENABLE_PARSE_WEB_LOG_LINE_DEBUG - debug_log( "Item %d (type: REQ or REQ_URL):%.*s", i, (int)field_size, field); - #endif - - snprintfz( log_line_parsed->req_URL, REQ_URL_MAX_LEN, "%.*s", (int)field_size, field); - - // if(unlikely(field[0] == '-' && field_size == 1)){ - // log_line_parsed->req_method[0] = '\0'; - // log_line_parsed->parsing_errors++; - // } - - //if(verify){} ?? - - #if ENABLE_PARSE_WEB_LOG_LINE_DEBUG - debug_log( "Extracted REQ_URL:%s", log_line_parsed->req_URL ? log_line_parsed->req_URL : "NULL!"); - #endif - - if(fields_format[i] == REQ) { - while(*(offset + 1) == delimiter) offset++; // Consume extra whitespace characters - field = ++offset; - while(*offset != delimiter && ((size_t)(offset - line) < line_len)) offset++; - field_size = (size_t) (offset - field); - } - else goto next_item; - } - - if(fields_format[i] == REQ || fields_format[i] == REQ_PROTO){ - - #if ENABLE_PARSE_WEB_LOG_LINE_DEBUG - debug_log( "Item %d (type: REQ or REQ_PROTO):%.*s", i, (int)field_size, field); - #endif - - if(unlikely(field[0] == '-' && field_size == 1)){ - log_line_parsed->req_proto[0] = '\0'; - log_line_parsed->parsing_errors++; - goto next_item; - } - - if(unlikely( field_size > REQ_PROTO_PREF_SIZE + REQ_PROTO_MAX_LEN - 1)){ - field_size = REQ_PROTO_PREF_SIZE + REQ_PROTO_MAX_LEN - 1; - } - - size_t req_proto_num_size = field_size - REQ_PROTO_PREF_SIZE; - - if(verify){ - if(unlikely(field_size < 6 || - req_proto_num_size == 0 || - strncmp(field, "HTTP/", REQ_PROTO_PREF_SIZE) || - ( strncmp(&field[REQ_PROTO_PREF_SIZE], "1", req_proto_num_size) && - strncmp(&field[REQ_PROTO_PREF_SIZE], "1.0", req_proto_num_size) && - strncmp(&field[REQ_PROTO_PREF_SIZE], "1.1", req_proto_num_size) && - strncmp(&field[REQ_PROTO_PREF_SIZE], "2", req_proto_num_size) && - strncmp(&field[REQ_PROTO_PREF_SIZE], "2.0", req_proto_num_size)))) { - #if ENABLE_PARSE_WEB_LOG_LINE_DEBUG - collector_error("REQ_PROTO is invalid"); - #endif - log_line_parsed->req_proto[0] = '\0'; - log_line_parsed->parsing_errors++; - } - else snprintfz( log_line_parsed->req_proto, req_proto_num_size + 1, - "%.*s", (int)req_proto_num_size, &field[REQ_PROTO_PREF_SIZE]); - } - else snprintfz( log_line_parsed->req_proto, req_proto_num_size + 1, - "%.*s", (int)req_proto_num_size, &field[REQ_PROTO_PREF_SIZE]); - - #if ENABLE_PARSE_WEB_LOG_LINE_DEBUG - debug_log( "Extracted REQ_PROTO:%s", log_line_parsed->req_proto); - #endif - - goto next_item; - } - - if(fields_format[i] == REQ_SIZE){ - /* TODO: Differentiate between '-' or 0 and an invalid request size. - * right now, all these will set req_size == 0 */ - #if ENABLE_PARSE_WEB_LOG_LINE_DEBUG - debug_log( "Item %d (type: REQ_SIZE):%.*s", i, (int)field_size, field); - #endif - - char req_size_d[REQ_SIZE_MAX_LEN]; - snprintfz( req_size_d, REQ_SIZE_MAX_LEN, "%.*s", (int) field_size, field); - - if(field[0] == '-' && field_size == 1) { - log_line_parsed->req_size = 0; // Request size can be '-' - } - else if(likely(str2int(&log_line_parsed->req_size, req_size_d, 10) == STR2XX_SUCCESS)){ - if(verify){ - if(unlikely(log_line_parsed->req_size < 0)){ - #if ENABLE_PARSE_WEB_LOG_LINE_DEBUG - collector_error("REQ_SIZE is invalid (<0)"); - #endif - log_line_parsed->req_size = 0; - log_line_parsed->parsing_errors++; - } - } - } - else{ - collector_error("Error while extracting REQ_SIZE from string"); - log_line_parsed->req_size = 0; - log_line_parsed->parsing_errors++; - } - #if ENABLE_PARSE_WEB_LOG_LINE_DEBUG - debug_log( "Extracted REQ_SIZE:%d", log_line_parsed->req_size); - #endif - - goto next_item; - } - - if(fields_format[i] == REQ_PROC_TIME){ - #if ENABLE_PARSE_WEB_LOG_LINE_DEBUG - debug_log( "Item %d (type: REQ_PROC_TIME):%.*s", i, (int)field_size, field); - #endif - - if(unlikely(field[0] == '-' && field_size == 1)){ - log_line_parsed->req_proc_time = WEB_LOG_INVALID_PORT; - log_line_parsed->parsing_errors++; - goto next_item; - } - - float f = 0; - - char req_proc_time_d[REQ_PROC_TIME_MAX_LEN]; - snprintfz( req_proc_time_d, REQ_PROC_TIME_MAX_LEN, "%.*s", (int) field_size, field); - - if(memchr(field, '.', field_size)){ // nginx time is in seconds with a milliseconds resolution. - if(likely(str2float(&f, req_proc_time_d) == STR2XX_SUCCESS)){ - log_line_parsed->req_proc_time = (int) (f * 1.0E6); - } - else { - #if ENABLE_PARSE_WEB_LOG_LINE_DEBUG - collector_error("Error while extracting REQ_PROC_TIME from string"); - #endif - log_line_parsed->req_proc_time = 0; - log_line_parsed->parsing_errors++; - } - } - else{ // apache time is in microseconds - if(unlikely(str2int(&log_line_parsed->req_proc_time, req_proc_time_d, 10) != STR2XX_SUCCESS)) { - #if ENABLE_PARSE_WEB_LOG_LINE_DEBUG - collector_error("Error while extracting REQ_PROC_TIME from string"); - #endif - log_line_parsed->req_proc_time = 0; - log_line_parsed->parsing_errors++; - } - } - - if(verify){ - if(unlikely(log_line_parsed->req_proc_time < 0)){ - #if ENABLE_PARSE_WEB_LOG_LINE_DEBUG - collector_error("REQ_PROC_TIME is invalid (<0)"); - #endif - log_line_parsed->req_proc_time = 0; - log_line_parsed->parsing_errors++; - } - } - #if ENABLE_PARSE_WEB_LOG_LINE_DEBUG - debug_log( "Extracted REQ_PROC_TIME:%d", log_line_parsed->req_proc_time); - #endif - - goto next_item; - } - - if(fields_format[i] == RESP_CODE){ - #if ENABLE_PARSE_WEB_LOG_LINE_DEBUG - debug_log( "Item %d (type: RESP_CODE):%.*s\n", i, (int)field_size, field); - #endif - - if(unlikely(field[0] == '-' && field_size == 1)){ - log_line_parsed->resp_code = 0; - log_line_parsed->parsing_errors++; - goto next_item; - } - - char resp_code_d[REQ_RESP_CODE_MAX_LEN]; - snprintfz( resp_code_d, REQ_RESP_CODE_MAX_LEN, "%.*s", (int)field_size, field); - - if(likely(str2int(&log_line_parsed->resp_code, resp_code_d, 10) == STR2XX_SUCCESS)){ - if(verify){ - /* rfc7231 - * Informational responses (100–199), - * Successful responses (200–299), - * Redirects (300–399), - * Client errors (400–499), - * Server errors (500–599). */ - if(unlikely(log_line_parsed->resp_code < 100 || log_line_parsed->resp_code > 599)){ - #if ENABLE_PARSE_WEB_LOG_LINE_DEBUG - collector_error("RESP_CODE is invalid (<100 or >599)"); - #endif - log_line_parsed->resp_code = 0; - log_line_parsed->parsing_errors++; - } - } - } - else{ - #if ENABLE_PARSE_WEB_LOG_LINE_DEBUG - collector_error("Error while extracting RESP_CODE from string"); - #endif - log_line_parsed->resp_code = 0; - log_line_parsed->parsing_errors++; - } - #if ENABLE_PARSE_WEB_LOG_LINE_DEBUG - debug_log( "Extracted RESP_CODE:%d", log_line_parsed->resp_code); - #endif - - goto next_item; - } - - if(fields_format[i] == RESP_SIZE){ - /* TODO: Differentiate between '-' or 0 and an invalid response size. - * right now, all these will set resp_size == 0 */ - #if ENABLE_PARSE_WEB_LOG_LINE_DEBUG - debug_log( "Item %d (type: RESP_SIZE):%.*s", i, (int)field_size, field); - #endif - - char resp_size_d[REQ_RESP_SIZE_MAX_LEN]; - snprintfz( resp_size_d, REQ_RESP_SIZE_MAX_LEN, "%.*s", (int)field_size, field); - - if(field[0] == '-' && field_size == 1) { - log_line_parsed->resp_size = 0; // Response size can be '-' - } - else if(likely(str2int(&log_line_parsed->resp_size, resp_size_d, 10) == STR2XX_SUCCESS)){ - if(verify){ - if(unlikely(log_line_parsed->resp_size < 0)){ - #if ENABLE_PARSE_WEB_LOG_LINE_DEBUG - collector_error("RESP_SIZE is invalid (<0)"); - #endif - log_line_parsed->resp_size = 0; - log_line_parsed->parsing_errors++; - } - } - } - else { - #if ENABLE_PARSE_WEB_LOG_LINE_DEBUG - collector_error("Error while extracting RESP_SIZE from string"); - #endif - log_line_parsed->resp_size = 0; - log_line_parsed->parsing_errors++; - } - #if ENABLE_PARSE_WEB_LOG_LINE_DEBUG - debug_log( "Extracted RESP_SIZE:%d", log_line_parsed->resp_size); - #endif - - goto next_item; - } - - if(fields_format[i] == UPS_RESP_TIME){ - #if ENABLE_PARSE_WEB_LOG_LINE_DEBUG - debug_log( "Item %d (type: UPS_RESP_TIME):%.*s", i, (int)field_size, field); - #endif - - if(field[0] == '-' && field_size == 1) { - log_line_parsed->ups_resp_time = 0; - log_line_parsed->parsing_errors++; - goto next_item; - } - - /* Times of several responses are separated by commas and colons. Following the - * Go parser implementation, where only the first one is kept, the others are - * discarded. Also, there must be no space in between them. Needs testing... */ - char *pch = memchr(field, ',', field_size); - if(pch) field_size = pch - field; - - float f = 0; - - char ups_resp_time_d[UPS_RESP_TIME_MAX_LEN]; - snprintfz( ups_resp_time_d, UPS_RESP_TIME_MAX_LEN, "%.*s", (int)field_size, field); - - if(memchr(field, '.', field_size)){ // nginx time is in seconds with a milliseconds resolution. - if(likely(str2float(&f, ups_resp_time_d) == STR2XX_SUCCESS)){ - log_line_parsed->ups_resp_time = (int) (f * 1.0E6); - } - else { - #if ENABLE_PARSE_WEB_LOG_LINE_DEBUG - collector_error("Error while extracting UPS_RESP_TIME from string"); - #endif - log_line_parsed->ups_resp_time = 0; - log_line_parsed->parsing_errors++; - } - } - else{ // unlike in the REQ_PROC_TIME case, apache doesn't have an equivalent here - #if ENABLE_PARSE_WEB_LOG_LINE_DEBUG - collector_error("Error while extracting UPS_RESP_TIME from string"); - #endif - log_line_parsed->ups_resp_time = 0; - log_line_parsed->parsing_errors++; - } - if(verify){ - if(unlikely(log_line_parsed->ups_resp_time < 0)){ - #if ENABLE_PARSE_WEB_LOG_LINE_DEBUG - collector_error("UPS_RESP_TIME is invalid (<0)"); - #endif - log_line_parsed->ups_resp_time = 0; - log_line_parsed->parsing_errors++; - } - } - #if ENABLE_PARSE_WEB_LOG_LINE_DEBUG - debug_log( "Extracted UPS_RESP_TIME:%d", log_line_parsed->ups_resp_time); - #endif - - goto next_item; - } - - if(fields_format[i] == SSL_PROTO){ - #if ENABLE_PARSE_WEB_LOG_LINE_DEBUG - debug_log( "Item %d (type: SSL_PROTO):%.*s", i, (int)field_size, field); - #endif - - if(field[0] == '-' && field_size == 1) { - log_line_parsed->ssl_proto[0] = '\0'; - log_line_parsed->parsing_errors++; - goto next_item; - } - - #if ENABLE_PARSE_WEB_LOG_LINE_DEBUG - debug_log( "SSL_PROTO field size:%zu", field_size); - #endif - - snprintfz( log_line_parsed->ssl_proto, SSL_PROTO_MAX_LEN, "%.*s", (int)field_size, field); - - #if ENABLE_PARSE_WEB_LOG_LINE_DEBUG - debug_log( "log_line_parsed->ssl_proto:%s", log_line_parsed->ssl_proto); - #endif - - if(verify){ - if(unlikely(strcmp(log_line_parsed->ssl_proto, "TLSv1") && - strcmp(log_line_parsed->ssl_proto, "TLSv1.1") && - strcmp(log_line_parsed->ssl_proto, "TLSv1.2") && - strcmp(log_line_parsed->ssl_proto, "TLSv1.3") && - strcmp(log_line_parsed->ssl_proto, "SSLv2") && - strcmp(log_line_parsed->ssl_proto, "SSLv3"))) { - #if ENABLE_PARSE_WEB_LOG_LINE_DEBUG - collector_error("SSL_PROTO is invalid"); - #endif - log_line_parsed->ssl_proto[0] = '\0'; - log_line_parsed->parsing_errors++; - } - } - - #if ENABLE_PARSE_WEB_LOG_LINE_DEBUG - debug_log( "Extracted SSL_PROTO:%s", log_line_parsed->ssl_proto); - #endif - - goto next_item; - } - - if(fields_format[i] == SSL_CIPHER_SUITE){ - #if ENABLE_PARSE_WEB_LOG_LINE_DEBUG - debug_log( "Item %d (type: SSL_CIPHER_SUITE):%.*s", i, (int)field_size, field); - #endif - - if(field[0] == '-' && field_size == 1) { - log_line_parsed->ssl_cipher[0] = '\0'; - log_line_parsed->parsing_errors++; - } - - snprintfz( log_line_parsed->ssl_cipher, SSL_CIPHER_SUITE_MAX_LEN, "%.*s", (int)field_size, field); - - #if ENABLE_PARSE_WEB_LOG_LINE_DEBUG - debug_log( "before: SSL_CIPHER_SUITE:%s", log_line_parsed->ssl_cipher); - #endif - - if(verify){ - int regex_rc = regexec(&cipher_suite_regex, log_line_parsed->ssl_cipher, 0, NULL, 0); - if (likely(regex_rc == 0)){/* do nothing */} - else if (unlikely(regex_rc == REG_NOMATCH)) { - #if ENABLE_PARSE_WEB_LOG_LINE_DEBUG - collector_error("SSL_CIPHER_SUITE is invalid"); - #endif - log_line_parsed->ssl_cipher[0] = '\0'; - log_line_parsed->parsing_errors++; - } - else { - size_t err_msg_size = regerror(regex_rc, &cipher_suite_regex, NULL, 0); - char *err_msg = mallocz(err_msg_size); - regerror(regex_rc, &cipher_suite_regex, err_msg, err_msg_size); - collector_error("cipher_suite_regex error:%s", err_msg); - freez(err_msg); - m_assert(0, "cipher_suite_regex has failed"); - } - } - - #if ENABLE_PARSE_WEB_LOG_LINE_DEBUG - debug_log( "Extracted SSL_CIPHER_SUITE:%s", log_line_parsed->ssl_cipher); - #endif - - goto next_item; - } - - if(fields_format[i] == TIME){ - - if(wblp_config->skip_timestamp_parsing){ - while(*offset != ']') offset++; - i++; - offset++; - goto next_item; - } - - #if ENABLE_PARSE_WEB_LOG_LINE_DEBUG - debug_log( "Item %d (type: TIME - 1st of 2 fields):%.*s", i, (int)field_size, field); - #endif - - // TODO: What if TIME is invalid? - // if(field[0] == '-' && field_size == 1) { - // log_line_parsed->timestamp = 0; - // log_line_parsed->parsing_errors++; - // ++i; - // goto next_item; - // } - - char *datetime = field; - - if(memchr(datetime, '[', field_size)) { - datetime++; - field_size--; - } - - struct tm ltm = {0}; - char *tz_str = strptime(datetime, "%d/%b/%Y:%H:%M:%S", <m); - if(unlikely(tz_str == NULL)){ - collector_error("TIME datetime parsing failed"); - log_line_parsed->timestamp = 0; - log_line_parsed->parsing_errors++; - goto next_item; - } - - #if ENABLE_PARSE_WEB_LOG_LINE_DEBUG - debug_log( "strptime() result: year:%d mon:%d day:%d hour:%d min:%d sec:%d", - ltm.tm_year, ltm.tm_mon, ltm.tm_mday, - ltm.tm_hour, ltm.tm_min, ltm.tm_sec); - #endif - - /* Deal with 2nd part of datetime i.e. timezone */ - - m_assert(*tz_str == ' ', "Invalid TIME timezone"); - ++tz_str; - m_assert(*tz_str == '+' || *tz_str == '-', "Invalid TIME timezone"); - char tz_sign = *tz_str; - - char *tz_str_end = ++tz_str; - while(*tz_str_end != ']') tz_str_end++; - - m_assert(tz_str_end - tz_str == 4, "Invalid TIME timezone string length"); - - char tz_num[4]; - memcpy(tz_num, tz_str, tz_str_end - tz_str); - - #if ENABLE_PARSE_WEB_LOG_LINE_DEBUG - debug_log( "TIME 2nd part: %.*s", (int)(tz_str_end - tz_str), tz_str); - #endif - - long int tz = strtol(tz_str, NULL, 10); - long int tz_h = tz / 100; - long int tz_m = tz % 100; - int64_t tz_adj = (int64_t) tz_h * 3600 + (int64_t) tz_m * 60; - if(tz_sign == '+') tz_adj *= -1; // if timezone is positive, we need to subtract it to get GMT - - #if ENABLE_PARSE_WEB_LOG_LINE_DEBUG - debug_log( "Timezone: int:%ld, hrs:%ld, mins:%ld", tz, tz_h, tz_m); - #endif - - if(-1 == (log_line_parsed->timestamp = timegm(<m) + tz_adj)){ - collector_error("TIME datetime parsing failed"); - log_line_parsed->timestamp = 0; - log_line_parsed->parsing_errors++; - } - - #if ENABLE_PARSE_WEB_LOG_LINE_DEBUG - char tb[80]; - strftime(tb, sizeof(tb), "%c", <m ); - debug_log( "Extracted TIME:%ld", log_line_parsed->timestamp); - debug_log( "Extracted TIME string:%s", tb); - #endif - - offset = tz_str_end + 1; // WARNING! this modifies the offset but it is required in the TIME case. - ++i; // TIME takes up 2 fields_format[] spaces, so skip the next one - - goto next_item; - } - -next_item: - /* If offset is located beyond the end of the line, terminate parsing */ - if(unlikely((size_t) (offset - line) >= line_len)) break; - - field = ++offset; - } -} - -/** - * @brief Extract web log metrics from a group of web log fields. - * @param[in] parser_config Configuration specifying how and what web log - * metrics to extract. - * @param[in] line_parsed Web logs fields extracted from a web log line. - * @param[out] metrics Web logs metrics exctracted from the \p line_parsed - * web log fields, using the \p parser_config configuration. - */ -void extract_web_log_metrics(Log_parser_config_t *parser_config, - Log_line_parsed_t *line_parsed, - Web_log_metrics_t *metrics){ - - /* Extract number of parsed lines */ - /* NOTE: Commented out as it is done in flb_collect_logs_cb() now. */ - // metrics->num_lines++; - - /* Extract vhost */ - // TODO: Reduce number of reallocs - if((parser_config->chart_config & CHART_VHOST) && *line_parsed->vhost){ - int i; - for(i = 0; i < metrics->vhost_arr.size; i++){ - if(!strcmp(metrics->vhost_arr.vhosts[i].name, line_parsed->vhost)){ - metrics->vhost_arr.vhosts[i].count++; - break; - } - } - if(metrics->vhost_arr.size == i){ // Vhost not found in array - need to append - metrics->vhost_arr.size++; - if(metrics->vhost_arr.size >= metrics->vhost_arr.size_max){ - metrics->vhost_arr.size_max = metrics->vhost_arr.size * VHOST_BUFFS_SCALE_FACTOR + 1; - metrics->vhost_arr.vhosts = reallocz( metrics->vhost_arr.vhosts, - metrics->vhost_arr.size_max * sizeof(struct log_parser_metrics_vhost)); - } - snprintf(metrics->vhost_arr.vhosts[metrics->vhost_arr.size - 1].name, VHOST_MAX_LEN, "%s", line_parsed->vhost); - metrics->vhost_arr.vhosts[metrics->vhost_arr.size - 1].count = 1; - } - } - - /* Extract port */ - // TODO: Reduce number of reallocs - if((parser_config->chart_config & CHART_PORT) && line_parsed->port){ - int i; - for(i = 0; i < metrics->port_arr.size; i++){ - if(metrics->port_arr.ports[i].port == line_parsed->port){ - metrics->port_arr.ports[i].count++; - break; - } - } - if(metrics->port_arr.size == i){ // Port not found in array - need to append - metrics->port_arr.size++; - if(metrics->port_arr.size >= metrics->port_arr.size_max){ - metrics->port_arr.size_max = metrics->port_arr.size * PORT_BUFFS_SCALE_FACTOR + 1; - metrics->port_arr.ports = reallocz( metrics->port_arr.ports, - metrics->port_arr.size_max * sizeof(struct log_parser_metrics_port)); - } - if(line_parsed->port == WEB_LOG_INVALID_PORT) - snprintfz(metrics->port_arr.ports[metrics->port_arr.size - 1].name, PORT_MAX_LEN, WEB_LOG_INVALID_PORT_STR); - else - snprintfz(metrics->port_arr.ports[metrics->port_arr.size - 1].name, PORT_MAX_LEN, "%d", line_parsed->port); - metrics->port_arr.ports[metrics->port_arr.size - 1].port = line_parsed->port; - metrics->port_arr.ports[metrics->port_arr.size - 1].count = 1; - } - } - - /* Extract client metrics */ - if(( parser_config->chart_config & ( CHART_IP_VERSION | CHART_REQ_CLIENT_CURRENT | CHART_REQ_CLIENT_ALL_TIME)) && *line_parsed->req_client) { - - /* Invalid IP version */ - if(unlikely(!strcmp(line_parsed->req_client, WEB_LOG_INVALID_CLIENT_IP_STR))){ - if(parser_config->chart_config & CHART_IP_VERSION) metrics->ip_ver.invalid++; - } - - else if(strchr(line_parsed->req_client, ':')){ - /* IPv6 version */ - if(parser_config->chart_config & CHART_IP_VERSION) metrics->ip_ver.v6++; - - /* Unique Client IPv6 Address current poll */ - if(parser_config->chart_config & CHART_REQ_CLIENT_CURRENT){ - int i; - for(i = 0; i < metrics->req_clients_current_arr.ipv6_size; i++){ - if(!strcmp(metrics->req_clients_current_arr.ipv6_req_clients[i], line_parsed->req_client)) break; - } - if(metrics->req_clients_current_arr.ipv6_size == i){ // Req client not found in array - need to append - metrics->req_clients_current_arr.ipv6_size++; - metrics->req_clients_current_arr.ipv6_req_clients = reallocz(metrics->req_clients_current_arr.ipv6_req_clients, - metrics->req_clients_current_arr.ipv6_size * sizeof(*metrics->req_clients_current_arr.ipv6_req_clients)); - snprintf(metrics->req_clients_current_arr.ipv6_req_clients[metrics->req_clients_current_arr.ipv6_size - 1], - REQ_CLIENT_MAX_LEN, "%s", line_parsed->req_client); - } - } - - /* Unique Client IPv6 Address all-time */ - if(parser_config->chart_config & CHART_REQ_CLIENT_ALL_TIME){ - int i; - for(i = 0; i < metrics->req_clients_alltime_arr.ipv6_size; i++){ - if(!strcmp(metrics->req_clients_alltime_arr.ipv6_req_clients[i], line_parsed->req_client)) break; - } - if(metrics->req_clients_alltime_arr.ipv6_size == i){ // Req client not found in array - need to append - metrics->req_clients_alltime_arr.ipv6_size++; - metrics->req_clients_alltime_arr.ipv6_req_clients = reallocz(metrics->req_clients_alltime_arr.ipv6_req_clients, - metrics->req_clients_alltime_arr.ipv6_size * sizeof(*metrics->req_clients_alltime_arr.ipv6_req_clients)); - snprintf(metrics->req_clients_alltime_arr.ipv6_req_clients[metrics->req_clients_alltime_arr.ipv6_size - 1], - REQ_CLIENT_MAX_LEN, "%s", line_parsed->req_client); - } - } - } - - - else{ - /* IPv4 version */ - if(parser_config->chart_config & CHART_IP_VERSION) metrics->ip_ver.v4++; - - /* Unique Client IPv4 Address current poll */ - if(parser_config->chart_config & CHART_REQ_CLIENT_CURRENT){ - int i; - for(i = 0; i < metrics->req_clients_current_arr.ipv4_size; i++){ - if(!strcmp(metrics->req_clients_current_arr.ipv4_req_clients[i], line_parsed->req_client)) break; - } - if(metrics->req_clients_current_arr.ipv4_size == i){ // Req client not found in array - need to append - metrics->req_clients_current_arr.ipv4_size++; - metrics->req_clients_current_arr.ipv4_req_clients = reallocz(metrics->req_clients_current_arr.ipv4_req_clients, - metrics->req_clients_current_arr.ipv4_size * sizeof(*metrics->req_clients_current_arr.ipv4_req_clients)); - snprintf(metrics->req_clients_current_arr.ipv4_req_clients[metrics->req_clients_current_arr.ipv4_size - 1], - REQ_CLIENT_MAX_LEN, "%s", line_parsed->req_client); - } - } - - /* Unique Client IPv4 Address all-time */ - if(parser_config->chart_config & CHART_REQ_CLIENT_ALL_TIME){ - int i; - for(i = 0; i < metrics->req_clients_alltime_arr.ipv4_size; i++){ - if(!strcmp(metrics->req_clients_alltime_arr.ipv4_req_clients[i], line_parsed->req_client)) break; - } - if(metrics->req_clients_alltime_arr.ipv4_size == i){ // Req client not found in array - need to append - metrics->req_clients_alltime_arr.ipv4_size++; - metrics->req_clients_alltime_arr.ipv4_req_clients = reallocz(metrics->req_clients_alltime_arr.ipv4_req_clients, - metrics->req_clients_alltime_arr.ipv4_size * sizeof(*metrics->req_clients_alltime_arr.ipv4_req_clients)); - snprintf(metrics->req_clients_alltime_arr.ipv4_req_clients[metrics->req_clients_alltime_arr.ipv4_size - 1], - REQ_CLIENT_MAX_LEN, "%s", line_parsed->req_client); - } - } - } - } - - /* Extract request method */ - if(parser_config->chart_config & CHART_REQ_METHODS){ - for(int i = 0; i < REQ_METHOD_ARR_SIZE; i++){ - if(!strcmp(line_parsed->req_method, req_method_str[i])){ - metrics->req_method[i]++; - break; - } - } - } - - /* Extract request protocol */ - if(parser_config->chart_config & CHART_REQ_PROTO){ - if(!strcmp(line_parsed->req_proto, "1") || !strcmp(line_parsed->req_proto, "1.0")) metrics->req_proto.http_1++; - else if(!strcmp(line_parsed->req_proto, "1.1")) metrics->req_proto.http_1_1++; - else if(!strcmp(line_parsed->req_proto, "2") || !strcmp(line_parsed->req_proto, "2.0")) metrics->req_proto.http_2++; - else metrics->req_proto.other++; - } - - /* Extract bytes received and sent */ - if(parser_config->chart_config & CHART_BANDWIDTH){ - metrics->bandwidth.req_size += line_parsed->req_size; - metrics->bandwidth.resp_size += line_parsed->resp_size; - } - - /* Extract request processing time */ - if((parser_config->chart_config & CHART_REQ_PROC_TIME) && line_parsed->req_proc_time){ - if(line_parsed->req_proc_time < metrics->req_proc_time.min || metrics->req_proc_time.min == 0){ - metrics->req_proc_time.min = line_parsed->req_proc_time; - } - if(line_parsed->req_proc_time > metrics->req_proc_time.max || metrics->req_proc_time.max == 0){ - metrics->req_proc_time.max = line_parsed->req_proc_time; - } - metrics->req_proc_time.sum += line_parsed->req_proc_time; - metrics->req_proc_time.count++; - } - - /* Extract response code family, response code & response code type */ - if(parser_config->chart_config & (CHART_RESP_CODE_FAMILY | CHART_RESP_CODE | CHART_RESP_CODE_TYPE)){ - switch(line_parsed->resp_code / 100){ - /* Note: 304 and 401 should be treated as resp_success */ - case 1: - metrics->resp_code_family.resp_1xx++; - metrics->resp_code[line_parsed->resp_code - 100]++; - metrics->resp_code_type.resp_success++; - break; - case 2: - metrics->resp_code_family.resp_2xx++; - metrics->resp_code[line_parsed->resp_code - 100]++; - metrics->resp_code_type.resp_success++; - break; - case 3: - metrics->resp_code_family.resp_3xx++; - metrics->resp_code[line_parsed->resp_code - 100]++; - if(line_parsed->resp_code == 304) metrics->resp_code_type.resp_success++; - else metrics->resp_code_type.resp_redirect++; - break; - case 4: - metrics->resp_code_family.resp_4xx++; - metrics->resp_code[line_parsed->resp_code - 100]++; - if(line_parsed->resp_code == 401) metrics->resp_code_type.resp_success++; - else metrics->resp_code_type.resp_bad++; - break; - case 5: - metrics->resp_code_family.resp_5xx++; - metrics->resp_code[line_parsed->resp_code - 100]++; - metrics->resp_code_type.resp_error++; - break; - default: - metrics->resp_code_family.other++; - metrics->resp_code[RESP_CODE_ARR_SIZE - 1]++; - metrics->resp_code_type.other++; - break; - } - } - - /* Extract SSL protocol */ - if(parser_config->chart_config & CHART_SSL_PROTO){ - if(!strcmp(line_parsed->ssl_proto, "TLSv1")) metrics->ssl_proto.tlsv1++; - else if(!strcmp(line_parsed->ssl_proto, "TLSv1.1")) metrics->ssl_proto.tlsv1_1++; - else if(!strcmp(line_parsed->ssl_proto, "TLSv1.2")) metrics->ssl_proto.tlsv1_2++; - else if(!strcmp(line_parsed->ssl_proto, "TLSv1.3")) metrics->ssl_proto.tlsv1_3++; - else if(!strcmp(line_parsed->ssl_proto, "SSLv2")) metrics->ssl_proto.sslv2++; - else if(!strcmp(line_parsed->ssl_proto, "SSLv3")) metrics->ssl_proto.sslv3++; - else metrics->ssl_proto.other++; - } - - /* Extract SSL cipher suite */ - // TODO: Reduce number of reallocs - if((parser_config->chart_config & CHART_SSL_CIPHER) && *line_parsed->ssl_cipher){ - int i; - for(i = 0; i < metrics->ssl_cipher_arr.size; i++){ - if(!strcmp(metrics->ssl_cipher_arr.ssl_ciphers[i].name, line_parsed->ssl_cipher)){ - metrics->ssl_cipher_arr.ssl_ciphers[i].count++; - break; - } - } - if(metrics->ssl_cipher_arr.size == i){ // SSL cipher suite not found in array - need to append - metrics->ssl_cipher_arr.size++; - metrics->ssl_cipher_arr.ssl_ciphers = reallocz(metrics->ssl_cipher_arr.ssl_ciphers, - metrics->ssl_cipher_arr.size * sizeof(struct log_parser_metrics_ssl_cipher)); - snprintf( metrics->ssl_cipher_arr.ssl_ciphers[metrics->ssl_cipher_arr.size - 1].name, - SSL_CIPHER_SUITE_MAX_LEN, "%s", line_parsed->ssl_cipher); - metrics->ssl_cipher_arr.ssl_ciphers[metrics->ssl_cipher_arr.size - 1].count = 1; - } - } - - metrics->timestamp = line_parsed->timestamp; -} - -/** - * @brief Try to automatically detect the configuration for a web log parser. - * @details It tries to automatically detect the configuration to be used for - * a web log parser, by parsing a single web log line record and trying to pick - * a matching configuration (from a static list of predefined ones.) - * @param[in] line Null-terminated web log line to use in guessing the configuration. - * @param[in] delimiter Delimiter used to break down \p line in separate fields. - * @returns Pointer to the web log parser configuration if automatic detection - * was sucessful, otherwise NULL. - */ -Web_log_parser_config_t *auto_detect_web_log_parser_config(char *line, const char delimiter){ - for(int i = 0; csv_auto_format_guess_matrix[i] != NULL; i++){ - Web_log_parser_config_t *wblp_config = read_web_log_parser_config(csv_auto_format_guess_matrix[i], delimiter); - if(count_fields(line, delimiter) == wblp_config->num_fields){ - wblp_config->verify_parsed_logs = 1; // Verification must be turned on to be able to pick up parsing_errors - Log_line_parsed_t line_parsed = (Log_line_parsed_t) {0}; - parse_web_log_line(wblp_config, line, strlen(line), &line_parsed); - if(line_parsed.parsing_errors == 0){ - return wblp_config; - } - } - - freez(wblp_config->fields); - freez(wblp_config); - } - return NULL; -} diff --git a/src/logsmanagement/parser.h b/src/logsmanagement/parser.h deleted file mode 100644 index c0cf284b1..000000000 --- a/src/logsmanagement/parser.h +++ /dev/null @@ -1,436 +0,0 @@ -// SPDX-License-Identifier: GPL-3.0-or-later - -/** @file parser.h - * @brief Header of parser.c - */ - -#ifndef PARSER_H_ -#define PARSER_H_ - -#include <regex.h> -#include "daemon/common.h" -#include "libnetdata/libnetdata.h" - -// Forward decleration -typedef struct log_parser_metrics Log_parser_metrics_t; - - -/* -------------------------------------------------------------------------- */ -/* Configuration-related */ -/* -------------------------------------------------------------------------- */ - -typedef enum{ - - CHART_COLLECTED_LOGS_TOTAL = 1 << 0, - CHART_COLLECTED_LOGS_RATE = 1 << 1, - - /* FLB_WEB_LOG charts */ - CHART_VHOST = 1 << 2, - CHART_PORT = 1 << 3, - CHART_IP_VERSION = 1 << 4, - CHART_REQ_CLIENT_CURRENT = 1 << 5, - CHART_REQ_CLIENT_ALL_TIME = 1 << 6, - CHART_REQ_METHODS = 1 << 7, - CHART_REQ_PROTO = 1 << 8, - CHART_BANDWIDTH = 1 << 9, - CHART_REQ_PROC_TIME = 1 << 10, - CHART_RESP_CODE_FAMILY = 1 << 11, - CHART_RESP_CODE = 1 << 12, - CHART_RESP_CODE_TYPE = 1 << 13, - CHART_SSL_PROTO = 1 << 14, - CHART_SSL_CIPHER = 1 << 15, - - /* FLB_SYSTEMD or FLB_SYSLOG charts */ - CHART_SYSLOG_PRIOR = 1 << 16, - CHART_SYSLOG_SEVER = 1 << 17, - CHART_SYSLOG_FACIL = 1 << 18, - - /* FLB_KMSG charts */ - CHART_KMSG_SUBSYSTEM = 1 << 19, - CHART_KMSG_DEVICE = 1 << 20, - - /* FLB_DOCKER_EV charts */ - CHART_DOCKER_EV_TYPE = 1 << 21, - CHART_DOCKER_EV_ACTION = 1 << 22, - - /* FLB_MQTT charts*/ - CHART_MQTT_TOPIC = 1 << 23 - -} chart_type_t; - -typedef struct log_parser_config{ - void *gen_config; /**< Pointer to (optional) generic configuration, as per use case. */ - unsigned long int chart_config; /**< Configuration of which charts to enable according to chart_type_t **/ -} Log_parser_config_t; - -/* -------------------------------------------------------------------------- */ - - -/* -------------------------------------------------------------------------- */ -/* Web Log parsing and metrics */ -/* -------------------------------------------------------------------------- */ - -#define VHOST_MAX_LEN 255 /**< Max vhost string length, inclding terminating \0 **/ -#define PORT_MAX_LEN 6 /**< Max port string length, inclding terminating \0 **/ -#define REQ_SCHEME_MAX_LEN 6 /**< Max request scheme length, including terminating \0 **/ -#define REQ_CLIENT_MAX_LEN 46 /**< https://superuser.com/questions/381022/how-many-characters-can-an-ip-address-be#comment2219013_381029 **/ -#define REQ_METHOD_MAX_LEN 18 /**< Max request method length, including terminating \0 **/ -#define REQ_URL_MAX_LEN 128 /**< Max request URL length, including terminating \0 **/ -#define REQ_PROTO_PREF_SIZE (sizeof("HTTP/") - 1) -#define REQ_PROTO_MAX_LEN 4 /**< Max request protocol numerical part length, including terminating \0 **/ -#define REQ_SIZE_MAX_LEN 11 /**< Max size of bytes received, including terminating \0 **/ -#define REQ_PROC_TIME_MAX_LEN 11 /**< Max size of request processing time, including terminating \0 **/ -#define REQ_RESP_CODE_MAX_LEN 4 /**< Max size of response code, including terminating \0 **/ -#define REQ_RESP_SIZE_MAX_LEN 11 /**< Max size of request response size, including terminating \0 **/ -#define UPS_RESP_TIME_MAX_LEN 10 /**< Max size of upstream response time, including terminating \0 **/ -#define SSL_PROTO_MAX_LEN 8 /**< Max SSL protocol length, inclding terminating \0 **/ -#define SSL_CIPHER_SUITE_MAX_LEN 256 /**< TODO: Check max len for ssl cipher suite string is indeed 256 **/ - -#define RESP_CODE_ARR_SIZE 501 /**< Size of resp_code array, assuming 500 valid resp codes + 1 for "other" **/ - -#define WEB_LOG_INVALID_HOST_STR "invalid" -#define WEB_LOG_INVALID_PORT -1 -#define WEB_LOG_INVALID_PORT_STR "inv" -#define WEB_LOG_INVALID_CLIENT_IP_STR WEB_LOG_INVALID_PORT_STR - -/* Web log configuration */ -#define ENABLE_PARSE_WEB_LOG_LINE_DEBUG 0 - -#define VHOST_BUFFS_SCALE_FACTOR 1.5 -#define PORT_BUFFS_SCALE_FACTOR 8 // Unlike Vhosts, ports are stored as integers, so scale factor can be bigger - - -typedef enum{ - VHOST_WITH_PORT, // nginx: $host:$server_port apache: %v:%p - VHOST, // nginx: $host ($http_host) apache: %v - PORT, // nginx: $server_port apache: %p - REQ_SCHEME, // nginx: $scheme apache: - - REQ_CLIENT, // nginx: $remote_addr apache: %a (%h) - REQ, // nginx: $request apache: %r - REQ_METHOD, // nginx: $request_method apache: %m - REQ_URL, // nginx: $request_uri apache: %U - REQ_PROTO, // nginx: $server_protocol apache: %H - REQ_SIZE, // nginx: $request_length apache: %I - REQ_PROC_TIME, // nginx: $request_time apache: %D - RESP_CODE, // nginx: $status apache: %s, %>s - RESP_SIZE, // nginx: $bytes_sent, $body_bytes_sent apache: %b, %O, %B // TODO: Should separate %b from %O ? - UPS_RESP_TIME, // nginx: $upstream_response_time apache: - - SSL_PROTO, // nginx: $ssl_protocol apache: - - SSL_CIPHER_SUITE, // nginx: $ssl_cipher apache: - - TIME, // nginx: $time_local apache: %t - CUSTOM -} web_log_line_field_t; - -typedef struct web_log_parser_config{ - web_log_line_field_t *fields; - int num_fields; /**< Number of strings in the fields array. **/ - char delimiter; /**< Delimiter that separates the fields in the log format. **/ - int verify_parsed_logs; /**< Boolean whether to try and verify parsed log fields or not **/ - int skip_timestamp_parsing; /**< Boolean whether to skip parsing of timestamp fields **/ -} Web_log_parser_config_t; - -static const char *const req_method_str[] = { - "ACL", - "BASELINE-CONTROL", - "BIND", - "CHECKIN", - "CHECKOUT", - "CONNECT", - "COPY", - "DELETE", - "GET", - "HEAD", - "LABEL", - "LINK", - "LOCK", - "MERGE", - "MKACTIVITY", - "MKCALENDAR", - "MKCOL", - "MKREDIRECTREF", - "MKWORKSPACE", - "MOVE", - "OPTIONS", - "ORDERPATCH", - "PATCH", - "POST", - "PRI", - "PROPFIND", - "PROPPATCH", - "PUT", - "REBIND", - "REPORT", - "SEARCH", - "TRACE", - "UNBIND", - "UNCHECKOUT", - "UNLINK", - "UNLOCK", - "UPDATE", - "UPDATEREDIRECTREF", - "-" -}; - -#define REQ_METHOD_ARR_SIZE (int)(sizeof(req_method_str) / sizeof(req_method_str[0])) - -typedef struct web_log_metrics{ - /* Web log metrics */ - struct log_parser_metrics_vhosts_array{ - struct log_parser_metrics_vhost{ - char name[VHOST_MAX_LEN]; /**< Name of the vhost **/ - int count; /**< Occurences of the vhost **/ - } *vhosts; - int size; /**< Size of vhosts array **/ - int size_max; - } vhost_arr; - struct log_parser_metrics_ports_array{ - struct log_parser_metrics_port{ - char name[PORT_MAX_LEN]; /**< Number of port in str */ - int port; /**< Number of port **/ - int count; /**< Occurences of the port **/ - } *ports; - int size; /**< Size of ports array **/ - int size_max; - } port_arr; - struct log_parser_metrics_ip_ver{ - int v4, v6, invalid; - } ip_ver; - /**< req_clients_current_arr is used by parser.c to save unique client IPs - * extracted per circular buffer item and also in p_file_info to save unique - * client IPs per collection (poll) iteration of plugin_logsmanagement.c. - * req_clients_alltime_arr is used in p_file_info to save unique client IPs - * of all time (and so ipv4_size and ipv6_size can only grow and are never reset to 0). **/ - struct log_parser_metrics_req_clients_array{ - char (*ipv4_req_clients)[REQ_CLIENT_MAX_LEN]; - int ipv4_size; - int ipv4_size_max; - char (*ipv6_req_clients)[REQ_CLIENT_MAX_LEN]; - int ipv6_size; - int ipv6_size_max; - } req_clients_current_arr, req_clients_alltime_arr; - int req_method[REQ_METHOD_ARR_SIZE]; - struct log_parser_metrics_req_proto{ - int http_1, http_1_1, http_2, other; - } req_proto; - struct log_parser_metrics_bandwidth{ - long long req_size, resp_size; - } bandwidth; - struct log_parser_metrics_req_proc_time{ - int min, max, sum, count; - } req_proc_time; - struct log_parser_metrics_resp_code_family{ - int resp_1xx, resp_2xx, resp_3xx, resp_4xx, resp_5xx, other; // TODO: Can there be "other"? - } resp_code_family; - /**< Array counting occurences of response codes. Each item represents the - * respective response code by adding 100 to its index, e.g. resp_code[102] - * counts how many 202 codes were detected. 501st item represents "other" */ - unsigned int resp_code[RESP_CODE_ARR_SIZE]; - struct log_parser_metrics_resp_code_type{ /* Note: 304 and 401 should be treated as resp_success */ - int resp_success, resp_redirect, resp_bad, resp_error, other; // TODO: Can there be "other"? - } resp_code_type; - struct log_parser_metrics_ssl_proto{ - int tlsv1, tlsv1_1, tlsv1_2, tlsv1_3, sslv2, sslv3, other; - } ssl_proto; - struct log_parser_metrics_ssl_cipher_array{ - struct log_parser_metrics_ssl_cipher{ - char name[SSL_CIPHER_SUITE_MAX_LEN]; /**< SSL cipher suite string **/ - int count; /**< Occurences of the SSL cipher **/ - } *ssl_ciphers; - int size; /**< Size of SSL ciphers array **/ - } ssl_cipher_arr; - int64_t timestamp; -} Web_log_metrics_t; - -typedef struct log_line_parsed{ - char vhost[VHOST_MAX_LEN]; - int port; - char req_scheme[REQ_SCHEME_MAX_LEN]; - char req_client[REQ_CLIENT_MAX_LEN]; - char req_method[REQ_METHOD_MAX_LEN]; - char req_URL[REQ_URL_MAX_LEN]; - char req_proto[REQ_PROTO_MAX_LEN]; - int req_size; - int req_proc_time; - int resp_code; - int resp_size; - int ups_resp_time; - char ssl_proto[SSL_PROTO_MAX_LEN]; - char ssl_cipher[SSL_CIPHER_SUITE_MAX_LEN]; - int64_t timestamp; - int parsing_errors; -} Log_line_parsed_t; - -Web_log_parser_config_t *read_web_log_parser_config(const char *log_format, const char delimiter); -#ifdef ENABLE_LOGSMANAGEMENT_TESTS -/* Used as public only for unit testing, normally defined as static */ -int count_fields(const char *line, const char delimiter); -#endif // ENABLE_LOGSMANAGEMENT_TESTS -void parse_web_log_line(const Web_log_parser_config_t *wblp_config, - char *line, const size_t line_len, - Log_line_parsed_t *log_line_parsed); -void extract_web_log_metrics(Log_parser_config_t *parser_config, - Log_line_parsed_t *line_parsed, - Web_log_metrics_t *metrics); -Web_log_parser_config_t *auto_detect_web_log_parser_config(char *line, const char delimiter); - -/* -------------------------------------------------------------------------- */ - - -/* -------------------------------------------------------------------------- */ -/* Kernel logs (kmsg) metrics */ -/* -------------------------------------------------------------------------- */ - -#define SYSLOG_SEVER_ARR_SIZE 9 /**< Number of severity levels plus 1 for 'unknown' **/ - -typedef struct metrics_dict_item{ - bool dim_initialized; - int num; - int num_new; -} metrics_dict_item_t; - -typedef struct kernel_metrics{ - unsigned int sever[SYSLOG_SEVER_ARR_SIZE]; /**< Syslog severity, 0-7 plus 1 space for 'unknown' **/ - DICTIONARY *subsystem; - DICTIONARY *device; -} Kernel_metrics_t; - -/* -------------------------------------------------------------------------- */ - - -/* -------------------------------------------------------------------------- */ -/* Systemd and Syslog metrics */ -/* -------------------------------------------------------------------------- */ - -#define SYSLOG_FACIL_ARR_SIZE 25 /**< Number of facility levels plus 1 for 'unknown' **/ -#define SYSLOG_PRIOR_ARR_SIZE 193 /**< Number of priority values plus 1 for 'unknown' **/ - -typedef struct systemd_metrics{ - unsigned int sever[SYSLOG_SEVER_ARR_SIZE]; /**< Syslog severity, 0-7 plus 1 space for 'unknown' **/ - unsigned int facil[SYSLOG_FACIL_ARR_SIZE]; /**< Syslog facility, 0-23 plus 1 space for 'unknown' **/ - unsigned int prior[SYSLOG_PRIOR_ARR_SIZE]; /**< Syslog priority value, 0-191 plus 1 space for 'unknown' **/ -} Systemd_metrics_t; - -/* -------------------------------------------------------------------------- */ - - -/* -------------------------------------------------------------------------- */ -/* Docker Events metrics */ -/* -------------------------------------------------------------------------- */ - -static const char *const docker_ev_type_string[] = { - "container", "image", "plugin", "volume", "network", "daemon", "service", "node", "secret", "config", "unknown" -}; - -#define NUM_OF_DOCKER_EV_TYPES ((int) (sizeof docker_ev_type_string / sizeof docker_ev_type_string[0])) - -#define NUM_OF_CONTAINER_ACTIONS 25 /**< == size of 'Containers actions' array, largest array in docker_ev_action_string **/ - -static const char *const docker_ev_action_string[NUM_OF_DOCKER_EV_TYPES][NUM_OF_CONTAINER_ACTIONS] = { - /* Order of arrays is important, it must match the order of docker_ev_type_string[] strings. */ - - /* Containers actions */ - {"attach", "commit", "copy", "create", "destroy", "detach", "die", "exec_create", "exec_detach", "exec_die", - "exec_start", "export", "health_status", "kill", "oom", "pause", "rename", "resize", "restart", "start", "stop", - "top", "unpause", "update", NULL}, - - /* Images actions */ - {"delete", "import", "load", "pull", "push", "save", "tag", "untag", NULL}, - - /* Plugins actions */ - {"enable", "disable", "install", "remove", NULL}, - - /* Volumes actions */ - {"create", "destroy", "mount", "unmount", NULL}, - - /* Networks actions */ - {"create", "connect", "destroy", "disconnect", "remove", NULL}, - - /* Daemons actions */ - {"reload", NULL}, - - /* Services actions */ - {"create", "remove", "update", NULL}, - - /* Nodes actions */ - {"create", "remove", "update", NULL}, - - /* Secrets actions */ - {"create", "remove", "update", NULL}, - - /* Configs actions */ - {"create", "remove", "update", NULL}, - - {"unknown", NULL} -}; - -typedef struct docker_ev_metrics{ - unsigned int ev_type[NUM_OF_DOCKER_EV_TYPES]; - unsigned int ev_action[NUM_OF_DOCKER_EV_TYPES][NUM_OF_CONTAINER_ACTIONS]; -} Docker_ev_metrics_t; - -/* -------------------------------------------------------------------------- */ - - -/* -------------------------------------------------------------------------- */ -/* MQTT metrics */ -/* -------------------------------------------------------------------------- */ - -typedef struct mqtt_metrics{ - DICTIONARY *topic; -} Mqtt_metrics_t; - -/* -------------------------------------------------------------------------- */ - - -/* -------------------------------------------------------------------------- */ -/* Regex / Keyword search */ -/* -------------------------------------------------------------------------- */ - -#define MAX_KEYWORD_LEN 100 /**< Max size of keyword used in keyword search, in bytes */ -#define MAX_REGEX_SIZE MAX_KEYWORD_LEN + 7 /**< Max size of regular expression (used in keyword search) in bytes **/ - -int search_keyword( char *src, size_t src_sz, - char *dest, size_t *dest_sz, - const char *keyword, regex_t *regex, - const int ignore_case); - -/* -------------------------------------------------------------------------- */ - - -/* -------------------------------------------------------------------------- */ -/* Custom Charts configuration and metrics */ -/* -------------------------------------------------------------------------- */ - -typedef struct log_parser_cus_config{ - char *chartname; /**< Chart name where the regex metrics will appear in **/ - char *regex_str; /**< String representation of the regex **/ - char *regex_name; /**< If regex is named, this is where its name is stored **/ - regex_t regex; /**< The compiled regex **/ -} Log_parser_cus_config_t; - -typedef struct log_parser_cus_metrics{ - unsigned long long count; -} Log_parser_cus_metrics_t; - -/* -------------------------------------------------------------------------- */ - - -/* -------------------------------------------------------------------------- */ -/* General / Other */ -/* -------------------------------------------------------------------------- */ - -struct log_parser_metrics{ - unsigned long long num_lines; - // struct timeval tv; - time_t last_update; - union { - Web_log_metrics_t *web_log; - Kernel_metrics_t *kernel; - Systemd_metrics_t *systemd; - Docker_ev_metrics_t *docker_ev; - Mqtt_metrics_t *mqtt; - }; - Log_parser_cus_metrics_t **parser_cus; /**< Array storing custom chart metrics structs **/ -} ; - -#endif // PARSER_H_ diff --git a/src/logsmanagement/query.c b/src/logsmanagement/query.c deleted file mode 100644 index c98e0ccc3..000000000 --- a/src/logsmanagement/query.c +++ /dev/null @@ -1,238 +0,0 @@ -// SPDX-License-Identifier: GPL-3.0-or-later - -/** @file query.c - * - * @brief This is the file containing the implementation of the - * logs management querying API. - */ - -#ifndef _GNU_SOURCE -#define _GNU_SOURCE -#endif - -#include "query.h" -#include <uv.h> -#include <sys/resource.h> -#include "circular_buffer.h" -#include "db_api.h" -#include "file_info.h" -#include "helper.h" - -static const char esc_ch[] = "[]\\^$.|?*+(){}"; - -/** - * @brief Sanitise string to work with regular expressions - * @param[in] s Input string to be sanitised - will not be modified - * @return Sanitised string (escaped characters according to esc_ch[] array) - */ -UNIT_STATIC char *sanitise_string(char *const s){ - size_t s_len = strlen(s); - /* Truncate keyword if longer than maximum allowed length */ - if(unlikely(s_len > MAX_KEYWORD_LEN)){ - s_len = MAX_KEYWORD_LEN; - s[s_len] = '\0'; - } - char *s_san = mallocz(s_len * 2); - - char *s_off = s; - char *s_san_off = s_san; - while(*s_off) { - for(char *esc_ch_off = (char *) esc_ch; *esc_ch_off; esc_ch_off++){ - if(*s_off == *esc_ch_off){ - *s_san_off++ = '\\'; - break; - } - } - *s_san_off++ = *s_off++; - } - *s_san_off = '\0'; - return s_san; -} - -const logs_qry_res_err_t *fetch_log_sources(BUFFER *wb){ - if(unlikely(!p_file_infos_arr || !p_file_infos_arr->count)) - return &logs_qry_res_err[LOGS_QRY_RES_ERR_CODE_SERVER_ERR]; - - buffer_json_add_array_item_object(wb); - buffer_json_member_add_string(wb, "id", "all"); - buffer_json_member_add_string(wb, "name", "all"); - buffer_json_member_add_string(wb, "pill", "100"); // TODO - - buffer_json_member_add_string(wb, "info", "All log sources"); - - buffer_json_member_add_string(wb, "basename", ""); - buffer_json_member_add_string(wb, "filename", ""); - buffer_json_member_add_string(wb, "log_type", ""); - buffer_json_member_add_string(wb, "db_dir", ""); - buffer_json_member_add_uint64(wb, "db_version", 0); - buffer_json_member_add_uint64(wb, "db_flush_freq", 0); - buffer_json_member_add_int64( wb, "db_disk_space_limit", 0); - buffer_json_object_close(wb); // options object - - bool queryable_sources = false; - for (int i = 0; i < p_file_infos_arr->count; i++) { - if(p_file_infos_arr->data[i]->db_mode == LOGS_MANAG_DB_MODE_FULL) - queryable_sources = true; - } - - if(!queryable_sources) - return &logs_qry_res_err[LOGS_QRY_RES_ERR_CODE_NOT_FOUND_ERR]; - - for (int i = 0; i < p_file_infos_arr->count; i++) { - buffer_json_add_array_item_object(wb); - buffer_json_member_add_string(wb, "id", p_file_infos_arr->data[i]->chartname); - buffer_json_member_add_string(wb, "name", p_file_infos_arr->data[i]->chartname); - buffer_json_member_add_string(wb, "pill", "100"); // TODO - - char info[1024]; - snprintfz(info, sizeof(info), "Chart '%s' from log source '%s'", - p_file_infos_arr->data[i]->chartname, - p_file_infos_arr->data[i]->file_basename); - - buffer_json_member_add_string(wb, "info", info); - - buffer_json_member_add_string(wb, "basename", p_file_infos_arr->data[i]->file_basename); - buffer_json_member_add_string(wb, "filename", p_file_infos_arr->data[i]->filename); - buffer_json_member_add_string(wb, "log_type", log_src_type_t_str[p_file_infos_arr->data[i]->log_type]); - buffer_json_member_add_string(wb, "db_dir", p_file_infos_arr->data[i]->db_dir); - buffer_json_member_add_int64(wb, "db_version", db_user_version(p_file_infos_arr->data[i]->db, -1)); - buffer_json_member_add_int64(wb, "db_flush_freq", db_user_version(p_file_infos_arr->data[i]->db, -1)); - buffer_json_member_add_int64( wb, "db_disk_space_limit", p_file_infos_arr->data[i]->blob_max_size * BLOB_MAX_FILES); - buffer_json_object_close(wb); // options object - } - - return &logs_qry_res_err[LOGS_QRY_RES_ERR_CODE_OK]; -} - -bool terminate_logs_manag_query(logs_query_params_t *const p_query_params){ - if(p_query_params->cancelled && __atomic_load_n(p_query_params->cancelled, __ATOMIC_RELAXED)) { - return true; - } - - if(now_monotonic_usec() > __atomic_load_n(p_query_params->stop_monotonic_ut, __ATOMIC_RELAXED)) - return true; - - return false; -} - -const logs_qry_res_err_t *execute_logs_manag_query(logs_query_params_t *p_query_params) { - struct File_info *p_file_infos[LOGS_MANAG_MAX_COMPOUND_QUERY_SOURCES] = {NULL}; - - /* Check all required query parameters are present */ - if(unlikely(!p_query_params->req_from_ts || !p_query_params->req_to_ts)) - return &logs_qry_res_err[LOGS_QRY_RES_ERR_CODE_INV_TS_ERR]; - - /* Start with maximum possible actual timestamp range and reduce it - * accordingly when searching DB and circular buffer. */ - p_query_params->act_from_ts = p_query_params->req_from_ts; - p_query_params->act_to_ts = p_query_params->req_to_ts; - - if(p_file_infos_arr == NULL) - return &logs_qry_res_err[LOGS_QRY_RES_ERR_CODE_NOT_INIT_ERR]; - - /* Find p_file_infos for this query according to chartnames or filenames - * if the former is not valid. Only one of the two will be used, - * charts_names and filenames cannot be mixed. - * If neither list is provided, search all available log sources. */ - if(p_query_params->chartname[0]){ - int pfi_off = 0; - for(int cn_off = 0; p_query_params->chartname[cn_off]; cn_off++) { - for(int pfi_arr_off = 0; pfi_arr_off < p_file_infos_arr->count; pfi_arr_off++) { - if( !strcmp(p_file_infos_arr->data[pfi_arr_off]->chartname, p_query_params->chartname[cn_off]) && - p_file_infos_arr->data[pfi_arr_off]->db_mode != LOGS_MANAG_DB_MODE_NONE) { - p_file_infos[pfi_off++] = p_file_infos_arr->data[pfi_arr_off]; - break; - } - } - } - } - else if(p_query_params->filename[0]){ - int pfi_off = 0; - for(int fn_off = 0; p_query_params->filename[fn_off]; fn_off++) { - for(int pfi_arr_off = 0; pfi_arr_off < p_file_infos_arr->count; pfi_arr_off++) { - if( !strcmp(p_file_infos_arr->data[pfi_arr_off]->filename, p_query_params->filename[fn_off]) && - p_file_infos_arr->data[pfi_arr_off]->db_mode != LOGS_MANAG_DB_MODE_NONE) { - p_file_infos[pfi_off++] = p_file_infos_arr->data[pfi_arr_off]; - break; - } - } - } - } - else{ - int pfi_off = 0; - for(int pfi_arr_off = 0; pfi_arr_off < p_file_infos_arr->count; pfi_arr_off++) { - if(p_file_infos_arr->data[pfi_arr_off]->db_mode != LOGS_MANAG_DB_MODE_NONE) - p_file_infos[pfi_off++] = p_file_infos_arr->data[pfi_arr_off]; - } - } - - if(unlikely(!p_file_infos[0])) - return &logs_qry_res_err[LOGS_QRY_RES_ERR_CODE_NOT_FOUND_ERR]; - - - if( p_query_params->sanitize_keyword && p_query_params->keyword && - *p_query_params->keyword && strcmp(p_query_params->keyword, " ")){ - p_query_params->keyword = sanitise_string(p_query_params->keyword); // freez(p_query_params->keyword) in this case - } - - struct rusage ru_start, ru_end; - getrusage(RUSAGE_THREAD, &ru_start); - - /* Secure DB lock to ensure no data will be transferred from the buffers to - * the DB during the query execution and also no other execute_logs_manag_query - * will try to access the DB at the same time. The operations happen - * atomically and the DB searches in series. */ - for(int pfi_off = 0; p_file_infos[pfi_off]; pfi_off++) - uv_mutex_lock(p_file_infos[pfi_off]->db_mut); - - /* If results are requested in ascending timestamp order, search DB(s) first - * and then the circular buffers. Otherwise, search the circular buffers - * first and the DB(s) second. In both cases, the quota must be respected. */ - if(p_query_params->order_by_asc) - db_search(p_query_params, p_file_infos); - - if( p_query_params->results_buff->len < p_query_params->quota && - !terminate_logs_manag_query(p_query_params)) - circ_buff_search(p_query_params, p_file_infos); - - if(!p_query_params->order_by_asc && - p_query_params->results_buff->len < p_query_params->quota && - !terminate_logs_manag_query(p_query_params)) - db_search(p_query_params, p_file_infos); - - for(int pfi_off = 0; p_file_infos[pfi_off]; pfi_off++) - uv_mutex_unlock(p_file_infos[pfi_off]->db_mut); - - getrusage(RUSAGE_THREAD, &ru_end); - - __atomic_add_fetch(&p_file_infos[0]->cpu_time_per_mib.user, - p_query_params->results_buff->len ? ( ru_end.ru_utime.tv_sec * USEC_PER_SEC - - ru_start.ru_utime.tv_sec * USEC_PER_SEC + - ru_end.ru_utime.tv_usec - - ru_start.ru_utime.tv_usec ) * (1 MiB) / p_query_params->results_buff->len : 0 - , __ATOMIC_RELAXED); - - __atomic_add_fetch(&p_file_infos[0]->cpu_time_per_mib.sys, - p_query_params->results_buff->len ? ( ru_end.ru_stime.tv_sec * USEC_PER_SEC - - ru_start.ru_stime.tv_sec * USEC_PER_SEC + - ru_end.ru_stime.tv_usec - - ru_start.ru_stime.tv_usec ) * (1 MiB) / p_query_params->results_buff->len : 0 - , __ATOMIC_RELAXED); - - /* If keyword has been sanitised, it needs to be freed - otherwise it's just a pointer to a substring */ - if(p_query_params->sanitize_keyword && p_query_params->keyword){ - freez(p_query_params->keyword); - } - - if(terminate_logs_manag_query(p_query_params)){ - return (p_query_params->cancelled && - __atomic_load_n(p_query_params->cancelled, __ATOMIC_RELAXED)) ? - &logs_qry_res_err[LOGS_QRY_RES_ERR_CODE_CANCELLED] /* cancelled */ : - &logs_qry_res_err[LOGS_QRY_RES_ERR_CODE_TIMEOUT] /* timed out */ ; - } - - if(!p_query_params->results_buff->len) - return &logs_qry_res_err[LOGS_QRY_RES_ERR_CODE_NOT_FOUND_ERR]; - - return &logs_qry_res_err[LOGS_QRY_RES_ERR_CODE_OK]; -} diff --git a/src/logsmanagement/query.h b/src/logsmanagement/query.h deleted file mode 100644 index a9da4368a..000000000 --- a/src/logsmanagement/query.h +++ /dev/null @@ -1,157 +0,0 @@ -// SPDX-License-Identifier: GPL-3.0-or-later - -/** @file query.h - * @brief Header of query.c - */ - -#ifndef QUERY_H_ -#define QUERY_H_ - -#include <inttypes.h> -#include <stdlib.h> -#include "libnetdata/libnetdata.h" -#include "defaults.h" - -#define LOGS_QRY_VERSION "1" - -#define LOGS_MANAG_FUNC_PARAM_AFTER "after" -#define LOGS_MANAG_FUNC_PARAM_BEFORE "before" -#define LOGS_QRY_KW_QUOTA "quota" -#define LOGS_QRY_KW_CHARTNAME "chartname" -#define LOGS_QRY_KW_FILENAME "filename" -#define LOGS_QRY_KW_KEYWORD "keyword" -#define LOGS_QRY_KW_IGNORE_CASE "ignore_case" -#define LOGS_QRY_KW_SANITIZE_KW "sanitize_keyword" - -typedef struct { - const enum {LOGS_QRY_RES_ERR_CODE_OK = 0, - LOGS_QRY_RES_ERR_CODE_INV_TS_ERR, - LOGS_QRY_RES_ERR_CODE_NOT_FOUND_ERR, - LOGS_QRY_RES_ERR_CODE_NOT_INIT_ERR, - LOGS_QRY_RES_ERR_CODE_SERVER_ERR, - LOGS_QRY_RES_ERR_CODE_UNMODIFIED, - LOGS_QRY_RES_ERR_CODE_CANCELLED, - LOGS_QRY_RES_ERR_CODE_TIMEOUT } err_code; - char const *const err_str; - const int http_code; -} logs_qry_res_err_t; - -static const logs_qry_res_err_t logs_qry_res_err[] = { - { LOGS_QRY_RES_ERR_CODE_OK, "success", HTTP_RESP_OK }, - { LOGS_QRY_RES_ERR_CODE_INV_TS_ERR, "invalid timestamp range", HTTP_RESP_BAD_REQUEST }, - { LOGS_QRY_RES_ERR_CODE_NOT_FOUND_ERR, "no results found", HTTP_RESP_OK }, - { LOGS_QRY_RES_ERR_CODE_NOT_INIT_ERR, "logs management engine not running", HTTP_RESP_SERVICE_UNAVAILABLE }, - { LOGS_QRY_RES_ERR_CODE_SERVER_ERR, "server error", HTTP_RESP_INTERNAL_SERVER_ERROR }, - { LOGS_QRY_RES_ERR_CODE_UNMODIFIED, "not modified", HTTP_RESP_NOT_MODIFIED }, - { LOGS_QRY_RES_ERR_CODE_CANCELLED, "cancelled", HTTP_RESP_CLIENT_CLOSED_REQUEST }, - { LOGS_QRY_RES_ERR_CODE_TIMEOUT, "query timed out", HTTP_RESP_OK } -}; - -const logs_qry_res_err_t *fetch_log_sources(BUFFER *wb); - - -/** - * @brief Parameters of the query. - * @param req_from_ts Requested start timestamp of query in epoch - * milliseconds. - * - * @param req_to_ts Requested end timestamp of query in epoch milliseconds. - * If it doesn't match the requested start timestamp, there may be more results - * to be retrieved (for descending timestamp order queries). - * - * @param act_from_ts Actual start timestamp of query in epoch milliseconds. - * - * @param act_to_ts Actual end timestamp of query in epoch milliseconds. - * If it doesn't match the requested end timestamp, there may be more results to - * be retrieved (for ascending timestamp order queries). - * - * @param order_by_asc Equal to 1 if req_from_ts <= req_to_ts, otherwise 0. - * - * @param quota Request quota for results. When exceeded, query will - * return, even if there are more pending results. - * - * @param stop_monotonic_ut Monotonic time in usec after which the query - * will be timed out. - * - * @param chartname Chart name of log source to be queried, as it appears - * on the netdata dashboard. If this is defined and not an empty string, the - * filename parameter is ignored. - * - * @param filename Full path of log source to be queried. Will only be used - * if the chartname is not used. - * - * @param keyword The keyword to be searched. IMPORTANT! Regular expressions - * are supported (if sanitize_keyword is not set) but have not been tested - * extensively, so use with caution! - * - * @param ignore_case If set to any integer other than 0, the query will be - * case-insensitive. If not set or if set to 0, the query will be case-sensitive - * - * @param sanitize_keyword If set to any integer other than 0, the keyword - * will be sanitized before used by the regex engine (which means the keyword - * cannot be a regular expression, as it will be taken as a literal input). - * - * @param results_buff Buffer of BUFFER type to store the results of the - * query in. - * - * @param results_buff->size Defines the maximum quota of results to be - * expected. If exceeded, the query will return the results obtained so far. - * - * @param results_buff->len The exact size of the results matched. - * - * @param results_buff->buffer String containing the results of the query. - * - * @param num_lines Number of log records that match the keyword. - * - * @warning results_buff->size argument must be <= MAX_LOG_MSG_SIZE. - */ -typedef struct logs_query_params { - msec_t req_from_ts; - msec_t req_to_ts; - msec_t act_from_ts; - msec_t act_to_ts; - int order_by_asc; - unsigned long quota; - bool *cancelled; - usec_t *stop_monotonic_ut; - char *chartname[LOGS_MANAG_MAX_COMPOUND_QUERY_SOURCES]; - char *filename[LOGS_MANAG_MAX_COMPOUND_QUERY_SOURCES]; - char *keyword; - int ignore_case; - int sanitize_keyword; - BUFFER *results_buff; - unsigned long num_lines; -} logs_query_params_t; - -typedef struct logs_query_res_hdr { - msec_t timestamp; - size_t text_size; - int matches; - char log_source[20]; - char log_type[20]; - char basename[20]; - char filename[50]; - char chartname[20]; -} logs_query_res_hdr_t; - -/** - * @brief Check if query should be terminated. - * @param p_query_params See documentation of logs_query_params_t struct. - * @return true if query should be terminated of false otherwise. -*/ -bool terminate_logs_manag_query(logs_query_params_t *p_query_params); - -/** - * @brief Primary query API. - * @param p_query_params See documentation of logs_query_params_t struct. - * @return enum of LOGS_QRY_RES_ERR_CODE with result of query - * @todo Cornercase if filename not found in DB? Return specific message? - */ -const logs_qry_res_err_t *execute_logs_manag_query(logs_query_params_t *p_query_params); - -#ifdef ENABLE_LOGSMANAGEMENT_TESTS -/* Used as public only for unit testing, normally defined as static */ -char *sanitise_string(char *s); -#endif // ENABLE_LOGSMANAGEMENT_TESTS - -#endif // QUERY_H_ diff --git a/src/logsmanagement/rrd_api/rrd_api.h b/src/logsmanagement/rrd_api/rrd_api.h deleted file mode 100644 index 8c98acbb9..000000000 --- a/src/logsmanagement/rrd_api/rrd_api.h +++ /dev/null @@ -1,312 +0,0 @@ -/** @file rrd_api.h - */ - -#ifndef RRD_API_H_ -#define RRD_API_H_ - -#include "daemon/common.h" -#include "../circular_buffer.h" -#include "../helper.h" - -struct Chart_meta; -struct Chart_str { - const char *type; - const char *id; - const char *title; - const char *units; - const char *family; - const char *context; - const char *chart_type; - long priority; - int update_every; -}; - -#include "rrd_api_generic.h" -#include "rrd_api_web_log.h" -#include "rrd_api_kernel.h" -#include "rrd_api_systemd.h" -#include "rrd_api_docker_ev.h" -#include "rrd_api_mqtt.h" - -#define CHART_TITLE_TOTAL_COLLECTED_LOGS "Total collected log records" -#define CHART_TITLE_RATE_COLLECTED_LOGS "Rate of collected log records" -#define NETDATA_CHART_PRIO_LOGS_INCR 100 /**< PRIO increment step from one log source to another **/ - -typedef struct Chart_data_cus { - char *id; - - struct chart_data_cus_dim { - char *name; - collected_number val; - unsigned long long *p_counter; - } *dims; - - int dims_size; - - struct Chart_data_cus *next; - -} Chart_data_cus_t ; - -struct Chart_meta { - enum log_src_type_t type; - long base_prio; - - union { - chart_data_generic_t *chart_data_generic; - chart_data_web_log_t *chart_data_web_log; - chart_data_kernel_t *chart_data_kernel; - chart_data_systemd_t *chart_data_systemd; - chart_data_docker_ev_t *chart_data_docker_ev; - chart_data_mqtt_t *chart_data_mqtt; - }; - - Chart_data_cus_t *chart_data_cus_arr; - - void (*init)(struct File_info *p_file_info); - void (*update)(struct File_info *p_file_info); - -}; - -static inline struct Chart_str lgs_mng_create_chart(const char *type, - const char *id, - const char *title, - const char *units, - const char *family, - const char *context, - const char *chart_type, - long priority, - int update_every){ - - struct Chart_str cs = { - .type = type, - .id = id, - .title = title, - .units = units, - .family = family ? family : "", - .context = context ? context : "", - .chart_type = chart_type ? chart_type : "", - .priority = priority, - .update_every = update_every - }; - - printf("CHART '%s.%s' '' '%s' '%s' '%s' '%s' '%s' %ld %d '' '" LOGS_MANAGEMENT_PLUGIN_STR "' ''\n", - cs.type, - cs.id, - cs.title, - cs.units, - cs.family, - cs.context, - cs.chart_type, - cs.priority, - cs.update_every - ); - - return cs; -} - -static inline void lgs_mng_add_dim( const char *id, - const char *algorithm, - collected_number multiplier, - collected_number divisor){ - - printf("DIMENSION '%s' '' '%s' %lld %lld\n", id, algorithm, multiplier, divisor); -} - -static inline void lgs_mng_add_dim_post_init( struct Chart_str *cs, - const char *dim_id, - const char *algorithm, - collected_number multiplier, - collected_number divisor){ - - printf("CHART '%s.%s' '' '%s' '%s' '%s' '%s' '%s' %ld %d '' '" LOGS_MANAGEMENT_PLUGIN_STR "' ''\n", - cs->type, - cs->id, - cs->title, - cs->units, - cs->family, - cs->context, - cs->chart_type, - cs->priority, - cs->update_every - ); - lgs_mng_add_dim(dim_id, algorithm, multiplier, divisor); -} - -static inline void lgs_mng_update_chart_begin(const char *type, const char *id){ - - printf("BEGIN '%s.%s'\n", type, id); -} - -static inline void lgs_mng_update_chart_set(const char *id, collected_number val){ - printf("SET '%s' = %lld\n", id, val); -} - -static inline void lgs_mng_update_chart_end(time_t sec){ - printf("END %" PRId64 " 0 1\n", sec); -} - -#define lgs_mng_do_num_of_logs_charts_init(p_file_info, chart_prio) do { \ - \ - /* Number of collected logs total - initialise */ \ - if(p_file_info->parser_config->chart_config & CHART_COLLECTED_LOGS_TOTAL){ \ - lgs_mng_create_chart( \ - (char *) p_file_info->chartname /* type */ \ - , "collected_logs_total" /* id */ \ - , CHART_TITLE_TOTAL_COLLECTED_LOGS /* title */ \ - , "log records" /* units */ \ - , "collected_logs" /* family */ \ - , NULL /* context */ \ - , RRDSET_TYPE_AREA_NAME /* chart_type */ \ - , ++chart_prio /* priority */ \ - , p_file_info->update_every /* update_every */ \ - ); \ - lgs_mng_add_dim("total records", RRD_ALGORITHM_ABSOLUTE_NAME, 1, 1); \ - } \ - \ - /* Number of collected logs rate - initialise */ \ - if(p_file_info->parser_config->chart_config & CHART_COLLECTED_LOGS_RATE){ \ - lgs_mng_create_chart( \ - (char *) p_file_info->chartname /* type */ \ - , "collected_logs_rate" /* id */ \ - , CHART_TITLE_RATE_COLLECTED_LOGS /* title */ \ - , "log records" /* units */ \ - , "collected_logs" /* family */ \ - , NULL /* context */ \ - , RRDSET_TYPE_LINE_NAME /* chart_type */ \ - , ++chart_prio /* priority */ \ - , p_file_info->update_every /* update_every */ \ - ); \ - lgs_mng_add_dim("records", RRD_ALGORITHM_INCREMENTAL_NAME, 1, 1); \ - } \ - \ -} while(0) - -#define lgs_mng_do_num_of_logs_charts_update(p_file_info, lag_in_sec, chart_data) do { \ - \ - /* Number of collected logs total - update previous values */ \ - if(p_file_info->parser_config->chart_config & CHART_COLLECTED_LOGS_TOTAL){ \ - for(time_t sec = p_file_info->parser_metrics->last_update - lag_in_sec; \ - sec < p_file_info->parser_metrics->last_update; \ - sec++){ \ - lgs_mng_update_chart_begin(p_file_info->chartname, "collected_logs_total"); \ - lgs_mng_update_chart_set("total records", chart_data->num_lines); \ - lgs_mng_update_chart_end(sec); \ - } \ - } \ - \ - /* Number of collected logs rate - update previous values */ \ - if(p_file_info->parser_config->chart_config & CHART_COLLECTED_LOGS_RATE){ \ - for(time_t sec = p_file_info->parser_metrics->last_update - lag_in_sec; \ - sec < p_file_info->parser_metrics->last_update; \ - sec++){ \ - lgs_mng_update_chart_begin(p_file_info->chartname, "collected_logs_rate"); \ - lgs_mng_update_chart_set("records", chart_data->num_lines); \ - lgs_mng_update_chart_end(sec); \ - } \ - } \ - \ - chart_data->num_lines = p_file_info->parser_metrics->num_lines; \ - \ - /* Number of collected logs total - update */ \ - if(p_file_info->parser_config->chart_config & CHART_COLLECTED_LOGS_TOTAL){ \ - lgs_mng_update_chart_begin( (char *) p_file_info->chartname, "collected_logs_total"); \ - lgs_mng_update_chart_set("total records", chart_data->num_lines); \ - lgs_mng_update_chart_end(p_file_info->parser_metrics->last_update); \ - } \ - \ - /* Number of collected logs rate - update */ \ - if(p_file_info->parser_config->chart_config & CHART_COLLECTED_LOGS_RATE){ \ - lgs_mng_update_chart_begin( (char *) p_file_info->chartname, "collected_logs_rate"); \ - lgs_mng_update_chart_set("records", chart_data->num_lines); \ - lgs_mng_update_chart_end(p_file_info->parser_metrics->last_update); \ - } \ -} while(0) - -#define lgs_mng_do_custom_charts_init(p_file_info) do { \ - \ - for(int cus_off = 0; p_file_info->parser_cus_config[cus_off]; cus_off++){ \ - \ - Chart_data_cus_t *cus; \ - Chart_data_cus_t **p_cus = &p_file_info->chart_meta->chart_data_cus_arr; \ - \ - for(cus = p_file_info->chart_meta->chart_data_cus_arr; \ - cus; \ - cus = cus->next){ \ - \ - if(!strcmp(cus->id, p_file_info->parser_cus_config[cus_off]->chartname)) \ - break; \ - \ - p_cus = &(cus->next); \ - } \ - \ - if(!cus){ \ - cus = callocz(1, sizeof(Chart_data_cus_t)); \ - *p_cus = cus; \ - \ - cus->id = p_file_info->parser_cus_config[cus_off]->chartname; \ - \ - lgs_mng_create_chart( \ - (char *) p_file_info->chartname /* type */ \ - , cus->id /* id */ \ - , cus->id /* title */ \ - , "matches" /* units */ \ - , "custom_charts" /* family */ \ - , NULL /* context */ \ - , RRDSET_TYPE_AREA_NAME /* chart_type */ \ - , p_file_info->chart_meta->base_prio + 1000 + cus_off /* priority */ \ - , p_file_info->update_every /* update_every */ \ - ); \ - } \ - \ - cus->dims = reallocz(cus->dims, ++cus->dims_size * sizeof(struct chart_data_cus_dim)); \ - cus->dims[cus->dims_size - 1].name = \ - p_file_info->parser_cus_config[cus_off]->regex_name; \ - cus->dims[cus->dims_size - 1].val = 0; \ - cus->dims[cus->dims_size - 1].p_counter = \ - &p_file_info->parser_metrics->parser_cus[cus_off]->count; \ - \ - lgs_mng_add_dim(cus->dims[cus->dims_size - 1].name, \ - RRD_ALGORITHM_INCREMENTAL_NAME, 1, 1); \ - \ - } \ -} while(0) - -#define lgs_mng_do_custom_charts_update(p_file_info, lag_in_sec) do { \ - \ - for(time_t sec = p_file_info->parser_metrics->last_update - lag_in_sec; \ - sec < p_file_info->parser_metrics->last_update; \ - sec++){ \ - \ - for(Chart_data_cus_t *cus = p_file_info->chart_meta->chart_data_cus_arr; \ - cus; \ - cus = cus->next){ \ - \ - lgs_mng_update_chart_begin(p_file_info->chartname, cus->id); \ - \ - for(int d_idx = 0; d_idx < cus->dims_size; d_idx++) \ - lgs_mng_update_chart_set(cus->dims[d_idx].name, cus->dims[d_idx].val); \ - \ - lgs_mng_update_chart_end(sec); \ - } \ - \ - } \ - \ - for(Chart_data_cus_t *cus = p_file_info->chart_meta->chart_data_cus_arr; \ - cus; \ - cus = cus->next){ \ - \ - lgs_mng_update_chart_begin(p_file_info->chartname, cus->id); \ - \ - for(int d_idx = 0; d_idx < cus->dims_size; d_idx++){ \ - \ - cus->dims[d_idx].val += *(cus->dims[d_idx].p_counter); \ - *(cus->dims[d_idx].p_counter) = 0; \ - \ - lgs_mng_update_chart_set(cus->dims[d_idx].name, cus->dims[d_idx].val); \ - } \ - \ - lgs_mng_update_chart_end(p_file_info->parser_metrics->last_update); \ - } \ -} while(0) - -#endif // RRD_API_H_ diff --git a/src/logsmanagement/rrd_api/rrd_api_docker_ev.c b/src/logsmanagement/rrd_api/rrd_api_docker_ev.c deleted file mode 100644 index 743d256a9..000000000 --- a/src/logsmanagement/rrd_api/rrd_api_docker_ev.c +++ /dev/null @@ -1,137 +0,0 @@ -// SPDX-License-Identifier: GPL-3.0-or-later - -#include "rrd_api_docker_ev.h" - -void docker_ev_chart_init(struct File_info *p_file_info){ - p_file_info->chart_meta->chart_data_docker_ev = callocz(1, sizeof (struct Chart_data_docker_ev)); - p_file_info->chart_meta->chart_data_docker_ev->last_update = now_realtime_sec(); // initial value shouldn't be 0 - long chart_prio = p_file_info->chart_meta->base_prio; - - lgs_mng_do_num_of_logs_charts_init(p_file_info, chart_prio); - - /* Docker events type - initialise */ - if(p_file_info->parser_config->chart_config & CHART_DOCKER_EV_TYPE){ - lgs_mng_create_chart( - (char *) p_file_info->chartname // type - , "events_type" // id - , "Events type" // title - , "events types" // units - , "event_type" // family - , NULL // context - , RRDSET_TYPE_AREA_NAME // chart_type - , ++chart_prio // priority - , p_file_info->update_every // update_every - ); - - for(int idx = 0; idx < NUM_OF_DOCKER_EV_TYPES; idx++) - lgs_mng_add_dim(docker_ev_type_string[idx], RRD_ALGORITHM_INCREMENTAL_NAME, 1, 1); - } - - /* Docker events actions - initialise */ - if(p_file_info->parser_config->chart_config & CHART_DOCKER_EV_ACTION){ - lgs_mng_create_chart( - (char *) p_file_info->chartname // type - , "events_action" // id - , "Events action" // title - , "events actions" // units - , "event_action" // family - , NULL // context - , RRDSET_TYPE_AREA_NAME // chart_type - , ++chart_prio // priority - , p_file_info->update_every // update_every - ); - - for(int ev_off = 0; ev_off < NUM_OF_DOCKER_EV_TYPES; ev_off++){ - int act_off = -1; - while(docker_ev_action_string[ev_off][++act_off] != NULL){ - - char dim[50]; - snprintfz(dim, 50, "%s %s", - docker_ev_type_string[ev_off], - docker_ev_action_string[ev_off][act_off]); - - lgs_mng_add_dim(dim, RRD_ALGORITHM_INCREMENTAL_NAME, 1, 1); - } - } - } - - lgs_mng_do_custom_charts_init(p_file_info); -} - -void docker_ev_chart_update(struct File_info *p_file_info){ - chart_data_docker_ev_t *chart_data = p_file_info->chart_meta->chart_data_docker_ev; - - if(chart_data->last_update != p_file_info->parser_metrics->last_update){ - - time_t lag_in_sec = p_file_info->parser_metrics->last_update - chart_data->last_update - 1; - - lgs_mng_do_num_of_logs_charts_update(p_file_info, lag_in_sec, chart_data); - - /* Docker events type - update */ - if(p_file_info->parser_config->chart_config & CHART_DOCKER_EV_TYPE){ - for(time_t sec = p_file_info->parser_metrics->last_update - lag_in_sec; - sec < p_file_info->parser_metrics->last_update; - sec++){ - - lgs_mng_update_chart_begin(p_file_info->chartname, "events_type"); - for(int idx = 0; idx < NUM_OF_DOCKER_EV_TYPES; idx++) - lgs_mng_update_chart_set(docker_ev_type_string[idx], chart_data->num_dock_ev_type[idx]); - lgs_mng_update_chart_end(sec); - } - - lgs_mng_update_chart_begin(p_file_info->chartname, "events_type"); - for(int idx = 0; idx < NUM_OF_DOCKER_EV_TYPES; idx++){ - chart_data->num_dock_ev_type[idx] = p_file_info->parser_metrics->docker_ev->ev_type[idx]; - lgs_mng_update_chart_set(docker_ev_type_string[idx], chart_data->num_dock_ev_type[idx]); - } - lgs_mng_update_chart_end(p_file_info->parser_metrics->last_update); - } - - /* Docker events action - update */ - if(p_file_info->parser_config->chart_config & CHART_DOCKER_EV_ACTION){ - char dim[50]; - - for(time_t sec = p_file_info->parser_metrics->last_update - lag_in_sec; - sec < p_file_info->parser_metrics->last_update; - sec++){ - - lgs_mng_update_chart_begin(p_file_info->chartname, "events_action"); - for(int ev_off = 0; ev_off < NUM_OF_DOCKER_EV_TYPES; ev_off++){ - int act_off = -1; - while(docker_ev_action_string[ev_off][++act_off] != NULL){ - if(chart_data->num_dock_ev_action[ev_off][act_off]){ - snprintfz(dim, 50, "%s %s", - docker_ev_type_string[ev_off], - docker_ev_action_string[ev_off][act_off]); - lgs_mng_update_chart_set(dim, chart_data->num_dock_ev_action[ev_off][act_off]); - } - } - } - lgs_mng_update_chart_end(sec); - } - - lgs_mng_update_chart_begin(p_file_info->chartname, "events_action"); - for(int ev_off = 0; ev_off < NUM_OF_DOCKER_EV_TYPES; ev_off++){ - int act_off = -1; - while(docker_ev_action_string[ev_off][++act_off] != NULL){ - chart_data->num_dock_ev_action[ev_off][act_off] = - p_file_info->parser_metrics->docker_ev->ev_action[ev_off][act_off]; - - if(chart_data->num_dock_ev_action[ev_off][act_off]){ - snprintfz(dim, 50, "%s %s", - docker_ev_type_string[ev_off], - docker_ev_action_string[ev_off][act_off]); - lgs_mng_update_chart_set(dim, chart_data->num_dock_ev_action[ev_off][act_off]); - } - } - } - lgs_mng_update_chart_end(p_file_info->parser_metrics->last_update); - - } - - lgs_mng_do_custom_charts_update(p_file_info, lag_in_sec); - - chart_data->last_update = p_file_info->parser_metrics->last_update; - } - -} diff --git a/src/logsmanagement/rrd_api/rrd_api_docker_ev.h b/src/logsmanagement/rrd_api/rrd_api_docker_ev.h deleted file mode 100644 index 693413265..000000000 --- a/src/logsmanagement/rrd_api/rrd_api_docker_ev.h +++ /dev/null @@ -1,39 +0,0 @@ -// SPDX-License-Identifier: GPL-3.0-or-later - -/** @file plugins_logsmanagement_docker_ev.h - * @brief Incudes the structure and function definitions - * for the docker event log charts. - */ - -#ifndef RRD_API_DOCKER_EV_H_ -#define RRD_API_DOCKER_EV_H_ - -#include "daemon/common.h" - -struct File_info; - -typedef struct Chart_data_docker_ev chart_data_docker_ev_t; - -#include "../file_info.h" -#include "../circular_buffer.h" - -#include "rrd_api.h" - -struct Chart_data_docker_ev { - - time_t last_update; - - /* Number of collected log records */ - collected_number num_lines; - - /* Docker events metrics - event type */ - collected_number num_dock_ev_type[NUM_OF_DOCKER_EV_TYPES]; - - /* Docker events metrics - action type */ - collected_number num_dock_ev_action[NUM_OF_DOCKER_EV_TYPES][NUM_OF_CONTAINER_ACTIONS]; -}; - -void docker_ev_chart_init(struct File_info *p_file_info); -void docker_ev_chart_update(struct File_info *p_file_info); - -#endif // RRD_API_DOCKER_EV_H_ diff --git a/src/logsmanagement/rrd_api/rrd_api_generic.c b/src/logsmanagement/rrd_api/rrd_api_generic.c deleted file mode 100644 index 752f5af75..000000000 --- a/src/logsmanagement/rrd_api/rrd_api_generic.c +++ /dev/null @@ -1,28 +0,0 @@ -// SPDX-License-Identifier: GPL-3.0-or-later - -#include "rrd_api_generic.h" - -void generic_chart_init(struct File_info *p_file_info){ - p_file_info->chart_meta->chart_data_generic = callocz(1, sizeof (struct Chart_data_generic)); - p_file_info->chart_meta->chart_data_generic->last_update = now_realtime_sec(); // initial value shouldn't be 0 - long chart_prio = p_file_info->chart_meta->base_prio; - - lgs_mng_do_num_of_logs_charts_init(p_file_info, chart_prio); - - lgs_mng_do_custom_charts_init(p_file_info); -} - -void generic_chart_update(struct File_info *p_file_info){ - chart_data_generic_t *chart_data = p_file_info->chart_meta->chart_data_generic; - - if(chart_data->last_update != p_file_info->parser_metrics->last_update){ - - time_t lag_in_sec = p_file_info->parser_metrics->last_update - chart_data->last_update - 1; - - lgs_mng_do_num_of_logs_charts_update(p_file_info, lag_in_sec, chart_data); - - lgs_mng_do_custom_charts_update(p_file_info, lag_in_sec); - - chart_data->last_update = p_file_info->parser_metrics->last_update; - } -} diff --git a/src/logsmanagement/rrd_api/rrd_api_generic.h b/src/logsmanagement/rrd_api/rrd_api_generic.h deleted file mode 100644 index 25b801a0d..000000000 --- a/src/logsmanagement/rrd_api/rrd_api_generic.h +++ /dev/null @@ -1,34 +0,0 @@ -// SPDX-License-Identifier: GPL-3.0-or-later - -/** @file rrd_api_generic.h - * @brief Incudes the structure and function definitions for - * generic log charts. - */ - -#ifndef RRD_API_GENERIC_H_ -#define RRD_API_GENERIC_H_ - -#include "daemon/common.h" - -struct File_info; - -typedef struct Chart_data_generic chart_data_generic_t; - -#include "../file_info.h" -#include "../circular_buffer.h" - -#include "rrd_api.h" - -struct Chart_data_generic { - - time_t last_update; - - /* Number of collected log records */ - collected_number num_lines; - -}; - -void generic_chart_init(struct File_info *p_file_info); -void generic_chart_update(struct File_info *p_file_info); - -#endif // RRD_API_GENERIC_H_ diff --git a/src/logsmanagement/rrd_api/rrd_api_kernel.c b/src/logsmanagement/rrd_api/rrd_api_kernel.c deleted file mode 100644 index 9372f7735..000000000 --- a/src/logsmanagement/rrd_api/rrd_api_kernel.c +++ /dev/null @@ -1,168 +0,0 @@ -// SPDX-License-Identifier: GPL-3.0-or-later - -#include "rrd_api_kernel.h" - -void kernel_chart_init(struct File_info *p_file_info){ - p_file_info->chart_meta->chart_data_kernel = callocz(1, sizeof (struct Chart_data_kernel)); - chart_data_kernel_t *chart_data = p_file_info->chart_meta->chart_data_kernel; - chart_data->last_update = now_realtime_sec(); // initial value shouldn't be 0 - long chart_prio = p_file_info->chart_meta->base_prio; - - lgs_mng_do_num_of_logs_charts_init(p_file_info, chart_prio); - - /* Syslog severity level (== Systemd priority) - initialise */ - if(p_file_info->parser_config->chart_config & CHART_SYSLOG_SEVER){ - lgs_mng_create_chart( - (char *) p_file_info->chartname // type - , "severity_levels" // id - , "Severity Levels" // title - , "severity levels" // units - , "severity" // family - , NULL // context - , RRDSET_TYPE_AREA_NAME // chart_type - , ++chart_prio // priority - , p_file_info->update_every // update_every - ); - - for(int i = 0; i < SYSLOG_SEVER_ARR_SIZE; i++) - lgs_mng_add_dim(dim_sever_str[i], RRD_ALGORITHM_INCREMENTAL_NAME, 1, 1); - - } - - /* Subsystem - initialise */ - if(p_file_info->parser_config->chart_config & CHART_KMSG_SUBSYSTEM){ - chart_data->cs_subsys = lgs_mng_create_chart( - (char *) p_file_info->chartname // type - , "subsystems" // id - , "Subsystems" // title - , "subsystems" // units - , "subsystem" // family - , NULL // context - , RRDSET_TYPE_AREA_NAME // chart_type - , ++chart_prio // priority - , p_file_info->update_every // update_every - ); - } - - /* Device - initialise */ - if(p_file_info->parser_config->chart_config & CHART_KMSG_DEVICE){ - chart_data->cs_device = lgs_mng_create_chart( - (char *) p_file_info->chartname // type - , "devices" // id - , "Devices" // title - , "devices" // units - , "device" // family - , NULL // context - , RRDSET_TYPE_AREA_NAME // chart_type - , ++chart_prio // priority - , p_file_info->update_every // update_every - ); - } - - lgs_mng_do_custom_charts_init(p_file_info); -} - -void kernel_chart_update(struct File_info *p_file_info){ - chart_data_kernel_t *chart_data = p_file_info->chart_meta->chart_data_kernel; - - if(chart_data->last_update != p_file_info->parser_metrics->last_update){ - - time_t lag_in_sec = p_file_info->parser_metrics->last_update - chart_data->last_update - 1; - - lgs_mng_do_num_of_logs_charts_update(p_file_info, lag_in_sec, chart_data); - - /* Syslog severity level (== Systemd priority) - update */ - if(p_file_info->parser_config->chart_config & CHART_SYSLOG_SEVER){ - for(time_t sec = p_file_info->parser_metrics->last_update - lag_in_sec; - sec < p_file_info->parser_metrics->last_update; - sec++){ - - lgs_mng_update_chart_begin(p_file_info->chartname, "severity_levels"); - for(int idx = 0; idx < SYSLOG_SEVER_ARR_SIZE; idx++) - lgs_mng_update_chart_set(dim_sever_str[idx], chart_data->num_sever[idx]); - lgs_mng_update_chart_end(sec); - } - - lgs_mng_update_chart_begin(p_file_info->chartname, "severity_levels"); - for(int idx = 0; idx < SYSLOG_SEVER_ARR_SIZE; idx++){ - chart_data->num_sever[idx] = p_file_info->parser_metrics->kernel->sever[idx]; - lgs_mng_update_chart_set(dim_sever_str[idx], chart_data->num_sever[idx]); - } - lgs_mng_update_chart_end(p_file_info->parser_metrics->last_update); - } - - /* Subsystem - update */ - if(p_file_info->parser_config->chart_config & CHART_KMSG_SUBSYSTEM){ - metrics_dict_item_t *it; - - for(time_t sec = p_file_info->parser_metrics->last_update - lag_in_sec; - sec < p_file_info->parser_metrics->last_update; - sec++){ - - lgs_mng_update_chart_begin(p_file_info->chartname, "subsystems"); - dfe_start_read(p_file_info->parser_metrics->kernel->subsystem, it){ - if(it->dim_initialized) - lgs_mng_update_chart_set(it_dfe.name, (collected_number) it->num); - } - dfe_done(it); - lgs_mng_update_chart_end(sec); - } - - dfe_start_write(p_file_info->parser_metrics->kernel->subsystem, it){ - if(!it->dim_initialized){ - it->dim_initialized = true; - lgs_mng_add_dim_post_init( &chart_data->cs_subsys, it_dfe.name, - RRD_ALGORITHM_INCREMENTAL_NAME, 1, 1); - } - } - dfe_done(it); - - lgs_mng_update_chart_begin(p_file_info->chartname, "subsystems"); - dfe_start_write(p_file_info->parser_metrics->kernel->subsystem, it){ - it->num = it->num_new; - lgs_mng_update_chart_set(it_dfe.name, (collected_number) it->num); - } - dfe_done(it); - lgs_mng_update_chart_end(p_file_info->parser_metrics->last_update); - } - - /* Device - update */ - if(p_file_info->parser_config->chart_config & CHART_KMSG_DEVICE){ - metrics_dict_item_t *it; - - for(time_t sec = p_file_info->parser_metrics->last_update - lag_in_sec; - sec < p_file_info->parser_metrics->last_update; - sec++){ - - lgs_mng_update_chart_begin(p_file_info->chartname, "devices"); - dfe_start_read(p_file_info->parser_metrics->kernel->device, it){ - if(it->dim_initialized) - lgs_mng_update_chart_set(it_dfe.name, (collected_number) it->num); - } - dfe_done(it); - lgs_mng_update_chart_end(sec); - } - - dfe_start_write(p_file_info->parser_metrics->kernel->device, it){ - if(!it->dim_initialized){ - it->dim_initialized = true; - lgs_mng_add_dim_post_init( &chart_data->cs_device, it_dfe.name, - RRD_ALGORITHM_INCREMENTAL_NAME, 1, 1); - } - } - dfe_done(it); - - lgs_mng_update_chart_begin(p_file_info->chartname, "devices"); - dfe_start_write(p_file_info->parser_metrics->kernel->device, it){ - it->num = it->num_new; - lgs_mng_update_chart_set(it_dfe.name, (collected_number) it->num); - } - dfe_done(it); - lgs_mng_update_chart_end(p_file_info->parser_metrics->last_update); - } - - lgs_mng_do_custom_charts_update(p_file_info, lag_in_sec); - - chart_data->last_update = p_file_info->parser_metrics->last_update; - } -} diff --git a/src/logsmanagement/rrd_api/rrd_api_kernel.h b/src/logsmanagement/rrd_api/rrd_api_kernel.h deleted file mode 100644 index ccb4a7526..000000000 --- a/src/logsmanagement/rrd_api/rrd_api_kernel.h +++ /dev/null @@ -1,46 +0,0 @@ -// SPDX-License-Identifier: GPL-3.0-or-later - -/** @file rrd_api_kernel.h - * @brief Incudes the structure and function definitions - * for the kernel log charts. - */ - -#ifndef RRD_API_KERNEL_H_ -#define RRD_API_KERNEL_H_ - -#include "daemon/common.h" - -struct File_info; - -typedef struct Chart_data_kernel chart_data_kernel_t; - -#include "../file_info.h" -#include "../circular_buffer.h" - -#include "rrd_api.h" - -#include "rrd_api_systemd.h" // required for dim_sever_str[] - -struct Chart_data_kernel { - - time_t last_update; - - /* Number of collected log records */ - collected_number num_lines; - - /* Kernel metrics - Syslog Severity value */ - collected_number num_sever[SYSLOG_SEVER_ARR_SIZE]; - - /* Kernel metrics - Subsystem */ - struct Chart_str cs_subsys; - // Special case: Subsystem dimension and number are part of Kernel_metrics_t - - /* Kernel metrics - Device */ - struct Chart_str cs_device; - // Special case: Device dimension and number are part of Kernel_metrics_t -}; - -void kernel_chart_init(struct File_info *p_file_info); -void kernel_chart_update(struct File_info *p_file_info); - -#endif // RRD_API_KERNEL_H_ diff --git a/src/logsmanagement/rrd_api/rrd_api_mqtt.c b/src/logsmanagement/rrd_api/rrd_api_mqtt.c deleted file mode 100644 index eb90b2ab6..000000000 --- a/src/logsmanagement/rrd_api/rrd_api_mqtt.c +++ /dev/null @@ -1,79 +0,0 @@ -// SPDX-License-Identifier: GPL-3.0-or-later - -#include "rrd_api_mqtt.h" - -void mqtt_chart_init(struct File_info *p_file_info){ - p_file_info->chart_meta->chart_data_mqtt = callocz(1, sizeof (struct Chart_data_mqtt)); - chart_data_mqtt_t *chart_data = p_file_info->chart_meta->chart_data_mqtt; - chart_data->last_update = now_realtime_sec(); // initial value shouldn't be 0 - long chart_prio = p_file_info->chart_meta->base_prio; - - lgs_mng_do_num_of_logs_charts_init(p_file_info, chart_prio); - - /* Topic - initialise */ - if(p_file_info->parser_config->chart_config & CHART_MQTT_TOPIC){ - chart_data->cs_topic = lgs_mng_create_chart( - (char *) p_file_info->chartname // type - , "topics" // id - , "Topics" // title - , "topics" // units - , "topic" // family - , NULL // context - , RRDSET_TYPE_AREA_NAME // chart_type - , ++chart_prio // priority - , p_file_info->update_every // update_every - ); - } - - lgs_mng_do_custom_charts_init(p_file_info); -} - -void mqtt_chart_update(struct File_info *p_file_info){ - chart_data_mqtt_t *chart_data = p_file_info->chart_meta->chart_data_mqtt; - - if(chart_data->last_update != p_file_info->parser_metrics->last_update){ - - time_t lag_in_sec = p_file_info->parser_metrics->last_update - chart_data->last_update - 1; - - lgs_mng_do_num_of_logs_charts_update(p_file_info, lag_in_sec, chart_data); - - /* Topic - update */ - if(p_file_info->parser_config->chart_config & CHART_MQTT_TOPIC){ - metrics_dict_item_t *it; - - for(time_t sec = p_file_info->parser_metrics->last_update - lag_in_sec; - sec < p_file_info->parser_metrics->last_update; - sec++){ - - lgs_mng_update_chart_begin(p_file_info->chartname, "topics"); - dfe_start_read(p_file_info->parser_metrics->mqtt->topic, it){ - if(it->dim_initialized) - lgs_mng_update_chart_set(it_dfe.name, (collected_number) it->num); - } - dfe_done(it); - lgs_mng_update_chart_end(sec); - } - - dfe_start_write(p_file_info->parser_metrics->mqtt->topic, it){ - if(!it->dim_initialized){ - it->dim_initialized = true; - lgs_mng_add_dim_post_init( &chart_data->cs_topic, it_dfe.name, - RRD_ALGORITHM_INCREMENTAL_NAME, 1, 1); - } - } - dfe_done(it); - - lgs_mng_update_chart_begin(p_file_info->chartname, "topics"); - dfe_start_write(p_file_info->parser_metrics->mqtt->topic, it){ - it->num = it->num_new; - lgs_mng_update_chart_set(it_dfe.name, (collected_number) it->num); - } - dfe_done(it); - lgs_mng_update_chart_end(p_file_info->parser_metrics->last_update); - } - - lgs_mng_do_custom_charts_update(p_file_info, lag_in_sec); - - chart_data->last_update = p_file_info->parser_metrics->last_update; - } -} diff --git a/src/logsmanagement/rrd_api/rrd_api_mqtt.h b/src/logsmanagement/rrd_api/rrd_api_mqtt.h deleted file mode 100644 index 13c5cff3d..000000000 --- a/src/logsmanagement/rrd_api/rrd_api_mqtt.h +++ /dev/null @@ -1,37 +0,0 @@ -// SPDX-License-Identifier: GPL-3.0-or-later - -/** @file rrd_api_mqtt.h - * @brief Incudes the structure and function definitions - * for the mqtt log charts. - */ - -#ifndef RRD_API_MQTT_H_ -#define RRD_API_MQTT_H_ - -#include "daemon/common.h" - -struct File_info; - -typedef struct Chart_data_mqtt chart_data_mqtt_t; - -#include "../file_info.h" -#include "../circular_buffer.h" - -#include "rrd_api.h" - -struct Chart_data_mqtt { - - time_t last_update; - - /* Number of collected log records */ - collected_number num_lines; - - /* MQTT metrics - Topic */ - struct Chart_str cs_topic; - // Special case: Topic dimension and number are part of Mqtt_metrics_t -}; - -void mqtt_chart_init(struct File_info *p_file_info); -void mqtt_chart_update(struct File_info *p_file_info); - -#endif // RRD_API_MQTT_H_ diff --git a/src/logsmanagement/rrd_api/rrd_api_stats.c b/src/logsmanagement/rrd_api/rrd_api_stats.c deleted file mode 100644 index e845d0417..000000000 --- a/src/logsmanagement/rrd_api/rrd_api_stats.c +++ /dev/null @@ -1,298 +0,0 @@ -// SPDX-License-Identifier: GPL-3.0-or-later - -#include "rrd_api_stats.h" - -static const char *const rrd_type = "netdata"; - -static char **dim_db_timings_write, **dim_db_timings_rotate; - -extern bool logsmanagement_should_exit; - -static void stats_charts_update(void){ - - /* Circular buffer total memory stats - update */ - lgs_mng_update_chart_begin(rrd_type, "circular_buffers_mem_total_cached"); - for(int i = 0; i < p_file_infos_arr->count; i++){ - struct File_info *p_file_info = p_file_infos_arr->data[i]; - if(!p_file_info->parser_config) - continue; - - lgs_mng_update_chart_set(p_file_info->chartname, - __atomic_load_n(&p_file_info->circ_buff->total_cached_mem, __ATOMIC_RELAXED)); - } - lgs_mng_update_chart_end(0); - - /* Circular buffer number of items - update */ - lgs_mng_update_chart_begin(rrd_type, "circular_buffers_num_of_items"); - for(int i = 0; i < p_file_infos_arr->count; i++){ - struct File_info *p_file_info = p_file_infos_arr->data[i]; - if(!p_file_info->parser_config) - continue; - - lgs_mng_update_chart_set(p_file_info->chartname, p_file_info->circ_buff->num_of_items); - } - lgs_mng_update_chart_end(0); - - /* Circular buffer uncompressed buffered items memory stats - update */ - lgs_mng_update_chart_begin(rrd_type, "circular_buffers_mem_uncompressed_used"); - for(int i = 0; i < p_file_infos_arr->count; i++){ - struct File_info *p_file_info = p_file_infos_arr->data[i]; - if(!p_file_info->parser_config) - continue; - - lgs_mng_update_chart_set(p_file_info->chartname, - __atomic_load_n(&p_file_info->circ_buff->text_size_total, __ATOMIC_RELAXED)); - } - lgs_mng_update_chart_end(0); - - /* Circular buffer compressed buffered items memory stats - update */ - lgs_mng_update_chart_begin(rrd_type, "circular_buffers_mem_compressed_used"); - for(int i = 0; i < p_file_infos_arr->count; i++){ - struct File_info *p_file_info = p_file_infos_arr->data[i]; - if(!p_file_info->parser_config) - continue; - - lgs_mng_update_chart_set(p_file_info->chartname, - __atomic_load_n(&p_file_info->circ_buff->text_compressed_size_total, __ATOMIC_RELAXED)); - } - lgs_mng_update_chart_end(0); - - /* Compression stats - update */ - lgs_mng_update_chart_begin(rrd_type, "average_compression_ratio"); - for(int i = 0; i < p_file_infos_arr->count; i++){ - struct File_info *p_file_info = p_file_infos_arr->data[i]; - if(!p_file_info->parser_config) - continue; - - lgs_mng_update_chart_set(p_file_info->chartname, - __atomic_load_n(&p_file_info->circ_buff->compression_ratio, __ATOMIC_RELAXED)); - } - lgs_mng_update_chart_end(0); - - /* DB disk usage stats - update */ - lgs_mng_update_chart_begin(rrd_type, "database_disk_usage"); - for(int i = 0; i < p_file_infos_arr->count; i++){ - struct File_info *p_file_info = p_file_infos_arr->data[i]; - if(!p_file_info->parser_config) - continue; - - lgs_mng_update_chart_set(p_file_info->chartname, - __atomic_load_n(&p_file_info->blob_total_size, __ATOMIC_RELAXED)); - } - lgs_mng_update_chart_end(0); - - /* DB timings - update */ - lgs_mng_update_chart_begin(rrd_type, "database_timings"); - for(int i = 0; i < p_file_infos_arr->count; i++){ - struct File_info *p_file_info = p_file_infos_arr->data[i]; - if(!p_file_info->parser_config) - continue; - - lgs_mng_update_chart_set(dim_db_timings_write[i], - __atomic_exchange_n(&p_file_info->db_write_duration, 0, __ATOMIC_RELAXED)); - - lgs_mng_update_chart_set(dim_db_timings_rotate[i], - __atomic_exchange_n(&p_file_info->db_rotate_duration, 0, __ATOMIC_RELAXED)); - } - lgs_mng_update_chart_end(0); - - /* Query CPU time per byte (user) - update */ - lgs_mng_update_chart_begin(rrd_type, "query_cpu_time_per_MiB_user"); - for(int i = 0; i < p_file_infos_arr->count; i++){ - struct File_info *p_file_info = p_file_infos_arr->data[i]; - if(!p_file_info->parser_config) - continue; - - lgs_mng_update_chart_set(p_file_info->chartname, - __atomic_load_n(&p_file_info->cpu_time_per_mib.user, __ATOMIC_RELAXED)); - } - lgs_mng_update_chart_end(0); - - /* Query CPU time per byte (user) - update */ - lgs_mng_update_chart_begin(rrd_type, "query_cpu_time_per_MiB_sys"); - for(int i = 0; i < p_file_infos_arr->count; i++){ - struct File_info *p_file_info = p_file_infos_arr->data[i]; - if(!p_file_info->parser_config) - continue; - - lgs_mng_update_chart_set(p_file_info->chartname, - __atomic_load_n(&p_file_info->cpu_time_per_mib.sys, __ATOMIC_RELAXED)); - } - lgs_mng_update_chart_end(0); - -} - -void stats_charts_init(void *arg){ - - netdata_mutex_t *p_stdout_mut = (netdata_mutex_t *) arg; - - netdata_mutex_lock(p_stdout_mut); - - int chart_prio = NETDATA_CHART_PRIO_LOGS_STATS_BASE; - - /* Circular buffer total memory stats - initialise */ - lgs_mng_create_chart( - rrd_type // type - , "circular_buffers_mem_total_cached" // id - , "Circular buffers total cached memory" // title - , "bytes" // units - , "logsmanagement" // family - , NULL // context - , RRDSET_TYPE_STACKED_NAME // chart_type - , ++chart_prio // priority - , g_logs_manag_config.update_every // update_every - ); - for(int i = 0; i < p_file_infos_arr->count; i++) - lgs_mng_add_dim(p_file_infos_arr->data[i]->chartname, RRD_ALGORITHM_ABSOLUTE_NAME, 1, 1); - - /* Circular buffer number of items - initialise */ - lgs_mng_create_chart( - rrd_type // type - , "circular_buffers_num_of_items" // id - , "Circular buffers number of items" // title - , "items" // units - , "logsmanagement" // family - , NULL // context - , RRDSET_TYPE_LINE_NAME // chart_type - , ++chart_prio // priority - , g_logs_manag_config.update_every // update_every - ); - for(int i = 0; i < p_file_infos_arr->count; i++) - lgs_mng_add_dim(p_file_infos_arr->data[i]->chartname, RRD_ALGORITHM_ABSOLUTE_NAME, 1, 1); - - /* Circular buffer uncompressed buffered items memory stats - initialise */ - lgs_mng_create_chart( - rrd_type // type - , "circular_buffers_mem_uncompressed_used" // id - , "Circular buffers used memory for uncompressed logs" // title - , "bytes" // units - , "logsmanagement" // family - , NULL // context - , RRDSET_TYPE_STACKED_NAME // chart_type - , ++chart_prio // priority - , g_logs_manag_config.update_every // update_every - ); - for(int i = 0; i < p_file_infos_arr->count; i++) - lgs_mng_add_dim(p_file_infos_arr->data[i]->chartname, RRD_ALGORITHM_ABSOLUTE_NAME, 1, 1); - - /* Circular buffer compressed buffered items memory stats - initialise */ - lgs_mng_create_chart( - rrd_type // type - , "circular_buffers_mem_compressed_used" // id - , "Circular buffers used memory for compressed logs" // title - , "bytes" // units - , "logsmanagement" // family - , NULL // context - , RRDSET_TYPE_STACKED_NAME // chart_type - , ++chart_prio // priority - , g_logs_manag_config.update_every // update_every - ); - for(int i = 0; i < p_file_infos_arr->count; i++) - lgs_mng_add_dim(p_file_infos_arr->data[i]->chartname, RRD_ALGORITHM_ABSOLUTE_NAME, 1, 1); - - /* Compression stats - initialise */ - lgs_mng_create_chart( - rrd_type // type - , "average_compression_ratio" // id - , "Average compression ratio" // title - , "uncompressed / compressed ratio" // units - , "logsmanagement" // family - , NULL // context - , RRDSET_TYPE_LINE_NAME // chart_type - , ++chart_prio // priority - , g_logs_manag_config.update_every // update_every - ); - for(int i = 0; i < p_file_infos_arr->count; i++) - lgs_mng_add_dim(p_file_infos_arr->data[i]->chartname, RRD_ALGORITHM_ABSOLUTE_NAME, 1, 1); - - /* DB disk usage stats - initialise */ - lgs_mng_create_chart( - rrd_type // type - , "database_disk_usage" // id - , "Database disk usage" // title - , "bytes" // units - , "logsmanagement" // family - , NULL // context - , RRDSET_TYPE_STACKED_NAME // chart_type - , ++chart_prio // priority - , g_logs_manag_config.update_every // update_every - ); - for(int i = 0; i < p_file_infos_arr->count; i++) - lgs_mng_add_dim(p_file_infos_arr->data[i]->chartname, RRD_ALGORITHM_ABSOLUTE_NAME, 1, 1); - - /* DB timings - initialise */ - lgs_mng_create_chart( - rrd_type // type - , "database_timings" // id - , "Database timings" // title - , "ns" // units - , "logsmanagement" // family - , NULL // context - , RRDSET_TYPE_STACKED_NAME // chart_type - , ++chart_prio // priority - , g_logs_manag_config.update_every // update_every - ); - for(int i = 0; i < p_file_infos_arr->count; i++){ - struct File_info *p_file_info = p_file_infos_arr->data[i]; - - dim_db_timings_write = reallocz(dim_db_timings_write, (i + 1) * sizeof(char *)); - dim_db_timings_rotate = reallocz(dim_db_timings_rotate, (i + 1) * sizeof(char *)); - - dim_db_timings_write[i] = mallocz(snprintf(NULL, 0, "%s_write", p_file_info->chartname) + 1); - sprintf(dim_db_timings_write[i], "%s_write", p_file_info->chartname); - lgs_mng_add_dim(dim_db_timings_write[i], RRD_ALGORITHM_ABSOLUTE_NAME, 1, 1); - - dim_db_timings_rotate[i] = mallocz(snprintf(NULL, 0, "%s_rotate", p_file_info->chartname) + 1); - sprintf(dim_db_timings_rotate[i], "%s_rotate", p_file_info->chartname); - lgs_mng_add_dim(dim_db_timings_rotate[i], RRD_ALGORITHM_ABSOLUTE_NAME, 1, 1); - } - - /* Query CPU time per byte (user) - initialise */ - lgs_mng_create_chart( - rrd_type // type - , "query_cpu_time_per_MiB_user" // id - , "CPU user time per MiB of query results" // title - , "usec/MiB" // units - , "logsmanagement" // family - , NULL // context - , RRDSET_TYPE_STACKED_NAME // chart_type - , ++chart_prio // priority - , g_logs_manag_config.update_every // update_every - ); - for(int i = 0; i < p_file_infos_arr->count; i++) - lgs_mng_add_dim(p_file_infos_arr->data[i]->chartname, RRD_ALGORITHM_INCREMENTAL_NAME, 1, 1); - - /* Query CPU time per byte (system) - initialise */ - lgs_mng_create_chart( - rrd_type // type - , "query_cpu_time_per_MiB_sys" // id - , "CPU system time per MiB of query results" // title - , "usec/MiB" // units - , "logsmanagement" // family - , NULL // context - , RRDSET_TYPE_STACKED_NAME // chart_type - , ++chart_prio // priority - , g_logs_manag_config.update_every // update_every - ); - for(int i = 0; i < p_file_infos_arr->count; i++) - lgs_mng_add_dim(p_file_infos_arr->data[i]->chartname, RRD_ALGORITHM_INCREMENTAL_NAME, 1, 1); - - netdata_mutex_unlock(p_stdout_mut); - - - heartbeat_t hb; - heartbeat_init(&hb); - usec_t step_ut = g_logs_manag_config.update_every * USEC_PER_SEC; - - while (0 == __atomic_load_n(&logsmanagement_should_exit, __ATOMIC_RELAXED)) { - heartbeat_next(&hb, step_ut); - - netdata_mutex_lock(p_stdout_mut); - stats_charts_update(); - fflush(stdout); - netdata_mutex_unlock(p_stdout_mut); - } - - collector_info("[stats charts]: thread exiting..."); -} - diff --git a/src/logsmanagement/rrd_api/rrd_api_stats.h b/src/logsmanagement/rrd_api/rrd_api_stats.h deleted file mode 100644 index 79a0f15d1..000000000 --- a/src/logsmanagement/rrd_api/rrd_api_stats.h +++ /dev/null @@ -1,19 +0,0 @@ -// SPDX-License-Identifier: GPL-3.0-or-later - -/** @file rrd_api_stats.h - * @brief Incudes the structure and function definitions - * for logs management stats charts. - */ - -#ifndef RRD_API_STATS_H_ -#define RRD_API_STATS_H_ - -#include "daemon/common.h" - -struct File_info; - -#include "../file_info.h" - -void stats_charts_init(void *arg); - -#endif // RRD_API_STATS_H_
\ No newline at end of file diff --git a/src/logsmanagement/rrd_api/rrd_api_systemd.c b/src/logsmanagement/rrd_api/rrd_api_systemd.c deleted file mode 100644 index 1d489389f..000000000 --- a/src/logsmanagement/rrd_api/rrd_api_systemd.c +++ /dev/null @@ -1,206 +0,0 @@ -// SPDX-License-Identifier: GPL-3.0-or-later - -#include "rrd_api_systemd.h" - -const char *dim_sever_str[SYSLOG_SEVER_ARR_SIZE] = { - "0:Emergency", - "1:Alert", - "2:Critical", - "3:Error", - "4:Warning", - "5:Notice", - "6:Informational", - "7:Debug", - "uknown" -}; - -static const char *dim_facil_str[SYSLOG_FACIL_ARR_SIZE] = { - "0:kernel", - "1:user-level", - "2:mail", - "3:system", - "4:sec/auth", - "5:syslog", - "6:lpd/printer", - "7:news/nntp", - "8:uucp", - "9:time", - "10:sec/auth", - "11:ftp", - "12:ntp", - "13:logaudit", - "14:logalert", - "15:clock", - "16:local0", - "17:local1", - "18:local2", - "19:local3", - "20:local4", - "21:local5", - "22:local6", - "23:local7", - "uknown" -}; - -void systemd_chart_init(struct File_info *p_file_info){ - p_file_info->chart_meta->chart_data_systemd = callocz(1, sizeof (struct Chart_data_systemd)); - chart_data_systemd_t *chart_data = p_file_info->chart_meta->chart_data_systemd; - chart_data->last_update = now_realtime_sec(); // initial value shouldn't be 0 - long chart_prio = p_file_info->chart_meta->base_prio; - - lgs_mng_do_num_of_logs_charts_init(p_file_info, chart_prio); - - /* Syslog priority value - initialise */ - if(p_file_info->parser_config->chart_config & CHART_SYSLOG_PRIOR){ - lgs_mng_create_chart( - (char *) p_file_info->chartname // type - , "priority_values" // id - , "Priority Values" // title - , "priority values" // units - , "priority" // family - , NULL // context - , RRDSET_TYPE_AREA_NAME // chart_type - , ++chart_prio // priority - , p_file_info->update_every // update_every - ); - - for(int i = 0; i < SYSLOG_PRIOR_ARR_SIZE - 1; i++){ - char dim_id[4]; - snprintfz(dim_id, 4, "%d", i); - chart_data->dim_prior[i] = strdupz(dim_id); - lgs_mng_add_dim(chart_data->dim_prior[i], RRD_ALGORITHM_INCREMENTAL_NAME, 1, 1); - } - chart_data->dim_prior[SYSLOG_PRIOR_ARR_SIZE - 1] = "uknown"; - lgs_mng_add_dim(chart_data->dim_prior[SYSLOG_PRIOR_ARR_SIZE - 1], - RRD_ALGORITHM_INCREMENTAL_NAME, 1, 1); - - } - - /* Syslog severity level (== Systemd priority) - initialise */ - if(p_file_info->parser_config->chart_config & CHART_SYSLOG_SEVER){ - lgs_mng_create_chart( - (char *) p_file_info->chartname // type - , "severity_levels" // id - , "Severity Levels" // title - , "severity levels" // units - , "priority" // family - , NULL // context - , RRDSET_TYPE_AREA_NAME // chart_type - , ++chart_prio // priority - , p_file_info->update_every // update_every - ); - - for(int i = 0; i < SYSLOG_SEVER_ARR_SIZE; i++) - lgs_mng_add_dim(dim_sever_str[i], RRD_ALGORITHM_INCREMENTAL_NAME, 1, 1); - } - - /* Syslog facility level - initialise */ - if(p_file_info->parser_config->chart_config & CHART_SYSLOG_FACIL){ - lgs_mng_create_chart( - (char *) p_file_info->chartname // type - , "facility_levels" // id - , "Facility Levels" // title - , "facility levels" // units - , "priority" // family - , NULL // context - , RRDSET_TYPE_AREA_NAME // chart_type - , ++chart_prio // priority - , p_file_info->update_every // update_every - ); - - for(int i = 0; i < SYSLOG_FACIL_ARR_SIZE; i++) - lgs_mng_add_dim(dim_facil_str[i], RRD_ALGORITHM_INCREMENTAL_NAME, 1, 1); - } - - lgs_mng_do_custom_charts_init(p_file_info); -} - -void systemd_chart_update(struct File_info *p_file_info){ - chart_data_systemd_t *chart_data = p_file_info->chart_meta->chart_data_systemd; - - if(chart_data->last_update != p_file_info->parser_metrics->last_update){ - - time_t lag_in_sec = p_file_info->parser_metrics->last_update - chart_data->last_update - 1; - - lgs_mng_do_num_of_logs_charts_update(p_file_info, lag_in_sec, chart_data); - - /* Syslog priority value - update */ - if(p_file_info->parser_config->chart_config & CHART_SYSLOG_PRIOR){ - for(time_t sec = p_file_info->parser_metrics->last_update - lag_in_sec; - sec < p_file_info->parser_metrics->last_update; - sec++){ - - lgs_mng_update_chart_begin(p_file_info->chartname, "priority_values"); - for(int idx = 0; idx < SYSLOG_PRIOR_ARR_SIZE; idx++){ - if(chart_data->num_prior[idx]) - lgs_mng_update_chart_set(chart_data->dim_prior[idx], chart_data->num_prior[idx]); - } - lgs_mng_update_chart_end(sec); - } - - lgs_mng_update_chart_begin(p_file_info->chartname, "priority_values"); - for(int idx = 0; idx < SYSLOG_PRIOR_ARR_SIZE; idx++){ - if(p_file_info->parser_metrics->systemd->prior[idx]){ - chart_data->num_prior[idx] = p_file_info->parser_metrics->systemd->prior[idx]; - lgs_mng_update_chart_set(chart_data->dim_prior[idx], chart_data->num_prior[idx]); - } - } - lgs_mng_update_chart_end(p_file_info->parser_metrics->last_update); - - } - - /* Syslog severity level (== Systemd priority) - update chart */ - if(p_file_info->parser_config->chart_config & CHART_SYSLOG_SEVER){ - for(time_t sec = p_file_info->parser_metrics->last_update - lag_in_sec; - sec < p_file_info->parser_metrics->last_update; - sec++){ - - lgs_mng_update_chart_begin(p_file_info->chartname, "severity_levels"); - for(int idx = 0; idx < SYSLOG_SEVER_ARR_SIZE; idx++){ - if(chart_data->num_sever[idx]) - lgs_mng_update_chart_set(dim_sever_str[idx], chart_data->num_sever[idx]); - } - lgs_mng_update_chart_end(sec); - } - - lgs_mng_update_chart_begin(p_file_info->chartname, "severity_levels"); - for(int idx = 0; idx < SYSLOG_SEVER_ARR_SIZE; idx++){ - if(p_file_info->parser_metrics->systemd->sever[idx]){ - chart_data->num_sever[idx] = p_file_info->parser_metrics->systemd->sever[idx]; - lgs_mng_update_chart_set(dim_sever_str[idx], chart_data->num_sever[idx]); - } - } - lgs_mng_update_chart_end(p_file_info->parser_metrics->last_update); - - } - - /* Syslog facility value - update chart */ - if(p_file_info->parser_config->chart_config & CHART_SYSLOG_FACIL){ - for(time_t sec = p_file_info->parser_metrics->last_update - lag_in_sec; - sec < p_file_info->parser_metrics->last_update; - sec++){ - - lgs_mng_update_chart_begin(p_file_info->chartname, "facility_levels"); - for(int idx = 0; idx < SYSLOG_FACIL_ARR_SIZE; idx++){ - if(chart_data->num_facil[idx]) - lgs_mng_update_chart_set(dim_facil_str[idx], chart_data->num_facil[idx]); - } - lgs_mng_update_chart_end(sec); - } - - lgs_mng_update_chart_begin(p_file_info->chartname, "facility_levels"); - for(int idx = 0; idx < SYSLOG_FACIL_ARR_SIZE; idx++){ - if(p_file_info->parser_metrics->systemd->facil[idx]){ - chart_data->num_facil[idx] = p_file_info->parser_metrics->systemd->facil[idx]; - lgs_mng_update_chart_set(dim_facil_str[idx], chart_data->num_facil[idx]); - } - } - lgs_mng_update_chart_end(p_file_info->parser_metrics->last_update); - - } - - lgs_mng_do_custom_charts_update(p_file_info, lag_in_sec); - - chart_data->last_update = p_file_info->parser_metrics->last_update; - } -} diff --git a/src/logsmanagement/rrd_api/rrd_api_systemd.h b/src/logsmanagement/rrd_api/rrd_api_systemd.h deleted file mode 100644 index 3497168f3..000000000 --- a/src/logsmanagement/rrd_api/rrd_api_systemd.h +++ /dev/null @@ -1,45 +0,0 @@ -// SPDX-License-Identifier: GPL-3.0-or-later - -/** @file plugins_logsmanagement_systemd.h - * @brief Incudes the structure and function definitions - * for the systemd log charts. - */ - -#ifndef RRD_API_SYSTEMD_H_ -#define RRD_API_SYSTEMD_H_ - -#include "daemon/common.h" - -struct File_info; - -typedef struct Chart_data_systemd chart_data_systemd_t; - -#include "../file_info.h" -#include "../circular_buffer.h" - -#include "rrd_api.h" - -extern const char *dim_sever_str[SYSLOG_SEVER_ARR_SIZE]; - -struct Chart_data_systemd { - - time_t last_update; - - /* Number of collected log records */ - collected_number num_lines; - - /* Systemd metrics - Syslog Priority value */ - char *dim_prior[193]; - collected_number num_prior[193]; - - /* Systemd metrics - Syslog Severity value */ - collected_number num_sever[9]; - - /* Systemd metrics - Syslog Facility value */ - collected_number num_facil[25]; -}; - -void systemd_chart_init(struct File_info *p_file_info); -void systemd_chart_update(struct File_info *p_file_info); - -#endif // RRD_API_SYSTEMD_H_ diff --git a/src/logsmanagement/rrd_api/rrd_api_web_log.c b/src/logsmanagement/rrd_api/rrd_api_web_log.c deleted file mode 100644 index 5ab602044..000000000 --- a/src/logsmanagement/rrd_api/rrd_api_web_log.c +++ /dev/null @@ -1,716 +0,0 @@ -// SPDX-License-Identifier: GPL-3.0-or-later - -#include "rrd_api_web_log.h" - -void web_log_chart_init(struct File_info *p_file_info){ - p_file_info->chart_meta->chart_data_web_log = callocz(1, sizeof (struct Chart_data_web_log)); - chart_data_web_log_t *chart_data = p_file_info->chart_meta->chart_data_web_log; - chart_data->last_update = now_realtime_sec(); // initial value shouldn't be 0 - long chart_prio = p_file_info->chart_meta->base_prio; - - lgs_mng_do_num_of_logs_charts_init(p_file_info, chart_prio); - - /* Vhost - initialise */ - if(p_file_info->parser_config->chart_config & CHART_VHOST){ - chart_data->cs_vhosts = lgs_mng_create_chart( - (char *) p_file_info->chartname // type - , "vhost" // id - , "Requests by Vhost" // title - , "requests" // units - , "vhost" // family - , NULL // context - , RRDSET_TYPE_AREA_NAME // chart_type - , ++chart_prio // priority - , p_file_info->update_every // update_every - ); - } - - /* Port - initialise */ - if(p_file_info->parser_config->chart_config & CHART_PORT){ - chart_data->cs_ports = lgs_mng_create_chart( - (char *) p_file_info->chartname // type - , "port" // id - , "Requests by Port" // title - , "requests" // units - , "port" // family - , NULL // context - , RRDSET_TYPE_AREA_NAME // chart_type - , ++chart_prio // priority - , p_file_info->update_every // update_every - ); - } - - /* IP Version - initialise */ - if(p_file_info->parser_config->chart_config & CHART_IP_VERSION){ - lgs_mng_create_chart( - (char *) p_file_info->chartname // type - , "ip_version" // id - , "Requests by IP version" // title - , "requests" // units - , "ip_version" // family - , NULL // context - , RRDSET_TYPE_AREA_NAME // chart_type - , ++chart_prio // priority - , p_file_info->update_every // update_every - ); - - lgs_mng_add_dim("ipv4", RRD_ALGORITHM_INCREMENTAL_NAME, 1, 1); - lgs_mng_add_dim("ipv6", RRD_ALGORITHM_INCREMENTAL_NAME, 1, 1); - lgs_mng_add_dim("invalid", RRD_ALGORITHM_INCREMENTAL_NAME, 1, 1); - } - - /* Request client current poll - initialise */ - if(p_file_info->parser_config->chart_config & CHART_REQ_CLIENT_CURRENT){ - lgs_mng_create_chart( - (char *) p_file_info->chartname // type - , "clients" // id - , "Current Poll Unique Client IPs" // title - , "unique ips" // units - , "clients" // family - , NULL // context - , RRDSET_TYPE_AREA_NAME // chart_type - , ++chart_prio // priority - , p_file_info->update_every // update_every - ); - - lgs_mng_add_dim("ipv4", RRD_ALGORITHM_INCREMENTAL_NAME, 1, 1); - lgs_mng_add_dim("ipv6", RRD_ALGORITHM_INCREMENTAL_NAME, 1, 1); - } - - /* Request client all-time - initialise */ - if(p_file_info->parser_config->chart_config & CHART_REQ_CLIENT_ALL_TIME){ - lgs_mng_create_chart( - (char *) p_file_info->chartname // type - , "clients_all" // id - , "All Time Unique Client IPs" // title - , "unique ips" // units - , "clients" // family - , NULL // context - , RRDSET_TYPE_AREA_NAME // chart_type - , ++chart_prio // priority - , p_file_info->update_every // update_every - ); - - lgs_mng_add_dim("ipv4", RRD_ALGORITHM_ABSOLUTE_NAME, 1, 1); - lgs_mng_add_dim("ipv6", RRD_ALGORITHM_ABSOLUTE_NAME, 1, 1); - } - - /* Request methods - initialise */ - if(p_file_info->parser_config->chart_config & CHART_REQ_METHODS){ - lgs_mng_create_chart( - (char *) p_file_info->chartname // type - , "http_methods" // id - , "Requests Per HTTP Method" // title - , "requests" // units - , "http_methods" // family - , NULL // context - , RRDSET_TYPE_AREA_NAME // chart_type - , ++chart_prio // priority - , p_file_info->update_every // update_every - ); - - for(int j = 0; j < REQ_METHOD_ARR_SIZE; j++) - lgs_mng_add_dim(req_method_str[j], RRD_ALGORITHM_INCREMENTAL_NAME, 1, 1); - } - - /* Request protocol - initialise */ - if(p_file_info->parser_config->chart_config & CHART_REQ_PROTO){ - lgs_mng_create_chart( - (char *) p_file_info->chartname // type - , "http_versions" // id - , "Requests Per HTTP Version" // title - , "requests" // units - , "http_versions" // family - , NULL // context - , RRDSET_TYPE_AREA_NAME // chart_type - , ++chart_prio // priority - , p_file_info->update_every // update_every - ); - - lgs_mng_add_dim("1.0", RRD_ALGORITHM_INCREMENTAL_NAME, 1, 1); - lgs_mng_add_dim("1.1", RRD_ALGORITHM_INCREMENTAL_NAME, 1, 1); - lgs_mng_add_dim("2.0", RRD_ALGORITHM_INCREMENTAL_NAME, 1, 1); - lgs_mng_add_dim("other", RRD_ALGORITHM_INCREMENTAL_NAME, 1, 1); - } - - /* Request bandwidth - initialise */ - if(p_file_info->parser_config->chart_config & CHART_BANDWIDTH){ - lgs_mng_create_chart( - (char *) p_file_info->chartname // type - , "bandwidth" // id - , "Bandwidth" // title - , "kilobits" // units - , "bandwidth" // family - , NULL // context - , RRDSET_TYPE_AREA_NAME // chart_type - , ++chart_prio // priority - , p_file_info->update_every // update_every - ); - - lgs_mng_add_dim("received", RRD_ALGORITHM_INCREMENTAL_NAME, 8, 1000); - lgs_mng_add_dim("sent", RRD_ALGORITHM_INCREMENTAL_NAME, -8, 1000); - } - - /* Request processing time - initialise */ - if(p_file_info->parser_config->chart_config & CHART_REQ_PROC_TIME){ - lgs_mng_create_chart( - (char *) p_file_info->chartname // type - , "timings" // id - , "Request Processing Time" // title - , "milliseconds" // units - , "timings" // family - , NULL // context - , RRDSET_TYPE_LINE_NAME // chart_type - , ++chart_prio // priority - , p_file_info->update_every // update_every - ); - - lgs_mng_add_dim("min", RRD_ALGORITHM_ABSOLUTE_NAME, 1, 1000); - lgs_mng_add_dim("max", RRD_ALGORITHM_ABSOLUTE_NAME, 1, 1000); - lgs_mng_add_dim("avg", RRD_ALGORITHM_ABSOLUTE_NAME, 1, 1000); - } - - /* Response code family - initialise */ - if(p_file_info->parser_config->chart_config & CHART_RESP_CODE_FAMILY){ - lgs_mng_create_chart( - (char *) p_file_info->chartname // type - , "responses" // id - , "Response Codes" // title - , "requests" // units - , "responses" // family - , NULL // context - , RRDSET_TYPE_AREA_NAME // chart_type - , ++chart_prio // priority - , p_file_info->update_every // update_every - ); - - lgs_mng_add_dim("1xx", RRD_ALGORITHM_INCREMENTAL_NAME, 1, 1); - lgs_mng_add_dim("2xx", RRD_ALGORITHM_INCREMENTAL_NAME, 1, 1); - lgs_mng_add_dim("3xx", RRD_ALGORITHM_INCREMENTAL_NAME, 1, 1); - lgs_mng_add_dim("4xx", RRD_ALGORITHM_INCREMENTAL_NAME, 1, 1); - lgs_mng_add_dim("5xx", RRD_ALGORITHM_INCREMENTAL_NAME, 1, 1); - lgs_mng_add_dim("other", RRD_ALGORITHM_INCREMENTAL_NAME, 1, 1); - } - - /* Response code - initialise */ - if(p_file_info->parser_config->chart_config & CHART_RESP_CODE){ - lgs_mng_create_chart( - (char *) p_file_info->chartname // type - , "detailed_responses" // id - , "Detailed Response Codes" // title - , "requests" // units - , "responses" // family - , NULL // context - , RRDSET_TYPE_AREA_NAME // chart_type - , ++chart_prio // priority - , p_file_info->update_every // update_every - ); - - for(int idx = 0; idx < RESP_CODE_ARR_SIZE - 1; idx++){ - char dim_name[4]; - snprintfz(dim_name, 4, "%d", idx + 100); - lgs_mng_add_dim(dim_name, RRD_ALGORITHM_INCREMENTAL_NAME, 1, 1); - } - } - - /* Response code type - initialise */ - if(p_file_info->parser_config->chart_config & CHART_RESP_CODE_TYPE){ - lgs_mng_create_chart( - (char *) p_file_info->chartname // type - , "response_types" // id - , "Response Statuses" // title - , "requests" // units - , "responses" // family - , NULL // context - , RRDSET_TYPE_AREA_NAME // chart_type - , ++chart_prio // priority - , p_file_info->update_every // update_every - ); - - lgs_mng_add_dim("success", RRD_ALGORITHM_INCREMENTAL_NAME, 1, 1); - lgs_mng_add_dim("redirect", RRD_ALGORITHM_INCREMENTAL_NAME, 1, 1); - lgs_mng_add_dim("bad", RRD_ALGORITHM_INCREMENTAL_NAME, 1, 1); - lgs_mng_add_dim("error", RRD_ALGORITHM_INCREMENTAL_NAME, 1, 1); - lgs_mng_add_dim("other", RRD_ALGORITHM_INCREMENTAL_NAME, 1, 1); - } - - /* SSL protocol - initialise */ - if(p_file_info->parser_config->chart_config & CHART_SSL_PROTO){ - lgs_mng_create_chart( - (char *) p_file_info->chartname // type - , "ssl_protocol" // id - , "Requests Per SSL Protocol" // title - , "requests" // units - , "ssl_protocol" // family - , NULL // context - , RRDSET_TYPE_AREA_NAME // chart_type - , ++chart_prio // priority - , p_file_info->update_every // update_every - ); - - lgs_mng_add_dim("TLSV1", RRD_ALGORITHM_INCREMENTAL_NAME, 1, 1); - lgs_mng_add_dim("TLSV1.1", RRD_ALGORITHM_INCREMENTAL_NAME, 1, 1); - lgs_mng_add_dim("TLSV1.2", RRD_ALGORITHM_INCREMENTAL_NAME, 1, 1); - lgs_mng_add_dim("TLSV1.3", RRD_ALGORITHM_INCREMENTAL_NAME, 1, 1); - lgs_mng_add_dim("SSLV2", RRD_ALGORITHM_INCREMENTAL_NAME, 1, 1); - lgs_mng_add_dim("SSLV3", RRD_ALGORITHM_INCREMENTAL_NAME, 1, 1); - lgs_mng_add_dim("other", RRD_ALGORITHM_INCREMENTAL_NAME, 1, 1); - } - - /* SSL cipher suite - initialise */ - if(p_file_info->parser_config->chart_config & CHART_SSL_CIPHER){ - chart_data->cs_ssl_ciphers = lgs_mng_create_chart( - (char *) p_file_info->chartname // type - , "ssl_cipher_suite" // id - , "Requests by SSL cipher suite" // title - , "requests" // units - , "ssl_cipher_suite" // family - , NULL // context - , RRDSET_TYPE_AREA_NAME // chart_type - , ++chart_prio // priority - , p_file_info->update_every // update_every - ); - } - - lgs_mng_do_custom_charts_init(p_file_info); -} - - -void web_log_chart_update(struct File_info *p_file_info){ - chart_data_web_log_t *chart_data = p_file_info->chart_meta->chart_data_web_log; - Web_log_metrics_t *wlm = p_file_info->parser_metrics->web_log; - - if(chart_data->last_update != p_file_info->parser_metrics->last_update){ - - time_t lag_in_sec = p_file_info->parser_metrics->last_update - chart_data->last_update - 1; - - lgs_mng_do_num_of_logs_charts_update(p_file_info, lag_in_sec, chart_data); - - /* Vhost - update */ - if(p_file_info->parser_config->chart_config & CHART_VHOST){ - for(time_t sec = p_file_info->parser_metrics->last_update - lag_in_sec; - sec < p_file_info->parser_metrics->last_update; - sec++){ - - lgs_mng_update_chart_begin(p_file_info->chartname, "vhost"); - for(int idx = 0; idx < chart_data->vhost_size; idx++) - lgs_mng_update_chart_set(wlm->vhost_arr.vhosts[idx].name, chart_data->num_vhosts[idx]); - lgs_mng_update_chart_end(sec); - } - - if(wlm->vhost_arr.size > chart_data->vhost_size){ - if(wlm->vhost_arr.size >= chart_data->vhost_size_max){ - chart_data->vhost_size_max = wlm->vhost_arr.size * VHOST_BUFFS_SCALE_FACTOR + 1; - chart_data->num_vhosts = reallocz( chart_data->num_vhosts, - chart_data->vhost_size_max * sizeof(collected_number)); - - } - - for(int idx = chart_data->vhost_size; idx < wlm->vhost_arr.size; idx++){ - chart_data->num_vhosts[idx] = 0; - lgs_mng_add_dim_post_init( &chart_data->cs_vhosts, - wlm->vhost_arr.vhosts[idx].name, - RRD_ALGORITHM_INCREMENTAL_NAME, 1, 1); - } - - chart_data->vhost_size = wlm->vhost_arr.size; - } - - lgs_mng_update_chart_begin(p_file_info->chartname, "vhost"); - for(int idx = 0; idx < chart_data->vhost_size; idx++){ - chart_data->num_vhosts[idx] += wlm->vhost_arr.vhosts[idx].count; - wlm->vhost_arr.vhosts[idx].count = 0; - lgs_mng_update_chart_set(wlm->vhost_arr.vhosts[idx].name, chart_data->num_vhosts[idx]); - } - lgs_mng_update_chart_end(p_file_info->parser_metrics->last_update); - } - - /* Port - update */ - if(p_file_info->parser_config->chart_config & CHART_PORT){ - for(time_t sec = p_file_info->parser_metrics->last_update - lag_in_sec; - sec < p_file_info->parser_metrics->last_update; - sec++){ - - lgs_mng_update_chart_begin(p_file_info->chartname, "port"); - for(int idx = 0; idx < chart_data->port_size; idx++) - lgs_mng_update_chart_set(wlm->port_arr.ports[idx].name, chart_data->num_ports[idx]); - lgs_mng_update_chart_end(sec); - } - - if(wlm->port_arr.size > chart_data->port_size){ - if(wlm->port_arr.size >= chart_data->port_size_max){ - chart_data->port_size_max = wlm->port_arr.size * PORT_BUFFS_SCALE_FACTOR + 1; - chart_data->num_ports = reallocz( chart_data->num_ports, - chart_data->port_size_max * sizeof(collected_number)); - } - - for(int idx = chart_data->port_size; idx < wlm->port_arr.size; idx++){ - chart_data->num_ports[idx] = 0; - lgs_mng_add_dim_post_init( &chart_data->cs_ports, - wlm->port_arr.ports[idx].name, - RRD_ALGORITHM_INCREMENTAL_NAME, 1, 1); - } - - chart_data->port_size = wlm->port_arr.size; - } - - lgs_mng_update_chart_begin(p_file_info->chartname, "port"); - for(int idx = 0; idx < chart_data->port_size; idx++){ - chart_data->num_ports[idx] += wlm->port_arr.ports[idx].count; - wlm->port_arr.ports[idx].count = 0; - lgs_mng_update_chart_set(wlm->port_arr.ports[idx].name, chart_data->num_ports[idx]); - } - lgs_mng_update_chart_end(p_file_info->parser_metrics->last_update); - } - - /* IP Version - update */ - if(p_file_info->parser_config->chart_config & CHART_IP_VERSION){ - for(time_t sec = p_file_info->parser_metrics->last_update - lag_in_sec; - sec < p_file_info->parser_metrics->last_update; - sec++){ - - lgs_mng_update_chart_begin(p_file_info->chartname, "ip_version"); - lgs_mng_update_chart_set("ipv4", chart_data->num_ip_ver_4); - lgs_mng_update_chart_set("ipv6", chart_data->num_ip_ver_6); - lgs_mng_update_chart_set("invalid", chart_data->num_ip_ver_invalid); - lgs_mng_update_chart_end(sec); - } - - chart_data->num_ip_ver_4 += wlm->ip_ver.v4; - chart_data->num_ip_ver_6 += wlm->ip_ver.v6; - chart_data->num_ip_ver_invalid += wlm->ip_ver.invalid; - memset(&wlm->ip_ver, 0, sizeof(wlm->ip_ver)); - - lgs_mng_update_chart_begin(p_file_info->chartname, "ip_version"); - lgs_mng_update_chart_set("ipv4", chart_data->num_ip_ver_4); - lgs_mng_update_chart_set("ipv6", chart_data->num_ip_ver_6); - lgs_mng_update_chart_set("invalid", chart_data->num_ip_ver_invalid); - lgs_mng_update_chart_end(p_file_info->parser_metrics->last_update); - } - - /* Request client current poll - update */ - if(p_file_info->parser_config->chart_config & CHART_REQ_CLIENT_CURRENT){ - for(time_t sec = p_file_info->parser_metrics->last_update - lag_in_sec; - sec < p_file_info->parser_metrics->last_update; - sec++){ - - lgs_mng_update_chart_begin(p_file_info->chartname, "clients"); - lgs_mng_update_chart_set("ipv4", chart_data->num_req_client_current_ipv4); - lgs_mng_update_chart_set("ipv6", chart_data->num_req_client_current_ipv6); - lgs_mng_update_chart_end(sec); - } - - chart_data->num_req_client_current_ipv4 += wlm->req_clients_current_arr.ipv4_size; - wlm->req_clients_current_arr.ipv4_size = 0; - chart_data->num_req_client_current_ipv6 += wlm->req_clients_current_arr.ipv6_size; - wlm->req_clients_current_arr.ipv6_size = 0; - - lgs_mng_update_chart_begin(p_file_info->chartname, "clients"); - lgs_mng_update_chart_set("ipv4", chart_data->num_req_client_current_ipv4); - lgs_mng_update_chart_set("ipv6", chart_data->num_req_client_current_ipv6); - lgs_mng_update_chart_end(p_file_info->parser_metrics->last_update); - } - - /* Request client all-time - update */ - if(p_file_info->parser_config->chart_config & CHART_REQ_CLIENT_ALL_TIME){ - for(time_t sec = p_file_info->parser_metrics->last_update - lag_in_sec; - sec < p_file_info->parser_metrics->last_update; - sec++){ - - lgs_mng_update_chart_begin(p_file_info->chartname, "clients_all"); - lgs_mng_update_chart_set("ipv4", chart_data->num_req_client_all_time_ipv4); - lgs_mng_update_chart_set("ipv6", chart_data->num_req_client_all_time_ipv6); - lgs_mng_update_chart_end(sec); - } - - chart_data->num_req_client_all_time_ipv4 = wlm->req_clients_alltime_arr.ipv4_size; - chart_data->num_req_client_all_time_ipv6 = wlm->req_clients_alltime_arr.ipv6_size; - - lgs_mng_update_chart_begin(p_file_info->chartname, "clients_all"); - lgs_mng_update_chart_set("ipv4", chart_data->num_req_client_all_time_ipv4); - lgs_mng_update_chart_set("ipv6", chart_data->num_req_client_all_time_ipv6); - lgs_mng_update_chart_end(p_file_info->parser_metrics->last_update); - } - - /* Request methods - update */ - if(p_file_info->parser_config->chart_config & CHART_REQ_METHODS){ - for(time_t sec = p_file_info->parser_metrics->last_update - lag_in_sec; - sec < p_file_info->parser_metrics->last_update; - sec++){ - - lgs_mng_update_chart_begin(p_file_info->chartname, "http_methods"); - for(int idx = 0; idx < REQ_METHOD_ARR_SIZE; idx++){ - if(chart_data->num_req_method[idx]) - lgs_mng_update_chart_set(req_method_str[idx], chart_data->num_req_method[idx]); - } - lgs_mng_update_chart_end(sec); - } - - lgs_mng_update_chart_begin(p_file_info->chartname, "http_methods"); - for(int idx = 0; idx < REQ_METHOD_ARR_SIZE; idx++){ - chart_data->num_req_method[idx] += wlm->req_method[idx]; - wlm->req_method[idx] = 0; - if(chart_data->num_req_method[idx]) - lgs_mng_update_chart_set(req_method_str[idx], chart_data->num_req_method[idx]); - } - lgs_mng_update_chart_end(p_file_info->parser_metrics->last_update); - } - - /* Request protocol - update */ - if(p_file_info->parser_config->chart_config & CHART_REQ_PROTO){ - for(time_t sec = p_file_info->parser_metrics->last_update - lag_in_sec; - sec < p_file_info->parser_metrics->last_update; - sec++){ - - lgs_mng_update_chart_begin(p_file_info->chartname, "http_versions"); - lgs_mng_update_chart_set("1.0", chart_data->num_req_proto_http_1); - lgs_mng_update_chart_set("1.1", chart_data->num_req_proto_http_1_1); - lgs_mng_update_chart_set("2.0", chart_data->num_req_proto_http_2); - lgs_mng_update_chart_set("other", chart_data->num_req_proto_other); - lgs_mng_update_chart_end(sec); - } - - chart_data->num_req_proto_http_1 += wlm->req_proto.http_1; - chart_data->num_req_proto_http_1_1 += wlm->req_proto.http_1_1; - chart_data->num_req_proto_http_2 += wlm->req_proto.http_2; - chart_data->num_req_proto_other += wlm->req_proto.other; - memset(&wlm->req_proto, 0, sizeof(wlm->req_proto)); - - lgs_mng_update_chart_begin(p_file_info->chartname, "http_versions"); - lgs_mng_update_chart_set("1.0", chart_data->num_req_proto_http_1); - lgs_mng_update_chart_set("1.1", chart_data->num_req_proto_http_1_1); - lgs_mng_update_chart_set("2.0", chart_data->num_req_proto_http_2); - lgs_mng_update_chart_set("other", chart_data->num_req_proto_other); - lgs_mng_update_chart_end(p_file_info->parser_metrics->last_update); - } - - /* Request bandwidth - update */ - if(p_file_info->parser_config->chart_config & CHART_BANDWIDTH){ - for(time_t sec = p_file_info->parser_metrics->last_update - lag_in_sec; - sec < p_file_info->parser_metrics->last_update; - sec++){ - - lgs_mng_update_chart_begin(p_file_info->chartname, "bandwidth"); - lgs_mng_update_chart_set("received", chart_data->num_bandwidth_req_size); - lgs_mng_update_chart_set("sent", chart_data->num_bandwidth_resp_size); - lgs_mng_update_chart_end(sec); - } - - chart_data->num_bandwidth_req_size += wlm->bandwidth.req_size; - chart_data->num_bandwidth_resp_size += wlm->bandwidth.resp_size; - memset(&wlm->bandwidth, 0, sizeof(wlm->bandwidth)); - - lgs_mng_update_chart_begin(p_file_info->chartname, "bandwidth"); - lgs_mng_update_chart_set("received", chart_data->num_bandwidth_req_size); - lgs_mng_update_chart_set("sent", chart_data->num_bandwidth_resp_size); - lgs_mng_update_chart_end(p_file_info->parser_metrics->last_update); - } - - /* Request proc time - update */ - if(p_file_info->parser_config->chart_config & CHART_REQ_PROC_TIME){ - for(time_t sec = p_file_info->parser_metrics->last_update - lag_in_sec; - sec < p_file_info->parser_metrics->last_update; - sec++){ - - lgs_mng_update_chart_begin(p_file_info->chartname, "timings"); - lgs_mng_update_chart_set("min", chart_data->num_req_proc_time_min); - lgs_mng_update_chart_set("max", chart_data->num_req_proc_time_max); - lgs_mng_update_chart_set("avg", chart_data->num_req_proc_time_avg); - lgs_mng_update_chart_end(sec); - } - - chart_data->num_req_proc_time_min = wlm->req_proc_time.min; - chart_data->num_req_proc_time_max = wlm->req_proc_time.max; - chart_data->num_req_proc_time_avg = wlm->req_proc_time.count ? - wlm->req_proc_time.sum / wlm->req_proc_time.count : 0; - memset(&wlm->req_proc_time, 0, sizeof(wlm->req_proc_time)); - - lgs_mng_update_chart_begin(p_file_info->chartname, "timings"); - lgs_mng_update_chart_set("min", chart_data->num_req_proc_time_min); - lgs_mng_update_chart_set("max", chart_data->num_req_proc_time_max); - lgs_mng_update_chart_set("avg", chart_data->num_req_proc_time_avg); - lgs_mng_update_chart_end(p_file_info->parser_metrics->last_update); - } - - /* Response code family - update */ - if(p_file_info->parser_config->chart_config & CHART_RESP_CODE_FAMILY){ - for(time_t sec = p_file_info->parser_metrics->last_update - lag_in_sec; - sec < p_file_info->parser_metrics->last_update; - sec++){ - - lgs_mng_update_chart_begin(p_file_info->chartname, "responses"); - lgs_mng_update_chart_set("1xx", chart_data->num_resp_code_family_1xx); - lgs_mng_update_chart_set("2xx", chart_data->num_resp_code_family_2xx); - lgs_mng_update_chart_set("3xx", chart_data->num_resp_code_family_3xx); - lgs_mng_update_chart_set("4xx", chart_data->num_resp_code_family_4xx); - lgs_mng_update_chart_set("5xx", chart_data->num_resp_code_family_5xx); - lgs_mng_update_chart_set("other", chart_data->num_resp_code_family_other); - lgs_mng_update_chart_end(sec); - } - - chart_data->num_resp_code_family_1xx += wlm->resp_code_family.resp_1xx; - chart_data->num_resp_code_family_2xx += wlm->resp_code_family.resp_2xx; - chart_data->num_resp_code_family_3xx += wlm->resp_code_family.resp_3xx; - chart_data->num_resp_code_family_4xx += wlm->resp_code_family.resp_4xx; - chart_data->num_resp_code_family_5xx += wlm->resp_code_family.resp_5xx; - chart_data->num_resp_code_family_other += wlm->resp_code_family.other; - memset(&wlm->resp_code_family, 0, sizeof(wlm->resp_code_family)); - - lgs_mng_update_chart_begin(p_file_info->chartname, "responses"); - lgs_mng_update_chart_set("1xx", chart_data->num_resp_code_family_1xx); - lgs_mng_update_chart_set("2xx", chart_data->num_resp_code_family_2xx); - lgs_mng_update_chart_set("3xx", chart_data->num_resp_code_family_3xx); - lgs_mng_update_chart_set("4xx", chart_data->num_resp_code_family_4xx); - lgs_mng_update_chart_set("5xx", chart_data->num_resp_code_family_5xx); - lgs_mng_update_chart_set("other", chart_data->num_resp_code_family_other); - lgs_mng_update_chart_end(p_file_info->parser_metrics->last_update); - } - - /* Response code - update */ - if(p_file_info->parser_config->chart_config & CHART_RESP_CODE){ - char dim_name[4]; - - for(time_t sec = p_file_info->parser_metrics->last_update - lag_in_sec; - sec < p_file_info->parser_metrics->last_update; - sec++){ - - lgs_mng_update_chart_begin(p_file_info->chartname, "detailed_responses"); - for(int idx = 0; idx < RESP_CODE_ARR_SIZE - 1; idx++){ - if(chart_data->num_resp_code[idx]){ - snprintfz(dim_name, 4, "%d", idx + 100); - lgs_mng_update_chart_set(dim_name, chart_data->num_resp_code[idx]); - } - } - if(chart_data->num_resp_code[RESP_CODE_ARR_SIZE - 1]) - lgs_mng_update_chart_set("other", chart_data->num_resp_code[RESP_CODE_ARR_SIZE - 1]); - lgs_mng_update_chart_end(sec); - } - - lgs_mng_update_chart_begin(p_file_info->chartname, "detailed_responses"); - for(int idx = 0; idx < RESP_CODE_ARR_SIZE - 1; idx++){ - chart_data->num_resp_code[idx] += wlm->resp_code[idx]; - wlm->resp_code[idx] = 0; - if(chart_data->num_resp_code[idx]){ - snprintfz(dim_name, 4, "%d", idx + 100); - lgs_mng_update_chart_set(dim_name, chart_data->num_resp_code[idx]); - } - } - chart_data->num_resp_code[RESP_CODE_ARR_SIZE - 1] += wlm->resp_code[RESP_CODE_ARR_SIZE - 1]; - wlm->resp_code[RESP_CODE_ARR_SIZE - 1] = 0; - if(chart_data->num_resp_code[RESP_CODE_ARR_SIZE - 1]) - lgs_mng_update_chart_set("other", chart_data->num_resp_code[RESP_CODE_ARR_SIZE - 1]); - lgs_mng_update_chart_end(p_file_info->parser_metrics->last_update); - } - - /* Response code type - update */ - if(p_file_info->parser_config->chart_config & CHART_RESP_CODE_TYPE){ - for(time_t sec = p_file_info->parser_metrics->last_update - lag_in_sec; - sec < p_file_info->parser_metrics->last_update; - sec++){ - - lgs_mng_update_chart_begin(p_file_info->chartname, "response_types"); - lgs_mng_update_chart_set("success", chart_data->num_resp_code_type_success); - lgs_mng_update_chart_set("redirect", chart_data->num_resp_code_type_redirect); - lgs_mng_update_chart_set("bad", chart_data->num_resp_code_type_bad); - lgs_mng_update_chart_set("error", chart_data->num_resp_code_type_error); - lgs_mng_update_chart_set("other", chart_data->num_resp_code_type_other); - lgs_mng_update_chart_end(sec); - } - - chart_data->num_resp_code_type_success += wlm->resp_code_type.resp_success; - chart_data->num_resp_code_type_redirect += wlm->resp_code_type.resp_redirect; - chart_data->num_resp_code_type_bad += wlm->resp_code_type.resp_bad; - chart_data->num_resp_code_type_error += wlm->resp_code_type.resp_error; - chart_data->num_resp_code_type_other += wlm->resp_code_type.other; - memset(&wlm->resp_code_type, 0, sizeof(wlm->resp_code_type)); - - lgs_mng_update_chart_begin(p_file_info->chartname, "response_types"); - lgs_mng_update_chart_set("success", chart_data->num_resp_code_type_success); - lgs_mng_update_chart_set("redirect", chart_data->num_resp_code_type_redirect); - lgs_mng_update_chart_set("bad", chart_data->num_resp_code_type_bad); - lgs_mng_update_chart_set("error", chart_data->num_resp_code_type_error); - lgs_mng_update_chart_set("other", chart_data->num_resp_code_type_other); - lgs_mng_update_chart_end(p_file_info->parser_metrics->last_update); - } - - /* SSL protocol - update */ - if(p_file_info->parser_config->chart_config & CHART_SSL_PROTO){ - for(time_t sec = p_file_info->parser_metrics->last_update - lag_in_sec; - sec < p_file_info->parser_metrics->last_update; - sec++){ - - lgs_mng_update_chart_begin(p_file_info->chartname, "ssl_protocol"); - lgs_mng_update_chart_set("TLSV1", chart_data->num_ssl_proto_tlsv1); - lgs_mng_update_chart_set("TLSV1.1", chart_data->num_ssl_proto_tlsv1_1); - lgs_mng_update_chart_set("TLSV1.2", chart_data->num_ssl_proto_tlsv1_2); - lgs_mng_update_chart_set("TLSV1.3", chart_data->num_ssl_proto_tlsv1_3); - lgs_mng_update_chart_set("SSLV2", chart_data->num_ssl_proto_sslv2); - lgs_mng_update_chart_set("SSLV3", chart_data->num_ssl_proto_sslv3); - lgs_mng_update_chart_set("other", chart_data->num_ssl_proto_other); - lgs_mng_update_chart_end(sec); - } - - chart_data->num_ssl_proto_tlsv1 += wlm->ssl_proto.tlsv1; - chart_data->num_ssl_proto_tlsv1_1 += wlm->ssl_proto.tlsv1_1; - chart_data->num_ssl_proto_tlsv1_2 += wlm->ssl_proto.tlsv1_2; - chart_data->num_ssl_proto_tlsv1_3 += wlm->ssl_proto.tlsv1_3; - chart_data->num_ssl_proto_sslv2 += wlm->ssl_proto.sslv2; - chart_data->num_ssl_proto_sslv3 += wlm->ssl_proto.sslv3; - chart_data->num_ssl_proto_other += wlm->ssl_proto.other; - memset(&wlm->ssl_proto, 0, sizeof(wlm->ssl_proto)); - - lgs_mng_update_chart_begin(p_file_info->chartname, "ssl_protocol"); - lgs_mng_update_chart_set("TLSV1", chart_data->num_ssl_proto_tlsv1); - lgs_mng_update_chart_set("TLSV1.1", chart_data->num_ssl_proto_tlsv1_1); - lgs_mng_update_chart_set("TLSV1.2", chart_data->num_ssl_proto_tlsv1_2); - lgs_mng_update_chart_set("TLSV1.3", chart_data->num_ssl_proto_tlsv1_3); - lgs_mng_update_chart_set("SSLV2", chart_data->num_ssl_proto_sslv2); - lgs_mng_update_chart_set("SSLV3", chart_data->num_ssl_proto_sslv3); - lgs_mng_update_chart_set("other", chart_data->num_ssl_proto_other); - lgs_mng_update_chart_end(p_file_info->parser_metrics->last_update); - } - - /* SSL cipher suite - update */ - if(p_file_info->parser_config->chart_config & CHART_SSL_CIPHER){ - for(time_t sec = p_file_info->parser_metrics->last_update - lag_in_sec; - sec < p_file_info->parser_metrics->last_update; - sec++){ - - lgs_mng_update_chart_begin(p_file_info->chartname, "ssl_cipher_suite"); - for(int idx = 0; idx < chart_data->ssl_cipher_size; idx++){ - lgs_mng_update_chart_set( wlm->ssl_cipher_arr.ssl_ciphers[idx].name, - chart_data->num_ssl_ciphers[idx]); - } - lgs_mng_update_chart_end(sec); - } - - if(wlm->ssl_cipher_arr.size > chart_data->ssl_cipher_size){ - chart_data->ssl_cipher_size = wlm->ssl_cipher_arr.size; - chart_data->num_ssl_ciphers = reallocz( chart_data->num_ssl_ciphers, - chart_data->ssl_cipher_size * sizeof(collected_number)); - - for(int idx = chart_data->ssl_cipher_size; idx < wlm->ssl_cipher_arr.size; idx++){ - chart_data->num_ssl_ciphers[idx] = 0; - lgs_mng_add_dim_post_init( &chart_data->cs_ssl_ciphers, - wlm->ssl_cipher_arr.ssl_ciphers[idx].name, - RRD_ALGORITHM_INCREMENTAL_NAME, 1, 1); - } - - chart_data->ssl_cipher_size = wlm->ssl_cipher_arr.size; - } - - lgs_mng_update_chart_begin(p_file_info->chartname, "ssl_cipher_suite"); - for(int idx = 0; idx < chart_data->ssl_cipher_size; idx++){ - chart_data->num_ssl_ciphers[idx] += wlm->ssl_cipher_arr.ssl_ciphers[idx].count; - wlm->ssl_cipher_arr.ssl_ciphers[idx].count = 0; - lgs_mng_update_chart_set( wlm->ssl_cipher_arr.ssl_ciphers[idx].name, - chart_data->num_ssl_ciphers[idx]); - } - lgs_mng_update_chart_end(p_file_info->parser_metrics->last_update); - } - - lgs_mng_do_custom_charts_update(p_file_info, lag_in_sec); - - chart_data->last_update = p_file_info->parser_metrics->last_update; - } -} diff --git a/src/logsmanagement/rrd_api/rrd_api_web_log.h b/src/logsmanagement/rrd_api/rrd_api_web_log.h deleted file mode 100644 index de0c88e32..000000000 --- a/src/logsmanagement/rrd_api/rrd_api_web_log.h +++ /dev/null @@ -1,88 +0,0 @@ -// SPDX-License-Identifier: GPL-3.0-or-later - -/** @file rrd_api_web_log.h - * @brief Incudes the structure and function definitions for - * the web log charts. - */ - -#ifndef RRD_API_WEB_LOG_H_ -#define RRD_API_WEB_LOG_H_ - -#include "daemon/common.h" - -struct File_info; - -typedef struct Chart_data_web_log chart_data_web_log_t; - -#include "../file_info.h" -#include "../circular_buffer.h" - -#include "rrd_api.h" - -struct Chart_data_web_log { - - time_t last_update; - - /* Number of collected log records */ - collected_number num_lines; - - /* Vhosts */ - struct Chart_str cs_vhosts; - collected_number *num_vhosts; - int vhost_size, vhost_size_max; /**< Actual size and maximum allocated size of dim_vhosts, num_vhosts arrays **/ - - /* Ports */ - struct Chart_str cs_ports; - collected_number *num_ports; - int port_size, port_size_max; /**< Actual size and maximum allocated size of dim_ports, num_ports and ports arrays **/ - - /* IP Version */ - collected_number num_ip_ver_4, num_ip_ver_6, num_ip_ver_invalid; - - /* Request client current poll */ - collected_number num_req_client_current_ipv4, num_req_client_current_ipv6; - - /* Request client all-time */ - collected_number num_req_client_all_time_ipv4, num_req_client_all_time_ipv6; - - /* Request methods */ - collected_number num_req_method[REQ_METHOD_ARR_SIZE]; - - /* Request protocol */ - collected_number num_req_proto_http_1, num_req_proto_http_1_1, - num_req_proto_http_2, num_req_proto_other; - - /* Request bandwidth */ - collected_number num_bandwidth_req_size, num_bandwidth_resp_size; - - /* Request processing time */ - collected_number num_req_proc_time_min, num_req_proc_time_max, num_req_proc_time_avg; - - /* Response code family */ - collected_number num_resp_code_family_1xx, num_resp_code_family_2xx, - num_resp_code_family_3xx, num_resp_code_family_4xx, - num_resp_code_family_5xx, num_resp_code_family_other; - - /* Response code */ - collected_number num_resp_code[RESP_CODE_ARR_SIZE]; - - /* Response code type */ - collected_number num_resp_code_type_success, num_resp_code_type_redirect, - num_resp_code_type_bad, num_resp_code_type_error, num_resp_code_type_other; - - /* SSL protocol */ - collected_number num_ssl_proto_tlsv1, num_ssl_proto_tlsv1_1, - num_ssl_proto_tlsv1_2, num_ssl_proto_tlsv1_3, - num_ssl_proto_sslv2, num_ssl_proto_sslv3, num_ssl_proto_other; - - /* SSL cipher suite */ - struct Chart_str cs_ssl_ciphers; - collected_number *num_ssl_ciphers; - int ssl_cipher_size; - -}; - -void web_log_chart_init(struct File_info *p_file_info); -void web_log_chart_update(struct File_info *p_file_info); - -#endif // RRD_API_WEB_LOG_H_ diff --git a/src/logsmanagement/stock_conf/logsmanagement.d.conf.in b/src/logsmanagement/stock_conf/logsmanagement.d.conf.in deleted file mode 100644 index 8ce4183a2..000000000 --- a/src/logsmanagement/stock_conf/logsmanagement.d.conf.in +++ /dev/null @@ -1,33 +0,0 @@ -[global] - update every = 1 - update timeout = 10 - use log timestamp = auto - circular buffer max size MiB = 64 - circular buffer drop logs if full = no - compression acceleration = 1 - collected logs total chart enable = no - collected logs rate chart enable = yes - submit logs to system journal = no - systemd journal fields prefix = LOGS_MANAG_ - -[db] - db mode = none - db dir = @cachedir_POST@/logs_management_db - circular buffer flush to db = 6 - disk space limit MiB = 500 - -[forward input] - enabled = no - unix path = - unix perm = 0644 - listen = 0.0.0.0 - port = 24224 - -[fluent bit] - flush = 0.1 - http listen = 0.0.0.0 - http port = 2020 - http server = false - log file = @localstatedir_POST@/log/netdata/fluentbit.log - log level = info - coro stack size = 24576 diff --git a/src/logsmanagement/stock_conf/logsmanagement.d/default.conf b/src/logsmanagement/stock_conf/logsmanagement.d/default.conf deleted file mode 100644 index c01fd2070..000000000 --- a/src/logsmanagement/stock_conf/logsmanagement.d/default.conf +++ /dev/null @@ -1,455 +0,0 @@ -# ------------------------------------------------------------------------------ -# Netdata Logs Management default configuration -# See full explanation on https://github.com/netdata/netdata/blob/master/src/logsmanagement/README.md -# -# To add a new log source, a new section must be added in this -# file with at least the following settings: -# -# [LOG SOURCE NAME] -# enabled = yes -# log type = flb_tail -# -# For a list of all available log types, see: -# https://github.com/netdata/netdata/blob/master/src/logsmanagement/README.md#types-of-available-collectors -# -# ------------------------------------------------------------------------------ - -[kmsg Logs] - ## Example: Log collector that will collect new kernel ring buffer logs - - ## Required settings - enabled = yes - log type = flb_kmsg - - ## Optional settings, common to all log source. - ## Uncomment to override global equivalents in netdata.conf. - # update every = 1 - # update timeout = 10 - use log timestamp = no - # circular buffer max size MiB = 64 - # circular buffer drop logs if full = no - # compression acceleration = 1 - # db mode = none - # circular buffer flush to db = 6 - # disk space limit MiB = 500 - - ## Drop kernel logs with priority higher than prio_level. - # prio level = 8 - - ## Charts to enable - # collected logs total chart enable = no - # collected logs rate chart enable = yes - severity chart = yes - subsystem chart = yes - device chart = yes - - ## Example of capturing specific kmsg events: - # custom 1 chart = USB connect/disconnect - # custom 1 regex name = connect - # custom 1 regex = .*\bNew USB device found\b.* - - # custom 2 chart = USB connect/disconnect - # custom 2 regex name = disconnect - # custom 2 regex = .*\bUSB disconnect\b.* - -[Systemd Logs] - ## Example: Log collector that will query journald to collect system logs - - ## Required settings - enabled = yes - log type = flb_systemd - - ## Optional settings, common to all log source. - ## Uncomment to override global equivalents in netdata.conf. - # update every = 1 - # update timeout = 10 - # use log timestamp = auto - # circular buffer max size MiB = 64 - # circular buffer drop logs if full = no - # compression acceleration = 1 - # db mode = none - # circular buffer flush to db = 6 - # disk space limit MiB = 500 - - ## Use default path to Systemd Journal - log path = auto - - ## Charts to enable - # collected logs total chart enable = no - # collected logs rate chart enable = yes - priority value chart = yes - severity chart = yes - facility chart = yes - -[Docker Events Logs] - ## Example: Log collector that will monitor the Docker daemon socket and - ## collect Docker event logs in a default format similar to executing - ## the `sudo docker events` command. - - ## Required settings - enabled = yes - log type = flb_docker_events - - ## Optional settings, common to all log source. - ## Uncomment to override global equivalents in netdata.conf. - # update every = 1 - # update timeout = 10 - # use log timestamp = auto - # circular buffer max size MiB = 64 - # circular buffer drop logs if full = no - # compression acceleration = 1 - # db mode = none - # circular buffer flush to db = 6 - # disk space limit MiB = 500 - - ## Use default Docker socket UNIX path: /var/run/docker.sock - log path = auto - - ## Submit structured log entries to the system journal - # submit logs to system journal = no - - ## Charts to enable - # collected logs total chart enable = no - # collected logs rate chart enable = yes - event type chart = yes - event action chart = yes - - ## Example of how to capture create / attach / die events for a named container: - # custom 1 chart = serverA events - # custom 1 regex name = container create - # custom 1 regex = .*\bcontainer create\b.*\bname=serverA\b.* - - # custom 2 chart = serverA events - # custom 2 regex name = container attach - # custom 2 regex = .*\bcontainer attach\b.*\bname=serverA\b.* - - # custom 3 chart = serverA events - # custom 3 regex name = container die - # custom 3 regex = .*\bcontainer die\b.*\bname=serverA\b.* - - ## Stream to https://cloud.openobserve.ai/ - # output 1 name = http - # output 1 URI = YOUR_API_URI - # output 1 Host = api.openobserve.ai - # output 1 Port = 443 - # output 1 tls = On - # output 1 Format = json - # output 1 Json_date_key = _timestamp - # output 1 Json_date_format = iso8601 - # output 1 HTTP_User = test@netdata.cloud - # output 1 HTTP_Passwd = YOUR_OPENOBSERVE_PASSWORD - # output 1 compress = gzip - - ## Real-time export to /tmp/docker_event_logs.csv - # output 2 name = file - # output 2 Path = /tmp - # output 2 File = docker_event_logs.csv - -[Apache access.log] - ## Example: Log collector that will tail Apache's access.log file and - ## parse each new record to extract common web server metrics. - - ## Required settings - enabled = yes - log type = flb_web_log - - ## Optional settings, common to all log source. - ## Uncomment to override global equivalents in netdata.conf. - # update every = 1 - # update timeout = 10 - # use log timestamp = auto - # circular buffer max size MiB = 64 - # circular buffer drop logs if full = no - # compression acceleration = 1 - # db mode = none - # circular buffer flush to db = 6 - # disk space limit MiB = 500 - - ## This section supports auto-detection of log file path if section name - ## is left unchanged, otherwise it can be set manually, e.g.: - ## log path = /var/log/apache2/access.log - ## See README for more information on 'log path = auto' option - log path = auto - - ## Use inotify instead of file stat watcher. Set to 'no' to reduce CPU usage. - use inotify = yes - - ## Auto-detect web log format, otherwise it can be set manually, e.g.: - ## log format = %h %l %u %t "%r" %>s %b "%{Referer}i" "%{User-agent}i" - ## see https://httpd.apache.org/docs/2.4/logs.html#accesslog - log format = auto - - ## Detect errors such as illegal port numbers or response codes. - verify parsed logs = yes - - ## Submit structured log entries to the system journal - # submit logs to system journal = no - - ## Charts to enable - # collected logs total chart enable = no - # collected logs rate chart enable = yes - vhosts chart = yes - ports chart = yes - IP versions chart = yes - unique client IPs - current poll chart = yes - unique client IPs - all-time chart = no - http request methods chart = yes - http protocol versions chart = yes - bandwidth chart = yes - timings chart = yes - response code families chart = yes - response codes chart = yes - response code types chart = yes - SSL protocols chart = yes - SSL chipher suites chart = yes - -[Nginx access.log] - ## Example: Log collector that will tail Nginx's access.log file and - ## parse each new record to extract common web server metrics. - - ## Required settings - enabled = yes - log type = flb_web_log - - ## Optional settings, common to all log source. - ## Uncomment to override global equivalents in netdata.conf. - # update every = 1 - # update timeout = 10 - # use log timestamp = auto - # circular buffer max size MiB = 64 - # circular buffer drop logs if full = no - # compression acceleration = 1 - # db mode = none - # circular buffer flush to db = 6 - # disk space limit MiB = 500 - - ## This section supports auto-detection of log file path if section name - ## is left unchanged, otherwise it can be set manually, e.g.: - ## log path = /var/log/nginx/access.log - ## See README for more information on 'log path = auto' option - log path = auto - - ## Use inotify instead of file stat watcher. Set to 'no' to reduce CPU usage. - use inotify = yes - - ## see https://docs.nginx.com/nginx/admin-guide/monitoring/logging/#setting-up-the-access-log - log format = $remote_addr - $remote_user [$time_local] "$request" $status $body_bytes_sent $request_length $request_time "$http_referer" "$http_user_agent" - - ## Detect errors such as illegal port numbers or response codes. - verify parsed logs = yes - - ## Submit structured log entries to the system journal - # submit logs to system journal = no - - ## Charts to enable - # collected logs total chart enable = no - # collected logs rate chart enable = yes - vhosts chart = yes - ports chart = yes - IP versions chart = yes - unique client IPs - current poll chart = yes - unique client IPs - all-time chart = no - http request methods chart = yes - http protocol versions chart = yes - bandwidth chart = yes - timings chart = yes - response code families chart = yes - response codes chart = yes - response code types chart = yes - SSL protocols chart = yes - SSL chipher suites chart = yes - -[Netdata daemon.log] - ## Example: Log collector that will tail Netdata's daemon.log and - ## it will generate log level charts based on custom regular expressions. - - ## Required settings - enabled = yes - log type = flb_tail - - ## Optional settings, common to all log source. - ## Uncomment to override global equivalents in netdata.conf. - # update every = 1 - # update timeout = 10 - # use log timestamp = auto - # circular buffer max size MiB = 64 - # circular buffer drop logs if full = no - # compression acceleration = 1 - # db mode = none - # circular buffer flush to db = 6 - # disk space limit MiB = 500 - - ## This section supports auto-detection of log file path if section name - ## is left unchanged, otherwise it can be set manually, e.g.: - ## log path = /tmp/netdata/var/log/netdata/daemon.log - ## See README for more information on 'log path = auto' option - log path = auto - - ## Use inotify instead of file stat watcher. Set to 'no' to reduce CPU usage. - use inotify = yes - - ## Submit structured log entries to the system journal - # submit logs to system journal = no - - ## Charts to enable - # collected logs total chart enable = no - # collected logs rate chart enable = yes - - ## Examples of extracting custom metrics from Netdata's daemon.log: - - ## log level chart - custom 1 chart = log level - custom 1 regex name = emergency - custom 1 regex = level=emergency - custom 1 ignore case = no - - custom 2 chart = log level - custom 2 regex name = alert - custom 2 regex = level=alert - custom 2 ignore case = no - - custom 3 chart = log level - custom 3 regex name = critical - custom 3 regex = level=critical - custom 3 ignore case = no - - custom 4 chart = log level - custom 4 regex name = error - custom 4 regex = level=error - custom 4 ignore case = no - - custom 5 chart = log level - custom 5 regex name = warning - custom 5 regex = level=warning - custom 5 ignore case = no - - custom 6 chart = log level - custom 6 regex name = notice - custom 6 regex = level=notice - custom 6 ignore case = no - - custom 7 chart = log level - custom 7 regex name = info - custom 7 regex = level=info - custom 7 ignore case = no - - custom 8 chart = log level - custom 8 regex name = debug - custom 8 regex = level=debug - custom 8 ignore case = no - -[Netdata fluentbit.log] - ## Example: Log collector that will tail Netdata's - ## embedded Fluent Bit's logs - - ## Required settings - enabled = no - log type = flb_tail - - ## Optional settings, common to all log source. - ## Uncomment to override global equivalents in netdata.conf. - # update every = 1 - # update timeout = 10 - # use log timestamp = auto - # circular buffer max size MiB = 64 - # circular buffer drop logs if full = no - # compression acceleration = 1 - # db mode = none - # circular buffer flush to db = 6 - # disk space limit MiB = 500 - - ## This section supports auto-detection of log file path if section name - ## is left unchanged, otherwise it can be set manually, e.g.: - ## log path = /tmp/netdata/var/log/netdata/fluentbit.log - ## See README for more information on 'log path = auto' option - log path = auto - - ## Use inotify instead of file stat watcher. Set to 'no' to reduce CPU usage. - use inotify = yes - - ## Submit structured log entries to the system journal - # submit logs to system journal = no - - ## Charts to enable - # collected logs total chart enable = no - # collected logs rate chart enable = yes - - ## Examples of extracting custom metrics from fluentbit.log: - - ## log level chart - custom 1 chart = log level - custom 1 regex name = error - custom 1 regex = \[error\] - custom 1 ignore case = no - - custom 2 chart = log level - custom 2 regex name = warning - custom 2 regex = \[warning\] - custom 2 ignore case = no - - custom 3 chart = log level - custom 3 regex name = info - custom 3 regex = \[ info\] - custom 3 ignore case = no - - custom 4 chart = log level - custom 4 regex name = debug - custom 4 regex = \[debug\] - custom 4 ignore case = no - - custom 5 chart = log level - custom 5 regex name = trace - custom 5 regex = \[trace\] - custom 5 ignore case = no - -[auth.log tail] - ## Example: Log collector that will tail auth.log file and count - ## occurences of certain `sudo` commands, using POSIX regular expressions. - - ## Required settings - enabled = no - log type = flb_tail - - ## Optional settings, common to all log source. - ## Uncomment to override global equivalents in netdata.conf. - # update every = 1 - # update timeout = 10 - # use log timestamp = auto - # circular buffer max size MiB = 64 - # circular buffer drop logs if full = no - # compression acceleration = 1 - # db mode = none - # circular buffer flush to db = 6 - # disk space limit MiB = 500 - - ## This section supports auto-detection of log file path if section name - ## is left unchanged, otherwise it can be set manually, e.g.: - ## log path = /var/log/auth.log - ## See README for more information on 'log path = auto' option - log path = auto - - ## Use inotify instead of file stat watcher. Set to 'no' to reduce CPU usage. - use inotify = yes - - ## Submit structured log entries to the system journal - # submit logs to system journal = no - - ## Charts to enable - # collected logs total chart enable = no - # collected logs rate chart enable = yes - - ## Examples of extracting custom metrics from auth.log: - # custom 1 chart = failed su - # # custom 1 regex name = - # custom 1 regex = .*\bsu\b.*\bFAILED SU\b.* - # custom 1 ignore case = no - - # custom 2 chart = sudo commands - # custom 2 regex name = sudo su - # custom 2 regex = .*\bsudo\b.*\bCOMMAND=/usr/bin/su\b.* - # custom 2 ignore case = yes - - # custom 3 chart = sudo commands - # custom 3 regex name = sudo docker run - # custom 3 regex = .*\bsudo\b.*\bCOMMAND=/usr/bin/docker run\b.* - # custom 3 ignore case = yes diff --git a/src/logsmanagement/stock_conf/logsmanagement.d/example_forward.conf b/src/logsmanagement/stock_conf/logsmanagement.d/example_forward.conf deleted file mode 100644 index 87921d25e..000000000 --- a/src/logsmanagement/stock_conf/logsmanagement.d/example_forward.conf +++ /dev/null @@ -1,96 +0,0 @@ -[Forward systemd] - ## Example: Log collector that will collect streamed Systemd logs - ## only for parsing, according to global "forward in" configuration - ## found in logsmanagement.d.conf . - - ## Required settings - enabled = no - log type = flb_systemd - - ## Optional settings, common to all log source. - ## Uncomment to override global equivalents in netdata.conf. - # update every = 1 - # update timeout = 10 - # use log timestamp = auto - # circular buffer max size MiB = 64 - # circular buffer drop logs if full = no - # compression acceleration = 1 - # db mode = none - # circular buffer flush to db = 6 - # disk space limit MiB = 500 - - ## Streaming input settings. - log source = forward - stream guid = 6ce266f5-2704-444d-a301-2423b9d30735 - - ## Charts to enable - # collected logs total chart enable = no - # collected logs rate chart enable = yes - priority value chart = yes - severity chart = yes - facility chart = yes - -[Forward Docker Events] - ## Example: Log collector that will collect streamed Docker Events logs - ## only for parsing, according to global "forward in" configuration - ## found in logsmanagement.d.conf . - - ## Required settings - enabled = no - log type = flb_docker_events - - ## Optional settings, common to all log source. - ## Uncomment to override global equivalents in netdata.conf. - # update every = 1 - # update timeout = 10 - # use log timestamp = auto - # circular buffer max size MiB = 64 - # circular buffer drop logs if full = no - # compression acceleration = 1 - # db mode = none - # circular buffer flush to db = 6 - # disk space limit MiB = 500 - - ## Submit structured log entries to the system journal - # submit logs to system journal = no - - ## Streaming input settings. - log source = forward - stream guid = 6ce266f5-2704-444d-a301-2423b9d30736 - - ## Charts to enable - # collected logs total chart enable = no - # collected logs rate chart enable = yes - event type chart = yes - -[Forward collection] - ## Example: Log collector that will collect streamed logs of any type - ## according to global "forward in" configuration found in - ## logsmanagement.d.conf and will also save them in the logs database. - - ## Required settings - enabled = no - log type = flb_tail - - ## Optional settings, common to all log source. - ## Uncomment to override global equivalents in netdata.conf. - # update every = 1 - # update timeout = 10 - # use log timestamp = auto - # circular buffer max size MiB = 64 - # circular buffer drop logs if full = no - # compression acceleration = 1 - db mode = full - # circular buffer flush to db = 6 - # disk space limit MiB = 500 - - ## Submit structured log entries to the system journal - # submit logs to system journal = no - - ## Streaming input settings. - log source = forward - stream guid = 6ce266f5-2704-444d-a301-2423b9d30737 - - ## Charts to enable - # collected logs total chart enable = no - # collected logs rate chart enable = yes diff --git a/src/logsmanagement/stock_conf/logsmanagement.d/example_mqtt.conf b/src/logsmanagement/stock_conf/logsmanagement.d/example_mqtt.conf deleted file mode 100644 index 2481795df..000000000 --- a/src/logsmanagement/stock_conf/logsmanagement.d/example_mqtt.conf +++ /dev/null @@ -1,31 +0,0 @@ -[MQTT messages] - ## Example: Log collector that will create a server to listen for MQTT logs over a TCP connection. - - ## Required settings - enabled = no - log type = flb_mqtt - - ## Optional settings, common to all log source. - ## Uncomment to override global equivalents in netdata.conf. - # update every = 1 - # update timeout = 10 - # use log timestamp = auto - # circular buffer max size MiB = 64 - # circular buffer drop logs if full = no - # compression acceleration = 1 - # db mode = none - # circular buffer flush to db = 6 - # disk space limit MiB = 500 - - ## Set up configuration specific to flb_mqtt - ## see also https://docs.fluentbit.io/manual/pipeline/inputs/mqtt - # listen = 0.0.0.0 - # port = 1883 - - ## Submit structured log entries to the system journal - # submit logs to system journal = no - - ## Charts to enable - # collected logs total chart enable = no - # collected logs rate chart enable = yes - topic chart = yes diff --git a/src/logsmanagement/stock_conf/logsmanagement.d/example_serial.conf b/src/logsmanagement/stock_conf/logsmanagement.d/example_serial.conf deleted file mode 100644 index 7b0bb0bcb..000000000 --- a/src/logsmanagement/stock_conf/logsmanagement.d/example_serial.conf +++ /dev/null @@ -1,38 +0,0 @@ -[Serial logs] - ## Example: Log collector that will collect logs from a serial interface. - - ## Required settings - enabled = no - log type = flb_serial - - ## Optional settings, common to all log source. - ## Uncomment to override global equivalents in netdata.conf. - # update every = 1 - # update timeout = 10 - # use log timestamp = auto - # circular buffer max size MiB = 64 - # circular buffer drop logs if full = no - # compression acceleration = 1 - # db mode = none - # circular buffer flush to db = 6 - # disk space limit MiB = 500 - - ## Set up configuration specific to flb_serial - log path = /dev/pts/4 - bitrate = 115200 - min bytes = 1 - # separator = X - # format = json - - ## Submit structured log entries to the system journal - # submit logs to system journal = no - - ## Charts to enable - # collected logs total chart enable = no - # collected logs rate chart enable = yes - - ## Example of extracting custom metrics from serial interface messages: - # custom 1 chart = UART0 - # # custom 1 regex name = test - # custom 1 regex = .*\bUART0\b.* - # # custom 1 ignore case = no diff --git a/src/logsmanagement/stock_conf/logsmanagement.d/example_syslog.conf b/src/logsmanagement/stock_conf/logsmanagement.d/example_syslog.conf deleted file mode 100644 index 2dbd416e2..000000000 --- a/src/logsmanagement/stock_conf/logsmanagement.d/example_syslog.conf +++ /dev/null @@ -1,145 +0,0 @@ -[syslog tail] - ## Example: Log collector that will tail the syslog file and count - ## occurences of certain keywords, using POSIX regular expressions. - - ## Required settings - enabled = no - log type = flb_tail - - ## Optional settings, common to all log source. - ## Uncomment to override global equivalents in netdata.conf. - # update every = 1 - # update timeout = 10 - # use log timestamp = auto - # circular buffer max size MiB = 64 - # circular buffer drop logs if full = no - # compression acceleration = 1 - # db mode = none - # circular buffer flush to db = 6 - # disk space limit MiB = 500 - - ## This section supports auto-detection of log file path if section name - ## is left unchanged, otherwise it can be set manually, e.g.: - ## log path = /var/log/syslog - ## log path = /var/log/messages - ## See README for more information on 'log path = auto' option - log path = auto - - ## Use inotify instead of file stat watcher. Set to 'no' to reduce CPU usage. - use inotify = yes - - ## Submit structured log entries to the system journal - # submit logs to system journal = no - - ## Charts to enable - # collected logs total chart enable = no - # collected logs rate chart enable = yes - - ## Examples of extracting custom metrics from syslog: - # custom 1 chart = identifier - # custom 1 regex name = kernel - # custom 1 regex = .*\bkernel\b.* - # custom 1 ignore case = no - - # custom 2 chart = identifier - # custom 2 regex name = systemd - # custom 2 regex = .*\bsystemd\b.* - # custom 2 ignore case = no - - # custom 3 chart = identifier - # custom 3 regex name = CRON - # custom 3 regex = .*\bCRON\b.* - # custom 3 ignore case = no - - # custom 3 chart = identifier - # custom 3 regex name = netdata - # custom 3 regex = .*\netdata\b.* - # custom 3 ignore case = no - -[syslog Unix socket] - ## Example: Log collector that will listen for RFC-3164 syslog on a UNIX - ## socket that will be created on /tmp/netdata-syslog.sock . - - ## Required settings - enabled = no - log type = flb_syslog - - ## Optional settings, common to all log source. - ## Uncomment to override global equivalents in netdata.conf. - # update every = 1 - # update timeout = 10 - # use log timestamp = auto - # circular buffer max size MiB = 64 - # circular buffer drop logs if full = no - # compression acceleration = 1 - # db mode = none - # circular buffer flush to db = 6 - # disk space limit MiB = 500 - - ## Netdata will create this socket if mode == unix_tcp or mode == unix_udp, - ## please ensure the right permissions exist for this path - log path = /tmp/netdata-syslog.sock - - ## Ruby Regular Expression to define expected syslog format - ## Please make sure <PRIVAL>, <SYSLOG_TIMESTAMP>, <HOSTNAME>, <SYSLOG_IDENTIFIER>, <PID> and <MESSAGE> are defined - ## see also https://docs.fluentbit.io/manual/pipeline/parsers/regular-expression - log format = /^\<(?<PRIVAL>[0-9]+)\>(?<SYSLOG_TIMESTAMP>[^ ]* {1,2}[^ ]* [^ ]* )(?<HOSTNAME>[^ ]*) (?<SYSLOG_IDENTIFIER>[a-zA-Z0-9_\/\.\-]*)(?:\[(?<PID>[0-9]+)\])?(?:[^\:]*\:)? *(?<MESSAGE>.*)$/ - - ## Set up configuration specific to flb_syslog - ## see also https://docs.fluentbit.io/manual/pipeline/inputs/syslog#configuration-parameters - ## Modes supported are: unix_tcp, unix_udp, tcp, udp - mode = unix_udp - # listen = 0.0.0.0 - # port = 5140 - unix_perm = 0666 - - ## Charts to enable - # collected logs total chart enable = no - # collected logs rate chart enable = yes - priority value chart = yes - severity chart = yes - facility chart = yes - -[syslog TCP socket] - ## Example: Log collector that will listen for RFC-3164 syslog, - ## incoming via TCP on localhost IP and port 5140. - - ## Required settings - enabled = no - log type = flb_syslog - - ## Optional settings, common to all log source. - ## Uncomment to override global equivalents in netdata.conf. - # update every = 1 - # update timeout = 10 - # use log timestamp = auto - # circular buffer max size MiB = 64 - # circular buffer drop logs if full = no - # compression acceleration = 1 - # db mode = none - # circular buffer flush to db = 6 - # disk space limit MiB = 500 - - ## Netdata will create this socket if mode == unix_tcp or mode == unix_udp, - ## please ensure the right permissions exist for this path - # log path = /tmp/netdata-syslog.sock - - ## Ruby Regular Expression to define expected syslog format - ## Please make sure <PRIVAL>, <SYSLOG_TIMESTAMP>, <HOSTNAME>, <SYSLOG_IDENTIFIER>, <PID> and <MESSAGE> are defined - ## see also https://docs.fluentbit.io/manual/pipeline/parsers/regular-expression - log format = /^\<(?<PRIVAL>[0-9]+)\>(?<SYSLOG_TIMESTAMP>[^ ]* {1,2}[^ ]* [^ ]* )(?<HOSTNAME>[^ ]*) (?<SYSLOG_IDENTIFIER>[a-zA-Z0-9_\/\.\-]*)(?:\[(?<PID>[0-9]+)\])?(?:[^\:]*\:)? *(?<MESSAGE>.*)$/ - - ## Set up configuration specific to flb_syslog - ## see also https://docs.fluentbit.io/manual/pipeline/inputs/syslog#configuration-parameters - ## Modes supported are: unix_tcp, unix_udp, tcp, udp - mode = tcp - listen = 0.0.0.0 - port = 5140 - # unix_perm = 0666 - - ## Charts to enable - # collected logs total chart enable = no - # collected logs rate chart enable = yes - priority value chart = yes - severity chart = yes - facility chart = yes diff --git a/src/logsmanagement/unit_test/unit_test.c b/src/logsmanagement/unit_test/unit_test.c deleted file mode 100644 index d9a490d43..000000000 --- a/src/logsmanagement/unit_test/unit_test.c +++ /dev/null @@ -1,787 +0,0 @@ -// SPDX-License-Identifier: GPL-3.0-or-later - -/** @file unit_test.h - * @brief Includes unit tests for the Logs Management project - */ - -#include "unit_test.h" -#include <stdlib.h> -#include <stdio.h> - -#ifndef __USE_XOPEN_EXTENDED -#define __USE_XOPEN_EXTENDED -#endif - -#include <ftw.h> -#include <unistd.h> -#include "../circular_buffer.h" -#include "../helper.h" -#include "../logsmanag_config.h" -#include "../parser.h" -#include "../query.h" -#include "../db_api.h" - -static int old_stdout = STDOUT_FILENO; -static int old_stderr = STDERR_FILENO; - -#define SUPRESS_STDX(stream_no) \ -{ \ - if(stream_no == STDOUT_FILENO) \ - old_stdout = dup(old_stdout); \ - else \ - old_stderr = dup(old_stderr); \ - if(!freopen("/dev/null", "w", stream_no == STDOUT_FILENO ? stdout : stderr)) \ - exit(-1); \ -} - -#define UNSUPRESS_STDX(stream_no) \ -{ \ - fclose(stream_no == STDOUT_FILENO ? stdout : stderr); \ - if(stream_no == STDOUT_FILENO) \ - stdout = fdopen(old_stdout, "w"); \ - else \ - stderr = fdopen(old_stderr, "w"); \ -} - -#define SUPRESS_STDOUT() SUPRESS_STDX(STDOUT_FILENO) -#define SUPRESS_STDERR() SUPRESS_STDX(STDERR_FILENO) -#define UNSUPRESS_STDOUT() UNSUPRESS_STDX(STDOUT_FILENO) -#define UNSUPRESS_STDERR() UNSUPRESS_STDX(STDERR_FILENO) - -#define LOG_RECORDS_PARTIAL "\ -127.0.0.1 - - [30/Jun/2022:16:43:51 +0300] \"GET / HTTP/1.0\" 200 11192 \"-\" \"ApacheBench/2.3\"\n\ -192.168.2.1 - - [30/Jun/2022:16:43:51 +0300] \"PUT / HTTP/1.0\" 400 11192 \"-\" \"ApacheBench/2.3\"\n\ -255.91.204.202 - mann1475 [30/Jun/2023:21:05:09 +0000] \"POST /vertical/turn-key/engineer/e-enable HTTP/1.0\" 401 11411\n\ -91.126.60.234 - ritchie4302 [30/Jun/2023:21:05:09 +0000] \"PATCH /empower/interfaces/deploy HTTP/2.0\" 404 29063\n\ -120.134.242.160 - runte5364 [30/Jun/2023:21:05:09 +0000] \"GET /visualize/enterprise/optimize/embrace HTTP/1.0\" 400 10637\n\ -61.134.57.25 - - [30/Jun/2023:21:05:09 +0000] \"HEAD /metrics/optimize/bandwidth HTTP/1.1\" 200 26713\n\ -18.90.118.50 - - [30/Jun/2023:21:05:09 +0000] \"PATCH /methodologies/extend HTTP/2.0\" 205 15708\n\ -21.174.251.223 - zulauf8852 [30/Jun/2023:21:05:09 +0000] \"POST /proactive HTTP/2.0\" 100 9456\n\ -20.217.190.46 - - [30/Jun/2023:21:05:09 +0000] \"GET /mesh/frictionless HTTP/1.1\" 301 3153\n\ -130.43.250.80 - hintz5738 [30/Jun/2023:21:05:09 +0000] \"PATCH /e-markets/supply-chains/mindshare HTTP/2.0\" 401 13039\n\ -222.36.95.121 - pouros3514 [30/Jun/2023:21:05:09 +0000] \"DELETE /e-commerce/scale/customized/best-of-breed HTTP/1.0\" 406 8304\n\ -133.117.9.29 - hoeger7673 [30/Jun/2023:21:05:09 +0000] \"PUT /extensible/maximize/visualize/bricks-and-clicks HTTP/1.0\" 403 17067\n\ -65.145.39.136 - heathcote3368 [30/Jun/2023:21:05:09 +0000] \"DELETE /technologies/iterate/viral HTTP/1.1\" 501 29982\n\ -153.132.199.122 - murray8217 [30/Jun/2023:21:05:09 +0000] \"PUT /orchestrate/visionary/visualize HTTP/1.1\" 500 12705\n\ -140.149.178.196 - hickle8613 [30/Jun/2023:21:05:09 +0000] \"PATCH /drive/front-end/infomediaries/maximize HTTP/1.1\" 406 20179\n\ -237.31.189.207 - - [30/Jun/2023:21:05:09 +0000] \"GET /bleeding-edge/recontextualize HTTP/1.1\" 406 24815\n\ -210.217.232.107 - - [30/Jun/2023:21:05:09 +0000] \"POST /redefine/next-generation/relationships/intuitive HTTP/2.0\" 205 14028\n\ -121.2.189.119 - marvin5528 [30/Jun/2023:21:05:09 +0000] \"PUT /sexy/innovative HTTP/2.0\" 204 10689\n\ -120.13.121.164 - jakubowski1027 [30/Jun/2023:21:05:09 +0000] \"PUT /sexy/initiatives/morph/eyeballs HTTP/1.0\" 502 22287\n\ -28.229.107.175 - wilderman8830 [30/Jun/2023:21:05:09 +0000] \"PATCH /visionary/best-of-breed HTTP/1.1\" 503 6010\n\ -210.147.186.50 - - [30/Jun/2023:21:05:09 +0000] \"PUT /paradigms HTTP/2.0\" 501 18054\n\ -185.157.236.127 - - [30/Jun/2023:21:05:09 +0000] \"GET /maximize HTTP/1.0\" 400 13650\n\ -236.90.19.165 - - [30/Jun/2023:21:23:34 +0000] \"GET /next-generation/user-centric/24%2f365 HTTP/1.0\" 400 5212\n\ -233.182.111.100 - torphy3512 [30/Jun/2023:21:23:34 +0000] \"PUT /seamless/incentivize HTTP/1.0\" 304 27750\n\ -80.185.129.193 - - [30/Jun/2023:21:23:34 +0000] \"HEAD /strategic HTTP/1.1\" 502 6146\n\ -182.145.92.52 - - [30/Jun/2023:21:23:34 +0000] \"PUT /dot-com/grow/networks HTTP/1.0\" 301 1763\n\ -46.14.122.16 - - [30/Jun/2023:21:23:34 +0000] \"HEAD /deliverables HTTP/1.0\" 301 7608\n\ -162.111.143.158 - bruen3883 [30/Jun/2023:21:23:34 +0000] \"POST /extensible HTTP/2.0\" 403 22752\n\ -201.13.111.255 - hilpert8768 [30/Jun/2023:21:23:34 +0000] \"PATCH /applications/engage/frictionless/content HTTP/1.0\" 406 24866\n\ -76.90.243.15 - - [30/Jun/2023:21:23:34 +0000] \"PATCH /24%2f7/seamless/target/enable HTTP/1.1\" 503 8176\n\ -187.79.114.48 - - [30/Jun/2023:21:23:34 +0000] \"GET /synergistic HTTP/1.0\" 503 14251\n\ -59.52.178.62 - kirlin3704 [30/Jun/2023:21:23:34 +0000] \"POST /web-readiness/grow/evolve HTTP/1.0\" 501 13305\n\ -27.46.78.167 - - [30/Jun/2023:21:23:34 +0000] \"PATCH /interfaces/schemas HTTP/2.0\" 100 4860\n\ -191.9.15.43 - goodwin7310 [30/Jun/2023:21:23:34 +0000] \"POST /engage/innovate/web-readiness/roi HTTP/2.0\" 404 4225\n\ -195.153.126.148 - klein8350 [30/Jun/2023:21:23:34 +0000] \"DELETE /killer/synthesize HTTP/1.0\" 204 15134\n\ -162.207.64.184 - mayert4426 [30/Jun/2023:21:23:34 +0000] \"HEAD /intuitive/vertical/incentivize HTTP/1.0\" 204 23666\n\ -185.96.7.205 - - [30/Jun/2023:21:23:34 +0000] \"DELETE /communities/deliver/user-centric HTTP/1.0\" 416 18210\n\ -187.180.105.55 - - [30/Jun/2023:21:23:34 +0000] \"POST /customized HTTP/2.0\" 200 1396\n\ -216.82.243.54 - kunze7200 [30/Jun/2023:21:23:34 +0000] \"PUT /e-tailers/evolve/leverage/engage HTTP/2.0\" 504 1665\n\ -170.128.69.228 - - [30/Jun/2023:21:23:34 +0000] \"DELETE /matrix/open-source/proactive HTTP/1.0\" 301 18326\n\ -253.200.84.66 - steuber5220 [30/Jun/2023:21:23:34 +0000] \"POST /benchmark/experiences HTTP/1.1\" 504 18944\n\ -28.240.40.161 - - [30/Jun/2023:21:23:34 +0000] \"PATCH /initiatives HTTP/1.0\" 500 6500\n\ -134.163.236.75 - - [30/Jun/2023:21:23:34 +0000] \"HEAD /platforms/recontextualize HTTP/1.0\" 203 22188\n\ -241.64.230.66 - - [30/Jun/2023:21:23:34 +0000] \"GET /cutting-edge/methodologies/b2c/cross-media HTTP/1.1\" 403 20698\n\ -210.216.183.157 - okuneva6218 [30/Jun/2023:21:23:34 +0000] \"POST /generate/incentivize HTTP/2.0\" 403 25900\n\ -164.219.134.242 - - [30/Jun/2023:21:23:34 +0000] \"HEAD /efficient/killer/whiteboard HTTP/2.0\" 501 22081\n\ -173.156.54.99 - harvey6165 [30/Jun/2023:21:23:34 +0000] \"HEAD /dynamic/cutting-edge/sexy/user-centric HTTP/2.0\" 200 2995\n\ -215.242.74.14 - - [30/Jun/2023:21:23:34 +0000] \"PUT /roi HTTP/1.0\" 204 9674\n\ -133.77.49.187 - lockman3141 [30/Jun/2023:21:23:34 +0000] \"PUT /mindshare/transition HTTP/2.0\" 503 2726\n\ -159.77.190.255 - - [30/Jun/2023:21:23:34 +0000] \"DELETE /world-class/bricks-and-clicks HTTP/1.1\" 501 21712\n\ -65.6.237.113 - - [30/Jun/2023:21:23:34 +0000] \"PATCH /e-enable HTTP/2.0\" 405 11865\n\ -194.76.211.16 - champlin6280 [30/Jun/2023:21:23:34 +0000] \"PUT /applications/redefine/eyeballs/mindshare HTTP/1.0\" 302 27679\n\ -96.206.219.202 - - [30/Jun/2023:21:23:34 +0000] \"PUT /solutions/mindshare/vortals/transition HTTP/1.0\" 403 7385\n\ -255.80.116.201 - hintz8162 [30/Jun/2023:21:23:34 +0000] \"POST /frictionless/e-commerce HTTP/1.0\" 302 9235\n\ -89.66.165.183 - smith2655 [30/Jun/2023:21:23:34 +0000] \"HEAD /markets/synergize HTTP/2.0\" 501 28055\n\ -39.210.168.14 - - [30/Jun/2023:21:23:34 +0000] \"GET /integrate/killer/end-to-end/infrastructures HTTP/1.0\" 302 11311\n\ -173.99.112.210 - - [30/Jun/2023:21:23:34 +0000] \"GET /interfaces HTTP/2.0\" 503 1471\n\ -108.4.157.6 - morissette1161 [30/Jun/2023:21:23:34 +0000] \"POST /mesh/convergence HTTP/1.1\" 403 18708\n\ -174.160.107.162 - - [30/Jun/2023:21:23:34 +0000] \"POST /vortals/monetize/utilize/synergistic HTTP/1.1\" 302 13252\n\ -188.8.105.56 - beatty6880 [30/Jun/2023:21:23:34 +0000] \"POST /web+services/innovate/generate/leverage HTTP/1.1\" 301 29856\n\ -115.179.64.255 - - [30/Jun/2023:21:23:34 +0000] \"PATCH /transform/transparent/b2c/holistic HTTP/1.1\" 406 10208\n\ -48.104.215.32 - - [30/Jun/2023:21:23:34 +0000] \"DELETE /drive/clicks-and-mortar HTTP/1.0\" 501 13752\n\ -75.212.115.12 - pfannerstill5140 [30/Jun/2023:21:23:34 +0000] \"PATCH /leading-edge/mesh/methodologies HTTP/1.0\" 503 4946\n\ -52.75.2.117 - osinski2030 [30/Jun/2023:21:23:34 +0000] \"PUT /incentivize/recontextualize HTTP/1.1\" 301 8785\n" - -#define LOG_RECORD_WITHOUT_NEW_LINE \ -"82.39.169.93 - streich5722 [30/Jun/2023:21:23:34 +0000] \"GET /action-items/leading-edge/reinvent/maximize HTTP/1.1\" 500 1228" - -#define LOG_RECORDS_WITHOUT_TERMINATING_NEW_LINE \ - LOG_RECORDS_PARTIAL \ - LOG_RECORD_WITHOUT_NEW_LINE - -#define LOG_RECORD_WITH_NEW_LINE \ -"131.128.33.109 - turcotte6735 [30/Jun/2023:21:23:34 +0000] \"PUT /distributed/strategize HTTP/1.1\" 401 16471\n" - -#define LOG_RECORDS_WITH_TERMINATING_NEW_LINE \ - LOG_RECORDS_PARTIAL \ - LOG_RECORD_WITH_NEW_LINE - -static int test_compression_decompression() { - int errors = 0; - fprintf(stderr, "%s():\n", __FUNCTION__); - - Circ_buff_item_t item; - item.text_size = sizeof(LOG_RECORDS_WITH_TERMINATING_NEW_LINE); - fprintf(stderr, "Testing LZ4_compressBound()...\n"); - size_t required_compressed_space = LZ4_compressBound(item.text_size); - if(!required_compressed_space){ - fprintf(stderr, "- Error while using LZ4_compressBound()\n"); - return ++errors; - } - - item.data_max_size = item.text_size + required_compressed_space; - item.data = mallocz(item.data_max_size); - memcpy(item.data, LOG_RECORDS_WITH_TERMINATING_NEW_LINE, sizeof(LOG_RECORDS_WITH_TERMINATING_NEW_LINE)); - - fprintf(stderr, "Testing LZ4_compress_fast()...\n"); - item.text_compressed = item.data + item.text_size; - - item.text_compressed_size = LZ4_compress_fast( item.data, item.text_compressed, - item.text_size, required_compressed_space, 1); - if(!item.text_compressed_size){ - fprintf(stderr, "- Error while using LZ4_compress_fast()\n"); - return ++errors; - } - - char *decompressed_text = mallocz(item.text_size); - - if(LZ4_decompress_safe( item.text_compressed, - decompressed_text, - item.text_compressed_size, - item.text_size) < 0){ - fprintf(stderr, "- Error in decompress_text()\n"); - return ++errors; - } - - if(memcmp(item.data, decompressed_text, item.text_size)){ - fprintf(stderr, "- Error, original and decompressed data not the same\n"); - ++errors; - } - freez(decompressed_text); - - fprintf(stderr, "%s\n", errors ? "FAIL" : "OK"); - return errors; -} - -static int test_read_last_line() { - int errors = 0; - fprintf(stderr, "%s():\n", __FUNCTION__); - - #if defined(_WIN32) || defined(_WIN64) - char tmpname[MAX_PATH] = "/tmp/tmp.XXXXXX"; - #else - char tmpname[] = "/tmp/tmp.XXXXXX"; - #endif - (void) umask(0022); - - int fd = mkstemp(tmpname); - if (fd == -1){ - fprintf(stderr, "mkstemp() Failed with error %s\n", strerror(errno)); - exit(EXIT_FAILURE); - } - - FILE *tmpfp = fdopen(fd, "r+"); - if (tmpfp == NULL) { - close(fd); - unlink(tmpname); - exit(EXIT_FAILURE); - } - - if(fprintf(tmpfp, "%s", LOG_RECORDS_WITHOUT_TERMINATING_NEW_LINE) <= 0){ - close(fd); - unlink(tmpname); - exit(EXIT_FAILURE); - } - fflush(tmpfp); - - fprintf(stderr, "Testing read of LOG_RECORD_WITHOUT_NEW_LINE...\n"); - errors += strcmp(LOG_RECORD_WITHOUT_NEW_LINE, read_last_line(tmpname, 0)) ? 1 : 0; - - if(fprintf(tmpfp, "\n%s", LOG_RECORD_WITH_NEW_LINE) <= 0){ - close(fd); - unlink(tmpname); - exit(EXIT_FAILURE); - } - fflush(tmpfp); - - fprintf(stderr, "Testing read of LOG_RECORD_WITH_NEW_LINE...\n"); - errors += strcmp(LOG_RECORD_WITH_NEW_LINE, read_last_line(tmpname, 0)) ? 1 : 0; - - unlink(tmpname); - close(fd); - fclose(tmpfp); - - fprintf(stderr, "%s\n", errors ? "FAIL" : "OK"); - return errors; -} - -const char * const parse_configs_to_test[] = { - /* [1] Apache csvCombined 1 */ - "127.0.0.1 - - [15/Oct/2020:04:43:51 -0700] \"GET / HTTP/1.0\" 200 11228 \"-\" \"ApacheBench/2.3\"", - - /* [2] Apache csvCombined 2 - extra white space */ - "::1 - - [01/Sep/2022:19:04:42 +0100] \"GET / HTTP/1.1\" 200 3477 \"-\" \"Mozilla/5.0 (Windows NT 10.0; \ -Win64; x64; rv:103.0) Gecko/20100101 Firefox/103.0\"", - - /* [3] Apache csvCombined 3 - with new line */ - "209.202.252.202 - rosenbaum7551 [20/Jun/2023:14:42:27 +0000] \"PUT /harness/networks/initiatives/engineer HTTP/2.0\"\ - 403 42410 \"https://www.senioriterate.name/streamline/exploit\" \"Opera/10.54 (Macintosh; Intel Mac OS X 10_7_6;\ - en-US) Presto/2.12.334 Version/10.00\"\n", - - /* [4] Apache csvCombined 4 - invalid request field */ - "::1 - - [13/Jul/2023:21:00:56 +0100] \"-\" 408 - \"-\" \"-\"", - - /* [5] Apache csvVhostCombined */ - "XPS-wsl.localdomain:80 ::1 - - [30/Jun/2022:20:59:29 +0300] \"GET / HTTP/1.1\" 200 3477 \"-\" \"Mozilla\ -/5.0 (Windows NT 10.0; Win64; x64) AppleWebKit/537.36 (KHTML, like Gecko) Chrome/103.0.5060.53 Safari/537.36\ - Edg/103.0.1264.37\"", - - /* [6] Apache csvCommon 1 */ - "127.0.0.1 - - [30/Jun/2022:16:43:51 +0300] \"GET / HTTP/1.0\" 200 11228", - - /* [7] Apache csvCommon 2 - with carriage return */ - "180.89.137.89 - barrows1527 [05/Jun/2023:17:46:08 +0000]\ - \"DELETE /b2c/viral/innovative/reintermediate HTTP/1.0\" 416 99\r", - - /* [8] Apache csvCommon 3 - with new line */ - "212.113.230.101 - - [20/Jun/2023:14:29:49 +0000] \"PATCH /strategic HTTP/1.1\" 404 1217\n", - - /* [9] Apache csvVhostCommon 1 */ - "XPS-wsl.localdomain:80 127.0.0.1 - - [30/Jun/2022:16:43:51 +0300] \"GET / HTTP/1.0\" 200 11228", - - /* [10] Apache csvVhostCommon 2 - with new line and extra white space */ - "XPS-wsl.localdomain:80 2001:0db8:85a3:0000:0000:8a2e:0370:7334 - - [30/Jun/2022:16:43:51 +0300] \"GET /\ - HTTP/1.0\" 200 11228\n", - - /* [11] Nginx csvCombined */ - "47.29.201.179 - - [28/Feb/2019:13:17:10 +0000] \"GET /?p=1 HTTP/2.0\" 200 5316 \"https://dot.com/?p=1\"\ - \"Mozilla/5.0 (Windows NT 6.1) AppleWebKit/537.36 (KHTML, like Gecko) Chrome/72.0.3626.119 Safari/537.36\"", -}; -const web_log_line_field_t parse_config_expected[][15] = { - /* [1] */ {REQ_CLIENT , CUSTOM , CUSTOM, TIME , TIME, REQ , RESP_CODE, RESP_SIZE, CUSTOM , CUSTOM , -1, -1, -1, -1, -1}, /* Apache csvCombined 1 */ - /* [2] */ {REQ_CLIENT , CUSTOM , CUSTOM, TIME , TIME, REQ , RESP_CODE, RESP_SIZE, CUSTOM , CUSTOM , -1, -1, -1, -1, -1}, /* Apache csvCombined 2 */ - /* [3] */ {REQ_CLIENT , CUSTOM , CUSTOM, TIME , TIME, REQ , RESP_CODE, RESP_SIZE, CUSTOM , CUSTOM , -1, -1, -1, -1, -1}, /* Apache csvCombined 3 */ - /* [4] */ {REQ_CLIENT , CUSTOM , CUSTOM, TIME , TIME, REQ , RESP_CODE, RESP_SIZE, CUSTOM , CUSTOM , -1, -1, -1, -1, -1}, /* Apache csvCombined 4 */ - /* [5] */ {VHOST_WITH_PORT, REQ_CLIENT, CUSTOM, CUSTOM, TIME, TIME, REQ , RESP_CODE, RESP_SIZE, CUSTOM , CUSTOM, -1, -1, -1, -1}, /* Apache csvVhostCombined */ - /* [6] */ {REQ_CLIENT , CUSTOM , CUSTOM, TIME , TIME, REQ , RESP_CODE, RESP_SIZE, -1 , -1 , -1, -1, -1, -1, -1}, /* Apache csvCommon 1 */ - /* [7] */ {REQ_CLIENT , CUSTOM , CUSTOM, TIME , TIME, REQ , RESP_CODE, RESP_SIZE, -1 , -1 , -1, -1, -1, -1, -1}, /* Apache csvCommon 2 */ - /* [8] */ {REQ_CLIENT , CUSTOM , CUSTOM, TIME , TIME, REQ , RESP_CODE, RESP_SIZE, -1 , -1 , -1, -1, -1, -1, -1}, /* Apache csvCommon 3 */ - /* [9] */ {VHOST_WITH_PORT, REQ_CLIENT, CUSTOM, CUSTOM, TIME, TIME, REQ , RESP_CODE, RESP_SIZE, -1 , -1, -1, -1, -1, -1}, /* Apache csvVhostCommon 1 */ - /* [10] */ {VHOST_WITH_PORT, REQ_CLIENT, CUSTOM, CUSTOM, TIME, TIME, REQ , RESP_CODE, RESP_SIZE, -1 , -1, -1, -1, -1, -1}, /* Apache csvVhostCommon 2 */ - /* [11] */ {REQ_CLIENT , CUSTOM , CUSTOM, TIME , TIME, REQ, RESP_CODE, RESP_SIZE, CUSTOM , CUSTOM , -1, -1, -1, -1, -1}, /* Nginx csvCombined */ -}; -static const char parse_config_delim = ' '; -static int *parse_config_expected_num_fields = NULL; - -static void setup_parse_config_expected_num_fields() { - fprintf(stderr, "%s():\n", __FUNCTION__); - - for(int i = 0; i < (int) (sizeof(parse_configs_to_test) / sizeof(parse_configs_to_test[0])); i++){ - parse_config_expected_num_fields = reallocz(parse_config_expected_num_fields, (i + 1) * sizeof(int)); - parse_config_expected_num_fields[i] = 0; - for(int j = 0; (int) parse_config_expected[i][j] != -1; j++){ - parse_config_expected_num_fields[i]++; - } - } - - fprintf(stderr, "OK\n"); -} - -static int test_count_fields() { - int errors = 0; - fprintf(stderr, "%s():\n", __FUNCTION__); - - for(int i = 0; i < (int) (sizeof(parse_configs_to_test) / sizeof(parse_configs_to_test[0])); i++){ - if(count_fields(parse_configs_to_test[i], parse_config_delim) != parse_config_expected_num_fields[i]){ - fprintf(stderr, "- Error (count_fields() result incorrect) for:\n%s", parse_configs_to_test[i]); - ++errors; - } - } - - fprintf(stderr, "%s\n", errors ? "FAIL" : "OK"); - return errors; -} - -static int test_auto_detect_web_log_parser_config() { - int errors = 0; - fprintf(stderr, "%s():\n", __FUNCTION__); - - for(int i = 0; i < (int) (sizeof(parse_configs_to_test) / sizeof(parse_configs_to_test[0])); i++){ - size_t line_sz = strlen(parse_configs_to_test[i]) + 1; - char *line = strdupz(parse_configs_to_test[i]); - if(line[line_sz - 2] != '\n' && line[line_sz - 2] != '\r'){ - line = reallocz(line, ++line_sz); // +1 to add '\n' char - line[line_sz - 1] = '\0'; - line[line_sz - 2] = '\n'; - } - Web_log_parser_config_t *wblp_conf = auto_detect_web_log_parser_config(line, parse_config_delim); - if(!wblp_conf){ - fprintf(stderr, "- Error (NULL wblp_conf) for:\n%s", line); - ++errors; - } else if(wblp_conf->num_fields != parse_config_expected_num_fields[i]){ - fprintf(stderr, "- Error (number of fields mismatch) for:\n%s", line); - fprintf(stderr, "Expected %d fields but auto-detected %d\n", parse_config_expected_num_fields[i], wblp_conf->num_fields); - ++errors; - } else { - for(int j = 0; (int) parse_config_expected[i][j] != -1; j++){ - if(wblp_conf->fields[j] != parse_config_expected[i][j]){ - fprintf(stderr, "- Error (field type mismatch) for:\n%s", line); - ++errors; - break; - } - } - } - - freez(line); - if(wblp_conf) freez(wblp_conf->fields); - freez(wblp_conf); - } - - fprintf(stderr, "%s\n", errors ? "FAIL" : "OK"); - return errors; -} - -Log_line_parsed_t log_line_parsed_expected[] = { - /* -------------------------------------- - char vhost[VHOST_MAX_LEN]; - int port; - char req_scheme[REQ_SCHEME_MAX_LEN]; - char req_client[REQ_CLIENT_MAX_LEN]; - char req_method[REQ_METHOD_MAX_LEN]; - char req_URL[REQ_URL_MAX_LEN]; - char req_proto[REQ_PROTO_MAX_LEN]; - int req_size; - int req_proc_time; - int resp_code; - int resp_size; - int ups_resp_time; - char ssl_proto[SSL_PROTO_MAX_LEN]; - char ssl_cipher[SSL_CIPHER_SUITE_MAX_LEN]; - int64_t timestamp; - int parsing_errors; - ------------------------------------------ */ - /* [1] */ {"", 0, "", "127.0.0.1", "GET", "/", "1.0", 0, 0, 200, 11228, 0, "", "", 1602762231, 0}, - /* [2] */ {"", 0, "", "::1", "GET", "/", "1.1", 0, 0, 200, 3477 , 0, "", "", 1662055482, 0}, - /* [3] */ {"", 0, "", "209.202.252.202", "PUT", "/harness/networks/initiatives/engineer", "2.0", 0, 0, 403, 42410, 0, "", "", 1687272147, 0}, - /* [4] */ {"", 0, "", "::1", "-", "", "", 0, 0, 408, 0, 0, "", "", 1689278456, 0}, - /* [5] */ {"XPS-wsl.localdomain", 80, "", "::1", "GET", "/", "1.1", 0, 0, 200, 3477 , 0, "", "", 1656611969, 0}, - /* [6] */ {"", 0, "", "127.0.0.1", "GET", "/", "1.0", 0, 0, 200, 11228, 0, "", "", 1656596631, 0}, - /* [7] */ {"", 0, "", "180.89.137.89", "DELETE", "/b2c/viral/innovative/reintermediate", "1.0", 0, 0, 416, 99 , 0, "", "", 1685987168, 0}, - /* [8] */ {"", 0, "", "212.113.230.101", "PATCH", "/strategic", "1.1", 0, 0, 404, 1217 , 0, "", "", 1687271389, 0}, - /* [9] */ {"XPS-wsl.localdomain", 80, "", "127.0.0.1", "GET", "/", "1.0", 0, 0, 200, 11228, 0, "", "", 1656596631, 0}, - /* [10] */ {"XPS-wsl.localdomain", 80, "", "2001:0db8:85a3:0000:0000:8a2e:0370:7334", "GET", "/", "1.0", 0, 0, 200, 11228, 0, "", "", 1656596631, 0}, - /* [11] */ {"", 0, "", "47.29.201.179", "GET", "/?p=1", "2.0", 0, 0, 200, 5316 , 0, "", "", 1551359830, 0} -}; -static int test_parse_web_log_line(){ - int errors = 0; - fprintf(stderr, "%s():\n", __FUNCTION__); - - Web_log_parser_config_t *wblp_conf = callocz(1, sizeof(Web_log_parser_config_t)); - - wblp_conf->delimiter = parse_config_delim; - wblp_conf->verify_parsed_logs = 1; - - for(int i = 0; i < (int) (sizeof(parse_configs_to_test) / sizeof(parse_configs_to_test[0])); i++){ - wblp_conf->num_fields = parse_config_expected_num_fields[i]; - wblp_conf->fields = (web_log_line_field_t *) parse_config_expected[i]; - - Log_line_parsed_t log_line_parsed = (Log_line_parsed_t) {0}; - parse_web_log_line( wblp_conf, - (char *) parse_configs_to_test[i], - strlen(parse_configs_to_test[i]), - &log_line_parsed); - - if(strcmp(log_line_parsed_expected[i].vhost, log_line_parsed.vhost)) - fprintf(stderr, "- Error (parsed vhost:%s != expected vhost:%s) for:\n%s", - log_line_parsed.vhost, log_line_parsed_expected[i].vhost, parse_configs_to_test[i]), ++errors; - if(log_line_parsed_expected[i].port != log_line_parsed.port) - fprintf(stderr, "- Error (parsed port:%d != expected port:%d) for:\n%s", - log_line_parsed.port, log_line_parsed_expected[i].port, parse_configs_to_test[i]), ++errors; - if(strcmp(log_line_parsed_expected[i].req_scheme, log_line_parsed.req_scheme)) - fprintf(stderr, "- Error (parsed req_scheme:%s != expected req_scheme:%s) for:\n%s", - log_line_parsed.req_scheme, log_line_parsed_expected[i].req_scheme, parse_configs_to_test[i]), ++errors; - if(strcmp(log_line_parsed_expected[i].req_client, log_line_parsed.req_client)) - fprintf(stderr, "- Error (parsed req_client:%s != expected req_client:%s) for:\n%s", - log_line_parsed.req_client, log_line_parsed_expected[i].req_client, parse_configs_to_test[i]), ++errors; - if(strcmp(log_line_parsed_expected[i].req_method, log_line_parsed.req_method)) - fprintf(stderr, "- Error (parsed req_method:%s != expected req_method:%s) for:\n%s", - log_line_parsed.req_method, log_line_parsed_expected[i].req_method, parse_configs_to_test[i]), ++errors; - if(strcmp(log_line_parsed_expected[i].req_URL, log_line_parsed.req_URL)) - fprintf(stderr, "- Error (parsed req_URL:%s != expected req_URL:%s) for:\n%s", - log_line_parsed.req_URL, log_line_parsed_expected[i].req_URL, parse_configs_to_test[i]), ++errors; - if(strcmp(log_line_parsed_expected[i].req_proto, log_line_parsed.req_proto)) - fprintf(stderr, "- Error (parsed req_proto:%s != expected req_proto:%s) for:\n%s", - log_line_parsed.req_proto, log_line_parsed_expected[i].req_proto, parse_configs_to_test[i]), ++errors; - if(log_line_parsed_expected[i].req_size != log_line_parsed.req_size) - fprintf(stderr, "- Error (parsed req_size:%d != expected req_size:%d) for:\n%s", - log_line_parsed.req_size, log_line_parsed_expected[i].req_size, parse_configs_to_test[i]), ++errors; - if(log_line_parsed_expected[i].req_proc_time != log_line_parsed.req_proc_time) - fprintf(stderr, "- Error (parsed req_proc_time:%d != expected req_proc_time:%d) for:\n%s", - log_line_parsed.req_proc_time, log_line_parsed_expected[i].req_proc_time, parse_configs_to_test[i]), ++errors; - if(log_line_parsed_expected[i].resp_code != log_line_parsed.resp_code) - fprintf(stderr, "- Error (parsed resp_code:%d != expected resp_code:%d) for:\n%s", - log_line_parsed.resp_code, log_line_parsed_expected[i].resp_code, parse_configs_to_test[i]), ++errors; - if(log_line_parsed_expected[i].resp_size != log_line_parsed.resp_size) - fprintf(stderr, "- Error (parsed resp_size:%d != expected resp_size:%d) for:\n%s", - log_line_parsed.resp_size, log_line_parsed_expected[i].resp_size, parse_configs_to_test[i]), ++errors; - if(log_line_parsed_expected[i].ups_resp_time != log_line_parsed.ups_resp_time) - fprintf(stderr, "- Error (parsed ups_resp_time:%d != expected ups_resp_time:%d) for:\n%s", - log_line_parsed.ups_resp_time, log_line_parsed_expected[i].ups_resp_time, parse_configs_to_test[i]), ++errors; - if(strcmp(log_line_parsed_expected[i].ssl_proto, log_line_parsed.ssl_proto)) - fprintf(stderr, "- Error (parsed ssl_proto:%s != expected ssl_proto:%s) for:\n%s", - log_line_parsed.ssl_proto, log_line_parsed_expected[i].ssl_proto, parse_configs_to_test[i]), ++errors; - if(strcmp(log_line_parsed_expected[i].ssl_cipher, log_line_parsed.ssl_cipher)) - fprintf(stderr, "- Error (parsed ssl_cipher:%s != expected ssl_cipher:%s) for:\n%s", - log_line_parsed.ssl_cipher, log_line_parsed_expected[i].ssl_cipher, parse_configs_to_test[i]), ++errors; - if(log_line_parsed_expected[i].timestamp != log_line_parsed.timestamp) - fprintf(stderr, "- Error (parsed timestamp:%" PRId64 " != expected timestamp:%" PRId64 ") for:\n%s", - log_line_parsed.timestamp, log_line_parsed_expected[i].timestamp, parse_configs_to_test[i]), ++errors; - } - - freez(wblp_conf); - - fprintf(stderr, "%s\n", errors ? "FAIL" : "OK"); - return errors ; -} - -const char * const unsanitised_strings[] = { "[test]", "^test$", "{test}", - "(test)", "\\test\\", "test*+.?|", "test&£@"}; -const char * const expected_sanitised_strings[] = { "\\[test\\]", "\\^test\\$", "\\{test\\}", - "\\(test\\)", "\\\\test\\\\", "test\\*\\+\\.\\?\\|", "test&£@"}; -static int test_sanitise_string(){ - int errors = 0; - fprintf(stderr, "%s():\n", __FUNCTION__); - - for(int i = 0; i < (int) (sizeof(unsanitised_strings) / sizeof(unsanitised_strings[0])); i++){ - char *sanitised = sanitise_string((char *) unsanitised_strings[i]); - if(strcmp(expected_sanitised_strings[i], sanitised)){ - fprintf(stderr, "- Error during sanitise_string() for:%s\n", unsanitised_strings[i]); - ++errors; - }; - freez(sanitised); - } - - fprintf(stderr, "%s\n", errors ? "FAIL" : "OK"); - return errors; -} - -char * const regex_src[] = { -"2022-11-07T11:28:27.427519600Z container create e0c3c6120c29beb393e4b92773c9aa60006747bddabd352b77bf0b4ad23747a7 (image=hello-world, name=xenodochial_lumiere)\n\ -2022-11-07T11:28:27.932624500Z container start e0c3c6120c29beb393e4b92773c9aa60006747bddabd352b77bf0b4ad23747a7 (image=hello-world, name=xenodochial_lumiere)\n\ -2022-11-07T11:28:27.971060500Z container die e0c3c6120c29beb393e4b92773c9aa60006747bddabd352b77bf0b4ad23747a7 (exitCode=0, image=hello-world, name=xenodochial_lumiere)", - -"2022-11-07T11:28:27.427519600Z container create e0c3c6120c29beb393e4b92773c9aa60006747bddabd352b77bf0b4ad23747a7 (image=hello-world, name=xenodochial_lumiere)\n\ -2022-11-07T11:28:27.932624500Z container start e0c3c6120c29beb393e4b92773c9aa60006747bddabd352b77bf0b4ad23747a7 (image=hello-world, name=xenodochial_lumiere)\n\ -2022-11-07T11:28:27.971060500Z container die e0c3c6120c29beb393e4b92773c9aa60006747bddabd352b77bf0b4ad23747a7 (exitCode=0, image=hello-world, name=xenodochial_lumiere)", - -"2022-11-07T11:28:27.427519600Z container create e0c3c6120c29beb393e4b92773c9aa60006747bddabd352b77bf0b4ad23747a7 (image=hello-world, name=xenodochial_lumiere)\n\ -2022-11-07T11:28:27.932624500Z container start e0c3c6120c29beb393e4b92773c9aa60006747bddabd352b77bf0b4ad23747a7 (image=hello-world, name=xenodochial_lumiere)\n\ -2022-11-07T11:28:27.971060500Z container die e0c3c6120c29beb393e4b92773c9aa60006747bddabd352b77bf0b4ad23747a7 (exitCode=0, image=hello-world, name=xenodochial_lumiere)", - -"2022-11-07T20:06:36.919980700Z container create bd8d4a3338c3e9ab4ca555c6d869dc980f04f10ebdcd9284321c0afecbec1234 (image=hello-world, name=distracted_sinoussi)\n\ -2022-11-07T20:06:36.927728700Z container attach bd8d4a3338c3e9ab4ca555c6d869dc980f04f10ebdcd9284321c0afecbec1234 (image=hello-world, name=distracted_sinoussi)\n\ -2022-11-07T20:06:36.958906200Z network connect 178a1988c4173559c721d5e24970eef32aaca41e0e363ff9792c731f917683ed (container=bd8d4a3338c3e9ab4ca555c6d869dc980f04f10ebdcd9284321c0afecbec1234, name=bridge, type=bridge)\n\ -2022-11-07T20:06:37.564947300Z container start bd8d4a3338c3e9ab4ca555c6d869dc980f04f10ebdcd9284321c0afecbec1234 (image=hello-world, name=distracted_sinoussi)\n\ -2022-11-07T20:06:37.596428500Z container die bd8d4a3338c3e9ab4ca555c6d869dc980f04f10ebdcd9284321c0afecbec1234 (exitCode=0, image=hello-world, name=distracted_sinoussi)\n\ -2022-11-07T20:06:38.134325100Z network disconnect 178a1988c4173559c721d5e24970eef32aaca41e0e363ff9792c731f917683ed (container=bd8d4a3338c3e9ab4ca555c6d869dc980f04f10ebdcd9284321c0afecbec1234, name=bridge, type=bridge)", - -"Nov 7 21:54:24 X-PC sudo: john : TTY=pts/7 ; PWD=/home/john ; USER=root ; COMMAND=/usr/bin/docker run hello-world\n\ -Nov 7 21:54:24 X-PC sudo: pam_unix(sudo:session): session opened for user root by john(uid=0)\n\ -Nov 7 21:54:25 X-PC sudo: pam_unix(sudo:session): session closed for user root\n\ -Nov 7 21:54:24 X-PC sudo: john : TTY=pts/7 ; PWD=/home/john ; USER=root ; COMMAND=/usr/bin/docker run hello-world\n" -}; -const char * const regex_keyword[] = { - "start", - "CONTAINER", - "CONTAINER", - NULL, - NULL -}; -const char * const regex_pat_str[] = { - NULL, - NULL, - NULL, - ".*\\bcontainer\\b.*\\bhello-world\\b.*", - ".*\\bsudo\\b.*\\bCOMMAND=/usr/bin/docker run\\b.*" - -}; -const int regex_ignore_case[] = { - 1, - 1, - 0, - 1, - 1 -}; -const int regex_exp_matches[] = { - 1, - 3, - 0, - 4, - 2 -}; -const char * const regex_exp_dst[] = { -"2022-11-07T11:28:27.932624500Z container start e0c3c6120c29beb393e4b92773c9aa60006747bddabd352b77bf0b4ad23747a7 (image=hello-world, name=xenodochial_lumiere)\n", - -"2022-11-07T11:28:27.427519600Z container create e0c3c6120c29beb393e4b92773c9aa60006747bddabd352b77bf0b4ad23747a7 (image=hello-world, name=xenodochial_lumiere)\n\ -2022-11-07T11:28:27.932624500Z container start e0c3c6120c29beb393e4b92773c9aa60006747bddabd352b77bf0b4ad23747a7 (image=hello-world, name=xenodochial_lumiere)\n\ -2022-11-07T11:28:27.971060500Z container die e0c3c6120c29beb393e4b92773c9aa60006747bddabd352b77bf0b4ad23747a7 (exitCode=0, image=hello-world, name=xenodochial_lumiere)", - -"", - -"2022-11-07T20:06:36.919980700Z container create bd8d4a3338c3e9ab4ca555c6d869dc980f04f10ebdcd9284321c0afecbec1234 (image=hello-world, name=distracted_sinoussi)\n\ -2022-11-07T20:06:36.927728700Z container attach bd8d4a3338c3e9ab4ca555c6d869dc980f04f10ebdcd9284321c0afecbec1234 (image=hello-world, name=distracted_sinoussi)\n\ -2022-11-07T20:06:37.564947300Z container start bd8d4a3338c3e9ab4ca555c6d869dc980f04f10ebdcd9284321c0afecbec1234 (image=hello-world, name=distracted_sinoussi)\n\ -2022-11-07T20:06:37.596428500Z container die bd8d4a3338c3e9ab4ca555c6d869dc980f04f10ebdcd9284321c0afecbec1234 (exitCode=0, image=hello-world, name=distracted_sinoussi)", - -"Nov 7 21:54:24 X-PC sudo: john : TTY=pts/7 ; PWD=/home/john ; USER=root ; COMMAND=/usr/bin/docker run hello-world\n\ -Nov 7 21:54:24 X-PC sudo: john : TTY=pts/7 ; PWD=/home/john ; USER=root ; COMMAND=/usr/bin/docker run hello-world\n" -}; -static int test_search_keyword(){ - int errors = 0; - fprintf(stderr, "%s():\n", __FUNCTION__); - - for(int i = 0; i < (int) (sizeof(regex_src) / sizeof(regex_src[0])); i++){ - regex_t *regex_c = regex_pat_str[i] ? mallocz(sizeof(regex_t)) : NULL; - if(regex_c && regcomp( regex_c, regex_pat_str[i], - regex_ignore_case[i] ? REG_EXTENDED | REG_NEWLINE | REG_ICASE : REG_EXTENDED | REG_NEWLINE)) - fatal("Could not compile regular expression:%s", regex_pat_str[i]); - - size_t regex_src_sz = strlen(regex_src[i]) + 1; - char *res = callocz(1 , regex_src_sz); - size_t res_sz; - int matches = search_keyword( regex_src[i], regex_src_sz, - res, &res_sz, - regex_keyword[i], regex_c, - regex_ignore_case[i]); - // fprintf(stderr, "\nMatches:%d\nResults:\n%.*s\n", matches, (int) res_sz, res); - if(regex_exp_matches[i] != matches){ - fprintf(stderr, "- Error in matches returned from search_keyword() for: regex_src[%d]\n", i); - ++errors; - }; - if(strncmp(regex_exp_dst[i], res, res_sz - 1)){ - fprintf(stderr, "- Error in strncmp() of results from search_keyword() for: regex_src[%d]\n", i); - ++errors; - } - - if(regex_c) freez(regex_c); - freez(res); - } - - fprintf(stderr, "%s\n", errors ? "FAIL" : "OK"); - return errors; -} - -static Flb_socket_config_t *p_forward_in_config = NULL; - -static flb_srvc_config_t flb_srvc_config = { - .flush = FLB_FLUSH_DEFAULT, - .http_listen = FLB_HTTP_LISTEN_DEFAULT, - .http_port = FLB_HTTP_PORT_DEFAULT, - .http_server = FLB_HTTP_SERVER_DEFAULT, - .log_path = "NULL", - .log_level = FLB_LOG_LEVEL_DEFAULT, - .coro_stack_size = FLB_CORO_STACK_SIZE_DEFAULT -}; - -static flb_srvc_config_t *p_flb_srvc_config = NULL; - -static int test_logsmanag_config_funcs(){ - int errors = 0, rc; - fprintf(stderr, "%s():\n", __FUNCTION__); - - fprintf(stderr, "Testing get_X_dir() functions...\n"); - if(NULL == get_user_config_dir()){ - fprintf(stderr, "- Error, get_user_config_dir() returns NULL.\n"); - ++errors; - } - - if(NULL == get_stock_config_dir()){ - fprintf(stderr, "- Error, get_stock_config_dir() returns NULL.\n"); - ++errors; - } - - if(NULL == get_log_dir()){ - fprintf(stderr, "- Error, get_log_dir() returns NULL.\n"); - ++errors; - } - - if(NULL == get_cache_dir()){ - fprintf(stderr, "- Error, get_cache_dir() returns NULL.\n"); - ++errors; - } - - fprintf(stderr, "Testing logs_manag_config_load() when p_flb_srvc_config is NULL...\n"); - - SUPRESS_STDERR(); - rc = logs_manag_config_load(p_flb_srvc_config, &p_forward_in_config, 1); - UNSUPRESS_STDERR(); - - if(LOGS_MANAG_CONFIG_LOAD_ERROR_P_FLB_SRVC_NULL != rc){ - fprintf(stderr, "- Error, logs_manag_config_load() returns %d.\n", rc); - ++errors; - } - - p_flb_srvc_config = &flb_srvc_config; - - fprintf(stderr, "Testing logs_manag_config_load() can load stock config...\n"); - - SUPRESS_STDERR(); - rc = logs_manag_config_load(&flb_srvc_config, &p_forward_in_config, 1); - UNSUPRESS_STDERR(); - - if( LOGS_MANAG_CONFIG_LOAD_ERROR_OK != rc){ - fprintf(stderr, "- Error, logs_manag_config_load() returns %d.\n", rc); - ++errors; - } - - fprintf(stderr, "%s\n", errors ? "FAIL" : "OK"); - return errors; -} - -uv_loop_t *main_loop; - -static void setup_p_file_infos_arr_and_main_loop() { - fprintf(stderr, "%s():\n", __FUNCTION__); - - p_file_infos_arr = callocz(1, sizeof(struct File_infos_arr)); - main_loop = mallocz(sizeof(uv_loop_t)); - if(uv_loop_init(main_loop)) - exit(EXIT_FAILURE); - - fprintf(stderr, "OK\n"); -} - -static int test_flb_init(){ - int errors = 0, rc; - fprintf(stderr, "%s():\n", __FUNCTION__); - - fprintf(stderr, "Testing flb_init() with wrong stock_config_dir...\n"); - - SUPRESS_STDERR(); - rc = flb_init(flb_srvc_config, "/tmp", "example_prefix_"); - UNSUPRESS_STDERR(); - if(!rc){ - fprintf(stderr, "- Error, flb_init() should fail but it returns %d.\n", rc); - ++errors; - } - - fprintf(stderr, "Testing flb_init() with correct stock_config_dir...\n"); - - rc = flb_init(flb_srvc_config, get_stock_config_dir(), "example_prefix_"); - if(rc){ - fprintf(stderr, "- Error, flb_init() should fail but it returns %d.\n", rc); - ++errors; - } - - fprintf(stderr, "%s\n", errors ? "FAIL" : "OK"); - return errors; -} - -static int unlink_cb(const char *fpath, const struct stat *sb, int typeflag, struct FTW *ftwbuf){ - UNUSED(sb); - UNUSED(typeflag); - UNUSED(ftwbuf); - - return remove(fpath); -} - -static int test_db_init(){ - int errors = 0; - fprintf(stderr, "%s():\n", __FUNCTION__); - - extern netdata_mutex_t stdout_mut; - - SUPRESS_STDOUT(); - SUPRESS_STDERR(); - config_file_load(main_loop, p_forward_in_config, &flb_srvc_config, &stdout_mut); - UNSUPRESS_STDOUT(); - UNSUPRESS_STDERR(); - - fprintf(stderr, "Testing db_init() with main_db_dir == NULL...\n"); - - SUPRESS_STDERR(); - db_set_main_dir(NULL); - int rc = db_init(); - UNSUPRESS_STDERR(); - - if(!rc){ - fprintf(stderr, "- Error, db_init() returns %d even though db_set_main_dir(NULL); was called.\n", rc); - ++errors; - } - - char tmpdir[] = "/tmp/tmpdir.XXXXXX"; - char *main_db_dir = mkdtemp (tmpdir); - fprintf(stderr, "Testing db_init() with main_db_dir == %s...\n", main_db_dir); - - SUPRESS_STDERR(); - db_set_main_dir(main_db_dir); - rc = db_init(); - UNSUPRESS_STDERR(); - - if(rc){ - fprintf(stderr, "- Error, db_init() returns %d.\n", rc); - ++errors; - } - - fprintf(stderr, "Cleaning up %s...\n", main_db_dir); - - if(nftw(main_db_dir, unlink_cb, 64, FTW_DEPTH | FTW_PHYS) == -1){ - fprintf(stderr, "Error while remove path:%s. Will exit...\n", strerror(errno)); - exit(EXIT_FAILURE); - } - - fprintf(stderr, "%s\n", errors ? "FAIL" : "OK"); - return errors; -} - -int logs_management_unittest(void){ - int errors = 0; - - fprintf(stderr, "\n\n======================================================\n"); - fprintf(stderr, " ** Starting logs management tests **\n"); - fprintf(stderr, "======================================================\n"); - fprintf(stderr, "------------------------------------------------------\n"); - errors += test_compression_decompression(); - fprintf(stderr, "------------------------------------------------------\n"); - errors += test_read_last_line(); - fprintf(stderr, "------------------------------------------------------\n"); - setup_parse_config_expected_num_fields(); - fprintf(stderr, "------------------------------------------------------\n"); - errors += test_count_fields(); - fprintf(stderr, "------------------------------------------------------\n"); - errors += test_auto_detect_web_log_parser_config(); - fprintf(stderr, "------------------------------------------------------\n"); - errors += test_parse_web_log_line(); - fprintf(stderr, "------------------------------------------------------\n"); - errors += test_sanitise_string(); - fprintf(stderr, "------------------------------------------------------\n"); - errors += test_search_keyword(); - fprintf(stderr, "------------------------------------------------------\n"); - errors += test_logsmanag_config_funcs(); - fprintf(stderr, "------------------------------------------------------\n"); - setup_p_file_infos_arr_and_main_loop(); - fprintf(stderr, "------------------------------------------------------\n"); - errors += test_flb_init(); - fprintf(stderr, "------------------------------------------------------\n"); - errors += test_db_init(); - fprintf(stderr, "------------------------------------------------------\n"); - fprintf(stderr, "[%s] Total errors: %d\n", errors ? "FAILED" : "SUCCEEDED", errors); - fprintf(stderr, "======================================================\n"); - fprintf(stderr, " ** Finished logs management tests **\n"); - fprintf(stderr, "======================================================\n"); - fflush(stderr); - - return errors; -} diff --git a/src/logsmanagement/unit_test/unit_test.h b/src/logsmanagement/unit_test/unit_test.h deleted file mode 100644 index 364f2ea58..000000000 --- a/src/logsmanagement/unit_test/unit_test.h +++ /dev/null @@ -1,12 +0,0 @@ -// SPDX-License-Identifier: GPL-3.0-or-later - -/** @file unit_test.h - * @brief This is the header for unit_test.c - */ - -#ifndef LOGS_MANAGEMENT_UNIT_TEST_H_ -#define LOGS_MANAGEMENT_UNIT_TEST_H_ - -int logs_management_unittest(void); - -#endif // LOGS_MANAGEMENT_UNIT_TEST_H_ diff --git a/src/registry/registry_db.c b/src/registry/registry_db.c index 448ca29d3..67c5312ed 100644 --- a/src/registry/registry_db.c +++ b/src/registry/registry_db.c @@ -162,7 +162,7 @@ int registry_db_save(void) { fclose(fp); - errno = 0; + errno_clear(); // remove the .old db netdata_log_debug(D_REGISTRY, "REGISTRY: Removing old db '%s'", old_filename); diff --git a/src/spawn/README.md b/src/spawn/README.md deleted file mode 100644 index e69de29bb..000000000 --- a/src/spawn/README.md +++ /dev/null diff --git a/src/spawn/spawn.c b/src/spawn/spawn.c deleted file mode 100644 index a6e53718a..000000000 --- a/src/spawn/spawn.c +++ /dev/null @@ -1,288 +0,0 @@ -// SPDX-License-Identifier: GPL-3.0-or-later - -#include "spawn.h" - -static uv_thread_t thread; -int spawn_thread_error; -int spawn_thread_shutdown; - -struct spawn_queue spawn_cmd_queue; - -static struct spawn_cmd_info *create_spawn_cmd(const char *command_to_run) -{ - struct spawn_cmd_info *cmdinfo; - - cmdinfo = mallocz(sizeof(*cmdinfo)); - fatal_assert(0 == uv_cond_init(&cmdinfo->cond)); - fatal_assert(0 == uv_mutex_init(&cmdinfo->mutex)); - cmdinfo->serial = 0; /* invalid */ - cmdinfo->command_to_run = strdupz(command_to_run); - cmdinfo->exit_status = -1; /* invalid */ - cmdinfo->pid = -1; /* invalid */ - cmdinfo->flags = 0; - - return cmdinfo; -} - -void destroy_spawn_cmd(struct spawn_cmd_info *cmdinfo) -{ - uv_cond_destroy(&cmdinfo->cond); - uv_mutex_destroy(&cmdinfo->mutex); - - freez(cmdinfo->command_to_run); - freez(cmdinfo); -} - -int spawn_cmd_compare(void *a, void *b) -{ - struct spawn_cmd_info *cmda = a, *cmdb = b; - - /* No need for mutex, serial will never change and the entries cannot be deallocated yet */ - if (cmda->serial < cmdb->serial) return -1; - if (cmda->serial > cmdb->serial) return 1; - - return 0; -} - -static void init_spawn_cmd_queue(void) -{ - spawn_cmd_queue.cmd_tree.root = NULL; - spawn_cmd_queue.cmd_tree.compar = spawn_cmd_compare; - spawn_cmd_queue.size = 0; - spawn_cmd_queue.latest_serial = 0; - fatal_assert(0 == uv_cond_init(&spawn_cmd_queue.cond)); - fatal_assert(0 == uv_mutex_init(&spawn_cmd_queue.mutex)); -} - -/* - * Returns serial number of the enqueued command - */ -uint64_t spawn_enq_cmd(const char *command_to_run) -{ - unsigned queue_size; - uint64_t serial; - avl_t *avl_ret; - struct spawn_cmd_info *cmdinfo; - - cmdinfo = create_spawn_cmd(command_to_run); - - /* wait for free space in queue */ - uv_mutex_lock(&spawn_cmd_queue.mutex); - while ((queue_size = spawn_cmd_queue.size) == SPAWN_MAX_OUTSTANDING) { - uv_cond_wait(&spawn_cmd_queue.cond, &spawn_cmd_queue.mutex); - } - fatal_assert(queue_size < SPAWN_MAX_OUTSTANDING); - spawn_cmd_queue.size = queue_size + 1; - - serial = ++spawn_cmd_queue.latest_serial; /* 0 is invalid */ - cmdinfo->serial = serial; /* No need to take the cmd mutex since it is unreachable at the moment */ - - /* enqueue command */ - avl_ret = avl_insert(&spawn_cmd_queue.cmd_tree, (avl_t *)cmdinfo); - fatal_assert(avl_ret == (avl_t *)cmdinfo); - uv_mutex_unlock(&spawn_cmd_queue.mutex); - - /* wake up event loop */ - fatal_assert(0 == uv_async_send(&spawn_async)); - return serial; -} - -/* - * Blocks until command with serial finishes running. Only one thread is allowed to wait per command. - */ -void spawn_wait_cmd(uint64_t serial, int *exit_status, time_t *exec_run_timestamp) -{ - avl_t *avl_ret; - struct spawn_cmd_info tmp, *cmdinfo; - - tmp.serial = serial; - - uv_mutex_lock(&spawn_cmd_queue.mutex); - avl_ret = avl_search(&spawn_cmd_queue.cmd_tree, (avl_t *)&tmp); - uv_mutex_unlock(&spawn_cmd_queue.mutex); - - fatal_assert(avl_ret); /* Could be NULL if more than 1 threads wait for the command */ - cmdinfo = (struct spawn_cmd_info *)avl_ret; - - uv_mutex_lock(&cmdinfo->mutex); - while (!(cmdinfo->flags & SPAWN_CMD_DONE)) { - /* Only 1 thread is allowed to wait for this command to finish */ - uv_cond_wait(&cmdinfo->cond, &cmdinfo->mutex); - } - uv_mutex_unlock(&cmdinfo->mutex); - - spawn_deq_cmd(cmdinfo); - *exit_status = cmdinfo->exit_status; - *exec_run_timestamp = cmdinfo->exec_run_timestamp; - - destroy_spawn_cmd(cmdinfo); -} - -void spawn_deq_cmd(struct spawn_cmd_info *cmdinfo) -{ - unsigned queue_size; - avl_t *avl_ret; - - uv_mutex_lock(&spawn_cmd_queue.mutex); - queue_size = spawn_cmd_queue.size; - fatal_assert(queue_size); - /* dequeue command */ - avl_ret = avl_remove(&spawn_cmd_queue.cmd_tree, (avl_t *)cmdinfo); - fatal_assert(avl_ret); - - spawn_cmd_queue.size = queue_size - 1; - - /* wake up callers */ - uv_cond_signal(&spawn_cmd_queue.cond); - uv_mutex_unlock(&spawn_cmd_queue.mutex); -} - -/* - * Must be called from the spawn client event loop context. This way no mutex is needed because the event loop is the - * only writer as far as struct spawn_cmd_info entries are concerned. - */ -static int find_unprocessed_spawn_cmd_cb(void *entry, void *data) -{ - struct spawn_cmd_info **cmdinfop = data, *cmdinfo = entry; - - if (!(cmdinfo->flags & SPAWN_CMD_PROCESSED)) { - *cmdinfop = cmdinfo; - return -1; /* break tree traversal */ - } - return 0; /* continue traversing */ -} - -struct spawn_cmd_info *spawn_get_unprocessed_cmd(void) -{ - struct spawn_cmd_info *cmdinfo; - unsigned queue_size; - int ret; - - uv_mutex_lock(&spawn_cmd_queue.mutex); - queue_size = spawn_cmd_queue.size; - if (queue_size == 0) { - uv_mutex_unlock(&spawn_cmd_queue.mutex); - return NULL; - } - /* find command */ - cmdinfo = NULL; - ret = avl_traverse(&spawn_cmd_queue.cmd_tree, find_unprocessed_spawn_cmd_cb, (void *)&cmdinfo); - if (-1 != ret) { /* no commands available for processing */ - uv_mutex_unlock(&spawn_cmd_queue.mutex); - return NULL; - } - uv_mutex_unlock(&spawn_cmd_queue.mutex); - - return cmdinfo; -} - -/** - * This function spawns a process that shares a libuv IPC pipe with the caller and performs spawn server duties. - * The spawn server process will close all open file descriptors except for the pipe, UV_STDOUT_FD, and UV_STDERR_FD. - * The caller has to be the netdata user as configured. - * - * @param loop the libuv loop of the caller context - * @param spawn_channel the bidirectional libuv IPC pipe that the server and the caller will share - * @param process the spawn server libuv process context - * @return 0 on success or the libuv error code - */ -int create_spawn_server(uv_loop_t *loop, uv_pipe_t *spawn_channel, uv_process_t *process) -{ - uv_process_options_t options = {0}; - char *args[3]; - int ret; -#define SPAWN_SERVER_DESCRIPTORS (3) - uv_stdio_container_t stdio[SPAWN_SERVER_DESCRIPTORS]; - struct passwd *passwd = NULL; - char *user = NULL; - - passwd = getpwuid(getuid()); - user = (passwd && passwd->pw_name) ? passwd->pw_name : ""; - - args[0] = netdata_exe_file; - args[1] = SPAWN_SERVER_COMMAND_LINE_ARGUMENT; - args[2] = NULL; - - memset(&options, 0, sizeof(options)); - options.file = netdata_exe_file; - options.args = args; - options.exit_cb = NULL; //exit_cb; - options.stdio = stdio; - options.stdio_count = SPAWN_SERVER_DESCRIPTORS; - - stdio[0].flags = UV_CREATE_PIPE | UV_READABLE_PIPE | UV_WRITABLE_PIPE; - stdio[0].data.stream = (uv_stream_t *)spawn_channel; /* bidirectional libuv pipe */ - stdio[1].flags = UV_INHERIT_FD; - stdio[1].data.fd = 1 /* UV_STDOUT_FD */; - stdio[2].flags = UV_INHERIT_FD; - stdio[2].data.fd = nd_log_health_fd() /* UV_STDERR_FD */; - - ret = uv_spawn(loop, process, &options); /* execute the netdata binary again as the netdata user */ - if (0 != ret) { - netdata_log_error("uv_spawn (process: \"%s\") (user: %s) failed (%s).", netdata_exe_file, user, uv_strerror(ret)); - fatal("Cannot start netdata without the spawn server."); - } - - return ret; -} - -#define CONCURRENT_SPAWNS 16 -#define SPAWN_ITERATIONS 10000 -#undef CONCURRENT_STRESS_TEST - -void spawn_init(void) -{ - struct completion completion; - int error; - - netdata_log_info("Initializing spawn client."); - - init_spawn_cmd_queue(); - - completion_init(&completion); - error = uv_thread_create(&thread, spawn_client, &completion); - if (error) { - netdata_log_error("uv_thread_create(): %s", uv_strerror(error)); - goto after_error; - } - /* wait for spawn client thread to initialize */ - completion_wait_for(&completion); - completion_destroy(&completion); - - if (spawn_thread_error) { - error = uv_thread_join(&thread); - if (error) { - netdata_log_error("uv_thread_create(): %s", uv_strerror(error)); - } - goto after_error; - } -#ifdef CONCURRENT_STRESS_TEST - signals_reset(); - signals_unblock(); - - sleep(60); - uint64_t serial[CONCURRENT_SPAWNS]; - for (int j = 0 ; j < SPAWN_ITERATIONS ; ++j) { - for (int i = 0; i < CONCURRENT_SPAWNS; ++i) { - char cmd[64]; - sprintf(cmd, "echo CONCURRENT_STRESS_TEST %d 1>&2", j * CONCURRENT_SPAWNS + i + 1); - serial[i] = spawn_enq_cmd(cmd); - netdata_log_info("Queued command %s for spawning.", cmd); - } - int exit_status; - time_t exec_run_timestamp; - for (int i = 0; i < CONCURRENT_SPAWNS; ++i) { - netdata_log_info("Started waiting for serial %llu exit status %d run timestamp %llu.", serial[i], exit_status, - exec_run_timestamp); - spawn_wait_cmd(serial[i], &exit_status, &exec_run_timestamp); - netdata_log_info("Finished waiting for serial %llu exit status %d run timestamp %llu.", serial[i], exit_status, - exec_run_timestamp); - } - } - exit(0); -#endif - return; - - after_error: - netdata_log_error("Failed to initialize spawn service. The alarms notifications will not be spawned."); -} diff --git a/src/spawn/spawn.h b/src/spawn/spawn.h deleted file mode 100644 index 6e9e51ef0..000000000 --- a/src/spawn/spawn.h +++ /dev/null @@ -1,109 +0,0 @@ -// SPDX-License-Identifier: GPL-3.0-or-later - -#ifndef NETDATA_SPAWN_H -#define NETDATA_SPAWN_H 1 - -#include "daemon/common.h" - -#define SPAWN_SERVER_COMMAND_LINE_ARGUMENT "--special-spawn-server" - -typedef enum spawn_protocol { - SPAWN_PROT_EXEC_CMD = 0, - SPAWN_PROT_SPAWN_RESULT, - SPAWN_PROT_CMD_EXIT_STATUS -} spawn_prot_t; - -struct spawn_prot_exec_cmd { - uint16_t command_length; - char command_to_run[]; -}; - -struct spawn_prot_spawn_result { - pid_t exec_pid; /* 0 if failed to spawn */ - time_t exec_run_timestamp; /* time of successfully spawning the command */ -}; - -struct spawn_prot_cmd_exit_status { - int exec_exit_status; -}; - -struct spawn_prot_header { - spawn_prot_t opcode; - void *handle; -}; - -#undef SPAWN_DEBUG /* define to enable debug prints */ - -#define SPAWN_MAX_OUTSTANDING (32768) - -#define SPAWN_CMD_PROCESSED 0x00000001 -#define SPAWN_CMD_IN_PROGRESS 0x00000002 -#define SPAWN_CMD_FAILED_TO_SPAWN 0x00000004 -#define SPAWN_CMD_DONE 0x00000008 - -struct spawn_cmd_info { - avl_t avl; - - /* concurrency control per command */ - uv_mutex_t mutex; - uv_cond_t cond; /* users block here until command has finished */ - - uint64_t serial; - char *command_to_run; - int exit_status; - pid_t pid; - unsigned long flags; - time_t exec_run_timestamp; /* time of successfully spawning the command */ -}; - -/* spawn command queue */ -struct spawn_queue { - avl_tree_type cmd_tree; - - /* concurrency control of command queue */ - uv_mutex_t mutex; - uv_cond_t cond; - - volatile unsigned size; - uint64_t latest_serial; -}; - -struct write_context { - uv_write_t write_req; - struct spawn_prot_header header; - struct spawn_prot_cmd_exit_status exit_status; - struct spawn_prot_spawn_result spawn_result; - struct spawn_prot_exec_cmd payload; -}; - -extern int spawn_thread_error; -extern int spawn_thread_shutdown; -extern uv_async_t spawn_async; - -void spawn_init(void); -void spawn_server(void); -void spawn_client(void *arg); -void destroy_spawn_cmd(struct spawn_cmd_info *cmdinfo); -uint64_t spawn_enq_cmd(const char *command_to_run); -void spawn_wait_cmd(uint64_t serial, int *exit_status, time_t *exec_run_timestamp); -void spawn_deq_cmd(struct spawn_cmd_info *cmdinfo); -struct spawn_cmd_info *spawn_get_unprocessed_cmd(void); -int create_spawn_server(uv_loop_t *loop, uv_pipe_t *spawn_channel, uv_process_t *process); - -/* - * Copies from the source buffer to the protocol buffer. It advances the source buffer by the amount copied. It - * subtracts the amount copied from the source length. - */ -static inline void copy_to_prot_buffer(char *prot_buffer, unsigned *prot_buffer_len, unsigned max_to_copy, - char **source, unsigned *source_len) -{ - unsigned to_copy; - - to_copy = MIN(max_to_copy, *source_len); - memcpy(prot_buffer + *prot_buffer_len, *source, to_copy); - *prot_buffer_len += to_copy; - *source += to_copy; - *source_len -= to_copy; -} - -#endif //NETDATA_SPAWN_H diff --git a/src/spawn/spawn_client.c b/src/spawn/spawn_client.c deleted file mode 100644 index f2af9842c..000000000 --- a/src/spawn/spawn_client.c +++ /dev/null @@ -1,250 +0,0 @@ -// SPDX-License-Identifier: GPL-3.0-or-later - -#include "spawn.h" - -static uv_process_t process; -static uv_pipe_t spawn_channel; -static uv_loop_t *loop; -uv_async_t spawn_async; - -static char prot_buffer[MAX_COMMAND_LENGTH]; -static unsigned prot_buffer_len = 0; - -static void async_cb(uv_async_t *handle) -{ - uv_stop(handle->loop); -} - -static void after_pipe_write(uv_write_t* req, int status) -{ - (void)status; -#ifdef SPAWN_DEBUG - netdata_log_info("CLIENT %s called status=%d", __func__, status); -#endif - void **data = req->data; - freez(data[0]); - freez(data[1]); - freez(data); -} - -static void client_parse_spawn_protocol(unsigned source_len, char *source) -{ - unsigned required_len; - struct spawn_prot_header *header; - struct spawn_prot_spawn_result *spawn_result; - struct spawn_prot_cmd_exit_status *exit_status; - struct spawn_cmd_info *cmdinfo; - - while (source_len) { - required_len = sizeof(*header); - if (prot_buffer_len < required_len) - copy_to_prot_buffer(prot_buffer, &prot_buffer_len, required_len - prot_buffer_len, &source, &source_len); - if (prot_buffer_len < required_len) - return; /* Source buffer ran out */ - - header = (struct spawn_prot_header *)prot_buffer; - cmdinfo = (struct spawn_cmd_info *)header->handle; - fatal_assert(NULL != cmdinfo); - - switch(header->opcode) { - case SPAWN_PROT_SPAWN_RESULT: - required_len += sizeof(*spawn_result); - if (prot_buffer_len < required_len) - copy_to_prot_buffer(prot_buffer, &prot_buffer_len, required_len - prot_buffer_len, &source, &source_len); - if (prot_buffer_len < required_len) - return; /* Source buffer ran out */ - - spawn_result = (struct spawn_prot_spawn_result *)(header + 1); - uv_mutex_lock(&cmdinfo->mutex); - cmdinfo->pid = spawn_result->exec_pid; - if (0 == cmdinfo->pid) { /* Failed to spawn */ -#ifdef SPAWN_DEBUG - netdata_log_info("CLIENT %s SPAWN_PROT_SPAWN_RESULT failed to spawn.", __func__); -#endif - cmdinfo->flags |= SPAWN_CMD_FAILED_TO_SPAWN | SPAWN_CMD_DONE; - uv_cond_signal(&cmdinfo->cond); - } else { - cmdinfo->exec_run_timestamp = spawn_result->exec_run_timestamp; - cmdinfo->flags |= SPAWN_CMD_IN_PROGRESS; -#ifdef SPAWN_DEBUG - netdata_log_info("CLIENT %s SPAWN_PROT_SPAWN_RESULT in progress.", __func__); -#endif - } - uv_mutex_unlock(&cmdinfo->mutex); - prot_buffer_len = 0; - break; - case SPAWN_PROT_CMD_EXIT_STATUS: - required_len += sizeof(*exit_status); - if (prot_buffer_len < required_len) - copy_to_prot_buffer(prot_buffer, &prot_buffer_len, required_len - prot_buffer_len, &source, &source_len); - if (prot_buffer_len < required_len) - return; /* Source buffer ran out */ - - exit_status = (struct spawn_prot_cmd_exit_status *)(header + 1); - uv_mutex_lock(&cmdinfo->mutex); - cmdinfo->exit_status = exit_status->exec_exit_status; -#ifdef SPAWN_DEBUG - netdata_log_info("CLIENT %s SPAWN_PROT_CMD_EXIT_STATUS %d.", __func__, exit_status->exec_exit_status); -#endif - cmdinfo->flags |= SPAWN_CMD_DONE; - uv_cond_signal(&cmdinfo->cond); - uv_mutex_unlock(&cmdinfo->mutex); - prot_buffer_len = 0; - break; - default: - fatal_assert(0); - break; - } - - } -} - -static void on_pipe_read(uv_stream_t* pipe, ssize_t nread, const uv_buf_t* buf) -{ - if (0 == nread) { - netdata_log_info("%s: Zero bytes read from spawn pipe.", __func__); - } else if (UV_EOF == nread) { - netdata_log_info("EOF found in spawn pipe."); - } else if (nread < 0) { - netdata_log_error("%s: %s", __func__, uv_strerror(nread)); - } - - if (nread < 0) { /* stop stream due to EOF or error */ - (void)uv_read_stop((uv_stream_t *)pipe); - } else if (nread) { -#ifdef SPAWN_DEBUG - netdata_log_info("CLIENT %s read %u", __func__, (unsigned)nread); -#endif - client_parse_spawn_protocol(nread, buf->base); - } - if (buf && buf->len) { - freez(buf->base); - } - - if (nread < 0) { - uv_close((uv_handle_t *)pipe, NULL); - } -} - -static void on_read_alloc(uv_handle_t* handle, - size_t suggested_size, - uv_buf_t* buf) -{ - (void)handle; - buf->base = mallocz(suggested_size); - buf->len = suggested_size; -} - -static void spawn_process_cmd(struct spawn_cmd_info *cmdinfo) -{ - int ret; - uv_buf_t *writebuf; - struct write_context *write_ctx; - - void **data = callocz(2, sizeof(void *)); - writebuf = callocz(3, sizeof(uv_buf_t)); - write_ctx = callocz(1, sizeof(*write_ctx)); - - data[0] = write_ctx; - data[1] = writebuf; - write_ctx->write_req.data = data; - - uv_mutex_lock(&cmdinfo->mutex); - cmdinfo->flags |= SPAWN_CMD_PROCESSED; - uv_mutex_unlock(&cmdinfo->mutex); - - write_ctx->header.opcode = SPAWN_PROT_EXEC_CMD; - write_ctx->header.handle = cmdinfo; - write_ctx->payload.command_length = strlen(cmdinfo->command_to_run); - - writebuf[0] = uv_buf_init((char *)&write_ctx->header, sizeof(write_ctx->header)); - writebuf[1] = uv_buf_init((char *)&write_ctx->payload, sizeof(write_ctx->payload)); - writebuf[2] = uv_buf_init((char *)cmdinfo->command_to_run, write_ctx->payload.command_length); - -#ifdef SPAWN_DEBUG - netdata_log_info("CLIENT %s SPAWN_PROT_EXEC_CMD %u", __func__, (unsigned)cmdinfo->serial); -#endif - ret = uv_write(&write_ctx->write_req, (uv_stream_t *)&spawn_channel, writebuf, 3, after_pipe_write); - fatal_assert(ret == 0); -} - -void spawn_client(void *arg) -{ - uv_thread_set_name_np("DAEMON_SPAWN"); - - int ret; - struct completion *completion = (struct completion *)arg; - - loop = mallocz(sizeof(uv_loop_t)); - ret = uv_loop_init(loop); - if (ret) { - netdata_log_error("uv_loop_init(): %s", uv_strerror(ret)); - spawn_thread_error = ret; - goto error_after_loop_init; - } - loop->data = NULL; - - spawn_async.data = NULL; - ret = uv_async_init(loop, &spawn_async, async_cb); - if (ret) { - netdata_log_error("uv_async_init(): %s", uv_strerror(ret)); - spawn_thread_error = ret; - goto error_after_async_init; - } - - ret = uv_pipe_init(loop, &spawn_channel, 1); - if (ret) { - netdata_log_error("uv_pipe_init(): %s", uv_strerror(ret)); - spawn_thread_error = ret; - goto error_after_pipe_init; - } - fatal_assert(spawn_channel.ipc); - - ret = create_spawn_server(loop, &spawn_channel, &process); - if (ret) { - netdata_log_error("Failed to fork spawn server process."); - spawn_thread_error = ret; - goto error_after_spawn_server; - } - - spawn_thread_error = 0; - spawn_thread_shutdown = 0; - /* wake up initialization thread */ - completion_mark_complete(completion); - - prot_buffer_len = 0; - ret = uv_read_start((uv_stream_t *)&spawn_channel, on_read_alloc, on_pipe_read); - fatal_assert(ret == 0); - - while (spawn_thread_shutdown == 0) { - struct spawn_cmd_info *cmdinfo; - - uv_run(loop, UV_RUN_DEFAULT); - while (NULL != (cmdinfo = spawn_get_unprocessed_cmd())) { - spawn_process_cmd(cmdinfo); - } - } - /* cleanup operations of the event loop */ - netdata_log_info("Shutting down spawn client event loop."); - uv_close((uv_handle_t *)&spawn_channel, NULL); - uv_close((uv_handle_t *)&spawn_async, NULL); - uv_run(loop, UV_RUN_DEFAULT); /* flush all libuv handles */ - - netdata_log_info("Shutting down spawn client loop complete."); - fatal_assert(0 == uv_loop_close(loop)); - - return; - -error_after_spawn_server: - uv_close((uv_handle_t *)&spawn_channel, NULL); -error_after_pipe_init: - uv_close((uv_handle_t *)&spawn_async, NULL); -error_after_async_init: - uv_run(loop, UV_RUN_DEFAULT); /* flush all libuv handles */ - fatal_assert(0 == uv_loop_close(loop)); -error_after_loop_init: - freez(loop); - - /* wake up initialization thread */ - completion_mark_complete(completion); -} diff --git a/src/spawn/spawn_server.c b/src/spawn/spawn_server.c deleted file mode 100644 index f17669368..000000000 --- a/src/spawn/spawn_server.c +++ /dev/null @@ -1,386 +0,0 @@ -// SPDX-License-Identifier: GPL-3.0-or-later - -#include "spawn.h" - -static uv_loop_t *loop; -static uv_pipe_t server_pipe; - -static int server_shutdown = 0; - -static uv_thread_t thread; - -/* spawn outstanding execution structure */ -static avl_tree_lock spawn_outstanding_exec_tree; - -static char prot_buffer[MAX_COMMAND_LENGTH]; -static unsigned prot_buffer_len = 0; - -struct spawn_execution_info { - avl_t avl; - - void *handle; - int exit_status; - pid_t pid; - struct spawn_execution_info *next; -}; - -int spawn_exec_compare(void *a, void *b) -{ - struct spawn_execution_info *spwna = a, *spwnb = b; - - if (spwna->pid < spwnb->pid) return -1; - if (spwna->pid > spwnb->pid) return 1; - - return 0; -} - -/* wake up waiter thread to reap the spawned processes */ -static uv_mutex_t wait_children_mutex; -static uv_cond_t wait_children_cond; -static uint8_t spawned_processes; -static struct spawn_execution_info *child_waited_list; -static uv_async_t child_waited_async; - -static inline struct spawn_execution_info *dequeue_child_waited_list(void) -{ - struct spawn_execution_info *exec_info; - - uv_mutex_lock(&wait_children_mutex); - if (NULL == child_waited_list) { - exec_info = NULL; - } else { - exec_info = child_waited_list; - child_waited_list = exec_info->next; - } - uv_mutex_unlock(&wait_children_mutex); - - return exec_info; -} - -static inline void enqueue_child_waited_list(struct spawn_execution_info *exec_info) -{ - uv_mutex_lock(&wait_children_mutex); - exec_info->next = child_waited_list; - child_waited_list = exec_info; - uv_mutex_unlock(&wait_children_mutex); -} - -static void after_pipe_write(uv_write_t *req, int status) -{ - (void)status; -#ifdef SPAWN_DEBUG - fprintf(stderr, "SERVER %s called status=%d\n", __func__, status); -#endif - void **data = req->data; - freez(data[0]); - freez(data[1]); - freez(data); -} - -static void child_waited_async_cb(uv_async_t *async_handle) -{ - uv_buf_t *writebuf; - int ret; - struct spawn_execution_info *exec_info; - struct write_context *write_ctx; - - (void)async_handle; - while (NULL != (exec_info = dequeue_child_waited_list())) { - write_ctx = mallocz(sizeof(*write_ctx)); - - void **data = callocz(2, sizeof(void *)); - writebuf = callocz(2, sizeof(uv_buf_t)); - - data[0] = write_ctx; - data[1] = writebuf; - write_ctx->write_req.data = data; - - write_ctx->header.opcode = SPAWN_PROT_CMD_EXIT_STATUS; - write_ctx->header.handle = exec_info->handle; - write_ctx->exit_status.exec_exit_status = exec_info->exit_status; - writebuf[0] = uv_buf_init((char *) &write_ctx->header, sizeof(write_ctx->header)); - writebuf[1] = uv_buf_init((char *) &write_ctx->exit_status, sizeof(write_ctx->exit_status)); -#ifdef SPAWN_DEBUG - fprintf(stderr, "SERVER %s SPAWN_PROT_CMD_EXIT_STATUS\n", __func__); -#endif - ret = uv_write(&write_ctx->write_req, (uv_stream_t *) &server_pipe, writebuf, 2, after_pipe_write); - fatal_assert(ret == 0); - - freez(exec_info); - } -} - -static void wait_children(void *arg) -{ - siginfo_t i; - struct spawn_execution_info tmp, *exec_info; - avl_t *ret_avl; - - (void)arg; - while (!server_shutdown) { - uv_mutex_lock(&wait_children_mutex); - while (!spawned_processes) { - uv_cond_wait(&wait_children_cond, &wait_children_mutex); - } - spawned_processes = 0; - uv_mutex_unlock(&wait_children_mutex); - - while (!server_shutdown) { - i.si_pid = 0; - if (os_waitid(P_ALL, (id_t) 0, &i, WEXITED) == -1) { - if (errno != ECHILD) - fprintf(stderr, "SPAWN: Failed to wait: %s\n", strerror(errno)); - break; - } - if (i.si_pid == 0) { - fprintf(stderr, "SPAWN: No child exited.\n"); - break; - } -#ifdef SPAWN_DEBUG - fprintf(stderr, "SPAWN: Successfully waited for pid:%d.\n", (int) i.si_pid); -#endif - fatal_assert(CLD_EXITED == i.si_code); - tmp.pid = (pid_t)i.si_pid; - while (NULL == (ret_avl = avl_remove_lock(&spawn_outstanding_exec_tree, (avl_t *)&tmp))) { - fprintf(stderr, - "SPAWN: race condition detected, waiting for child process %d to be indexed.\n", - (int)tmp.pid); - (void)sleep_usec(10000); /* 10 msec */ - } - exec_info = (struct spawn_execution_info *)ret_avl; - exec_info->exit_status = i.si_status; - enqueue_child_waited_list(exec_info); - - /* wake up event loop */ - fatal_assert(0 == uv_async_send(&child_waited_async)); - } - } -} - -void spawn_protocol_execute_command(void *handle, char *command_to_run, uint16_t command_length) -{ - uv_buf_t *writebuf; - int ret; - avl_t *avl_ret; - struct spawn_execution_info *exec_info; - struct write_context *write_ctx; - - write_ctx = mallocz(sizeof(*write_ctx)); - void **data = callocz(2, sizeof(void *)); - writebuf = callocz(2, sizeof(uv_buf_t)); - data[0] = write_ctx; - data[1] = writebuf; - write_ctx->write_req.data = data; - - command_to_run[command_length] = '\0'; -#ifdef SPAWN_DEBUG - fprintf(stderr, "SPAWN: executing command '%s'\n", command_to_run); -#endif - if (netdata_spawn(command_to_run, &write_ctx->spawn_result.exec_pid)) { - fprintf(stderr, "SPAWN: Cannot spawn(\"%s\", \"r\").\n", command_to_run); - write_ctx->spawn_result.exec_pid = 0; - } else { /* successfully spawned command */ - write_ctx->spawn_result.exec_run_timestamp = now_realtime_sec(); - - /* record it for when the process finishes execution */ - exec_info = mallocz(sizeof(*exec_info)); - exec_info->handle = handle; - exec_info->pid = write_ctx->spawn_result.exec_pid; - avl_ret = avl_insert_lock(&spawn_outstanding_exec_tree, (avl_t *)exec_info); - fatal_assert(avl_ret == (avl_t *)exec_info); - - /* wake up the thread that blocks waiting for processes to exit */ - uv_mutex_lock(&wait_children_mutex); - spawned_processes = 1; - uv_cond_signal(&wait_children_cond); - uv_mutex_unlock(&wait_children_mutex); - } - - write_ctx->header.opcode = SPAWN_PROT_SPAWN_RESULT; - write_ctx->header.handle = handle; - writebuf[0] = uv_buf_init((char *)&write_ctx->header, sizeof(write_ctx->header)); - writebuf[1] = uv_buf_init((char *)&write_ctx->spawn_result, sizeof(write_ctx->spawn_result)); -#ifdef SPAWN_DEBUG - fprintf(stderr, "SERVER %s SPAWN_PROT_SPAWN_RESULT\n", __func__); -#endif - ret = uv_write(&write_ctx->write_req, (uv_stream_t *)&server_pipe, writebuf, 2, after_pipe_write); - fatal_assert(ret == 0); -} - -static void server_parse_spawn_protocol(unsigned source_len, char *source) -{ - unsigned required_len; - struct spawn_prot_header *header; - struct spawn_prot_exec_cmd *payload; - uint16_t command_length; - - while (source_len) { - required_len = sizeof(*header); - if (prot_buffer_len < required_len) - copy_to_prot_buffer(prot_buffer, &prot_buffer_len, required_len - prot_buffer_len, &source, &source_len); - if (prot_buffer_len < required_len) - return; /* Source buffer ran out */ - - header = (struct spawn_prot_header *)prot_buffer; - fatal_assert(SPAWN_PROT_EXEC_CMD == header->opcode); - fatal_assert(NULL != header->handle); - - required_len += sizeof(*payload); - if (prot_buffer_len < required_len) - copy_to_prot_buffer(prot_buffer, &prot_buffer_len, required_len - prot_buffer_len, &source, &source_len); - if (prot_buffer_len < required_len) - return; /* Source buffer ran out */ - - payload = (struct spawn_prot_exec_cmd *)(header + 1); - command_length = payload->command_length; - - required_len += command_length; - if (unlikely(required_len > MAX_COMMAND_LENGTH - 1)) { - fprintf(stderr, "SPAWN: Ran out of protocol buffer space.\n"); - command_length = (MAX_COMMAND_LENGTH - 1) - (sizeof(*header) + sizeof(*payload)); - required_len = MAX_COMMAND_LENGTH - 1; - } - if (prot_buffer_len < required_len) - copy_to_prot_buffer(prot_buffer, &prot_buffer_len, required_len - prot_buffer_len, &source, &source_len); - if (prot_buffer_len < required_len) - return; /* Source buffer ran out */ - - spawn_protocol_execute_command(header->handle, payload->command_to_run, command_length); - prot_buffer_len = 0; - } -} - -static void on_pipe_read(uv_stream_t *pipe, ssize_t nread, const uv_buf_t *buf) -{ - if (0 == nread) { - fprintf(stderr, "SERVER %s: Zero bytes read from spawn pipe.\n", __func__); - } else if (UV_EOF == nread) { - fprintf(stderr, "EOF found in spawn pipe.\n"); - } else if (nread < 0) { - fprintf(stderr, "%s: %s\n", __func__, uv_strerror(nread)); - } - - if (nread < 0) { /* stop spawn server due to EOF or error */ - int error; - - uv_mutex_lock(&wait_children_mutex); - server_shutdown = 1; - spawned_processes = 1; - uv_cond_signal(&wait_children_cond); - uv_mutex_unlock(&wait_children_mutex); - - fprintf(stderr, "Shutting down spawn server event loop.\n"); - /* cleanup operations of the event loop */ - (void)uv_read_stop((uv_stream_t *) pipe); - uv_close((uv_handle_t *)&server_pipe, NULL); - - error = uv_thread_join(&thread); - if (error) { - fprintf(stderr, "uv_thread_create(): %s", uv_strerror(error)); - } - /* After joining it is safe to destroy child_waited_async */ - uv_close((uv_handle_t *)&child_waited_async, NULL); - } else if (nread) { -#ifdef SPAWN_DEBUG - fprintf(stderr, "SERVER %s nread %u\n", __func__, (unsigned)nread); -#endif - server_parse_spawn_protocol(nread, buf->base); - } - if (buf && buf->len) { - freez(buf->base); - } -} - -static void on_read_alloc(uv_handle_t *handle, - size_t suggested_size, - uv_buf_t* buf) -{ - (void)handle; - buf->base = mallocz(suggested_size); - buf->len = suggested_size; -} - -static void ignore_signal_handler(int signo) { - /* - * By having a signal handler we allow spawned processes to reset default signal dispositions. Setting SIG_IGN - * would be inherited by the spawned children which is not desirable. - */ - (void)signo; -} - -void spawn_server(void) -{ - int error; - - // initialize the system clocks - clocks_init(); - - // close all open file descriptors, except the standard ones - // the caller may have left open files (lxc-attach has this issue) - for_each_open_fd(OPEN_FD_ACTION_CLOSE, OPEN_FD_EXCLUDE_STDIN | OPEN_FD_EXCLUDE_STDOUT | OPEN_FD_EXCLUDE_STDERR); - - // Have the libuv IPC pipe be closed when forking child processes - (void) fcntl(0, F_SETFD, FD_CLOEXEC); - fprintf(stderr, "Spawn server is up.\n"); - - // Define signals we want to ignore - struct sigaction sa; - int signals_to_ignore[] = {SIGPIPE, SIGINT, SIGQUIT, SIGTERM, SIGHUP, SIGUSR1, SIGUSR2, SIGBUS, SIGCHLD}; - unsigned ignore_length = sizeof(signals_to_ignore) / sizeof(signals_to_ignore[0]); - - unsigned i; - for (i = 0; i < ignore_length ; ++i) { - sa.sa_flags = 0; - sigemptyset(&sa.sa_mask); - sa.sa_handler = ignore_signal_handler; - if(sigaction(signals_to_ignore[i], &sa, NULL) == -1) - fprintf(stderr, "SPAWN: Failed to change signal handler for signal: %d.\n", signals_to_ignore[i]); - } - - signals_unblock(); - - loop = uv_default_loop(); - loop->data = NULL; - - error = uv_pipe_init(loop, &server_pipe, 1); - if (error) { - fprintf(stderr, "uv_pipe_init(): %s\n", uv_strerror(error)); - exit(error); - } - fatal_assert(server_pipe.ipc); - - error = uv_pipe_open(&server_pipe, 0 /* UV_STDIN_FD */); - if (error) { - fprintf(stderr, "uv_pipe_open(): %s\n", uv_strerror(error)); - exit(error); - } - avl_init_lock(&spawn_outstanding_exec_tree, spawn_exec_compare); - - spawned_processes = 0; - fatal_assert(0 == uv_cond_init(&wait_children_cond)); - fatal_assert(0 == uv_mutex_init(&wait_children_mutex)); - child_waited_list = NULL; - error = uv_async_init(loop, &child_waited_async, child_waited_async_cb); - if (error) { - fprintf(stderr, "uv_async_init(): %s\n", uv_strerror(error)); - exit(error); - } - - error = uv_thread_create(&thread, wait_children, NULL); - if (error) { - fprintf(stderr, "uv_thread_create(): %s\n", uv_strerror(error)); - exit(error); - } - - prot_buffer_len = 0; - error = uv_read_start((uv_stream_t *)&server_pipe, on_read_alloc, on_pipe_read); - fatal_assert(error == 0); - - while (!server_shutdown) { - uv_run(loop, UV_RUN_DEFAULT); - } - fprintf(stderr, "Shutting down spawn server loop complete.\n"); - fatal_assert(0 == uv_loop_close(loop)); - - exit(0); -} diff --git a/src/streaming/receiver.c b/src/streaming/receiver.c index 2cbf247dc..50da031a7 100644 --- a/src/streaming/receiver.c +++ b/src/streaming/receiver.c @@ -70,7 +70,7 @@ static inline int read_stream(struct receiver_state *r, char* buffer, size_t siz ssize_t bytes_read; do { - errno = 0; + errno_clear(); switch(wait_on_socket_or_cancel_with_timeout( #ifdef ENABLE_HTTPS diff --git a/src/streaming/rrdpush.c b/src/streaming/rrdpush.c index 1ce8e4ea8..23a86e720 100644 --- a/src/streaming/rrdpush.c +++ b/src/streaming/rrdpush.c @@ -54,7 +54,7 @@ char *netdata_ssl_ca_file = NULL; #endif static void load_stream_conf() { - errno = 0; + errno_clear(); char *filename = strdupz_path_subpath(netdata_configured_user_config_dir, "stream.conf"); if(!appconfig_load(&stream_config, filename, 0, NULL)) { nd_log_daemon(NDLP_NOTICE, "CONFIG: cannot load user config '%s'. Will try stock config.", filename); diff --git a/src/streaming/sender.c b/src/streaming/sender.c index 3432e6927..a5fbe6044 100644 --- a/src/streaming/sender.c +++ b/src/streaming/sender.c @@ -1894,7 +1894,7 @@ void *rrdpush_sender_thread(void *ptr) { // protection from overflow if(unlikely(s->flags & SENDER_FLAG_OVERFLOW)) { worker_is_busy(WORKER_SENDER_JOB_DISCONNECT_OVERFLOW); - errno = 0; + errno_clear(); netdata_log_error("STREAM %s [send to %s]: buffer full (allocated %zu bytes) after sending %zu bytes. Restarting connection", rrdhost_hostname(s->host), s->connected_to, s->buffer->size, s->sent_bytes_on_this_connection); rrdpush_sender_thread_close_socket(s->host); diff --git a/src/streaming/stream.conf b/src/streaming/stream.conf index 9dc154e2f..475d5eac2 100644 --- a/src/streaming/stream.conf +++ b/src/streaming/stream.conf @@ -32,6 +32,9 @@ # This communication is not HTTP (it cannot be proxied by web proxies). destination = + # The API_KEY to use (as the sender) + api key = + # Skip Certificate verification? # The netdata child is configurated to avoid invalid SSL/TLS certificate, # so certificates that are self-signed or expired will stop the streaming. @@ -53,9 +56,6 @@ # #CAfile = - # The API_KEY to use (as the sender) - api key = - # Stream Compression # The default is enabled # You can control stream compression in this agent with options: yes | no diff --git a/src/web/api/queries/query.c b/src/web/api/queries/query.c index c97b546b1..6854300f3 100644 --- a/src/web/api/queries/query.c +++ b/src/web/api/queries/query.c @@ -691,7 +691,7 @@ static void rrdr_set_grouping_function(RRDR *r, RRDR_TIME_GROUPING group_method) } } if(!found) { - errno = 0; + errno_clear(); internal_error(true, "QUERY: grouping method %u not found. Using 'average'", (unsigned int)group_method); r->time_grouping.create = tg_average_create; r->time_grouping.reset = tg_average_reset; diff --git a/src/web/api/web_api_v1.c b/src/web/api/web_api_v1.c index 1884f1fe0..bfaa4f6f7 100644 --- a/src/web/api/web_api_v1.c +++ b/src/web/api/web_api_v1.c @@ -1422,10 +1422,13 @@ static int web_client_api_request_v1_aclk_state(RRDHOST *host, struct web_client BUFFER *wb = w->response.data; buffer_flush(wb); - +#ifdef ENABLE_ACLK char *str = aclk_state_json(); buffer_strcat(wb, str); freez(str); +#else + buffer_strcat(wb, "{\"aclk-available\":false}"); +#endif wb->content_type = CT_APPLICATION_JSON; buffer_no_cacheable(wb); diff --git a/src/web/server/web_client.c b/src/web/server/web_client.c index 27fcf29c7..ca1c28e7f 100644 --- a/src/web/server/web_client.c +++ b/src/web/server/web_client.c @@ -1855,7 +1855,7 @@ ssize_t web_client_receive(struct web_client *w) // do we have any space for more data? buffer_need_bytes(w->response.data, NETDATA_WEB_REQUEST_INITIAL_SIZE); - errno = 0; + errno_clear(); #ifdef ENABLE_HTTPS if ( (web_client_check_conn_tcp(w)) && (netdata_ssl_web_server_ctx) ) { |